research investment idea 24 mar 2017 atul auto · pdf filepcg research investment idea 24 mar...
TRANSCRIPT

PCG RESEARCH INVESTMENT IDEA 24 MAR 2017
Atul Auto
Private Client Group - PCG RESEARCH P a g e | 1
Industry CMP Recommendation Add on Dips to band Target Time Horizon
AUTO Rs. 453 BUY Rs. 453 - 415 Rs. 545 3-4 Quarters
HDFC Scrip Code ATUAUT
BSE Code 531795
NSE Code ATULAUTO
Bloomberg ATA IN
CMP – 24 Mar 17 453
Equity Capital (Rs mn)
109.7
Face Value (Rs) 5
Equity O/S (mn) 21.94
Market Cap (Rs mn) 9951.2
Book Value (Rs) 78.9
Avg. 52 Week Volumes
45284
52 Week High 568
52 Week Low 392
Shareholding Pattern (%)
Promoters 52.7
Institutions 16.8
Non Institutions 30.5
PCG Risk Rating* Yellow * Refer Rating explanation
Kushal Rughani [email protected]
Company Background
Atul Auto (ATUL) is a three-wheeler manufacturer of auto rickshaws, pick-up vans and chassis of passenger
vehicles based in Gujarat. It offers a range of diesel and compressed natural gas (CNG) three-wheeler
products in both front and rear engine platform for passenger and cargo transportation. Its brands include
ATUL SHAKTI, which include Pickup Van Standard, Delivery Van Carrier and Pickup Van Highdeck; ATUL GEM,
which include GEM Cargo / Cargo XL, GEM Paxx, Delivery Van, GEM Paxx-CNG and GEM XL HD; ATUL SMART,
which include 3+1 Passenger Carriers and Pickup Van Highdeck, and ATUL GEMINI, Gemini-Dz, Gemini-
Petrol, Gemini-CNG and Gemini-LPG. Its product portfolio consists of almost 50 models catering to passenger
and goods carrier segments. ATUL procures engines from Greaves Cotton, large portion of batteries from
Exide, and tyres from MRF and CEAT. The Company serves a range of customer base in the cargo and
passenger segments, with a payload capacity of over 0.35 tons and over 0.50 tons. ATUL continues to be
number 1 player in Gujarat with ~35% sales coming from the state. Currently, company has 320 touch points
which includes 200 primary dealers and 120 sub-dealers.
ATUL had acquired land at Ahmadabad for Rs 50cr; This land is significantly larger in size than that of Rajkot
plant. It plans to incur capex of Rs 100cr to setup a plant with capacity of 60,000 units. Till now, company
has not started construction activity. The funding would be met through internal accruals. The Ahmedabad
unit would start contributing from FY20 onwards. Once the Ahmedabad plant comes on stream Atul will have
capacity of 120,000 units. As scale of production rises, benefits of operating leverage would start kicking in as
ATUL’s bargaining power with suppliers would rise.
Investment Rationale
Currently, ATUL has manufacturing facility at Shapar, Rajkot (Gujarat). Company has capacity to manufacture
~60,000 units at the facility, but the sales volume per annum is to the tune of 40-45,000 units (~70%
utilization levels). In FY16, Company had posted total sales of 44,232 units, out of that 20,162 units were
sold in Cargo segment while 24070 units were sold in Passenger segment. In FY17, the volumes have
dropped significantly on the back of higher competitive ness and demonetization impact. In FY17, company is
likely to end up with 38,800 units.

PCG RESEARCH
Private Client Group - PCG RESEARCH P a g e | 2
Risk & Concerns: aa View & Valuation: Talwalkars Better Value
Here are few points to discuss about Atul Auto
1) Led by demonetization, domestic sales have been lower in Nov-Dec 16, and are likely to remain muted
over next few months. However we expect sharp surge in performance across all the front in FY18
2) Exports are expected to post significant surge in the next 3-4 years, led by ramp up in sales of new
products, expanding distributor network and recovery in underlying markets.
3) Domestic sales growth to outpace that of underlying industry, led by launch of new products across the
country, expansion in dealership network and ramp up in captive finance unit.
4) Margins are expected to expand over the medium term. We expect company to post 12% revenue cagr
along with 60bps margin expansion over FY16-19E. We have estimated 8% volume cagr over FY16-19E,
exports to grow faster and would post 22% cagr over the same period. We recommend BUY on ATUL at cmp
and add on dips to Rs 415 with target price of Rs 545. We value ATUL at 18x FY19E and arrive to TP of Rs
545.
India has emerged as the largest three-wheeler industry with a large domestic market and export base on the
back of strong demand from local as well as international markets.
Moreover, In urban markets, replacement demand has also been an important growth driver where in
improving network of CNG fuel stations is driving replacement of older petrol or diesel powered 3Ws with
ones based on CNG, the report said.
Despite the fact that the usage of CNG is only mandatory in Delhi, the acceptance for CNG-based 3Ws has
caught up in other cities as well primarily on back of favorable operating economics, it said. The report said
the cargo variants face tough competition from small CVs but certain attributes support their sales. Which
augurs well for the smaller player like ATUL.
Focus on network expansion
ATUL is increasing its distribution channels with the addition of 20-25 dealers by the end of FY17 (currently
there are ~200 primary and 120 secondary dealers). ATUL is currently selling its gasoline 3Ws in just 4 states
(Gujarat, Rajasthan, Haryana and Punjab) and is awaiting STA approvals in others. The company is confident
that it will be present in all the states by FY18. It is also planning to launch 3W electric vehicles by Q2 FY18E.
Strong balance sheet and healthy return ratios
ATUL has robust balance sheet positioning and enjoys healthy return ratios (five-year average RoE and RoCE
of > 25%. Funding for the new capacity expansion (from 60,000 to 120,000 units) at Ahmedabad is expected
to be met by internal accruals, given healthy cash generation capability, and thus ATUL’s debt free status to
remain intact. Thus, the new capex plan is unlikely to affect health of the balance sheet.

PCG RESEARCH
Private Client Group - PCG RESEARCH P a g e | 3
Q3 FY17 Update
ATUL’s volume declined 12.4% YoY to 11,043 units in Q3 FY17 as sales in the month of November and
December 2016 declined 13.9% YoY to 3,450 units and 36.2% YoY to 2,556 units respectively due to
demonetization woes. Domestic passenger volumes were down 24.0% YoY to 5,176 units while cargo
volumes were down 12.8% YoY to 4,940 units.
Atul Auto’s (ATUL) Q3 FY17 posted 12% yoy dip in revenues to Rs 130cr while EBITDA at Rs 19cr (-25% YoY,
-14% QoQ) owing to dip in gross margins. PAT came in at Rs 12cr (-29% YoY).
ATUL’s domestic market share in the 3W cargo segment increased 20bps QoQ to 17.4%, while in the
Passenger segment, it went up by 30bps QoQ to 4.6%. The management is confident of expanding its
market share on the back of incremental volumes from gasoline 3Ws and a revival in rural demand.
Q4 FY17 numbers are expected to be little weak, as the demonetisation impact may push 3W purchase
decisions by at least 1-2 months in the rural market. Export volumes increased six folds to 927 units in Q3
FY17 as volumes in the passenger segment surged 10x to 893 units. The growth appears strong on a low
base, there was strong pick up in volumes on a consistent basis in the last two quarters (Q1 FY17 sales of
336 units, Q2 FY17 - 508 units). In 9M FY17, export volumes stood at 1,771 units and surpassed the FY16
numbers of 1,532 units. During 11 months ended ATUL has posted 12% dip in volumes on the back of
demonetisation woes. It had impacted Q3 volumes and also during the last quarter also the impact to
continue. We forecast 20% cagr in exports sales volumes to 2688 units in FY19E.
Outlook & valuation:
We expect company to post 12% revenue cagr along with 60bps margin expansion over FY16-19E. We have
estimated 8% volume cagr over FY16-19E, exports to grow faster and would post 22% cagr over the same
period. At the CMP, ATUL is trading at P/E of 17x and 14x based on our EPS estimate of FY18E and FY19E
respectively. ATUL’s export performance was exceptionally great in the Q3. We expect the trend to continue
in the exports front over FY16-19E. Entry into electric 3W opens up another opportunity for ATUL. Strong
return ratios, robust balance sheet positioning and healthy revenues and PAT cagr supports our positive view
on the stock. We recommend BUY on ATUL at CMP and add on dips to Rs 415 with target price of Rs 545. We
value ATUL at 18x FY19E and arrive to TP of Rs 545.

PCG RESEARCH
Private Client Group - PCG RESEARCH P a g e | 4
Risks
Lower than expected Revenues and Earnings growth
Competitiveness from other players such as Bajaj, Piaggio and others
Delay in expansion plan of Ahmedabad facility
Financial Summary:
(Rs mn) Q3 FY17 Q3 FY16 YoY (%) Q2 FY17 QoQ (%) FY16 FY17E FY18E FY19E
Net Sales 1,348 1,517 (11.2) 1,435 (6.1) 5,310 4,757 6,261 7,207
EBITDA 189 251 (25.0) 220 (14.3) 763 640 914 1,081
APAT 123 160 (23.0) 138 (11.0) 474 389 575 682
Diluted EPS (Rs) 5.6 7.3 (23.0) 6.3 (11.0) 21.6 17.7 26.2 31.1
P/E (x)
21 26 17 15
EV / EBITDA (x)
12.2 14.7 10.5 8.7
RoE (%) 34.4 23 28.5 27.7
Source: Company, HDFC sec Research

PCG RESEARCH
Private Client Group - PCG RESEARCH P a g e | 5
Quarterly Financials Snapshot Particulars (Rs mn) Q3 FY17 Q3 FY16 YoY (%) Q2 FY17 QoQ (%)
Volumes (in units) 11,043 12,609 (12) 11,761 (6)
Net ASP (Rs/veh) 121,127 119,906 1 121,333 (0)
Net Sales 1,348 1,517 (11) 1,435 (6)
Material Expenses 969 1,086 (11) 1,028 (6)
Employee Expenses 100 96 4 101 (1)
Other Expenses 90 84 8 86 5
EBITDA 189 251 (25) 220 (14)
Depreciation 13 13 (1) 13 3
EBIT 175 238 (26) 207 (15)
Other Income 13 4 207 10 36
Interest Cost 1 1 40 4 (81)
PBT 188 242 (22) 213 (12)
Tax 65 82 (21) 75 (14)
RPAT 123 160 (23) 138 (11)
EO Items (Adj For Tax) - - - - -
APAT 123 160 (23) 138 (11)
EPS 6 7 (23) 6 (11)
Source: Company, HDFC sec Research

PCG RESEARCH
Private Client Group - PCG RESEARCH P a g e | 6
Revenues Trend over FY15-19E (Rs cr)
-20
-10
0
10
20
30
40
0
100
200
300
400
500
600
700
800
FY15 FY16 FY17E FY18E FY19E
Revenue Growth (%)
Source: Company, HDFC sec Research
Margin to witness improvement
0
2
4
6
8
10
12
14
16
18
0
20
40
60
80
100
120
FY15 FY16 FY17E FY18E FY19E
EBITDA EBITDA Margin (%)
Source: Company, HDFC sec Research
PAT Trend over FY15-19E (Rs cr)
-50
-25
0
25
50
75
10
20
30
40
50
60
70
80
FY15 FY16 FY17E FY18E FY19E
PAT Growth (%)
Source: Company, HDFC sec Research
Strong Return Ratios
3734
23
29 28
3533
22
28 27
0
5
10
15
20
25
30
35
40
FY15 FY16 FY17E FY18E FY19E
RoE RoCE
%
Source: Company, HDFC sec Research

PCG RESEARCH
Private Client Group - PCG RESEARCH P a g e | 7
3W sales trend in Cargo Segment
107000
97000 95000100000
96000
115000
0
20000
40000
60000
80000
100000
120000
140000
2011-12 2012-13 2013-14 2014-15 2015-16 2019-20P
Source: Company, HDFC sec Research
3W sales trend in Passenger Segment
406000441000
385000
432000 441000
635000
0
100000
200000
300000
400000
500000
600000
700000
2011-12 2012-13 2013-14 2014-15 2015-16 2019-20P
Source: Company, HDFC sec Research
Players in 3W segment in Cargo (%)
53
21
20
6
Piaggio (PVPL)
Atul Auto
M&M
Others'
Source: Company, HDFC sec Research
Players in 3W Passenger vehicle – Market Share (%)
5725
8
54 1
Bajaj Auto
Piaggio (PVPL)
M&M
Atul Auto
TVS
Others
Source: Company, HDFC sec Research
PCG RESEARCH
Private Client Group - PCG RESEARCH P a g e | 8
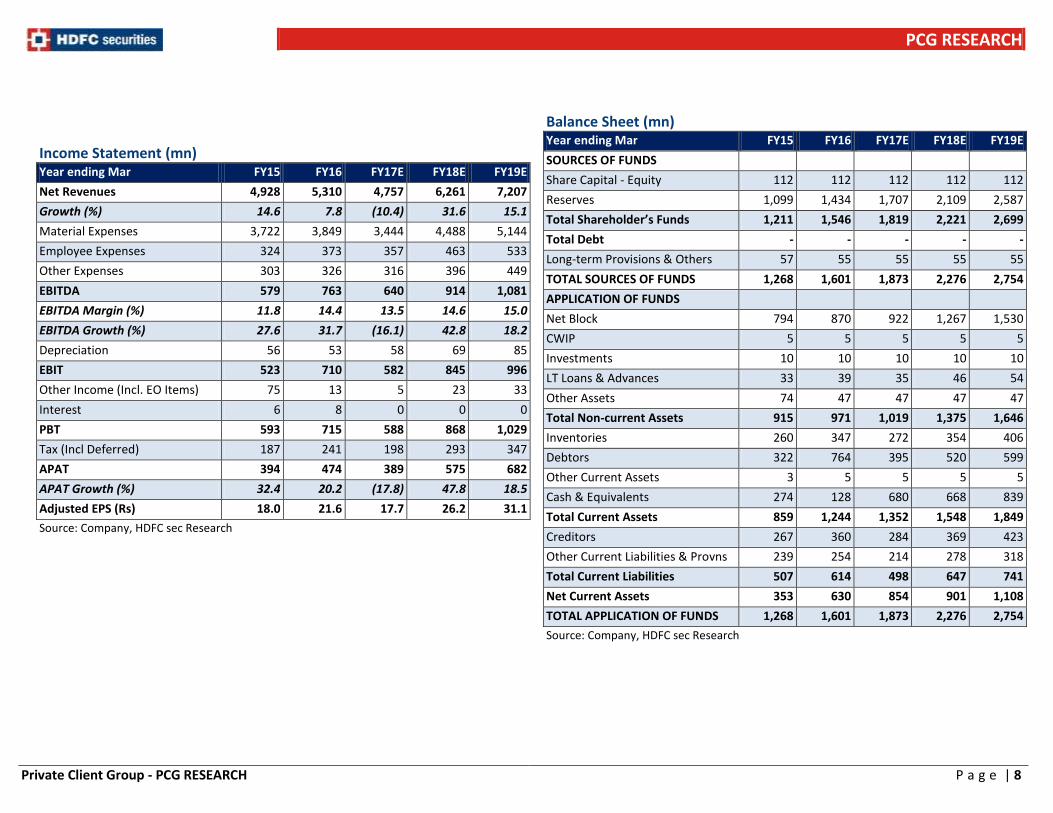
Income Statement (mn) Year ending Mar FY15 FY16 FY17E FY18E FY19E
Net Revenues 4,928 5,310 4,757 6,261 7,207
Growth (%) 14.6 7.8 (10.4) 31.6 15.1
Material Expenses 3,722 3,849 3,444 4,488 5,144
Employee Expenses 324 373 357 463 533
Other Expenses 303 326 316 396 449
EBITDA 579 763 640 914 1,081
EBITDA Margin (%) 11.8 14.4 13.5 14.6 15.0
EBITDA Growth (%) 27.6 31.7 (16.1) 42.8 18.2
Depreciation 56 53 58 69 85
EBIT 523 710 582 845 996
Other Income (Incl. EO Items) 75 13 5 23 33
Interest 6 8 0 0 0
PBT 593 715 588 868 1,029
Tax (Incl Deferred) 187 241 198 293 347
APAT 394 474 389 575 682
APAT Growth (%) 32.4 20.2 (17.8) 47.8 18.5
Adjusted EPS (Rs) 18.0 21.6 17.7 26.2 31.1
Source: Company, HDFC sec Research
Balance Sheet (mn) Year ending Mar FY15 FY16 FY17E FY18E FY19E
SOURCES OF FUNDS
Share Capital - Equity 112 112 112 112 112
Reserves 1,099 1,434 1,707 2,109 2,587
Total Shareholder’s Funds 1,211 1,546 1,819 2,221 2,699
Total Debt - - - - -
Long-term Provisions & Others 57 55 55 55 55
TOTAL SOURCES OF FUNDS 1,268 1,601 1,873 2,276 2,754
APPLICATION OF FUNDS
Net Block 794 870 922 1,267 1,530
CWIP 5 5 5 5 5
Investments 10 10 10 10 10
LT Loans & Advances 33 39 35 46 54
Other Assets 74 47 47 47 47
Total Non-current Assets 915 971 1,019 1,375 1,646
Inventories 260 347 272 354 406
Debtors 322 764 395 520 599
Other Current Assets 3 5 5 5 5
Cash & Equivalents 274 128 680 668 839
Total Current Assets 859 1,244 1,352 1,548 1,849
Creditors 267 360 284 369 423
Other Current Liabilities & Provns 239 254 214 278 318
Total Current Liabilities 507 614 498 647 741
Net Current Assets 353 630 854 901 1,108
TOTAL APPLICATION OF FUNDS 1,268 1,601 1,873 2,276 2,754
Source: Company, HDFC sec Research

PCG RESEARCH
Private Client Group - PCG RESEARCH P a g e | 9
Cash Flow Statement (mn) Year ending Mar FY15 FY16 FY17E FY18E FY19E
Reported PBT 581 715 588 868 1029
Non-operating & EO items 0 0 0 0 0
Interest expenses 6 8 0 0 0
Depreciation 56 53 58 69 85
Working Capital Change (150) (429) 331 (70) (43)
Tax Paid (187) (241) (198) (293) (347)
OPERATING CASH FLOW ( a ) 306 105 779 575 724
Capex (323) (128) (110) (414) (348)
Free cash flow (FCF) (17) (23) 669 161 376
Investments 4 (0) 0 0 0
INVESTING CASH FLOW ( b ) (319) (128) (110) (414) (348)
Debt Issuance/(Repaid) (31) 24 0 0 0
Interest Expenses (6) (8) 0 0 0
FCFE (53) (7) 669 161 376
Share Capital Issuance 0 0 0 0 0
Dividend (129) (139) (117) (173) (205)
FINANCING CASH FLOW ( c ) (166) (122) (117) (173) (205)
NET CASH FLOW (a+b+c) (179) (145) 552 (12) 171
EO Items, Others
Closing Cash & Equivalents 274 128 680 668 839
Source: Company, HDFC sec Research
Key Ratios FY15 FY16 FY17E FY18E FY19E
PROFITABILITY (%)
GPM 24.5 27.5 27.6 28.3 28.6
EBITDA Margin 11.8 14.4 13.5 14.6 15.0
APAT Margin 8.0 8.9 8.2 9.2 9.5
RoE 36.6 34.4 23.1 28.5 27.7
RoIC (or Core RoCE) 45.9 39.4 29.9 40.9 38.1
RoCE 35.0 33.4 22.4 27.7 27.1
EFFICIENCY
Tax Rate (%) 31.5 33.7 33.7 33.7 33.7
Fixed Asset Turnover (x) 4.8 4.2 3.4 3.8 3.6
Inventory (days) 24.2 28.8 28.8 28.8 28.8
Debtors (days) 16.8 37.3 30.3 30.3 30.3
Other Current Assets (days) 0.3 0.3 0.4 0.3 0.3
Payables (days) 22.6 25.2 25.2 25.2 25.2
Other Current Liab & Provns (days) 17.0 19.8 20.8 16.8 17.8
Cash Conversion Cycle (days) 1.7 21.4 13.6 17.5 16.4
PER SHARE DATA (Rs)
EPS 18.0 21.6 17.7 26.2 31.1
CEPS 20.5 24.0 20.4 29.4 34.9
Dividend 5.0 5.3 5.3 7.9 9.3
Book Value 55.2 70.5 82.9 101.2 123.0
VALUATIONS
P/E (x) 25.2 21 25.6 17.3 14.7
P/BV (x) 8 6 5.5 4.5 3.7
EV/EBITDA (x) 15.9 12.2 14.7 10.5 8.7
EV/Revenues (x) 1.9 1.7 1.9 1.5 1.3
FCF/EV (%) (0.2) (0.3) 7.3 1.7 4.1
Dividend Yield (%) 1.2 1.2 1.3 1.9 2.2
Source: Company, HDFC sec Research

PCG RESEARCH
Private Client Group - PCG RESEARCH P a g e | 10
Rating Chart
R E T U R N
HIGH
MEDIUM
LOW
LOW MEDIUM HIGH
RISK
Ratings Explanation:
RATING Risk - Return BEAR CASE BASE CASE BULL CASE
BLUE LOW RISK - LOW RETURN STOCKS
IF RISKS MANIFEST PRICE CAN FALL 20% OR MORE
IF RISKS MANIFEST PRICE CAN FALL 15%
& IF INVESTMENT RATIONALE
FRUCTFIES PRICE CAN RISE BY 15%
IF INVESTMENT RATIONALE
FRUCTFIES PRICE CAN RISE BY 20% OR
MORE
YELLOW MEDIUM RISK - HIGH RETURN STOCKS
IF RISKS MANIFEST PRICE CAN FALL 35% OR MORE
IF RISKS MANIFEST PRICE CAN FALL 20%
& IF INVESTMENT RATIONALE
FRUCTFIES PRICE CAN RISE BY 30%
IF INVESTMENT RATIONALE
FRUCTFIES PRICE CAN RISE BY 35% OR
MORE
RED HIGH RISK - HIGH RETURN STOCKS
IF RISKS MANIFEST PRICE CAN FALL 50% OR MORE
IF RISKS MANIFEST PRICE CAN FALL 30%
& IF INVESTMENT RATIONALE
FRUCTFIES PRICE CAN RISE BY 30%
IF INVESTMENT RATIONALE
FRUCTFIES PRICE CAN RISE BY 50%
OR MORE

PCG RESEARCH
Private Client Group - PCG RESEARCH P a g e | 11
Price Movement
100
150
200
250
300
350
400
450
500
550
600
Close Price
Rating Definition:
Buy: Stock is expected to gain by 10% or more in the next 1 Year. Sell: Stock is expected to decline by 10% or more in the next 1 Year.

PCG RESEARCH
Private Client Group - PCG RESEARCH P a g e | 12
I, Kushal Rughani, MBA, author and the name subscribed to this report, hereby certify that all of the views expressed in this research report accurately reflect our views about the subject issuer(s) or securities. We also certify that no part of our compensation was, is, or will be directly or indirectly related to the specific recommendation(s) or view(s) in this report. Research Analyst or his/her relative or HDFC Securities Ltd. does not have any financial interest in the subject company. Also Research Analyst or his relative or HDFC Securities Ltd. or its Associate may have beneficial ownership of 1% or more in the subject company at the end of the month immediately preceding the date of publication of the Research Report. Further Research Analyst or his relative or HDFC Securities Ltd. or its associate does not have any material conflict of interest. Any holding in stock – No Disclaimer: This report has been prepared by HDFC Securities Ltd and is meant for sole use by the recipient and not for circulation. The information and opinions contained herein have been compiled or arrived at, based upon information obtained in good faith from sources believed to be reliable. Such information has not been independently verified and no guaranty, representation of warranty, express or implied, is made as to its accuracy, completeness or correctness. All such information and opinions are subject to change without notice. This document is for information purposes only. Descriptions of any company or companies or their securities mentioned herein are not intended to be complete and this document is not, and should not be construed as an offer or solicitation of an offer, to buy or sell any securities or other financial instruments. This report is not directed to, or intended for display, downloading, printing, reproducing or for distribution to or use by, any person or entity who is a citizen or resident or located in any locality, state, country or other jurisdiction where such distribution, publication, reproduction, availability or use would be contrary to law or regulation or what would subject HDFC Securities Ltd or its affiliates to any registration or licensing requirement within such jurisdiction. If this report is inadvertently send or has reached any individual in such country, especially, USA, the same may be ignored and brought to the attention of the sender. This document may not be reproduced, distributed or published for any purposes without prior written approval of HDFC Securities Ltd. Foreign currencies denominated securities, wherever mentioned, are subject to exchange rate fluctuations, which could have an adverse effect on their value or price, or the income derived from them. In addition, investors in securities such as ADRs, the values of which are influenced by foreign currencies effectively assume currency risk. It should not be considered to be taken as an offer to sell or a solicitation to buy any security. HDFC Securities Ltd may from time to time solicit from, or perform broking, or other services for, any company mentioned in this mail and/or its attachments. HDFC Securities and its affiliated company(ies), their directors and employees may; (a) from time to time, have a long or short position in, and buy or sell the securities of the company(ies) mentioned herein or (b) be engaged in any other transaction involving such securities and earn brokerage or other compensation or act as a market maker in the financial instruments of the company(ies) discussed herein or act as an advisor or lender/borrower to such company(ies) or may have any other potential conflict of interests with respect to any recommendation and other related information and opinions. HDFC Securities Ltd, its directors, analysts or employees do not take any responsibility, financial or otherwise, of the losses or the damages sustained due to the investments made or any action taken on basis of this report, including but not restricted to, fluctuation in the prices of shares and bonds, changes in the currency rates, diminution in the NAVs, reduction in the dividend or income, etc. HDFC Securities Ltd and other group companies, its directors, associates, employees may have various positions in any of the stocks, securities and financial instruments dealt in the report, or may make sell or purchase or other deals in these securities from time to time or may deal in other securities of the companies / organizations described in this report. HDFC Securities or its associates might have managed or co-managed public offering of securities for the subject company or might have been mandated by the subject company for any other assignment in the past twelve months. HDFC Securities or its associates might have received any compensation from the companies mentioned in the report during the period preceding twelve months from the date of this report for services in respect of managing or co-managing public offerings, corporate finance, investment banking or merchant banking, brokerage services or other advisory service in a merger or specific transaction in the normal course of business. HDFC Securities or its analysts did not receive any compensation or other benefits from the companies mentioned in the report or third party in connection with preparation of the research report. Accordingly, neither HDFC Securities nor Research Analysts have any material conflict of interest at the time of publication of this report. Compensation of our Research Analysts is not based on any specific merchant banking, investment banking or brokerage service transactions. HDFC Securities may have issued other reports that are inconsistent with and reach different conclusion from the information presented in this report. Research entity has not been engaged in market making activity for the subject company. Research analyst has not served as an officer, director or employee of the subject company. We have not received any compensation/benefits from the Subject Company or third party in connection with the Research Report. HDFC Securities Ltd. is a SEBI Registered Research Analyst having registration no. INH000002475 HDFC securities Limited, I Think Techno Campus, Building - B, "Alpha", Office Floor 8, Near Kanjurmarg Station, Opp. Crompton Greaves, Kanjurmarg (East), Mumbai 400 042
HDFC securities Limited, 4th Floor, Above HDFC Bank, Astral Tower, Nr. Mithakali 6 Road, Navrangpura, Ahmedabad-380009, Gujarat.
Website: www.hdfcsec.com Email: [email protected]