research explorer | the university of manchester
TRANSCRIPT
0
993
BIPHASIC DROPLET MICROFLUIDICS IN RELATION TO
PHARMACEUTICAL INDUSTRIAL BIOCHEMICAL
SCREENING
A Thesis submitted to The University of Manchester for the degree of
Doctor of Philosophy
Faculty of Engineering and Physical Sciences
2016
Brett Andrew Litten BSc. (Hons.)
~

1
Table of Contents
ABSTRACT 7
ABBREVIATIONS 10
DECLARATION AND COPYRIGHT STATEMENT 13
ACKNOWLEDGEMENTS 14
1 INTRODUCTION
1.1 Overview 15
1.2 Drug Discovery and Screening 15
1.2.1 Early Phase Screening 15
1.2.2 Drug Metabolism and Pharmacokinetics 18
1.2.3 Phase I/II Metabolism 19
1.2.4 Recombinant Cytochrome P450 Enzymes 20
1.2.5 Lipinski's 'Rule of Five' 23
1.2.6 Microtitre Plate Enzyme Inhibition Assays 23
1.2.7 Droplet Microfluidic Chip Assays 27
1.2.8 Microfluidics, Industrial Screening and the ‘Killer App’ 29
1.2.9 Challenges for Microfluidics in Industry 30
1.2.10 The Cost of Screening 33
1.2.11 Integration with Existing Technology 35
1.2.12 Droplet Assays 35
1.2.13 Facilitation of Biochemical Screening in Microfluidics 37
1.2.14 Cell Screening – Encapsulation 37
1.2.15 '3D' Cell Assay & Hydrogels 38
1.3 Microfluidic Devices 40
1.3.1 Fabrication 40
1.3.2 Sealing 42
1.3.3 Device Surface Functionalisation `Hydrophobicity' 44
1.3.4 Functionalisation of Polymer Chips 45

2
1.3.5 Fluid Connection 45
1.3.6 Fluid Propulsion - Hydraulic Pressure 46
1.3.7 Fluid Propulsion - Electro-osmotic flow (EOF) 48
1.3.8 Fluid Propulsion - Centrifugal Force 50
1.4 Detection and Analytical Techniques 50
1.4.1 Jablonski Diagrams 51
1.4.2 Absorbance 52
1.4.3 Vibrational Relaxation and Internal Conversion 53
1.4.4 Fluorescence 54
1.4.5 Intersystem Crossing (IS) 55
1.4.6 Absorbance Detection and Microfluidics 56
1.4.7 Fluorescence Detection and Microfluidics 57
1.4.8 Luminescence Detection and Microfluidics 57
1.4.9 Mass Spectrometry and Microfluidics 59
1.4.10 Other Detection Methods and Microfluidics 59
1.4.11 Advantages and Disadvantages of Analytical Techniques 60
1.5 Droplet Production & Manipulation 61
1.5.1 Surface Tension 61
1.5.2 Surfactants in Droplet Microfluidic Systems 64
1.5.3 Reynolds and Capillary Numbers 66
1.5.4 Droplet Detachment: Squeezing, dripping and jetting 66
1.5.5 T-junction and Flow Focussing Droplet Generation 67
1.5.6 Oils for carrier phase 68
1.5.7 Droplet sorting - Hydrodynamic Sorting 70
1.5.8 Droplet sorting - Dielectrophoretic Sorting 70
1.5.9 Droplet sorting - Magnetic Sorting 71
1.5.10 Droplet sorting - Optical Sorting (laser tweezers) 71
1.5.11 Droplet sorting - Electrowetting-On-Dielectric 72

3
1.5.12 Geometry-Mediated Passive Droplet Fusion 73
1.5.13 Electrofusion 73
1.5.14 Droplet Fission 74
1.6 Partitioning and Droplet Surface Interactions 75
1.6.1 Partitioning in Drug Discovery 75
1.6.2 Partitioning in Microfluidics 76
1.6.3 Proteins at Liquid Interfaces 77
2 PROJECT AIMS
2.1 Objectives 78
3 EXPERIMENTAL
3.1 Chemical and Reagents 80
3.1.1 Preparation of Phosphate Buffer Solution 80
3.1.2 Preparation of NADPH Solution 83
3.1.3 Preparation of Cytochrome P450 Enzyme Solution 83
3.1.4 Preparation of CEC Substrate Solution 83
3.2 Apparatus 84
3.2.1 Chip Designs 84
3.2.2 Chip Fabrication 84
3.2.3 Chip Sealing 87
3.2.4 Fluid Delivery 89
3.2.5 Analytic Apparatus for Fluorescent Detection 90
3.2.6 Fluorescence Intensity Measurements 92
3.2.7 Direct Observation 92
3.2.8 High Voltage Power Supply 92
3.3 Methods 93
3.3.1 Procedure for Oil Testing, Droplet Formation and Linearity 93
3.3.2 Synthesis and Characterisation of Fluorosurfactant 95
4
3.3.3 AZF Dissolution 100
3.3.4 AZF Critical Micelle Concentration (CMC) Determination
by Dynamic Light Scattering (DLS) 101
3.3.5 Procedure for Microtitre plate Cytochrome P450 Inhibition Assay and
Dependence on Reaction Temperature 101
3.3.6 Design of Electrical Heater for Incubation of Droplet Chips 103
3.3.7 Procedure for Chip-Based 1A2-CEC Inhibition Experiments 105
3.3.8 Procedure for Partitioning Experiments in Glass Vial 110
3.3.9 Investigating the Impact of Surfactant on Partitioning 112
3.3.10 Procedure for Partitioning Experiments Using AstraZeneca Collection
Library Compounds 113
3.3.11 Testing AZ Compound Solubility 115
3.3.12 Partitioning Test - Round 1 115
3.3.13 Partitioning Test - Round 2 116
3.3.14 Procedure for Predictive Partitioning Modelling 117
3.3.15 Partitioning Test - Round 3 118
3.3.16 Procedure for in situ Chip Partitioning Experiments 118
3.3.17 Procedure for Shake-Flask Experiment 120
3.3.18 Procedure for Labelling Proteins/Enzymes 121
3.3.19 Procedure for Determination of Droplet Labelling Ratio 122
3.3.20 Procedure for Blocking Enzyme Adsorption at the Interface 123
4 RESULTS & DISCUSSION: DROPLET FORMATION
4.0.1 Droplet Formation and Linearity 126
4.0.2 Dual Aqueous Input Electro-Fusion T-Junction Chip 135
4.0.3 Surfactant CMC Determination by Dynamic Light Scattering 137
4.1 Summary & Conclusions 138
4.1.1 Droplet Formation and Linearity 138
4.1.2 Dual Aqueous Input Electro-Fusion T-Junction Chip 139
4.1.3 Fluorosurfactant CMC Determination 139

5
5. RESULTS & DISCUSSION: COMPOUND PARTITIONING
5.0.1 Partitioning from Aqueous to Oil Phase (Glass Vial tests) 141
5.0.2 AstraZeneca (AZ) Library Compounds: Aqueous Solubility 146
5.0.3 AstraZeneca Library Compounds: Partitioning - Round 1 & 2 146
5.0.4 Predictive Modelling of Partitioning 156
5.0.5 AstraZeneca Library Compounds: Partitioning - Round 3 156
5.0.6 Partitioning from Droplets to Carrier Oil in Droplet Chip 159
5.1 Summary & Conclusions 160
5.1.1 Partitioning – Glass Vial Tests 160
5.1.2 Partitioning – Droplet Chip Tests 161
5.1.3 Partitioning – AZ Library Compounds & Predictive Modelling 161
6. RESULTS & DISCUSSION: CYTOCHROME P450 REACTION
6.0.1 Microtitre Plate: Reaction Dependence on Temperature 163
6.0.2 Microtitre Plate: Linearity at 34 °C and Standard CHC Curve 166
6.1 Summary & Conclusions 169
6.1.1 Reaction Dependence on Temperature & Linearity of Reaction 169
6.1.2 CHC Standard Curve 169
7. RESULTS & DISCUSSION: SPIRAL INCUBATION CHIP
7.0.1 Droplet Chip: CHC Standard Curve 171
7.0.2 Droplet Chip: Cytochrome P450 Enzyme Inhibition 175
7.1 Summary & Conclusions 181
7.1.1 P450 Enzyme Reaction in Spiral Incubation Chip 181
8. RESULTS & DISCUSSION: PARTITIONING FOLLOW-UP
8.0.1 Shake Flask 182
8.1 Summary & Conclusions 185
8.1.1 Shake Flask 185

6
9. RESULTS & DISCUSSION: SERPENTINE INCUBATION CHIP
9.0.1 Cytochrome P450 Control Activity (no inhibitor) 186
9.1 Summary & Conclusions 188
9.1.1 Serpentine Incubation Chip 188
10. RESULTS & DISCUSSION: BLOCKING PROTEINS
10.0.1 Determination of Fluorescent Tag 189
10.0.2 Labelled Proteins at the Droplet-Oil Interface 190
10.0.3 Droplet Formation in the Presence of Blocking Proteins 193
10.0.4 Impact of Blocking Proteins on Cytochrome Enzyme Reaction 194
10.0.5 Impact of Blocking Proteins on Cytochrome 1A2-CEC pIC50 197
10.1 Summary & Conclusions 200
10.1.1 Fluorescent Tagging & Labelled Proteins at the Droplet Interface 200
10.1.2 Droplet Formation in the Presence of Blocking Proteins 200
10.1.3 Impact of Blocking Proteins on the Cytochrome P450 Reaction 201
11. SUMMARY, CONCLUSIONS AND FURTHER WORK
11.1 Summary 202
11.2 Conclusions 205
11.2.1 Partitioning of Compound from the Droplet 205
11.2.2 Enzyme Inhibition & Proteins at the Droplet Interface 207
11.2.3 Droplet Technology as an Industrial Screening Tool 207
11.3 Further Work 208
11.3.1 Predictive Model Development 208
11.3.2 Reagents into Microfluidic Devices 209
11.3.3 Analytical Detection Methods 213
11.3.4 Cell-based Droplet Microfluidics 214
12. REFERENCES 216

7
Abstract
Many droplet microfluidic assays have been described in the literature over the last decade of
research, however, there has been little reported industrial use of droplet microfluidics in
drug discovery compound screening, and in particular that of P450 enzyme inhibition assays
for profiling drug-drug interactions. This is partly for Intellectual Property reasons, since
Pharmaceutical companies do not wish to give away trade secrets in a competitive market,
but also because the technology is not yet 'proven' and remains in the proof-of-concept stage.
In droplet microfluidics, where at least two liquid phases are encountered, it is important that
leakage of material between phases is addressed. This effect has been extensively reported in
the literature using fluorescent dyes, however there is very little evidence of research using
large compound sets of diverse chemistry. This is probably because few researchers have
access to the large pharmaceutical libraries necessary for this work.
This project assessed the feasibility of translating a widely used microtitre plate-based P450
enzyme inhibition assay to droplet format; determined the extent of partitioning from droplets
using a large pharmaceutical library set and attempted to model this behaviour, and thirdly,
considered the pharmacological impact the droplet format may have on the assay.
The P450 cytochrome 1A2 enzyme type (isoform) was chosen for translation to the micro-
droplet format. Assays of this type are often conducted using fluorogenic substrates, making
them favourable for relatively easy fluorescent detection in droplet format using simple
optical detection assemblies.
Oil selection was investigated to determine which oil systems would be better suited in
respect of droplet formation. The use of surfactants in the oil phase and its impact on droplet
formation was studied and the synthesis, preparation and characterisation of a custom
perfluoropolyether (PFPE) surfactant (‘AZF’) conducted.
8
Droplet chips were designed and fabricated to produce droplets of 200–300 µm diameter
using novel channel designs and sealing techniques. The droplets were analysed by
fluorescence spectroscopy using bespoke detector apparatus. Partitioning from aqueous to oil
phase was studied for a small range of compounds and oils (with and without surfactant for
fluorous oils). Partitioning was lowest using fluorous oils alone, and increased substantially
when surfactant was included. Results from the large pharmaceutical test set suggested the
percentage of compounds that may partition readily to the oil phase is low even when using
surfactant. However, attempts to correlate this to known physicochemical properties and to
develop a predictive model for fluorous solubility proved largely unsuccessful. Partitioning in
the droplet chip using a droplet collection pooling method was difficult to quantify as a
consequence of the profound impact turbulence had on partitioning.
Miniaturisation of the P450 cytochrome inhibition assay to the droplet format initially gave
poorly reproducible low signals. Possible causes included detector insensitivity, partitioning
of reagent and/or fluorescent metabolite over longer incubation times, and binding of the 1A2
P450 cytochrome enzyme-protein at the droplet interface.
Protein interaction at the droplet-oil boundary was studied by fluorescence labelling a protein
contained in 200µm droplets and observing the extent of fluorescence localisation at the
interface by epifluorescent and confocal fluorescence microscopy. The data from this work
indicates a pronounced localisation of protein at the droplet interface, possibly leading to
enzyme deactivation and the loss of signal seen for the assay in the droplet chip.
A number of protein titrations were co-added to the droplets as 'blocking proteins' which
were found to improve the reaction output, however were also noted to affect the
pharmacology of the assay, noted by an order of magnitude shift in the reported IC50 for the
test inhibitor used (fluvoxamine).

9
The effects of compound leakage from droplets, and the possible detrimental impact on
biological reagents by interaction at the droplet-oil interface, is a challenge that may limit
widespread adoption of droplet MF systems in drug screening operations. Appropriate
control measures and/or a means to reduce these effects are essential to enable accurate
quantification with industrial drug discovery environments.
The findings in this work highlight the challenges that have to be addressed for droplet
microfluidic technology to be successfully incorporated into key areas of assay screening
within drug discovery. In terms of further research, there is a significant requirement for the
research community to delve further into these challenges and work closely with the industry
sector to understand the beneficial role microfluidics can have and how to develop effective
robust strategies the industry can easily adopt to progress this area of science.

10
Abbreviations
AZ AstraZeneca
AZF AstraZeneca custom-made fluorosurfactant
ADC Analogue-to-Digital Convertor
ADME Adsorption, Distribution, Metabolism & Excretion
BSA Bovine Serum Albumin
°C Degrees Celsius
Ca Capillary number
CAD Computer Assisted Design
CCD Charged-Coupled Device
CEC 3-cyano-7-ethoxycoumarin
CHC 3-cyano-7-hydroxycoumarin
CNC Computer Numerical Control
Cpd(s) Compound(s)
CV Co-efficient of Variation
d or φ Diameter
DC Direct Current
DCM Dichloromethane
DDA Dodecylamine
DLS Dynamic Light Scattering
DMPK Drug Metabolism and Pharmacokinetics
DMSO Dimethylsulfoxide
cDNA complimentary Deoxyribonucleic Acid
EOF Electro-Osmotic Flow
EWOD Electro-Wetting On Dielectric
et al. abbreviation: et alia (Latin: ‘and others’)
FEP Fluoroethylene Propylene
FI Fluorescent Intensity

11
FITC Fluorescein Isothiocyanate
f.p.s Frames Per Second
FP Fluorescent Polarisation
FRET Fluorescent Resonance Energy Transfer
FSD Full Scale Deflection
h Height or depth
HCB High Content Biology
HF/HNO3 Hydrogen Fluoride / Nitric Acid
HF/NH4F Hydrogen Fluoride / Ammonium Fluoride
HPLC High Performance Liquid Chromatography
HTS High Throughput Screening
HV High Voltage
HVPS High Voltage Power Supply
IC50 Concentration to yield 50% inhibition of effect
i.d. Internal Diameter
in vitro latin: ‘In Glass’
in vivo latin: ‘Within the living’
in silico analogy: ‘By Computer’
IR Infrared
l Length
logD Logarithm of the Distribution Co-efficient (partitioning)
logP Logarithm of the Partition Co-efficient
MF Micro Fluidic Device(s)
MS Mass Spectrometry
NADPH Nicotinamide adenine dinucleotide phosphate
P450(s) Referring to ‘Cytochrome P450 enzyme(s)’
P Fluidic pressure
PAPS 3’-phosphoadenosine-5’-phosphosulfate
PC Polycarbonate

12
(q)PCR (quantitative) Polymerase Chain Reaction
PDMS Polydimethylsiloxane
PEG Poly ethylene glycol
PID Proportional Integral Derivative
PFPE Perfluoropolyether
PFO Perfluorooctanol
PMMA Polymethylmethacrylate
PMT Photo-Multiplier Tube
PoC Proof of Concept
PTFE Polytetrafluoroethylene
Proliferation (cell) Cell growth via cell division.
Q Volumetric or total flow rate
QT interval desc.: electrical depolarization and repolarisation of the
heart ventricles
Re Reynolds number
ROC Receiver Operating Characteristic
RSD Relative Standard Deviation
s Second (time)
SAR Structure-Activity Relationship
SBS Society for Biomolecular Sciences
THF Tetrahydrofuran
TRF Time Resolved Fluorescence
(µ)TAS (micro) Total Chemical Analysis System
USB Universal Serial Bus
UV Ultraviolet
VIS Visible
w Width
We Weber number

13
Declaration and Copyright Statement
No part of the work referred to in this doctoral thesis has been submitted (either previously,
or concurrently), in support of any application for other degree or qualification of this or any
other university, institute or centre of learning.
The ownership of any intellectual property rights described in this thesis is vested in the
University of Manchester (herein referred as ‘the University’) and AstraZeneca
Pharmaceuticals plc. (herein referred as ‘the Company’), subject to any prior agreement to
the contrary, and may not be made available for use by third parties without the written
permission of the University and the Company as appropriate, which will prescribe the terms
and conditions of any such agreement.
Further information on the conditions under which disclosures and exploitation may take
place is available from the University via the head of the School of Chemical Engineering
and Analytical Science, and from the Company via the Director of High Throughput
Screening, Discovery Sciences.
Copyright in text of this thesis rests with the Author. Copies (by any process) either in full,
or in extracts, may be made only in accordance with instructions given by the Author and
lodged in the John Ryland’s University Library of Manchester. Details may be obtained from
the Librarian. This page must form part of any such copies made.
Further copies (by any process) made in accordance with such instructions may not be made
without the written permission of the Author.

14
Acknowledgements
AstraZeneca
I would like to thank the AstraZeneca (AZ) colleagues who over the last several years have
helped enable the opportunity to embark upon this research and have provided the support
and sponsorship for my research endeavours:
Ian Wilson, Kin Tam, David Robinson, Christine Rigby, Brian Law, Madeleine Brady,
Carolyn Blackett, Derek Barratt, Mark Wigglesworth and Steve Rees.
In addition, I would like to extend thanks to Trevor Johnson, Ian Sinclair and Thierry Kogej
for their assistance with fluorosurfactant synthesis, HPLC-MS analysis and Bayesian model
construction, respectively.
University of Manchester
I would also like to thank my academic supervisors, Prof. Peter Fielden (PRF) and Prof.
Nicholas Goddard (NJG) for their supervision and encouragement – it has been a pleasure to
be part of their research group. I would particularly like to thank Dr. Stephan Mohr for his
invaluable help and tuition in micro-fabrication and for sharing his technical knowledge on
CAD design and CNC machining.
I would also like to thank the rest of the PRF/NJG group. Special thanks to Dr. Bernard
Treves Brown for helping me with all things relating to computers and to Dr. Amelia Markey
and Dr. Craig Alexander for their help and guidance during my time at the University of
Manchester.
Finally, I thank my wife and family for putting up with the pain of my research, constant
ramblings about microfluidics and compound screening.
Brett Litten, July 2016.

15
1 INTRODUCTION
1.1 Overview
This project concerned the application of droplet microfluidic technology as a proposed
viable option for the miniaturisation of screening activities in industrial drug discovery. The
body of this work attempted to address challenges requiring consideration to help enable
microfluidics to evolve from proof-of-concept processes (PoC) to platforms that are able to
deliver reproducible and accurate data in the discovery and development of new drugs.
Microfluidics as a screening technology is highly desirable in that it can achieve significant
reagent and cost reductions for an industry whose expenses constantly increase. This
introduction considers the state of the art of microfluidics and the present technology and
assay formats currently used in routine industrial screening.
The project specifically considered the biphasic environment of droplet microfluidics and the
impact this has for screening from several aspects; i) partitioning of material between liquid
phases; ii) droplet miniaturisation of an enzyme assay used regularly in drug screening; iii)
the impact of protein binding at the liquid–liquid droplet interface, and iv) how to mitigate
adverse interaction artefacts at the liquid-liquid droplet interface.
1.2 Drug Discovery and Screening
1.2.1 Early Phase Screening
Advances in chemical engineering and combinatorial chemistry have provided a means for
many novel compounds to be made with comparative ease on a short time scale. The vast
diversity of these compounds has resulted in a significant increase in the use of high-

16
throughput screening techniques within the pharmaceutical industry to characterise these
compounds1.
Miniaturisation of in vitro assays used within the pharmaceutical industry can lead to a
significant efficiency improvement, reduction of operational costs and a decrease in
consumption of reagent and/or test compound2. A reduction in the personnel resource
required to generate a given assay throughput is similarly an attractive feature of streamlined
assays and provides opportunity for employee skills to be used in the most effective and
efficient manner. Drug hunting screening activities in the pharmaceutical industry exploit
increasingly smaller assay footprints, with many biochemical and cell early-screening
processes using 384- and 1536- well microtitre plate formats1. In early phase drug discovery,
one strategy to find novel leads is through compound collection library screening. High
Throughput Screening (HTS) campaigns are executed whereby large numbers (typically
50000 to 2-3 million) of chemically diverse materials are screened against the validated target
of interest in an effort to find ‘active hits’ that may have the appropriate pharmacology for the
target in question3.
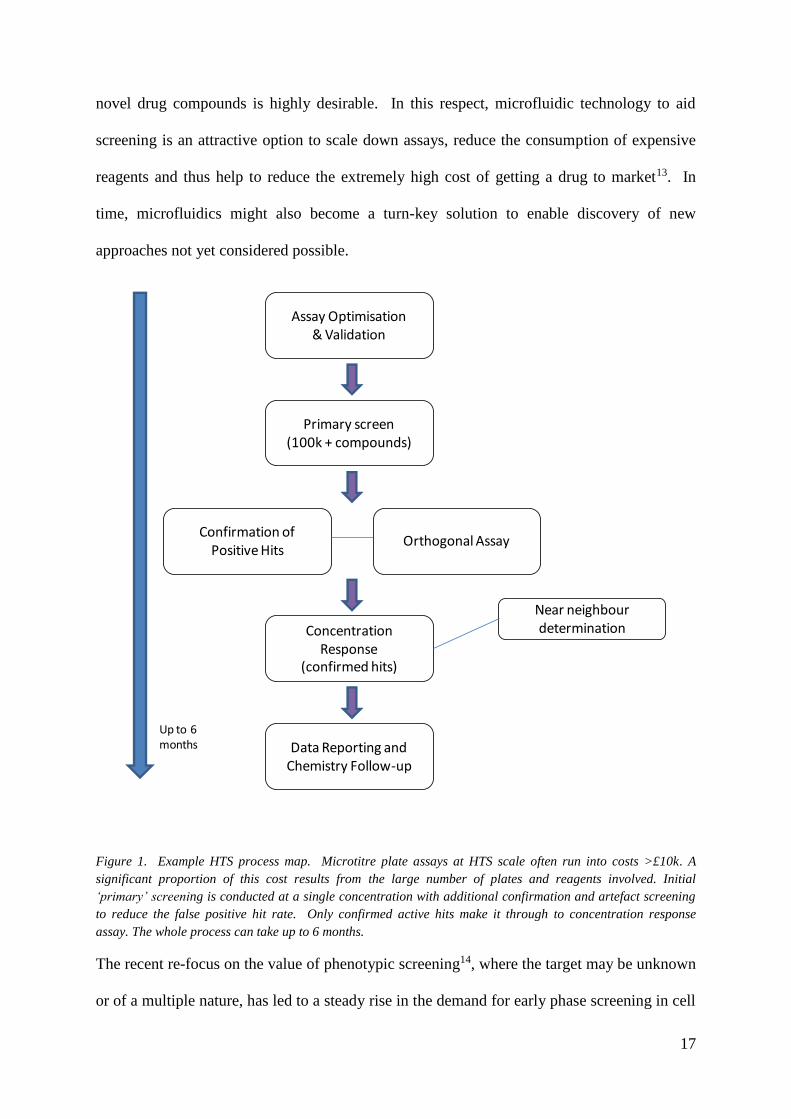
Despite significant gains, such as reduced reagent consumption and elevated throughput by
using 1536-well plate formats, HTS (Figure 1) remains a time-consuming and relatively
cumbersome process. However, given the expanse of chemical diversity, it remains one of the
main approaches to screen tens of thousands to millions of compounds against different
biological targets4-8. Despite the operational benefits conventional microtitre plate-based
miniaturisation may offer, reductions in well volume can give rise to other problems such as
evaporation leading to plate artefacts and an increase in non-specific binding due to larger
surface area-to-volume ratios9,10. Furthermore, high density microtitre plate assays often rely
upon relatively bulky and expensive equipment for high capacity automated screening11,12.
The desire to apply technologies that may enable new science and reduce the cost of finding
17
novel drug compounds is highly desirable. In this respect, microfluidic technology to aid
screening is an attractive option to scale down assays, reduce the consumption of expensive
reagents and thus help to reduce the extremely high cost of getting a drug to market13. In
time, microfluidics might also become a turn-key solution to enable discovery of new
approaches not yet considered possible.
Figure 1. Example HTS process map. Microtitre plate assays at HTS scale often run into costs >£10k. A
significant proportion of this cost results from the large number of plates and reagents involved. Initial
‘primary’ screening is conducted at a single concentration with additional confirmation and artefact screening
to reduce the false positive hit rate. Only confirmed active hits make it through to concentration response
assay. The whole process can take up to 6 months.
The recent re-focus on the value of phenotypic screening14, where the target may be unknown
or of a multiple nature, has led to a steady rise in the demand for early phase screening in cell
Assay Optimisation & Validation
Primary screen (100k + compounds)
Confirmation of Positive Hits
Orthogonal Assay
Concentration Response
(confirmed hits)
Data Reporting and Chemistry Follow-up
Near neighbour determination
Up to 6 months

18
lines or whole organism entities such as c. elegans15, which may present additional
challenges to performing quantifiable assays in miniaturised microtitre plates formats, thus
making microfluidic technology more attractive
1.2.2 Drug Metabolism and Pharmacokinetics
In pharmaceutical drug discovery, confirmed hits against the target biology will enter a
second phase of testing to further characterise the lead compounds (Figure 2)16,17. Typically,
assays in the early phase investigate the interaction of test compounds against the biology
target, whereas later stages will include panels of assays used to characterise physicochemical
and metabolic properties such as solubility, logD (distribution of compound by partitioning
between phases), blood plasma binding, drug transporters (intra- and inter- cellular),
metabolic profiling and investigation of in vivo phamacokinetics and pharmacodynamics18-22.
Figure 2. Some key stages of drug discovery & development screening activities for a drug project.
The cytochrome P450 inhibition assay is an important tool in early-phase screening for
identifying compounds that can cause undesirable drug-drug interactions in the clinic in
respect of drug metabolism by the liver. Historically, there is the example of co-
administration of the anti-inflammatory drug terfenidine, with the anti-fungal drug,
ketoconazole23. In this situation, ketoconazole was reported to have inhibited the action of
cytochrome 3A4 enzyme, switching off the metabolic pathway, and hence physiological
Project timeline
HTS & SAR
DMPK
Molecular Tox

19
clearance (elimination) of terfenidine. Over time, the concentration of terfenidine, which
affects the potassium ion channel responsible for correct heart regulation (QT interval),
increased to toxic levels, resulting in heart arrhythmia and sudden cardiac death23,24.
Cytochrome inhibition assays allow screening of test compounds often against the five major
human liver cytochrome P450 enzymes (1A2, 2C9, 2C19, 2D6, 3A4) responsible for a large
percentage of xenobiotic metabolism25-27. The assay enables scientists to calculate the
concentration of drug that will cause 50% inhibition (IC50) of a specific P450 enzyme-
substrate pair reaction by testing over a range of drug concentrations. The P450 enzyme-
specific substrates are metabolised to products that have been quantified by various analytical
techniques, such as fluorimetry26,28 or mass spectrometry29. Compounds found to be
affecting enzyme activity can thus be identified at an early stage and modified to remove or
reduce undesired interactions.
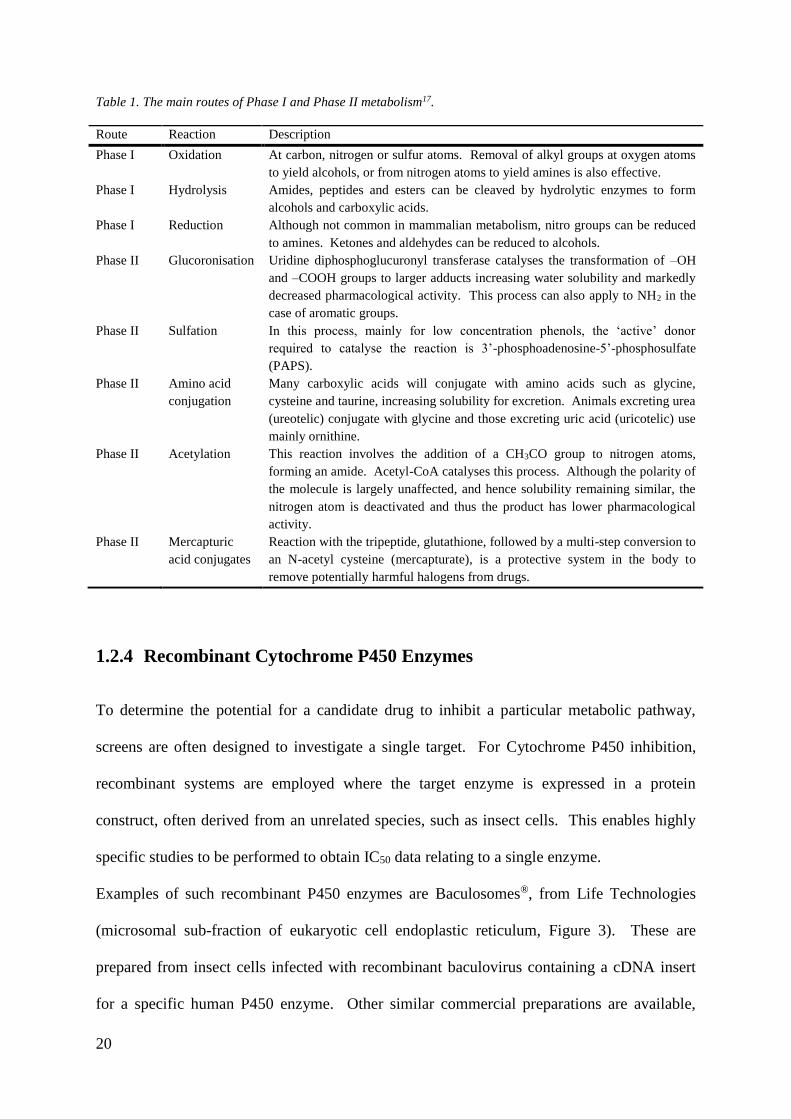
1.2.3 Phase I/II Metabolism
In the context of this project involving the miniaturisation of a P450 cytochrome assay, Phase
I metabolism is the most relevant. This type of metabolism occurs when compounds are first
passed through the liver to be processed for elimination30. Most often, this initial form of
metabolism involves making the material more water-soluble and hence more readily
excreted via the urine. There are a number of chemical reactions that can be accomplished to
achieve this aim. Table 1 summarises the most common routes for comparison.
20
Table 1. The main routes of Phase I and Phase II metabolism17.
Route Reaction Description
Phase I Oxidation At carbon, nitrogen or sulfur atoms. Removal of alkyl groups at oxygen atoms
to yield alcohols, or from nitrogen atoms to yield amines is also effective.
Phase I Hydrolysis Amides, peptides and esters can be cleaved by hydrolytic enzymes to form
alcohols and carboxylic acids.
Phase I Reduction Although not common in mammalian metabolism, nitro groups can be reduced
to amines. Ketones and aldehydes can be reduced to alcohols.
Phase II Glucoronisation Uridine diphosphoglucuronyl transferase catalyses the transformation of –OH
and –COOH groups to larger adducts increasing water solubility and markedly
decreased pharmacological activity. This process can also apply to NH2 in the
case of aromatic groups.
Phase II Sulfation In this process, mainly for low concentration phenols, the ‘active’ donor
required to catalyse the reaction is 3’-phosphoadenosine-5’-phosphosulfate
(PAPS).
Phase II Amino acid
conjugation
Many carboxylic acids will conjugate with amino acids such as glycine,
cysteine and taurine, increasing solubility for excretion. Animals excreting urea
(ureotelic) conjugate with glycine and those excreting uric acid (uricotelic) use
mainly ornithine.
Phase II Acetylation This reaction involves the addition of a CH3CO group to nitrogen atoms,
forming an amide. Acetyl-CoA catalyses this process. Although the polarity of
the molecule is largely unaffected, and hence solubility remaining similar, the
nitrogen atom is deactivated and thus the product has lower pharmacological
activity.
Phase II Mercapturic
acid conjugates
Reaction with the tripeptide, glutathione, followed by a multi-step conversion to
an N-acetyl cysteine (mercapturate), is a protective system in the body to
remove potentially harmful halogens from drugs.
1.2.4 Recombinant Cytochrome P450 Enzymes
To determine the potential for a candidate drug to inhibit a particular metabolic pathway,
screens are often designed to investigate a single target. For Cytochrome P450 inhibition,
recombinant systems are employed where the target enzyme is expressed in a protein
construct, often derived from an unrelated species, such as insect cells. This enables highly
specific studies to be performed to obtain IC50 data relating to a single enzyme.
Examples of such recombinant P450 enzymes are Baculosomes®, from Life Technologies
(microsomal sub-fraction of eukaryotic cell endoplastic reticulum, Figure 3). These are
prepared from insect cells infected with recombinant baculovirus containing a cDNA insert
for a specific human P450 enzyme. Other similar commercial preparations are available,

21
including Supersomes® from BD Gentest and Bactosomes® from Cypex. Assays
investigating enzyme inhibition can either use small 'drug-like' substrate probes25 or
fluorogenic substrate probes26,27.
Figure 3. Eukaryotic cell diagram, highlighting main components (slice). Figure courtesy of AstraZeneca. Cell
type is mammalian (not specified).
Assays using small 'drug-like' probes are generally regarded as being more pharmacologically
relevant as the products are also more ‘drug-like’ i.e. they more closely resemble the small-
molecule physicochemical properties of the candidate drugs being tested (see section on
Lipinski’s rules). Mass spectrometry can be used to detect and quantify the metabolic
products, however, for early screening processes where vast numbers of compounds are
tested against different P450 enzymes, it may be necessary to utilise spectroscopic techniques
to enable a higher throughput to meet business demand.
In one form of a typical fluorescence P450 inhibition experiment2,31, the enzyme is incubated
with an enzyme-specific coumarin substrate and test compound at known concentration. The
Nucleus
Mitochondria
Endoplasmic
reticulum
Cytosol
10 µm

22
reaction can be initiated by the addition of the reduced form of nicotinamide adenine
dinucleotide phosphate (NADPH) as depicted by the reaction schematic in Figure 4.
Figure 4. Reaction schematic for phase I metabolism of the fluorogenic substrate 3-cyano-7-ethoxycoumarin.
The reduced flavoprotein, NADPH, facilitates electron transfer in the cleavage of the ethoxy group producing
the fluorescent metabolite 3-cyano-7-hydroxycoumarin. Figure adapted from an image courtesy of the
AstraZeneca Structure & Biophysics group.
After the required incubation duration, reaction cessation may be achieved by the addition of
a suitable quenching reagent, such as chilled acetonitrile, which denatures the enzyme
protein, preventing further reaction17. The resultant fluorescent substrate metabolite is then
quantified by fluorescence spectroscopy and the metabolic inhibition calculated by
regression. The experiment is normally set up so there is an excess of enzyme, yielding
pseudo-first order kinetics (Figure 5).
Figure 5. Competitive enzyme reaction. Pseudo first-order kinetics where there is an excess of enzyme and
competition between the substrate and competitive inhibitor for binding to the enzyme binding pocket.

23
1.2.5 Lipinski's 'Rule of Five'
In 1997, Christopher Lipinski (at the time working with Pfizer) devised the mnemonic, ‘Rule
of Five’ relating physicochemical properties of a molecule to whether or not it may be
considered 'drug-like'32. In the context of pharmaceutical products, there are a number of
properties that may indicate being 'drug-like', including good solubility in biological tissues,
being able to pass into cells (such as the eukaryotic cell depicted in Figure 3) or being small
enough to interact with reactive pockets in proteins and enzymes33. Rather than being five
rules, there are in fact only four, but the parameters of each have cut-off values containing
five, as summarised in Table 2.
Table 2. Lipinski's 'Rule of Five' for drug-like molecules. The rule is perhaps useful as a starting point in drug
design, but is by no means perfect. There are many drugs marketed in recent years that do not follow the 'Rule
of Five' and would not have made it to market if the rules were followed explicitly.
Number of Hydrogen bond donors < 5
Molecular Weight < 500
Clog P < 5
Sum of nitrogen and oxygen atoms < 10
1.2.6 Microtitre Plate Enzyme Inhibition Assays
In industry, in vitro P450 inhibition assays were initially conducted in test tubes and more
recently in 96 well microtitre plates34, however, increasing demands upon the industry has
resulted in further miniaturisation to 384- and 1536-well formats (Figure 6) to increase
throughput35. In conjunction, laboratory automation for plate and liquid handling has become
commonplace to ensure good reproducibility, high levels of assay throughput and unattended
operation25,27,36-38. Assays conducted in 96-, 384- and 1536-well microtitre plates typically
feature incubate volumes of 200 µL, 30 µL and 5 µL, respectively17.

24
Figure 6. 96-, 384- and 1536-well microtitre plates used in drug discovery screening.
A microtitre plate-based assay may follow a procedure similar to that outlined in Figure 7 for
an optimised assay where the enzyme kinetic profile has been previously determined. A
protocol of this format lends itself to drug discovery screening and droplet microfluidics, as
many, if not all of the reagents, can be prepared in advance.
Figure 7. Typical protocol for cytochrome P450 inhibition assay.
As P450 cytochromes have a sensitivity to DMSO, which can significantly inhibit
activity39,40, routine assay procedures may often include DMSO controls which are used to
NAPDH solution is added to wells (concentration excess).
Dissolve substrate in suitable solvent at relatively high concentration.
Test compounds and controls are solubilised in DMSO.
Concentration response (CR) curve working solutions are prepared for all compounds.
A specific volume of each compound CR solution is dispensed into the assay plate.
P450 enzyme stock is thawed and diluted in pH7.4 phosphate buffer.
Fluorogenic substrate is spiked to the enzyme solution.
NADPH is solubilised to the required concentration in pH7.4 phosphate buffer.
Compounds dispensed to the enzyme solution, mixed, and pre-incubated for 5 minutes at 37 °C.
Incubate for required duration at 37 °C (incubation time depends on activity of enzymes)
Quench all wells with acetonitrile to stop reaction (or perform in situ real time analysis)
Read plates in fluorescent intensity mode at the emission wavelength for the substrate metabolite
and calculate IC50.

25
correct the maximum rate of the enzyme minus any inhibitory test compound. Equations 1 to
12 can be applied to calculate compound IC50 data assuming the same concentration of
DMSO is present in each test well (Equation (1)):
Mean Background = ∑ Ctrl(DMSO)n
1n
n (1)
Control Rate= Ctrl(DMSO)n- Mean Background
Incubation time (min) (2)
The assay signal-to-noise ratio is calculated using Equation 3.
Assay S:N=∑ [
Ctrl(low)nCtrl(DMSO)n
⁄ ]1n
n (3)
Where Ctrl(low) is the lowest concentration point of control drug
Compound S:N= Cpd(low)
Cpd(0) (4)
Where; Cpd(low) is the signal obtained at the lowest test compound concentration
and Cpd(0) is the signal obtained at the top compound concentration (added after
incubation).
Corrected fluorescence = Raw Fluorescence-Mean Background (5)
Individual Cpd Rate=Corrected C(n)c fluorescence
Assay incubation time (min) (6)
Compound signal-to-noise ratio is found by dividing the signal for the lowest test compound
concentration by the signal for the compound top concentration, where this top concentration
sample is added after incubation, as described by Equation (4). Differences between this S:N
and the Assay S:N (Equation (3)) are used as an indicator identifying the presence of
fluorescent quenching or enhancement, often due to compound native fluorescence at the
emission wavelength being monitored .

26
The maximum rate of the enzyme-substrate reaction is found by Equation (7):
Maximum rate (C(n)c=
∑ (Ctrl(i)corr
Ctrl(0)corr⁄ )n
i=1
n (7)
Individual compound rates are found using Equation (8):
Individual maximum rate (C(n)c)=
([Ctrl(n)1
Ctrl(0)1⁄ ]+[
Ctrl(n)2Ctrl(0)2
⁄ ])
2 (8)
Individual compound rates are converted to a percentage of the maximum corrected control
activity using Equation (9):
% Maximal Rate= Individual rate*100
Maximal rate (9)
To calculate IC50 values for each compound, the log of the % rate difference is plotted against
the log compound concentration and linear regression used to determine the gradient and
intercept. IC50 data can then be calculated using a pseudo-Hill analysis, plotting:
the dependent variable; Log (% maxrate
100-% max rate) vs. (10)
the dependent variable; Log (concentration) (11)
Linear regression analysis is then used to calculate the gradient and Y-intercept of the line
(Equation 12).
IC50= 10(-Intercept
Gradient⁄ ) (12)

27
1.2.7 Droplet Microfluidic Chip Assays
Despite the widespread use of P450 enzyme inhibition assays in drug discovery, few reports
directly consider the use of droplet microfluidic technology to aid this screening process and
even fewer consider the implications of leakage, or partitioning, from droplets can have in
drug discovery environments. There exists a comprehensive body of work describing various
enzymatic and cellular droplet-based reactions and consideration of other specific areas such
as Directed Evolution41,41,42,42 and droplet PCR43 where microfluidic technology can be
considered to have some impact. Gu et al. reported a droplet based system for enzyme
inhibition utilising electrochemical detection44. In this paper, Gu describes the potential for
surfactant to interfere with enzyme assays and reports that for the inhibition of hydrolytic
transformation of acetylcholinesterase to thiocholine, surfactants did not have a significant
effect on the assay. Recently, a compartmentalised absorbance end-point assay to determine
the Michaelis–Menten parameters of 4-nitrophenyl glucopyranoside hydrolysis by sweet
almond β-glucosidase was reported by Gielen et al.45. Gielen reports the use of 0.5%
perfluorooctanol in the fluorous oil phase necessary to aid droplet formation. Interestingly,
neither author comments on the potential for partitioning and its relevance to general drug
screening.

28
Table 3. Summary of example assays reported in droplet microfluidic formats.
Droplet-based Assay / System Description Reference Type
Cell proliferation and encapsulated multi-cellular organism toxicity 46 Cell
System for high throughput cytotoxocity screening of encapsulated single
mammalian cells 47 Cell
3D tumour simulation using breast tumour cells, drug loading and cell
viability testing 48 Cell
Sepsis diagnosis due to bacterial infection by measurement of minimal
inhibitory concentration of antibiotics 49 Bacteria
Bacterial population dynamics 50 Bacteria
Drug screening; droplet storage, mixing & detection – toxicity assays 51 Cell
Multidimensional concentrations of bacteria to evaluate toxic effects 52 Bacteria
High throughput screening of enzymes by retroviral display 53 Virus
Quantitative cell reporter gene assay 54 Cell
Directed evolution of biocatalysts for biofuel cell application 55 Biochemical
Dose-response assay of enzyme inhibitors using electrochemical detection 56 Biochemical
Discovery of promiscuous enzymes using functional metagenomics 57 Biochemical
Measuring enzyme kinetics 58 Biochemical
High throughput PCR 43 Biochemical
Recently, a number of articles have detailed the potential for compound leakage from and
between droplets and have attempted to characterise the mechanisms which govern such
transfers59,60. In addition, the impact of surfactant on droplet leakage has been studied61-63.
However, little work has been published linking such proof-of-concept studies, which often
use fluorescent dyes, to the case of drug screening where a much wider range of chemistry is
encountered.

29
Other work, such as that by Gupta64 and Pan65 consider approaches taken to counteract the
potential for droplet leakage through the use of nanoparticles to ‘block’ transport at the
interface.
1.2.8 Microfluidics, Industrial Screening and the ‘Killer App’
Over the last twenty years, biotechnology and academic institutions have contributed on a
global footprint to the discovery and development of a vast array of microfluidic solutions.
Figure 8 – Gartner’s Hype Cycle depicting the last 25 years of microfluidic expectation. Figure adapted from
published work by the Gartner Group64.
As Becker stated in his 2008 review on microfluidics66 and in his article from 2010 on
‘Collective Wisdom’67, we have seen a trend based on Gartner’s Hype Cycle68 that reflects a
fairly accurate picture of how microfluidics has been regarded over the last two decades
(Figure 8). Despite advances being made, with a great many functions having been
performed in a variety of microfluidic approaches58,69-72, it follows there may still remain a
number of significant challenges around seamless integration of microfluidics into a scientific
community that is very much microtitre plate-centric73-76. The fact that many drug hunting
Hype
1990 1995 2000 2005 2010 2015
Time
Inflated expectations
Technology trigger
Disillusionment
Slope of enlightenment
Plateau of productivity

30
organisations continue to rely almost exclusively upon the microtitre plate for compound
collection handling, suggests this is a key area for microfluidics development to address; that
is, devise ways to seamlessly integrate the existing technology with the new. There is a
perception that when a new technology arrives, it will replace the ones preceding it; there is
some truth to this idea. There are examples scattered across the history of science of
techniques being refined replaced with the ‘latest’ technology77-80. The consumer electronics
market is an obvious example where new developments are seized upon and displace the
previous generation of devices. However, the view that microfluidic technology is ‘the next
thing’ is perhaps misguided and the oft-mentioned microfluidic ‘killer app’81 that would
generate massive worldwide sales may not have materialised, evidenced perhaps from the
lack of sales to the pharma industry17. In the context of the pharmaceutical industry and drug
discovery, for microfluidics to be truly successful, not only must it provide advantages and be
robust, but it must also be implementable on a wide-scale, and have wide application appeal.
1.2.9 The Challenges for Microfluidics in Industry
As discussed before, there are financial benefits for the inclusion of microfluidics in drug
hunting organisations. Other reasons may include geographical footprint, where microfluidic
systems may require less laboratory space than the equivalent conventional microtitre plate-
based activity.
To achieve successful implementation, it is imperative that any microfluidic technology is
able to initially interface with existing technologies. To expect a complete removal of
previous technology from established processes is highly unrealistic, however, one may
expect a paradigm shift over time as re-investment allows processes to accommodate new
approaches.

31
This project seeks to address important areas required for microfluidics to prosper as a viable
screening tool within drug discovery. Firstly; the leakage of compounds from droplets
(Figure 9 a-c). Secondly; the interaction of reagents at the droplet interface and how this may
affect the efficacy or scalability of pharmaceutically relevant drug screening assays (Figure 9
d & e). and thirdly, how to mitigate the challenges presented.
An additional significant challenge, although out of scope for direct investigation in this
project, is how to get large numbers of test compounds from the test tube or microtitre plate
to the microfluidic chip or device. Many examples in the literature consider testing only
relatively small numbers of compounds administered to microfluidic chips using either
custom-designed chip systems or selecting from the limited range of commercialised
microfluidic products (for example, droplet chip products from Dolomite Microfluidics,
Royston, Cambridgeshire), however there is currently no major product solution available
that is perfectly suited for generic screening in microfluidics within higher throughput
screening in the pharmaceutical industry (Figure 9f). This will be considered further in
concluding remarks towards the end of this report.

32
Figure 9. Representation of some of the main challenges to overcome for successful implementation of
microfluidics in industrial drug screening; leakage of compounds from droplets (a-c), interfacial interaction of
biology at the droplet surface (d & e) and how to realise the transformation of compound testing from storage
tube to microtitre plate to microfluidic chip (f).
f.

33
1.2.10 The Cost of Screening
In early phase drug discovery, small molecule drug science relies extensively upon the
screening of novel drug entities against either identified validated targets, or within
phenotypic assays, in microtitre plate formats. To increase throughput, there is an ever
increasing dependency upon 1536-well microtitre plates16. However, not all assays can be
successfully miniaturised to 1536-well volumes, perhaps because of non-specific binding
problems associated with changes in surface area to volume ratios encountered in different
plate formats (larger surface area to volume ratio in the 1536-well compared to 384-well), or
evaporation issues at the smaller volume, hence the 384-well plate may be a good
compromise. In other cases, such as Structure-Activity Relationship (SAR) screening, the
throughput demand is lower and 96-well plates are more commonplace17,82,83.
In high throughput early-phase screening, the process generally includes screening compound
collections of interest (which may run into millions of compounds) at a single concentration,
referred to as the ‘primary assay’. However, as false positives can occur from biochemical or
technology artefacts, there is usually a requirement to run additional confirmation assays to
remove false positives. Following repeats to confirm active compounds, statistical analysis
allows a selection of compounds having a high confidence of being genuinely active against
the target to be progressed to full concentration response assays, whereby full IC50 profiling
can be completed. Structure Activity Relationship screening (SAR) which relates
pharmacologically relevant activity of a compound against the target biology to the molecular
structure is usually conducted as post-high throughput screening operation. As fewer
compounds may be tested at this stage, it is common to find greater use of 96- or 384-well
plate assays17,82. Table 4 highlights the typical plate costs associated with 384- and 1536-
well formats when running a single concentration primary assay.

34
With respect to Table 4, droplet microfluidic technology is highly desirable to lower assay
costs, especially if cheap injection moulding construction is used84,85. For a system using
droplets of 4 to 5 nL, this represents a 400-fold assay volume reduction per test, based on a
one-well to one-droplet comparison.
Table 4. The typical microtitre plate cost for primary screening 2 million compounds in 384 and 1536-well
plates.
In cell-based screening, plate format can be even more critical, with some screens not proving
robust enough in the 1536-well format; cells may not proliferate well, or the smaller number
of cells present do not provide a large enough total-well signal86,87. Typically, around 5000-
10000 cells per 384-well are required in cell-based assays, falling to 1000-2000 in 1536
format17. Clearly, the difference in the cost of cells between plate formats can be quite large,
especially in the case of specialised or primary cell types. Droplet microfluidics would
enable a substantial reduction in the quantity of cells required, which may be in the order of
100-1000 fold lower than 1536-well microtitre plates; however, reduction to fewer than
several cells per droplet may introduce other issues associated with maintaining cell viability
and controlling variability between droplets arising from differing cell densities.
Plate format Cost per plate† Number of plates* Total plate cost
384 £2.80 5682 £15,910
1536 £3.80 1327 £5,040
* assumes 32 wells contain controls in 384-well plate and 64 wells contain controls in 1536-well plate. †based on June 2014 Greiner Bio-One Ltd catalogue as a typical plate type.

35
1.2.11 Integration with Existing Technology
An important aspect of microfluidics is the ability to integrate with existing technology and
processes commonly in use within drug discovery. A critical step to achieve this is to
develop generic ways in which reagents and test compounds are introduced to chip-based
technology for screening. Whilst it is desirable to provide direct compatibility for analysis
(such as with plate readers), it is not critical, as it may be feasible to devise bespoke detection
systems for interrogating microfluidic chip-based systems, similar to that designed in this
work.
The majority of proof of concept (PoC) microfluidic research is often reported to rely upon
syringes or other external vessels and may use a variety of novel and complex on-chip pumps
and valving assemblies by which to introduce reagents to the devices88-90. These are
acceptable for research purposes, however are complicated to produce. To take these
innovations forward and develop microfluidics into a more mainstream commercialised
format that industry can use efficiently and effectively, other techniques should be considered
for reagent introduction. Negative pressure regimes to ‘sip’ solutions91-93, or provide open
micro-well intake ports for acoustic dispensing of compounds94 directly into the microfluidic
chip may be of benefit in this respect. MF devices designed around the design criteria of the
Society for Biomolecular Sciences (SBS) defined format may enable the use of existing
laboratory automation equipment and provide the crucial integration of differing
technologies.
1.2.12 Droplet Assays
The techniques for generating and manipulating droplets in microfluidic devices represent a
‘toolbox’ enabling specific processes to be designed to serve a single or many purposes.

36
Assays used within the pharmaceutical industry are generally either biochemical or cell-
based. The specific requirements of the microfluidic system are thus tailored towards either
environment.
In biochemical screening, it is commonplace for reagents to be dispensed in turn to a
microtitre plate that may include, but is not limited to, process steps for reagent addition, test
compound addition, mixing, incubation and analysis2,17,83.
In the microfluidic format, droplets containing test compound can be fused with other reagent
droplets to produce a reactant droplet that can then be incubated and subsequently analysed
downstream. Other strategies, as reported by Abate et al.95, use pico-injectors located along
the droplet channel to inject reagents from reservoir wells located on the chip directly into
passing droplets. As described by Song et al.96 reagents can be flowed to the droplet
generator (whether this be of T-junction or flow-focus design) where they mix intimately
immediately before being sheared off as reactant droplets. This approach simplifies the
microfluidic system by not requiring complicated droplet fusion methods, however may
become limiting if the number of reagents is large and may also give rise to higher system
dead volumes from the increased channel lengths required in the chip design.
In cell-based screening, cells from the growth culture are added to the reaction mixture and
mixed with test compounds and other required reagents, prior to incubation, etc. In droplet
microfluidic formats, it is thus necessary to encapsulate cells into droplets with known
populations without damage and add other reagents to the cell-containing droplets in a
quantitative manner. Many of the droplet handling techniques discussed above apply equally
to biochemical and cell based microfluidics. However, cells have additional requirements
such as needing nutrients, gas exchange and may need a support on which to survive and
grow, as is the case with a large number of adherent-type cell lines. Despite these

37
requirements necessarily complicating the design of cell-based microfluidic systems, a
number of reports in this field have demonstrated success in maintaining viable cells47,97,98.
1.2.13 Facilitation of Biochemical Screening in Microfluidic Devices
As reagents are dissolved in various buffers or media, it is usually a matter of adding
compound solutions to the biochemical reagents, incubating and then analysing the reactant
droplets17. Reagents can be individually supplied to the chip, or where possible, some
reagents may be pre-mixed ahead of the microfluidic chip environment to simplify the
channel network of the device.
1.2.14 Cell Screening - Encapsulation
As discussed previously, cell-based assay can be problematic for a variety of reasons in
existing microtitre plate assays, including the forcing of cell growth into a primarily 2D
environment (single monolayer of cells)99. Droplet microfluidic technology can be desirable
for cell assays as the environment within droplets can be sterile and largely unaffected by
external influence. The 3D nature of cells encapsulated within droplets offers the potential
for a more physiological relevant environment, more similar to that found for cells in
vivo100,101.
When a suspension of cells is encapsulated using a flow-focusing droplet device102,102-104 the
number cells per droplet follows the Poisson distribution. In this model, changing the density
of the supplied media cell suspension relative to the flow rates employed will change the cell
encapsulation distribution. Whilst the absolute number of encapsulated cells can be tightly
38
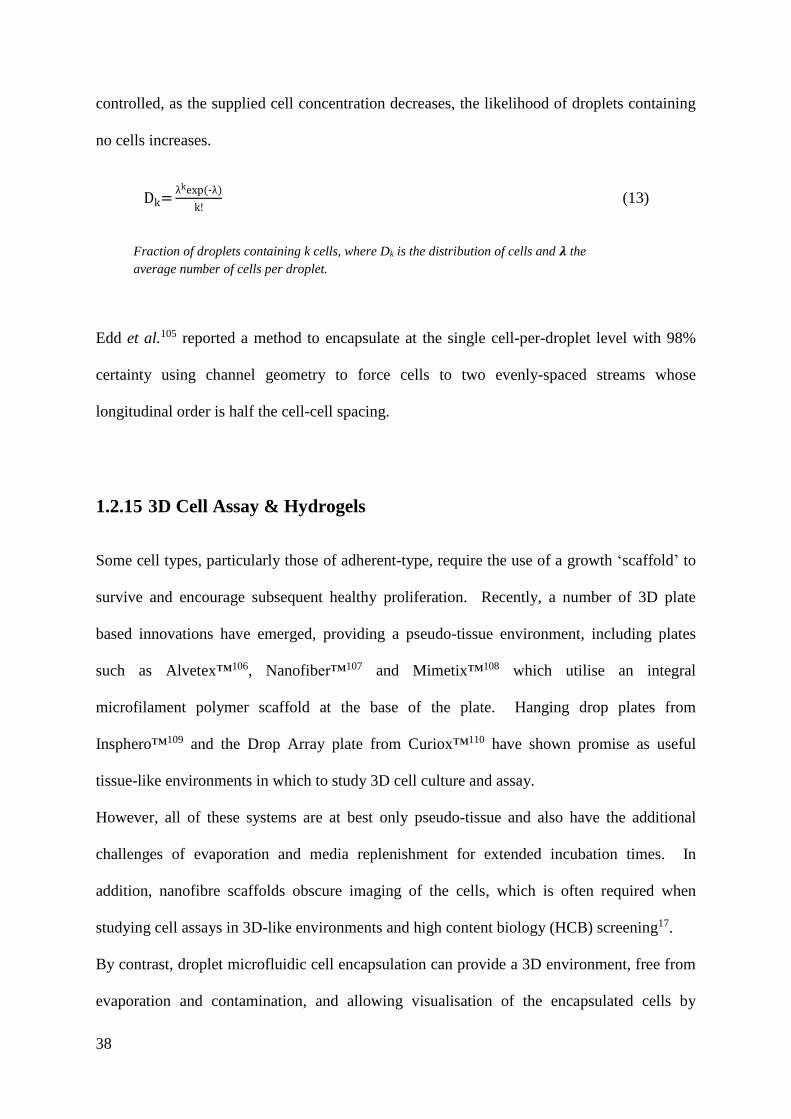
controlled, as the supplied cell concentration decreases, the likelihood of droplets containing
no cells increases.
Dk=λkexp(-λ)
k! (13)
Fraction of droplets containing k cells, where Dk is the distribution of cells and 𝝀 the
average number of cells per droplet.
Edd et al.105 reported a method to encapsulate at the single cell-per-droplet level with 98%
certainty using channel geometry to force cells to two evenly-spaced streams whose
longitudinal order is half the cell-cell spacing.
1.2.15 3D Cell Assay & Hydrogels
Some cell types, particularly those of adherent-type, require the use of a growth ‘scaffold’ to
survive and encourage subsequent healthy proliferation. Recently, a number of 3D plate
based innovations have emerged, providing a pseudo-tissue environment, including plates
such as Alvetex™106, Nanofiber™107 and Mimetix™108 which utilise an integral
microfilament polymer scaffold at the base of the plate. Hanging drop plates from
Insphero™109 and the Drop Array plate from Curiox™110 have shown promise as useful
tissue-like environments in which to study 3D cell culture and assay.
However, all of these systems are at best only pseudo-tissue and also have the additional
challenges of evaporation and media replenishment for extended incubation times. In
addition, nanofibre scaffolds obscure imaging of the cells, which is often required when
studying cell assays in 3D-like environments and high content biology (HCB) screening17.
By contrast, droplet microfluidic cell encapsulation can provide a 3D environment, free from
evaporation and contamination, and allowing visualisation of the encapsulated cells by

39
microscopy. In an approach reported by Workman et al.111,112, sodium alginate solution,
CaCO3 and the cell media were co-flowed with acetic acid and carrier oil in separate channels
to a shielded flow-focussing dropletiser to effect hydrogel formation upon release of Ca2+ on
mixing with the acid (Figure 10).
Figure 10. Representation of the shielded junction to generate alginate encapsulated cell droplets. The
sunflower oil in the red channel acts as a shield to prevent premature hydrogel formation which occurs once the
acidified oil contacts the CaCO3 in the media stream, releasing cross-linking Ca2+ ions.
In other work by Crowther et al.113, the target biology was encapsulated in agarose beads. A
temperature difference was used in the encapsulation chip to render liquid agarose (of
typically 1-2%) into semi-solid beads.
Sunflower oil
Sunflower oil +
acetic acid
Cells, sodium
alginate and CaCO3

40
1.3 Microfluidic Devices
1.3.1 Fabrication
Several substrate materials have been used for microfluidic device fabrication, including
glass114, silicon115, polymers116-120 and ceramics121. Silicon was one of the first materials to
be used, since photolithographic and wet etching techniques previously developed in the
electronics industry could be used to build channel features. Silicon is brittle, expensive and
optically opaque in the UV/VIS region, it is thus unsuitable for most of the spectroscopic
detection techniques used in biochemical applications. In the photolithographic / wet etching
process, the substrate is coated with a layer of metal, such as chromium (a few nanometers
thick) by vacuum deposition. A layer of photo-resist, which becomes soluble after exposure
to UV light, is spin-coated on top of the metal layer. A mask of the channel design is placed
over, the assembly exposed to UV, and the unmasked areas washed out and the metal
underneath etched away. The substrate surface is now protected except where features are
required, which can be made by etching with hydrogen fluoride/nitric acid (HF/HNO3)122 or
HF/ammonium fluoride (NH4F)123. The remaining metal and photo-resist can be etched off
and the chip bonded to another piece of substrate to form the final device.
Glass is a more common substrate material as it has good optical properties, is cheap, and has
well-characterised surface properties, although, like silicon, can be brittle. In addition, the
fragility may suggest glass is not appropriate for applications requiring very high density
surface features of small dimensions.
Polymers are commonly used for microfluidic devices, because of the low cost and the much
wider range of mechanical characteristics, surface chemistries and optical properties
available. Several methods have been exploited for fabricating polymer microchip devices,

41
including soft photolithography124,125, injection moulding126, laser ablation127 and milling
using direct computer numerical controlled machining (CNC)128.
Laser ablation techniques involve directing laser energy to the substrate material either via a
mask or by using X-Y control of the laser. The laser pulse length, light frequency and
properties of the material to be ablated determine the mass of material removed. In the case
of plastic laser ablation, the laser energy breaks the long-chain polymer bonds (over a
confined distance measured in micrometres), ejecting material from the surface to leave
features that can be smooth with little thermal damage, although only a limited number of
polymers are suitable. The technique is relatively slow, potentially limiting its usefulness for
producing large numbers of microchip devices.
Injection moulding is a rapid method for microchip production. In this process, a device is
made by melting polymer granules and injecting the resulting liquid polymer into a mould
under high pressure. Individual devices can be produced every 5-15 seconds, meaning the
technique is suitable for mass-production of consumable devices, as well as being attractive
to commercial applications requiring sterility (each device can be considered disposable)
and/or high throughput. The process is reliant on a suitable mould being made first by either
photolithographic or CNC techniques.
Table 5. Approximate scoring of microfluidic device construction methods.
Fabrication
method
Production Cost
(1 = cheap, 5 =
expensive)
Production Speed
(1 = slow, 5 = fast)
Feature Size
(1 = small, 5 = large)
Accuracy of Features
(1 = Low; 5 = High)
Photolithography 5 3 1 5
CNC 3 1 5 3
Laser ablation 4 2 4 4
PDMS moulding 2 4 2 1
Injection
moulding 1 5 3 2

42
In instances where reproducibility of many identical devices is required, positive moulds can
be CNC machined in a variety of metals, which can then be used to rapidly produce injection
moulded devices.
An alternative option is to mould devices directly from a curable material such as
polydimethylsiloxane (PDMS), although this approach may not be suitable for all
applications as organic oils can be absorbed by the PDMS causing it to swell and deform129.
PDMS is relatively cheap and has been used effectively in MF research130-132.
Several polymers are very well suited to rapid prototyping by CNC machining, such as
PMMA and polycarbonate (PC), thus removing many of the expensive and complicated
processes that are required for other substrate materials and techniques. Direct machining
often cannot produce features smaller than about 50 µm due to limitations in CNC machine
accuracy and available milling tool size, however, the relative simplicity and convenience of
the technique allows devices to be produced on a scale appropriate for proof-of-concept
microfluidic research. Production of high numbers of replicate devices remains a challenge
using this approach.
1.3.2 Sealing
To render them operable, the majority of chip devices require sealing after the features have
been formed. Sealing should not block the channels and ideally not alter the properties of the
device by exposing reagents in the channels to adhesive which may leach in and affect the
contents of the channels. Glass devices prove one of the harder materials to seal as a
consequence of the high bonding temperatures required133. Lower bonding temperatures
have been reported using sodium silicate134.

43
Self-adhesive labels have been used to some success for sealing devices119. This is cheap and
quick to effect, however is not suitable for very long channel devices as high back-pressure
often results in seal failure, and in some cases, the adhesive present on the seal directly above
the channel features can dissolve or detach into the fluids passing through, thus
contaminating reagents, or result in channel blockages. A related technique that achieves a
stronger seal is to use acetate sheet or fluorinated ethylene propylene (FEP) or film bonded to
the substrate with a UV-curable epoxy resin135. Although free of adhesive directly above the
channel, the seal can still fail at extreme back pressures. Care has to be exercised during
assembly to ensure resin does not overflow and block the channels.
Glass microscope slide cover slips have been investigated as part of this project for sealing
microfluidic devices. In this case, UV curable epoxy resin was applied as a thin layer to the
substrate surface via intermediate acetate sheets (to progressively thin the resulting layer of
adhesive transferred) before placing the slip and curing with UV light. Benefits of this
technique include optical transparency in the majority of the UV-VIS range and the absence
of adhesive over the channel features, however, mechanical differences between the polymer
substrate and glass seal were found to lead to the glass cover cracking and/or de-lamination.
In addition, the naturally hydrophilic surface of the glass can interact and disturb droplet
production and flow, thus pre-processing of the glass slips, such as fluoro-silanisation136 to
increase hydrophobicity may be advantageous.
Optically clear polyester microtitre plate seals, obtained from Corning Life Sciences, may be
used to seal polymer substrate devices. The low-tack adhesive is largely unaffected by a
range of fluids flowed through the microfluidic chip and appears to bond better over time to
PMMA substrates. Crucially, the sealed regions used for droplet detection remain clear and
transparent when exposed to the carrier fluids, and thus are suited to spectroscopic analysis.

44
1.3.3 Device Surface Functionalisation - Hydrophobicity
The surface of polymers can be treated for two purposes; i) to improve hydrophobicity and ii)
functionalisation to perform specific tasks, such as surface-activated droplet fusion.
The majority of common polymers, are hydrophobic, having contact angles with water of
approximately 65-80°. Fluorinated polymers, such as polytetrafluoroethylene (PTFE) do
have higher contact angles (up to 112°)242 but are too soft for CNC machining. High
concentrations of proteins and other materials having pronounced surface activity within the
dispersed phase can lead channel wall ‘wetting’ and hence disrupt or prevent droplet
formation resulting in bi-laminar flow of the dispersed and carrier phases through the
channel. Surface modification to increase the contact angle with polar materials can be
achieved through either applying a coating of water-repellent material via a solution (for
example, AquaPel™ or Certanol™; both fluoropolymers dissolved in a volatile organic
solvent that is allowed to evaporate, depositing a thin layer of the fluoropolymer to the
channel wall); or through chemical reaction of the surface to reduce surface molecular
polarity243. In the first instance, coatings tend to be temporary and can be washed off over
time, thus needing replacement.
Figure 11. Functionalisation of polycarbonate with dodecylamine to render a more hydrophobic surface.
Dodecylamine reacts at the carbonyl group, eliminating water and forming an amide.
Chemical reaction of the surface is permanent, but may only apply to a select number of
polymers that have suitable reactivity. For example, polycarbonate is particularly suited to
O
O
OOH O
O
O *m
δ+
O
O
NH
OH
n
EtOH, 60°C, ~ 4 hrs
O
O
O *OHk
+
NH2..
Polycarbonate
unit

45
chemical modification. Dodecylamine has been used successfully to yield greater surface
hydrophobicity137 (Figure 11).
1.3.4 Functionalisation of Polymer Chips
Modification of channel features can be applied to provide additional functionality, such as
droplet fusion regions. In this situation, a section of the channel is rendered more hydrophilic
(often through chemical reaction) such that droplets will enter the region and ‘stick’ allowing
carrier fluid to pass either side. When a subsequent droplet catches up, this will either
spontaneously merge with the immobilised droplet, or be coerced to merge using a disruptive
electric field. The increased physical size of the resultant droplet then provides sufficient
hydrodynamic resistance in the channel to be moved from the hydrophilic region138.
1.3.5 Fluid Connection
CNC machining of microfluidic features is a convenient method that allows rapid prototyping
of devices. Fluid connections to the chip can be addressed by two common methods. Un-
insulated bootlace ferrules (RS components, 211-4252) can be push-fitted into through-
drilled holes on the reverse side of the chip. This provides a simple means for connecting
narrow bore tubing, through which the required reagents can be flowed to supply the
microfluidic chip. In certain cases, there may be a need for greater mechanical connection
stability, such as when encountering higher back pressures. In these instances, the holes can
be tapped, and screw-in fluidic terminals can be inserted, such as those made by The Lee
Company (Figure 12).

46
Figure 12. Fluidic connection methods for microfluidic devices; screw-in Luer-lock fitting (left) and push-fit
bootlace ferrule (right).
Either of the connection methods described here tend to be compatible with fluid connections
typical found on a variety of instrumentation often found within scientific industry, such as
High Pressure Liquid Chromatography (HPLC), autosamplers and other liquid handling
workstations7,34,76,139.
1.3.6 Fluid Propulsion - Hydraulic Pressure
One of the easiest methods to move liquids within micro-channels is by applying pressure.
The necessary pressure can be achieved by elevating the reagents fed to the chip and relying
on potential energy to force fluids (‘gravity fed’). Whilst this approach is excellent with
respect to generating completely smooth (pulse free) reagent delivery, the pressure required
to overcome the higher hydrodynamic resistance in more complicated and/or longer micro-
channels can result in very high and impractical physical placement of the reagent vessels
relative to the microfluidic chip. Moreover, gravity flow systems can be difficult to set up
accurately, especially in the cases where the pressures for correct microfluidic device
function require careful, specific adjustment of relative flow rates. Additionally, multi-source
flows may suffer from hydrodynamic coupling244 making individual fluid flow rate
adjustment difficult.
Fluid flow is well characterised principally by the Navier–Stokes equations describing fluid
motion140-142. For incompressible fluids (liquids), the volumetric flow rate, Q (m3 s−1) is

47
proportional to the pressure drop, ΔP (N m−2) and fluidic resistance R (m5 N–1 s−1) as
described by the Hagen–Poiseuille law143, equation 14:
RPQ .
(14)
Fluidic resistance (R) is dependent on the channel geometry and fluid viscosity, which for a
channel approximating a capillary can be described by Equation (15):
tL
dR
128
4
(15)
Where d is the capillary inner diameter (m), is the viscosity of the fluid (N s−1 m−2)
and Lt is the total length of the capillary (m).
From these equations, it can be deduced that as channel dimension decreases, the pressure
required for a given flow rate increases, and as the channel length increases.
The Hagen-Poiseuille law applies to fluid flow through channels that exhibit laminar flow,
i.e. where there is no turbulent flow.
This is characterised by the Reynolds number (Re)144, equation 16:
uLRe
(16)
Where is the fluid density (g m3), is the viscosity (N s−1 m−2), u is the average
linear velocity (m s−1) and L is the characteristic channel length (m). This length is
the dimension that best describes the channel section in which the fluid flows. For
the majority of microfluidic devices, this is thus most likely to be the channel width
or height. Values of Re < 2000 are generally considered to exhibit laminar flow
whilst Re > 2000 exhibit turbulent flow.
The required pressure to flow liquids is more often achieved using pumps, either of the
syringe or peristaltic type connected to the device, although there are reported instances
where centrifugal force can be utilised to promote flow, such as in the experimental Lab-

48
CD™ system researched by Tecan139 and Gyros145 or the programmable microfluidic assay
system using ‘Virtual Laser Valves’, such as that developed by SpinX146.
A small number of devices have been reported to work successfully using negative pressure
regimes to pull fluids through the chip147. A benefit of this approach is the ease by which
materials can be drawn into the chip, potentially simplifying connection to microtitre plates
and other fluid sources as the system input works at atmospheric pressure. However, such
systems will be limited to a pressure differential of 1 atmosphere and may be prone to
instability from the release of dissolved gases in the fluids within the device when under a
negative pressure regime.
1.3.7 Fluid Propulsion - Electro-Osmotic Flow (EOF)
Fluids can be driven through micro-channels using electro-osmotic flow (EOF)148. EOF is
the volume flow of fluid containing charged species in a narrow bore capillary or channel that
has suitably charged walls. For example, in the case of a fused silica capillary containing a
buffer liquid, the cations from the buffer are attracted towards the negatively charged silanol
(Si-OH) groups on the inside walls of the capillary (Figure 13). For EOF to be wholly
effective in glass, the pH is ideally adjusted to around pH 9 to ensure all silanol groups are
ionised. This results in an immobilised layer of cations adjacent to the surface. However, the
negative silanol charge is not balanced, so a second layer of cations, less strongly bound,
adhere to the first layer.

49
Figure 13. Electro-osmotic flow in a fused silica capillary. Flow is induced in the liquid (indicated above the
shear plane line) when a tangential electric field is applied, by the polarisation of buffer relative to the cationic
‘wall’ resulting from the attraction of ions to the negatively charged silanol groups of the capillary.
The application of a tangential electric field results in the second layer cations being attracted
to the cathode, which in turn, promotes the flow of liquid with the cations (Figure 13)149.
With the requirements of specific pH for efficient EOF, this method of fluid propulsion may
not be compatible with assay systems required to run at physiological pH and will also not
work for non-ionisable, neutral compounds.
The shear plane referenced in Figure 13 represents the ionic imbalance and is termed the zeta
potential. This potential, , is given by equation 17.
e4
(17)
Where is the mobile layer thickness, e is the charge per unit surface area and is the
dielectric constant of the fluid (buffer).
The electro osmotic flow velocity can be calculated by equation 18.
EE
V EOFEOF
4 (18)
Where is the dielectric constant of the fluid (buffer), is the zeta potential, E is the applied electric field, is
the viscosity of the buffer and EOF is the electro osmotic mobility.
SiO-SiO-SiO-SiO-SiO-SiO-
SiO-
Shear plane
Neutral buf fer
Mobile layer
(net positive
charge)
Fixed layer
(net negative
charge)Capillary Wall
++
+
+ + ++
++
+
+
+ -Flow
++
+
++
+

50
1.3.8 Fluid Propulsion - Centrifugal Force
Generally applied more to the field of continuous or single phase microfluidics, fluids can be
moved through channel features using centrifugal forces. As previously discussed, a number
of commercial devices have been reported that utilise a spinning disc, or ‘lab CD’ format
whereby chambers on the ‘disc’ are filled with reagent and the disc spun to entrain liquids
through the chambers to various incubation and detection zones via a variety of valves and
capillary channels.
Capillary valves are often used to ensure fluids to do not spontaneously flow along the
channels prematurely due to capillary forces; thus making highly complex and multi-stage
processes possible whereby higher rotation speeds, hence higher centrifugal forces, can be
used to breach capillary valves designed with higher burst pressures150. Other valve
arrangements have been employed that utilise the change in level of fluids due to centrifugal
force to trigger capillary flow, thus making siphon valves possible that continue to drain fluid
from one compartment to another even as the speed of rotation is reduced. This format has
been reported to work successfully for a variety of blood-plasma151 and cell separation
processes152.
1.4 Detection and Analytical Techniques
A majority of assay analysis conducted in early to middle phase drug screening often uses
spectrophotometric techniques such as absorbance, fluorescence and luminescence for ease of
analysis and increased throughput16. In certain cases, it is necessary to employ more
advanced methods, such as fluorescent polarisation (FP)153, Förster resonance energy transfer
(FRET)154 or homogeneous time resolved fluorescence (HTRF)155 to enrich the detection
technique with a mode allowing for kinetic and spatial dependence of the analytes within the
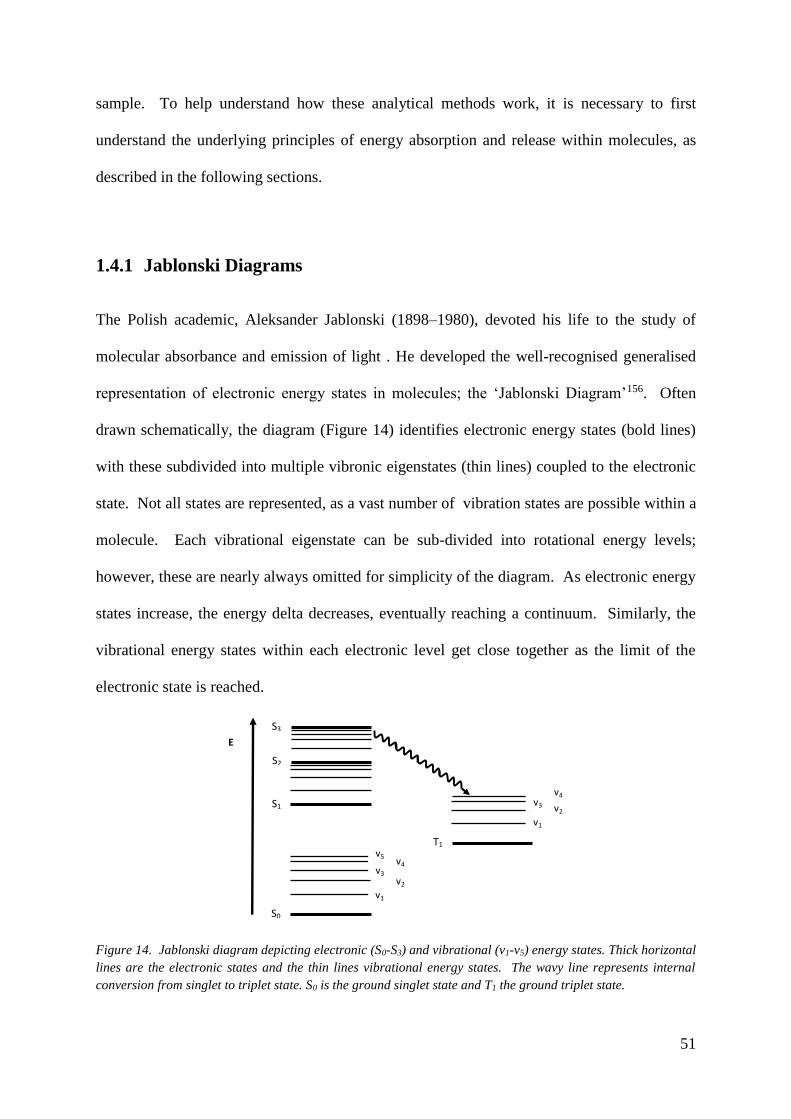
51
sample. To help understand how these analytical methods work, it is necessary to first
understand the underlying principles of energy absorption and release within molecules, as
described in the following sections.
1.4.1 Jablonski Diagrams
The Polish academic, Aleksander Jablonski (1898–1980), devoted his life to the study of
molecular absorbance and emission of light . He developed the well-recognised generalised
representation of electronic energy states in molecules; the ‘Jablonski Diagram’156. Often
drawn schematically, the diagram (Figure 14) identifies electronic energy states (bold lines)
with these subdivided into multiple vibronic eigenstates (thin lines) coupled to the electronic
state. Not all states are represented, as a vast number of vibration states are possible within a
molecule. Each vibrational eigenstate can be sub-divided into rotational energy levels;
however, these are nearly always omitted for simplicity of the diagram. As electronic energy
states increase, the energy delta decreases, eventually reaching a continuum. Similarly, the
vibrational energy states within each electronic level get close together as the limit of the
electronic state is reached.
Figure 14. Jablonski diagram depicting electronic (S0-S3) and vibrational (v1-v5) energy states. Thick horizontal
lines are the electronic states and the thin lines vibrational energy states. The wavy line represents internal
conversion from singlet to triplet state. S0 is the ground singlet state and T1 the ground triplet state.
E
T1
S3
S2
S1
S0
E
v4
v1
v2v3
v4
v1
v2
v5
v3

52
In the diagram, straight arrows represent conversion between a photon of light and the energy
of an electron, whereas wavy lines show energy transitions of electrons without emission of
light.
1.4.2 Absorbance
The simplest representation in the Jablonski diagram, indicated by the blue arrows in Figure
15, is the absorbance of a photon of a particular energy (wavelength) by the molecule. An
electron is excited from a lower to higher energy state, where the energy of the photon is
transferred to the electron. This process is very fast, occurring in the region of 10–15 seconds.
Usually, the transition will occur from the ground electronic state, where according to the
Boltzmann distribution there is the greatest number of electrons occupying the lowest lying
state at normal temperatures. Absorption transitions can occur between electronic states and
between vibration states.
Figure 15. Jablonski diagram depicting absorbance (blue arrows) between different electronic eigenstates.
E
T1
S3
S2
S1
S0
E
v4
v1
v2v3
v4
v1
v2
v5
v3

53
1.4.3 Vibrational Relaxation and Internal Conversion
After excitation, there are a number of routes by which the energy will be dissipated. The
first is via vibrational relaxation, a non-radiative process where electrons drop to lower
vibronic eigenstates (Figure 16). The energy is lost either through transfer to other molecules
or within the same molecule as kinetic energy and can occur very quickly after absorbance.
As this is a vibrational energy loss, electrons do not generally change electronic state at this
point, unless there is an overlap between electronic and vibrational energy levels. In this
instance, transition from a vibration level in one electronic state to another vibration level in a
lower electronic state is referred to as internal conversion. The large energy gap between the
ground electronic state and the first excited state, translates to internal conversion being
relatively slow. This condition allows other transitive processes to dominate, such as
fluorescence or phosphorescence.
Figure 16. Jablonski diagram depicting absorbance (blue arrow), internal conversion (red arrow) and
vibrational relaxation (green arrow).
E
T1
S3
S2
S1
S0
E
v4
v1
v2v3
v4
v1
v2
v5
v3

54
1.4.4 Fluorescence
Another route by which molecules can lose absorbed energy is fluorescence, which releases a
photon. This is represented by a straight arrow (Figure 17) between electronic energy states.
As fluorescence is relatively slow (in the order of 10–9 to 10–7 seconds), it is unlikely that
electrons will dissipate energy in this manner from states higher than the first excited state.
The energy of the photon emitted in fluorescence is the same energy difference as that
between the eigenstates of the transition; however, the energy of the emitted photon is always
less than that of the exciting photon as a consequence of internal conversion and vibrational
relaxation. Due the number of vibrational levels that may be involved with the transition
between electronic states, the emitted photon energy is usually distributed over a range of
wavelengths.
Figure 17. Jablonski diagram depicting absorbance (blue arrow), internal conversion (red arrow) and
fluorescence (purple arrow).
E
T1
S3
S2
S1
S0
E
v4
v1
v2v3
v4
v1
v2
v5
v3

55
1.4.5 Intersystem Crossing (IS)
A further route a molecule may dissipate absorbed energy by is intersystem crossing. In this
process, the electron changes spin multiplicity from an exited singlet state to an excited triplet
state. On the Jablonski diagram (Figure 18), this is referenced by a wavy arrow crossing
between columns representing different electron spin multiplicities.
Figure 18. Jablonski diagram depicting absorbance (blue arrow), internal conversion (brown arrow) and
phosphorescence (yellow arrow).
This process is the slowest of all, being several orders of magnitude slower than fluorescence.
Although a forbidden transition, based strictly on electronic selection rules, by vibrational
coupling, the transition becomes weakly allowable and able to compete with the time scale of
fluorescence. IS results in a number of routes back to ground state including
phosphorescence, a radiative process where transition from excited triplet state to a singlet
ground state occurs, and delayed fluorescence, where decay back to the first excited singlet
level occurs followed by emissive transition back to ground state.
E
T1
S3
S2
S1
S0
E
v4
v1
v2v3
v4
v1
v2
v5
v3
56
1.4.6 Absorbance Detection and Microfluidics
Measurements of this type are easier to implement in continuous phase MF due to the relative
ease by which the sample can be presented within a channel to a fibre-optic guided
spectrophotometer157. In droplet MF, absorbance measurements can be considerably harder
due to the challenge of presenting a uniform sample path to the spectrophotometer; the
curvature of the droplet and its position within the channel can impact on the light path by
undesired refraction and reflection at the droplet-oil interface. One way to reduce this
artefact is by constricting the droplet within a channel narrower than the droplet diameter
such that the top and bottom of the droplet are perpendicular to the light path. However, due
the small size of the droplets in MF, absorbance may not prove sensitive enough for low
analyte concentrations and materials having a weakly absorbing chromophore.
1.4.7 Fluorescence Detection and Microfluidics
Generally, fluorescence is a more sensitive technique than absorbance as the background and
interference is often lower and is thus particularly suited to droplet MF, especially for
analytes having fluorophores with high quantum yields where the emissive light intensity is
high245. In addition, there are a number of applied fluorescence analysis techniques including
fluorescent polarisation246 (Figure 19a, b), where polarisation of the excitation and emission
light can be used to determine molecule rotation during the acquisition time and thus
ascertain whether a binding event may have occurred for example, and fluorescence
resonance energy transfer (Figure 19c) where physical close proximity of reagents having
different overlapping excitation-emission spectra fluorophores can signify other reaction or
binding events.

57
1.4.8 Luminescence Measurement and Microfluidics
Certain chemical or biochemical reactions can result in excited molecular states that then
decay to ground by emitting light known as chemi- or bio- luminescence158.
Where it is feasible, this technique is particularly suitable for microchannel techniques since
if offers very high sensitivity, largely due to lower background noise and separation of the
excitation-emission spectra. In addition, unlike conventional fluorescence techniques,
luminescence is not subject to background emission from other materials within the system
(unless there are materials present that are excited by the emissive luminescent light resulting
in background fluorescence). Conventionally, a luminescent substrate is added post-reaction
which then develops a light output that can be quantified to determine the progression of
reaction. Luminescence is an attractive option for screening processes as only one
wavelength of light is quantified for all assays of the same type. In the context of MF, the
detector setup can be very simple using PMT or CCD modules with ADC to convert the light
output to an analogue signal159.

58
Figure 19. (a) Fluorescent polarisation (FP) diagram. Fast molecular rotation during the acquisition time,
gives rise to roughly equal vertical and horizontal polarised emission. (b) In comparison, since the molecule has
bound to a large entity, fast rotation is not possible and as such, a bias towards vertical or horizontal
polarisation is observed. (c) Fluorescence Resonance Energy Transfer (FRET) spectroscopy. This mode of
fluorescence is dependent upon the emission spectra of one fluorophore overlapping the excitation spectra of a
second fluorophore. The effect requires close proximity of the fluorophores and thus can be used to measure
movement, spatial orientation or binding of molecules.
(a)
Monochromatic light
Vertical polariser
Vertically polarised light
Molecules with free rotation
Fast rotation
emission light
Vertical and horizontal emission
( b )
emission light Vertical and horizontal polarisers
Vertical emission
Monochromatic light
Vertical polariser
Vertically polarised light
Molecules with l i m i t e d r o t a t i o n
N o f a s t rotation
(c)
Horizontal and vertical polarisers

59
1.4.9 Mass Spectrometry and Microfluidics
In recent years, mass spectrometry (MS) has made significant steps forward with the
development of nano-electrospray sources160 allowing quantification of analytes from lower
source volumes and input flow rates. This reduction has enabled microfluidic integration to
MS161-163. One of the major challenges in droplet microfluidics in respect of MS detection is
removal of the carrier oil phase prior to introduction to the MS source. In recent years, a
number of research groups have demonstrated dielectrophoretic (DEP) methods of droplet
extraction from the carrier phase; in one case where droplets are ejected directly from a
channel via a 'spyhole' into a mass spectrometer sample cone using a high voltage electrode
adjacent to the channel164 and another example where the droplets are moved using DEP into
an analyte counter-stream and then injected into an electrospray ionisation mass spectrometer
source165. Despite gains in mass spectrometer sensitivity and efficiency of coupling droplets
to mass spectrometers, there remains a challenge to yield MS detection that is wholly
equivalent in sensitivity and reproducibility to spectrophotometry techniques.
1.4.10 Other Detection Methods and Microfluidics
Additional detection techniques that are commonly employed in microfluidics include
amperometry, potentiometry and conductivity. Amperometry is a sensitive technique which
involves measuring a current generated when an analyte produces electrons in a redox
reaction. A limitation of this approach is the requirement for electrodes to be directly in
contact with the reagents which can result in fouling and subsequent contamination. In the
case of potentiometry, the potential difference (voltage) is measured ideally keeping the
current across the system to zero166.

60
1.4.11 Advantages and Disadvantages of Analytical Techniques
Most, if not all, spectrophotometric techniques have been successfully incorporated into
microtitre plate based assays167-169. As the availability of cheaper, smaller and more sensitive
detector electronics have become available, it has been possible to reduce analyte sample
volumes, in parallel with the miniaturisation of assays, to speed up data acquisition. The
relative simplicity of most photometric methods results in it being possible to collect data
rapidly. Coupling to this the relative simplicity of assays used in early phase drug screening
where an ‘add-mix-read’ approach is common17, it is usual to find utilisation of
spectrophotometric outputs to make tests easier to perform17.
A possible limitation of spectrophotometric analysis is the requirement to measure a probe or
label which has to be incorporated into the biochemical or cell reaction if there is no native
measurement at the required wavelength(s). In certain cases, this may be detrimental to the
biology of the system concerned (interference with reaction) and may have implications to
the range of signal, sensitivity or discrimination available170. For example, when screening
for cytochrome P450 enzyme inhibition, the assay can be quantified either by MS or
spectrophotometry (see section ‘P450 Cytochrome Inhibition’). Mass spectrometry is much
slower and does not yield the same throughput of spectrophotometry, however does have the
potential to provide a more pharmacologically relevant data set by using materials that are
more ‘drug-like’.
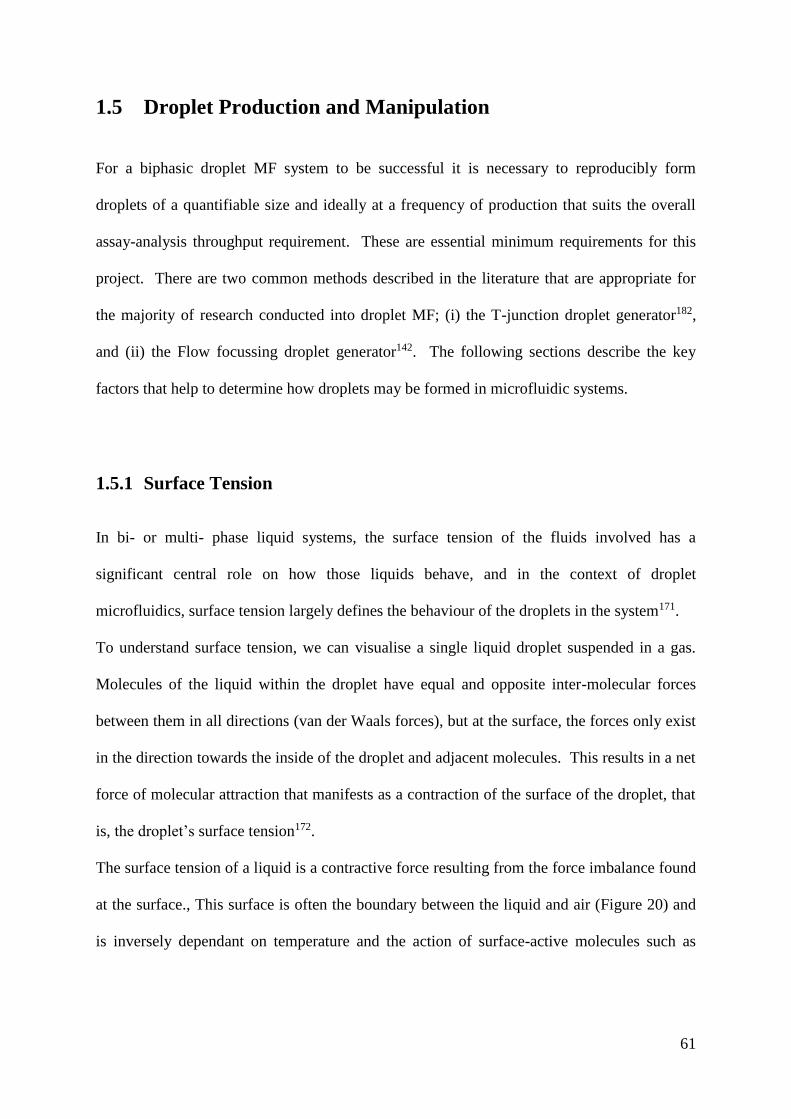
61
1.5 Droplet Production and Manipulation
For a biphasic droplet MF system to be successful it is necessary to reproducibly form
droplets of a quantifiable size and ideally at a frequency of production that suits the overall
assay-analysis throughput requirement. These are essential minimum requirements for this
project. There are two common methods described in the literature that are appropriate for
the majority of research conducted into droplet MF; (i) the T-junction droplet generator182,
and (ii) the Flow focussing droplet generator142. The following sections describe the key
factors that help to determine how droplets may be formed in microfluidic systems.
1.5.1 Surface Tension
In bi- or multi- phase liquid systems, the surface tension of the fluids involved has a
significant central role on how those liquids behave, and in the context of droplet
microfluidics, surface tension largely defines the behaviour of the droplets in the system171.
To understand surface tension, we can visualise a single liquid droplet suspended in a gas.
Molecules of the liquid within the droplet have equal and opposite inter-molecular forces
between them in all directions (van der Waals forces), but at the surface, the forces only exist
in the direction towards the inside of the droplet and adjacent molecules. This results in a net
force of molecular attraction that manifests as a contraction of the surface of the droplet, that
is, the droplet’s surface tension172.
The surface tension of a liquid is a contractive force resulting from the force imbalance found
at the surface., This surface is often the boundary between the liquid and air (Figure 20) and
is inversely dependant on temperature and the action of surface-active molecules such as

62
surfactants. Dimensionally, surface tension, σ, is force per unit length, corresponding to Nm−1
or sometime by the unit dyne/cm (where 1 dyne/cm = 0.001 Nm−1).
Figure 20. Schematic representation of the molecular Van der Waals forces giving rise to the phenomenon of
surface tension. Molecules near the surface of the liquid experience an imbalance of net force such that
interactions are greater in the plane of the fluid surface. Surfactants can interact to reduce intra-molecular
attraction.
The stronger the inter-molecular bonding within the liquid, the greater the surface tension, as
there is an increase in the force per unit area at the liquid surface. Surfactants (surface active
reagents) are amphiphilic molecules, that is, having both hydrophilic and hydrophobic
ligands. This property enables surfactants to be adsorbed to the surface orienting according
to the polarity of the liquid concerned.
In the context of two immiscible liquids, such as water and oil, the interface between the
liquids is the zone where surfactants will diffuse to, forming a localised surfactant molecule
concentration. In doing so, the surface tension of the fluids is reduced. Antonov’s rule173
states the interfacial surface tension of two immiscible liquids can be found by equation 19:
γ = |σ1 – σ2| (19)
Antonov’s rule for interfacial surface tension. Where γ is the resulting interfacial tension,
σ1 and σ2 the surface tension of the two liquids in respect of the liquid–air boundary.
WATER
AIR

63
For biphasic MF, the action of reducing the surface energy of fluids is an important factor in
droplet formation. The majority of dispersed phases in biochemical microfluidics
applications are aqueous, thus this phase will tend to exhibit a relatively large surface tension.
If the carrier oil being used has a very low surface tension, it is quite possible (subject to
other factors, such as flow rates and channel geometry) that forming droplet emulsions
becomes impossible, or at least difficult, with the resulting emulsions not being very stable
due to the aqueous phase not breaking-up readily62.
The addition of surfactant to the liquids will reduce the interfacial surface tension sufficiently
so that droplets can form174. Furthermore, the surfactant will migrate to the droplet surface
stabilising each droplet from auto-coalescence as the hydrophobic surfactant tails will tend to
prevent droplets from becoming close enough to fuse.
In the context of biological or biochemical assay, it is important that surface chemistry and
protein adsorption at the liquid-liquid interface is carefully controlled. Surfactant selection is
an important criterion in this respect and, as reported by Holt et al., surfactants having
different polarity head groups, can significantly affect the adsorption of biological materials
to the droplet interface175. Measuring surface tension by drop tensiometry showed that
surfactants containing carboxylic acid and alcohol head groups gave an enhanced adsorption
of fibrinogen to the droplet interface compared to a surfactant containing a non-ionic
oligoethylene glycol functional group176. Furthermore, it has been previously reported by
Holtze et al.177 that short-chain perfluorinated surfactants containing polar head groups, such
as perfluorooctanol, do not provide sufficient long-term emulsion stability. Droplet formation
and the interaction of reagents at the droplet interface is explored in the context of this project
in later chapters.

64
1.5.2 Surfactants in Droplet Microfluidic Systems
The critical micelle concentration (CMC) of a surfactant relates to the concentration where
the surface tension is measured to significantly inflect. As the number of surfactant
molecules reaches a critical concentration, no more can be adsorbed to an interface and thus
the pronounced formation of micelles whereby surfactant molecules form colloidal clusters
containing a hydrophilic or hydrophobic centre, are formed.
There are a number of methods for determining the CMC of a surfactant; all of which rely
upon measuring the change in a characteristic of the fluid in which the surfactant is tested.
Fluorimetry247, absorbance248 and conductivity249 can be used, although measurements of
surface tension via hanging drop tensiometry or capillary rise are more often encountered110.
The challenges associated with measuring the CMC of the custom fluorosurfactant are three-
fold; firstly, the fluorosurfactant is designed to be soluble in the fluorous phase and only very
sparingly in the aqueous environment; secondly, because the surface tension of the fluorous
phase is already very low (~0.018 Nm−1 cf. water at 0.072 Nm−1) adding surfactant only
serves to further reduce this surface tension making measurements by capillary rise very
difficult as frictional forces may tend to dominate capillary forces. Conductivity
measurements may be difficult or impossible when using non-ionic fluorous oils as the
carrier phase.
An alternative means of determining the CMC is to measure the back scatter of light caused
by micelle formation. Dynamic Light Scattering (DLS) is a technique often used for particle
sizing in the sub-micron range by relying on time-dependant fluctuations in the intensity of
scattered light from a suspension of particles undergoing random Brownian motion178. From
analysis of the intensity fluctuations, the diffusion constant and the particle size can be
calculated using the Stokes–Einstein Equation (Equation (20)).
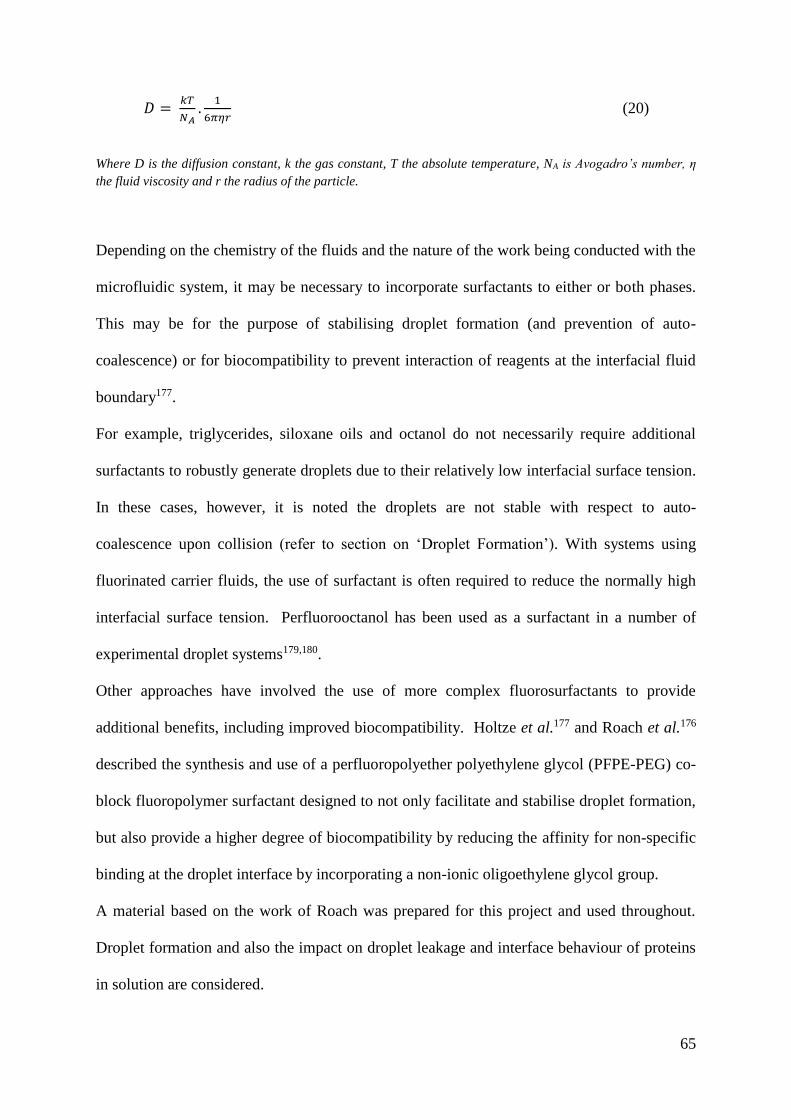
65
𝐷 = 𝑘𝑇
𝑁𝐴.
1
6𝜋𝜂𝑟 (20)
Where D is the diffusion constant, k the gas constant, T the absolute temperature, NA is Avogadro’s number, η
the fluid viscosity and r the radius of the particle.
Depending on the chemistry of the fluids and the nature of the work being conducted with the
microfluidic system, it may be necessary to incorporate surfactants to either or both phases.
This may be for the purpose of stabilising droplet formation (and prevention of auto-
coalescence) or for biocompatibility to prevent interaction of reagents at the interfacial fluid
boundary177.
For example, triglycerides, siloxane oils and octanol do not necessarily require additional
surfactants to robustly generate droplets due to their relatively low interfacial surface tension.
In these cases, however, it is noted the droplets are not stable with respect to auto-
coalescence upon collision (refer to section on ‘Droplet Formation’). With systems using
fluorinated carrier fluids, the use of surfactant is often required to reduce the normally high
interfacial surface tension. Perfluorooctanol has been used as a surfactant in a number of
experimental droplet systems179,180.
Other approaches have involved the use of more complex fluorosurfactants to provide
additional benefits, including improved biocompatibility. Holtze et al.177 and Roach et al.176
described the synthesis and use of a perfluoropolyether polyethylene glycol (PFPE-PEG) co-
block fluoropolymer surfactant designed to not only facilitate and stabilise droplet formation,
but also provide a higher degree of biocompatibility by reducing the affinity for non-specific
binding at the droplet interface by incorporating a non-ionic oligoethylene glycol group.
A material based on the work of Roach was prepared for this project and used throughout.
Droplet formation and also the impact on droplet leakage and interface behaviour of proteins
in solution are considered.

66
1.5.3 Reynolds and Capillary Numbers
In fluid dynamics, one of the most widely used dimensionless values is the Reynolds number
(Re) which compares inertial and viscous forces within a fluid. The size of the fluid system
largely dictates the nature of the forces and whether fluid flow is turbulent or laminar,
described by equation 21.
𝑅𝑒 = 𝜌𝑢𝐿
𝜂 (21)
Where ρ is the fluid density, u the velocity of flow, the characteristic length of the
system and η the dynamic viscosity of the liquid.
The capillary number is a dimensionless value that compares the surface tension forces to the
viscous forces acting across a liquid interface which is a significant factor in microfluidic,
low Reynolds number, situations. Briefly, the capillary number, Ca is defined by Equation
(22).
𝐶𝑎 = 𝜂𝑢
𝜎 (22)
Where 𝐶𝑎 is the capillary number, and 𝜎 the interfacial surface tension between
the fluids.
1.5.4 Droplet Detachment: Squeezing, Dripping and Jetting
Garstecki et al.181, Menech182 and Fu142 have described different modes of droplet formation:
squeezing, dripping and jetting and how flow in microfluidics systems may transition
between these regimes. In the first instance, the squeezing regime relies upon complete or
partial blockage of the channel by the dispersed phase, leading to a build of viscous forces
that eventually overcome surface tension forces and break off a droplet of the dispersed
phase, often slightly down stream of the channel junction (Figure 21a).

67
Figure 21. (a) droplet formation via the ‘squeezing’ regime where the dispersed phase partially blocks the oil
channel; (b) droplet formation via the ‘dripping’ regime and (c) droplet formation via the ‘jetting’ regime,
normally found in higher flow rate flow-focussing devices.
Capillary numbers (Ca) are usually very low in this mode. As the Ca number increases, it is
possible for the dripping regime to manifest; this relies upon a combination of build-up
pressure and shear stress to promote droplets into the carrier phase (Figure 21b). With the
jetting regime, not encountered as often in microfluidics, the capillary number and/or flow
rate is very high and is more usually associated with co-focussed flows (Figure 21c).
1.5.5 T-Junction and Flow Focussing Droplet Generation
The T-junction is the most frequently encountered arrangement used to produce fluid
segments (plugs) and droplets. Aside from requiring the right conditions for squeezing or
dripping droplet formation142,183, the contact angle of reagents (wetting properties) are also
highly important to ensure dispersed phases do not wet the channel wall, which otherwise
results in a co-flow of fluids that do not result in droplet break-off (Figure 22)184185.
(a) (b)
(c)
Direction of flow
Direction of flow
Direction of flow

68
Figure 22. Incorrect surface tension, viscosity and/or flow rate/geometry combinations can result in laminar
flow of immiscible fluids without dispersion in to droplets. Aqueous phase ‘wetting out’ of the chip material can
also lead to this condition184.
Figure 23. Typical flow focussing droplet generator. Flow rates tend to be higher than for the T-junction and
typically operate in the dripping to jetting regimes15.
Flow focussing devices (Figure 23) behave similarly to the T-junction and have three distinct
modes of operation: (i) droplets are formed immediately at the junction; (ii) droplets form
downstream after a period of laminar flow (Figure 21c) and (iii) a thread of laminar flow is
formed that does not break up into droplets. The capillary number and flow rate ratios are
important predictors of the flow regime that will prevail in any one system.
1.5.6 Oils for Carrier Phase Fluid
For droplet MF systems, the choice of carrier phase oil is important with respect to droplet
formation, in terms of interfacial surface tension between the dispersed and carrier phases. In
addition, the viscosity of the carrier oil is an important selection criterion. Oils having a high
viscosity will exhibit much higher back pressures, requiring higher pressure differentials to
Dispersed phase,
e.g. aqueous
reagents.
Carrier phase, e.g. oil.
Direction of flow
Direction of flow

69
obtain fluid flow and consequently be at higher risk of seal rupture and other pressure-related
failure. More importantly than this, it is imperative the carrier phase oil is chemically stable,
inert and non-miscible with the mainly aqueous dispersed droplet phase. In addition, the
carrier oil should not be a good solvent for the materials present in the droplets. Failure to
observe this would result in significant partitioning of materials between the droplet and
carrier phase, resulting in uncertainty of quantification.
Table 6. Carrier phase oils reported in droplet microfluidic systems.
Oil References Chemical Description
HFE7500 93 Fluorinated alkane
FC-40 186 Fluorinated tertiary amine
FC-70 187 Fluorinated tertiary amine
FC-77 188 Cyclic fluorocarbon (contains
oxygen heteroatom)
FC-3283 188 Fluorinated tertiary amine
Perfluorodecalin 189 Cyclic fluorocarbon
White Mineral oil 128 Long-chain alkane blend
Vegetable oil 190,190 Complex triglycerides
In certain applications, such as LogP (partition co-efficient) or logD experiments where the
distribution co-efficient D is calculated by determining the ratio of a molecule in aqueous and
organic phases, partitioning in microfluidic systems can be used to an advantage. The lower
compound volumes and a greater throughput offered is desirable over traditional large-
volume, low-throughput shake-flask methods250.
In the majority of droplet microfluidic systems reported, fluorinated oils are used as the
carrier phase due to being largely un-reactive, able to transfer gases to cells in encapsulation
systems and poor solvents for many molecules103,191,192. However, there are examples where

70
triglycerides such as vegetable oil or mineral oil are used119,128,193. Typical oils are
summarised in Table 6.
1.5.7 Droplet Sorting - Hydrodynamic Sorting
In the simplest case, droplets can be sorted passively based upon their size. By designing
bifurcating channel geometries with differing widths, droplets within a size range can be
entrained preferentially into a specific channel dependant on the shear force and flow
resistance. This is known as the Zweifach-Fung effect, and has been described by Yang et
al.151 to achieve separation of blood cells and plasma where the pinched flow fractionation
acts differently on blood cells forcing them into a new streamline. In a recent review, Biral et
al.194 investigated how purely hydrodynamic functionality could be employed within
microfluidic systems to achieve precise control and direction of droplets.
1.5.8 Droplet Sorting - Dielectrophoretic Sorting
Inclusion of embedded isolated electrodes within microfluidic devices provides a means of
creating non-uniform electric fields across droplet and suspended particle/cell flows. By
changing the field strength, differing vector forces can be applied to droplets directing them
to different regions of a chip or different channels, even if the hydrodynamic resistance of the
channels is higher as demonstrated by Ahn et al.195. In a similar way, a surface charge can
be imparted onto droplets flowing past an electrode. In this way, droplets can be attracted or
repelled from opposite or same charge respectively, allowing sorting of droplets or particles
into other channels196. Dielectrophoresis has been used for the separation of cells197.

71
1.5.9 Droplet Sorting - Magnetic Sorting
Nanoparticles with superparamagnetic magnetite cores have been used successfully to sort
droplets into different channels by the targeted application of perpendicular electromagnetic
fields. The use of such small magnetic particles avoids magnetic ‘memory’ effects and
reduces the possibility of particle aggregation198. Such approaches have been applied to
DNA purification199, separation of distinct droplet populations198,200 and as a tool to enable
the investigation of drug-protein interactions201.
1.5.10 Droplet Sorting - Optical Sorting (Laser Tweezers)
Focussed laser light can be used to generate localised thermocapillary currents within a
channel geometry, such that droplets can be entrained to follow particular routes174.
However, the relatively high power density of focussed laser light, suggests the technique
may not be suitable for materials within droplets that are thermally liable, or liable to
photolysis.

72
1.5.11 Droplet Sorting - Electrowetting-On-Dielectric (EWOD)
The key principle behind this technique is that the apparent surface tension of an electrically
conducting liquid in contact with a solid is altered by an applied electric field. This
relationship was first derived by Lippmann, and it has since been shown by Berge that the
Lippmann relationship results in a change of contact angle with the applied voltage202. This is
described by the Berge-Lippmann-Young (BLY) Equation (Equation (23)) and depicted in
Figure 24.
cosθ= cosθ0+ C
2γLGV2 (23)
BLY equation, where θ and θ0 are the actuated and Young contact angles, C the capacitance of the substrate,
γLG the liquid-air surface tension and V the electric potential. The contact angle decreases as the electric field
is applied as depicted in Figure 24.
Figure 24. Change of contact angle as a result of an applied electric field. Contact angle θ decreases with
increasing electric field (b).
The EWOD technique allows very specific fluid movement across substrate materials and is a
robust way to develop programmable digital microfluidics for cell manipulation203 and has
been used in DNA reaction204. However, the process described above requires the fluid to
have good conductivity. As many biological assays are conducted in ionic buffers17, it can be
assumed there is sufficient conductivity.
θ(a)
Ground ElectrodeElectrode (no voltage)
θ(b)
Electrode (voltage applied)

73
1.5.12 Geometry-Mediated Passive Droplet Fusion
Dependent on the stability of droplets within the microfluidics system (whether they have
been stabilised through the use of surfactants) droplets can be fused passively by draining
carrier phase fluid from between contiguous droplets. This may be achieved by modifying
the channel geometry at a specific point such that the flow rate is reduced and droplets fuse at
the point they meet from disturbances in the surface tension205,206. In order for geometrically
constrained devices to work, the droplet spacing (frequency of generation) is critical to ensure
droplets will come into contact in the fusion zone. If droplets have been sufficiently stabilised
by the use of a surfactant, it may not be possible to achieve passive fusion in this manner and
such techniques as electrofusion may be required to sufficiently disrupt the droplet interface
surface tension.
1.5.13 Electrofusion
Originally applied to research involving the fusion of plant protoplasts207, electrofusion or
electro-coalescence208, has been used successfully in several reports to accomplish droplet or
vesicle fusion209.
Figure 25. (a) Schematic of an oil drain concept, where oil is extracted from the carrier flow while channel
geometry prevents loss of the dispersed phase via the drain channels. Droplets may auto-coalesce on contact, or
through the use of electric fields to induce electrofusion. (b) An expanded channel region will slow linear flow
rate, resulting in closer droplet-droplet proximity. An electric field applied across the region can then de-
stabilise the droplet interfaces and promote electro-fusion.
Electric f ield
Electrodes
+ve- ve
(a) (b)
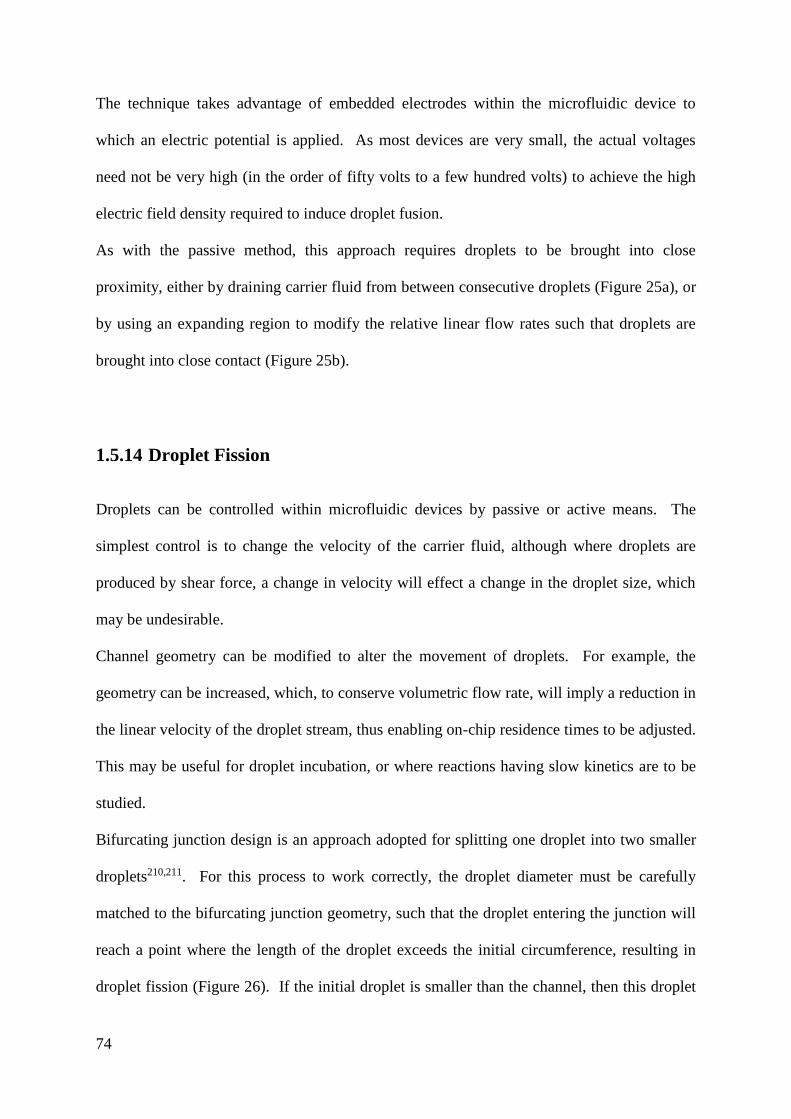
74
The technique takes advantage of embedded electrodes within the microfluidic device to
which an electric potential is applied. As most devices are very small, the actual voltages
need not be very high (in the order of fifty volts to a few hundred volts) to achieve the high
electric field density required to induce droplet fusion.
As with the passive method, this approach requires droplets to be brought into close
proximity, either by draining carrier fluid from between consecutive droplets (Figure 25a), or
by using an expanding region to modify the relative linear flow rates such that droplets are
brought into close contact (Figure 25b).
1.5.14 Droplet Fission
Droplets can be controlled within microfluidic devices by passive or active means. The
simplest control is to change the velocity of the carrier fluid, although where droplets are
produced by shear force, a change in velocity will effect a change in the droplet size, which
may be undesirable.
Channel geometry can be modified to alter the movement of droplets. For example, the
geometry can be increased, which, to conserve volumetric flow rate, will imply a reduction in
the linear velocity of the droplet stream, thus enabling on-chip residence times to be adjusted.
This may be useful for droplet incubation, or where reactions having slow kinetics are to be
studied.
Bifurcating junction design is an approach adopted for splitting one droplet into two smaller
droplets210,211. For this process to work correctly, the droplet diameter must be carefully
matched to the bifurcating junction geometry, such that the droplet entering the junction will
reach a point where the length of the droplet exceeds the initial circumference, resulting in
droplet fission (Figure 26). If the initial droplet is smaller than the channel, then this droplet

75
will not split, but rather, be randomly distributed into one or other output channels of the
bifurcating junction. An asymmetric design can be used to produce droplet fission where one
droplet has a different volume.
Cacr= ∝ε0 (1
ε02/3 - 1)
2
(24)
Where; 𝐶𝑎𝑐𝑟 isd the critical capillary number; ∝ is a dimensionless constant of the viscosity difference
between the two fluids and channel geometry; 𝜀0 is the ratio of the initial droplet length to
circumference.
Figure 26. Droplet fission at a bifurcating junction. If the droplet size is correct, relative to the channel cross
section, the droplet will be forced to cleave into two daughter droplets in both output channels. If the droplet is
smaller than the channel cross section, it will travel either to the left or right channel at random.
As there is a precise requirement of channel size to ensure droplet fission, this technique may
not work under all conditions of flow rate, solvent composition and viscosity. Equation 24
describes the relationship between droplet dimension (due to channel size) and critical
capillary number.
1.6 Partitioning and Droplet Surface Interactions
1.6.1 Partitioning in Drug Discovery
Candidate drugs are profiled to have a balance between good aqueous solubility (e.g. for
effective dosing formulation) and good bioavailability (for uptake to target tissues, etc.). In

76
immiscible biphasic solvent systems, substances may tend to partition between the phases,
with an equilibrium point reached dependant on the physical chemistry of the solvent and
solute. LogP, or more usually by measurement at a specific pH, logD, is a key parameter
used in drug design. In biological drug design, logD values are usually quoted at
physiological pH (pH 7.4) and using a well characterised shake-flask method using octanol as
the counter-phase solvent212. The process is illustrated by Figure 27 and described by
Equation 25.
D=[aq.t0]-[aq.t30]
[aq.t30].
Vaq.
Voil (25)
Calculation of D, the diffusion constant, where [aqt0] is the concentration in the
aqueous phase before partitioning and [aqt30] after 30 minutes. Vaq. and Voil are the
volumes of aqueous and oil phase, respectively.
Figure 27. Shake flask determination of logD.
1.6.2 Partitioning and Microfluidics
When moving from 96-, to 384- and then 1536-well microtitre plate formats, we see an
increase in the surface area to volume ratio. As the assay volume decreases further in droplet
microfluidics, this ratio increases significantly as droplet size decreases. The impact this may
Solubilise
compound, pH 7.4 buffer
i) Mix (30 mins)
ii) Separate
Add octanol

77
have on microfluidic systems can become quite profound, where physical chemistry
mechanisms such as partitioning and interfacial surface chemistry may become increasingly
dominant in the dynamics of the system. Table 7 highlights the ratio seen with different
droplet volumes, comparing 96-, 384- and 1536-well microtitre plates to droplet formats.
As the droplet surface area increases more rapidly with decreasing droplet volume,
partitioning of materials from the droplet may be expected to increase.
Table 7. Microtitre plate surface area to volume ratio comparison
Format Approx. surface area-to-volume ratio
96 well microtitre plate (well) 0.7:1
384-well microtitre plate (well) 1.2:1
1536-well microtitre plate (well) 3:1
300 µm diameter droplet (14 nL) 20:1
150 µm diameter droplet (1.8 nL) 40:1
50 µm diameter droplet (0.5 nL) 60:1
1.6.3 Proteins at Liquid Interfaces
As the surface area-to-volume ratio increases in droplet microfluidics, the potential for
interfacial surface interactions may also be expected to increase. As Holtze et al.177 reported,
when requiring dispersed phase stability where droplets do not auto-coalesce upon collision,
it is necessary to use biocompatible surfactants that do not adversely affect biological
reagents contained within the droplets. The conformation change of proteins and peptides at
interfaces has been previously studied and is well known213-215; such changes in a droplet
microfluidic system may radically change the nature of any reactions taking place. The
potential for this artefact to affect the P450 enzyme inhibition assay described in this project
is considered in later chapters.

78
2 PROJECT AIMS
2.1 Objectives
Miniaturise an existing in vitro cytochrome P450 inhibition assay used in drug
discovery to a droplet microfluidic format. This assay generates multi-point IC50 data
for small molecule (150 to 700 Da mass) candidate drugs entities for a specific human
P450 isoform, 1A2, as described in Chapter 1.
o Design and fabricate a novel chip to enable the production of droplets suitable
for the miniaturisation of the cytochrome P450 inhibition assay.
o Design and fabricate a suitable analytical device for the detection of emission
light from fluorogenic substrates used in the chip-based cytochrome P450
enzyme inhibition assay.
Investigate a range of oils for use in biphasic droplet microfluidics and select the most
appropriate based on physical properties and the ability to readily form and sustain
droplets under the required flow conditions. Include tests to investigate the impact of
surfactants on droplet formation and synthesise a large molecule non-ionic surfactant
and compare to the behaviour seen when using a commercially available small-
molecule ionic surfactant.
Investigate reagent migration from aqueous to oil phase across a planar interface and
compare to in situ droplet-based measurements.
Following optimisation of the oil type in respect of ideal droplet formation and
stabilisation, design and conduct experiments to determine the extent of reagent
migration observed for a wider range of compound chemistry provided via the AZ
compound collection library using mass spectrometry to quantify compound
concentrations at known time-points. Attempt to build a model that can be used to

79
predict the potential for partitioning of reagent/drug from the aqueous droplet to
carrier oil phase.
Observe and investigate effects seen that may arise directly from the miniaturisation
of the assay system, such as the impact of droplet surface-area-to-volume ratio and
interfacial artefacts. Interfacial effects in biphasic systems are well known, but the
specifics of these may be particular to the microfluidic system concerned.

80
3 EXPERIMENTAL
3.1 Chemicals and Reagents
Table 8a summarises the reagents and chemicals tested throughout the project. For
Intellectual Property protection purposes, the compounds from the AstraZeneca compound
collection library tested in the extended partitioning tests cannot be disclosed and are referred
to numerically where applicable.
3.1.1 Preparation of Phosphate Buffer Solution
The following method was used for all experiments involved with enzyme inhibition. As
shown in previous studies17,27-29, phosphate buffers of this type are typical for biochemical
assays. In addition, this buffer was used for all tests investigating partitioning between
aqueous and oil phases, to help ensure no drift in spectrophotometric emission profile was
related to changes in pH.
1. Disodium hydrogen phosphate (35.9 g) was added to reverse osmosis (RO) water
(1 litre) and stirred thoroughly until dissolved. This was labelled ‘Solution A’.
2. Potassium dihydrogen phosphate (6.8 g) was added to RO water (0.5 L) and stirred
thoroughly until dissolved. This was labelled ‘Solution B’.
3. Solution B was added to Solution A whilst stirring until pH 7.4 was reached,
measured using a 3-point (pH 4, 7 & 10) calibrated electronic pH meter (Fisher
Scientific, Waltham, MA).
The final solution is referred to as ‘phosphate buffer’ (PB) throughout this project.

81
Table 8a. Summary of chemicals and reagents. All materials are of reagent grade quality having >95% purity.
Chemical/Biochemical Reagent Description / use Thesis Page ref. Supplier Supplier ref.
olive oil triglyceride/carrier oil Tesco n/a
octanol alcohol/carrier oil Sigma–Aldrich 472328-100ML-D
dodecane alkane/carrier oil Sigma–Aldrich D221104-100ML-D
polydimethylsiloxane (DC200) siloxane/carrier oil Sigma–Aldrich 378372-250ML
hexadecafluoro-1,3-dimethylcyclohexane fluorinated cycloalkane/carrier oil Sigma–Aldrich 282316
perfluorodecalin fluorinated heterocyclic alkane/carrier oil Fluorochem 003283
perfluoroperhydrophenanthrene fluorinated heterocyclic alkane/carrier oil Fluorochem 007152
FC-40 fluorinated tertiary amine/carrier oil 3M Free sample
FC-70 fluorinated tertiary amine/carrier oil Apollo Scientific PC3312G
NADPH enzyme co-factor/inhibition assay Sigma–Aldrich N7505-100MG
cytochrome P450 enzyme 1A2 enzyme Invitrogen (Life Technologies) P2792
disodium hydrogen phosphate buffer/inhibition assay & partitioning Sigma–Aldrich S9390-500G-D
potassium dihydrogen phosphate buffer/inhibition assay & partitioning Sigma–Aldrich 795488
3-cyano-7-ethoxycoumarin fluorogenic substrate/inhibition assay Invitrogen (Life Technologies) C684
fluvoxamine 1A2-specific inhibitor/inhibition assay Sigma–Aldrich F2802-10MG
acetonitrile solvent/dissolution of fluorogenic substrate Sigma–Aldrich 271004
dimethylformamide
di
solvent/fluorosurfactactant preparation Sigma–Aldrich 227056
dichloromethane
solvent/fluorosurfactactant preparation Sigma–Aldrich 676853
thionyl chloride
reagent/fluorosurfactactant preparation Sigma–Aldrich 230464
toluene solvent/fluorosurfactactant preparation Sigma–Aldrich 244511
tetrahydrofuran solvent/fluorosurfactactant preparation Sigma–Aldrich 401757
triphenylphosphine reagent/fluorosurfactactant preparation Sigma–Aldrich 93092
oxalyl dichloride reagent/fluorosurfactactant preparation Sigma–Aldrich O8801
ethyl acetate solvent/fluorosurfactactant preparation Sigma–Aldrich 270989
polystyrene-dimethylaminopyridine reagent/fluorosurfactactant preparation Sigma–Aldrich 359882
phosphorus pentoxide drying agent/fluorosurfactactant preparation Sigma–Aldrich 298220
KRYTOX 143FSH Surfactant precursor/fluorosurfactactant
preparation
GBR Technology Ltd n/a
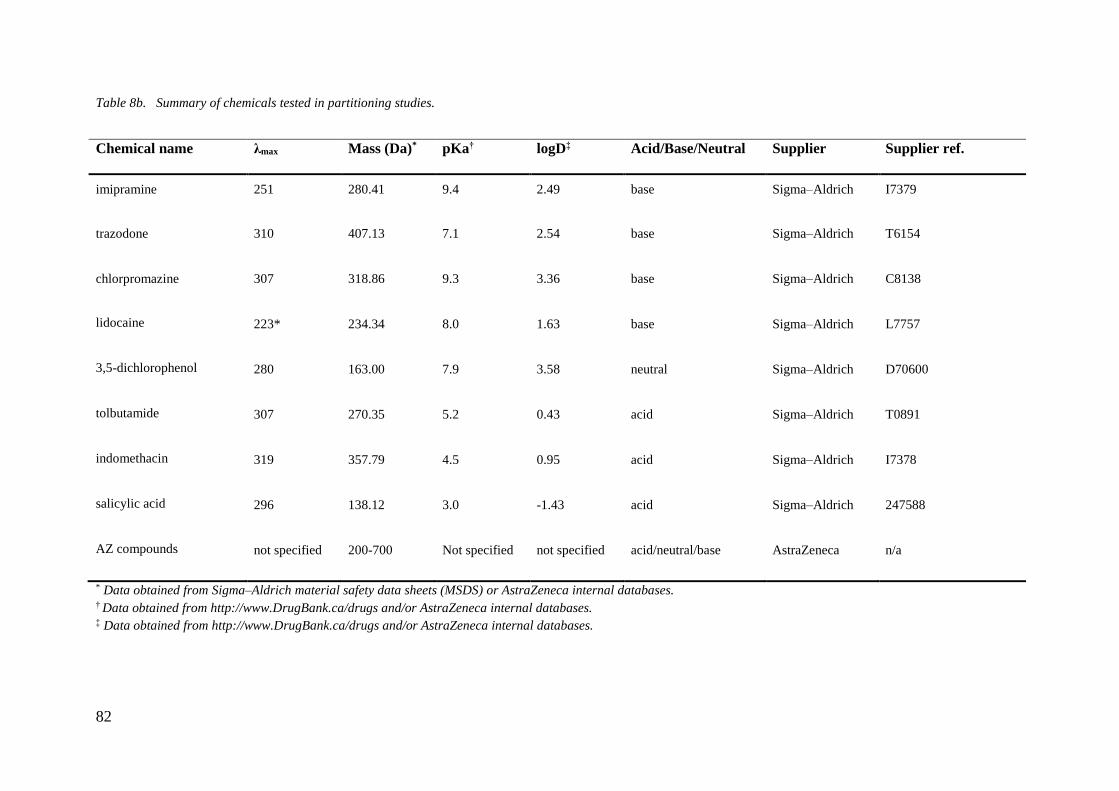
82
Table 8b. Summary of chemicals tested in partitioning studies.
Chemical name λmax Mass (Da)* pKa† logD‡ Acid/Base/Neutral Supplier Supplier ref.
imipramine 251 280.41 9.4 2.49 base Sigma–Aldrich I7379
trazodone 310 407.13 7.1 2.54 base Sigma–Aldrich T6154
chlorpromazine 307 318.86 9.3 3.36 base Sigma–Aldrich C8138
lidocaine 223* 234.34 8.0 1.63 base Sigma–Aldrich L7757
3,5-dichlorophenol 280 163.00 7.9 3.58 neutral Sigma–Aldrich D70600
tolbutamide 307 270.35 5.2 0.43 acid Sigma–Aldrich T0891
indomethacin 319 357.79 4.5 0.95 acid Sigma–Aldrich I7378
salicylic acid 296 138.12 3.0 -1.43 acid Sigma–Aldrich 247588
AZ compounds not specified 200-700 Not specified not specified acid/neutral/base AstraZeneca n/a
* Data obtained from Sigma–Aldrich material safety data sheets (MSDS) or AstraZeneca internal databases. † Data obtained from http://www.DrugBank.ca/drugs and/or AstraZeneca internal databases. ‡ Data obtained from http://www.DrugBank.ca/drugs and/or AstraZeneca internal databases.

83
3.1.2 Preparation of NADPH Solution
The procedure followed for the P450 enzyme reaction in both microtitre plate and chip based
experiments used a 1:1 ratio of NADPH solution to enzyme–substrate (pg. 102), and a final
incubate NADPH concentration of 250 µM was required. Fresh NADPH working solutions
in phosphate buffer (500 µM) were made for each experiment and kept on ice until required.
3.1.3 Preparation of Cytochrome P450 Enzyme Solution
1A2 enzyme was supplied by Life Technologies (ThermoFisher, Waltham, MA) as a stock at
1 µM concentration. The procedure for the enzyme inhibition reaction details the
requirement for a final incubate enzyme concentration of 10 nM, thus with the 1:1 addition of
NADPH co-factor, the enzyme working solution was 999made up to 20 nM in phosphate
buffer and kept on ice for up to 4 hours until use. The volume of enzyme solution required for
any given test was spiked with the appropriate stock substrate solution prior to use.
3.1.4 Preparation of CEC Substrate Solution
Stock solution was prepared by dissolving CEC in acetonitrile to 2 mM and ensuring
thorough dissolution by vortex mixing rapidly for 20 seconds.
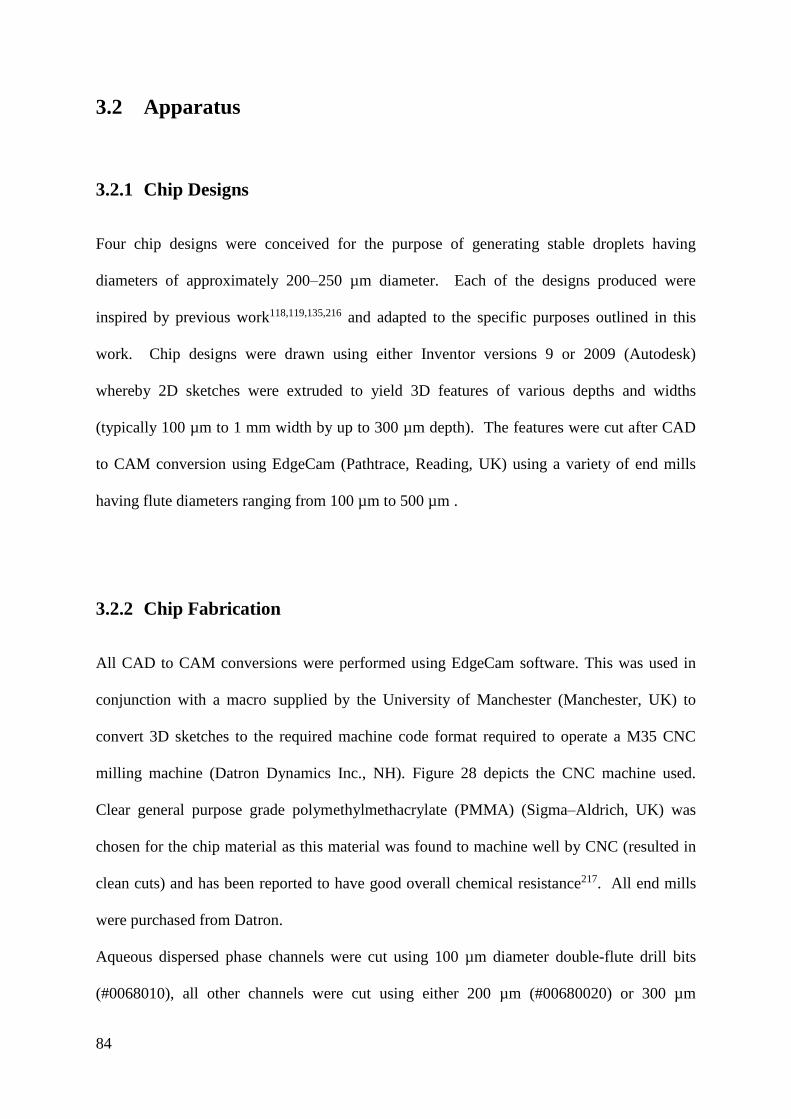
84
3.2 Apparatus
3.2.1 Chip Designs
Four chip designs were conceived for the purpose of generating stable droplets having
diameters of approximately 200–250 µm diameter. Each of the designs produced were
inspired by previous work118,119,135,216 and adapted to the specific purposes outlined in this
work. Chip designs were drawn using either Inventor versions 9 or 2009 (Autodesk)
whereby 2D sketches were extruded to yield 3D features of various depths and widths
(typically 100 µm to 1 mm width by up to 300 µm depth). The features were cut after CAD
to CAM conversion using EdgeCam (Pathtrace, Reading, UK) using a variety of end mills
having flute diameters ranging from 100 µm to 500 µm .
3.2.2 Chip Fabrication
All CAD to CAM conversions were performed using EdgeCam software. This was used in
conjunction with a macro supplied by the University of Manchester (Manchester, UK) to
convert 3D sketches to the required machine code format required to operate a M35 CNC
milling machine (Datron Dynamics Inc., NH). Figure 28 depicts the CNC machine used.
Clear general purpose grade polymethylmethacrylate (PMMA) (Sigma–Aldrich, UK) was
chosen for the chip material as this material was found to machine well by CNC (resulted in
clean cuts) and has been reported to have good overall chemical resistance217. All end mills
were purchased from Datron.
Aqueous dispersed phase channels were cut using 100 µm diameter double-flute drill bits
(#0068010), all other channels were cut using either 200 µm (#00680020) or 300 µm

85
(#0068003) diameter double-flute drill bits. In the case of 100 µm, 200 µm and 300 µm
mills, maximum cutting depth was roughly equivalent to the flute diameter. For larger holes
cut with a 500 µm bit (double-flute, #0068605) the maximum hole depth was 3 mm (milling
bit had an extended flute length). Fluid connection holes were drilled using 500 µm drill bits
of the longer 3 mm flute type enabling through–holes to be cut.
Fluid connection holes were drilled using a 500 µm diameter end mill and the channel-side
surface of the chip roughened using a ‘Very Fine’ grade (grit size 400) silicon carbide
abrasive paper (797-5960, RS Components, UK) to remove minor blemishes and to provide a
roughened surface for the chip seal to bind to.
Figure 28. Datron M35 CNC milling machine used to produce microfluidic chip devices.
To minimise the impact of extraneous light interference, each chip was covered with black
card on the reverse side, and also on the top side, either side of the detection channel, using
double-sided tape. In addition, all fluorescence measurements were made in subdued
ambient lighting to further limit the extraneous signal noise.
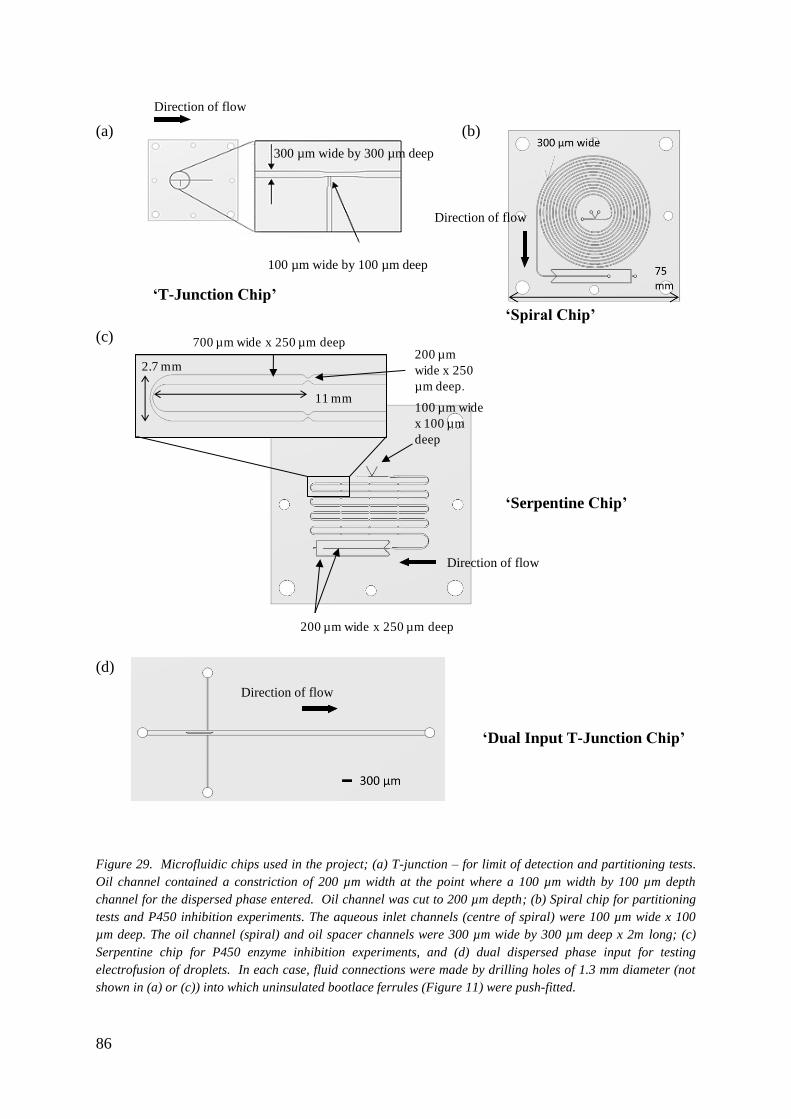
86
Figure 29. Microfluidic chips used in the project; (a) T-junction – for limit of detection and partitioning tests.
Oil channel contained a constriction of 200 µm width at the point where a 100 µm width by 100 µm depth
channel for the dispersed phase entered. Oil channel was cut to 200 µm depth; (b) Spiral chip for partitioning
tests and P450 inhibition experiments. The aqueous inlet channels (centre of spiral) were 100 µm wide x 100
µm deep. The oil channel (spiral) and oil spacer channels were 300 µm wide by 300 µm deep x 2m long; (c)
Serpentine chip for P450 enzyme inhibition experiments, and (d) dual dispersed phase input for testing
electrofusion of droplets. In each case, fluid connections were made by drilling holes of 1.3 mm diameter (not
shown in (a) or (c)) into which uninsulated bootlace ferrules (Figure 11) were push-fitted.
(a)
(b)
(c)
(d)
200 µm
wide x 250
µm deep.
200 µm wide x 250 µm deep
100 µm wide
x 100 µm
deep
11 mm
2.7 mm
700 µm wide x 250 µm deep
100 µm wide by 100 µm deep
300 µm wide by 300 µm deep
‘Spiral Chip’
‘Serpentine Chip’
‘T-Junction Chip’
‘Dual Input T-Junction Chip’
Direction of flow
Direction of flow
Direction of flow
Direction of flow
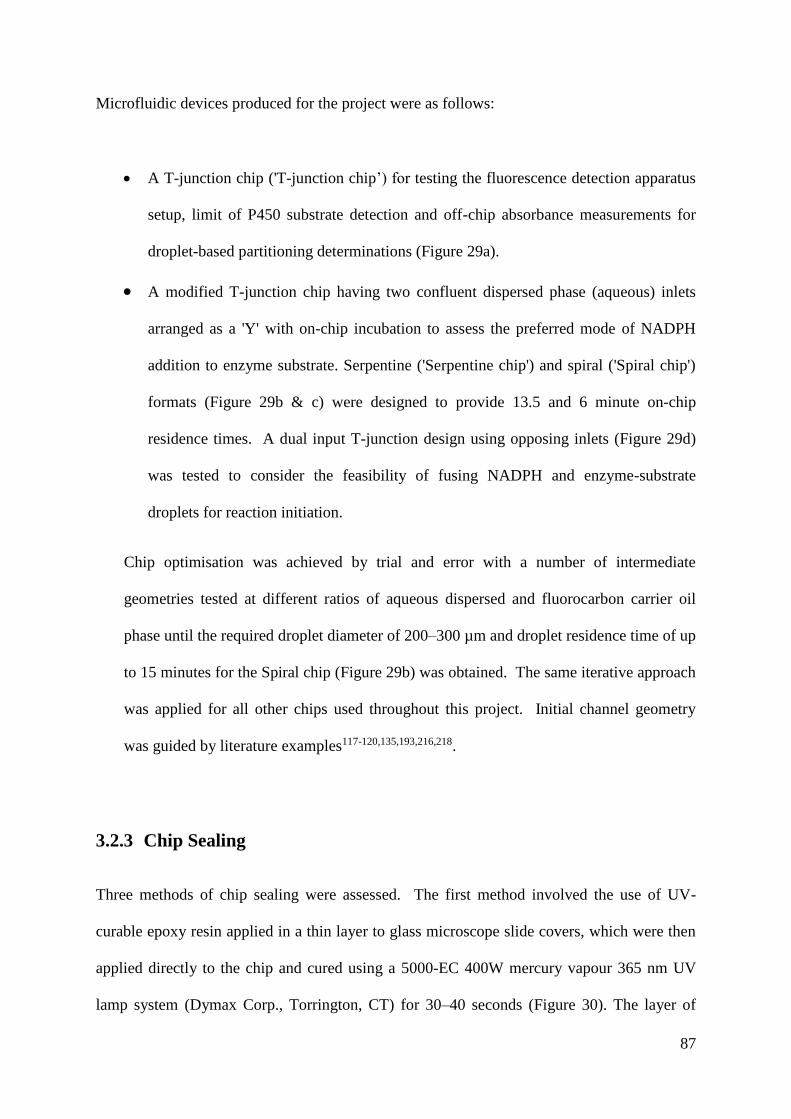
87
Microfluidic devices produced for the project were as follows:
A T-junction chip ('T-junction chip’) for testing the fluorescence detection apparatus
setup, limit of P450 substrate detection and off-chip absorbance measurements for
droplet-based partitioning determinations (Figure 29a).
A modified T-junction chip having two confluent dispersed phase (aqueous) inlets
arranged as a 'Y' with on-chip incubation to assess the preferred mode of NADPH
addition to enzyme substrate. Serpentine ('Serpentine chip') and spiral ('Spiral chip')
formats (Figure 29b & c) were designed to provide 13.5 and 6 minute on-chip
residence times. A dual input T-junction design using opposing inlets (Figure 29d)
was tested to consider the feasibility of fusing NADPH and enzyme-substrate
droplets for reaction initiation.
Chip optimisation was achieved by trial and error with a number of intermediate
geometries tested at different ratios of aqueous dispersed and fluorocarbon carrier oil
phase until the required droplet diameter of 200–300 µm and droplet residence time of up
to 15 minutes for the Spiral chip (Figure 29b) was obtained. The same iterative approach
was applied for all other chips used throughout this project. Initial channel geometry
was guided by literature examples117-120,135,193,216,218.
3.2.3 Chip Sealing
Three methods of chip sealing were assessed. The first method involved the use of UV-
curable epoxy resin applied in a thin layer to glass microscope slide covers, which were then
applied directly to the chip and cured using a 5000-EC 400W mercury vapour 365 nm UV
lamp system (Dymax Corp., Torrington, CT) for 30–40 seconds (Figure 30). The layer of

88
adhesive was prepared by first placing a small amount of Norland ‘NOA68’ UV curable
optical epoxy adhesive (Norland Inc., Cranbury, NJ) between two sheets of acetate film and
rolling this out between the two sheets as much as possible. The top acetate sheet was
replaced with a fresh one and the process repeated. This was then repeated a third time
before placing one of the final acetate sheets directly onto the glass chip seal and carefully
rolling flush to remove air. The seal was then placed carefully on the chip, carefully rolled
and then subjected to the UV lamp for 30 seconds. Although this provided a very robust seal
able to withstand fairly high back-pressures, after a few days’ use, the chip and subsequently
glass cracked, presumably a result of thermal expansion or contraction differences and/or
plastic swelling due to solvent absorption. This method was not pursued further.
Figure 30. Dymax 365 nm 400W UV curing lamp system for curing UV curable epoxy resin.
Method two, evolving from the first, replaced the glass with overhead projector acetate sheet,
following the same construction technique. This approach proved much more reliable over
time, but an even adhesive coating over the entire seal could not be obtained reliably.
Furthermore, it was found that small features were prone to being blocked by adhesive if too
much was applied. This was evident from adhesive spilling into the channels when observed
under a microscope. The correct amount of adhesive was determined by trial and error.

89
Method three was preferred for all future work, being quick and simple to apply and crucially
having good reliability. Sections of self-adhesive optically clear microtitre plate seals
(#6575, Corning, Tewkesbury, NA) were applied directly to the finished chip. The binding
side on the seals formed a firm attachment to the chip after at least 2 hours’ post-application.
This condition was ascertained by the observation of the seal becoming transparent as if
having ‘wetted’ fully into the keyed surface of the chip surrounding the channels. The
binding side of the seal directly above the chip channels did not appear to adversely affect
droplet formation or fluorescent detection.
3.2.4 Fluid Delivery
All microfluidic devices were compression push-fitted with 1.3 mm diameter uninsulated
bootlace ferrules (#211-4252, RS Components, Corby, UK). Short sections of silicone tubing
(7mm long) of 1mm internal diameter (#VERN760070, VWR, UK) were used to join PTFE
tubing of 0.5 mm internal diameter (#DENE3400501, VWR, UK) to the ferrules for fluid
delivery. Harvard PHD2000 syringe pumps (Harvard Apparatus, MA) were used for all
reagent delivery, using 10 mL and 1 mL glass Gastight® syringes (Hamilton, Bonaduz,
Switzerland). Glass syringes were considered to have a smoother piston action for low speed
operation than plastic syringes.

90
3.2.5 Analytic Apparatus for Fluorescent Detection
An aluminium optical breadboard (PGB52522, Thorlabs, Ely, UK) was used to assemble a
custom built laser diode-dichroic mirror-photomultiplier detector. Microfluidic chips were
supported on a X-Y twin-axis translation stage (20XT65, Comar Optics, UK), to enable
accurate positioning of the detection channel beneath the optics.
The detection apparatus (Figure 31, left) consisted of a 10× microscope objective lens to
focus light from a 3 mW 405 nm solid state laser (Laser Components, UK) into the detection
channel and to then focus the emission light back through a dichroic mirror (Long Pass cut
off 425 nm, Laser Components, UK) to a H10722-01 photomultiplier tube (PMT)
(Hamamatsu Photonics Ltd., Herts., UK). The laser diode-PMT apparatus and microfluidic
chip were both mounted to the breadboard using translation stages (Thorlabs, Cambridge,
UK) providing four degrees of movement; X, Y and Z and additionally a rotation module for
the diode-PMT assembly to allow fine adjustment of the excitation/emission light position
(Figure 32).
Figure 31. Schematic of laser diode, dichroic mirror block, PMT module and Pico data logger used for
acquiring fluorescence data from the droplets. Photomultiplier from Hamamatsu (H10722-01); 405nm
Flexpoint 405nm laser from Laser Components, UK; custom-built dichroic mirror block to house 25mm long-
pass dichroic mirror from Comar Optics (420IY25). Olympus 10× microscope lens was used to focus light in
the chip channel to a spot approx. 1mm2. ADC-11 (Pico Technology, UK) was used to convert the voltage
output from the PMT to a digital signal captured by universal serial bus data transfer (USB).
Microscope objective lens
Photomultiplier module
Band-pass filter
Dichroic mirror block
Droplet
405 nm
laser

91
Excitation light beam was estimated to be approximately 0.5–1.0 mm diameter when
compared to the known channel width sections (300 µm) at sharp focus. This was judged by
moving the z-axis up and down to find the point at which the light beam was at its smallest
diameter, and thus deemed in focus.
Figure 32. General arrangement of laser diode, dichroic mirror block, and PMT module and microfluidic chip
mounted to a breadboard. The heater was formed from an aluminium block fitted with a self-adhesive heater
pad. 4 degrees of movement (x, y, z and rotate) via the translation stages provided accurate channel alignment
and light focussing.
The x and y translation stages were then adjusted to move the beam to the required detection
spot on the chip channel.
A Pico analogue-to-digital 12-bit data logger (Pico Technology, St. Neots, Cambridgeshire,
UK) was used to capture the output signal from the PMT (Figure 31, right).
Channel geometry was determined by iterative chip design-make-test cycles for all chip
designs used throughout the project. All designs incorporated a suitable region towards the
exit fluid connections where either a camera lens assembly was focused to enable capture of
bright-field images of droplets, or the laser-PMT assembly used to capture fluorescence.
Microfluidic chip
Heater block
PMT
405 nm laser
Dichroic
mirror block

92
3.2.6 Fluorescence Intensity Measurements
The target analyte for the project was the fluorescent metabolite 3-cyano-7-hydroxycoumarin
(CHC), produced by the oxidative metabolism of 3-cyano-7-ethoxycoumarin (CEC) by the
1A2 P450 cytochrome enzyme used in this project. CEC is an enzyme specific fluorogenic
substrate used in existing conventional microtitre plate drug-drug interaction studies2,28
having an absorbance maximum at 408 nm and fluorescence emission at 460 nm.
3.2.7 Direct Observation
Alternatively, visual observations (image snapshots or video clips) were aided through the
use of a high speed monochrome CMOS camera (#LU075, Lumenera, Ontario, Canada)
fitted with a fixed focal length C-mount lens. Alternatively, a colour USB 400x digital
microscope (Veho, Hampshire, UK) was used to provide higher magnification images at
lower frame rates.
3.2.8 High Voltage Power Supply
An electrophoresis high voltage power supply (Consort bvba., Turnhout, Belgium) was used
to provide the required 2–3 kV to electro-fuse droplets collected in the off-chip partitioning
experiments. Briefly, droplet emulsion samples were collected in a 0.5 mL Eppendorf tube
(Eppendorf, Hauppauge, NY). The tube was surrounded by aluminium foil connected to one
HV terminal, whilst an insulated probe connected to the opposite HV terminal was used to
fuse the droplet emulsion collected in the vessel. An electric field gradient was thus formed,
sufficient enough to disrupt the surfactant-stabilised droplets and effect electro-fusion.

93
3.3 Methods
3.3.1 Procedure for Oil Testing, Droplet Formation and Linearity
The range of oils detailed in Table 9 were tested in the T-junction chip shown in Figure 29a
to determine which would best promote droplet formation and whether these could be
considered suitable for use throughout the whole project in respect of droplet formation. For
each oil, flow rates of the oil and aqueous phase were incrementally increased using an
iterative approach until stable droplet formation was achieved. As described previously (pg.
46), droplet formation and droplet size is affected by the absolute and relative flow rates of
the oil carrier and dispersed phases. In all cases, phosphate buffer was the aqueous dispersed
phase for droplet production. This was selected based on the intended use of the buffer in
chip-based biochemical P450 enzyme reactions later on in the project (pg. 106).
Table 9. Oils tested in the droplet formation & stability tests.
Carrier Oil Chemistry
olive oil triglyceride
silicone oil polydimethylsiloxane
octanol alcohol
dodecane straight-chain alkane
hexadecafluorodimethylcyclohexane fluorinated cycloalkane
perfluorodecalin fluorinated polycyclic alkane
perfluoroperhydrophenanthrene fluorinated polycyclic alkane
FC-40 fluorinated tertiary amine
FC-70 fluorinated tertiary amine
FC-40 with PFO (10% v/v)
FC-70 with PFO (10% v/v)

94
Two methods were applied to assess droplet formation reproducibility; the first relied upon
recording attempted droplet formation using a USB high speed camera (Lumenera, Ontario,
Canada) and analysing individual frames. The images were imported to Adobe Premier Pro
(Adobe, CA) to extract individual frames which were then analysed in ImageJ (NIH,
Bethesda, MD). By scaling against the known geometry of the channel, the diameter and
circumference of 100 consecutive droplets was estimated and the variance calculated.
In the second method, the laser-PMT assembly (Figure 32, pg. 91) was used to obtain
fluorescent data from droplets containing CHC solution over a concentration range from 0.05
to 1 µM. The collected data was plotted in Origin 7.5 (OriginLab, Northampton, MA) and
Excel™ (Microsoft, Redmond, WA), droplet signal intensity identified and the average signal
and standard deviation calculated. Built-in peak baseline detection and integration algorithms
available in Origin were used to calculate peak width, height and area data.
Peak height was recorded for proportionality and linearity with respect to concentration,
whilst peak width was used to provide a measure of droplet diameter calculated from the
linear flow rate and time domain spanning the width of each peak. This approach assumed a
constant flow rate and correct alignment of droplets through the detection zone.
The aqueous flow was adjusted over the range 2 to 6 µL per min and oil flow rate over 5 to
20 µL and both incrementally increased until either a stable droplet stream was produced, or
wetting out of the aqueous phase occurred.
As discussed previously, fluorocarbon oils may require a surfactant to yield stable
droplets62,175,177 and thus these oils were also tested in the T-Junction chip using the
admixture of perfluorooctanol (10 % v/v) to the fluorous oil phase.

95
3.3.2 Synthesis and Characterisation of Fluorosurfactant
Surfactants are often necessary to enable stable droplet formation by reduction of the
interfacial surface tension between dispersed and carrier phase and/or provide additional
‘shielding’ of the droplet contents from undesirable interaction with the droplet interface or
oil. As reported by Holtze et al.177, non-ionic capped fluorosurfactants added to fluorocarbon
carrier oils were the most biocompatible in respect to controlling the degree of protein
adsorption at the droplet interface. A similar non-ionic fluorosurfactant was prepared and
tested to investigate this in the context of droplet P450 enzyme inhibition assays attempted in
this project.
The following procedure were developed to synthesize a complex perfluoropolyether
fluorosurfactant:
Step 1: Conversion of PEG 600 to 1-chloro-2-(2-chloropolyethoxy)ethane
(R1)
Figure 33. 2,2-oxydiethanol PEG 600 conversion to 1-chloro-2-(2-chloropolyethoxy)ethane.
Reaction R1 (Figure 33): 2,2'-oxydiethanol PEG 600 (60 g, 100.00 mmol) was heated at
80°C under vacuum for 1 hour to degas and remove moisture. The oil was cooled under
nitrogen, and thionyl chloride (21 mL, 287.72 mmol) added slowly at 20°C. The mixture was
heated to 50 °C for 18 hours. Reaction completion was determined by infrared spectroscopy,
observing disappearance of the O-H stretch at 3500 cm–1 and formation of C-Cl stretch at 730
cm–1 (data not shown). The intermediate was diluted with DMF and evaporated. This was
repeated three times to remove all traces of thionyl chloride, to afford 1-chloro-2-(2-
OOH OH
n OCl Cl
n
thionyl chloride

96
chloropolyethoxy) ethane (65.7 g, 103 mmol, 103 %) as a pale yellow oil and confirmed by
mass spectrometry (Figure 34).
Figure 34. Mass Spectrometry analysis of 1-chloro-2-(2-chloropolyethoxy) ethane.
Step 2:
(R2)
Figure 35. 1-chloro-2-(2-chloropolyethoxy) ethane conversion to 1-azido-2-(2-azidopolyethoxy) ethane.
Reaction R2 (Figure 35): 1-chloro-2-(2-chloropolyethoxy) ethane (65.7 g, 103.30 mmol) was
dissolved in dimethylformamide (DMF) (500 mL), and sodium azide (19g, 292.26 mmol)
added. The mixture was stirred at 85 °C for 18 hours under nitrogen and then evaporated.
Dichloromethane (DCM) (400ml) was added and the inorganic constituents removed by
ON3N3
nOCl Cl
n
sodium azide

97
filtration. The filtrate was evaporated to afford 1-azido-2-(2-azidopolyethoxy) ethane (61.85
g, 95 mmol, 92 %) as a brown oil (Figure 36).
IR confirmed the formation of the di-azide by the appearance of a sharp azide stretch at 2100
cm–1 and the disappearance of the C-Cl stretch at 730 cm–1 (data not shown).
Figure 36. Mass spectrometry analysis of 1-azido-2-(2-azidopolyethoxy) ethane.
Step 3:
(R3)
Figure 37. Conversion of 1-azido-2-(2-azidopolyethoxy) ethane to 2,2'-polyoxydiethanamine.
ON3N3
n ONH
2NH
2n
triphenylphosphine, water

98
Reaction R3 (Figure 37): 1-azido-2-(2-azidoethoxy) ethane (61.8 g, 95.08 mmol) was
dissolved in tetrahydrofuran (THF) (600 mL), triphenylphosphine (60 g, 228.76 mmol) added
and stirred at 25 °C for 4 hours. Water (8 mL) was then added and the solution stirred for 18
hours at 25 °C. This was evaporated to dryness and water (200ml) added to the residue. The
solid was removed by filtration and the filtrate washed three times with toluene (100ml). The
aqueous solution was evaporated to afford 2,2'-polyoxydiethanamine (50.2 g, 84 mmol, 88
%) as a brown oil which crystallized on prolonged drying.
Figure 38. Mass spectrometry analysis of 2,2'-polyoxydiethanamine.
IR analysis demonstrated the absence of an azide peak at 2100 cm–1 and peaks in the region
3300–3600 cm–1 for the NH groups (data not shown). Mass spectrometry confirmed
intermediate product formation (Figure 38).

99
Step 4:
(R4)
OO
F
F
FF F
F FF
F
F
FF
F
F
FF
F
OH
On
OO
F
F
FF F
F FF
F
F
FF F
F
FF
F
Cl
On
Figure 39. Conversion of KRYTOX 134FSH to 2,3,3,3-tetrafluoro-2-(1,1,2,3,3,3-hexafluoro-2-
(perfluoropropoxy)propoxy) propanoyl chloride.
Reaction R4 (Figure 39): Oxalyl dichloride (25 mL, 286.58 mmol) was added to a solution
of KRYTOX 134FSH (DuPont) (100 g, 20.78 mmol) in 1,1,2-trichloro-1,2,2-trifluoroethane
(250 mL) and stirred at reflux under a slow stream of nitrogen for 24 hours. This was
evaporated and the residue dried to afford 2,3,3,3-tetrafluoro-2-(1,1,2,3,3,3-hexafluoro-2-
(perfluoropropoxy)propoxy) propanoyl chloride (100 g, 100 %).
Step 5:
(R5)
Figure 40. Formation of product.
Reaction R5 (Figure 40): 2,3,3,3-tetrafluoro-2-(1,1,2,3,3,3-hexafluoro-2-
(perfluoropropoxy)propoxy) propanoyl chloride (100 g, 20.70 mmol), 2,2'-oxydiethanamine
(6.21 g, 10.35 mmol) and polystyrene supported 4-dimethylaminopyridine (PS-DMAP)
1.46mmol /g (25 g, 126.74 mmol) were charged to a 500ml flask and dried in a desiccator
over phosphorus pentoxide for two hours.
OO
F
F
FF F
F FF
F
F
FF F
F
FF
F
Cl
On O
NH2
NH2
n
ONHNH
OO
F
F
FF F
F FF
F
F
FF
F
F
FF
F
O OO
F
F
FFF
FFF
F
F
FF
F
F
FF
F
O
n
n
n

100
1,1,2-trichloro-1,2,2-trifluoroethane (200 mL) and (trifluoromethyl)benzene (100 mL) were
added and the mixture stirred at 60 °C under nitrogen for 24 hours. This was then cooled,
filtered and rinsed with 1:1 reaction solvents. The material was finally evaporated and
triturated with water then ethyl acetate. The thick oil was evaporated and dried to afford the
product (100 g, 95 %) as a pale cream, opaque viscous oil.
2,3,3,3-tetrafluoro-2-[1,1,2,3,3,3-hexafluoro-2-(1,1,2,2,3,3,3-heptafluoropropoxy)propoxy]-
N-[2-[2-[[2,3,3,3-tetrafluoro-2-[1,1,2,3,3,3-hexafluoro-2-(1,1,2,2,3,3,3-
heptafluoropropoxy)propoxy]propanoyl]amino]ethoxy]ethyl]propanamide is hereafter
referred to as ‘AZF’.
3.3.3 AZF Dissolution
The use of fluorosurfactants of the PFPE type has been reported at concentrations of
approximately 1–2% w/w62. AZF was first dissolved in FC-70 to 2% w/w using a positive
displacement pipette to carefully weigh the required amount in a small aluminium weighing
boat which was then added directly to about ¾ total required oil volume, whirly-mixed for 5
minutes followed by 5 minutes of sonication to ensure dissolution and then made up to the
correct volume. This yielded a clear to opaque solution which either contained non-dissolved
surfactant or possibly residual materials from incomplete purification. The solution was
passed through a 0.2 µm Luer-lock syringe filter which resulted in a clear and colourless
solution.

101
3.3.4 AZF Critical Micelle Concentration (CMC) by Dynamic Light
Scattering (DLS)
To determine the CMC of AZF using DLS, a series of dilutions of AZF in FC-70 were made
from a stock solution and analysed on a Brookhaven BI-200SM DLS instrument
(Brookhaven, Holtsville, NY) using a 90° scatter angle measurement. Briefly, serial 2-fold
dilutions of AZF fluorosurfactant were made from the filtered 2% w/w stock solution in FC-
70 described previously to the point where the signal-to-noise ratio deteriorated too much to
distinguish the sample. A plot of 90 ° scatter kilo counts per second against concentration
was then used to identify any deviation from linearity that could correspond to an aggregation
event or CMC point where a marked increase in larger micelles would be observed resulting
in a shift in the amount of scattered light.
3.3.5 Procedure for Microtitre Plate Cytochrome P450 Inhibition Assay
and Dependence on Reaction Temperature
The initial characterisation of the P450 enzyme reaction ('control activity') was performed
using a microtitre plate following the procedure outlined in Table 10. In this approach, a
working solution (50 µL) of 1A2 enzyme (20 nM) in phosphate buffer (0.1 M) containing
CEC substrate (3 µM) was pre-incubated in wells of a 384-well microtitre plate for 3 minutes
at a range of temperatures to determine the extent of useful linearity and max signal available.
After pre-incubation, a working solution of NADPH (500 µM) was dispensed using a multi-
channel pipette to ensure all reaction wells were started simultaneously. Measurement of
CHC formation was performed automatically using a kinetic-mode method to acquire data for
up to 20 minutes. This time was chosen based on the reported use of the 1A2 enzyme in
previous work2,17 and application notes from the enzyme supplier (Life Technologies, MA).
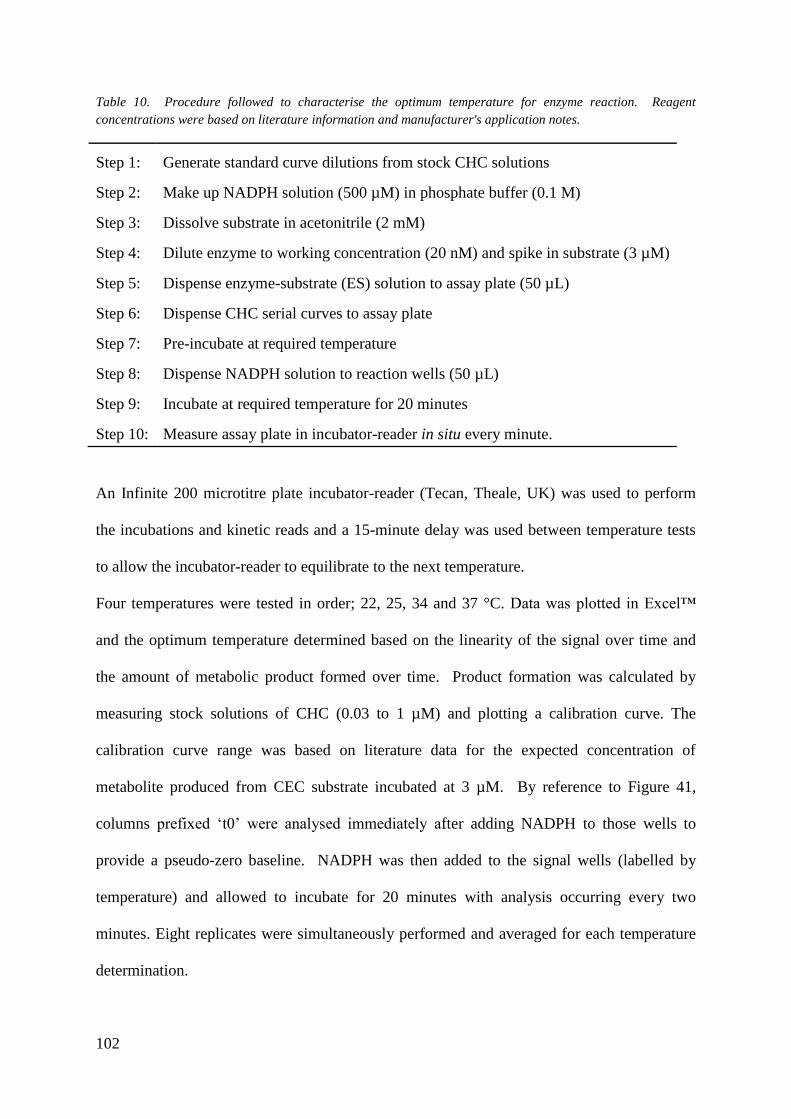
102
Table 10. Procedure followed to characterise the optimum temperature for enzyme reaction. Reagent
concentrations were based on literature information and manufacturer's application notes.
Step 1: Generate standard curve dilutions from stock CHC solutions
Step 2: Make up NADPH solution (500 µM) in phosphate buffer (0.1 M)
Step 3: Dissolve substrate in acetonitrile (2 mM)
Step 4: Dilute enzyme to working concentration (20 nM) and spike in substrate (3 µM)
Step 5: Dispense enzyme-substrate (ES) solution to assay plate (50 µL)
Step 6: Dispense CHC serial curves to assay plate
Step 7: Pre-incubate at required temperature
Step 8: Dispense NADPH solution to reaction wells (50 µL)
Step 9: Incubate at required temperature for 20 minutes
Step 10: Measure assay plate in incubator-reader in situ every minute.
An Infinite 200 microtitre plate incubator-reader (Tecan, Theale, UK) was used to perform
the incubations and kinetic reads and a 15-minute delay was used between temperature tests
to allow the incubator-reader to equilibrate to the next temperature.
Four temperatures were tested in order; 22, 25, 34 and 37 °C. Data was plotted in Excel™
and the optimum temperature determined based on the linearity of the signal over time and
the amount of metabolic product formed over time. Product formation was calculated by
measuring stock solutions of CHC (0.03 to 1 µM) and plotting a calibration curve. The
calibration curve range was based on literature data for the expected concentration of
metabolite produced from CEC substrate incubated at 3 µM. By reference to Figure 41,
columns prefixed ‘t0’ were analysed immediately after adding NADPH to those wells to
provide a pseudo-zero baseline. NADPH was then added to the signal wells (labelled by
temperature) and allowed to incubate for 20 minutes with analysis occurring every two
minutes. Eight replicates were simultaneously performed and averaged for each temperature
determination.

103
1 2 3 4 5 6 7 8 9 10 11 12
A
t0_25 25 t0_34 34 t0_37 37 t0_22 22
B
t0_25 25 t0_34 34 t0_37 37 t0_22 22
C
t0_25 25 t0_34 34 t0_37 37 t0_22 22
D
t0_25 25 t0_34 34 t0_37 37 t0_22 22
E
t0_25 25 t0_34 34 t0_37 37 t0_22 22
F
t0_25 25 t0_34 34 t0_37 37 t0_22 22
G
t0_25 25 t0_34 34 t0_37 37 t0_22 22
H
t0_25 25 t0_34 34 t0_37 37 t0_22 22
Figure 41. Microtitre plate layout used for enzyme-substrate reaction temperature dependence test. Wells
labelled ‘t0_x’ are measured immediately to provide a time=0-minute baseline; other labelled wells are the
end-point samples after incubation at temperatures 22, 25, 34 and 37 °C.
3.3.6 Design of Electrical Heater for Incubation of Droplet Chips
As the rate of an enzyme catalysed reaction is often dependent on temperature219,220, an
appropriate means to heat droplet chips to specific temperatures for studying P450 enzyme
inhibition assays was required.
An aluminium heater block was made using 5 mm sheet aluminium. To this, a self-adhesive
electrical heater pad obtained from RS components (#245-512, 12 3.75 W), measuring 50 ×
75 mm, was stuck on the reverse side (Figure 42) and a hole drilled into the edge of the metal
to accept a PT-100 temperature probe (#348-2427, RS Components, Corby, UK). The
thermal characteristics of the block were calculated and the required heater power determined
to enable microfluidic chips be heated to between 34 and 37 °C. Given the size of the heater
block and density of aluminium we can calculate the mass of aluminium using Equation (26),
and by using the specific heat capacity, the energy required to raise the temperature of the

104
block to 37 °C is found by Equation (27) and the time taken to reach this temperature
determined by Equation (28).
m=vρ (26)
Where; 𝑚 is mass, 𝑣 is volume and 𝜌 density.
E=Cpm∆T (27)
Where; E = energy in Joules, 𝐶𝑝 specific heat capacity, 𝑚 mass and ∆𝑇 temperature
change required.
W=E/t (28)
Where; W = power in Watts, E = energy in Joules, 𝑡 time in seconds
Thus, for an aluminium block of dimensions 0.025 m x 0.050 m x 0.005 m, having a specific
heat capacity of 0.91 kJ kg–1 °C and density of 2700 kg m–3, by equation 26 we can calculate
the mass of aluminium to be 16.88 g. From equation 27, the energy required to raise the
temperature of this block from room temperature (assuming 21 °C) to 34 °C is ~462 J. Using
equation 28, and the calculated required energy, the time to reach 34 °C is ~369 seconds.
Allowing for radiative losses and imperfect thermal conduction from the heater pad to the
block and microfluidic chip, we can assume efficiency in the region of 60%, thus the actually
time to reach 34 °C may be somewhat more. However, this was a reasonable delay given the
device was allowed to come to full operational temperature well ahead of any experiments,
and was not required have an adjustable temperature, requiring fast equilibration times.

105
Figure 42. Side view schematic of chip and electrical heater block. The self-adhesive heater (ii) and PT-100
temperature probe (iii) were connected to a low voltage temperature regulator control module enabling precise
temperature control of the heater to within +/- 1 °C.
A 24 V DC wall plug power adaptor (RS Components, Corby, UK) was used to power a
temperature controller (#DTC410, Tempatron, Essex, UK) which together with the PT-100
probe controlled a 12 V DC wall plug adaptor (RS Components, Corby, UK) connected to the
chip heater pad. Temperature stabilisation was determined using a separate calibrated digital
thermometer (#620-1934, VWR, UK) using a thermocouple junction temporarily fixed with
tape to the surface of a chip placed on the heater assembly.
3.3.7 Procedure for Chip-based 1A2-CEC Inhibition Assay
Equal volumes of enzyme-substrate and NADPH solution were introduced into droplets
produced at a T-junction channel by using a binary Y-shaped input for the aqueous phases.
Enzyme-substrate and NADPH solutions were introduced to the chip using a dual Harvard
syringe pump via 1ml plastic syringes. The use of this pump type avoided differences in flow
rate that mechanical fluctuations between two physically separate pumps may create.
The first chip was designed to provide an incubation of up to 20-minutes to match the
incubation time used in the microtitre plate assay method. To enable design of a chip to
achieve this within the confines of the 75 × 75 mm PMMA chip area available, flow rates of
oil and dispersed phase that worked well for droplet formation in the T-junction chip (oil at
Aluminium block
Heater pad
MF chip
PT-100 temperature
probe

106
3–12 µL min–1, dispersed phase at 1–5 µL min–1) were used as a starting point from which to
calculate the length of channel required in the spiral that would be necessary for droplets to
have up to 20-minute residence time before exiting the chip.
A spiral channel working from the middle (starting after the droplet-forming T-junction) to
the outside of the chip was cut having a turn spacing of 1 mm (Figure 43). The overall length
of the channel was ~ 560 mm. The spiral channel had a width and depth of 300 µm. Final
pump rates were 3.7 µL min–1 oil, 1 µL min–1 aqueous) to minimise back pressure and
produce droplets that remained within the chip for ~ 13.5 minutes. A second syringe pump
fitted with a 10 mL Hamilton GasTight glass syringe was used for the carrier oil and a third
pump used to introduce additional oil at 3.5 µL min–1 to the droplet spacer via the second oil
inlet (Figure 43ii).
Figure 43. ‘Spiral chip’ for incubating 4.2 nL droplets over 16–20 minutes. Enzyme-substrate and NADPH
solutions are introduced via a binary syringe pump to the Y-T junction, (i). Second oil supply (ii) is connected
near the main outlet (iii) providing separation between droplets as they flow through the detection region, (iv).
Spiral turn was 1 mm separation.
(i)
(ii)
(iii)(iv)
‘Spiral Chip’ 20 mm
Direction of flow

107
Figure 44. ‘Serpentine Chip’ delay line incubation chip designed for a droplet residence time 6 minutes. The
large width of the main channel (0.7 mm wide × 0.25 mm deep), may give rise to a pronounced parabolic flow
along the channel due to friction with the side walls221. Droplets smaller than the channel width will tend to
flow in parallel streams. Those near the wall will move more slowly and have a longer incubation time than
those in the centre of the channel. As Frenz et al. described, constrictions along the channel ensure that on
average all droplets are resident for an equal time by re-ordering them as they pass through the
constrictions221.
The droplet spacer feature was incorporated to increase the spatial separation of droplets
passing through the channel at this point where the fluorescence detector was placed.
To quantify data from chip-based enzyme-substrate reactions, a CHC serial dilution curve
was prepared, consisting of five points; 3, 1, 0.3, 0.1 and 0.03 µm. The concentration curve
set of sample standards were run through the chip prior to any enzyme-substrate experiments
to allow correct setting of the gain parameter for the PMT detector. During this, it was found
the photomultiplier tube detector was found to have a relatively limited dynamic range. The
gain was thus set to enable quantification across the expected signal range expected for the
reaction of 1A2 with CEC at 3 µM for 20 minutes in the microtitre plate tests.
0.2 mm wide x 0.25 mm deep
0.7 mm wide x 0.25 mm deep
‘Serpentine Chip’
20 mm
Direction of flow

108
As discussed previously, the results of the microtitre plate assay, indicated that after an
incubation of 20 minutes at 34 °C, when calibrated against a standard curve, the amount of
fluorescent metabolite produced represented about 8% metabolic turnover of the substrate, or
~ 0.25 µM. For the chip experiments, a similar production of metabolite was initially
assumed, and thus the gain setting was set for a full scale deflection (FSD) at about 0.3 µM
top concentration of fluorescent CHC standard. Standard curve dilutions of CHC in 0.1 M
phosphate buffer were made and sequentially run from lowest to highest concentration in the
chip (to avoid carryover issues) to achieve this.
Control activity reactions of enzyme-substrate were used to determine if the reaction was
comparable to the microtitre plate-based control activity. Phosphate buffer was first charged
to the chip via the binary pump to generate a stream of droplets providing a background
response. A 15-minute delay was observed before collecting data to ensure device
stabilisation.
Enzyme-substrate and NADPH solutions were then co-administered to the chip via the dual
pump and the resultant droplet fluorescence acquired after an initial flow of 15 minutes to
provide device stabilisation. This data was then analysed in terms of droplet reproducibility
(droplet peak heights) and the concentration of metabolite determined.
A series of increasing inhibitor concentration tests were also performed to generate IC50 data.
Table 11. Fluvoxamine dilutions and volume addition to enzyme-substrate solution.
[Working
solution]
Volume of stock
solution
Volume of phosphate buffer
diluent
Final
[Incubate]
Final
[DMSO]
60 µM 60 µL 940 µL 0.3 µM 0.03 %
18 µM 300 µL 700 µL 0.1 µM 0.17 %
5.4 µM 300 µL 700 µL 0.03 µM 0.17 %
1.62 µM 300 µL 700 µL 0.01 µM 0.1 %

109
Fluvoxamine was used as the inhibitor of 1A2. The required solutions were prepared such
that addition to the enzyme-substrate working solution yielded enzyme-substrate-inhibitor
solutions having concentrations of fluvoxamine spanning previously reported IC50 values
(0.03–0.09 µM)2,222,223 (Table 11). Fluvoxamine was dissolved in 100% DMSO (1 mM) to
make a stock solution. This was serially diluted in DMSO to yield an intermediate dilution
series which was then pre-diluted in buffer before spiking into separate aliquots of ES
solution to yield ES containing a profile of inhibitor concentrations (Table 11).
The Spiral chip detailed in Figure 43 was used to generate data for a 13.5-minute droplet
(approximately 4.2 nL volume) incubation produced at the dual Y-input T-junction in the
centre of the chip.
A second chip was constructed, featuring a shorter serpentine design of much wider channel
dimensions (Figure 44). This design utilised the same dual Y-input inlet immediately before
the T-junction for enzyme-substrate and NADPH solutions, and also incorporated the droplet
spacer via the use of a second oil supply to the outlet channel. This additional oil feed was
used to provide greater separation between droplets exiting the incubation channel for greater
separation of droplet peaks in the analysis. Pump speeds were identical to those used for the
spiral chip. The increased channel width enabled a 6-minute droplet residence time in a
shorter length of channel. As reported by Frenz et al.221, pronounced parabolic flow in the
channel may occur when the channel is substantially wider than the droplet diameter,
allowing droplets near the channel wall to remain on the chip longer than those in the centre
of flow. The Serpentine chip thus included a design feature adapted from the work of Frenz
et al. 221 wherein the channel was constricted at set intervals along its length (Figure 44, detail
inset) to force a randomised 're-ordering' of the droplets.

110
3.3.8 Procedure for Partitioning Experiments in Glass Vial
Table 12 details the oils tested. A range of small molecule compounds were chosen having
relatively high logD values and representing acid, basic and neutral chemistry (Table 13). A
solution of pH 7.4 phosphate buffer (0.1 M) was prepared as described previously. Each
compound was independently dissolved in the phosphate buffer (100 µM).
Table 12. Oils tested in the glass tube static interface partitioning test. Oil structure and dynamic viscosity
obtained from manufacturer data sheets, with the exception of olive oil224.
Oil Oil Chemistry
Dynamic
Viscosity
(mPa.s) @
25 ºC
Formula
dodecane alkane 1.34 CH3(CH2)10CH3
olive oil triglyceride ester 81 CH3(CH2)COOR
Where R is ~80% C18
siloxane oil Polydimethylsiloxane
(DC200) 20 [-Si(CH3)2O-]n
octanol alcohol 7.36 C8H18O
hexadecafluoro-1,3-
dimethylcyclohexane
fluorinated
cycloalkane 1.92 C6F10(CF3)2
perfluorodecalin fluorinated
cycloalkane 5.1 C10F18
perfluoroperhydrophenanthrene fluorinated
cycloalkane 28.4 C14F24
FC-40 fluorinated tertiary
amine 4.1 C21F48N
FC-70 fluorinated tertiary
amine 24 C24F54N
Compound solutions were initially quantified by spectroscopy using a Shimadzu UV-2401
spectrophotometer. For each of the non-fluorous oils tested, an aliquot of compound solution
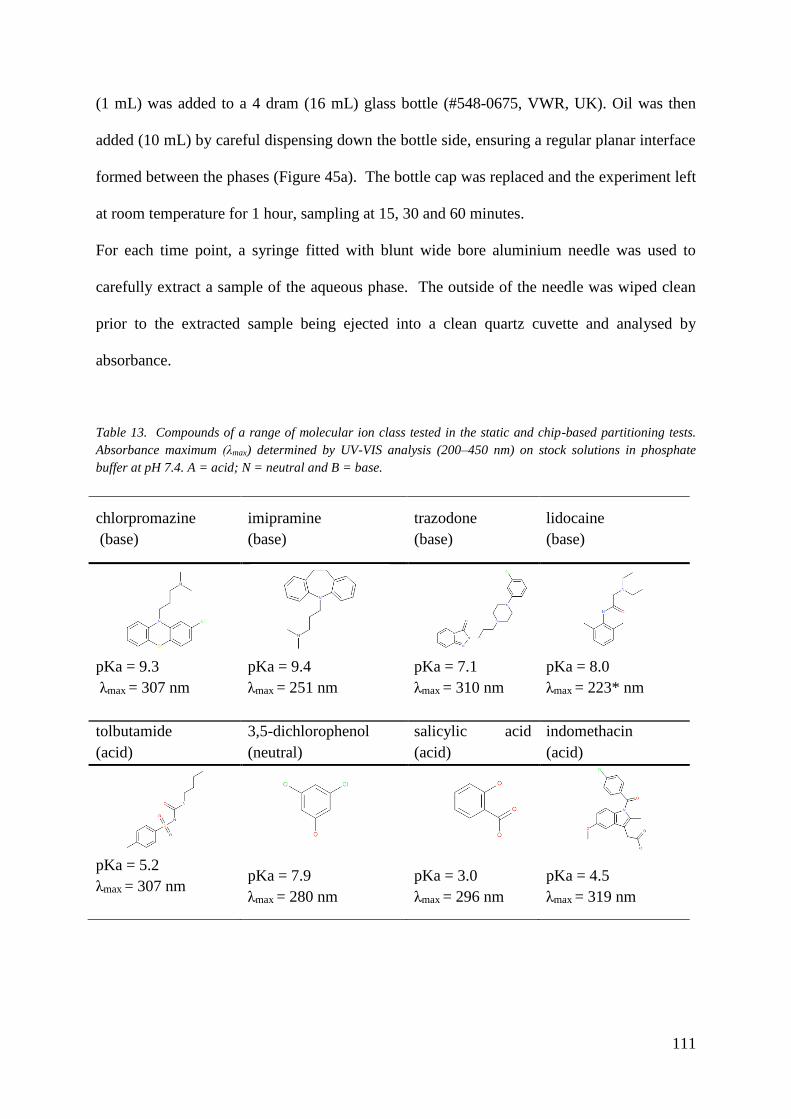
111
(1 mL) was added to a 4 dram (16 mL) glass bottle (#548-0675, VWR, UK). Oil was then
added (10 mL) by careful dispensing down the bottle side, ensuring a regular planar interface
formed between the phases (Figure 45a). The bottle cap was replaced and the experiment left
at room temperature for 1 hour, sampling at 15, 30 and 60 minutes.
For each time point, a syringe fitted with blunt wide bore aluminium needle was used to
carefully extract a sample of the aqueous phase. The outside of the needle was wiped clean
prior to the extracted sample being ejected into a clean quartz cuvette and analysed by
absorbance.
Table 13. Compounds of a range of molecular ion class tested in the static and chip-based partitioning tests.
Absorbance maximum (λmax) determined by UV-VIS analysis (200–450 nm) on stock solutions in phosphate
buffer at pH 7.4. A = acid; N = neutral and B = base.
chlorpromazine
(base)
imipramine
(base)
trazodone
(base)
lidocaine
(base)
pKa = 9.3
λmax = 307 nm
pKa = 9.4
λmax = 251 nm
pKa = 7.1
λmax = 310 nm
pKa = 8.0
λmax = 223* nm
tolbutamide
(acid)
3,5-dichlorophenol
(neutral)
salicylic acid
(acid)
indomethacin
(acid)
pKa = 5.2
λmax = 307 nm
pKa = 7.9
λmax = 280 nm
pKa = 3.0
λmax = 296 nm
pKa = 4.5
λmax = 319 nm

112
Figure 45. Schematic of static partitioning experiment for fluorous and non-fluorous carrier oils; (a)
arrangement for non-fluorous oils and (b) fluorous oil denser than aqueous phase.
For fluorous oil, the aqueous phase was added after the oil, as fluorinated oils are denser than
the aqueous phase (Figure 45b). From the initial results, time point data was plotted for each
drug in the best and worst oils in respect of partitioning.
3.3.9 Investigating the Impact of Surfactant on Partitioning
A comparison of the impact of surfactant on partitioning was made using PFO (10% v/v) and
AZF (2% w/w) surfactants, each dissolved separately into FC-70.
A solution of AZF in FC-70 (2% w/w) was prepared as described previously. Another
solution containing PFO (10%) was prepared by adding PFO (1 mL) to FC-70 (9 mL).
One tube for each drug solution was set up as previously described and left at room
temperature for 15 minutes before sampling and then again at 45 minutes. In addition, a t0
sample of each drug working solution was also sampled. All samples were analysed by UV-
VIS at the respective drug maximum absorbance (λmax) using a UV-2401 Shimadzu
spectrophotometer and low volume quartz cuvette of 1cm path length (0.7 cm3 volume).

113
3.3.10 Procedure for Partitioning Experiments Using AstraZeneca
Collection Library Compounds
An extended investigation into the possibility of compound partitioning to the oil phase was
conducted using a portion of the AZ compound collection library. In brief, the compounds
were selected from parts of the collection library known to have a wide range of chemical
diversity that would provide opportunity to study how much of an impact compound leakage
from droplets may have on biochemical assay.
1406 compounds were randomly selected from a sub-collection within the library frequently
used for routine assay validation purposes. The compounds were known to be stable and
having defined physicochemical properties, including; molecular structure, molecular mass
LogD, ClogP, pKa, number of rotatable bonds, number of fluorine atoms, polar surface area,
number of H-donors and number of H-acceptors. The available properties were hypothesised
to be helpful in defining correlation between solubility in the fluorous/non-aqueous phase.
The absorbance analysis approach used in the previous glass vial tests technique may limit
the choice of compounds to those having suitably strong chromophores. As some compounds
tested may not absorb readily, High Performance Liquid Chromatography Mass spectrometry
(HPLC–MS) was chosen to quantify samples from this set of experiments. Furthermore, the
HPLC–MS apparatus available at AZ was equipped with an autosampler to provide large
batch automated analysis. The majority of small molecule compounds found within the
pharmaceutical industry typically having masses between 200 and 700 Daltons are well
suited to Atmospheric Pressure Ionisation (API) mass spectrometry25,225,226. Table 14 details
the methodology applied for HPLC-MS analysis. Ian Sinclair (AZ) is acknowledged for his
assistance in running submitted samples.

114
Table 14. HPLC-MS analytical method used for rapid elucidation of aqueous partitioning experiment samples.
HPLC Method All HPLC separations were performed on an Agilent 1200 system utilizing two binary G1312B high-pressure gradient pumps connected, as has been previously
described in the literature227, with the solvent flow from pump 1 delivered through the auto-sampler and that from pump 2 delivered immediately after the separation
column. The typical solvent system was a combination of (A) HPLC grade water (Sigma–Aldrich, UK) containing 0.1% formic acid (Sigma–Aldrich, UK) and (B)
HPLC grade methanol (Sigma–Aldrich, UK) containing 0.05% formic acid (Sigma–Aldrich, UK).
Solvent was delivered from pump 1 at a flow rate of 700uL per minute with a composition at time zero of A=95% and B=5%, developing over a linear gradient such
that, after 2 minutes, B=100%, which was maintained for 0.5 minutes before being returned to starting conditions.
The solvent composition for pump 2 was delivered in exact opposition to that for pump 1 at all times, starting from A=5% and B=95% at time zero and traversing a
mirror-image gradient toward A=100% after 2 minutes, held for 0.5 minutes before being returned to starting conditions. The two streams were combined using a T-
piece after the separation column and, by this method, produced a constant 50:50 mix of A and B going forward, and thus minimized any solvent–related drift in signal
response. The separation column normally used was a 30x2mm Kinetex C18 3uM column (Phenomenex, Torrence, CA).
Peak Detection and Mass Spectrometry
The HPLC eluent was delivered through an Agilent G1315B diode array detector, scanning from 220–300nm at a rate of 5Hz, and then split between a single
quadrupole MS and a CAD.
Two configurations of MS systems were employed.
1. Agilent 6140 single quadrupole mass detector with G1367C well plate autosampler, G2255A well plate stacker, G1316B column oven and ESA Corona CAD
detector (ESA, Chelmsford, MA), and Agilent 35900E Analog to Digital Converter (ADC), all operating under Chemstation version B.03.01.
2. Waters ZQ quadrupole mass detector with integrated ADC, a CTC PAL autosampler (CTC Analytics, Switzerland) and an ESA Corona CAD detector, all
operating under MassLynx 4.0.
The corona discharge detector relied on droplet production and transformation into a particle beam, and was particularly sensitive to changes in solvent affecting the
size of the droplets, hence the careful control of post-column solvent composition. The particle beam was passed through a stream of charged nitrogen molecules where
charge was transferred to the analyte molecules contained within the droplets. The charge on these droplets was then detected via an electrometer, with a proportional
output acquired at a rate of 5Hz through the ADC. In this way a chromatogram was produced by plotting electrometer current against time.
The detector had an equivalent response for equal mass-per-volume concentrations of non-volatile analytes. The ratio of CAD peak area to sample molecular weight
was therefore proportional to the molar concentration of sample228.
The CAD detector was complementary to the DAD in that, in the main, it provided confirmation of the sample purity but could also provide information not available
from the DAD. This was particularly true when the sample structure did not absorb in the UV detection range, or where the sample was not retained on the
chromatographic column but was eluted in the solvent front along with its original solvent (normally dimethyl sulfoxide (DMSO)). In both of these cases, sample purity
was not measurable by the DAD and was assessed from the CAD alone. The two chromatograms produced were integrated within the respective operating systems of
the two instrument configurations and mass spectra, in both positive and negative ion modes, were produced for each detected peak. The processed data was passed into
our in house database where it could be reviewed and annotated as described in the literature229.

115
3.3.11 Testing AZ Compound Solubility
The 1406 compounds were first tested to determine which compounds were insoluble,
partially soluble or fully soluble in Phosphate Buffered Saline (PBS) solution (0.1 M) as this
was the aqueous phase representing the buffer that would be eventually used for the enzyme
experiments. Each compound was obtained from the AZ Compound Management Group as a
100 % Dimethylsulfoxide (DMSO) solution dispensed using an Echo acoustic dispenser
(Labcyte Inc., Sunnyvale, CA) to a polypropylene 384-well microtitre plate (500 nL)
(Greiner Bio-One, Stonehouse, UK). Each compound was present in 5 wells, with each
dispense being a different stock concentration. Phosphate buffered saline (PBS) solution was
added to the wells to dilute and generate standard curve solutions at 20, 40, 60, 80 and 100
μM. The plates were then sealed and left for 4 hours at room temperature prior to HPLC-MS
analysis, whereby the integrated peak area was recorded. Compounds having a linear
response across the full concentration range were flagged as soluble (S), those showing
partial linear response flagged partially soluble (PS) and those not having any mass peak
found at any concentration deemed not soluble (NS).
3.3.12 Partitioning Test – Round 1
FC-40 was chosen for the fluorous phase, which having a lower viscosity than FC-70 was
easier to pipette and settle in 384-well microtitre plates. Both oils were seen to perform
similarly in previous partitioning tests, and an assumption was made that data obtained using
this oil would rank similarly as FC-70 (both oils are perfluorinated aliphatic tertiary amines).
Stock solutions (500 nL, 10 mM) of compounds flagged as (S) and (PS) in the Compound
Solubility test were dispensed to flat bottom 384-well plates using an Echo acoustic
dispenser. Replicate compound set dispenses were made to provide independent samples of

116
each compound for time = 2 days (t2), time=4 days (t4) and time=0 (t0). Additional t0, t2
and t4 sets were also prepared for where FC-40 had AZF surfactant added (2% w/w).
PBS was added (50 µL) to each well to yield compound solutions at 100 µM, the plates
sealed with a gas impermeable foil seal and left for 3 hours at room temperature. After this
time, the plates were unsealed and FC-40 added (50 µL) to all plates, except the t0 plates. All
t0 plates and plates for subsequent t2 and t4 samples were resealed, briefly centrifuged to
settle the fluids and expunge air bubbles, and placed into an incubator at 37 °C, 98% relative
humidity.
On day 2, two sets of plates were removed from incubation, one for each where AZF was
absent and present in the FC-40. The plates centrifuged to remove any bubbles and the seals
removed. A PlateMate pipettor (Matrix Technologies, Hudson, NH) fitted with a 384 head
and 100 µL tips was used to pipette 40 µL aqueous samples from each well (t2 samples).
The samples were dispensed to fresh 384-well plates, sealed and submitted for MS analysis.
One set of t0 plates were also sampled to fresh plates and submitted for MS analysis. This
process was subsequently repeated on day 4 for t4 samples.
3.3.13 Partitioning Test – Round 2
Round 2 was identical in methodology to Round 1, except only t0 and t4 sample plates were
prepared. A Kohonen map230 process was used to help select compounds having a diverse
chemistry. A further 800 compounds were selected from other AZ compound libraries. As
access time to MS was limited, initial solubility experiments were not performed and rather a
commercial predictive model produced by ACD Labs (Toronto, Canada) was used to predict
aqueous solubility. Compounds having a predicted aqueous solubility at pH 7.4 of <80 µM
were excluded from the test.
117
3.3.14 Procedure for Predictive Partitioning Modelling
Following MS analysis and interpretation of the partitioning data from Round 1 and 2, a
model was developed in Pipeline Pilot (Dassault Systèmes, Cambridge, UK) using a
Bayesian231 pharmacophoric feature connectivity fingerprint (‘circular fingerprint”) approach
to predict solubility of compounds in the fluorous oil, based on molecular structure and
constituent atoms. For this, the rank ordering of compounds into ‘partitioning’ and ‘non-
partitioning’ categories was used to build training and test sets for the model. Compounds
that were observed to partition more than 50% in the fluorous oil were categorised as
partitioning. Recognising the potential for significant variability that may be associated with
HPLC-MS17,232, compounds having fluorous partitioning values of between -20 and 20%
were categorised as non-partitioning. Compounds having partition values of 20% to 50%
were initially excluded from the model to produce a separation between partitioning and non-
partitioning data sets. A script was run enabling each of the partitioning and non-
partitioning data sets to be randomly separated into 90% training 10% test sets for the model.
This was executed 5 times and an averaged model performance to be calculated. For each
iteration, the Pipeline pilot script was instructed to output a 'Receiver Operating
Characteristic' plot (ROC) which plots false positive rate (0 to 1) against the true positive rate
(0 to 1). In the event the model could accurately fit test compounds to the training set based
upon the parameters contained within the model (the 'circular fingerprint' analysis of
structure), the ROC curve was expected to generate a high value closer to 1, conferring a
good model fit.
To test the model, additional compounds were selected based on an output score. The output
score was labelled ‘Microfluid’. Positive numbers indicated a higher chance of partitioning
to the fluorous oil, whereas very low and negative numbers would be indicative of
compounds not likely to partition.

118
The model was applied across the whole AZ compound collection (~ 2 million compounds)
to generate a list containing the top score compounds having Microfluid scores >5. A similar
list was generated using the model in reverse to provide 10000 compounds not expected to
partition, having scores >–5. From each list, compounds were examined to determine
predicted aqueous phase solubility. Those having solubility <80 µM were excluded. 384
compounds (192 top and 192 bottom) were selected for inclusion in a third round microtitre
plate experiment to attempt validation of the predictive model.
3.3.15 Partitioning Test – Round 3
Round 3 was identical in methodology to Round 1 and 2. Compounds that were selected
from the output of the model after round 1 and 2 were run in round 3 and analysed to
determine if the experimental results were in agreement with the prediction of the model.
3.3.16 Procedure for in situ Chip Partitioning Experiments
The T-junction channel chips described previously were used to produce droplets of
approximately 250 µm diameter (~8 nL) providing on-chip droplet residence times of ~ 0
minutes and 13.5 minutes, respectively, when using an oil flow rate of 3.7 µL/minute.
Calibration plots of standard solutions of CHC metabolite were used to quantify the loss of
material from the aqueous phase by absorbance measurement and converted to a percentage
loss from the aqueous droplet.
Each chip was tested in turn with the outlet of the main channel terminated in a short length
of plastic tubing to collect droplets in a 0.5 mL Eppendorf vial. This vial was placed in ‘cup'
formed out of aluminium foil to which the high voltage power supply was connected.

119
Oil was flowed into the chips at 10 µL/min (without aqueous phase delivery) to purge air
from the channels. After 10 minutes, oil flow was stopped and the aqueous drug solution
loaded.
Figure 46. Chips used for chip-based droplet partitioning; (a) T-junction to provide 0 min droplet residence
time; (b) 13.5 min droplet residence time. Oil flow rate was 14 µL/min with a dispersed phase flow at 7 µL/min.
Droplets were collected in a 1.5 mL Eppendorf tube for 1.5 minutes (1) prior to subjecting the droplet emulsion
to a high voltage electric field (2) resulting in fusion of the droplets to a uniform layer above the carrier oil (3).
3–4 µL of this aqueous layer was rapidly sampled and analysed by UV-VIS on a Nanodrop Protein analyser.
The carrier oil phase was switched back on (3.7 µL/min) and the aqueous phase flowed (1
µL/min) until all air was expelled from the chip and a steady stream of droplets was achieved
prior to starting sampling. For both experiments, droplets were collected for precisely 1.5
+ 2-3 kV
1 2 3
Droplet emulsion
Aluminium foil shroud Oil phase
(a)
(b)
Coalesced droplet pool
(a)
(b)
+ 2-3 kV
1 2 3
Droplet emulsion
Aluminium foil shroud Oil phase
(a)
(b)
Coalesced droplet pool
(a)
(b)
Direction of flow
Direction of flow

120
minutes and the collected liquid subjected briefly to a 2 kV electric field inducing electro-
fusion of the collected droplet emulsion (Figure 46). Approximately 3 to 4 µL of pooled
droplet phase was available for sampling using a 10 µL positive displacement pipette. A sub-
sample of this (2 µL) was subsequently analysed on a Nanodrop protein analyser
(ThermoFisher, MA) for each drug tested by this method.
3.3.17 Procedure for Shake-Flask Experiment
As an orthogonal approach to determine unwanted partitioning of the substrate (CEC) or
metabolite (CHC), a modified shake-flask approach was used where intimate mixing of the
two phases was achieved by constant inversion19,212. The aim was to provide a much bigger
surface area between the two phases to determine if there was a marked increase or tendency
of either material to partition to the oil phase. To test the partitioning potential of CHC and
CEC over different time courses, working solutions were made (200 µM). CHC was
dissolved initially to a 1mM stock in phosphate buffer (0.1 M). As CEC had limited aqueous
solubility, it was dissolved to 400 µM in 100% ethanol and then diluted 1:1 with phosphate
buffer. The test comprised of two parts. Firstly, each solution was added to 2ml Eppendorf
tubes (1 mL); one containing 1 mL FC-70 + AZF (~2 % w/w) and another containing FC-70
alone. All tubes were constantly inverted for 5 minutes to provide thorough mixing of the
two phases. After this time the tubes were centrifuged for 1 minute and an aqueous sample
extracted from each tube. The samples were analysed by UV-VIS absorbance at the λmax for
each (CEC at 360 nm and CHC at 405 nm) on a Nanodrop protein UV-VIS
spectrophotometer.
Secondly, 0.2 mL and 1 mL CHC (200 µM) was added to fresh tubes containing 1 mL FC-70
+ AZF (2% w/w). The tubes were inverted for 5 minutes, centrifuged for 1 minute and a
121
small aliquot (15 µL) taken before resuming inversion for a further 10 minutes after which
time the tubes were centrifuges again and a final sample taken (15 µL). All samples were
analysed on a Nanodrop protein UV-VIS spectrophotometer.
3.3.18 Procedure for Labelling Proteins/Enzymes
A series of experiments were conducted to investigate the potential for proteins/enzymes to
undergo some form of adverse reaction or physical effect at the oil-droplet interface. Protein
behaviour at liquid-liquid interfaces have been described184,185 and discussed previously.
Given the potential for proteins to undergo non-specific binding events and/or conformational
change at such interfaces, it is perhaps not completely unexpected that such artefacts may
well effect the 1A2 P450 cytochrome employed in this research leading to an apparent loss of
enzyme activity and hence reduced reaction potential and metabolic output. Ideally, one
could measure the native fluorescence of the protein by measuring emission from
tyrosine/tryptophan residues within the protein structure. To achieve this, a suitable
excitation source at ~280 nm is necessary which was unavailable for this project. An
alternative approach was to fluorescently label the protein with a tag that can be excited by
longer wavelength light sources.
Casein (Sigma–Aldrich) and a protein (“Protein A”) supplied by AZ having a mass of
approximately 68 kDa were used as surrogate enzyme reagents. Although both were smaller
than the overall structure of a P450 cytochrome17 the assumption was made that, being
smaller, either material would have greater mobility and hence migrate to the interface more
quickly, enabling any droplet surface interactions to be studied over a shorter time period.
Furthermore, the structure of Protein A and casein were known, which allowed a more
deterministic view of fluorescent labelling success. A fluorescein isothiocyanate (FITC)

122
labelling kit (ThermoFisher) was used to prepare buffer solutions of fluorescent FITC-tagged
Protein A and casein to be prepared. This kit also included dye removal columns to ensure
no unbound fluorescent tag was present in the labelled protein solutions.
Kit instructions (see Appendix A) were followed using Protein A and casein at 2 mg/mL.
Absorbance measurements were taken at 495 and 280 nm to determine the extent of
fluorescent labelling (F/P ratio) as defined by Equation (29).
Molar F/P = 𝑀𝑊
389.
𝐴495 195⁄
𝐴280−[(0.35×𝐴495)] 𝐸2800.1%⁄
(29)
Where MW is the molecular mass of protein; 389 is the molecular mass of FITC
label, 195 is the absorption 𝐸2800.1% of bound FITC measured at 490nm pH 13.0; 0.35
x A495 is the correction factor due to absorbance of FITC at 280 nm.
3.3.19 Procedure for Determination of Droplet Labelling Ratio
A reservoir droplet chip was designed and fabricated from clear PMMA (Figure 47) to allow
many droplets to be collected and observed in a concentrated area in the chip. After flowing
droplets into the reservoir until nearly full, the pumps were turned off and the pressure
allowed to equilibrate across the chip prior to taking epifluorescent and laser scanning
confocal images of droplets in the chip. Epifluorescence and laser scanning confocal
microscopy were conducted at an excitation wavelength of 405 nm. Epifluorescence images
were acquired through the eyepiece (afocal imaging233) using a webcam. In the case of laser
scanning microscopy, a careful balance between high enough excitation power and
acquisition time to avoid fluorescence bleaching was necessary to obtain useful data. Focal
plane slices through the droplets at 8 µm intervals were used to assess the variation of
fluorescence relative to the droplet perimeter wall.

123
Figure 47. Reservoir chip used to observe droplets under a confocal laser scanning microscope. The large
reservoir channel area has the same depth of 250 µm as the other channels. The expanded area (A) slows the
linear fluid flow rate through the chip resulting in slow-moving, close-packed droplets.. Aqueous inlets (B and
C) were used to supply protein solution to the chip. The central area between the four elongated supports was
used for microscopy image collection.
A stock solution of fluorescein in phosphate buffer at pH 7.4 was prepared and diluted to a
similar concentration as the FITC label present in 2mg/mL protein solutions (~1 µM). This
enabled comparisons of fluorescence to be made at the same optical magnification and gain
settings during acquisition of epifluorescent and laser scanning data. Epifluorescent droplet
data was interrogated using ImageJ software to assess pixel intensity across the droplet
diameter. Both FITC-labelled Protein A and FITC-labelled casein were tested.
3.3.20 Procedure for Blocking Enzyme Adsorption at the Interface
The concentration of enzyme typically used in such P450 studies is very low. The method
previously described in this work follows a methodology commonly used within AZ where
the final incubate P450 enzyme concentration is only 10 nM. At this level, microtitre plate-
based experiments have been observed to work2,28,36. A droplet of ~14 nl volume has a
diameter of 300 nm and a corresponding surface area of 282 nm2. At 10 nM, there are 6.022
(A)
800 µm ‘Reservoir Chip’
(B) (C)
Direction of flow

124
× 1015 molecules, thus in a droplet volume of 14 nL with surface area of 282 nm2 (high
surface area to volume ratio), it follows that there is ample opportunity for a vast majority, if
not all of the molecules to rapidly localised/bound at the droplet surface. Compared to a 96
well plate where the surface area might be 190 mm2 and volume of liquid 200 µL (low
surface area to volume ratio) molecules in the liquid are less likely to saturate the surface
quickly. If a substantial number of enzyme molecules diffuse to the droplet interface and are
then subsequently made inactive, either through conformational change or other steric
interference effect, it follows that insufficient active enzyme may then reside within the
droplet for reaction with the substrate. To investigate this possibility, blocking proteins were
titrated at high concentration to the normal P450 enzyme-substrate mixture and the metabolic
fluorescent signal observed to see if an increase in signal corresponded to an increase in
blocking protein concentration. An increase in signal would then suggest that protein is
successful in blocking the artefact effects that may lead to reduced signal.
Three blocking proteins were investigated; casein, gelatin and bovine serum albumin (BSA).
In each case, the blocking proteins were made up to 50, 500 and 1000 µg/mL in phosphate
buffer (0.1 µM) and the required quantity of 1A2 enzyme and substrate stock added (Table
15).
Table 15. Proteins used in blocking experiments.
Blocking Protein (5 mL total final volume)
Casein BSA Gelatin
Approx. wt. (kDa) 23 67 95
Stock conc. (mg/mL) 5 5 5
Final conc. (µg/mL) 50 500 1000 50 500 1000 50 500 1000
Volume to add (µL) 50 500 1000 50 500 1000 50 500 1000

125
Each solution of blocking protein was tested for its impact on droplet formation prior to
replicate incubation (n=3) in a 384-well microtitre plate as previously described at 6 and 13.5
minutes. Fluorescence was measured on a Tecan Infinite 200 plate reader (Tecan UK, Theale,
UK). The identical test for each concentration of blocking protein was then repeated in the
Spiral chip to determine the effect each blocking protein had on the fluorescent signal.

126
4 Results and Discussion: DROPLET FORMATION
The first consideration for the translation of any assay process, and indeed any attempt to
quantify the issue of partitioning and leakage of material from aqueous droplets to the oil
carrier phase, is to determine the conditions best suited to form stable droplets under
controlled conditions. This section considers the results for a range of conditions tested to
understand the best oil selection to use for stable droplet production. Droplet reproducibility
was assessed by a combination of optical imaging and PMT output using a concentration
curve series of CHC solutions. Accurate and precise droplet formation and analysis is
essential to enable correct measurement of the miniaturised P450 cytochrome inhibition
discussed in subsequent chapters.
4.0.1 Droplet Formation and Linearity
Of the neat oils tested for droplet formation, only octanol and olive oil formed reproducible
droplets free from aqueous phase wetting of the chip (Table 16). Neat fluorous oils did not
readily produce droplets, but rather resulted in parallel laminar flows of oil and aqueous
phase through the main channel at all flow rates tested. Dodecane did not produce droplets
under any of the flow conditions tested. PDMS produced droplets that were erratic and not
stable with a tendency to 'stick' to the channel walls.
The higher viscosity of olive oil3 required lower oil flow rates to produce droplets and also to
ensure the chip seal was not ruptured from high back-pressure. Fluorocarbon oils containing
10% perfluorooctanol produced stable droplets readily, although they were observed to merge
upon contact. Concentrations of PFO at 1% did not reliably form droplets in FC-40 or FC-70.
FC-70 with AZF (2% w/w) produced droplets that were stable for at least four hours.

127
Droplet production frequency was higher for lower viscosity oils, which is to be expected
from the impact of surface tension discussed previously and reported work on droplet
formation (as discussed in chapter 1).
Table 16. Droplet formation using various oils in the T-junction chip.
Carrier Oil (100%) Droplet
Production Droplet formation stability
Olive oil yes very good†
Polydimethylsiloxane (PDMS) erratic erratic‡
Octanol yes very good†
Dodecane no* -
Hexadecafluorodimethylcyclohexane no* -
Perfluorodecalin no* -
perfluoroperhydrophenanthrene no* -
FC-40 no* -
FC-70 no*
FC-40 with PFO (10% v/v) or AZF (2% w/w) Yes very good
FC-70 with PFO (10% v/v) or AZF (2% w/w) Yes very good
†Aqueous flow: 3 µL/min; oil flow 7 µL/min
‡Aqueous flow: 2 µL/min; oil flow 8 µL/min
* Where droplet formation did not occur, or was poor, pronounced wetting out of the chip occurred leading to
laminar streaking of the dispersed phase over the range of oil and aqueous flow rates tested.
FC-70 fluorocarbon oil with surfactant (either PFO (10% v/v) or AZF (2% w/w)) produced
droplets easily without wetting out the chip material. This was confirmed by frame analysis
of a section of video capturing droplet formation, such as that depicted in Figure 48. Here,
the transition from emerging bulge of aqueous phase (Figure 48a) to free droplet in the main
channel (Figure 48c) can be seen. Importantly, there is no evidence of the aqueous phase
smearing or leaving aqueous residue adhered to the channel wall or junction. This suggested

128
the conditions for droplet formation were optimised in respect of channel geometry, oil type
and flow rate of oil and dispersed phase for this design of T-junction and experiment.
Figure 48. An example of correct droplet formation where no aqueous wetting of the main channel occurs; (a)
the droplet emerges from the aqueous inlet; (b and c) no evidence of aqueous phase left behind (from wetting
out of the chip) at the junction or adjacent channel wall.
Figure 49. Droplet reproducibility as determined by optical observation using a video camera. Six frames
cover the emergence of a new droplet formed at the T-junction. All droplets demonstrated very similar size and
shape, indicating a high degree of formation precision. The detail image depicts a droplet (highlighted yellow)
chosen for analysis in ImageJ. By scaling against the known width of the channel (300 µm) and applying this in
ImageJ, the droplet 'length' may be determined. By repeating this for a number of consecutive droplets, it is
possible to calculate variance of droplet size and hence volume by observing changes in the droplet dimension.
300 µm
(a) (b) (c)
Direction of flow
Direction of flow

129
Table 17. Droplet reproducibility as determined by manually fitting perimeter guides to droplet images in
ImageJ using the known channel width as a calibration guide. The results suggest the method is reasonably
precise yielding a low deviation across 31 consecutive droplets, however, the subjective nature of fitting
measurements to image pixels that may be affected by optical artefacts may question the accuracy of this
method.
Droplet Droplet Area (sq. mm) Circumference (mm) Diameter
(mm)
Volume
1 0.08 0.98 0.312 0.016
2 0.08 0.97 0.309 0.015
3 0.09 1 0.318 0.017
4 0.09 1.08 0.344 0.021
5 0.09 1.05 0.334 0.020
6 0.08 1.04 0.331 0.019
7 0.09 1.05 0.334 0.020
8 0.09 1.04 0.331 0.019
9 0.07 0.93 0.296 0.014
10 0.06 0.85 0.271 0.010
11 0.08 1 0.318 0.017
12 0.08 1.02 0.325 0.018
13 0.08 1.03 0.328 0.018
14 0.08 0.99 0.315 0.016
15 0.08 0.99 0.315 0.016
16 0.07 0.95 0.302 0.014
17 0.07 0.94 0.299 0.014
18 0.08 0.97 0.309 0.015
19 0.08 1.02 0.325 0.018
20 0.07 0.92 0.293 0.013
21 0.08 0.99 0.315 0.016
22 0.07 0.95 0.302 0.014
23 0.09 1.02 0.325 0.018
24 0.09 1.06 0.337 0.020
25 0.08 0.99 0.315 0.016
26 0.09 1.05 0.334 0.020
27 0.08 0.98 0.312 0.016
28 0.08 1.02 0.325 0.018
29 0.08 0.98 0.312 0.016
30 0.08 0.99 0.315 0.016
31 0.09 1.08 0.344 0.021
Avg. 0.08 1.00 0.318 0.017
SD 0.008 0.050 0.016 0.002
% CV 9.6 5.0 5.0 15.0
Two methods were used to assess droplet reproducibility. The first involved recording a
video segment of droplet formation and using image frame analysis in ImageJ to determine
droplet dimensions. Figure 49 depicts six contiguous frames captured during stable droplet

130
production. The detail box indicates the area of each frame interrogated in ImageJ. The X-Y
dimensions of the droplets were found by scaling against a known dimension (channel
width). Table 17 summarises the results obtained from 31 consecutive droplets sized by this
method of droplet interrogation.
All droplets appeared to be of a similar size, however, this method proved relatively
unreliable as there was an inherent subjective inaccuracy when selecting pixels in the image
representing the periphery of the droplet or channel. For example, as highlighted in the detail
box of Figure 49, the droplet edge is difficult to determine accurately due to refractive
artefacts of the incident light making the exact dimensions of the droplet indicated by the red
arrows harder to discern. This approach may have been more successful by using a camera
of higher resolution and/or magnification, which was not available for these experiments.
The precision of droplet volume calculated by this approach was found to be fairly low at
15% CV.
The second method to assess droplet reproducibility used spectroscopy. The data obtained
describe the variability of signal between adjacent droplets of identical composition. These
data were acquired from the data logger, and, when plotted, rendered a Gaussian-shaped peak
similar to that depicted in Figure 50. Baseline integration algorithms in Origin provided a
means to quantify peak heights and calculate peak areas. Although this technique was unable
to directly measure droplet physical dimensions, it was possible to correlate the signal for
each droplet to its properties. The (known) droplet concentration was related to the peak
height and the peak width corresponded to the transition time of the droplet, from which the
width could be determined.

131
Figure 50. Example of peak data acquired from logger. Droplets are represented as Gaussian-shaped peaks
when the acquired logger data is plotted. Peak leading and trailing edges correspond to the leading and
trailing 'sides' of a droplet as it passes through the detection zone. Peak height correlates to the concentration
of analyte within the droplet, as measured by PMT output voltage, V, whereas peak width is primarily
representative of the droplet width passing through the detection zone measured in seconds, T.
Variations in peak height and peak width described the overall variation seen between
droplets. For a given flow rate, smaller droplets would pass through the detection zone more
quickly resulting in smaller peak widths. Conversely, larger droplets had a wider peak shape.
In both cases, peak height was seen to vary less than the calculated peak area (Table 18). As
peak height is proportional to the PMT output, which is in turn proportional to the analyte
concentration, under steady droplet formation and flow conditions (as shown earlier in the
droplet formation experiments) the analyte concentration in each droplet was not expected
vary. Peak area is reliant on an accurate baseline and good peak resolution for accurate
integration, which may be more variable given the baseline noise seen in some of the data
plots (Figure 52) which deteriorates as the signal to noise ratio decreases. Positional
variation of a droplet within the channel and/or alignment of the detection apparatus may also
contribute to droplet signal variance. Figure 52 shows excerpts (~10 s) of the data acquired
0
0.2
0.4
0.6
0.8
1
1.2
1.4
1.6
1.8
2
0.000 0.100 0.200 0.300 0.400 0.500
V
Time (s)
Droplets of CHC (1 µM)
Trailing edge Leading edge

132
for each concentration as plotted and integrated in Origin. Firstly, a baseline detection was
performed to account for any baseline offset (electronic background signal) and to provide a
starting point for peak detection (detected peak maximums were automatically highlighted by
a red cross by the Origin peak identification algorithm). Following peak detection, peak area
integration was performed.
Table 18. Variability associated with different concentrations of CHC in the T-junction chip.
Conc.
(µM)
Mean Pk Ht.
(std. dev.) %CV
Mean Pk. Width
@ half ht. (std. dev.) %CV Time (s) n
0.05 0.06 (0.01) 9.19 68.19 (11.93) 17.49 84.5 252
0.5 0.75 (0.05) 6.10 44.57 (8.27) 18.56 101 204
1 1.65 (0.11) 6.72 37.53 (3.72) 9.92 106 235
By performing the aforementioned droplet variability tests at different concentrations, it was
possible to obtain an indication of linearity. Figure 51 shows the correlation of the three
concentrations tested and the means shown in Table 18. For both peak height and area
linearity was excellent, both with a correlation co-efficient above 0.9, suggesting there was
little or no signal bias dependant on concentration across the range tested.

133
Figure 51. Three serially diluted solutions of CHC were run through the chip and quantified. A linear fit was
obtained over the dynamic range investigated, as indicated by R2 > 0.9. With reference to Table 18, variability
was well controlled with peak height variability ranging 7– 9 % (where number of droplets, ~n=230).
Corresponding variability determined by peak area calculation exhibited a similarly good fit.
y = 59.659x - 0.7949
R² = 0.9997
0.00
10.00
20.00
30.00
40.00
50.00
60.00
70.00
0 0.2 0.4 0.6 0.8 1 1.2
Pk.
Are
a
Concentration (µM)
CHC Droplets: Peak Area
Peak Area
Linear (Peak Area)
y = 1.6803x - 0.0493
R² = 0.9981
0.00
0.20
0.40
0.60
0.80
1.00
1.20
1.40
1.60
1.80
2.00
0 0.2 0.4 0.6 0.8 1 1.2
Pea
k H
eight
(V)
Concentration (µM)
CHC Droplets: Peak Height
Peak Height
Linear (Peak Height)

134
(a) 1 µM CHC (b) 0.5 µM CHC
(c) 0.05 µM CHC
Figure 52. Excerpt droplet data covering 10 seconds of acquisition time for 1, 0.5 and 0.05 µM CHC. In (b),
the sixth detected droplet is much smaller than all other droplets in this series. This is most likely to be due to
an erroneously small droplet that did not pass through the detection zone correctly and hence did not result in
the same RFU output. Notably in (c), the signal to noise ratio has decreased, signified by the relative increase
of baseline noise apparent. As baseline noise increases, it becomes harder to accurately integrate each peak
and hence overall variation is seen to increase.
There is nothing apparent in the data to suggest detector saturation at the maximum
concentration used in this test (this would be evident from a pronounced decrease in response
0 2000 4000 6000 8000 10000
0
2
RF
U
Time (ms)
0 2000 4000 6000 8000 100000.00
0.25
0.50
0.75
1.00
RF
UTime (ms)
0 2000 4000 6000 8000 100000.06
0.07
0.08
0.09
0.10
0.11
0.12
0.13
0.14
RF
U
Time (ms)

135
with increasing analyte concentration), thus the particular detector setup was deemed accurate
for conducting the cytochrome P450 inhibition assay described previously. It was not
possible to adjust the beam width of the excitation light, other than to bring it into focus
which resulted in a spot of light over the detection channel of 0.5–1 mm diameter.
4.0.2 Dual Aqueous Input Electro-Fusion T-junction Chip
The dual aqueous chip having opposing aqueous phase inlets was investigated to assess how
suitable this would be as a means to introduce the two solutions that would ultimately be
required in the miniaturised droplet P450 cytochrome inhibition assay, that is, the enzyme-
substrate and NADPH solutions. The success of this approach relied upon the principle of
electrofusion to induce rapid coalescence and mixing of the reagent droplets from the
opposing T-junctions. In this process, it was essential that reagent concentrations in the
subsequent reactant droplet remained consistent to obtain useful results.
The binary inlet chip produced reproducible droplets when using fluorocarbon oils containing
10 % PFO. Hydrodynamic coupling between the two inlets resulted in alternating droplet
formation from each aqueous inlet, giving droplet pairs slightly spaced apart. Slight
differences in channel geometry were considered responsible for the volume difference seen
between droplets produced from either side of the chip (Figure 53). Whilst this did not
present a major problem, as the supplied reagent concentration could be adjusted to
compensate for differing droplet volumes, critically, when voltages over the available range
of 100–1000 V were applied to the dispersed phase inlets the expected droplet coalescence
did not occur. Possible explanations for the lack of droplet fusion included the gap between
droplets being too large, insufficient charge imparted to the droplets, or too much surfactant
having the effect of over-stabilising the droplets. Attempts to reduce surfactant concentration

136
led to difficulties in forming droplets (as seen before in the single aqueous input T-junction
chip) with linear streaking resulting from wetting out of the chip by the aqueous phases.
Figure 53. Binary aqueous input chip. In this single frame image taken from a video clip, although the droplets
produced by both inlets appear reproducible, hydrodynamic coupling between the inlets results in alternate
droplet formation from the inlets. Application of a voltage potential (100–1000 V) via connection to the inlet
electrodes did not result in reliable droplet coalescence. Small channel geometry differences and an imbalance
of flow rates was suggested by differing droplet volumes between both sides of the channel.
Attempts to change droplet spacing by altering the ratio of dispersed phase and oil flow rates
resulted in substantial changes in droplet size which destabilised the whole flow regime and
resulted in erratic droplet formation and also wetting out of the chip.
Electric field-induced droplet fusion by the method demonstrated by Raindance
Technology186 may be a better approach; an expanded channel region downstream of the
droplet pairs would enable droplets to move closer, facilitating electro-fusion, however the
spacing of droplet pairs and the overall frequency of droplet production would need careful
adjustment to ensure correct droplet fusion. As the correct conditions for the binary inlet
electro-fusion chip were difficult to determine, further work on this was abandoned in favour
of the dual input Y-junction type chips described in chapter 3 ('Spiral' and 'Serpentine' chips).
These were seen to provide more controllable droplet formation.
Direction of flow

137
4.0.3 Surfactant CMC Determination by Dynamic Light Scattering
As part of the droplet formation investigations, the use of the AZF material at 2% w/w was
successful in yielding stable droplets as described earlier in this chapter. As discussed in the
introduction, use of fluorosurfactants of the PFPE type, at concentrations in the 1–2 % w/w
range, has been described in the literature. A useful means of assessing a surfactant is to
consider its Critical Micelle Concentration (CMC), describing the point at which surfactant
monomers spontaneously form micelles. As described earlier, the formation of micelles may
have a role in the transport of material between phases. This section is thus included here
ahead of the following chapter concerning the partitioning of material from the droplet to the
oil phase to help understand the role fluorosurfactant may have on droplet leakage.
Figure 54 shows a plot of backscatter count (kilo counts per second) against concentration of
AZF fluorosurfactant. Between 0.5 % w/w and 0.75 % w/w, there was a subtle ‘knee’ having
a different count-concentration relationship, seen as a change in the slope. Fitting linear
regression plots to both halves of the data set reveals high R2 values, suggesting a good fit to
the data. The 'knee' may be evidence of the CMC or other complex aggregation event of the
fluorosurfactant monomers, however is not wholly conclusive given the limited number of
concentration points tested and subtlety of the inflection. The large molecular mass of the
AZF fluorosurfactant may imply a different CMC and micelle structure when compared to
the conventional low molecular weight surfactant molecules234,235.

138
Figure 54. Plot of kcps vs. concentration reveals a knee point between 0.5 %w/w and 0.75 %w/w. If not the
CMC, this may be a concentration where other surfactant molecule aggregation events have occurred giving
rise to a change in the number of scattering events observed at 90°.
4.1 Summary & Conclusions
4.1.1 Droplet Formation and Linearity
In respect of droplet formation, several of the oils tested showed potential to readily form
droplets in the T-junction chip described. Fluids having a degree of polarity such as octanol
and olive oil were able to form droplets readily without the addition of surfactant, whereas
dodecane and DC200 silicone oil either did not produce droplets or were erratic at best under
the conditions tested. Fluorous oils required the addition of surfactant to yield very
reproducible droplets.
y = 90.673x - 2.179
R² = 0.9997
y = 59.159x + 6.0182
R² = 0.9976
-100
-50
0
50
100
150
200
250
300
350
400
-1 0 1 2 3 4
Par
ticl
e E
ven
ts (
kcp
s)
AZF concentration (% w/w)
upper
lower
Linear (upper)
Linear (lower)

139
When testing standard CHC solutions, variability of the droplet signals obtained were
acceptable being at approximately < 10 % and only increasing above this value at lower
concentrations, which was expected from a decreased signal-to-noise ratio. For each CHC
solution tested, the concentration in each droplet had to be equal, thus the variation seen must
be attributable to subtle changes in droplet dimensions and relative position of the droplet in
the channel, or fluctuations in the signal acquired from the PMT. Analysis of the data
suggested that the chip construction and fluid delivery methods outlined in the experimental
are appropriate for conducting the PoC droplet microfluidics described in this project.
4.1.2 Dual Aqueous Input Electro-fusion
The chip was able to produce regular reproducible droplets alternatively from each aqueous
input, however all attempts to merge using an applied voltage did not result in droplet-pair
coalescence. This was thought to be due to either over-stabilisation with surfactant or that
insufficient electrical charge was imparted to the droplets. As in situ droplet merging may
add to the overall variability, it was decided this approach should not be pursued further and
rather focus effort on adding multiple reagents to the chip via multi-junction channels
allowing mixing of reagents immediately prior to droplet generation.
4.1.3 Fluorosurfactant CMC Determination
Using DLS to obtain an accurate measure of the CMC for the custom fluorosurfactant proved
challenging. Results possibly revealed an aggregation event, evidenced as a change in the
slope of the count to concentration plot (Figure 54) occurring between 0.5 % w/w and 0.75 %
w/w AZF. However, the deflection is very small and could be due to artefacts other than the

140
formation of micelles. Previous work has used PFPE type fluorosurfactants at 1–2% w/w176.
If the data presented here correctly identified the CMC, this would imply the use of AZF at a
concentration above the surfactant CMC when added to the fluorous oil at 2% w/w. In this
case, large numbers of micelles and/or aggregate structures could exist in the oil phase. As
discussed in the next section, large numbers of micelles could be a possible explanation for
observed partitioning, for reasons similar to those reported by Baret62, Chen59, Courtois60 and
Debon63.

141
5 Results and Discussion: COMPOUND PARTITIONING
This chapter relates to the issue of material leakage from the aqueous droplet to carrier phase
discussed from pg. 27 and describes how this impacts on the miniaturisation of the P450
cytochrome inhibition assay explored in a later section. For a droplet microfluidic screening
assay to be successful and quantifiably useful, it is essential any loss of reagent from one
phase to another is either mitigated through prevention or by understanding the rate or finite
amount that may be lost over a known period of time under known assay conditions.
The following four sections consider the results from; (i) glass vial tests for a range of
compounds in different oils; (ii) the same range of compounds using fluorous oil with and
without surfactant, and; (iii) a relative comparison of the partitioning kinetics observed for
the same compounds using the oils with the greatest and lowest extent of partitioning.
5.0.1 Partitioning from Aqueous Phase to Oil Phase (Glass Vial Tests)
For each of the nine oils tested, the percentage loss was calculated based on normalisation of
the aqueous sample against the initial absorbance data collected for the drug tested.
The percentage loss from the aqueous to oil phase seen across an unstirred interface for each
of the eight drugs tested in different oils was recorded (Table 19). Darker shading represents
a higher percentage loss from the aqueous droplet to oil.
Partitioning was observed to generally increase as the lipophilicity of the compound and
polarity of oil used increased. Thus partitioning was thus seen to be more significant for
compounds having higher logD and when octanol (relatively high polarity) was used as the
oil phase. Fluorocarbon oils showed the lowest partitioning, which being highly hydro- and
oleo- phobic, it was expected that materials would not readily dissolve in these oils.
Compound LogD was observed to have no appreciable effect on partitioning into the fluorous

142
phase. FC-70 marginally demonstrated the lowest partitioning for any of the compounds
tested.
Table 20 details the results for the eight drugs tested in FC-70 using either PFO (10% v/v) or
AZF fluorosurfactant (2% w/w) with a control of neat FC-70 (15-minute data available only
due to lack of samples at the time of assay). Similar data highlighting the loss to the oil phase
was obtained using both surfactants individually and it is notable that basic drugs were
affected more than acidic compounds. Of the compounds tested, none were shown to
partition readily to the fluorous phase alone, which was expected due to the hydro- and lipo-
phobic nature of fluorocarbon fluids. However, for some compounds, particularly those that
remain largely unionised at pH 7.4, a substantial increase in partitioning was observed when
surfactant was added to the oil phase. This observation suggested that transport mechanisms
other than free diffusion could account for the passage of material from aqueous to oil phase,
as has been discussed in respect of droplet leakage work by Chen59, Courtois60 and Baret62.
From the first test in this section, partitioning was greatest with octanol, and the lowest with
FC-70 for most of the compound set. Figure 55 depicts the relative rate of loss from the
aqueous phase to FC-70 and octanol. Data is normalised to the t0 concentration in the
original aqueous samples prior to testing. In the case where total partitioning to the oil phase
is seen to be substantial, the initial fast rate of partitioning slows rapidly which may be due to
the concentration of material on either side of the liquid-liquid interface approaching
equilibrium.
This data is relevant for a number of key reasons. Although partitioning is seen be rapid for
some compounds in some oils, assuming chemical reactivity is not a problem and droplet
formation is reproducible, other oils can still be used for droplet studies. In some cases, such
as designing microfluidic logD assays where movement between phases would be required,
partitioning could be used to advantage.

143
Table 20. % Loss of each drug from the aqueous phase to oil phase with and without PFO and AZF surfactants
present over a total of 45 minutes for a static planar interface. pKa data from www.drugbank.ca.
% Loss to oil (+ surfactant)
Ion
Class
pKa time FC-70 + 10% PFO FC-70 + AZF (2% w/w)
FC-70
alone
chlorpromazine B 9.2 15 55 57 3
45 65 68 -
trazodone B 7.09 15 9 13 11
45 16 30 -
imipramine B 9.2 15 10 15 0
45 19 27 -
lidocaine B 7.75 15 10 7 0
45 32 20 -
3,5-DCP N 8.27 15 81 81 0
45 82 83 -
indomethacin A 3.8 15 4 4 4
45 5 6 -
tolbutamide A 4.33 15 0 0 0
45 0 0 -
salicylic acid A 2.97 15 0 0 0
45 0 0 -
The increase in partitioning observed for some compounds when using fluorosurfactants in a
fluorous oil (necessary to produce stable droplets as seen in chapter 4) presents a challenge of
how best to mitigate the effect. Furthermore, the small set of compounds used in the tests
reported thus far, whilst offering some chemical diversity, are not wholly representative of
the vast range of chemical diversity that would be encountered in drug discovery screening.

144
Table 19. Static interface partitioning percentage loss from the aqueous phase determined by absorbance for a range of compounds where no surfactant is present in the oil
phase. Ion is B = base, N = neutral and A = acid. Data is normalized to t0 absorbance. Darker shade relates to a higher percentage loss from the aqueous phase. Included
is comparative data for FC-70 where a pronounced increase in partitioning of basic compounds was seen when using surfactants in the oil phase. 15, 30 and 60 minute time
point data is shown. Each drug was tested in each oil once. For surfactant tests, the time points were at 15 minutes and 45 minutes.
% Loss to oil (no surfactant)
10%
PFO
2% w/w
AZF
Ion
Log
D
Time
(mins) DOD OCT PDMS
Olive
oil
PFP-
HP PFD
HDFD-
MCH FC-40 FC-70 FC-70 FC-70
Chlor-
promazine B 3.36
15 51 70 32 70 0 14 15 13 3 55 57
30 60 80 39 77 13 17 17 14 9 65 68
60 72 89 53 79 25 23 25 17 13
Trazodone B 2.64
15 21 71 7 25 17 6 6 5 11 9 13
30 38 73 10 29 16 6 6 6 15 16 30
60 53 79 24 47 24 7 6 6 4
Imipramine B 2.49
15 30 53 10 20 17 6 2 3 0 10 15
30 39 67 13 35 13 6 2 3 0 19 27
60 44 85 41 64 0 7 2 4 8
Lidocaine B 1.62
15 0 0 0 0 2 1 0 0 0 10 7
30 0 0 0 0 0 0 0 0 0 32 20
60 1 1 0 0 1 0 0 0 0
3,5-DCP N 3.58
15 11 79 12 63 32 2 0 0 0 81 81
30 19 88 28 76 34 3 0 2 0 82 83
60 33 91 55 78 32 5 0 4 3
Indomethacin A 0.95
15 3 49 3 4 1 5 5 4 4 4 4
30 3 61 3 7 5 4 6 4 9 5 6
60 2 84 3 11 10 5 5 5 13
Tolbutamide A 0.43
15 0 1 0 0 6 0 1 0 0 0 0
30 1 1 0 0 0 1 0 1 0 0 0
60 1 2 0 0 0 - 0 0 -
Salicyclic
acid A -1.43
15 0 0 0 0 0 2 0 0 0 0 0
30 0 0 0 0 2 1 0 0 0 0 0
60 0 0 0 0 - 1 0 0 0

145
Figure 55. Rate of loss from the t0 drug solutions in octanol and FC-70 oil phases (no fluorosurfactant).
Partitioning is observed to be greater for most of the compounds tested when using octanol, possibly resulting
from higher phase polarity and the molecular ionisation state of the compound in question. Where partitioning
is observed to be substantial, the partitioning rate is initially fast, appearing to reduce over later time points.
This is thought to be due to a reduction in free diffusion across the liquid-liquid interface as the drug
concentrations on either side of the boundary move towards equilibrium.
0
40
80
120
0 15 30 45 60
% t
0
Timepoint (mins)
Chlorpromazine
Octanol
FC-70 0
40
80
120
0 15 30 45 60
% t
0
Timepoint (mins)
Imipramine
Octanol
FC-70
0
40
80
120
0 15 30 45 60
% t
0
Timepoint (mins)
Trazodone
Octanol
FC-70 0
40
80
120
0 15 30 45 60
% t
0
Timepoint (mins)
Dichlorophenol
Octanol
FC-70
0
40
80
120
0 15 30 45 60
% t
0
Timepoint (mins)
Indomethacin
Octanol
FC-70 0
40
80
120
0 15 30 45 60
% t
0
Timepoint (mins)
Salicylic acid
Octanol
FC-70
0
40
80
120
0 15 30 45 60
% t
0
Timepoint (mins)
Lidocaine
Octanol
FC-70 0
40
80
120
0 15 30 45 60
% t
0
Timepoint (mins)
Tolbutamide
Octanol
FC-70

146
5.0.2 AstraZeneca (AZ) Library Compounds
This section concerns the further investigation of compound partitioning from aqueous to
fluorous oil phase for a much wider chemical diversity, randomly sub-sampled from the AZ
compound collection library. This was intended to provide a more informed view as to the
extent of partitioning that might be expected when using droplet microfluidics. The final part
of this section details the attempt to develop a model that could be used to predict for
fluorous solubility, thus providing a way to flag 'problem' compounds.
Aqueous Solubility
1406 compounds were analysed by mass spectrometry after 4 hours room temperature
incubation over the range 20 to 100 µM in PBS pH7.4. By comparing the integrated peak
response data, 347 were found to have responses suggesting the concentration had reduced to
below 80% of the expected value and were thus flagged as Not Soluble ('NS'). These
compounds were removed from subsequent partitioning experiments as any decrease in
concentration observed in the aqueous phase would not necessarily be a cause of partitioning
in the aqueous phase, but may be wholly or in part due to the compound coming out of
solution during the experiment.
The remaining 1054 compounds were flagged as soluble to 100 µM and re-ordered from the
AZ compound collection library for the round 1 and round 2 tests.
5.0.3 Partitioning - Round 1 & Round 2
Data were imported to Spotfire 6.5 (Tibco, Boston, MA) and plotted according to cut-off
values where < 20 % was categorised as Non-Partitioning in the fluorous phase; > 20 < 70 %

147
was Partially-Partitioning in the fluorous phase and > 70 % Partitioning in the fluorous
phase. To assess the extent of partitioning, all data was normalised against the time = 0 days
(t0) sample response values and converted to a percentage uptake in the fluorous phase. The
t0 samples to be used in analysis of the time = 2 day (t02) and time = 4 day (t04)) were
compared and the average of these used if the t02 and t04 data were within ± 20 % CV. This
variability level was in recognition that mass spectrometry may have a drift in response over
a series of analyses when not using an internal standard to control the data.
Where t02 and t04 data varied greater than 20 % CV, the samples were excluded from the
final data set to remove ambiguity.
Of the 1054 compounds tested in Round 1, a number of failed injections, or no spectra found
at the specified mass (thermal lability resulting in possible degradation during assay, or
molecular fragmentation during analysis) were excluded in the reported data (autosampler
blockages, etc.),. Data deviating more than more than –20 % in the % t4 fluorous data were
also excluded from the reported set. These data may again have been due to compound
degradation and/or insolubility in the HPLC mobile phase.
Data for 475 valid sample injections were reported. For t2 and t4 samples, the percentage in
the fluorous phase was calculated from the t0 normalised data. Of the t2 data, 1% of the
compound set partitioned >70 %. This data is represented by the green set in Figure 57.
Comparing the same compounds at the later t4 point (Figure 58) showed that fewer of these
compounds remained at >70 % which may be a consequence of either a shift in the
equilibrium of solubility between aqueous and oil phase, or due to random experimental
error. The variability of MS analysis peak area quantification17 can vary by as much as
approximately ± 20 % which may be enough to result in reclassification of compounds lying
near either the 20 % or 70 % cut-off boundaries.

148
A more pronounced effect on partitioning was seen when comparing the t2 and t4 data where
AZF (2% w/w) was added to the oil phase (Figures 59 and 60). This is consistent with
reported work previously discussed, where fluorosurfactants are likely to increase leakage
from the aqueous phase via a number of mechanisms.
A number of plots are presented in Figure 56A–C derived from analysis of the t2 data which
attempt to correlate the percentage in fluorous phase with a number of key compound
parameters obtained from the AZ compound database. There was no immediately obvious
correlation between the observed partitioning result and compound property. That said, as
most compounds did not appear to partition, even when using fluorosurfactant, it was
difficult to derive a large enough population of compounds soluble in the fluorous phase that
would allow any emerging trend or subtle correlation to be deduced.
As very good miscibility was seen between different fluorous oils, such as PFO and FC-70 in
the earlier oil tests, it was proposed that compounds containing fluorine may partition more
readily to the oil phase through increased solubility from strong non-covalent fluorine-
fluorine (F-F) interaction. However, as the plot of percentage compound in the fluorous phase
against the number of fluorine atoms shows (Figure 56h), there was little correlation
supporting this hypothesis. Only 3 compounds out of 475 had 4 or 5 fluorine atoms. Gladysz
et al.236 have reported it is likely that greater solubility in fluorous phases would occur with a
higher level of overall molecular fluorination to result in sufficient F-F interaction.

149
Figure 56A. Poor correlation seen for 475 compounds between solubility in the fluorous phase and; (a)
molecular weight; (b) polar surface area and (c) number of rotatable bonds.
0
100
200
300
400
500
600
-40.000
-20.000
0.000
20.000
40.000
60.000
80.000
100.000
0 50 100 150 200 250 300 350 400 450 500 Mo
lecu
lar
Wei
ght
% I
n F
luo
rous
Phas
e
Compound Index
Correlation Percentage In Fluorous Phase vs. Molecular Weight
% In Fluorous Phase 2 days Molecular Weight
0
50
100
150
200
-40.000
-20.000
0.000
20.000
40.000
60.000
80.000
100.000
0 50 100 150 200 250 300 350 400 450 500
Mo
lecu
lar
Po
lar
Surf
ace
Are
a
% I
n F
luo
rous
Phas
e
Compound Index
Correlation Percentage In Fluorous Phase vs. Polar Surface Area
% In Fluorous Phase 2 days Molecular Polar Surface Area
0
2
4
6
8
10
12
14
16
-40.000
-20.000
0.000
20.000
40.000
60.000
80.000
100.000
0 100 200 300 400 500 # R
ota
tab
le B
ond
s
% I
n F
luo
rous
Phas
e
Compound Index
Correlation Percentage In Fluorous Phase vs. # Rotatable Bonds
% In Fluorous Phase 2 days # Rotatable bonds
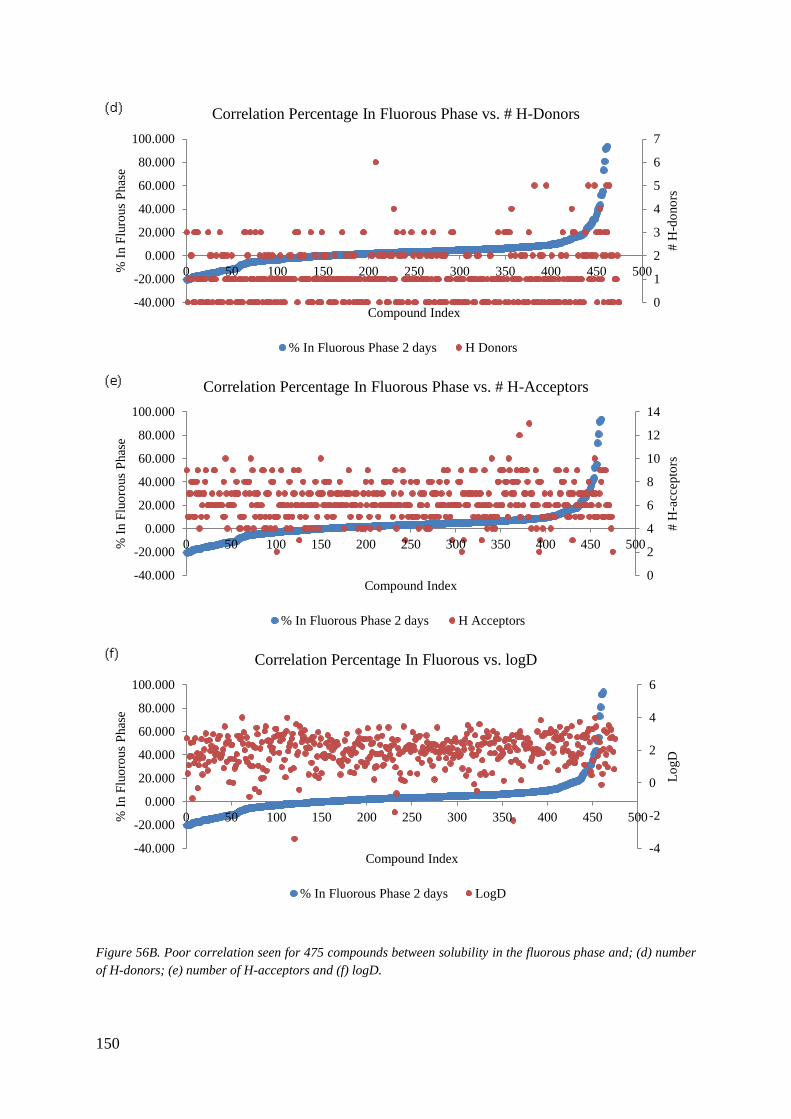
150
Figure 56B. Poor correlation seen for 475 compounds between solubility in the fluorous phase and; (d) number
of H-donors; (e) number of H-acceptors and (f) logD.
0
1
2
3
4
5
6
7
-40.000
-20.000
0.000
20.000
40.000
60.000
80.000
100.000
0 50 100 150 200 250 300 350 400 450 500
# H
-do
no
rs
% I
n F
luro
us
Phas
e
Compound Index
Correlation Percentage In Fluorous Phase vs. # H-Donors
% In Fluorous Phase 2 days H Donors
0
2
4
6
8
10
12
14
-40.000
-20.000
0.000
20.000
40.000
60.000
80.000
100.000
0 50 100 150 200 250 300 350 400 450 500
# H
-acc
epto
rs
% I
n F
luo
rous
Phas
e
Compound Index
Correlation Percentage In Fluorous Phase vs. # H-Acceptors
% In Fluorous Phase 2 days H Acceptors
-4
-2
0
2
4
6
-40.000
-20.000
0.000
20.000
40.000
60.000
80.000
100.000
0 50 100 150 200 250 300 350 400 450 500
Lo
gD
% I
n F
luo
rous
Phas
e
Compound Index
Correlation Percentage In Fluorous vs. logD
% In Fluorous Phase 2 days LogD

151
Figure 56C. Poor correlation seen for 475 compounds between solubility in the fluorous phase and; (g) ClogP
and (h) number of fluorine atoms.
-2
-1
0
1
2
3
4
5
6
7
-40.000
-20.000
0.000
20.000
40.000
60.000
80.000
100.000
0 50 100 150 200 250 300 350 400 450 500
CL
ogP
% I
n F
luo
rous
Phas
eCorrelation Percentage In Fluorous vs. CLogP
% In Fluorous Phase 2 days C LogP
0
1
2
3
4
5
6
-40.000
-20.000
0.000
20.000
40.000
60.000
80.000
100.000
0 50 100 150 200 250 300 350 400 450 500
# F
luo
rine
Ato
ms
% I
n F
luo
rous
Phas
e
Compound Index
Correlation Percentage In Fluorous vs. # Fluorine Atoms
% In Fluorous Phase 2 days # Fluorine Atoms

152
Figure 57. Percentage of compound dissolved in the fluorous oil phase after a 2 day incubation for 475 valid compound results. Error bars are ±20 %.

153
Figure 58. Percentage of compound dissolved in the fluorous oil phase after a 4 day incubation for 475 valid compound results. Error bars are ±20 %.

154
Figure 59. Percentage of compound dissolved in the fluorous oil phase in the presence of 2% w/w AZF after a 2 day incubation for 475 valid compound results. Error bars
are ±20 %.

155
Figure 60. Percentage of compound dissolved in the fluorous oil phase in the presence of 2% w/w AZF after a 4 day incubation for 475 valid compound results. Error bars
are ±20 %.

156
5.0.4 Predictive Modelling of Partitioning
From the data of Rounds 1 and 2, the Receiver Operating Characteristic (ROC) curves, as
depicted in Figure 61, suggested reasonably high levels of model accuracy may be possible,
although caution was exercised given the variability of ROC output over 5 consecutive
randomised training-test data splits (Figure 59). An ROC score of between 55% and 95%
(average ~76%) suggested there was agreement between predictions for compounds most
likely to partition and the experimental data for such compounds. Ideally, >85% would be
considered a highly accurate predictive model; however, to achieve this value would most
likely require a much larger total set of data, which was not possible because of resource
constraints at the time of investigation. The output from the Bayesian model training was
used in designing Round 3.
5.0.5 Partitioning - Round 3
Applying the Bayesian FCFP model to the 2 million compounds in the AZ compound library
yielded a list of these compounds arranged in order of predicted fluorous solubility. 192
compounds were selected from the top and 192 from the bottom of the list and tested in
Round 3. Of the 192 compounds selected from the top of the list, 187 provided valid
experimental results, however, of these, only 9 were found experimentally to partition >20%
to the fluorous phase and be predicted to be in this category by the model, whereas the
remaining 178 also predicted to be in the partitioning category were found experimentally to
be distributed over the –20 to 20 % non-partitioning range. The data was also tested for the
reverse case examining the model for the compounds tested that were expected to be in the

157
non-partitioning category. From this, 5 compounds were experimentally found to partition
>20 % and thus reside in the partitioning category.
Figure 61. ROC plot. A value of greater than 0.8 (80 %) may be considered an accurate model prediction
indicating a low false positive rate. Randomised training-test set splits of the data from round 1 and 2 was used
to generate 5 different iterations of ROC calculation.
From this, it is reasonable to suggest that the model accuracy was actually rather misleading
and supports the hypothesis the model was unable to resolve the connection between an
observed result and the physicochemical properties underlying the cause of the observation.

158
Figure 62. (a) Predictive accuracy of the model is indicated by plotting the false positive rate (x-axis) against the true positive rate (y- axis). 0.5 corresponds to 50% which is
no better than the chance of tossing a coin; that is, the model has no predictive ability to determine the outcome of an event having two possible outcomes.
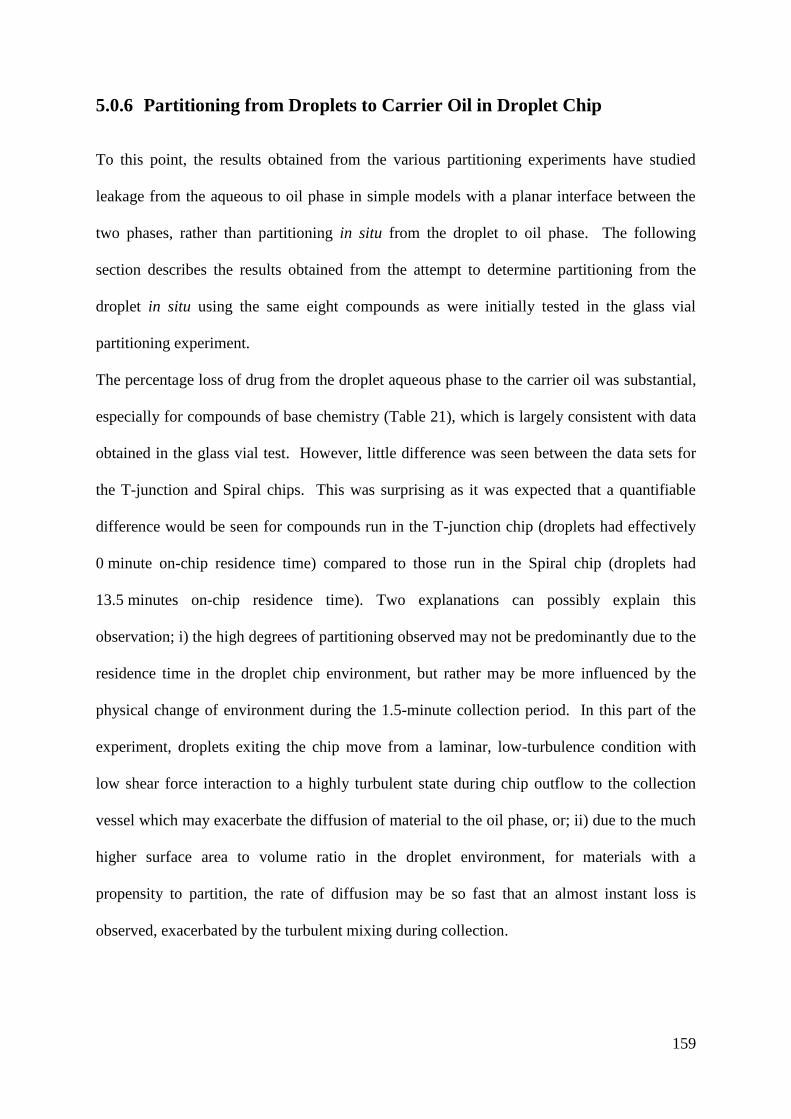
159
5.0.6 Partitioning from Droplets to Carrier Oil in Droplet Chip
To this point, the results obtained from the various partitioning experiments have studied
leakage from the aqueous to oil phase in simple models with a planar interface between the
two phases, rather than partitioning in situ from the droplet to oil phase. The following
section describes the results obtained from the attempt to determine partitioning from the
droplet in situ using the same eight compounds as were initially tested in the glass vial
partitioning experiment.
The percentage loss of drug from the droplet aqueous phase to the carrier oil was substantial,
especially for compounds of base chemistry (Table 21), which is largely consistent with data
obtained in the glass vial test. However, little difference was seen between the data sets for
the T-junction and Spiral chips. This was surprising as it was expected that a quantifiable
difference would be seen for compounds run in the T-junction chip (droplets had effectively
0 minute on-chip residence time) compared to those run in the Spiral chip (droplets had
13.5 minutes on-chip residence time). Two explanations can possibly explain this
observation; i) the high degrees of partitioning observed may not be predominantly due to the
residence time in the droplet chip environment, but rather may be more influenced by the
physical change of environment during the 1.5-minute collection period. In this part of the
experiment, droplets exiting the chip move from a laminar, low-turbulence condition with
low shear force interaction to a highly turbulent state during chip outflow to the collection
vessel which may exacerbate the diffusion of material to the oil phase, or; ii) due to the much
higher surface area to volume ratio in the droplet environment, for materials with a
propensity to partition, the rate of diffusion may be so fast that an almost instant loss is
observed, exacerbated by the turbulent mixing during collection.

160
Table 21. Summary of percentage drug loss from the aqueous phase after 0 and 13.5 minutes on-chip residence
time in the droplet environment using FC-70-AZF carrier oil. Losses are found to be significant for both t0 and
t13.5 chips suggesting that a larger extent of partitioning may be occurring during the 1.5 minute collection
period. This may be a cause of the high turbulence giving greater mixing and promotion of diffusion to the oil
phase.
Compound % loss (t0 chip) % loss (t13.5 chip)
Chlorpromazine 96 96
Imipramine 95 95
3,5-DCP 67 79
Trazodone 64 75
Indomethacin 27 25
Salicylic acid 7 0
Lidocaine 0 23
Tolbutamide 0 0
5.1 Summary & Conclusions
5.1.1 Partitioning - Glass Vial Tests
Results from the static interface partitioning experiments indicate that fluorocarbon oils
perform well with respect to low levels of partitioning across a non-stirred liquid interface for
neutral and acid and basic compounds, which may be expected for a hydro- and oleo-phobic
organic phase. However, when surfactants are added to the same static interface tests, a
pronounced increase in partitioning is observed. This is most likely as a result of increased
mass transport via micelle formation whereby the drug can be rendered more soluble in the
fluorous phase4. The level of partitioning observed when using surfactants is alarmingly high
at greater than 50 % loss to the oil phase for FC-70, however the selection of compounds
tested is small and only represents a limited chemistry. A much wider set of data would be
required to more fully understand how significant partitioning in the presence of surfactant is
and how this may impact on either the P450 inhibition assay objective in this project, or
indeed on the wider appeal for droplet microfluidic drug discovery screening.

161
5.1.2 Partitioning - Droplet Chip Tests
In the earlier droplet formation tests using fluorous oil carrier phases, it was established that
when the oils were tested in their pure form droplets were not produced under the conditions
of channel dimensions and flow rates described. The droplet chip-based partitioning
experiments therefore had to be explored using a surfactant. The results from the chip-based
tests reveal that partitioning can be very high, especially for basic compounds, with a rank
order similar to that for the eight drugs tested in the glass vial method. Furthermore, the
results indicate that a majority of partitioning occurred either in the droplet collection period,
or is occurring rapidly after droplet generation. This is broadly in agreement with the large
partitioning seen in the glass vial tests when using surfactant.
The chip-based method employed here was unable to distinguish clear differences of
partitioning based solely on chip residence times, suggesting a more robust method was
needed to evaluate loss of compound from droplets in situ.
5.1.3 Partitioning - AZ Library Compounds & Predictive Modelling
The results from testing ~2000 AZ library collection compounds of varied chemistry (not
disclosed for IP reasons) indicated that very few compounds tended to partition from the
aqueous phase to fluorous phase in the absence of surfactant and when AZF surfactant was
added to the oil, although partitioning was seen to increase overall, the number of compounds
moving from a low % in fluorous phase category to a high % category remained fairly low.
Over the broader range of chemistry tested, fewer drug-like compounds were found to
partition in the fluorous oil phase than were first expected based on the evidence of the glass
vial and droplet chip partitioning test, however, the impact of surface area-to-volume ratio on

162
partitioning especially in the presence of fluorosurfactants would require further investigation
to determine a more realistic outcome.
Correlation of known physicochemical properties to the extent of fluorous solubility was poor
and did not reveal an obvious combination of physicochemical properties that described
fluorous solubility. This, and the low number of compounds in the fluorous soluble set can
also explain the failure of the model to accurately predict partitioning to the fluorous phase.

163
6 Results and Discussion: CYTOCHROME P450 REACTION
In this section, the results from the microtitre plate cytochrome P450 inhibition experiment
are reported. This provided an essential 'gold standard' to which the droplet microfluidic
assay results, described in chapter 7, were compared. The data includes how the enzyme
reaction rate varied with temperature and how linear the reaction is over the incubation. Data
was compared to a calibration curve which enabled calculation of the concentration of
fluorescent metabolite produced during the reaction.
6.0.1 Microtitre Plate: Reaction Dependence on Temperature
As seen by the reaction profiles in Figure 62, over eight replicates, variability was well
controlled and a substantial increase in reaction velocity was obtained at higher temperatures.
The reaction proceeded fastest, producing the greatest signal, at 37 °C, which is consistent
with reports in the literature discussed in Chapter 1. Notably, regarding the 37 °C plot in
Figure 63, although variation between the individual replicates was acceptably low at less
than ~10 % variance (Table 22), there was a pronounced shift in reaction rate, as evidenced
by a change in the plot profile. At the beginning of reaction, the slightly slower rate is
probably due to the addition of ice-cold NADPH cooling the incubate briefly, resulting in an
initially slower rate of reaction. This is quickly recovered as the well contents return to the
correct incubation temperature. Towards the end of the 20-minute incubation, the rate was
observed to decrease again slightly, either as a result of the beginning of reagent depletion or
the effect of product formation on the reaction rate (deviation from pseudo-first order
reaction kinetics).

164
Figure 62. Average signal data plot for 1A2 enzyme incubated with CEC at different temperatures. Higher
temperatures yield a significantly higher rate of reaction and thus larger signal window after 20 minutes. All
four temperatures provided very good to excellent linearity over 20 minutes incubation. Error bars are 7%.
From the data summarised in Table 22 and plots in Figure 63, 34 °C offered the best
compromise between good signal linearity and maximum signal. There was very little
evidence of a slower rate at either the beginning or end of the 20 minute incubation.
In the next section, the results for a further investigation are described where the temperature
of a repeat experiment was set to 34 °C and cross-reference to a CHC standard curve is
employed to determine the concentration of fluorescent metabolite that was produced by the
enzyme reaction.
R² = 0.99
R² = 0.99
R² = 0.99
R² = 0.99
0
2000
4000
6000
8000
10000
12000
14000
16000
18000
0 5 10 15 20
RF
U
Incubation Time (mins)
1A2-CEC Reaction Rate Dependence on Temperature
Avg. Blank - 22 degs Avg. Signal - 22 degs
Avg. Blank - 25 degs Avg. Signal - 25 degs
Avg. Blank - 34 degs Avg. Signal - 34 degs
Avg. Blank - 37 degs Avg. Signal - 37 degs
Linear (Avg. Signal - 22 degs) Linear (Avg. Signal - 25 degs)
Linear (Avg. Signal - 34 degs) Linear (Avg. Signal - 37 degs)
n=8

165
Figure 63. Microtitre plate-based 1A2-CEC reaction profiles at different temperatures. Zero baseline not
shown.
R² = 0.9996
0
1000
2000
3000
4000
5000
6000
7000
0 5 10 15 20
RF
U
Time (mins)
22 °C
R² = 0.9992
0
2000
4000
6000
8000
10000
0 5 10 15 20
RF
U
Time (mins)
25 °C
R² = 0.9982
0
5000
10000
15000
0 5 10 15 20
RF
U
Time (mins)
34 °C
R² = 0.9975
0
5000
10000
15000
0 5 10 15 20
RF
U
Time (mins)
37 °C

166
Table 22. Data obtained from eight replicate incubations of P450 enzyme 1A2 with CEC at 22, 25, 34 and 37
°C. Final incubation concentrations are; 1A2 enzyme=10 nM; CEC=3 µM; NADPH=250 µM. Variance
across the data set is acceptably low and comparable to data seen previously17.
22 °C
25 °C
34 °C
37 °C
Time
(mins)
Avg.
(n=8) SD %
CV
Avg.
(n=8) SD %
CV
Avg.
(n=8) SD %C
V
Avg.
(n=8) SD %
CV
0 379 21 6
389 46 12
503 26 5
509 32 6
1 602 26 4
697 42 6
924 44 5
1025 33 3
2 857 36 4
1038 56 5
1427 68 5
1657 71 4
3 1128 45 4
1396 60 4
1967 106 5
2353 99 4
4 1402 58 4
1752 88 5
2546 145 6
3096 139 4
5 1693 63 4
2130 111 5
3173 209 7
3913 186 5
6 1969 78 4
2524 141 6
3831 229 6
4791 229 5
7 2269 78 3
2934 165 6
4525 289 6
5684 268 5
8 2566 79 3
3351 184 5
5233 327 6
6575 338 5
9 2852 97 3
3782 211 6
5973 361 6
7541 338 4
10 3164 112 4
4208 208 5
6694 394 6
8453 394 5
11 3469 118 3
4635 231 5
7414 447 6
9347 385 4
12 3774 128 3
5067 248 5
8162 444 5
10220 418 4
13 4088 136 3
5487 271 5
8874 475 5
11097 466 4
14 4381 128 3
5904 283 5
9620 501 5
11955 457 4
15 4666 150 3
6309 301 5
10314 499 5
12705 494 4
16 4960 146 3
6733 292 4
10983 504 5
13460 444 3
17 5276 166 3
7121 300 4
11686 482 4
14170 444 3
18 5546 177 3
7529 329 4
12322 532 4
14815 444 3
19 5826 163 3
7933 324 4
12963 524 4
15438 444 3
20 6122 175 3
8320 351 4
13579 502 4
16035 444 3
6.0.2 Microtitre Plate: Linearity at 34°C and Standard CHC Curve
The microtitre plate data from reaction at 34 °C was plotted against a CHC standard curve
over the range 0 to 1 µM (Table 23). The standard curve allowed calculation of CHC
metabolite concentration across the 20 minute incubation. This information was then used as
a 'gold standard' benchmark to which the droplet chip based experiments were compared.

167
Figure 64. CHC standard curve replicate measurements (n=8) show excellent correlation over the
concentration range studied (~5 % CV, see Table 22). As highlighted above, reaction at 6 minutes and 13.5
minutes were noted in particular as these incubation times were equivalent to the design of droplet chips to be
tested.
Using the linear fit equation from Figure 62 (Equation (30)), the RFU values obtained at 6
minutes and 13.5 minutes were calculated.
𝑦 = 680.7𝑥 − 11.14 (30)
where x is the time point and y the RFU value obtained.
From this, it follows that:
RFU at 6 minutes = 4073.06
RFU at 13.5 minutes = 9178.31
These values were then applied to the rearranged linear fit equation in Figure 65 (Equation
(31)) to calculate the concentration of CHC metabolite corresponding to the RFU value.

168
Table 23. Four replicate standard curve measurements of CHC metabolite.
Concn.
(µM) Rep 1 Rep 2 Rep 3 Rep 4 Average SD %CV
0 66 19 42 25 38 21 55.4*
0.03 2001 2613 2659 2498 2443 302 12.4
0.1 5063 5054 5142 5211 5118 74 1.4
0.3 14790 15131 14732 15025 14920 190 1.3
1 45317 44725 45664 44512 45055 530 1.2
*background noise
Figure 65. CHC standard curve replicate measurements (n=8) show very good correlation over the
concentration range studied.
x = 𝑦−788
44499 (31)
where x is the CHC concentration (µM) and y the input RFU value.
From this, it follows using calculated data from Equation 31:
At 6 minutes, concentration of CHC = 0.07 µM
At 13.5 minutes, concentration of CHC = 0.19 µM
y = 44499x + 788.01
R² = 0.999
0
5000
10000
15000
20000
25000
30000
35000
40000
45000
50000
0 0.2 0.4 0.6 0.8 1 1.2
CHC Calibration Curve
CHC Calibration
Curve
Linear (CHC
Calibration Curve)

169
From literature data17,187,188, we find that the concentration of fluorescent metabolite produced
in the reaction is similar to that expected for an enzyme catalysed reaction of this type. In
metabolic terms, 0.19 µM product formation at 6 minutes from the starting substrate
concentration of 3 µM is a metabolic 'turnover' of 2.3 % and that at 13.5 minutes, 6.3 %,
again consistent with data seen in this types of assay17.
In the next chapter, the results obtained from the equivalent CEC reaction in the droplet chip
are presented and discussed, using the microtitre plate data as a guide to how well the chip
method compares.
6.1 Summary & Conclusions
6.1.1 Reaction Dependence on Temperature & Linearity of Reaction
Of the four temperatures tested, 34 °C offered the best compromise between reaction velocity
and linearity over a 20-minute reaction incubation. Linearity of reaction is critical to ensure
consistent data and offers a much easier route to calculate unknown concentrations of
reaction product using linear regression. Reproducibility at 34 °C for 8 replicate incubations
was well controlled at ~5 % CV across the 20-minute reaction time.
6.1.2 CHC Standard Curve
Repeated incubations at four concentrations over 0.03 µM to 1 µM covered the expected
range of metabolite expected to be produced (based on literature data) from a droplet P450
enzyme inhibition reaction of this type. This assumed the assay in the droplet format worked
and scaled in a ratio-metric manner, that is, reaction velocities were consistent and did not
change with volume or changes in the surface area-to-volume ratio. The CV obtained was

170
very well controlled at ~1.5 % for the majority of the range increasing to only ~12.5 % at
0.03 µM. There was no evidence of non-linear response in the plate reader data.

171
7 Results and Discussion: SPIRAL INCUBATION CHIP
This chapter concerns the results obtained from the initial attempt to scale-down the
cytochrome P450 inhibition assay to the droplet format. A standard curve profile was
initially generated using solutions of the fluorescent metabolite across the expected
concentration range as determined by the previous plate-based experiments.
7.0.1 Droplet Chip: CHC Standard Curve
The data collected from the CHC standard curve showed very good linearity across the
concentration range tested (0.03 to 3 µM), however, the lowest concentration was found to be
very close to the limit of detection with a considerable degree of noise masking the droplet
peak data. Equations 32 and 33 describe the limit of blank and limit of detection,
respectively.
𝐿𝑂𝐵 = 𝑏𝑙𝑎𝑛𝑘̅̅ ̅̅ ̅̅ ̅̅ + 𝑏𝑙𝑎𝑛𝑘𝑆𝐷 (32)
where LOB is the 'Limit of Blank' described by the sum of the mean blank value and standard deviation
of the blank.
𝐿𝑂𝐷 = 𝐿𝑂𝐵 + [𝐴𝑛𝑎𝑙𝑦𝑡𝑒]𝑙𝑜𝑤𝑆𝐷 (33)
where LOD is the 'Limit of Detection' described by the sum of the limit of blank and the standard
deviation of the lowest analyte concentration.
From the CHC droplet data obtained using the Spiral chip, the LOB was calculated using
Equation 32 to be equivalent to a peak height response of 0.074 V. From this, the calculated
LOD was calculated using Equation 33 to be a peak height response of 0.171 V, equivalent to
an analyte concentration of between 0.3 and 0.4 µM. There are random noise spikes in the

172
baseline which most likely explain this higher LOD. In practice, it was found possible to
reasonably discriminate the droplet signal as low as 0.1 µM as shown by the raw data plots in
Figure 65.
Figure 66. Linearity plot of the four CHC concentrations. Quantified CHC droplets show good correlation
across the range studied. Linear fit is forced through zero.
Plotting the log-transformed peak area and height data in Table 23, yielded a linear fit,
suggesting that droplet signal response was directly proportional to droplet analyte
concentration (Figure 66). As seen before in previous droplet formation tests, droplet height
was seen to have the lower measurement variability, consistent with the expectation that
droplet size and position in the channel during detection will tend to vary more than droplet
analyte concentration. Reference to chapter 4 will confer the relative stability of droplet
analyte concentration.
y = 191.84x
R² = 0.9975
y = 0.4959x
R² = 0.9988
0.00
0.20
0.40
0.60
0.80
1.00
1.20
1.40
1.60
0.0
100.0
200.0
300.0
400.0
500.0
600.0
700.0
0 0.5 1 1.5 2 2.5 3 3.5
Pea
k H
eight
(V)
Pea
k A
rea
Concentration (µM)
Droplet Chip: CHC Linearity (Peak Area and Height)
area
height
Linear (area)
Linear (height)
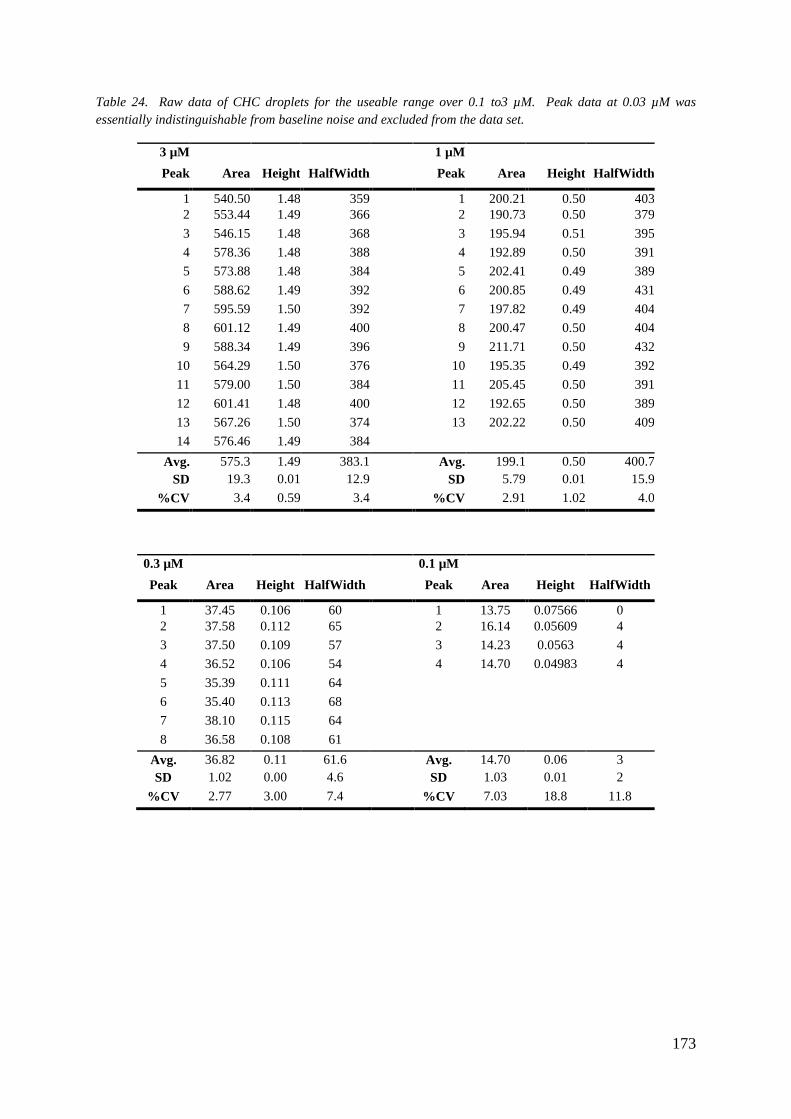
173
Table 24. Raw data of CHC droplets for the useable range over 0.1 to3 µM. Peak data at 0.03 µM was
essentially indistinguishable from baseline noise and excluded from the data set.
3 µM
1 µM
Peak Area Height HalfWidth
Peak Area Height HalfWidth
1 540.50 1.48 359
1 200.21 0.50 403
2 553.44 1.49 366
2 190.73 0.50 379
3 546.15 1.48 368
3 195.94 0.51 395
4 578.36 1.48 388
4 192.89 0.50 391
5 573.88 1.48 384
5 202.41 0.49 389
6 588.62 1.49 392
6 200.85 0.49 431
7 595.59 1.50 392
7 197.82 0.49 404
8 601.12 1.49 400
8 200.47 0.50 404
9 588.34 1.49 396
9 211.71 0.50 432
10 564.29 1.50 376
10 195.35 0.49 392
11 579.00 1.50 384
11 205.45 0.50 391
12 601.41 1.48 400
12 192.65 0.50 389
13 567.26 1.50 374
13 202.22 0.50 409
14 576.46 1.49 384
Avg. 575.3 1.49 383.1
Avg. 199.1 0.50 400.7
SD 19.3 0.01 12.9
SD 5.79 0.01 15.9
%CV 3.4 0.59 3.4
%CV 2.91 1.02 4.0
0.3 µM
0.1 µM
Peak Area Height HalfWidth
Peak Area Height HalfWidth
1 37.45 0.106 60
1 13.75 0.07566 0
2 37.58 0.112 65
2 16.14 0.05609 4
3 37.50 0.109 57
3 14.23 0.0563 4
4 36.52 0.106 54
4 14.70 0.04983 4
5 35.39 0.111 64
6 35.40 0.113 68
7 38.10 0.115 64
8 36.58 0.108 61
Avg. 36.82 0.11 61.6
Avg. 14.70 0.06 3
SD 1.02 0.00 4.6
SD 1.03 0.01 2
%CV 2.77 3.00 7.4
%CV 7.03 18.8 11.8

174
Figure 67. Raw data plot of CHC droplets (from 3 to 0.03 µM). Signal to noise ratio is very poor at 0.03µM
and was thus removed from the linearity plot. The data set for each concentration is truncated in this figure for
greatly clarity of peak shape against background noise.
0
1
2
0 5000 10000 15000 20000 25000 30000 35000 40000Res
po
nse
(V
)
time / ms
CHC at 3.0 µM
0
0.5
1
-2000 3000 8000 13000 18000 23000 28000 33000 38000Res
po
nse
/ V
time / ms
CHC at 1.0 uM
00.05
0.10.15
0.2
-2000 3000 8000 13000 18000 23000
Res
po
nse
/ V
time / ms
CHC at 0.3 µM
0
0.1
0.2
0 2000 4000 6000 8000 10000 12000 14000Res
po
nse
/ V
time / ms
CHC at 0.1 µM
0
0.05
0.1
0.15
0 5000 10000 15000 20000 25000 30000 35000 40000
Res
po
nse
/ V
time / ms
CHC at 0.03 µM

175
7.0.2 Droplet Chip: Cytochrome P450 Enzyme Inhibition
The evidence of quantified CHC metabolite data from the microtitre plate-based P450
enzyme assay and the agreement to this of the CHC standard curve data conducted in the
Spiral droplet chip, suggested the assay should yield reliable quantifiable data for the enzyme
assay conducted in the droplet format (Table 24 and Figure 67).
Initial attempts to deliver quantifiable 1A2-CEC reaction data from the Spiral chip were
surprisingly difficult. After a number of repeat attempts, only on one occasion was it
possible to acquire a definite signal indicating the formation of fluorescent metabolite (Figure
68).
Figure 68. 100% control activity determination by droplet chip. Each peak in the plot represents a droplet
passing the detector. The ‘twin peaks’ artefacts for each droplet may be caused by optical diffraction/reflection
attributed to the droplet leading and trailing edge causing a voltage spike in the detector as the light level
suddenly changes. Reproducibility is seen across the small sample set of 19 droplets with variance less than 9%
comparable to that seen in the microtitre plate control activity.
0 500 1000 1500 2000 2500
0.6
0.8
1.0
1.2
1.4
1.6
1.8
2.0
Res
ponse
(V
)
Time (ms)
1A2-CEC Control Activity (no inhibitor)

176
Droplet peaks had pronounced leading and trailing edge ‘spikes’, possibly caused by spurious
diffraction of the light captured by the PMT as droplets passed through the detection zone in
the chip channel. These are not seen in the standard CHC curve tests.
The series of ES solutions containing a range of inhibitor (fluvoxamine) concentrations
yielded similarly poor results in the respect they were all exhibited the 'spike' artefact and
were not reproducible on other occasions (Figure 69).
As inhibitor concentration increased, the quantified droplet signal fluorescence decreased in
accordance with inhibition of 1A2 by the enzyme-specific inhibitor. Table 24 summarises
the average data obtained. Significant noise is apparent in the data as evidenced by the
relatively high SD and % CV when compared to the CHC standard curve previously obtained
using the droplet chip. Despite the difficulty in obtaining a whole set of data for four different
concentrations of inhibitor in the enzyme reaction (plus the control activity), Logit-Log22
pseudo-Hill regression analysis of the data (Figure 70) resulted in an apparent IC50 for
fluvoxamine that closely matched literature data within the range reported2,17,222,223 (0.008
µM to 0.06 µM), however it must be noted that the confidence of this experimental result is
low due to the low resolution of the curve (only four concentration points) and that it was not
possible to robustly reproduce the data on either the same day, or separate days. Referring to
the raw data plots of Figure 69, the high level of noise and low signal seen, suggested either
a very small amount of fluorescent metabolite was produced, or detector alignment and
sensitivity was critically important in being able to detect the signal; between experiments, it
was not always possible to guarantee consistent alignment of the detector due to removing
and replacing syringe tubing for the next concentration of reagent and also between tests
conducted on separate occasions.

177
Figure 69. Droplet data for concentrations of fluvoxamine over 0.01–0.3 µM.
0 500 1000 1500 2000 2500
0.5
0.6
0.7
0.8
0.9
1.0
1.1
1.2
1.3
Res
ponse
(V
)
Time (ms)
1A2-CEC with 0.01 µM fluvoxamine
0 500 1000 1500 2000 2500
0.5
0.6
0.7
0.8
0.9
1.0
1.1
1.2
Res
ponse
(V
)
Time (ms)
1A2-CEC with 0.3 µM fluvoxamine
0 500 1000 1500 2000 2500
0.5
0.6
0.7
0.8
0.9
1.0
1.1
1.2
1.3
Res
ponse
(V
)
Time (ms)
1A2-CEC with 0.1 µM fluvoxamine
0 500 1000 1500 2000 2500
0.5
0.6
0.7
0.8
0.9
1.0
1.1
Res
ponse
(V
)Time (ms)
1A2-CEC with 0.3 µM fluvoxamine

178
Table 24. Average data for the IC50 determination. Resultant IC50 falls in range of literature values.
Conc (µM)
Avg. Pk
area
SD
(area) %CV (area)
Avg.
Peak
height
SD
(height)
%CV
(height)
0 21.86 1.17 5.35 0.96 0.08 8.19
0.01 12.08 2.30 19.00 0.57 0.10 17.88
0.03 11.33 2.03 17.95 0.52 0.08 16.28
0.1 9.03 1.70 18.81 0.48 0.11 22.29
0.3 7.49 1.53 20.44 0.45 0.03 6.69
RFU µM %CA %Inh Log[Inh]
Log(CA/100-
CA)
Line
fit
7.49 0.3 34.2 65.8 -0.52 -0.28 -0.27 m = -0.26
9.03 0.1 41.2 58.8 -1.00 -0.15 -0.15 c = -0.41
11.33 0.03 51.7 48.3 -1.52 0.03 -0.01 x' = -1.56
12.08 0.01 55.2 44.8 -2.00 0.09 0.12 r2 = 0.97
IC50 0.027
µM
Figure 70. IC50 calculation using a pseudo Hill analysis Logit-Log plot. The IC50 obtained is within the
literature values for fluvoxamine.
The positional flow of droplets within the channel may randomly shift, resulting in further
observed variations in detector signal. However, discounting detector alignment issues, the
signal obtained was lower than expected (based on the results of the microtitre plate and
standard curve assessments discussed in earlier chapters). As described in the introduction,
and followed up with the work on partitioning of material from droplets, a possible
consideration is that one or more reagents from the reaction had leaked out before reaction
0.0
10.0
20.0
30.0
40.0
50.0
60.0
0.010.11
% M
axim
al r
ate
[Inhibitor] / µM
IC50 Plot
-0.40
-0.30
-0.20
-0.10
0.00
0.10
0.20
-2.50-2.00-1.50-1.00-0.500.00
Lo
g(C
A/1
00
-CA
)
Log[Inh]
Logit-Log (pseudo Hill) Plot
Regression
Pseudo Hill

179
and/or quantification. Other possibilities include reagent stability and also whether there is a
significant negative impact on the enzyme reaction from the miniaturisation of the assay to
droplet format. Possible causes and the resulting action taken to address the apparent lack of
signal are summarised in Table 25. Table 26 rationalises each of the hypotheses outlined in
Table 25.
Table 25. Possible causes of the very low and irreproducible signal obtained for the 1A2-CEC reaction in the
Spiral droplet chip.
(1) Enzyme activity loss over time (prior to chip injection):
Enzyme activity may have decreased over the length of time required to setup and stabilise each droplet chip
experiment, compared to the microtitre plate. Reagents were charged to the syringes for chip-based experiments
and left for 2 hours at room temperature. After this time, the syringe contents were used in the microtitre plate
experiment and data compared to that obtained in the original microtitre plate test where fresh reagents were
used.
(2) Impurities in the apparatus causing enzyme inhibition:
Impurities in the syringe and/or tubing/chip may have inhibited the enzyme decreasing apparent activity before
injection to the droplet chip.
To address this, all syringes, tubing and chip were rigorously flushed with water, ethanol and then water again to
remove any contaminants. The test was then repeated to observe any improvement.
(3) Mixing of enzyme-substrate solution with NAPDH solution during droplet formation:
Incomplete mixing of NAPDH with the enzyme-substrate solution at the point where droplets were formed may
have resulted in a delayed reaction or lack of reaction velocity. This may result in a slower reaction with lower
quantities of metabolite produced.
To address this, a stock solution of CHC (3 µM) was first quantified by flowing into both chip inlets. This was
then compared to the signal obtained when flowing phosphate buffer in one channel with CHC (3 µM) in the
other.
(4) Limit of detection too high using the apparatus described:
The detection limit for the apparatus was not low enough for the concentration of metabolite produced, hence a
low signal with poor signal to noise ratio was obtained. This may affected by incorrect alignment of the optics,
focussing of the excitation light into the channel and movement of droplets in the channel.
(5) Incubation temperature of the droplets not at the required temperature (34 °C):
The droplets in the chip channel may not have reached the required 34 °C to produce sufficient metabolite over
either the 6 or 13.5 minute incubations.
(6) Partitioning of the substrate and /or metabolite:
The CEC substrate may have partially or completely partitioned out of the droplet before any significant
reaction had occurred. Alternatively, the CHC metabolite may have partitioned out from the droplet during
incubation prior to detection. The following chapter, "Partitioning Follow-up" describes this in detail.
(7) Droplet environment not suitable for the reagents:
In this case, it was considered whether the nature of the droplet environment and concentration of reagents used
was fundamentally at fault.

180
Table 26. Results summary of the hypotheses outlined in Table 19.
(1) Enzyme activity loss over time (prior to chip injection):
After 2 hours at room temperature, enzyme-substrate and NADPH solutions were found to yield similar results
to that obtained previously in the micro titre plate experiments, thus not a likely cause of the low signal seen in
the droplet chip 1A2-CEC reaction.
(2) Impurities in the apparatus causing enzyme inhibition:
No improvement to reaction signal was seen after extensive flushing of the chip apparatus with water, ethanol
and then water again.
(3) Incomplete mixing of enzyme-substrate solution with NAPDH solution during droplet formation:
The signal obtained for droplets where CHC was flowed in one inlet and phosphate buffer in the other showed
a broadly 2-fold reduction in signal corresponding to the 1:1 dilution ratio. Although droplet signal variability
was increased compared to CHC alone, the result suggested good mixing of reagents. NADPH is used in large
excess so even incomplete mixing should still work.
(4) Limit of detection too high using the apparatus described:
The results of the droplet formation and response linearity tests indicate there should be sufficient sensitivity
from the apparatus to see CHC down to ~0.05 µM which is below the expected concentration of CHC formed
after both 13.5 and 6 minutes incubation at 34 °C.
(5) Incubation temperature of the droplets not at the required temperature (34 °C):
A rapid response thermocouple temperature probe was adhered to the top surface of the droplet chips to measure
the temperature rise and final surface temperature. From room temperature, the chip top surface was measured
at 34 ±1°C after 5 minutes. From this it was assumed that droplets in the channel would reach this temperature.
(6) Partitioning of the substrate and /or metabolite:
CEC and CHC were tested in the shake-flask method to confirm partitioning potential to the oil phase. The
results are detailed in chapter 8.
(7) Droplet environment not suitable for the reagents:
The potential for enzyme to undergo non-specific binding events or other process that may lead to inactivation
were investigated. The results are detailed in chapter 9 and 10.
Of the hypotheses considered in Table 25, (6) and (7) were considered for significant further
investigation fitting the project aims described in chapter 2 and aligning to concerns raised in
chapter 1.
To address time-dependent issues relating to either reagent degradation, partitioning or other
artefact, the inhibition tests were repeated with the shorter Serpentine chip (see chapter 9)
comparing the data against the microtitre plate data obtained at 6 minutes.

181
7.1 Summary & Conclusions
7.7.1 P450 Enzyme Reaction in Spiral Incubation Chip
The results obtained by conducting a miniaturised droplet format cytochrome P450 inhibition
assay were more challenging than expected, which was particularly surprising given the
relative simplicity of the reagent build required, biochemical reaction involved, and the
design of the Spiral reaction chip. Only one replicate set of data were obtained for the chip-
based reaction, however, despite this, the reported IC50 closely match literature data. This
provided confidence that the assay could be made to work in the droplet format, but
recognised the need to overcome the problem of low signal and reproducibility.
182
8 Results & Discussion: PARTITIONING FOLLOW-UP
This chapter reports the results from the 'shake flask' test used to investigate whether the CEC
substrate in the cytochrome P450 reaction, or CHC metabolite were likely to partition to the
fluorous oil phase. If this was found to be the case, it would provide an explanation for the
low signal seen in the previously discussed droplet-based P450 enzyme inhibition assay
attempt.
8.0.1 Shake Flask
The CHC droplet standard curve linearity test showed that over the concentration range 0.1 to
3 µM it should be possible to measure CHC production from the metabolism of CEC by the
1A2 enzyme if appropriate quantities are produced in the droplet format. If the reaction
proceeded at the same rate as in the microtitre plate, a concentration of about 0.2 µM should
be reached, quantifiable after a 13.5 minute incubation at 34 °C, as found in the microtitre
plate experiments (pg. 102). The lack of signal observed in the initial attempts of droplet
chip based 1A2-CEC reaction may have been a result of substrate and/or metabolite leaching
out from the droplet.
For the first test conducted over 5 minutes, CEC and CHC were not observed to partition
substantially to either FC-70 oil alone or FC-70 containing 2 % w/w AZF surfactant. As the
inversion process maximised the interfacial surface area between the two liquids by forming
many small droplets in an emulsion, if either CEC or CHC were prone to partitioning, a
larger loss in the aqueous phase might be observed. As shown in Figure 71, dissolution in the
oil phase was low with an absorbance measurement in the aqueous phase similar to that

183
observed from the starting stock solution, suggesting a minimal loss of either CEC or CHC to
the fluorous phase.
Figure 71. CEC substrate absorbance plot and CHC metabolite absorbance plot of aqueous phase at t=0 and
t=5 minutes, with and without AZF surfactant. In each case, t0 and t5 data overlap suggesting no loss of
material from the aqueous phase by partitioning o the oil phase.
As shown in Figure 72, the data from the second test over 20 minutes for three replicates
showed no loss from the aqueous phase for CHC with all peaks essentially equivalent if
random signal variation is ignored. The three red plots prefixed 'CHC 200 µM' refer to the
initial stock solution analysis and the other the plots prefixed 'CHC 1000 µL' refer to the
analysis of the reaction aliquots of the samples following constant inversion for 20 minutes.
0
0.1
0.2
0.3
0.4
0.5
0.6
0.7
0.8
330 350 370 390
Ab
s
Wavelength (nm)
CEC (substrate)
200 µM CEC
t5 mins, no AZF
t5 mins, + 1.8 %
w/w AZF
0
0.1
0.2
0.3
0.4
0.5
0.6
0.7
0.8
320 370 420
Ab
s
Wavelength (nm)
CHC (metabolite)
200 µM CHC
t5 mins, no AZF
t5 mins, + 1.8 %
w/w AZF

184
Figure 72. Little partitioning from the aqueous phase to oil phase was observed for CHC after 20 minutes.
some analytical error is apparent as the signal at 20 minutes is reported to be slightly higher than that of the
stock 200 µM solution replicates at the maximum absorption wavelength. Labels prefixed ‘CHC 1000 µL…’
refer to the 1 mL samples that were analysed at 20 minutes.
From these data, it is reasonable to suggest that there is little of no impact of partitioning of
the metabolite from the enzyme reaction, however, due to the limited solubility of CEC in the
aqueous solution to a concentration high enough for reliable absorption spectroscopy, thus it
is not wholly conclusive evidence that no CEC is lost by partitioning during the enzyme
reaction in the droplet format.
0
0.1
0.2
0.3
0.4
0.5
0.6
220 270 320 370 420 470 520
Ab
s
Wavelength (nm)
CHC 200 µM std #1
CHC 200 µM std #2
CHC 200 µM std #3
CHC 1000 µl @ 20 mins #1
CHC 1000 µl @ 20 mins #2
CHC 1000 µl @ 20 mins #3

185
8.1 Summary & Conclusions
8.1.1 Shake Flask
The data from the shake flask experiments did not provide evidence of significant CHC
metabolite partitioning from the aqueous phase. The emulsion formed by constant inversion,
ensures a very large surface area-to-volume ratio for the two phases concerned and is thus
highly representative of the surface area-to-volume ratio encountered in the droplet-based
enzyme reaction. Loss of CEC from the aqueous phase to oil is not conclusively ruled out
due to the limited solubility of CEC in the aqueous phase. Additional orthogonal approaches
may be necessary to indirectly determine whether leakage of CEC is problem. Chapter 9
considers the use of the Serpentine chip having a 6 minute incubation. If CEC is lost by
partitioning, the results from this would also be poor, helping to confirm loss of CEC as a
primary cause of little or no reaction seen in the cytochrome P450 enzyme experiments.

186
9 Results & Discussion: SERPENTINE INCUBATION CHIP
In this chapter, the results are presented for the repeat P450 enzyme control activity reaction
test using the alternative shorter incubation time chip. The data obtained was quantified
against a CHC calibration curve and compared to equivalent data obtained at 6 min in the
microtitre plate experiments.
9.0.1 Cytochrome P450 Control Activity (no inhibitor)
As only a small signal was obtained from the Spiral chip, it was hypothesised that perhaps
some other artefact was responsible for the loss of signal that impacted more the longer the
incubation and that a shorter incubation may reveal a sufficient signal from the enzyme-
substrate reaction by minimising this additional effect. To achieve sufficient incubation time
in a serpentine that would fit onto the 75 × 75 mm PMMA sections used throughout this
research, and at the required flow rates for droplet formation, it was necessary to utilise a
wider channel. The use of a significantly wider channel (0.8 mm) resulted in a pronounced
parabolic flow where droplets near the channel walls moved more slowly and hence were
incubated for longer than droplets in the centre of the channel.
Table 27. Serpentine chip-based 1A2-CEC data acquired at 34 °C.
Average (n=107) SD %CV
Peak Area 13.7 2.81 20.5
Peak Height 0.5 0.09 18.1
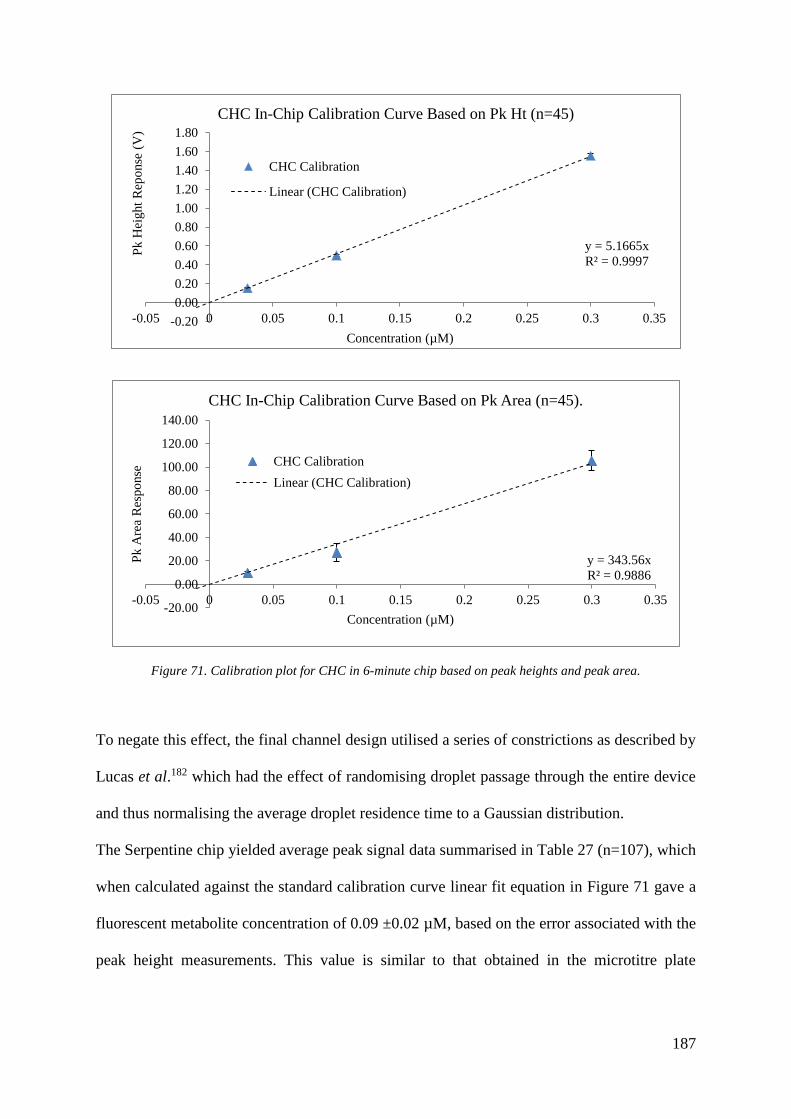
187
Figure 71. Calibration plot for CHC in 6-minute chip based on peak heights and peak area.
To negate this effect, the final channel design utilised a series of constrictions as described by
Lucas et al.182 which had the effect of randomising droplet passage through the entire device
and thus normalising the average droplet residence time to a Gaussian distribution.
The Serpentine chip yielded average peak signal data summarised in Table 27 (n=107), which
when calculated against the standard calibration curve linear fit equation in Figure 71 gave a
fluorescent metabolite concentration of 0.09 ±0.02 µM, based on the error associated with the
peak height measurements. This value is similar to that obtained in the microtitre plate
y = 5.1665x
R² = 0.9997
-0.20
0.00
0.20
0.40
0.60
0.80
1.00
1.20
1.40
1.60
1.80
-0.05 0 0.05 0.1 0.15 0.2 0.25 0.3 0.35
Pk H
eight
Rep
onse
(V
)
Concentration (µM)
CHC In-Chip Calibration Curve Based on Pk Ht (n=45)
CHC Calibration
Linear (CHC Calibration)
y = 343.56x
R² = 0.9886
-20.00
0.00
20.00
40.00
60.00
80.00
100.00
120.00
140.00
-0.05 0 0.05 0.1 0.15 0.2 0.25 0.3 0.35
Pk A
rea
Res
po
nse
Concentration (µM)
CHC In-Chip Calibration Curve Based on Pk Area (n=45).
CHC Calibration
Linear (CHC Calibration)

188
reaction at t=6 minutes, where the concentration of metabolite was calculated to be about
0.06 µM.
9.1 Summary & Conclusions
9.1.1 Serpentine Incubation Chip
The data provided a CHC control activity signal from the enzyme reaction after 6 minutes
incubation very close to that obtained in the microtitre plate experiment, suggesting the
shorter Serpentine chip was a useful option in which to conduct the P450 cytochrome assay.
However, the experiments did not test the reproducibility and functionality of the chip for
delivering quantifiable IC50 data using a range of inhibitor concentrations. The work
involving a full repeat IC50 determination using the Serpentine chip is detailed in chapter 10.

189
10 Results & Discussion: PROTEIN BLOCKING
In this chapter, the fluorescent tagging of a surrogate protein and the use of blocking proteins
is discussed. Results for tests using fluorescence microscopy to investigate the potential for
proteins to bind or localise at the droplet interface are described. As discussed in the
introduction, the interaction of proteins and enzymes at liquid interfaces has been well
documented in other areas of protein science and to a degree has be considered in
microfluidics, however each case is different, and as such, the impact this effect has on the
enzyme assay used in this project is largely unknown. The impact of using blocking proteins
co-administered to the enzyme reaction to affect the reaction signal is also described.
10.0.1 Determination of Fluorescent Tag
F/P ratio was determined to be approximately 0.15 which was considered high enough to
allow fluorescent measurements of the labelled protein. Absorbance data for the unlabelled
(green plot) versus labelled protein (red plot) is shown in Figure 72.
Figure 72 Absorbance spectra for unlabelled and FITC-labelled ‘Protein A’. The green plot represents the
absorbance profile of unlabelled ‘Protein A’ and the red plot that of FITC-labelled ‘Protein A’.
0
0.02
0.04
0.06
0.08
0.1
0.12
0.14
0.16
0.18
0.2
250 300 350 400 450 500 550 600
AB
S
Wavelength / nm
Blank
Average FITC-Protein A (n = 4)
Average Protein A(n=3)

190
10.0.2 Labelled Proteins at the Droplet-Oil Interface
Separately, solutions of fluorescein and FITC labelled 'Protein A' solution were flowed into
the Reservoir chip and the droplets analysed by fluorescent microscopy. Comparison of
epifluorescent detection between droplets containing just fluorescein in phosphate buffer
(PB) and those of FITC-labelled ‘Protein A’ solutions in PB yielded substantially different
results. As depicted in Figure 73i, fluorescein-only droplets had a uniform fluorescence
across the entire droplet diameter, whereas FITC-labelled ‘Protein A’ (Figure 73ii) showed a
pronounced bias of fluorescence around the circumference, seen as a ‘ring’ of light.
Figure 73(i) Droplets containing phosphate buffered fluorescein (1 µM) as measured by epifluorescence at 405
nm. (ii) Pixel analysis using ImageJ software of section indicated by the yellow line. (iii) Droplets containing
FITC-labelled ‘Protein A’ as measured by epifluorescence at 405 nm. The FITC label concentration was
determined to be approximately similar to the stock fluorescein droplets seen in (i) and thus able to provide a
signal of similar magnitude under the same acquisition conditions. Notably, droplets containing labelled protein
show a distinct ring of fluorescence compared to droplets containing just fluorescein. This is suggestive of
fluorophore localisation at the droplet interface due to surface protein adsorption, as highlighted by the ImageJ
analysis (iv).
0
10
20
30
40
50
60
70
0 10 20 30 40 50 60 70 80 90
Inte
nsi
ty (
gre
y V
alu
es)
# Pixels
Pixel Luminescence
0
20
40
60
80
0 20 40 60 80Inte
nsi
ty (
gre
y V
alu
es)
# Pixels
Pixel Luminescence
(i) (ii)
(iii)
(iv)

191
The bias of fluorescence across the droplet diameter is represented in Figure 73(iii) and
73(iv). The images were scaled in ImageJ and the pixel intensity across the diameter plotted
against droplet size to yield a representation of the variance of fluorescence across the
droplet. Droplets in both cases were of equivalent size and the fluorescent signal of similar
overall intensity.
Figure 74. (i) Droplets containing phosphate buffered fluorescein (1 µM) as measured by confocal laser
scanning microscopy at 405 nm. No apparent change in fluorescent intensity is observed from one side of the
droplet to the other, especially in the middle images of the series representing the droplet maximum cross
section. Each image represents an 8 µm incremental shift in the focal plane acquired. Some evidence of a
droplet-chip contact patch is seen as highlighted by the blue box. (ii) Droplets containing FITC-labelled
‘Protein A’ as measured by laser scanning confocal microscopy at 405 nm. As the acquired data moves from
one side of the droplet towards its contact patch with the chip (blue box), a pronounced ‘ring’ is observed at the
outer edge of the droplet, suggestive of a localised FITC-protein fluorescence concentration.
The data shown in Figure 73(iii) suggests the localisation of fluorescent material around the
droplet perimeter, evidenced by the ‘ring’ of light around the droplet circumference (Figure
73(iv). If this was simply an artefact of light refraction, it is reasonable to assume this would
have been seen for fluorescein-only droplets, which was not evident. The brighter region
(i)
(ii)

192
seen at the centre of each FITC-labelled protein droplet was assumed to be observation of the
same fluorescence surface localisation effect visualised in the z-plane. Notably, this centre-
of-droplet highlight is not observed in the fluorescein-only droplets.
To provide confirmation of fluorescent localisation, the same droplet tests were performed
and quantified by laser-scanning confocal microscopy. Figure 74(i) depicts the images
acquired for fluorescein-only droplets and Figure 74(ii) for droplets containing the labelled
protein. Each image represents a 'slice' of 8 µm thickness in the Z plane of the droplet. The
images result from each droplet being scanned from the bottom to the top, relative to the chip
on the microscope stage.
In the case of the fluorescein-only droplets, no significant variation of fluorescent intensity
was observed from the centre to interfacial surfaces of the droplets, depicted as a uniform
green colour for each of the slice images in Figure 74i. For droplets containing FITC-
labelled ‘Protein A’ solution, a ring of higher intensity fluorescence is seen as the confocal
imaging slices through the droplet, indicated by the red box in Figure 74(ii). As with the
epifluorescence images, a secondary area of higher intensity is seen as the acquisition slice
moves towards the edge of the droplet in contact with the plastic of the chip, indicated by the
blue boxes in Figure 74(i) & (ii).
A similar result was observed for FITC-labelled casein, as depicted in Figure 75. A ‘ring’ of
higher fluorescence became apparent about halfway through the imaging sequence (red box).
Figure 75. Droplets containing FITC-labelled casein (FITC effective concentration ~ 8 µM) as measured by
confocal laser scanning microscopy at 405 nm.

193
Both epifluorescence and laser scanning confocal microscopy for labelled Protein A and
casein, both revealed a marked tendency for a ‘ring’ of concentrated fluorescence around the
droplet perimeter. This was not evident when observing fluorescein-only containing droplets
which suggested the ‘ring’ is a real effect and not an optical artefact resulting from light
scattering and/or refraction.
10.0.3 Droplet Formation in the Presence of Blocking Proteins
Data obtained from the labelled protein experiments suggested localisation of material at the
droplet interface. The blocking protein experiments were designed to attempt mitigation of
this effect by preferentially saturating the droplet interface with a surrogate protein at higher
concentration such that the material of interest (the cytochrome P450 enzyme) would not
bind to the droplet perimeter. Initially, it was important to confirm robust and reproducible
droplet formation when using blocking proteins in the enzyme-substrate solution.
Casein, gelatin and BSA were dissolved in PB at three different concentrations and tested in
the droplet reservoir chip (Figure 76). Only gelatin and BSA were found to be useable over
the full concentration range tested up to 1 mg/mL. At concentrations greater than 50 µg/mL
casein had a pronounced effect on droplet formation and stability in that droplets were
observed to deform significantly. The deformation was worst at 1 mg/mL (Figure 76, top
left). The droplet deformation seen with casein, was considered excessive and this material
was not pursued further for the experiments investigating the effect of blocking protein on the
1A2-CEC reaction and subsequent IC50 determinations.
The impact of blocking proteins on the enzyme signal and IC50 data is considered in
subsequent sections.

194
Figure 76. Casein at 1 mg/mL in phosphate buffer (top left). A pronounced deformation of droplets is seen
which was not the case in either BSA (top right) or gelatin (bottom) at 1 mg/mL.
10.0.4 Impact of Blocking Proteins on Cytochrome 1A2 Enzyme Reaction
The serpentine chip was used to acquire all data reported in this section, which concerns the
potential of blocking proteins to attempt the recovery of the cytochrome P450 enzyme
reaction signal.
Three concentrations of gelatin, and, separately, the same three concentrations of BSA were
titrated to the enzyme-substrate solution as blocking proteins. The data (Figure 78) showed
that when compared to the data at 6 minutes when not using blocking protein, gelatin and
BSA appeared to have a substantial positive effect on the control activity signal obtained with
an almost doubling of control signal at 1000 µg/mL gelatin. For comparison, the same
1 mm 1 mm
1 mm

195
experiments conducted in the microtitre plate (Figure 77), yielded no discernible difference in
signal output whether blocking protein was present or not.
Figure 77. Microtitre plate 1A2-CEC control activity reaction measured at t=6 and t=20 minutes without any
blocking protein. Data included for three concentrations each of gelatin and BSA as blocking protein. No
significant impact on control activity signal is seen for either of the blocking protein at any concentration,
which was expected in the small surface area-to-volume ratio for microtitre plate environments. Plate data at
t=20 minutes is included for comparison.
Microtitre plate: 1A2-CEC Control Activity (CA)
[Protein]
(µg/ml) Plate CA SD
Gelatin µg/ml t6 Plate 50 4113 246.8
500 4556 414.6
1000 3915 348.4
BSA µg/ml t6 Plate 50 3597 104.3
500 2966 127.5
1000 4182 464.2
No blocker t6 Plate - 3788 491.7
No blocker t20 Plate - 13579 502.3
0
5000
10000
15000
50 µg/ml 500
µg/ml
1000
µg/ml
50
µg/ml
500
µg/ml
1000
µg/ml
t6 mins t6 mins t6 mins t20 mins
Gelatin BSA No
blocker
No
blocker
RF
U
Control Activity (microtitre plate) Gelatin t6 mins 50 µg/ml
Gelatin t6 mins 500 µg/ml
Gelatin t6 mins 1000 µg/ml
BSA t6 mins 50 µg/ml
BSA t6 mins 500 µg/ml
BSA t6 mins 1000 µg/ml
No blocker t6 mins
No blocker t20 mins
n=8
n=3n=3 n=3

196
This was expected due to the much smaller surface area to volume ratio encountered in the
microtitre plate well, thus the blocking protein serves little purpose in respect of stopping
interaction of the enzyme at surface interfaces compared to in the droplet where the surface
area to volume ratio is large and thus the enzyme is more likely to undergo surface interface
interactions.
Figure 78. Serpentine 6 minute chip 1A2-CEC control activity reaction measured. Most attempts to obtain a
signal at t=20 (spiral chip) failed. Only the t=6 minute chip yielded a control activity signal that could be
reproducibly quantified to enable the effect of different concentrations of blocking protein to be observed. As a
result of the relatively large deviation between data at different blocking protein concentrations, it is not
possible to conclude an obvious quantifiable effect of the blocking protein on control activity over the 20 fold
protein range tested, other than the suggestion of a trend for gelatin where higher concentrations result in a
higher signal and for BSA where higher concentrations appear to diminish the signal after an initial increase.
Overall, the control activity signal was increased when using blocking proteins.
Microfluidic chips: 1A2-CEC Control Activity (CA)
[Protein] (µg/ml) Chip CA pk height SD
t6 chip 50 1.1 247
500 1.39 415
1000 1.52 348
t6 chip 50 1.2 104
500 1.26 127
1000 1.01 464
t6 chip - 0.38 491
t20 chip - 0 502
-3.5
6.5
16.5
26.5
36.5
46.5
56.5
66.5
76.5
50 µg/ml 500
µg/ml
1000
µg/ml
50 µg/ml 500
µg/ml
1000
µg/ml
t6 mins t6 mins t6 mins t20 mins
Gelatin BSA No
blocker
No
blocker
Pea
k A
rea
Control Activity (DMF) Gelatin t6 mins 50 µg/ml
Gelatin t6 mins 500 µg/ml
Gelatin t6 mins 1000 µg/ml
BSA t6 mins 50 µg/ml
BSA t6 mins 500 µg/ml
BSA t6 mins 1000 µg/ml
No blocker t6 mins
No blocker t20 mins
n=342 n=246
n=308 n=297
n=216
n=213
n=286

197
Figure 78 summarises the data obtained for the Serpentine droplet incubation chip. A
substantial increase in signal is obtained when using gelatin, and although the standard
deviation associated with each measurement is relatively high (caused by variation in the
peak height and areas obtained over each quantified droplet series), the data suggested an
overall recovery towards the level of control activity seen in the microtitre plate experiment.
When using BSA, the quantified signal appeared lower, although taking account of the error
associated with the recorded data, this may be comparable to that obtained with gelatin. BSA
is known to sequester compounds through non-specific binding237,238, which could account for
a lower signal due to competitive binding with the CEC substrate.
10.0.5 Impact of Blocking Proteins on Cytochrome 1A2-CEC pIC50
In this section, the cytochrome P450 enzyme inhibition reaction is considered from the
perspective of how the reported inhibitor IC50 may be affected by the inclusion of blocking
proteins to the reaction. All IC50 data has been log transformed to pIC50 for easier data
visualisation.
Addition of gelatin to the 1A2 reaction in the microtitre plate was observed to decrease the
apparent potency of fluvoxamine by approximately one order of magnitude, seen by a
decrease in pIC50 (Figure 79). This effect could be explained by interaction of the high
concentration of the blocking protein in the well with the substrate and/or reactive enzyme
pocket. Fluvoxamine pIC50 was also observed to decrease in the droplet tests by about the
same amount when using gelatin (Figure 80). In both microtitre plate and droplet tests, the
change in pIC50 is more variable when using BSA which may be caused by greater non-
specific interaction of the BSA with the inhibitor and/or substrate.

198
Figure 79. Microtitre plate pIC50 data for fluvoxamine. Overall, the pIC50 data suggests the presence of
blocking protein co-administered to the incubate reduces the apparent potency of the fluvoxamine inhibitor.
For gelatin, the pIC50 appears to increase as the concentration if gelatin increases. For BSA, the data is more
variable, which may be explained by interaction of BSA with the inhibitor and/or substrate at different
concentrations.
6.00
7.00
8.00
50 µg/ml 500 µg/ml 1000
µg/ml
50 µg/ml 500 µg/ml 1000
µg/ml
t6 mins t6 mins t6 mins
Gelatin BSA No blocker
pIC
50
pIC50 fluvoxamine (microtitre plate)
Gelatin t6 mins 50 µg/ml
Gelatin t6 mins 500 µg/ml
Gelatin t6 mins 1000 µg/ml
BSA t6 mins 50 µg/ml
BSA t6 mins 500 µg/ml
BSA t6 mins 1000 µg/ml
No blocker t6 mins
Microtitre plate: Fluvoxamine IC50
IC50
(µM) pIC50
Gelatin µg/ml t6 Plate 50 0.34 6.47
500 0.3 6.52
1000 0.08 7.10
BSA µg/ml t6 Plate 50 0.05 7.30
500 0.60 6.22
1000 0.14 6.85
No blocker t6 Plate - 0.03 7.49

199
Figure 80. Micro droplet IC50 data for fluvoxamine. Overall, the pIC50 data suggests the presence of blocking
protein co-administered to the incubate reduces the apparent potency of the fluvoxamine inhibitor. For gelatin,
the pIC50 appears largely unaffected by gelatin concentration, whereas for BSA, the data suggests there may be
a concentration dependency on the observed pIC50.
Microfluidic chip: Fluvoxamine IC50
IC50 (µM) pIC50
Gelatin µg/ml t6 chip 50 0.31 6.51
500 0.40 6.40
1000 0.14 6.86
BSA µg/ml t6 chip 50 0.25 6.61
500 0.19 6.72
1000 0.007 8.15
No blocker t6 chip - 0.028 7.56
6.00
7.00
8.00
50 µg/ml 500 µg/ml 1000
µg/ml
50 µg/ml 500 µg/ml 1000
µg/ml
t6 chip t6 chip t6 chip
Gelatin BSA No blocker
pIC
50 /
µM
pIC50 fluvoxamine (DMF) Gelatin t6 chip 50 µg/ml
Gelatin t6 chip 500 µg/ml
Gelatin t6 chip 1000 µg/ml
BSA t6 chip 50 µg/ml
BSA t6 chip 500 µg/ml
BSA t6 chip 1000 µg/ml
No blocker t6 chip
n=308 n=297
n=216
n=287n=342
n=250
n=213

200
10.1 Summary & Conclusions
10.1.1 Fluorescent Tagging of Proteins & Labelled Proteins at the Droplet
Interface
Although the tests are purely qualitative, with no quantitative reference to the amount of
fluorescence observed, and hence the concentration of protein resident at the droplet
interface, the results suggest a pronounced surface localisation of protein in the droplet. This
could certainly explain the lack of enzymatic reaction seen in the droplet P450 cytochrome
experiments described previously. Some caution is exercised here as the labelled protein,
whilst a large macromolecule similar in size to the P450 cytochrome protein construct, is
different and may behave differently at the interface. However, it can be assumed the P450
cytochrome assay was affected by localisation of the material to the droplet interface,
possibly affecting its activity and reaction profile.
Furthermore, the number of molecules in a droplet of 14 nL volume at the intended incubate
concentration of 10 nM is relatively low. A large percentage of these molecules could be
bound to the droplet interface, and if rendered inactive, the substrate would not be
metabolised to the fluorescent product, explaining the lack of a signal previously seen.
10.1.2 Droplet Formation in the Presence of Blocking Proteins
Of the three proteins used tested for use as blocking proteins, only gelatin and BSA were
found to be suitable for use up to 1 mg/mL. Casein when used above 50 µg/mL in the PB
solution resulted in droplets that deformed significantly and was thus not pursued in further
testing.

201
10.1.3 Impact of Blocking Proteins on the Cytochrome P450 Reaction
The addition of blocking proteins at concentrations well in excess of the cytochrome P450
enzyme concentration used in these studies (10 nM incubate) were shown to have a positive
impact on recovering the available CHC signal produced from the enzyme reaction.
Equivalent tests performed in the microtitre plate assay did not reveal any signal
improvements. This suggested that the inclusion of blocking proteins to the droplet-based
enzyme reaction was able to reduce binding or interaction of enzyme to the droplet interface;
an effect only seen in the high surface area-to-volume ratio environment of the droplet.
Experiments conducted in the droplet format using blocking proteins also yielded evidence
that although the signal can be improved, there is the potential for the pharmacology of the
stem to be affected. In this case, this was seen as a shift in the reported pIC50 for the
fluvoxamine inhibitor. Caution must therefore be applied if requiring the use of secondary
materials to control interfacial artefacts in droplet microfluidic systems.

202
11 SUMMARY, CONCLUSIONS & FURTHER WORK
11.1 Summary
The aim was to investigate the feasibility of designing a proof of concept droplet microfluidic
device for performing biochemical cytochrome P450 enzyme inhibition studies in a micro
droplet environment, and how this would enable up-scaling of these assays in a routine
industrial screening environment. This approach would enable significant reductions in the
volume and hence cost of all reagents used to perform this type of assay when compared to
existing 96-, 384- or 1536-well microtitre plate formats. As part of the investigation, the
biphasic nature of the microfluidic environment meant it was necessary to consider the
potential for partitioning of materials from the dispersed droplet aqueous phase to the carrier
organic phase and the impact this may have on biochemical reaction and quantification.
Whilst it was not possible to exhaustively test all compounds’ chemistry, a selection of
common drugs were used in the test to provide a representative assessment. These studies
were conducted both on a ‘test tube’ scale, and as microtitre plate experiments. Thus
assumptions were made about a planar liquid interface compared to the spherical interface in
the droplet environment, and within experimental polymer microfluidic devices to provide
data more representative of the droplet environment. A range of oils were initially tested
with respect to droplet formation and in the test tube partitioning studies.
The fluorous oil, FC-70, was shown to form droplets very reproducibly and to have the
lowest partitioning potential in the glass vial experiments, so was subsequently tested in the
microtitre plate and chip droplet experiments.
The extent of compound partitioning from aqueous phase to fluorous oil for representative
drug discovery AZ compounds was conducted in 384-well microtitre plates. A model was
203
built on valid data obtained from two rounds of experimentation comprising 1406 diverse
chemical structures. This study indicated the potential for a number of compound chemistries
to be prone to fluorous phase partitioning, however only 5 compounds from 475 confirmed
results showed substantial partitioning greater than 70% which was lower than first expected
based on the initial glass vial tests.
Using the AZ compound partitioning data, a Bayesian score molecular fingerprint-based
model was built to attempt prediction of fluorous solubility. A further set of compounds were
selected based on the initial model output and experimentally tested to indicate model
accuracy. Of 187 valid compound results, only 9 were correctly predicted to be compounds
expected to partition > 20 % with the remaining 178 compounds which were also predicted to
partition >20 % found in the –20 to 20 % group . Whilst the model is not highly predictive at
this stage, it is envisaged that perhaps with further enrichment using data from a much larger
experimental test, it would be possible to increase the predictive ability of the model. The
poor correlation of the predictions provided by the fluorous solubility model to experimental
data suggested the range of physicochemical properties specified alone do not have a
significant bearing on the chemistry of fluorous solubility. There is perhaps reason to suggest
that a better prediction of fluorous solubility might be obtained if electronegativity data is
included in the model analysis and a closer consideration of fluorine bond lengths and bond
enthalpies to take account of fluorine chemistry which significantly differs to conventional
organic chemistry.
A range of construction techniques were considered for the microfluidic devices required.
The chosen approach of a CNC-machined, polymer-based chip using an optically transparent
microtitre plate seal, was based on the availability of the equipment necessary to machine the
plastic and the relative ease by which a number of devices could be produced in quick
succession for iterative design-make-test processes.

204
Initial tests concerning P450 enzyme inhibition assays included studying the linearity and
apparent limit of detection of standard metabolite curves over the concentration range 0.1 µM
to 1 µM in the microtitre plate compared to those conducted in the microfluidic chip. Good
agreement was seen with variability well controlled at typically less than 10 %. Secondly,
enzyme-substrate experiments were conducted in the Spiral and Serpentine microfluidic chips
to assess how this reaction proceeded in the droplet environment compared to the microtitre
plate. In the case of the Spiral chip, on only one occasion was it possible to obtain data that
yielded a strong enough signal to quantify the IC50 of the fluvoxamine inhibitor, yet this did
produce a value consistent with literature data (~0.03 µM). The shorter incubation
Serpentine chip did yield a reproducible enzyme reaction data that also closely matched the
data obtained in the equivalent microtitre plate tests.
Based on the outcome of these experiments, further work was completed investigating the
apparent effect of the droplet environment upon the enzyme/protein used. A qualitative study
was employed to provide evidence of protein adsorption to the droplet-oil interface,
hypothesised as a significant cause of the lack of enzyme activity found in the droplet P450
cytochrome studies. In this work, epifluorescence and laser scanning confocal microscopy in
conjunction with a static droplet reservoir chip were used to study the presence of
fluorescently labelled proteins localised at the droplet interface. The results indicated a
substantial localisation of fluorescently labelled protein at the interface, supporting the
hypothesis that P450 enzyme may be binding at the droplet interface, adversely affecting the
reaction with the CEC substrate. Following this, a series of tests were completed to
quantitatively assess the impact three different blocking proteins co-administered to the
droplets had on the P450 enzyme activity and how changes of pharmacology in terms of
pIC50 shift were observed. Casein as a blocking protein was not pursed further following
droplet formation tests that revealed this material to render droplets ‘sticky’ and deformed
205
within the chip. BSA and gelatin were successful at largely restoring cytochrome P450
enzyme activity, although there was evidence the presence of the blocking proteins in the
reactant droplets affected pharmacology, seen as an increase in the reported IC50 by about 1
order of magnitude.
11.2 Conclusions
11.2.1 Partitioning of Compound from the Droplet
Testing of compounds with respect to partitioning in a biphasic environment is by no means
trivial when significant numbers of compounds are concerned. On a small scale, it is feasible
to characterise the partitioning of all compounds used within the study, however at the scale
of industrial compound libraries and HTS, this task would become prohibitively time
consuming, thus the use of predictive models to provide informative data ahead of
experimental testing would be of high value in this area of research. Rank ordering of
compounds in respect of partitioning conducted in silico offers a means to identify classes of
compounds that may be challenging to assay/analyse in droplets.
There are assumptions made from the data obtained in the tests presented in this work that
may not fully represent certain specific cases; for example, specialised chemistry such as
organometallic compounds or chelating properties may affect partitioning in ways not
predicted by the model presented. The purpose of the partitioning experiments detailed is not
intended to be a fully quantitative assessment, but rather an indicator that may be
extrapolated to a wider population of chemistry. Much of the recent research in leakage of
compounds from droplets, described in chapter 1, concerns small molecule fluorescent dyes
which are not wholly representative of the wide chemistry that will be explored in drug

206
discovery. This may in part be due to the relative scarcity of large compound collection sets
available outside of the pharma industry and the cost of obtaining such libraries. The attempt
in this project to characterise partitioning for a diverse pharmaceutical compound set is
important in further defining and understanding the relevance partitioning has for droplet
microfluidics applied to drug discovery screening.
As discussed in Chapter 1, research into the impact of surfactants on biochemical assay is
varied and certainly not complete. Fluorous phases and fluorosurfactants have become
somewhat commonplace in droplet microfluidics, yet there is still no complete set of studies
that fully characterise or describe their use. Non-ionic fluorosurfactants were considered as a
way to control non-specific adsorption of proteins at the droplet interfaces (Roach et al.176)
and yet in this project, despite attempting to replicate such fluorosurfactants, it was found that
the fluorosurfactant synthesised for this project did not prevent P450 cytochrome enzyme
from interacting with the droplet interface and was observed to adversely affect leakage from
the droplet. However, it was successful in providing stable droplet formation.
The possibility of extensive leakage from the aqueous to oil phase in droplet MF is a key
issue, that unless appropriately addressed by including internal controls for every compound
tested, or using blocking proteins to reduce partitioning to within acceptable limits, may
prove be a significant limiting factor that reduces the scope of application. In a worst-case
scenario, droplet microfluidic technology may not be best placed within a screening
environment. Instead, the results suggest that droplet microfluidics may be better utilised
within specific niche applications where high degrees of miniaturisation can benefit the
overall process, but, crucially, the materials studied are well characterised.

207
11.2.2 Enzyme Inhibition & Proteins at the Droplet Interface
In addition to the concerns of compound partitioning, further problems arise when using
proteins and enzymes in droplets where adsorption at the droplet interface can lead to
conformational change or binding site blockage resulting in an observed loss of enzyme
reactivity. Simply increasing the overall droplet enzyme / protein concentration may be
effective in negating the effect of interface adsorption; however this is then counter to a key
advantage of miniaturisation by microfluidics as the level of reagents needed for each test is
increased. As described before, blocking proteins can be used to reduce the effect of
interface interaction of the protein being studied, however this may then result in
pharmacology changes which have to be considered and appropriately assessed.
Miniaturisation of the cytochrome P450 inhibition assay, as detailed in chapter 2, was
partially successful after inclusion of blocking proteins to recover the reaction signal.
However, it is clear from the initial attempts using the Spiral chip that a simple scaling-down
translation of this assay from microtitre plate to droplet format was not successful. To deliver
a robust working assay, more work is required in addressing the underlying challenges of
partitioning and the science of proteins/enzymes at liquid interfaces. Significant re-
optimisation and validation of any assay transferred to a droplet format is most likely
required before useful data can be obtained, if indeed a suitable set of conditions can be
found that are acceptable and reproducible.
11.2.3 Droplet Technology as an Industrial Screening Tool
Aside from the observed problems associated with partitioning and loss of P450 cytochrome
activity in this work, an additional complication arises in the means of introducing reagents

208
into microfluidic devices. This was out of scope for this project being a sizeable issue in its
own right. Paradoxically, the proof of concept methods for droplet tests employed in this
work use relatively large quantities of reagents, which equals or exceeds that required for a
single microtitre plate assay, negating the point of miniaturisation. For droplet-based
technology to be successful as a large-scale screening tool, a more efficient means of
introducing reagents to microfluidic devices must be found.
11.3 Further work
A number of key areas have been identified that require addressing if droplet microfluidic
technology can prosper as an alternative or complementary screening tool within drug
discovery. In this section, critical aspects of current technological challenges, limitations and
future aspirations of droplet microfluidics are discussed, with an accompanying discussion on
potential approaches to address a number of identified issues. In addition, there is a
requirement to further investigate the extent of partitioning between phases in droplet
microfluidic systems and the impact this may have on the use of droplet microfluidics in
routine screening.
11.3.1 Predictive Model Development
The model described in this work to predict for compound partitioning was found to be
largely unsuccessful in defining an accurate correlation between fluorous phase solubility and
compound chemistry. As described previously, the data set available for training the model
was probably too small to allow a robust prediction to evolve, given the apparent complexity
of the number of physicochemical parameters that may ultimately describe the tendency for

209
fluorous phase solubility. Alternatively, the model is not correlating the correct parameters,
and as such, the current design may have little chance of ever being enriched with additional
data to achieve the desired outcomes.
To address this, considerable further experimentation should be undertaken to provide a
greater pool of data from which to build training and test sets to determine if higher
prediction accuracy can be achieved. If no model improvement is obtained by expanding the
data pool, other model definitions may be explored, where molecular structure and
physicochemical properties are considered in different ways to generate predictive
correlations. In addition, other experimental designs could be considered that offer a faster
way to test large numbers of compounds, such as chromatographic systems using fluorous
stationary phases where differing compound retention may correlate to greater fluorous oil
solubility.
11.3.2 Reagents Into Microfluidic Devices
A primary challenge to render droplet microfluidics useful from an industrial at-scale
screening tool perspective is the ability to inject reagents, and particularly, large numbers of
diverse compounds, into droplet systems in a manner that is both robust and easy for the
scientist to employ. This problem was solved for current microtitre plate based processes
through the co-emergence of robotic pipetting stations and liquid-handling robots capable of
dispensing multiple compounds many times to a multitude of plate types. To realise the full
potential of microfluidics, a similar solution is required, so that many compounds can be
studied in DMF systems either in parallel or sequentially. This will be essential to apply
microfluidic technology in early stage high throughput screening where compound library
collections may rise to an excess of 2 million compounds for large pharmaceutical collection
libraries, or where it is advantageous to perform screens for smaller compound sets or an

210
individual compound against many multiple biochemical or cell-based targets
simultaneously. Given the high level of financial investment in microtitre plate-based
technology across the drug discovery industry, it is understandable the industry sector may
not be ready to abandon entirely its current screening platforms, especially as an alternative is
not yet immediately ready for at-scale routine screening processes. Thus, for microfluidics to
be successful, microfluidics must easily interface with existing technologies.
In introducing compounds into microfluidic systems at larger throughput levels, it is desirable
to utilise existing liquid handling and plate-based equipment where possible. However, this
is not a trivial problem; microfluidic systems in research tend to be closed systems where
reagents and compounds are often supplied to the chips via syringe pumps, or other closed
positive displacement mechanism. Such an approach cannot be used for many different
compounds in succession, as constant disconnection and reconnection of vessels and changes
in system operating pressure will lead to air ingress and destabilisation. To avoid these issues
and yet achieve easy integration to the outside plate-based lab environment, it follows, for
example, that either a clever way of supplying compounds to a chip by dispensing directly
should be found, or by using a negative pressure driven chip to ‘pull’ compounds and
reagents from other vessels into the microfluidic device. Considering the above former
option, Raindance Technology utilised a way in which all the reagents required are added to
modified Eppendorf-type reservoirs which are then pushed into the microfluidic system using
a regulated gas pressure to displace fluid from the reservoirs. Importantly, this closed-loop
approach minimises air ingress, however requires complete replenishment between
experiments. By contrast, the droplet qPCR system developed by BioRad, utilises a system
whereby reagents are dispensed by any conventional means to the chip, followed by
application of a sealed pressure manifold to drive fluids through the device239,240. However,
this too is limited by the number of samples per experiment and does not enable the efficient

211
processing of the thousands or even just hundreds of compounds required per experiment in
early phase screening.
A further requirement may also arise from the opportunity of process streamlining and
efficiency gains that microfluidics can offer. As we have seen previously, typical HTS
campaign cascades for large compound libraries will progress from an initial single
concentration point primary screen, through confirmation screens, to concentration response
for confirmed actives. Currently, this places a large demand upon HTS centres in terms of
consumables, cost and the time it takes to progress compounds through the screening
cascade, which may run up to 6 months from start to end. Microfluidics could reduce this
burden by screening all compounds at concentration response in the primary assay, thereby
realising significant reagent and consumable cost reduction and also significantly shorter
campaign duration. To satisfy this, microfluidic devices will have to be designed in such a
way that compounds can be introduced to the system easily and robustly.
Niu et al.241 presented a novel means of generating dose response curves in a droplet
generator whereby incoming droplets of diluent collided with pre-loaded sample plugs within
the device. The chip channel design resulted in a daughter droplet of lower concentration to
be sheared off. The limitation of this approach lies in the requirement to preload samples to
the chip which for 100’s or 1000’s of compounds becomes a nearly impossible task to
achieve in a manner that is at least as cheap or easy as creating dose response curves in a
1536-well plate.
The ‘Mitos Dropix’ microfluidic dropletiser device developed in collaboration between Drop-
Tech (Cambridge, UK)45 and Dolomite Microfluidics (Royston, Cambridge, UK) offers a
way of sipping small quantities of several samples in a continuous manner to exclude ingress
of air to the downstream microfluidic chip device. Although currently limited to only 24
different samples at one time and thus not ideally suited to HTS at the moment, it shows
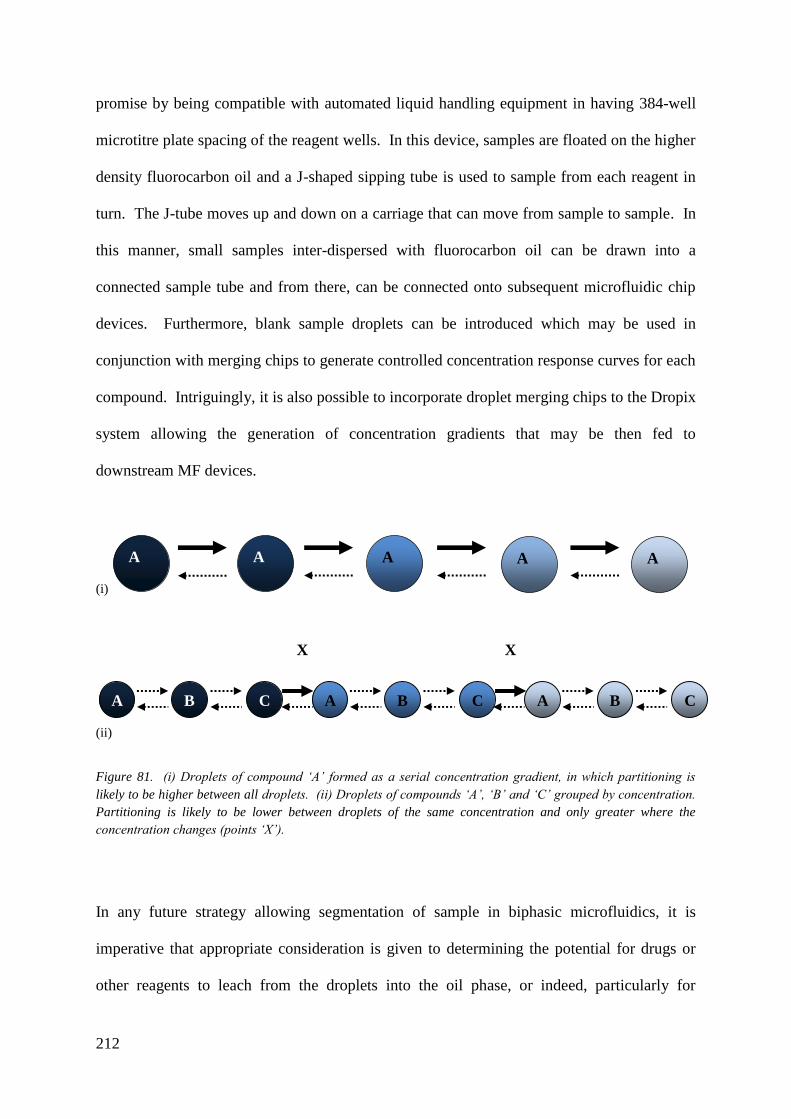
212
promise by being compatible with automated liquid handling equipment in having 384-well
microtitre plate spacing of the reagent wells. In this device, samples are floated on the higher
density fluorocarbon oil and a J-shaped sipping tube is used to sample from each reagent in
turn. The J-tube moves up and down on a carriage that can move from sample to sample. In
this manner, small samples inter-dispersed with fluorocarbon oil can be drawn into a
connected sample tube and from there, can be connected onto subsequent microfluidic chip
devices. Furthermore, blank sample droplets can be introduced which may be used in
conjunction with merging chips to generate controlled concentration response curves for each
compound. Intriguingly, it is also possible to incorporate droplet merging chips to the Dropix
system allowing the generation of concentration gradients that may be then fed to
downstream MF devices.
(i)
(ii)
Figure 81. (i) Droplets of compound ‘A’ formed as a serial concentration gradient, in which partitioning is
likely to be higher between all droplets. (ii) Droplets of compounds ‘A’, ‘B’ and ‘C’ grouped by concentration.
Partitioning is likely to be lower between droplets of the same concentration and only greater where the
concentration changes (points ‘X’).
In any future strategy allowing segmentation of sample in biphasic microfluidics, it is
imperative that appropriate consideration is given to determining the potential for drugs or
other reagents to leach from the droplets into the oil phase, or indeed, particularly for
A A A A A
A B C A B C A B C
X X

213
concentration response curves, to determine the extent of concentration gradient driven cross-
talk between droplets. Strategies to reduce these artefacts could include the use of pure
fluorocarbon oils using no surfactant, greater interspacing of droplets and, in the case of
concentration response curves, logical ordering of the droplets, grouping by each compound
and then concentration. In this arrangement, the gradient driven cross-talk would be more
likely to exist between a concentration of one compound and another concentration of
another compound, rather than between all droplets (Figure 81). Another option to reduce
cross-talk and partitioning is to avoid, where possible, using aqueous droplet environments
and use instead DMSO as a compound diluent, which being a better solvent for lipophilic
drug-like molecules, would be expected to increase solubility for many drug-like compounds.
11.3.3 Analytical Detection Methods
The majority of detection techniques employed within microfluidic technology research tend
to be spectrophotometric with some use of mass spectrometry (MS) and optical imaging (OI),
as previously described (pg. 50 onwards). Alternative techniques include: MS coupled to a
microfluidic system presents the possibility of conducting later-stage Lead Optimisation
assays based on hepatocytes or microsomes for intrinsic clearance studies where label-free
quantification of parent drug or its metabolites is required.
Optical imaging has found greater application in recent years in High Content Biology
screening (HCB) and is a powerful addition for phenotypic target identification. Throughput
is often lower than conventional HTS the requirement to conduct extensive imaging scans
(either laser scanning to generate a pseudo-image or genuine optical imaging) across multiple
fields of view at different wavelengths, such as would be required to interrogate cells stained
with different fluorophores, substantially increases the analysis time required. Droplet

214
microfluidic technology in particular may offer additional benefit to HCB by being capable
of both continuous flow and static modes, making it possible to design systems that can
perform HTS and HCB analysis in a one-flow process. To study cells in microfluidic
droplets, it may be necessary to render them stationary through the use of trap devices
allowing images to be acquired under zero flow conditions. The technical requirements for
droplet trapping and the ability to switch between flow and no-flow conditions are likely to
present additional challenges to the overall design of microfluidic systems. However, such
future developments in the area of droplet trapping and real-time imaging will add significant
value of microfluidics in phenotypic and high content biology screening.
11.3.4 Cell-Based Droplet Microfluidics
Despite a large volume of published work from academia and the biotech industry utilising
encapsulated cells, there are few reports of the widespread use of microfluidic cell
encapsulation within mainstream pharmaceutical drug discovery as a main screening
paradigm. A lack of understanding of how different cell types behave in such systems and
the previously outlined problems associated with compound introduction and leakage may all
contribute to an overall lack of confidence and certainty of how microfluidic technology may
succeed.
As discussed previously, agarose and alginate bead encapsulation have been reported, but
each report tends to be specific to a particular application and/or cell line. The emergence of
a more generic ‘best set’ of parameters that can be applied across a wide scope of cell-based
studies will foster a more consistent approach allowing a standard to develop that can be
commercialised more easily.

215
The potential of cell based encapsulation droplet microfluidics can be realised in two discrete
ways; i) reduction of cell numbers (100’s or 10’s of cells per test) to reduce assay costs, and
ii) single cell encapsulation to provide higher value data where cell-specific effects can be
evaluated.
Among the technological challenges of microfluidics, cell-based work is further complicated
by the necessity to ensure cell biology is not adversely affected by the nature of the system.
Cells may behave in unpredicted ways when compared to our current understanding of
microtitre plate cell assays. The limited volume of a bead or droplet will have a limited
quantity of the reagents required for cell survival and proliferation and the potential for
higher concentrations of toxins from cell metabolism may have a faster detrimental effect on
cell health. Thus, while MF may seem to be a desirable technology to reduce costs and
biology usage, this may be countered by limitations as to how long cell assays can operate for
in the MF system before cell apoptosis. Additionally, cell morphology may change as a
result of increased cell stress from the MF environment which in the worst case may result in
inaccurate data.

216
12 REFERENCES
1. Merten, C. A. Screening Europe 2010: an update about the latest technologies and
applications in high-throughput screening. Expert Rev Mol Diagn. 2010, 10, 559-563.
2. Litten, B. A.; Smith, R.; Banfield, E. An Automated 1536-Well Microplate Format
Cytochrome P450 Inhibition Assay Using a Tecan Freedom EVO Workstation with
Integrated Innovadyne Nanodrop II Dispenser. Journal of the Association for Laboratory
Automation 2010, 15, 58-64.
3. Berg, M.; Undisz, K.; Thiericke, R.; Moore, T.; Posten, C. Miniaturization of an Enzyme
Assay (β-Galactosidase) in the 384- and 1536-Well Plate Format. Journal of the
Association for Laboratory Automation 1999, 4, 64-67.
4. Ejendal, K. F. K.; Meyer, J. M.; Brust, T. F.; Avramova, L. V.; Hill, C. A.; Watts, V. J.
Discovery of antagonists of tick dopamine receptors via chemical library screening and
comparative pharmacological analyses. Insect Biochem. Mol. Biol. 2012, 42, 846-853.
5. Lamontagne, J.; Mills, C.; Mao, R.; Goddard, C.; Cai, D.; Guo, H.; Cuconati, A.; Block,
T.; Lu, X. Screening and identification of compounds with antiviral activity against
hepatitis B virus using a safe compound library and novel real-time immune-absorbance
PCR-based high throughput system. Antiviral Res. 2013, 98, 19-26.
6. Lim, K. T.; Zahari, Z.; Amanah, A.; Zainuddin, Z.; Adenan, M. I. Development of
resazurin-based assay in 384-well format for high throughput whole cell screening of
Trypanosoma brucei rhodesiense strain STIB 900 for the identification of potential anti-
trypanosomal agents. Exp. Parasitol. 2016, 162, 49-56.
7. Liu, B.; Li, S.; Hu, J. Technological advances in high-throughput screening. Am. J.
Pharmacogenomics 2004, 4, 263-276.
8. Morel, M.; Vanderstraete, M.; Cailliau, K.; Lescuyer, A.; Lancelot, J.; Dissous, C.
Compound library screening identified Akt/PKB kinase pathway inhibitors as potential
key molecules for the development of new chemotherapeutics against schistosomiasis.
International Journal for Parasitology: Drugs and Drug Resistance 2014, 4, 256-266.
9. Frederix, F.; Bonroy, K.; Reekmans, G.; Laureyn, W.; Campitelli, A.; Abramov, M. A.;
Dehaen, W.; Maes, G. Reduced nonspecific adsorption on covalently immobilized
protein surfaces using poly(ethylene oxide) containing blocking agents. Journal of
Biochemical and Biophysical Methods 2004, 58, 67.
10. Rebeski, D. E.; Winger, E. M.; Shin, Y.; Lelenta, M.; Robinson, M. M.; Varecka, R.;
Crowther, J. R. Identification of unacceptable background caused by non-specific protein
adsorption to the plastic surface of 96-well immunoassay plates using a standardized
enzyme-linked immunosorbent assay procedure. J. Immunol. Methods 1999, 226, 85-92.
11. Bosse, R.; Illy, C.; Elands, J.; Chelsky, D. Miniaturizing screening: how low can we go
today? Drug Discov. Today 2000, 5, 42-47.
12. Stevens, M. E.; Bouchard, P. J.; Kariv, I.; Chung, T. D. Y.; Oldenburg, K. R. Comparison
of Automation Equipment in High Throughput Screening. Journal of Biomolecular
Screening 1998, 3, 305-311.

217
13. DiMasi, J. A.; Grabowski, H. G.; Hansen, R. W. The Cost of Drug Development. N. Engl.
J. Med. 2015, 372, 1972-1972.
14. Harrison, C. Phenotypic screening: A more rapid route to target deconvolution. Nat Rev
Drug Discovery 2014, 13, 102-103.
15. Shi, W.; Qin, J.; Ye, N.; Lin, B. Droplet-based microfluidic system for individual
Caenorhabditis elegans assay. Lab Chip 2008, 8, 1432-1435.
16. Kogej, T.; Blomberg, N.; Greasley, P. J.; Mundt, S.; Vainio, M. J.; Schamberger, J.;
Schmidt, G.; Hüser, J. Big pharma screening collections: more of the same or unique
libraries? The AstraZeneca–Bayer Pharma AG case. Drug Discov. Today 2013, 18,
1014-1024.
17. AstraZeneca plc. Drug Discovery & Screening. Internal information 2000-2016
18. Chiang, P. C.; Hu, Y. Simultaneous determination of logD, logP, and pK(a) of drugs by
using a reverse phase HPLC coupled with a 96-well plate auto injector. Comb. Chem.
High Throughput Screen. 2009, 12, 250-257.
19. Yamashita, T.; Nishimura, I.; Nakamura, T.; Fukami, T. A System for logD Screening of
New Drug Candidates using a Water-Plug Injection Method and Automated Liquid
Handler. Journal of the Association for Laboratory Automation 2009, 14, 76-81.
20. Zdrazil, B.; Chichester, C.; Zander Balderud, L.; Engkvist, O.; Gaulton, A.; Overington,
J. P. Transporter assays and assay ontologies: useful tools for drug discovery. Drug
Discovery Today: Technologies 2014, 12, e47-e54.
21. Horst, R. L.; Reinhardt, T. A.; Beitz, D. C.; Littledike, E. T. A sensitive competitive
protein binding assay for vitamin D in plasma. Steroids 1981, 37, 581-591.
22. Shioya, H.; Shimojo, M.; Kawahara, Y. Determination in plasma of angiotensin-
converting enzyme inhibitor by inhibitor-binding assay. Journal of Chromatography B:
Biomedical Sciences and Applications 1991, 568, 309-314.
23. Honig, P. K.; Wortham, D. C.; Zamani, K.; Conner, D. P.; Mullin, J. C.; Cantilena, L. R.
Terfenadine-ketoconazole interaction: Pharmacokinetic and electrocardiographic
consequences. J. Am. Med. Assoc. 1993, 269, 1513-1518.
24. Brown, A. M. hERG Assay, QT Liability, and Sudden Cardiac Death. Cardiac Safety of
Noncardiac Drugs 2005, 67-81.
25. Atkinson, A.; Kenny, J. R.; Grime, K. Automated Assessment of Time-Dependent
Inhibition of Human Cytochrome P450 Enzymes Using Liquid Chromatography-
Tandem Mass Spectrometry Analysis. Drug Metabolism and Disposition 2005, 33, 1637-
1647.
26. Stresser, D. M.; Turner, S. D.; Blanchard, A. P.; Miller, V. P.; Crespi, C. L. Cytochrome
P450 Fluorometric Substrates: Identification of Isoform-Selective Probes for Rat
CYP2D2 and Human CYP3A4. Drug Metabolism and Disposition 2002, 30, 845-852.
27. Trubetskoy, O. V.; Gibson, J. R.; Marks, B. D. Highly Miniaturized Formats for In Vitro
Drug Metabolism Assays Using Vivid® Fluorescent Substrates and Recombinant
Human Cytochrome P450 Enzymes. Journal of Biomolecular Screening 2005, 10, 56-66.

218
28. Crespi, C. L.; Miller, V. P.; Stresser, D. M. Design and application of fluorometric assays
for human cytochrome P450 inhibition. In Methods in Enzymology Academic Press:
2002; Vol. Volume 357, pp 276-284.
29. Riley, R. J.; Grime, K. Metabolic screening in vitro: metabolic stability, CYP inhibition
and induction. Drug Discovery Today: Technologies 2004, 1, 365-372.
30. Hodgson, E.; Das, P. C.; Cho, T. M.; Rose, R. L. Phase 1 Metabolism of Toxicants and
Metabolic Interactions. In Molecular and Biochemical Toxicology John Wiley & Sons,
Inc.: 2008; pp 173-203.
31. Crespi, C. L.; Miller, V. P. The use of heterologously expressed drug metabolizing
enzymes - state of the art and prospects for the future. Pharmacology & Therapeutics
1999, 84, 121-131.
32. Lipinski, C. A.; Lombardo, F.; Dominy, B. W.; Feeney, P. J. Experimental and
computational approaches to estimate solubility and permeability in drug discovery and
development settings. Adv. Drug Deliv. Rev. 1997, 23, 3-25.
33. Lipinski, C. A. Drug-like properties and the causes of poor solubility and poor
permeability. J. Pharmacol. Toxicol. Methods 2000, 44, 235-249.
34. Yao, M.; Zhu, M.; Sinz, M. W.; Zhang, H.; Humphreys, W. G.; Rodrigues, A. D.; Dai, R.
Development and full validation of six inhibition assays for five major cytochrome P450
enzymes in human liver microsomes using an automated 96-well microplate incubation
format and LC–MS/MS analysis. J. Pharm. Biomed. Anal. 2007, 44, 211-223.
35. Litten, B. Automating metabolic inhibition assays - on a nanoscale. ISSUU 2006, 3, 21.
36. Grimm, S. W.; Einolf, H. J.; Hall, S. D.; He, K.; Lim, H.; Ling, K. J.; Lu, C.; Nomeir, A.
A.; Seibert, E.; Skordos, K. W.; Tonn, G. R.; Van Horn, R.; Wang, R. W.; Wong, Y. N.;
Yang, T. J.; Obach, R. S. The Conduct of in Vitro Studies to Address Time-Dependent
Inhibition of Drug-Metabolizing Enzymes: A Perspective of the Pharmaceutical
Research and Manufacturers of America. Drug Metabolism and Disposition 2009, 37,
1355-1370.
37. Lin, J. H.; Lu, A. Y. H. Role of Pharmacokinetics and Metabolism in Drug Discovery and
Development. Pharmacological Reviews 1997, 49, 403-449.
38. McDonnell, A. M.; H. Dang, C. Basic Review of the Cytochrome P450 System. J. Adv.
Pract. Oncol. 2013, 4, 263.
39. Easterbrook, J.; Lu, C.; Sakai, Y.; Li, A. P. Effects of Organic Solvents on the Activities
of Cytochrome P450 Isoforms, UDP-Dependent Glucuronyl Transferase, and Phenol
Sulfotransferase in Human Hepatocytes. Drug Metabolism and Disposition 2001, 29,
141-144.
40. Narimatsu, S.; Takatsu, N.; Yamano, S.; Inoue, Y.; Hanioka, N.; Kiryu, K.; Naito, S.;
Gonzalez, F. J.; Yamamoto, S. The effect of dimethyl sulfoxide on the function of
cytochrome P450 2D6 in HepG2 cells upon the co-expression with NADPH-cytochrome
P450 reductase. Chem. Biol. Interact. 2006, 159, 47-57.
41. Agresti, J. J.; Antipov, E.; Abate, A. R.; Ahn, K.; Rowat, A. C.; Baret, J.; Marquez, M.;
Klibanov, A. M.; Griffiths, A. D.; Weitz, D. A. Ultrahigh-throughput screening in drop-

219
based microfluidics for directed evolution. Proceedings of the National Academy of
Sciences 2010, 107, 4004-4009.
42. Zinchenko, A.; Devenish, S. R. A.; Kintses, B.; Colin, P.; Fischlechner, M.; Hollfelder, F.
One in a Million: Flow Cytometric Sorting of Single Cell-Lysate Assays in
Monodisperse Picolitre Double Emulsion Droplets for Directed Evolution. Anal. Chem.
2014.
43. Markey, A. L.; Mohr, S.; Day, P. J. R. High-throughput droplet PCR. Methods 2010, 50,
277-281.
44. Gu, S.; Lu, Y.; Ding, Y.; Li, L.; Zhang, F.; Wu, Q. Droplet-based microfluidics for dose–
response assay of enzyme inhibitors by electrochemical method. Anal. Chim. Acta 2013,
796, 68-74.
45. Gielen, F.; van Vliet, L.; Koprowski, B. T.; Devenish, S. R. A.; Fischlechner, M.; Edel, J.
B.; Niu, X.; deMello, A. J.; Hollfelder, F. A Fully Unsupervised Compartment-on-
Demand Platform for Precise Nanoliter Assays of Time-Dependent Steady-State Enzyme
Kinetics and Inhibition. Anal. Chem. 2013, 85, 4761-4769.
46. Clausell-Tormos, J.; Lieber, D.; Baret, J.; El-Harrak, A.; Miller, O. J.; Frenz, L.;
Blouwolff, J.; Humphry, K. J.; Köster, S.; Duan, H.; Holtze, C.; Weitz, D. A.; Griffiths,
A. D.; Merten, C. A. Droplet-Based Microfluidic Platforms for the Encapsulation and
Screening of Mammalian Cells and Multicellular Organisms. Chem. Biol. 2008, 15, 427-
437.
47. Brouzes, E.; Medkova, M.; Savenelli, N.; Marran, D.; Twardowski, M.; Hutchison, J. B.;
Rothberg, J. M.; Link, D. R.; Perrimon, N.; Samuels, M. L. Droplet microfluidic
technology for single-cell high-throughput screening. Proceedings of the National
Academy of Sciences 2009, 106, 14195-14200.
48. Yu, L.; Chen, M. C. W.; Cheung, K. C. Droplet-based microfluidic system for
multicellular tumor spheroid formation and anticancer drug testing. Lab Chip 2010, 10,
2424-2432.
49. Boedicker, J. Q.; Li, L.; Kline, T. R.; Ismagilov, R. F. Detecting bacteria and determining
their susceptibility to antibiotics by stochastic confinement in nanoliter droplets using
plug-based microfluidics. Lab Chip 2008, 8, 1265-1272.
50. Jakiela, S.; Kaminski, T. S.; Cybulski, O.; Weibel, D. B.; Garstecki, P. Bacterial Growth
and Adaptation in Microdroplet Chemostats. Angew. Chem. Int. Ed. 2013, 52, 8908-
8911.
51. Trivedi, V.; Doshi, A.; Kurup, G. K.; Ereifej, E.; Vandevord, P. J.; Basu, A. S. A modular
approach for the generation, storage, mixing, and detection of droplet libraries for high
throughput screening. Lab Chip 2010, 10, 2433-2442.
52. Cao, J.; Kursten, D.; Schneider, S.; Knauer, A.; Gunther, P. M.; Kohler, J. M. Uncovering
toxicological complexity by multi-dimensional screenings in microsegmented flow:
modulation of antibiotic interference by nanoparticles. Lab Chip 2012, 12, 474-484.

220
53. Granieri, L.; Baret, J.; Griffiths, A. D.; Merten, C. A. High-Throughput Screening of
Enzymes by Retroviral Display Using Droplet-Based Microfluidics. Chem. Biol. 2010,
17, 229-235.
54. Baret, J.; Beck, Y.; Billas-Massobrio, I.; Moras, D.; Griffiths, A. D. Quantitative Cell-
Based Reporter Gene Assays Using Droplet-Based Microfluidics. Chem. Biol. 2010, 17,
528-536.
55. Skhiri, Y.; Beneyton, T.; Mazutis, L.; Baret, J.; El Harrak, A.; Mayot, E.; Griffiths, A.;
Taly, V. Integrated microfluidic platform for directed evolution of biocatalysts for
biofuel cell applications; 14th International Conference on Miniaturized Systems for
Chemistry and Life Sciences; µTAS: 2010; , pp 980.
56. Miller, O. J.; El Harrak, A.; Mangeat, T.; Baret, J. C.; Frenz, L.; El Debs, B.; Mayot, E.;
Samuels, M. L.; Rooney, E. K.; Dieu, P.; Galvan, M.; Link, D. R.; Griffiths, A. D. High-
resolution dose-response screening using droplet-based microfluidics. Proc. Natl. Acad.
Sci. U. S. A. 2012, 109, 378-383.
57. Colin, P.; Kintses, B.; Gielen, F.; Miton, C. M.; Fischer, G.; Mohamed, M. F.; Hyvonen,
M.; Morgavi, D. P.; Janssen, D. B.; Hollfelder, F. Ultrahigh-throughput discovery of
promiscuous enzymes by picodroplet functional metagenomics. Nat Commun 2015, 6.
58. Fradet, E.; Bayer, C.; Hollfelder, F.; Baroud, C. N. Measuring Fast and Slow Enzyme
Kinetics in Stationary Droplets. Anal. Chem. 2015, 87, 11915-11922.
59. Chen, Y.; - Wijaya Gani, A.; - Tang, S. K. Y. - Characterization of sensitivity and
specificity in leaky droplet-based assays. Lab Chip 2012, - 5093.
60. Courtois, F.; Olguin, L. F.; Whyte, G.; Theberge, A. B.; Huck, W. T. S.; Hollfelder, F.;
Abell, C. Controlling the Retention of Small Molecules in Emulsion Microdroplets for
Use in Cell-Based Assays. Anal. Chem. 2009, 81, 3008-3016.
61. Baret, J.; Kleinschmidt, F.; El Harrak, A.; Griffiths, A. D. Kinetic Aspects of Emulsion
Stabilization by Surfactants: A Microfluidic Analysis. Langmuir 2009, 25, 6088-6093.
62. Baret, J. Surfactants in droplet-based microfluidics. Lab Chip 2012, 12, 422-433.
63. Debon, A. P.; Wootton, R. C. R.; Elvira, K. S. Droplet confinement and leakage: Causes,
underlying effects, and amelioration strategies. Biomicrofluidics 2015, 9, 024119.
64. Gupta, R.; Rousseau, D. Surface-active solid lipid nanoparticles as Pickering stabilizers
for oil-in-water emulsions. Food Funct. 2012, 3, 302-311.
65. Pan, M.; Rosenfeld, L.; Kim, M.; Xu, M.; Lin, E.; Derda, R.; Tang, S. K. Y. Fluorinated
Pickering Emulsions Impede Interfacial Transport and Form Rigid Interface for the
Growth of Anchorage-Dependent Cells. ACS Appl. Mater. Interfaces 2014, 6, 21446-
21453.
66. Becker, H. Microfluidics: a technology coming of age. Med. Device Technol. 2008, 19,
21-24.
67. Becker, H. - Collective wisdom. - Lab Chip 2010, - 1351.

221
68. Gartner, I. Gartner Hype Cycle.
http://www.gartner.com/technology/research/methodologies/hype-cycle.jsp (accessed
March, 07, 2016).
69. Kaminski, T. S.; Churski, K.; Garstecki, P. Microdroplet Technology: Principles and
Emerging Applications in Biology and Chemistry. 2012, 117-136.
70. Churski, K.; Kaminski, T. S.; Jakiela, S.; Kamysz, W.; Baranska-Rybak, W.; Weibel, D.
B.; Garstecki, P. Rapid screening of antibiotic toxicity in an automated microdroplet
system. Lab Chip 2012, 12, 1629-1637.
71. Dressler, O. J.; Maceiczyk, R. M.; Chang, S.; deMello, A. J. Droplet-Based
Microfluidics: Enabling Impact on Drug Discovery. Journal of Biomolecular Screening
2013.
72. Du, G.; Fang, Q.; den Toonder, J. M. J. Microfluidics for cell-based high throughput
screening platforms—A review. Anal. Chim. Acta 2016, 903, 36-50.
73. Wong, S. S. W.; Samaranayake, L. P.; Seneviratne, C. J. In pursuit of the ideal antifungal
agent for Candida infections: high-throughput screening of small molecules. Drug
Discov. Today 2014, 19, 1721-1730.
74. Joachim, J.; Jiang, M.; McKnight, N. C.; Howell, M.; Tooze, S. A. High-throughput
screening approaches to identify regulators of mammalian autophagy. Methods 2015, 75,
96-104.
75. Acker, M. G.; Auld, D. S. Considerations for the design and reporting of enzyme assays
in high-throughput screening applications. Perspectives in Science 2014, 1, 56-73.
76. An, P.; Winters, D.; Walker, K. W. Automated high-throughput dense matrix protein
folding screen using a liquid handling robot combined with microfluidic capillary
electrophoresis. Protein Expr. Purif. 2016, 120, 138-147.
77. Hao, S.; Song, M. Technology-driven strategy and firm performance: Are strategic
capabilities missing links? Journal of Business Research 2016, 69, 751-759.
78. Hung, C.; Lee, W. A proactive technology selection model for new technology: The case
of 3D IC TSV. Technological Forecasting and Social Change 2016, 103, 191-202.
79. Colombo, M. G.; D’Adda, D.; Pirelli, L. H. The participation of new technology-based
firms in EU-funded R&D partnerships: The role of venture capital. Research Policy
2016, 45, 361-375.
80. Chen, C.; Zhang, J.; Guo, R. The D-Day, V-Day, and bleak days of a disruptive
technology: A new model for ex-ante evaluation of the timing of technology disruption.
Eur. J. Oper. Res. 2016, 251, 562-574.
81. Whitesides, G. M. The origins and the future of microfluidics. Nature 2006, 442, 368-
373.
82. Hocquellet, A.; Odaert, B.; Cabanne, C.; Noubhani, A.; Dieryck, W.; Joucla, G.; Le
Senechal, C.; Milenkov, M.; Chaignepain, S.; Schmitter, J.; Claverol, S.; Santarelli, X.;
Dufourc, E. J.; Bonneu, M.; Garbay, B.; Costaglioli, P. Structure–activity relationship of
human liver-expressed antimicrobial peptide 2. Peptides 2010, 31, 58-66.
222
83. Casey, J. T.; O'Cleirigh, C.; Walsh, P. K.; O'Shea, D. G. Development of a robust
microtiter plate-based assay method for assessment of bioactivity. J. Microbiol. Methods
2004, 58, 327-334.
84. Matteucci, M.; Christiansen, T. L.; Tanzi, S.; Østergaard, P. F.; Larsen, S. T.; Taboryski,
R. Fabrication and characterization of injection molded multi level nano and microfluidic
systems. Microelectronic Engineering 2013, 111, 294-298.
85. Hopmann, C.; Fischer, T. New plasticising process for increased precision and reduced
residence times in injection moulding of micro parts. CIRP Journal of Manufacturing
Science and Technology 2015, 9, 51-56.
86. Sarker, S. D.; Nahar, L.; Kumarasamy, Y. Microtitre plate-based antibacterial assay
incorporating resazurin as an indicator of cell growth, and its application in the in vitro
antibacterial screening of phytochemicals. Methods 2007, 42, 321-324.
87. Bevan, P.; Ryder, H.; Shaw, I. Identifying small-molecule lead compounds: The
screening approach to drug discovery. Trends Biotechnol. 1995, 13, 115-121.
88. Zeng, Y.; Shin, M.; Wang, T. - Programmable active droplet generation enabled by
integrated pneumatic micropumps. Lab Chip 2013, - 267.
89. Grover, W. H.; Skelley, A. M.; Liu, C. N.; Lagally, E. T.; Mathies, R. A. Monolithic
membrane valves and diaphragm pumps for practical large-scale integration into glass
microfluidic devices. Sensors Actuators B: Chem. 2003, 89, 315-323.
90. Unger, M. A.; Chou, H.; Thorsen, T.; Scherer, A.; Quake, S. R. Monolithic
Microfabricated Valves and Pumps by Multi-layer Soft Lithography. Science 2000, 113.
91. Lin, Y. H.; Chen, Y. J.; Lai, C. S.; Chen, Y. T.; Chen, C. L.; Yu, J. S.; Chang, Y. S. A
negative-pressure-driven microfluidic chip for the rapid detection of a bladder cancer
biomarker in urine using bead-based enzyme-linked immunosorbent assay.
Biomicrofluidics 2013, 7, 24103.
92. Gielen, F.; Buryska, T.; Vliet, L. V.; Butz, M.; Damborsky, J.; Prokop, Z.; Hollfelder, F.
Interfacing Microwells with Nanoliter Compartments: A Sampler Generating High-
Resolution Concentration Gradients for Quantitative Biochemical Analyses in Droplets.
Anal. Chem. 2015, 87, 624-632.
93. Abate, A. R.; Weitz, D. A. Syringe-vacuum microfluidics: A portable technique to create
monodisperse emulsions. Biomicrofluidics 2011, 5, 014107.
94. Olechno, J.; Shieh, J.; Ellson, R. Improving IC50 Results with Acoustic Droplet Ejection.
Journal of the Association for Laboratory Automation 2006, 11, 240-246.
95. Abate, A. R.; Hung, T.; Mary, P.; Agresti, J. J.; Weitz, D. A. High-throughput injection
with microfluidics using picoinjectors. Proceedings of the National Academy of Sciences
2010, 107, 19163-19166.
96. Song, H.; Chen, D. L.; Ismagilov, R. F. Reactions in Droplets in Microfluidic Channels.
Angewandte Chemie International Edition 2006, 45, 7336-7356.

223
97. Kim, C.; Lee, K. S.; Kim, Y. E.; Lee, K.; Lee, S. H.; Kim, T. S.; Kang, J. Y. Rapid
exchange of oil-phase in microencapsulation chip to enhance cell viability. Lab Chip
2009, 9, 1294-1297.
98. Jiang, Q.; Zhang, S. Z.; Peng, J. P.; Wang, X. L. Preparation and in vitro studies of
microencapsulated cells releasing human tissue inhibitor of metalloproteinase-2. J.
Zhejiang Univ. Sci. B. 2005, 6, 859-864.
99. Lama, R.; Zhang, L.; Naim, J. M.; Williams, J.; Zhou, A.; Su, B. Development, validation
and pilot screening of an in vitro multi-cellular three-dimensional cancer spheroid assay
for anti-cancer drug testing. Bioorg. Med. Chem. 2013, 21, 922-931.
100. Friedrich, J.; Seidel, C.; Ebner, R.; Kunz-Schughart, L. Spheroid-based drug screen:
considerations and practical approach. Nat. Protocols 2009, 4, 309-324.
101. Ho, W. Y.; Yeap, S. K.; Ho, C. L.; Rahim, R. A.; Alitheen, N. B. Development of
Multicellular Tumor Spheroid (MCTS) Culture from Breast Cancer Cell and a High
Throughput Screening Method Using the MTT Assay. PLoS ONE 2012, 7, e44640.
102. Lagus, T. P.; Edd, J. F. High Throughput Single-cell and Multiple-cell Micro-
encapsulation. J Vis Exp 2012, e4096.
103. Todd P Lagus and Jon,F.Edd A review of the theory, methods and recent applications of
high-throughput single-cell droplet microfluidics. J. Phys. D 2013, 46, 114005.
104. Wilson, J. L.; Najia, M. A.; Saeed, R.; McDevitt, T. C. Alginate encapsulation
parameters influence the differentiation of microencapsulated embryonic stem cell
aggregates. Biotechnol. Bioeng. 2014, 111, 618-631.
105. Edd, J. F.; Di Carlo, D.; Humphry, K. J.; Koster, S.; Irimia, D.; Weitz, D. A.; - Toner,
M. Controlled encapsulation of single-cells into monodisperse picolitre drops. Lab Chip
2008, 1262.
106. Alvetex Alvetex. http://reinnervate.com/.
107. Nanofiber Solutions Nanofiber. http://www.nanofibersolutions.com/products.html.
108. Mimetix Mimetix. http://www.electrospinning.co.uk/product/mimetix-96-well-plate-3d-
cell-based-assays/.
109. Insphero Insphero. http://www.insphero.com/.
110. Curiox Curiox. http://www.curiox.com/.
111. Workman, V. L.; Dunnett, S. B.; Kille, P.; Palmer, D. D. Microfluidic chip-based
synthesis of alginate microspheres for encapsulation of immortalized human cells.
Biomicrofluidics 2007, 1.
112. Workman, V. L.; Dunnett, S. B.; Kille, P.; Palmer, D. D. On-Chip Alginate
Microencapsulation of Functional Cells. Macromolecular Rapid Communications 2008,
29, 165-170.

224
113. Crowther, D. C.; van Vliet, L.; Kuhaudomlarp, S.; Gielen, F.; Yan, J.; Azhar, M.;
Hinault, M.; Hollfelder, F. An Assay For Seeded Protein Aggregration Detects Abeta
Seeds In Serum. Alzheimer's & Dementia 2014, 10, P271.
114. Tresset, G.; Takeuchi, S. A Microfluidic Device for Electrofusion of Biological
Vesicles. Biomed. Microdevices 2004, 6, 213-218.
115. Terry, S. C.; Jerman, J. H.; Angell, J. B. A gas chromatographic air analyzer fabricated
on a silicon wafer. IEEE Trans. Electron Devices 1979, 26, 1880-1886.
116. Becker, H.; Gärtner, C. Polymer microfabrication methods for microfluidic analytical
applications. Electrophoresis 2000, 21, 12-26.
117. Fielden, P. R.; Baldock, S. J.; Goddard, N. J.; Morrison, L.; Prest, J. E.; Brown, B. J. T.;
Zgraggen, M. In In Micromolded polymer electrokinetic separation systems with
variable volume sampling and integrated optical and conductivity detection; Bornhop, D.
J., Dunn, D. A., Mariella, R. P., Jr., Murphy, C. J., Nicolau, D. V., Nie, S., Palmer, M.
and Raghavachari, R., Eds.; SPIE: 2002; Vol. 4626, pp 429-440.
118. Baldock, S. J.; Fielden, P. R.; Goddard, N. J.; Prest, J. E.; Treves Brown, B. J. Integrated
moulded polymer electrodes for performing conductivity detection on isotachophoresis
microdevices. Journal of Chromatography A 2003, 990, 11-22.
119. Prest, J. E.; Baldock, S. J.; Day, P. J. R.; Fielden, P. R.; Goddard, N. J.; Treves Brown,
B. J. Miniaturised isotachophoresis of DNA. Journal of Chromatography A 2007, 1156,
154-159.
120. Baldock, S. J.; Fielden, P. R.; Goddard, N. J.; Kretschmer, H. R.; Prest, J. E.; Brown, B.
J. T. A versatile sample injection system for miniaturised isotachophoresis devices.
Microelectronic Engineering 2008, 85, 1440-1442.
121. Charles S. Henry; Min Zhong; Susan M. Lunte; Moon Kim; Haim Bau; Jorge J.
Santiago Ceramic microchips for capillary electrophoresis, electrochemistry. Anal.
Commun. 1999, 36, 305-307.
122. Chiem, N.; Harrison, D. J. Microchip-Based Capillary Electrophoresis for
Immunoassays: Analysis of Monoclonal Antibodies and Theophylline. Anal. Chem.
1997, 69, 373-378.
123. Jacobson, S. C.; Ramsey, J. M. Electrokinetic Focusing in Microfabricated Channel
Structures. Anal. Chem. 1997, 69, 3212-3217.
124. Xia, Y.; Whitesides, G. M. Soft Lithography. Annual Review of Materials Science 1998,
28, 153-184.
125. Hung, L.; Lin, R.; Lee, A. P. Rapid microfabrication of solvent-resistant biocompatible
microfluidic devices. Lab on a Chip 2008, 8, 983-987.
126. McCormick, R. M.; Nelson, R. J.; Alonso-Amigo, M.; Benvegnu, D. J.; Hooper, H. H.
Microchannel Electrophoretic Separations of DNA in Injection-Moulded Plastic
Substrates. Anal. Chem. 1997, 69, 2626-2630.

225
127. Roberts, M. A.; Rossier, J. S.; Bercier, P.; Girault, H. UV Laser Machined Polymer
Substrates for the Development of Microdiagnostic Systems. Anal. Chem. 1997, 69,
2035-2042.
128. Zourob, M.; Mohr, S.; Mayes, A. G.; Macaskill, A.; Perez-Moral, N.; Fielden, P. R.;
Goddard, N. J. A micro-reactor for preparing uniform molecularly imprinted polymer
beads. Lab Chip 2006, 6, 296-301.
129. Vinothkumar, T. S.; Deivanayagam, K.; Ganesh, A.; Kumar, D. Influence of different
organic solvents on degree of swelling of poly (dimethyl siloxane)-based sealer. Journal
of Conservative Dentistry : JCD 2010, 14, 156-159.
130. Romero, P. A.; Tran, T. M.; Abate, A. R. Dissecting enzyme function with microfluidic-
based deep mutational scanning. Proc. Natl. Acad. Sci. U. S. A. 2015, 112, 7159-7164.
131. Fujii, T. PDMS-based microfluidic devices for biomedical applications. Microelectronic
Engineering 2002, 61–62, 907-914.
132. Friend, J.; Yeo, L. Fabrication of microfluidic devices using polydimethylsiloxane.
Biomicrofluidics 2009, 4, 026502.
133. Chen, L.; Luo, G.; Liu, K.; Ma, J.; Yao, B.; Yan, Y.; Wang, Y. Bonding of glass-based
microfluidic chips at low- or room-temperature in routine laboratory. Sensors Actuators
B: Chem. 2006, 119, 335-344.
134. Wang, H. Y.; Foote, R. S.; Jacobson, S. C.; Schneibel, J. H.; Ramsey, J. M. Low
temperature bonding for microfabrication of chemical analysis devices. Sensors
Actuators B: Chem. 1997, 45, 199-207.
135. Baldock, S. J.; Fielden, P. R.; Goddard, N. J.; Kretschmer, H. R.; Prest, J. E.; Treves
Brown, B. J. Novel variable volume injector for performing sample introduction in a
miniaturised isotachophoresis device. Journal of Chromatography A 2004, 1042, 181-
188.
136. Fuchs, A.; Kanoufi, F.; Combellas, C.; Shanahan, M. E. R. Wetting and surface
properties of (modified) fluoro-silanised glass. Colloids Surf. Physicochem. Eng. Aspects
2007, 307, 7-15.
137. Caldwell, J. R.; Jackson, W. J. Surface treatment of polycarbonate films with amines.
Journal of Polymer Science Part C: Polymer Symposia 1968, 24, 15-23.
138. Fidalgo, L. M.; Abell, C.; Huck, W. T. S. Surface-induced droplet fusion in microfluidic
devices. Lab Chip 2007, 984.
139. Shea, M.; Ommert, S.; Gleich, L.; Towle, T.; Haspel, H.; Schmid, N.; Jindal, H.;
Kellogg, G.; Carvalho, B. ADMET Assays on Tecan's LabCD-ADMET System. Journal
of the Association for Laboratory Automation 2003, 8, 74-77.
140. Baroud, C. N.; Gallaire, F.; Dangla, R. Dynamics of microfluidic droplets. Lab Chip
2010, 10, 2032-2045.
141. Gu, H.; Duits, M. H. G.; Mugele, F. Droplets Formation and Merging in Two-Phase
Flow Microfluidics. International Journal of Molecular Sciences 2011, 12, 2572-2597.

226
142. Fu, T.; Wu, Y.; Ma, Y.; Li, H. Z. Droplet formation and breakup dynamics in
microfluidic flow-focusing devices: From dripping to jetting. Chemical Engineering
Science 2012, 84, 207-217.
143. Madou, M. J. Fundamentals of Microfabrication: The Science of Miniaturisation,
Second Edition; CRC Press: 2002; , pp 752.
144. Bird, R. B. Transport Phenomena; Wiley: New York, 2002; .
145. Gyros Gyros. http://www.gyros.com/ (accessed 03/30, 2015).
146. NASA Tech Briefs FPGAs Yield Virtual Laser Valves for Microfluidics.
http://www.techbriefs.com/component/content/article/27-ntb/features/application-
briefs/11615 (accessed 03/30, 2015).
147. Zhang, L.; Yin, X. Parallel separation of multiple samples with negative pressure sample
injection on a 3-D microfluidic array chip. Electrophoresis 2007, 28, 1281-1288.
148. Glawdel, T.; Ren, C. L. Electro-osmotic flow control for living cell analysis in
microfluidic PDMS chips. Mech. Res. Commun. 2009, 36, 75-81.
149. Zhao, C.; Yang, C. Electro-osmotic mobility of non-Newtonian fluids. Biomicrofluidics
2011, 5, 014110.
150. Cho, H.; Kim, H.; Kang, J. Y.; Kim, T. S. How the capillary burst microvalve works. J.
Colloid Interface Sci. 2007, 306, 379-385.
151. Yang, S.; Undar, A.; Zahn, J. D. A microfluidic device for continuous, real time blood
plasma separation. Lab Chip 2006, 6, 871-880.
152. Lee, M. G.; Shin, J. H.; Bae, C. Y.; Choi, S.; Park, J. Label-Free Cancer Cell Separation
from Human Whole Blood Using Inertial Microfluidics at Low Shear Stress. Anal.
Chem. 2013, 85, 6213-6218.
153. Lea, W. A.; Simeonov, A. Fluorescence Polarization Assays in Small Molecule
Screening. Expert opinion on drug discovery 2011, 6, 17-32.
154. Song, Y.; Liao, J. An In Vitro Forster Resonance Energy Transfer-Based High-
Throughput Screening Assay for Inhibitors of Protein–Protein Interactions in
SUMOylation Pathway. Assay and Drug Development Technologies 2012, 10, 336-343.
155. Degorce, F.; Card, A.; Soh, S.; Trinquet, E.; Knapik, G.; Xie, B. HTRF: A Technology
Tailored for Drug Discovery –A Review of Theoretical Aspects and Recent
Applications. Curr Chem Genomics 2009, 22.
156. Frackowiak, D. The Jablonski diagram. Journal of Photochemistry and Photobiology B:
Biology 1988, 2, 399.
157. Mohr, S.; Fisher, K.; Scrutton, N. S.; Goddard, N. J.; Fielden, P. R. Continuous two-
phase flow miniaturised bioreactor for monitoring anaerobic biocatalysis by
pentaerythritol tetranitrate reductase. Lab Chip 2010, 10, 1929-1936.
158. Adcock, J. L.; Barnett, N. W.; Francis, P. S. Luminescence - Overview. In Reference
Module in Chemistry, Molecular Sciences and Chemical Engineering Elsevier: 2014; .

227
159. Mirasoli, M.; Guardigli, M.; Michelini, E.; Roda, A. Recent advancements in chemical
luminescence-based lab-on-chip and microfluidic platforms for bioanalysis. J. Pharm.
Biomed. Anal. 2014, 87, 36-52.
160. Kertesz, V.; Van Berkel, G. J. Fully automated liquid extraction-based surface sampling
and ionization using a chip-based robotic nanoelectrospray platform. Journal of Mass
Spectrometry 2010, 45, 252-260.
161. Lazar, I. M.; Grym, J.; Foret, F. Microfabricated devices: A new sample introduction
approach to mass spectrometry. Mass Spectrom. Rev. 2006, 25, 573-594.
162. Fidalgo, L. M.; Whyte, G.; Ruotolo, B. T.; Benesch, J. L. P.; Stengel, F.; Abell, C.;
Robinson, C. V.; Huck, W. T. S. Coupling Microdroplet Microreactors with Mass
Spectrometry: Reading the Contents of Single Droplets Online13. Angewandte Chemie
International Edition 2009, 48, 3665-3668.
163. Ji, J.; Nie, L.; Qiao, L.; Li, Y.; Guo, L.; Liu, B.; Yang, P.; Girault, H. H. Proteolysis in
microfluidic droplets: an approach to interface protein separation and peptide mass
spectrometry. Lab Chip 2012, 12, 2625-2629.
164. Gasilova, N.; Yu, Q.; Qiao, L.; Girault, H. H. On-Chip Spyhole Mass Spectrometry for
Droplet-Based Microfluidics. Angewandte Chemie International Edition 2014.
165. Angel, T. E.; Aryal, U. K.; Hengel, S. M.; Baker, E. S.; Kelly, R. T.; Robinson, E. W.;
Smith, R. D. Mass spectrometry-based proteomics: existing capabilities and future
directions. Chem. Soc. Rev. 2012, 41, 3912-3928.
166. Tanyanyiwa, J.; Leuthardt, S.; Hauser, P. C. Conductimetric and potentiometric
detection in conventional and microchip capillary electrophoresis. Electrophoresis 2002,
23, 3659-3666.
167. Wani, T. A.; Khalil, N. Y.; Abdel-Rahman, H.; Darwish, I. A. Novel microwell-based
spectrophotometric assay for determination of atorvastatin calcium in its pharmaceutical
formulations. Chemistry Central Journal 2011, 5, 1-8.
168. Jones, A. J. Y.; Hirst, J. A spectrophotometric coupled enzyme assay to measure the
activity of succinate dehydrogenase. Anal. Biochem. 2013, 442, 19-23.
169. Haggag, R. S.; Gawad, D. A.; Belal, S. F.; Elbardisy, H. M. Spectrophotometric and
spectrofluorimetric determination of mesna, acetylcysteine and timonacic acid through
the reaction with acetoxymercuri fluorescein. Anal. Methods 2016, 8, 2479-2493.
170. Gajraj, A.; Ofoli, R. Y. Effect of Extrinsic Fluorescent Labels on Diffusion and
Adsorption Kinetics of Proteins at the Liquid–Liquid Interface . Langmuir 2000, 16,
8085-8094.
171. Sugiura, S.; Nakajima, M.; Iwamoto, S.; Seki, M. Interfacial Tension Driven
Monodispersed Droplet Formation from Microfabricated Channel Array. Langmuir
2001, 17, 5562-5566.
172. White, H. E. Modern College Physics; van Nostrand: 1948 .

228
173. Messager, A.; Miracle-Sole, S.; Ruiz, J.; Shlosman, S. Interfaces in the Potts model II:
Antonov's rule and rigidity of the order disorder interface. Comms in Mathematical Phy.
1991, 140, 275-290.
174. Ozkan, M.; Wang, M.; Ozkan, C.; Flynn, R.; Esener, S. Optical manipulation of objects
and biological cells in microfluidic devices. Biomed. Microdevices 2003, 5, 61.
175. Holt, D. J.; Payne, R. J.; Chow, W. Y.; Abell, C. Fluorosurfactants for microdroplets:
Interfacial tension analysis. J. Colloid Interface Sci. 2010, 350, 205-211.
176. Roach, L. S.; Song, H.; Ismagilov, R. F. Controlling Nonspecific Protein Adsorption in a
Plug-Based Microfluidic System by Controlling Interfacial Chemistry Using Fluorous-
Phase Surfactants. Anal. Chem. 2005, 77, 785-796.
177. Holtze, C.; Rowat, A. C.; Agresti, J. J.; Hutchison, J. B.; Angile, F. E.; Schmitz, C. H. J.;
Koster, S.; - Duan, H.; - Humphry, K. J.; Scanga, R. A.; Johnson, J. S.; Pisignano, D.;
Weitz, D. A. Biocompatible surfactants for water-in-fluorocarbon emulsions. Lab Chip
2008, 1632.
178. Goldburg, W. I. Dynamic light scattering. American Journal of Physics 1999, 67, 1152-
1160.
179. Song, H.; Tice, J. D.; Ismagilov, R. F. A Microfluidic System for Controlling Reaction
Networks in Time. Angewandte Chemie International Edition 2003, 42, 768-772.
180. Zheng, B.; Roach, L. S.; Ismagilov, R. F. Screening of Protein Crystallization
Conditions on a Microfluidic Chip Using Nanoliter-Size Droplets. J. Am. Chem. Soc.
2003, 125, 11170-11171.
181. Garstecki, P.; Fuerstman, M. J.; Stone, H. A.; Whitesides, G. M. Formation of droplets
and bubbles in a microfluidic T-junction-scaling and mechanism of break-up. Lab on a
Chip 2006, 6, 437-446.
182. De Menech, M.; Garstecki, P.; Jousse, F.; Stone, H. A. Transition from squeezing to
dripping in a microfluidic T-shaped junction. J. Fluid Mech. 2008, 595, 141.
183. Ralf Seemann and Martin Brinkmann and Thomas Pfohl and,Stephan Herminghaus
Droplet based microfluidics. Reports on Progress in Physics 2012, 75, 016601.
184. Tice, J. D.; Song, H.; Lyon, A. D.; Ismagilov, R. F. Formation of Droplets and Mixing
in Multiphase Microfluidics at Low Values of the Reynolds and the Capillary Numbers.
Langmuir 2003, 19, 9127-9133.
185. Tice, J. D.; Lyon, A. D.; Ismagilov, R. F. Effects of viscosity on droplet formation and
mixing in microfluidic channels. Anal. Chim. Acta 2004, 507, 73-77.
186. Rane, T. D.; Zec, H.; Puleo, C.; Lee, A. P.; Wang, T. Droplet microfluidics for
amplification-free genetic detection of single cells. Lab on a chip 2012, 12, 3341-3347.
187. Zhang, S.; Guivier-Curien, C.; Veesler, S.; Candoni, N. Prediction of sizes and
frequencies of nanoliter-sized droplets in cylindrical T-junction microfluidics. Chemical
Engineering Science 2015, 138, 128-139.

229
188. Pompano, R. R.; Li, H.; Ismagilov, R. F. Rate of Mixing Controls Rate and Outcome of
Autocatalytic Processes: Theory and Microfluidic Experiments with Chemical Reactions
and Blood Coagulation. Biophys. J. 2008, 95, 1531-1543.
189. Suea-Ngam, A.; Rattanarat, P.; Chailapakul, O.; Srisa-Art, M. Electrochemical droplet-
based microfluidics using chip-based carbon paste electrodes for high-throughput
analysis in pharmaceutical applications. Anal. Chim. Acta 2015, 883, 45-54.
190. Su, Y. -.; Kim, H.; Kovenklioglu, S.; Lee, W. Y. Continuous nanoparticle production by
microfluidic-based emulsion, mixing and crystallization. Journal of Solid State
Chemistry 2007, 180, 2625-2629.
191. Mazutis, L.; Gilbert, J.; Ung, W. L.; Weitz, D. A.; Griffiths, A. D.; Heyman, J. A.
Single-cell analysis and sorting using droplet-based microfluidics. Nat. Protocols 2013,
8, 870-891.
192. Teh, S.; Lin, R.; Hung, L.; Lee, A. P. Droplet microfluidics. Lab on a Chip 2008, 8, 198-
220.
193. Prest, J. E.; Baldock, S. J.; Fielden, P. R.; Goddard, N. J.; Treves Brown, B. J. Analysis
of amino acids by miniaturised isotachophoresis. Journal of Chromatography A 2004,
1051, 221-226.
194. Biral, A.; Zanella, A. Introducing purely hydrodynamic networking functionalities into
microfluidic systems. Nano Communication Networks 2013, 4, 205-215.
195. Ahn, K.; Kerbage, C.; Hunt, T.; Westervelt, R.; Link, D.; Weitz, D. Dielectrophoretic
manipulation of drops for high-speed microfluidic sorting devices. Appl. Phys. Lett.
2006, 88, 024104.
196. Srivastava, S. K.; Baylon-Cardiel, J. L.; Lapizco-Encinas, B. H.; Minerick, A. R. A
continuous DC-insulator dielectrophoretic sorter of microparticles. Journal of
Chromatography A 2011, 1218, 1780-1789.
197. Chen, L.; Zheng, X.; Hu, N.; Yang, J.; Luo, H.; Jiang, F.; Liao, Y. Research Progress on
Microfluidic Chip of Cell Separation Based on Dielectrophoresis. Chinese Journal of
Analytical Chemistry 2015, 43, 300-309.
198. Zhang, K.; Liang, Q.; Ma, S.; Mu, X.; Hu, P.; Wang, Y.; Luo, G. On-chip manipulation
of continuous picoliter-volume superparamagnetic droplets using a magnetic force. Lab
Chip 2009, 9, 2992.
199. Lehmann, U.; Vandevyver, C.; Parashar, V. K.; Gijs, M. A. M. Droplet-Based DNA
Purification in a Magnetic Lab-on-a-Chip. Angewandte Chemie International Edition
2006, 45, 3062-3067.
200. Al‐Hetlani, E.; Hatt, O. J.; Vojtíšek, M.; Tarn, M. D.; Iles, A.; Pamme, N. Sorting and
Manipulation of Magnetic Droplets in Continuous Flow. AIP Conference Proceedings
2010, 1311, 167-175.
201. Lombardi, D.; Dittrich, P. S. Droplet microfluidics with magnetic beads: a new tool to
investigate drug--protein interactions. Analytical and Bioanalytical Chemistry 2010, 399,
347-352.

230
202. Berge, B.; Peseux, J. Variable Focal Lens controlled by an External Voltage: An
Application of Electrowetting. Eur. Phys. J. 2000, 3, 159.
203. Aijian, A. P.; Garrell, R. L. Digital Microfluidics for Automated Hanging Drop Cell
Spheroid Culture. Journal of Laboratory Automation 2014.
204. Lin, T.; Yao, D. Applications of EWOD Systems for DNA Reaction and Analysis. J.
Adhes. Sci. Technol. 2012, 26, 1789-1804.
205. Tan, Y.; Ho, Y.; Lee, A. P. Droplet coalescence by geometrically mediated flow in
microfluidic channels. Microfluid Nanofluid 2007, 3, 495-499.
206. Chen, Y.; Chang, W.; Fang, W.; Ting, S.; Yao, D.; Yang, J. Fission and fusion of
droplets in a 3-D crossing microstructure. Microfluid Nanofluid 2012, 13, 239.
207. Sencia, M.; Takeda, J.; Abe, S.; Nakamura, T. Induction of cell fusion of plant
protoplasts by electrical stimulation. Plant Cell Physiol. 1979, 20, 1441-1443.
208. Tan, W.; Takeuchi, S. Timing controllable electrofusion device for aqueous droplet-
based microreactors. Lab on a Chip 2006, 6, 757-763.
209. Chiu, D. T. A microfluidics platform for cell fusion. Curr. Opin. Chem. Biol. 2001, 5,
609-612.
210. Tan, Y.; Fisher, J. S.; Lee, A. I.; Cristini, V.; Lee, A. P. Design of microfluidic channel
geometries for the control of droplet volume, chemical concentration, and sorting. Lab
on a Chip 2004, 4, 292-298.
211. Jousse, F.; Farr, R.; Link, D. R.; Fuerstman, M. J.; Garstecki, P. Bifurcation of droplet
flows within capillaries. Phys. Rev. E. Stat. Nonlin Soft Matter Phys. 2006, 74, 036311.
212. Andrés, A.; Rosés, M.; Ràfols, C.; Bosch, E.; Espinosa, S.; Segarra, V.; Huerta, J. M.
Setup and validation of shake-flask procedures for the determination of partition
coefficients (log D) from low drug amounts. European Journal of Pharmaceutical
Sciences 2015, 76, 181-191.
213. Baldursdottir, S. G.; Fullerton, M. S.; Nielsen, S. H.; Jorgensen, L. Adsorption of
proteins at the oil/water interface—Observation of protein adsorption by interfacial shear
stress measurements. Colloids and Surfaces B: Biointerfaces 2010, 79, 41-46.
214. Osakai, T.; Yuguchi, Y.; Gohara, E.; Katano, H. Direct Label-free Electrochemical
Detection of Proteins Using the Polarized Oil/Water Interface. Langmuir 2010, 26,
11530-11537.
215. Holden, M. A.; Cremer, P. S. Microfluidic tools for studying the specific binding,
adsorption, and displacement of proteins at interfaces. Annu. Rev. Phys. Chem. 2005, 56,
369-387.
216. Abdulla Yusuf, H.; Baldock, S. J.; Barber, R. W.; Fielden, P. R.; Goddard, N. J.; Treves
Brown, B. J. Novel microsystems for concentration gradient generation through
computer optimization with validation using optical instrumentation. Microelectronic
Engineering 2008, 85, 1265-1268.

231
217. Ali, U.; Karim, K. J. B. A.; Buang, N. A. A Review of the Properties and Applications
of Poly (Methyl Methacrylate) (PMMA). Polymer Reviews 2015, 55, 678-705.
218. Nicholas J.Goddard; Singh, K.; Bounaira, F.; Richard J.Holmes; Sara J.Baldock; Lynsay
W.Pickering; Peter R.Fielden; Richard D.Snook Anti-Resonant Reflecting Optical
Waveguides (ARROWS) as Optimal Optical Detectors for µTAS Applications.
Department of Instrumentation and Analytical Science, UMIST 2007.
219. Puntarulo, S.; Cederbaum, A. I. Temperature dependence of the microsomal oxidation of
ethanol by cytochrome P450 and hydroxyl radical-dependent reactions. Arch. Biochem.
Biophys. 1989, 269, 569-575.
220. Hansen, L. D.; Transtrum, M. K.; Quinn, C.; Demarse, N. Enzyme-catalyzed and
binding reaction kinetics determined by titration calorimetry. Biochimica et Biophysica
Acta (BBA) - General Subjects 2016, 1860, 957-966.
221. Frenz, L.; Blank, K.; Brouzes, E.; Griffiths, A. D. Reliable microfluidic on-chip
incubation of droplets in delay-lines. Lab on a Chip 2009, 9, 1344-1348.
222. Brøsen, K.; Skjelbo, E.; Rasmussen, B. B.; Poulsen, H. E.; Loft, S. Fluvoxamine is a
potent inhibitor of cytochrome P4501A2. Biochem. Pharmacol. 1993, 45, 1211-1214.
223. Pastrakuljic, A.; Tang, B. K.; Roberts, E. A.; Kalow, W. Distinction of CYP1A1 and
CYP1A2 activity by selective inhibition using fluvoxamine and isosafrole. Biochem.
Pharmacol. 1997, 53, 531-538.
224. Vlahov, G.; Angelo, C. S. The Structure of Triglycerides of Monovarietal Olive Oils: A
13C-NMR Comparative Study. Lipid / Fett 1996, 98, 203-205.
225. de Boer AR; T, L.; van Elswijk DA; H, L.; WM, N.; H, I. On-line Coupling of High-
Performance Liquid Chromatography to a Continous-Flow Enzyme Assay Based on
Electrospray Ionisation Mass Spectrometry. Anal. Chem. 2004, 76, 3155-3161.
226. Zamfir, A. D. Recent advances in sheathless interfacing of capillary electrophoresis and
electrospray ionization mass spectrometry. Journal of Chromatography A 2007, 1159, 2-
13.
227. Sinclair, I.; Gallagher, R. Charged aerosol detection: factors for consideration in its use
as a generic quantitative detector. Chromatography Today 2008, 1, 5.
228. Sinclair, I.; Charles, I. Applications of the Charged Aerosol Detector in Compound
Management. Journal of Biomolecular Screening 2009, 14, 531-537.
229. Charles, I.; Sinclair, I.; Addison, D. H. Capture and Exploration of Sample Quality Data
to Inform and Improve the Management of a Screening Collection. Journal of
Laboratory Automation 2013.
230. (Anonymous) Kohonen network. Scholarpedia , 1568.
231. Spiegel, D. S.; Turner, E. L. Bayesian analysis of the astrobiological implications of
life’s early emergence on Earth. Proceedings of the National Academy of Sciences 2012,
109, 395-400.
232
232. Mahoney, D. W.; Therneau, T. M.; Heppelmann, C. J.; Higgins, L.; Benson, L. M.;
Zenka, R. M.; Jagtap, P.; Nelsestuen, G. L.; Bergen, H. R.; Oberg, A. L. Relative
Quantification: Characterization of bias, variability and fold changes in mass
spectrometry data from iTRAQ labeled peptides. Journal of proteome research 2011, 10,
4325-4333.
233. Haworth, D. Digital Astrophotography: The State of the Art. 2005, 15-29.
234. Palanuwech, J.; Coupland, J. N. Effect of surfactant type on the stability of oil-in-water
emulsions to dispersed phase crystallization. Colloids Surf. Physicochem. Eng. Aspects
2003, 223, 251-262.
235. Yu, X.; Yue, K.; Hsieh, I.; Li, Y.; Dong, X.; Liu, C.; Xin, Y.; Wang, H.; Shi, A.;
Newkome, G. R.; Ho, R.; Chen, E.; Zhang, W.; Cheng, S. Z. D. Giant surfactants
provide a versatile platform for sub-10-nm nanostructure engineering. Proceedings of the
National Academy of Sciences 2013, 110, 10078-10083.
236. Gladysz, J. A.; Curran, D. P.; Horvaith, I. T. Handbook of Fluorous Chemistry; Wiley-
VCH: Weinheim, Germany, 2004; .
237. Sahyun, M. R. V. Binding of Aromatic Compounds to Bovine Serum Albumin. Nature
1966, 209, 613-614.
238. Ozeki, S.; Tejima, K. Drug Interactions. V. Binding of Basic Compounds to Bovine
Serum Albumin by Fluorescent Probe Technique. Chem. Pharm. Bull. 1979, 27, 638-
646.
239. Sykes, P. J.; Fau, N. S.; Fau, B. M.; Hughes, E. F.; Condon J Fau - Morley,,A.A.;
Morley, A. A. Quantitation of targets for PCR by use of limiting dilution. BioTechniques
JID - 8306785 1119.
240. Vogelstein, B.; Kinzler, K. W. Digital PCR. Proceedings of the National Academy of
Sciences 1999, 96, 9236-9241.
241. Niu, X.; Gielen, F.; Edel, J. B.; deMello, A. J. A microdroplet dilutor for high-
throughput screening. Nat Chem 2011, 3, 437-442.
242. Chaudhuri, R. G.; Paria, S. Dynamic contact angles on PTFE surface by aqueous
surfactant solution in the absence and presence of electrolytes. J. Colloid Interface Sci.
2009, 337, 555-562.
243. Henry, A. C.; Tutt, T. J.; Galloway, M.; Davidson, Y. Y.; McWhorter, C. S.; Soper, S.
A.; McCarley, R. L. Surface Modification of Poly(methyl methacrylate) Used in the
Fabrication of Microanalytical Devices. Anal. Chem. 2000, 72, 5331-5337.
244. Chabert, M.; Viovy, J. Microfluidic high-throughput encapsulation and hydrodynamic
self-sorting of single cells. Proceedings of the National Academy of Sciences 2008, 105,
3191-3196.
245. Goldner, L. S.; Jofre, A. M.; Tang, J. Droplet Confinement and Fluorescence
Measurement of Single Molecules. Methods In Enzymology 2010, 472, 61.
246. Lea, W. A.; Simeonov, A. Fluorescence Polarization Assays in Small Molecule
Screening. Expert opinion on drug discovery 2011, 6, 17-32.

233
247. Rujimethabhas, M.; Wilairat, P. Determination of critical micelle concentration using
acridine orange dye probe. An undergraduate experiment. J. Chem. Educ. 1978, 55, 342.
248. Furton, K. G.; Norelus, A. Determining the critical micelle concentration of aqueous
surfactant solutions: Using a novel colorimetric method. J. Chem. Educ. 1993, 70, 254.
249. Bielawska, M.; Chodzińska, A.; Jańczuk, B.; Zdziennicka, A. Determination of CTAB
CMC in mixed water + short-chain alcohol solvent by surface tension, conductivity,
density and viscosity measurements. Colloids Surf. Physicochem. Eng. Aspects 2013,
424, 81-88.
250. Alimuddin, M.; Grant, D.; Bulloch, D.; Lee, N.; Peacock, M.; Dahl, R. Determination of
logD via Automated Microfluidic Liquid-Liquid Extraction. J. Med. Chem. 2008, 51,
5140-5142.