research equity model portfolio solutions october 31, 2014 ... · research equity model portfolio...
TRANSCRIPT
R E S E A R C H EQUITY MODEL PORTFOLIO SOLUTIONS OCTOBER 31, 2014
Morgan Stanley Wealth Management is the trade name of Morgan Stanley Smith Barney LLC, a registered broker-dealer in the United States. Morgan Stanley Wealth Management does and seeks to do business with companies covered in Morgan Stanley Wealth Management Research. As a result, investors should be aware that the firm may have a conflict of interest that could affect the objectivity of Morgan Stanley Wealth Management Research. Investors should consider Morgan Stanley Wealth Management Research as only a single factor in making their investment decision.
For analyst certification and other important disclosures, refer to the Disclosure Section, located at the end of this report.
US Model
NORTH AMERICA DANIEL SKELLY Morgan Stanley Wealth Management [email protected] +1 212 296-5109 SACHIN MANCHANDA Morgan Stanley Wealth Management [email protected] +1 212 296-5065 KATY ZHAO Morgan Stanley Wealth Management [email protected] +1 212 296-5105 ELIZABETH HARROW Morgan Stanley Wealth Management [email protected] +1 212 296-5118 Investment Objectives
Horizon: 3-5 Years Benchmark: S&P 500
Diversification
Number of Securities: 30-40 Maximum position size: 4%
Constraints
Equities in MS & Co coverage rated Overweight or Equal-weight
Investable Universe
Mostly US large cap equities Limited US mid cap equities
The Equity Model Portfolio Solutions platform, which includes this US Model Portfolio was launched on October 1, 2014, with initial publications limited to Morgan Stanley Financial Advisor distribution from October 1, 2014 until October 31, 2014. Prior to this, the platform was known as the Strategic Equity Portfolio (STEP), and reports had been available to clients. We are now pleased to resume publishing reports for our clients, including this US Model Portfolio, which was published formerly under the name the US Model Portfolio STEP.
The US Model Portfolio combines growth and value style investing to reflect Morgan Stanley & Co. (MS & Co.) Equity Research team's best ideas "in action." The portfolio consists of a diversified cross-section of primarily large-cap US equities and select mid-cap equities from a variety of industry groups. The portfolio's core is based largely on the published reports of MS & Co. Research's industry analysts, with an additional overlay from MS & Co.’s US Strategy team, as well as the Model Portfolio Solution (MPS) team's independent views.
The portfolio is run with a longer-term (typically one-year-plus) bottom-up emphasis that also incorporates macro and sector views from MS & Co.’s US Equity Strategy Team and the Global Investment Committee (GIC).
We select a diversified collection of US stocks balanced across market sectors and styles. Our approach is both qualitative and quantitative. In addition to fundamental research, we screen for attractive stocks quantitatively based on growth, valuation, and quality. We tend to favor valuation-sensitive strategies over more momentum-based approaches.
All Equity Model Portfolio Solutions reports will be client approved going forward, including change notes, periodic performance updates, and lists of portfolio holdings.
Portfolio Objective
R E S E A R C H US MODEL OCTOBER 31, 2014
Please refer to important information, disclosures and qualifications at the end of this material.
2
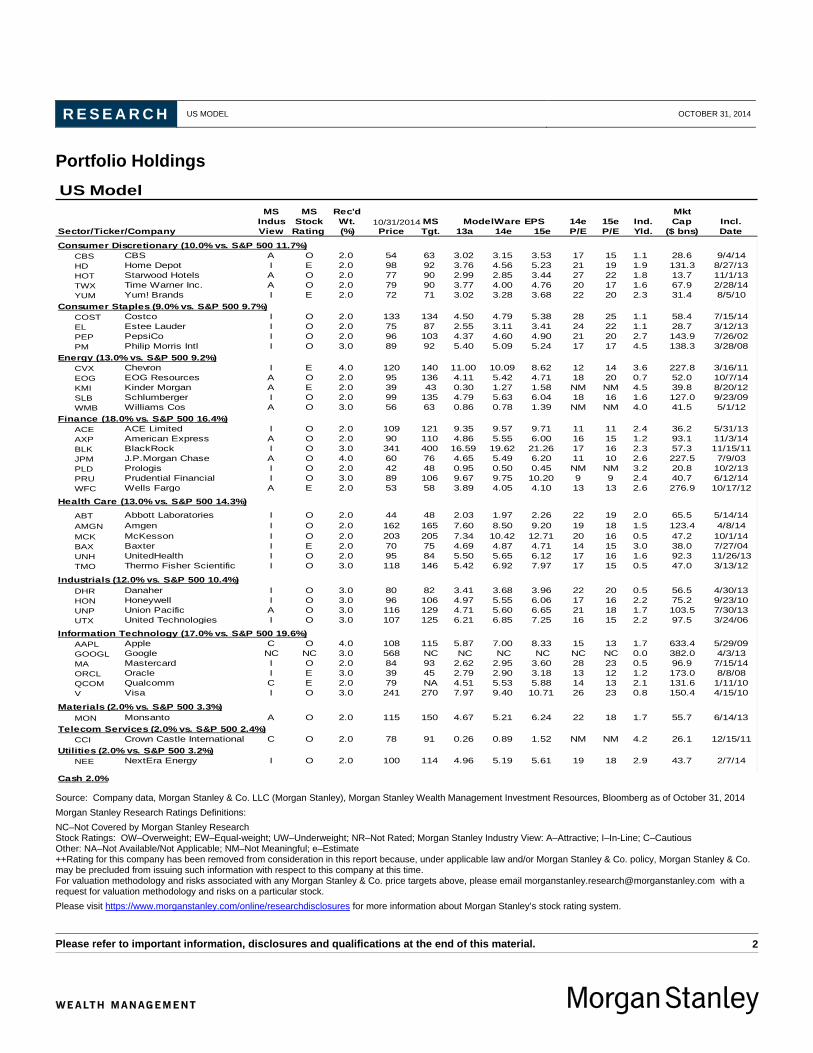
Portfolio Holdings
Source: Company data, Morgan Stanley & Co. LLC (Morgan Stanley), Morgan Stanley Wealth Management Investment Resources, Bloomberg as of October 31, 2014 Morgan Stanley Research Ratings Definitions: NC–Not Covered by Morgan Stanley Research Stock Ratings: OW–Overweight; EW–Equal-weight; UW–Underweight; NR–Not Rated; Morgan Stanley Industry View: A–Attractive; I–In-Line; C–Cautious Other: NA–Not Available/Not Applicable; NM–Not Meaningful; e–Estimate ++Rating for this company has been removed from consideration in this report because, under applicable law and/or Morgan Stanley & Co. policy, Morgan Stanley & Co. may be precluded from issuing such information with respect to this company at this time. For valuation methodology and risks associated with any Morgan Stanley & Co. price targets above, please email [email protected] with a request for valuation methodology and risks on a particular stock. Please visit https://www.morganstanley.com/online/researchdisclosures for more information about Morgan Stanley’s stock rating system.
US ModelMS MS Rec'd Mkt
Indus Stock Wt. 10/31/2014 MS 14e 15e Ind. Cap Incl.Sector/Ticker/Company View Rating (%) Price Tgt. 13a 14e 15e P/E P/E Yld. ($ bns) Date
Consumer Discretionary (10.0% vs. S&P 500 11.7%)CBS CBS A O 2.0 54 63 3.02 3.15 3.53 17 15 1.1 28.6 9/4/14HD Home Depot I E 2.0 98 92 3.76 4.56 5.23 21 19 1.9 131.3 8/27/13HOT Starwood Hotels A O 2.0 77 90 2.99 2.85 3.44 27 22 1.8 13.7 11/1/13TWX Time Warner Inc. A O 2.0 79 90 3.77 4.00 4.76 20 17 1.6 67.9 2/28/14YUM Yum! Brands I E 2.0 72 71 3.02 3.28 3.68 22 20 2.3 31.4 8/5/10
Consumer Staples (9.0% vs. S&P 500 9.7%)COST Costco I O 2.0 133 134 4.50 4.79 5.38 28 25 1.1 58.4 7/15/14EL Estee Lauder I O 2.0 75 87 2.55 3.11 3.41 24 22 1.1 28.7 3/12/13PEP PepsiCo I O 2.0 96 103 4.37 4.60 4.90 21 20 2.7 143.9 7/26/02PM Philip Morris Intl I O 3.0 89 92 5.40 5.09 5.24 17 17 4.5 138.3 3/28/08
Energy (13.0% vs. S&P 500 9.2%)CVX Chevron I E 4.0 120 140 11.00 10.09 8.62 12 14 3.6 227.8 3/16/11EOG EOG Resources A O 2.0 95 136 4.11 5.42 4.71 18 20 0.7 52.0 10/7/14KMI Kinder Morgan A E 2.0 39 43 0.30 1.27 1.58 NM NM 4.5 39.8 8/20/12SLB Schlumberger I O 2.0 99 135 4.79 5.63 6.04 18 16 1.6 127.0 9/23/09WMB Williams Cos A O 3.0 56 63 0.86 0.78 1.39 NM NM 4.0 41.5 5/1/12
Finance (18.0% vs. S&P 500 16.4%)ACE ACE Limited I O 2.0 109 121 9.35 9.57 9.71 11 11 2.4 36.2 5/31/13AXP American Express A O 2.0 90 110 4.86 5.55 6.00 16 15 1.2 93.1 11/3/14BLK BlackRock I O 3.0 341 400 16.59 19.62 21.26 17 16 2.3 57.3 11/15/11JPM J.P.Morgan Chase A O 4.0 60 76 4.65 5.49 6.20 11 10 2.6 227.5 7/9/03PLD Prologis I O 2.0 42 48 0.95 0.50 0.45 NM NM 3.2 20.8 10/2/13PRU Prudential Financial I O 3.0 89 106 9.67 9.75 10.20 9 9 2.4 40.7 6/12/14WFC Wells Fargo A E 2.0 53 58 3.89 4.05 4.10 13 13 2.6 276.9 10/17/12
Health Care (13.0% vs. S&P 500 14.3%)
ABT Abbott Laboratories I O 2.0 44 48 2.03 1.97 2.26 22 19 2.0 65.5 5/14/14AMGN Amgen I O 2.0 162 165 7.60 8.50 9.20 19 18 1.5 123.4 4/8/14MCK McKesson I O 2.0 203 205 7.34 10.42 12.71 20 16 0.5 47.2 10/1/14BAX Baxter I E 2.0 70 75 4.69 4.87 4.71 14 15 3.0 38.0 7/27/04UNH UnitedHealth I O 2.0 95 84 5.50 5.65 6.12 17 16 1.6 92.3 11/26/13TMO Thermo Fisher Scientific I O 3.0 118 146 5.42 6.92 7.97 17 15 0.5 47.0 3/13/12
Industrials (12.0% vs. S&P 500 10.4%)DHR Danaher I O 3.0 80 82 3.41 3.68 3.96 22 20 0.5 56.5 4/30/13HON Honeywell I O 3.0 96 106 4.97 5.55 6.06 17 16 2.2 75.2 9/23/10UNP Union Pacific A O 3.0 116 129 4.71 5.60 6.65 21 18 1.7 103.5 7/30/13UTX United Technologies I O 3.0 107 125 6.21 6.85 7.25 16 15 2.2 97.5 3/24/06
Information Technology (17.0% vs. S&P 500 19.6%)AAPL Apple C O 4.0 108 115 5.87 7.00 8.33 15 13 1.7 633.4 5/29/09GOOGL Google NC NC 3.0 568 NC NC NC NC NC NC 0.0 382.0 4/3/13MA Mastercard I O 2.0 84 93 2.62 2.95 3.60 28 23 0.5 96.9 7/15/14ORCL Oracle I E 3.0 39 45 2.79 2.90 3.18 13 12 1.2 173.0 8/8/08QCOM Qualcomm C E 2.0 79 NA 4.51 5.53 5.88 14 13 2.1 131.6 1/11/10V Visa I O 3.0 241 270 7.97 9.40 10.71 26 23 0.8 150.4 4/15/10
Materials (2.0% vs. S&P 500 3.3%)MON Monsanto A O 2.0 115 150 4.67 5.21 6.24 22 18 1.7 55.7 6/14/13
Telecom Services (2.0% vs. S&P 500 2.4%)CCI Crown Castle International C O 2.0 78 91 0.26 0.89 1.52 NM NM 4.2 26.1 12/15/11
Utilities (2.0% vs. S&P 500 3.2%)NEE NextEra Energy I O 2.0 100 114 4.96 5.19 5.61 19 18 2.9 43.7 2/7/14
Cash 2.0%
ModelWare EPS

R E S E A R C H US MODEL OCTOBER 31, 2014
Please refer to important information, disclosures and qualifications at the end of this material.
3
Additions and Removals Please note since October 1, 2014 the following securities have been added and/or removed from the portfolio:
EOG Resources (EOG) added on 10/7/14
Colgate (CL) removed on 10/7/14
American Express (AXP) added on 11/3/14
eBay (EBAY) removed on 11/3/14
Investment Rationale Abbott Laboratories (ABT) engages in the development, manufacture, and sale of health care products worldwide. The company operates in four segments: Pharmaceutical Products, Diagnostic Products, Nutritional Products, and Vascular Products.
Investment thesis: 1) a high-quality global franchise with proven management, diversified products and leading market shares; 2) underappreciated cost-cutting opportunities over the next two years that should drive EBIT margin expansion; 3) according to MS & Co. analyst, David Lewis, with about $7 billion of cash and investments, ABT has a strong balance sheet, which management can use to do additional buybacks as transformative M&A is less likely.
Valuation: David’s $48 target (12% implied total return, including the 2.0% dividend yield) is based on 13.7x his 2016E EBITDA of $5.2 billion. David assumes the current known headwinds for the company fade and margins grow less than 100 bp per year, supporting EPS growth of 10%+. He expects nutritionals and EPD growth in the high single digits as adult opportunity starts to materialize and EM EPD focus accelerates growth post DM EPD sale.
Risks include: 1) disappointing non-US and emerging markets (EM) macro growth; 2) competition in nutritionals from multinational and local Chinese players; 3) competition in diagnostics and devices from global competitors; and 4) government pricing policies in the generic pharmaceuticals business and nutritionals.
ACE Limited (ACE) is one of the world’s largest multiline property and casualty insurers. With operations in 54 countries, ACE provides commercial and personal property and casualty insurance, personal accident and supplemental health insurance, reinsurance and life insurance to a diverse group of clients.
Investment thesis: 1) ACE is a strong global franchise consistent with the portfolio's preference for well-managed industry leaders; 2) ACE’s acquisitions are a key growth strategy, and they most recently completed the acquisition of Samaggi Insurance in Thailand in 2Q14; and 3) MS & Co. analyst Kai Pan estimates that ACE has $8 billion of excess capital (or 27% of equity), which could be deployed via higher dividends going forward.
Valuation: MS & Co. analyst Kai Pan’s $121 price target (13% potential upside, including the 2.4% dividend yield) is based on 1.3x 1Q15E Book. Kai estimates 11% ROE in perpetuity for 2014-15, with the 5-year average of 12% and the 15% long-term cross-cycle goal.
Risks include: 1) general macro volatility; 2) poor capital deployment and/or M&A; 3) portfolio losses from high corporate bond exposures; and 4) underwriting losses from catastrophe or reserve charges.
American Express (AXP) is a leading global payments and travel and expense services company. Its principal products and services are charge and credit payment card products and travel-related services offered to consumers and businesses worldwide. The company operates in four segments: U.S. Card Services (49% of 2013 revenue), International Card Services (17%), Global Commercial Services (33%) and Global Network & Merchant Services (0.4%). By geography, AXP generates 70% of its revenues from the United States, 12% from EMEA, 10% from Japan, Asia/Pacific and Australia, and 9% from Latin America, Canada and the Caribbean.
Investment thesis: 1) Amex is exposed to an improving economy as housing and stock market appreciation should disproportionately benefit Amex’s affluent customers; 2) increased merchant penetration via the new OptBlue program should help boost Amex’s wallet share; and 3) we expect attractive capital returns and expense management going forward.
Valuation: MS & Co. analyst Betsy Graseck’s $110 price target (23% implied total return, including a 1.2% dividend yield) is based on blended valuation methodologies, including residual income, P/B and P/E. Her assumptions include a 16.3x base case 2015E EPS, given moderate economic recovery. Betsy assumes we are nearing the end of consumer deleveraging and that US-billed business growth will accelerate from 8% in 2013 to 9%-12% in 2014/15. Amex limits operating expense growth (ex-marketing, rewards and card member services) to <0% year-over-year in 2014.
R E S E A R C H US MODEL OCTOBER 31, 2014
Please refer to important information, disclosures and qualifications at the end of this material.
4
Risks include: 1) a higher expense ratio for the company; 2) sharply lower US and international spending; 3) higher-than-expected rise in credit costs; 4) lower small merchant penetration and/or the rapid consumer shift away from credit cards as merchants surcharge credit cards as a result of the Brooklyn settlement.
Amgen (AMGN) is a commercial stage biotechnology company with a treatment focus in supportive cancer care, nephrology and inflammation. Its main products are Aranesp, Epogen, Neulasta, and Enbrel. It has an active pipeline covering new treatment areas, especially in oncology.
Investment thesis: 1) AMGN has grown to be the largest independent biotechnology company in the world, with the largest biologic portfolio by revenue and a sustainable growth profile; 2) an underappreciated margin opportunity and diversified pipeline that should more than offset a 5% annual decline in existing products, according to MS & Co. Biotech analyst Matthew Harrison; and 3) strong free cash flow should provide downside risk reduction and supports a growing dividend and buyback.
Valuation: MS & Co. analyst Matthew Harrison’s $165 price target (3% implied total return, including a 1.5% yield) is derived from a discounted cash flow model that uses a 10% weighted average cost of capital and a 2% terminal growth rate post 2030. The main revenue drivers in his model are the erosion of the base business due to biosimilars, the launch of evolocumab, and the maturation of the Phase III pipeline.
Risks include: 1) increased biosimilar competition, especially in the U.S; 2) failure of the Phase III pipeline, particularly evolocumab; and 3) management spending above Matthew’s targets without compensating revenue growth.
Apple (AAPL) designs, manufactures and markets mobile communication and media devices, personal computers, and portable digital music players, and sells a variety of related software, services, peripherals, and digital content and applications. The company's products and services include iPhone, iPad, Mac, iPod, Apple TV, Apple Watch, a portfolio of consumer and professional software applications, the iOS and OS X operating systems, iCloud, and a variety of accessory, service and support offerings.
Investment thesis: 1) we see several near-term positive catalysts given upcoming product cycles, and expect iPhone share gains and growth re-acceleration driven by larger-screen iPhones; 2) MS & Co.'s Katy Huberty sees significant long-term growth in
emerging markets (EM), particularly in China; and 3) despite AAPL's consistent execution and long-term growth potential, the stock trades at a below-market multiple of roughly 13.8x Katy's 2015E EPS—an attractive valuation, in our view.
Valuation: Katy's $115 price target (8% implied total return, including a 1.7% dividend yield) is based on the stock trading at 14x her base case CY15E EPS of $8.20 or 11x ex-cash, putting it on par with high-quality, large-cap technology peers like Oracle and Microsoft.
Risks include: 1) maturing markets, and Android and Windows competition in smartphone and tablets; 2) carriers lengthening replacement cycles and/or lower subsidies; 3) regulatory and legal risk as Apple gains profit share in mobile devices; 4) weak global consumer demand, including China and other emerging markets; and 5) lack of new product categories and/or services limit multiple expansion.
Baxter International, Inc. (BAX) Baxter International Inc. is an American health care company with headquarters in Deerfield, Illinois. The company primarily focuses on products to treat hemophilia, kidney disease, immune disorders and other chronic and acute medical conditions.
Investment thesis: 1) BAX has significant long-term growth potential in emerging markets; 2) we favor BAX's peer-leading dividend yield of 3%; and 3) BAX is consistent with Adam Parker’s preference for healthcare exposure.
Valuation: MS & Co. analyst David Risinger’s $75 price target (10% implied total return, including a 3% dividend yield) is derived from 15x his base case 2016E cash EPS of $4.89.
Risks include: 1) delays or negative trial data; and 2) regulatory risk or the FDA requiring lengthy new clinical trials.
BlackRock, Inc (BLK) is a publicly owned investment manager. The firm primarily provides its services to institutional, intermediary, and individual investors. It also manages accounts for corporate, public, union and industry pension plans, insurance companies, third-party mutual funds, endowments, foundations, charities, corporations, official institutions, and banks. The firm offers global investment management, risk management, and advisory services. It manages separate client-focused equity, fixed income, and balanced portfolios. The firm also manages open-end and closed-end mutual funds, offshore funds, separate accounts, ETFs, unit trusts, and alternative investment vehicles, including hedge funds and structured funds. It invests in the public equity, fixed income, real estate, and alternative markets across the globe.
R E S E A R C H US MODEL OCTOBER 31, 2014
Please refer to important information, disclosures and qualifications at the end of this material.
5
Investment thesis: 1) we favor BLK’s best-in-class global franchise, significant product breadth, top-tier management team, solid balance sheet and strong and growing dividend; 2) these attributes are among the key elements that we like across most market cycles, but particularly during periods of elevated macro risk and market volatility; 3) BLK is likely to continue to gain market share emerging in an even stronger competitive position.
Valuation: MS & Co. analyst Betsy Graseck’s $400 price target (20% implied total return including a 2.3% dividend yield) is derived from 16.5x target P/E (highest in group and above group median 13.5x) on her base case 2016E EPS of $24.25. Betsy assumes +5% net inflows led by iShares equity, multi-asset & index products.
Risks include: 1) greater-than-expected share loss or pricing declines in ETFs and lack of positive operating leverage if markets decline; and 2) regulatory uncertainty (e.g., MMF reform, SIFI designation), resulting in more capital held or higher expenses.
CBS Corporation (CBS) is a multimedia company that operates broadcasting, television production, and publishing businesses. The company operates television and radio stations, produces and syndicates television programs, publishes books, and provides online content as well as outdoor advertising.
Investment thesis: 1) CBS’ YTD underperformance due to recent advertising trends provides an attractive entry point, as ad spend should improve in 2H14; 2) CBS is exposed to one of our favored long-term secular trends—content monetization—with its peer-leading exposure to retransmission fee growth; and 3) CBS is a high-conviction MS & Co. call included on their Best Ideas List.
Valuation: MS & Co. analyst Ben Swinburne’s $63 price target (17% implied total return, including a 1.1% dividend yield) reflects 14x his 2016E base case EPS. His base case scenario assumes mid-to-high single digit EBITDA growth in 2015/2016 bolstered by ~7 billion of buybacks in ‘14/’15 driving 15-20% EPS growth per annum.
Risks include: 1) ratings weakness may present downside risk to network advertising revenue; 2) weaker-than-expected US advertising market growth, 3) return of capital could slow in a downturn, as CBS looks to maintain financial flexibility; and 4) slower-than-expected growth in retransmission revenues.
Chevron (CVX) is one of the world’s leading integrated energy companies, based in San Ramon, CA, with subsidiaries that conduct business worldwide. The company explores for, produces and transports crude oil and natural gas; refines, markets and
distributes transportation fuels and lubricants; manufactures and sells petrochemical products; generates power and produces geothermal energy; and provides and develops energy efficiency solutions.
Investment thesis: 1) production growth should accelerate in 2016-2019E+ to 4-5% per year from start-up of oil-linked projects (deepwater gulf of Mexico and Australia LNG); 2) an increase in Return on Capital Employed (ROCE) over the long term as more of CVX’s employed capital comes onstream; and 3) strong return of capital, rising production growth and higher ROCE will likely drive a valuation re-rating.
Valuation: MS & Co. analyst Evan Calio’s $140 price target (20% implied total return, including a 3.6% dividend yield) is derived from his base case, which assumes 2015 volume growth in-line (+2-3% year over year). He assumes oil-weighted portfolio drives positive margin improvement and start-up of Australia LNG projects on track for mid-2015/16.
Risks include: 1) production risk to 2H14 and higher capex risk in 2015 in the last phase of spending in some of CVX’s major growth projects; and 2) lower commodity prices and lower crude oil price relative to natural gas.
Costco (COST) operates over 500 membership-only warehouse clubs under the Costco Wholesale Club name in the United States, Canada, United Kingdom, South Korea, Taiwan, and Japan, as well as 30+ joint-venture warehouses in Mexico. Food, sundries and hardlines, together account for roughly 60% of sales.
Investment thesis: 1) we favor COST’s strong management, consistent sales growth, high brand equity, international growth potential longer term, and loyal membership base, which should continue to enhance the overall value of the business model; 2 ) we agree with MS & Co. analyst Simeon Gutman that COST is particularly shielded from emerging e-Commerce threats, and that its competitive advantages will likely widen over time; and 3) from a portfolio perspective, the addition of consumer/retail exposure is consistent with MS & Co. chief US equity strategist Adam Parker’s recent sector call to increase consumer exposure.
Valuation: MS & Co. analyst Simeon Gutman’s $134 price target (2% implied total return, including a 1.1% dividend yield) is based on the stock trading at 25.5x his 2015E EPS. His base case scenario assumes US comps of 5% and modest EBIT margin expansion. The 25.5x multiple is a one-turn premium reflecting Simeon’s near-term earnings acceleration thesis.
R E S E A R C H US MODEL OCTOBER 31, 2014
Please refer to important information, disclosures and qualifications at the end of this material.
6
Risks include: 1) lower gasoline prices and rising food inflation, which may impact COST's margin as the company opts to maintain its value proposition. That being said, we view recent food inflation as largely temporary driven by highly idiosyncratic issues such as drought earlier this year; 2) traction in the food delivery business by competitors may pose a slight threat to COST's grocery segment; and 3) COST's business model may not resonate in new international markets.
Crown Castle International (CCI) engineers, deploys, owns and operates shared wireless infrastructure, including extensive networks of towers and rooftops. The company offers wireless communications coverage to many of the major US markets and to substantially all of the Australian population.
Investment thesis: 1) an attractive and stable business model with good visibility and relatively low volatility; 2) potential for significant return of capital given the company’s strong, growing, and sustainable free cash flow; and 3) a strong fit with one of our favorite secular themes—network ubiquity in an era of rapid wireless data growth. In sum, CCI has an attractive mix of a relatively defensive business model (more defensive than many investors might initially perceive, in our view) and “big idea” growth potential from the continued robust outlook for wireless demand.
Valuation: MS & Co. analyst Simon Flannery’s $91 price target (21% implied total return, including a 4.2% dividend yield) is derived using a DCF analysis, with a WACC of 6.7%. He uses a terminal FCF growth rate of -0.1%, which implies a 2015E Price to Adjusted Funds from Operations (P/AFFO) of ~18.5x.
Risks include: 1) rising interest rates; 2) carrier consolidation; 3) pre-sold commitments; and 4) valuation relative to other industries.
Danaher (DHR) is a Fortune 200, NYSE-listed, science and technology leader that designs, manufactures and markets innovative products and services to professional, medical, industrial and commercial customers. They have five reporting segments: Test & Measurement, Environmental, Dental, Life Sciences & Diagnostics, and Industrial Technologies.
Investment thesis: 1) one of the best-quality and highest-growth stocks in MS & Co. analyst Nigel Coe’s coverage; 2) DHR has underperformed the S&P 500 and its valuation premium compared to the overall market has declined; and 3) DHR has strategic potential through M&A. Nigel estimates M&A can potentially add over 8% per annum tailwind to earnings.
Valuation: MS & Co. analyst Nigel Coe’s $82 price target (3% implied total return, including a 1% dividend yield) is derived from his base case scenario of 19.5x July 2015E NTM EPS of $4.23 but cross-checked with his DCF modal. He uses a 7.9% WACC, terminal ROIC of 15.0% and a 10.5% EBITDA exit multiple.
Risks include: 1) deal paralysis could cause the stock to tread water relative to the group; and 2) sequestration and government austerity could lead to a more challenging environment in certain sciences and water end markets.
Estee Lauder Companies Inc. (EL) is one of the world’s leading manufacturers and marketers of prestige skin care, makeup, fragrance, and hair care products. The company’s products are sold in over 130 countries and territories under well-recognized brand names, including Estee Lauder, Clinique, Prescriptives, Origins, and MAC. The US accounts for 50% of Estee Lauder’s sales with other large markets in the UK, France, Germany, Italy, and Japan.
Investment thesis: 1) we favor EL’s leadership in the high-growth beauty category; 2) outsized margin expansion potential given cost savings, superior top-line growth; and 3) stronger better balance sheet, and higher returns than peers.
Valuation: MS & Co. analyst Dara Mohsenian’s $87 price target (17% implied total return, including a 1.1% dividend yield) assumes a 14x C2015E EV/EBITDA multiple, at the high end of peers given EL’s greater top-line/EPS growth, higher ROIC, strong balance sheet, and strategic potential. Dara assumes cost cutting and top-line leverage drive annual margin expansion of ~60bps/year.
Risks include: 1) macro conditions; 2) travel retail volatility; 3) disappointing China results; 4) category growth trends; and 5) FX headwinds.
Google (GOOGL) serves its users by developing products that enable people to more quickly and easily find, create, and organize information. The company's innovations in web search and advertising have made its website, google.com, a top internet destination. Google maintains the world's largest online index of websites and other content, and makes this information freely available to anyone with an Internet connection. Over 80% of Google’s revenue is derived from advertising with 47% of revenue sourced in the US, 10% in the UK, and 43% in the rest of the world.
R E S E A R C H US MODEL OCTOBER 31, 2014
Please refer to important information, disclosures and qualifications at the end of this material.
7
Investment thesis: 1) high-quality business model with market and brand leadership in large and growing markets; 2) we favor GOOGL’s resilient free cash flow driven by strong growth in global online advertising; 3) we expect further market share gains and growth in mobile and video advertising.
Valuation: GOOGL is currently uncovered by MS & Co. research.
Risks include: 1) dependence on key personnel/founders and the significant voting control of CEO Larry Page, co-founder and director, Sergey Brin, and executive chairman, Eric Schmidt; and 2) the rapid pace of change in the internet, regulatory scrutiny, market or macro deceleration, FX, regulation, Motorola mobility integration, mobile monetization and competition.
EOG Resources, Inc. (EOG) a Delaware corporation organized in 1985, together with its subsidiaries (collectively, EOG), explores for, develops, produces, and markets crude oil and natural gas primarily in major producing basins in the United States, Canada, The Republic of Trinidad and Tobago, the United Kingdom, The People's Republic of China, the Argentine Republic and, from time to time, select other international areas.
Investment thesis: 1) strong production growth given EOG’s attractive access to premier US oil plays including the Eagle Ford, Permian Basin and the Bakken; 2) robust pipeline of potential new exploration and production projects that could extend EOG’s growth over the medium and longer term; and 3) peer-leading cash flow growth, which may contribute to further multiple expansion in the stock. We view EOG as a leader and long-term beneficiary of increasing US oil production and believe the company’s size and scale position it well within the energy sector.
Valuation: MS & Co. analyst Evan Calio’s $136 price target (44% implied total return, including a 0.7% dividend yield) is based on 1x his risked net asset value and implies 8.8x 2015E forward debt-adjusted cash flow.
Risks include: 1) commodity price risk, including lower oil, gas, or NGL prices; 2) capital cost inflation; 3) poor results in exploration projects; and 4) acquisition: EOG’s leading position in Eagle Ford and cash flow discount to majors give it strategic potential.
The Home Depot (HD), Inc. is the world's largest home improvement retailer that sells building materials, home improvement, and lawn and garden products, and provides a number of services. Home Depot operates throughout the US (including Puerto Rico, the Virgin Islands and Guam), Canada, China, and Mexico.
Investment thesis: 1) HD is a quality franchise with likely high-teens earnings growth over the next several years; 2) while mortgage rates have risen, we continue to see multi-year upside to the US housing recovery and expect HD to be a key beneficiary; 3) we see HD as a strong fit with our quality bias given its proven management, leading market share position, and strong cash flow generation.
Valuation: MS & Co. analyst Simeon Gutman’s $92 price target (-4% implied total return, including a 1.9% dividend yield) is based on a DCF analysis and represents 18x his 2015E EPS of $5.12 which is in-line with FTM trading levels and its 3-year average multiple. With a WACC of 8.5% and a terminal growth rate of 1%, the estimated value of HD is $92. Operating assumptions within the DCF include FCF growing 5% and an EBIT margin of 14.5% by 2023.
Risks include: 1) deterioration in recent housing improvement trends; 2) housing prices and turnover begin to slow again; 3) competition from other retailers; 4) local weather impacting construction; 5) further increase in mortgage rates; 6) deteriorating housing loan availability; or 7) muted supply chain efficiencies.
Honeywell (HON) is a diversified global, multi-industry company split into four primary business segments: Aerospace Solutions, Automation and Control, Specialty Materials, and Transportation and Power. Each segment has various business units and product classes serving multiple end markets.
Investment thesis: 1) HON has exposure to the energy efficiency secular theme with roughly 50% of sales tied to this segment; 2) MS & Co. analyst, Nigel Coe, believes HON’s goal for 4-6% core growth and 18.5-20% margins by 2018 is achievable; and 3) HON’s ROIC and earnings quality are superior to peers and we see potential for multiple re-rating.
Valuation: MS & Co. analyst Nigel Coe’s $106 price target (12% implied total return, including a 2.2% dividend yield) is derived from his base case scenario of 16x October 2015 NTM EPS of $6.61 and cross-checked with his DCF model. He uses an 8% WACC, terminal ROIC of 25% and 10x EBITDA exit multiple.
Risks include: 1) short-cycle headwinds as HON has more short-cycle exposure than many large-cap peers, posing slightly above-average revenue risk if global growth slows down; and 2) further Department of Defense budget pressure given HON’s exposure to defense end markets.
JP Morgan Chase & Co. (JPM) is the second-largest US bank holding company by assets. The company operates five principal
R E S E A R C H US MODEL OCTOBER 31, 2014
Please refer to important information, disclosures and qualifications at the end of this material.
8
business lines: 1) Investment Banking; 2) Treasury and Security Services; 3) Investment Management and Private Banking; 4) JP Morgan Partners (Private Equity); and 5) Chase Financial Services (Retail and Middle Market Banking).
Investment thesis: 1) we favor JPM’s return of capital story, including a 2.7% dividend yield; 2) JPM has a high-quality global franchise with leading market shares and a strong, proven management team; and 3) lower legal costs, improved efficiency, and market share gains should boost return on capital from 11.9% in 2013 to 13.6% in 2016.
Valuation: MS & Co. analyst Betsy Graseck’s $76 price target (29% implied total return, including a 2.7% dividend yield) is based on multiple valuation methodologies including P/E, P/BV relative to ROE, P/TBV relative to ROTCE and residual income.
Risks include: 1) stricter-than-expected regulatory interpretation of financial reform legislation; 2) higher credit losses than anticipated; 3) legal/regulatory-related costs (including LIBOR-related litigation/penalties); and 4) thinner net interest margin.
Kinder Morgan Inc. (KMI) operates as a holding company with direct ownership and operation of midstream energy assets through MLP Kinder Morgan Energy Partner, L.P.
Investment thesis: 1) we view “toll collector” opportunities in natural gas and liquids as one of our favored investment themes. KMI is a strong fit with this theme; 2) we favor KMI's scale, defensive business model, limited commodity exposure, and quality management team; and 3) we see potential upside to KMI’s 4.6% dividend yield as an improved cost of capital allows for greater project/acquisition realization.
Valuation: MS & Co. analyst Brian Lasky’s $43 price target (16% implied total return, including a 4.6% dividend yield) is based on 4.75% 2015E yield/10% long-term dividend growth through 2020.
Risks include: 1) KMI unable to hit returns and growth targets; 2) commodity environment deteriorates; and 3) weaker-than-expected economic backdrop pressures energy stocks in general.
MasterCard (MA) is a provider of transaction processing services and other payment-related services in more than 210 countries. It connects merchants, financial institutions and governments worldwide, enabling them to make online payments.
Investment thesis: 1) we view MA as a high-quality global franchise, with exposure to robust secular growth drivers, resilient profit margins and a strong management; 2) tactically, we see an attractive entry point following MA’s YTD underperformance,
and given MS & Co. economics team’s view that consumer spending is likely to inflect higher, driven by improving jobs and consumer confidence; and 3) MA is a high-conviction MS & Co. research call and was included in the 2015 Vintage Values List.
Valuation: MS & Co. analyst Smittipon Srethapramote’s $93 price target (12% implied total return, including a 0.5% dividend yield) is derived from a 75%/25% weighted average of his base-case P/E multiple based analysis and discounted cash flow (DCF). DCF assumes a 9% weighted average cost of capital (WACC) and a 4% terminal growth rate. He assumes payment volume growth decelerates slightly in 2015.
Risks include: 1) a material slowdown in consumer spending trends and/or slowdown in cross-border volume growth; and 2) new payment companies attempting to disintermediate traditional payment network companies through utilization of automated clearinghouse (ACH).
McKesson Corporation (MCK) distributes pharmaceuticals, medical-surgical supplies, and health and beauty care products throughout North America. The company also develops, implements, and supports software that facilitates the integration of data throughout the health enterprise. In addition, McKesson offers analytic, care management and patient solutions for payers.
Investment thesis: 1) MCK is the largest US drug distributor, gaining further scale and benefiting from solid industry trends over the next two years; 2) MCK is likely to benefit from an improving generic pipeline in 2014/2015 and from utilization associated with reform; and 3) MS & Co. analyst Ricky Goldwasser expects greater cost savings and synergies associated with MCK’s Celesio acquisition.
Valuation: MS & Co. analyst Ricky Goldwasser’s $205 price target (1% total return, including a 0.5% dividend yield) is based on a 16x multiple applied to MS & Co.’s CY15E EPS of $12.78. The multiple represents the upper range of the group’s historical 1-year forward average, which we believe is justified given improving industry fundamentals and the opportunity to increase shareholder value.
Risks include: 1) MCK does not reach 100% ownership of Celesio; 2) MCK loses the CVS contract (FY16/FY17 event, which represents ~2-3% of EPS); and 3) generic price deflation.
Monsanto (MON) is a leader in providing agricultural products for farmers. Monsanto's business consists of two segments: Seeds and Genomics (73% of revenues), and Agricultural Productivity (27% of revenues). The Seeds and Genomics segment consists of

R E S E A R C H US MODEL OCTOBER 31, 2014
Please refer to important information, disclosures and qualifications at the end of this material.
9
the company's global seeds and traits business, and genetic technology platforms, including biotechnology, breeding and genomics. The Agricultural Productivity segment consists primarily of crop protection products, residential lawn and garden herbicide.
Investment thesis: 1) Monsanto has unusually powerful long-term growth drivers given the secular increase in global demand for agricultural crops, its leadership position and competitive advantage in biotech traits, and its strong technology pipeline; 2) MON’s key products include intacta soybeans, which could ultimately provide ~$2.50 of EPS in South America; and 3) we favor MON’s balance sheet optimization potential, which should add downside support.
Valuation: MS & Co. analyst Vincent Andrews’ $150 price target (32% implied total return, including a 1.7% dividend yield) is based on a sum-of-the-parts valuation. Vincent assumes 1) Intacta has solid performance in Brazil; 2) ~5% seed price/mix despite ~$4 corn; 3) 1% share gains in corn and soy; 4) IFS/Climate has a successful F2014; 5) Roundup Chemical stabilizes near current levels; and 6) balance sheet progress.
Risks include: 1) adverse corn prices; and 2) unfavorable field tests in corn and soy.
NextEra Energy, Inc. (NEE) consists of a regulated electric utility, Florida Power & Light, and a merchant generation segment weighted to clean sources of energy, namely, natural gas, nuclear, and wind power. Compared to the industry as a whole, NextEra has significantly lower emission rates of carbon dioxide, sulfur dioxide, and nitrogen oxide. Employees and operations span 28 U.S. states and Canada.
Investment thesis: 1) MS & Co. analyst Stephen Byrd sees incremental value from NEE’s YieldCo, NEP, resulting in ~20% total return potential including the dividend; 2) we believe NEE is well positioned given robust prospects for each of its core businesses, an above-average dividend growth outlook of 10% per year, a constructive regulatory dynamic in Florida, and strong cash flows; and 3) NEE’s risk reward is favorable, in our view.
Valuation: MS & Co. analyst Stephen Byrd’s $114 price target (17% implied total return, including a 2.9% dividend yield) is derived from his 2016E base case of 15.3x Utility EPS of $3.59.
Risks include: 1) NEP underperforms due to deteriorating market for yield/growth; 2) failure to complete utility/renewables growth projects; and 3) weak utility sales growth.
Oracle (ORCL) is the world’s leading database vendor, the second-largest business applications company and the second-largest software company in the world overall. In 2013, about 70% of its revenue was generated from software, 17% from hardware, and 13% from services.
Investment thesis: 1) we favor ORCL’s defensive attributes with 80% of operating income from recurring revenue; 2) MS & Co. analyst, Keith Weiss, believes ORCL can sustain low-double-digit EPS growth; and 3) potential for growth to accelerate driven by product cycles and new cloud business models.
Valuation: Keith’s $45 price target (17% implied total return, including a 1.2% dividend yield) is derived from his base case of 14x CY15E EPS of $3.25.
Risks include: 1) disruptive technologies in the data management market; 2) migration toward SaaS-based subscription application model; and 3) strong secular application competitors.
PepsiCo (PEP) manufactures sells and markets products from their business segments, Pepsi-Cola, Frito-Lay, Tropicana, and Quaker Foods. Pepsi-Cola sells both carbonated and non-carbonated beverages and holds approximately a 32% share of the U.S. soft drink industry. Frito-Lay sells such products as Lays and Ruffles Potato Chips, Tostitos and Fritos, and holds an approximately 58% share in the U.S. snack chip industry.
Investment thesis: 1) We view PEP as a quintessential high-quality global franchise that dovetails with our high-conviction "global gorilla" bias; 2) we favor PEP’s strong FCF generation and attractive 2.7% dividend yield (with solid dividend growth likely over time); and 4) PEP’s valuation is compelling, at 19x 2015E EPS and 12x EV/EBITDA, a discount to key peers.
Valuation: MS & Co. analyst Dara Mohsenian’s $103 price target (10% implied total return, including a 2.7% dividend yield) is derived from his base case of 21x 2015e EPS.
Risks include: 1) volatility in Russia/Mexico/China; 2) commodity cost and FX volatility; 3) lower-than-expected cost savings from the restructuring program; 4) acceleration in competitive intensity in beverages; and 5) macro and/or health-related topline weakness.
Philip Morris International (PM) currently has a 15%+ share of the international cigarette market. Its brands are sold in more than 180 markets. In 2013, PM generated 36% of revenues from Asia, 26% from Eastern Europe, Middle East & Africa, 27% from rest of Europe, 11% Latin America.
R E S E A R C H US MODEL OCTOBER 31, 2014
Please refer to important information, disclosures and qualifications at the end of this material.
10
Investment thesis: 1) PM operates in an inherently attractive industry with high profit margins and substantial free cash flow; 2) we favor PM’s global diversification with good exposure to EM and DM; and 3) MS & Co. analyst Matthew Grainger anticipates continued long-term improvement in PM’s local-currency operating results, driven by a general absence of excise tax shocks and good industry pricing.
Valuation: MS & Co. analyst Matthew Grainger’s $92 price target (8% implied total return, including a 4.5% dividend yield) is based on ~12x 2015E EV/EBITDA, reflecting a ~10% premium to current valuations of slower-growth US tobacco peers (~11x).
Risks include: 1) additional strength of the U.S dollar; and 2) large-scale excise tax increase.
Prologis (PLD) is the world’s largest owner, manager and developer of distribution facilities, with operations in 21 countries across the Americas, Europe and Asia. ProLogis’ customers include manufacturers, retailers, transportation companies, third-party logistics providers and other enterprises with large-scale distribution needs.
Investment thesis: 1) we expect cyclical strength in industrial leasing from an accelerating recovery. Warehouse vacancies are nearing the trough of the last cycle and PLD should benefit from rising rents; 2) additional upside could come from PLD’s successful development track record with meaningful value creation going forward anticipated; and 3) PLD’s strengthened balance sheet and underappreciated global land bank create barriers to entry and support new development.
Valuation: MS & Co. analyst Vance Edelson’s $48 target (19% implied total return, including a 3.2% dividend yield) is derived from a 17% premium to his base case 2014E NAV of $41. Vance applies a 5.7% cap rate to his 2014E net operating income (NOI) to arrive at a 2014 gross real estate value, and then adds other assets and liabilities to arrive at net asset value (NAV). He then applies a premium to this NAV to arrive at his 12-month price target.
Risks include: 1) development may not yield the related advantages for several quarters; 2) some of PLD’s facilities are older and may be perceived as antiquated; and 3) any hiccups in the global industrial cycle could weigh on results.
Prudential Financial, Inc. (PRU) provides insurance, investment management, and other financial products and services to both retail and institutional customers throughout the United States, Asia, Europe and Latin America. Principal products and services
provided include life insurance, annuities, retirement-related services, mutual funds and investment management.
Investment thesis: 1) PRU is a high-quality global franchise with strong execution, high returns on equity, and potential upcoming catalysts on clarification of Systematically Important Financial Institution (SIFI) rules; 2) from a capital return perspective, we highlight that PRU has a 2.4% dividend yield and has raised its dividend 28% per year over the last five years; 3) we view PRU, a MS & Co. Best Ideas List stock, as a high-conviction research call.
Valuation: MS & Co. analyst Nigel Dally’s $106 price target (22% implied total return, including a 2.4% dividend yield) is based on an ROE in excess of 15% and the stock trading around 1.5-1.6 times book value ex-AOCI Accumulated Other Comprehensive Income given an estimated cost of capital of roughly 10%. Applying this to a 2015 expected year-end book value ex-AOI Accumulated Other Income please check this of $68 leads him to his price target.
Risks include: 1) signs that non-bank SIFI capital rules likely to be more onerous than currently expected; 2) adverse currency fluctuations impacting future hedge rates in Japan; and 3) a meaningful pullback in equity markets and interest rates.
Qualcomm (QCOM) is a licensor of mobile technologies and a manufacturer of semiconductor chipsets for the mobile industry.
Investment thesis: 1) we favor QCOM’s leading position in the cellular baseband and application processors market; 2) strong fit with the portfolio given its high-quality balance sheet, leading technology capabilities, and attractive margin profile; and 3) QCOM’s exposure to the Internet of Things secular trend represents a significant growth opportunity.
Valuation: MS & Co. analyst James Faucette’s $75 base case (-3% implied total return, including a 2.1 % dividend yield) is based on 15x earnings potential discounted back. James assumes cost-cutting measures are taken while QCOM gains share in China. He expects the handset replacement cycle to remain steady at roughly 24 months, but that the company is able to gain incremental operating leverage as it reduces operating expenses during 2H14.
Risks include: 1) fall in phone replacement rate; 2) legal challenges to QCOM’s royalty structure; and 3) substantial loss of chipset share.
Schlumberger (SLB) is an oil services company. Through its subsidiaries it provides a range of services, including technology,
R E S E A R C H US MODEL OCTOBER 31, 2014
Please refer to important information, disclosures and qualifications at the end of this material.
11
project management and information solutions to the international petroleum industry.
Investment thesis: 1) we view SLB as a high-quality company given its management strength, international growth potential, and leading market share position; 2) we favor SLB’s greater exposure to offshore, which carries twice the growth rate of onshore operations; and 3) SLB has superior cash return and returns most of its FCF to shareholders, meaningfully above its peers.
Valuation: MS & Co. analyst Ole Slorer’s $135 price target (implies a 39% potential total return, including a 1.6% yield) and is based on a FCF yield of 3.5% on Ole’s 2016e FCF of ~4.90/share
Risks include: 1) international margin expansion derails on continued overly competitive behavior; 2) weak growth in well count in 2014-15; 3) Saudi growth misses expectations; and 4) adverse macro/oil price.
Starwood Hotels & Resorts Worldwide Inc. (HOT) is one of the leading hotel and leisure companies in the world with 1,025 properties in 100 countries and territories with 145,000 employees at its owned and managed properties.
Investment thesis: 1) Starwood has an attractive upscale global asset mix within a favorable industry backdrop for lodging; 2) Starwood appears well positioned to unlock real estate value as it transitions to an “asset light” recurring fee-based model; and 3) strong free cash flow generation and healthy balance sheet looks likely to drive greater capital return.
Valuation: MS & Co. analyst Thomas Allen’s $90 price target (19% potential upside, including a 1.8% dividend yield) is based on a 13.7x 2015E base EBITDA.
Risks include: 1) macro challenges do not improve and there is softer global demand; 2) cost pressures limit margin/incentive fee gains; and 3) underperformance of luxury/upper upscale US hotels.
Thermo Fisher Scientific (TMO) provides analytical instruments, equipment, reagents and consumables, software, and services for research, manufacture, analysis, discovery, and diagnostics. The company serves pharmaceutical and biotechnology companies, hospitals and clinical diagnostic labs, universities, research institutions, government agencies, and environmental and industrial process control settings primarily in the United States, Germany, and the United Kingdom.
Investment thesis: 1) we view TMO as a leader within the research market due to its high-specificity equipment and gene sequencing technology; 2) we favor TMO’s exposure to environmental end markets in China given the government’s focus on air quality control; and 3) we agree with MS & Co. analyst Steve Beuchaw that synergies from the 1Q14 LIFE acquisition may be conservative.
Valuation: MS & Co. analyst Steve Beuchaw’s $146 price target (25% implied total return, including a 0.5% dividend yield) reflects 16x his 2016E EPS, which is in-line with the current P/E and supported by his DCF analysis. Steve assumes 3.6% organic growth in 2016E with 130bps of EBIT margin expansion on better-than-expected LIFE synergies and leverage to emerging growth categories.
Risks include: 1) synergies from the LIFE transaction are lower than expected; and 2) global macro slowdown.
Time Warner Inc. (TWX) is one of the world's leading media and entertainment companies, whose businesses include filmed entertainment, interactive services, television networks, cable systems, and publishing.
Investment thesis: 1) TWX is a less advertising market-sensitive content powerhouse within the large-cap media universe, with just 20% of post Time Inc. spin-off revenues derived from advertising; 2) MS & Co. analyst Ben Swinburne estimates TWX will deliver an attractive high-single-digit EBIT growth and mid-to-high teens EPS growth over the next five years; 3) TWX continues to be a strong allocator of capital, further emphasized by raising its leverage target to 2.75x by year-end 2014.
Valuation: MS & Co. analyst Ben Swinburne’s $90 price target (15% implied potential return, including a 1.6% dividend yield) is based on 10.5x EV/1yr forward EBITDA. He assumes high-teens EPS growth in 2014 to 2018.
Risks include: 1) ratings weakness at Turner leads to below-market advertising growth, but robust syndication pipeline ahead could provide ratings support; 2) domestic affiliate renewal growth is slower than expected; 3) capital returns slow meaningfully, leading to EPS downside; and 4) “over-the-top” competitors significantly disrupt the premium networks ecosystem, leading to HBO subscriber declines.
Union Pacific Corporation (UNP) is a rail transportation company. UNP hauls a variety of goods, including agricultural, automotive, and chemical products. They offer long-haul routes from all major West Coast and Gulf Coast ports to eastern
R E S E A R C H US MODEL OCTOBER 31, 2014
Please refer to important information, disclosures and qualifications at the end of this material.
12
gateways. UNP also connects to Canada’s rail systems and serves the major gateways to Mexico.
Investment thesis: 1) high-quality transport company with exposure to favorable rail themes including volume growth, pricing power, and productivity improvements; 2) UNP’s recently announced more aggressive buyback authorization should offer further upside potential to the stock price; and 3) we favor UNP’s margin opportunity as it realizes more productivity gains.
MS & Co. analyst Bill Greene’s $129 price target (13% implied total return, including a 1.7% dividend yield) is based on a 17x year-end 2015E EPS of $6.65.
Risks include: 1) volume losses from higher pricing; 2) risk to volumes if shippers start moving to ocean supply chains through the Panama Canal; 3) episodes of poor execution around volume rebounds; and 4) regulatory changes could impact pricing, service or operations.
United Technologies (UTX) is a diversified manufacturing corporation that provides commercial and military aviation products, including helicopters and jet engines, and commercial building technologies including air conditioning, elevator design and security systems. Divisions include Pratt & Whitney, Sikorsky Helicopters, Hamilton Sundstrand, Otis Elevator, Carrier Air Conditioning, and Fire & Security.
Investment thesis: 1) we see UTX as a high-quality global franchise with a proven management team, diversified portfolio, strong cash flow generation, and attractive 2.2% dividend yield; 2) we favor UTX’s exposure to an extended aerospace upcycle. Key positive multi-year drivers for the industry include record production backlogs, regulatory-driven demand for aftermarket services, and emerging market tourism trends; and 3) valuation appears compelling with the stock trading at an unusual discount to peers. Valuation: MS & Co. analyst Nigel Coe’s $125 price target (19% implied total return, including a 2.2% dividend yield) is derived from his base case scenario of 16x October 2015E EPS of $7.82. He cross-checks his base case with his DCF model, using a 7.7% WACC, terminal pre-tax ROIC of 22% and a 10x EBITDA exit multiple.
Risks include: 1) China real estate hard landing could pressure Otis estimates in 2015 and beyond; and 2) risks to 2016 and beyond for commercial aerospace aftermarket given sharply falling aircraft re-sale values.
UnitedHealth Group (UNH) is a diversified healthcare services company offering managed care and other health insurance products nationwide. In addition, the company offers robust data analytics and technology capabilities. UnitedHealth Group offers products and services through two distinct platforms: UnitedHealthcare, which provides health care coverage and benefits services and Optum, which provides information and technology-based health services.
Investment thesis: 1) UNH is the largest, most diversified HMO, with unique exposure to Medicaid expansion; 2) earnings should accelerate in 2015-2016, driven by United’s services platform, Optum; and 3) strong free cash flow generation with attractive return of capital.
Valuation: MS & Co. analyst Andrew Schenker’s $84 price target (-10% potential upside, including a 1.6% dividend yield) assumes UNH trades at 13.5x his 2015E EPS, in-line with the historical premium to the company’s peer group, and is consistent with a 9% FCF yield.
Risks include: 1) OptumRx integration and transition and Optum growth slowing below expectations; 2) additional pressure on Medicare Advantage through reimbursement cuts; commercial pricing environment intensifies or the price-cost spread narrows or inverts after years of outperformance; 3) UNH might have mispriced or experienced adverse selection in its exchange products; and 4) new Medicaid lives may come in at a higher Medical Loss Ratio (MLR).
Visa (V) is a global payments technology company that connects consumers, businesses, banks and governments in more than 200 countries and territories, enabling them to use digital currency instead of cash and checks.
Investment thesis: 1) We favor V’s potential for double-digit earnings growth over the next several years; 2) V is exposed to key secular trends such as the transition from cash to credit payments; 3) we believe the ability to grow faster than the industry’s secular trends via continued innovation and solid execution in new product areas and higher growth geographies should sustain V’s relative premium valuation and drive the stock higher over time.
Valuation: MS & Co. analyst Smittipon Srethapramote’s $270 price target (13% implied total return, including a 0.8% dividend yield) is derived from a 75%/25% weighted average of his base case P/E multiple-based analysis (21x CY16E EPS) and DCF. Smitti assumes that payment volumes continue to grow at a low
R E S E A R C H US MODEL OCTOBER 31, 2014
Please refer to important information, disclosures and qualifications at the end of this material.
13
double digit pace in F2015. Organic revenue growth (ex-FX) averages ~10% with margin expansion. And that management continues to deploy buybacks to drive EPS growth in the mid-teens. His DCF assumes a 8% WACC and a 4% terminal growth rate.
Risks include: 1) a material slowdown in consumer spending; 2) slowdown in cross-border volume; 3) regulatory risk from countries such as Russia setting up domestic payment schemes.
Wells Fargo & Co. (WFC) Headquartered in San Francisco, CA, Wells Fargo & Co. is one of the largest banking companies in the country. The company is organized into three main businesses: Community Banking, Wholesale Banking and Wells Fargo Financial.
Investment thesis: 1) we view Wells, which emerged relatively unscathed, if not stronger, from the 2008-2009 housing bust, as one of the best-managed domestic banks; 2) MS & Co. analyst, Betsy Graseck, expects improving housing to drive lower loan losses, lower credit-related costs and higher loan growth; 3) WFC has a solid 2.6% dividend yield with attractive dividend growth characteristics.
Valuation: MS & Co. analyst Betsy Graseck’s price target of $58 (12% potential upside, including a 2.6% dividend yield) is based on 12.3x her base case 2016E EPS.
Risks include: 1) general equity market sensitivity; 2) inability to buy back stock; 3) failure to meet cost savings targets; 4) declining yields on its assets; 5) higher reserve requirements; and 6) an unexpected decline in home prices.
Williams Cos (WMB) is a natural gas company that engages in finding, producing, gathering and transporting natural gas, and it is organized into the following segments: exploration and production, gas pipelines, midstream gas and liquids, and gas marketing services.
Investment thesis: 1) we view WMB as well positioned to participate in the infrastructure necessary to develop and commercialize natural gas, benefiting from gathering, processing, and transporting gas across its pipelines; 2) attractive exposure to two MLPs, including 70% limited partner ownership in WPZ plus 100% ownership of the general partner; 3) we favor WMB’s significant return of capital potential via dividends or buybacks.
Valuation: MS & Co analyst Brian Lasky’s $63 price target (18% implied total return, including a 4% dividend yield) is derived from an average sum-of-the-parts dividend yield analysis. Brian assumes a 3.75% trading yield on a FY15E dividend of $2.46.
Risks include: 1) Proposed transactions fail to go through; 2) commodity prices pressure earnings further; 3) Geismar downtime and/or associated liabilities prove to be greater than anticipated; 4) northeast volumes continue to lag.
Yum! Brands (YUM) is the second-largest quick service restaurant (QSR) chain in the world. Its main brands include Taco Bell, KFC and Pizza Hut.
Investment thesis: 1) YUM is a key beneficiary as China moves from a producer to a consumer economy; 2) we favor YUM’s multiple levers for top-line growth in China including new stores, menu innovation, and price points; and 3) larger exposure to international growth opportunity than peers.
Valuation: MS & Co. analyst John Glass’ $71 base case (1.1% implied total return, including a 2.3% dividend yield) assumes an 18x 2016E EPS of $4.30 (discounted to 2015), essentially flat year-over-year in 2H given his same store sales assumptions.
Risks include: 1) long-term residual impact from China supply issue; 2) China consumer slowdown; 3) failure of key YRI markets to demonstrate profitable growth.
R E S E A R C H US MODEL OCTOBER 31, 2014
Please refer to important information, disclosures and qualifications at the end of this material.
14
Disclosure Section This report does not provide individually tailored investment advice and has been prepared without regard to the individual financial circumstances and objectives of persons who receive it. The securities in Equity Model Portfolios are selected and monitored on an ongoing basis by members of the Equity Model Portfolio Solutions team and may be purchased in a single transaction as individual stocks. Periodically, changes to the portfolios are recommended; clients then decide whether the recommendation makes sense for their particular financial situation. After client purchases a portfolio, the same stocks will remain in his or her account unless individual stocks are bought or sold in response to subsequent changes in the portfolio or as otherwise individually determined by the client. Such transactions will incur applicable commission charges. Clients should seek advice from their financial advisor as to the suitability of investing in any of the securities or investment strategies discussed in this report. Financial Advisors and Private Wealth Advisors may use Equity Model Portfolios as a resource in formulating investment advice for their advisory clients, provided that they consider all other relevant factors and sources of information in tailoring their advice to a particular client, taking into consideration the client's investment objectives, risk tolerance and investment horizons.
The information and opinions in Morgan Stanley Wealth Management Research were prepared by Morgan Stanley Smith Barney LLC under its trade name Morgan Stanley Wealth Management.
For important disclosures (including copies of historical disclosures) regarding the securities and/or companies that are the subject of this Morgan Stanley Wealth Management Research product, please contact Morgan Stanley Wealth Management Research, 522 Fifth Ave., New York, N.Y. 10036, Attention: Research Management. In addition, the same important disclosures, with the exception of the historical disclosures, are contained on the Firm's disclosure website at https://www.morganstanley.com/online/researchdisclosures. Historical disclosures will be provided upon request back to June 1, 2009.
Morgan Stanley Wealth Management Analyst Certification The Morgan Stanley Wealth Management research analysts principally responsible for the preparation and content of all or any identified portion of this research report, hereby certify that their views about the securities and/or companies discussed in this report are accurately expressed and that they have not received and will not receive direct or indirect compensation in exchange for expressing specific recommendations or views in this report. Unless otherwise stated, the individuals listed on the cover page of this report are Morgan Stanley Wealth Management research analysts.
Global Research Conflict Management Policy Morgan Stanley Wealth Management has a Conflict Management policy available at: https://www.morganstanley.com/online/researchconflictpolicies
Important US Regulatory Disclosures on Subject Issuers The following analyst or strategist (or a household member) owns securities (or related derivatives), ETFs, or Closed-End funds that he or she covers or recommends in Morgan Stanley Wealth Management Research: Katy Zhao - APPLE INC., QUALCOMM INCORPORATED; Sachin Manchanda - ORACLE CORPORATION. Morgan Stanley Wealth Management or an affiliate beneficially owned 1% or more of a class of common equity securities of: ABBOTT LABORATORIES, ACE LIMITED, APPLE INC., BAXTER INTERNATIONAL INC., BLACKROCK, INC., CBS CORPORATION, Crown Castle Corp., DANAHER CORPORATION, HONEYWELL INTERNATIONAL INC., KINDER MORGAN, INC., MASTERCARD INC., MONSANTO COMPANY, NEXTERA ENERGY, INC., PEPSICO INC., PHILIP MORRIS INTERNATIONAL INC., Prologis, Inc., PRUDENTIAL FINANCIAL INC., STARWOOD HOTELS & RESORTS WORLDWIDE, INC., THE ESTEE LAUDER COMPANIES INC., THE WILLIAMS COMPANIES, INC., THERMO FISHER SCIENTIFIC INC., TIME WARNER INC., UNITED TECHNOLOGIES CORPORATION, VISA INC., YUM! BRANDS, INC.. Within the last 12 months, Morgan Stanley Wealth Management or an affiliate received compensation for investment banking services from the following issuers (if the security is an ETF or Closed-End Fund, the compensation is from the fund's investment manager or advisor): ACE LIMITED, AMERICAN EXPRESS COMPANY, AMGEN INC., BLACKROCK, INC., CBS CORPORATION, CHEVRON CORPORATION, Crown Castle Corp., DANAHER CORPORATION, EOG RESOURCES INC., GOOGLE, INC., HONEYWELL INTERNATIONAL INC., JPMORGAN CHASE & CO., KINDER MORGAN, INC., MASTERCARD INC., MONSANTO COMPANY, NEXTERA ENERGY, INC., ORACLE CORPORATION, PEPSICO INC., Prologis, Inc., PRUDENTIAL FINANCIAL INC., SCHLUMBERGER NV, THE HOME DEPOT, INC., THE WILLIAMS COMPANIES, INC., THERMO FISHER SCIENTIFIC INC., TIME WARNER INC., UNION PACIFIC CORPORATION, UNITEDHEALTH GROUP INCORPORATED, WELLS FARGO & COMPANY, YUM! BRANDS, INC.. In the next 3 months, Morgan Stanley Wealth Management or an affiliate will seek compensation for investment banking services from the following issuers (if the security is an ETF or Closed-End Fund, the compensation is from the fund's investment manager or advisor): ABBOTT LABORATORIES, ACE LIMITED, AMERICAN EXPRESS COMPANY, AMGEN INC., APPLE INC., BAXTER INTERNATIONAL INC., BLACKROCK, INC., CBS CORPORATION, CHEVRON CORPORATION, COSTCO WHOLESALE CORPORATION, Crown Castle Corp., DANAHER CORPORATION, EOG RESOURCES INC., GOOGLE, INC., HONEYWELL INTERNATIONAL INC., JPMORGAN CHASE & CO., KINDER MORGAN, INC., MASTERCARD INC., MCKESSON CORPORATION, MONSANTO COMPANY, NEXTERA ENERGY, INC., ORACLE CORPORATION, PEPSICO INC., Prologis, Inc., PRUDENTIAL FINANCIAL INC., QUALCOMM INCORPORATED, SCHLUMBERGER NV, STARWOOD HOTELS & RESORTS WORLDWIDE, INC., THE ESTEE LAUDER COMPANIES INC., THE HOME DEPOT, INC., THE WILLIAMS
R E S E A R C H US MODEL OCTOBER 31, 2014
Please refer to important information, disclosures and qualifications at the end of this material.
15
COMPANIES, INC., THERMO FISHER SCIENTIFIC INC., TIME WARNER INC., UNION PACIFIC CORPORATION, UNITED TECHNOLOGIES CORPORATION, UNITEDHEALTH GROUP INCORPORATED, VISA INC., WELLS FARGO & COMPANY, YUM! BRANDS, INC.. Within the last 12 months, Morgan Stanley Wealth Management or an affiliate managed or co-managed a public offering (or 144a offering) for: ACE LIMITED, AMGEN INC., BLACKROCK, INC., CBS CORPORATION, Crown Castle Corp., GOOGLE, INC., HONEYWELL INTERNATIONAL INC., JPMORGAN CHASE & CO., KINDER MORGAN, INC., MASTERCARD INC., MONSANTO COMPANY, NEXTERA ENERGY, INC., ORACLE CORPORATION, PEPSICO INC., Prologis, Inc., PRUDENTIAL FINANCIAL INC., SCHLUMBERGER NV, THE HOME DEPOT, INC., THE WILLIAMS COMPANIES, INC., THERMO FISHER SCIENTIFIC INC., TIME WARNER INC., UNION PACIFIC CORPORATION, WELLS FARGO & COMPANY. Within the last 12 months, Morgan Stanley Wealth Management or an affiliate has provided or is providing investment banking services to, or has an investment banking client relationship with, the following issuers (if the security is an ETF or Closed-End Fund, the services were or are being provided to, or the relationship is with, the fund's investment manager or advisor): ABBOTT LABORATORIES, ACE LIMITED, AMERICAN EXPRESS COMPANY, AMGEN INC., APPLE INC., BAXTER INTERNATIONAL INC., BLACKROCK, INC., CBS CORPORATION, CHEVRON CORPORATION, COSTCO WHOLESALE CORPORATION, Crown Castle Corp., DANAHER CORPORATION, EOG RESOURCES INC., GOOGLE, INC., HONEYWELL INTERNATIONAL INC., JPMORGAN CHASE & CO., KINDER MORGAN, INC., MASTERCARD INC., MCKESSON CORPORATION, MONSANTO COMPANY, NEXTERA ENERGY, INC., ORACLE CORPORATION, PEPSICO INC., Prologis, Inc., PRUDENTIAL FINANCIAL INC., QUALCOMM INCORPORATED, SCHLUMBERGER NV, STARWOOD HOTELS & RESORTS WORLDWIDE, INC., THE ESTEE LAUDER COMPANIES INC., THE HOME DEPOT, INC., THE WILLIAMS COMPANIES, INC., THERMO FISHER SCIENTIFIC INC., TIME WARNER INC., UNION PACIFIC CORPORATION, UNITED TECHNOLOGIES CORPORATION, UNITEDHEALTH GROUP INCORPORATED, VISA INC., WELLS FARGO & COMPANY, YUM! BRANDS, INC.. Within the last 12 months, Morgan Stanley Wealth Management has received compensation for products or services other than investment banking services from the following issuers (if the security is an ETF or Closed-End Fund, the compensation is from the fund's investment manager or advisor): BLACKROCK, INC., JPMORGAN CHASE & CO., PRUDENTIAL FINANCIAL INC., WELLS FARGO & COMPANY. Within the last 12 months, Morgan Stanley Wealth Management has either provided or is providing non-investment banking, securities-related services to and/or in the past has entered into an agreement to provide services or has a client relationship with the following issuers (if the security is an ETF or Closed-End Fund, the services were or are being provided to, or the agreement is with, the fund's investment manager or advisor): AMERICAN EXPRESS COMPANY, APPLE INC., BLACKROCK, INC., CBS CORPORATION, CHEVRON CORPORATION, COSTCO WHOLESALE CORPORATION, DANAHER CORPORATION, GOOGLE, INC., HONEYWELL INTERNATIONAL INC., JPMORGAN CHASE & CO., KINDER MORGAN, INC., MASTERCARD INC., MCKESSON CORPORATION, MONSANTO COMPANY, ORACLE CORPORATION, PRUDENTIAL FINANCIAL INC., QUALCOMM INCORPORATED, THE HOME DEPOT, INC., THE WILLIAMS COMPANIES, INC., TIME WARNER INC., UNITEDHEALTH GROUP INCORPORATED, WELLS FARGO & COMPANY, YUM! BRANDS, INC.. An affiliate of Morgan Stanley Wealth Management has a significant financial interest in relation to the following issuers (if the security is an ETF or Closed-End Fund, the significant financial is in relation to the fund's investment manager or advisor): ABBOTT LABORATORIES, ACE LIMITED, AMERICAN EXPRESS COMPANY, AMGEN INC., APPLE INC., BAXTER INTERNATIONAL INC., BLACKROCK, INC., CBS CORPORATION, CHEVRON CORPORATION, COSTCO WHOLESALE CORPORATION, Crown Castle Corp., DANAHER CORPORATION, EOG RESOURCES INC., GOOGLE, INC., HONEYWELL INTERNATIONAL INC., JPMORGAN CHASE & CO., KINDER MORGAN, INC., MASTERCARD INC., MCKESSON CORPORATION, MONSANTO COMPANY, NEXTERA ENERGY, INC., ORACLE CORPORATION, PEPSICO INC., PHILIP MORRIS INTERNATIONAL INC., PRUDENTIAL FINANCIAL INC., SCHLUMBERGER NV, STARWOOD HOTELS & RESORTS WORLDWIDE, INC., THE HOME DEPOT, INC., THE WILLIAMS COMPANIES, INC., THERMO FISHER SCIENTIFIC INC., TIME WARNER INC., UNION PACIFIC CORPORATION, UNITED TECHNOLOGIES CORPORATION, UNITEDHEALTH GROUP INCORPORATED, WELLS FARGO & COMPANY, YUM! BRANDS, INC.. For an explanation of the determination of significant financial interest, please refer to the applicable policies for managing conflicts of interest, which can be found at https://www.morganstanley.com/online/researchconflictpolicies. The research analysts or strategists principally responsible for the preparation of Morgan Stanley Wealth Management Research have received compensation based upon various factors, including quality of research, investor client feedback, competitive factors, and firm profitability or revenues (which include fixed income trading and capital markets profitability or revenues). Research analysts' or strategists' compensation is not linked to the profitability or revenues of particular capital markets transactions performed by Morgan Stanley Wealth Management or the profitability or revenues of particular fixed income trading desks. Morgan Stanley Wealth Management and its affiliates do business that relates to companies/instruments covered in Morgan Stanley Wealth Management Research. Morgan Stanley Wealth Management and/or its affiliates sells to and buys from customers the securities/instruments of issuers covered in this Morgan Stanley Wealth Management Research report on a principal basis.
Certain disclosures listed above are also for compliance with applicable regulations in non-US jurisdictions.
Closed-End Fund Rating System Morgan Stanley Wealth Management only rates Closed-End Funds ("CEF"). For CEFs, Morgan Stanley Wealth Management uses a relative rating system using the terms Overweight, Equal-weight, Underweight, and Not Covered (see definitions below). Morgan Stanley Wealth Management does not assign ratings of Buy, Hold or Sell to the CEFs we cover. Overweight, Equal-weight, and Underweight are not the equivalent of buy, hold and sell. Investors should carefully read the definitions of all ratings used in Morgan Stanley Wealth Management Research. In addition, since Morgan Stanley Wealth Management Research contains more complete information concerning the analyst's view, investors should carefully read Morgan Stanley Wealth Management Research, in its entirety, and not infer the contents from the ratings alone. In any case, ratings (or research) should not be used
R E S E A R C H US MODEL OCTOBER 31, 2014
Please refer to important information, disclosures and qualifications at the end of this material.
16
or relied upon as investment advice. An investor's decision to buy or sell a security or fund should depend on individual circumstances (such as the investor's existing holdings) and other considerations.
Closed-End Fund Ratings Definitions Overweight (O): The closed-end fund's total return is expected to exceed the average total return of the analyst's industry coverage universe, on a risk-adjusted basis, over the next 12-18 months. Equal-weight (E): The closed-end fund's total return is expected to be in line with the average total return of the analyst's industry coverage universe, on a risk-adjusted basis, over the next 12-18 months. Underweight (U): The closed end fund's total return is expected to be below the average total return of the analyst's industry coverage universe, on a risk-adjusted basis, over the next 12-18 months. Not Covered (NC): Indicates that the analyst does not cover the fund.
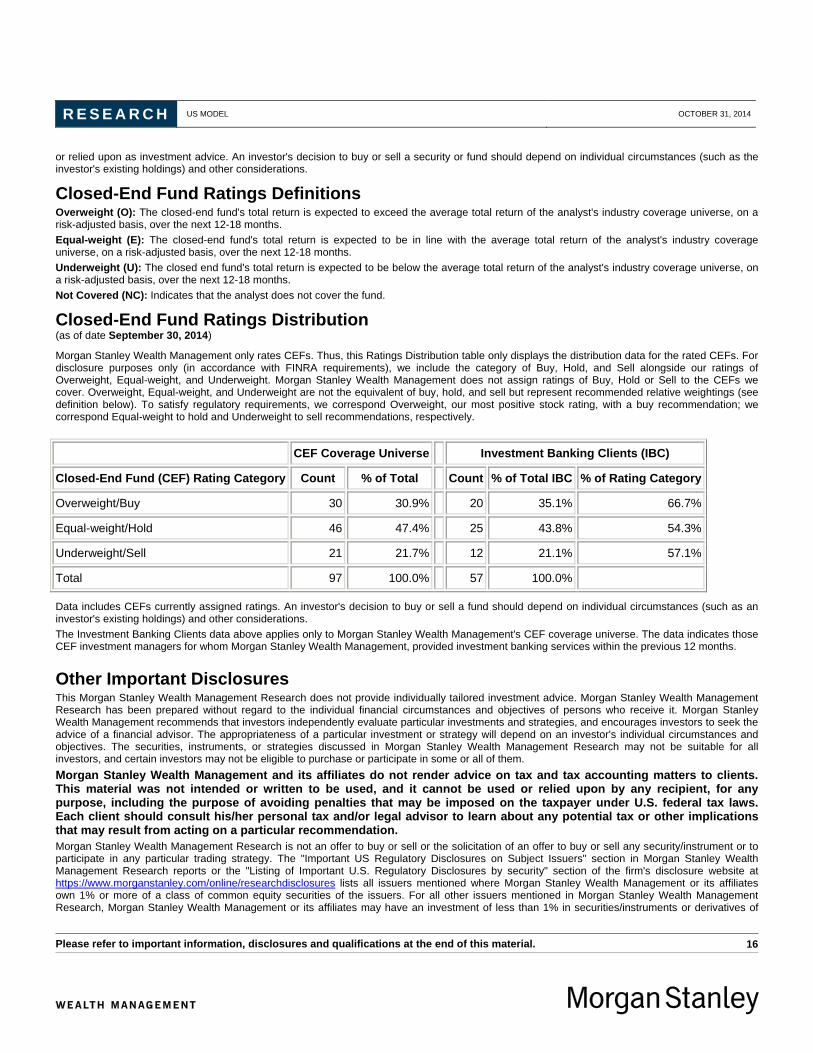
Closed-End Fund Ratings Distribution (as of date September 30, 2014)
Morgan Stanley Wealth Management only rates CEFs. Thus, this Ratings Distribution table only displays the distribution data for the rated CEFs. For disclosure purposes only (in accordance with FINRA requirements), we include the category of Buy, Hold, and Sell alongside our ratings of Overweight, Equal-weight, and Underweight. Morgan Stanley Wealth Management does not assign ratings of Buy, Hold or Sell to the CEFs we cover. Overweight, Equal-weight, and Underweight are not the equivalent of buy, hold, and sell but represent recommended relative weightings (see definition below). To satisfy regulatory requirements, we correspond Overweight, our most positive stock rating, with a buy recommendation; we correspond Equal-weight to hold and Underweight to sell recommendations, respectively.
CEF Coverage Universe Investment Banking Clients (IBC)
Closed-End Fund (CEF) Rating Category Count % of Total Count % of Total IBC % of Rating Category
Overweight/Buy 30 30.9% 20 35.1% 66.7%
Equal-weight/Hold 46 47.4% 25 43.8% 54.3%
Underweight/Sell 21 21.7% 12 21.1% 57.1%
Total 97 100.0% 57 100.0%
Data includes CEFs currently assigned ratings. An investor's decision to buy or sell a fund should depend on individual circumstances (such as an investor's existing holdings) and other considerations. The Investment Banking Clients data above applies only to Morgan Stanley Wealth Management's CEF coverage universe. The data indicates those CEF investment managers for whom Morgan Stanley Wealth Management, provided investment banking services within the previous 12 months.
Other Important Disclosures This Morgan Stanley Wealth Management Research does not provide individually tailored investment advice. Morgan Stanley Wealth Management Research has been prepared without regard to the individual financial circumstances and objectives of persons who receive it. Morgan Stanley Wealth Management recommends that investors independently evaluate particular investments and strategies, and encourages investors to seek the advice of a financial advisor. The appropriateness of a particular investment or strategy will depend on an investor's individual circumstances and objectives. The securities, instruments, or strategies discussed in Morgan Stanley Wealth Management Research may not be suitable for all investors, and certain investors may not be eligible to purchase or participate in some or all of them. Morgan Stanley Wealth Management and its affiliates do not render advice on tax and tax accounting matters to clients. This material was not intended or written to be used, and it cannot be used or relied upon by any recipient, for any purpose, including the purpose of avoiding penalties that may be imposed on the taxpayer under U.S. federal tax laws. Each client should consult his/her personal tax and/or legal advisor to learn about any potential tax or other implications that may result from acting on a particular recommendation. Morgan Stanley Wealth Management Research is not an offer to buy or sell or the solicitation of an offer to buy or sell any security/instrument or to participate in any particular trading strategy. The "Important US Regulatory Disclosures on Subject Issuers" section in Morgan Stanley Wealth Management Research reports or the "Listing of Important U.S. Regulatory Disclosures by security" section of the firm's disclosure website at https://www.morganstanley.com/online/researchdisclosures lists all issuers mentioned where Morgan Stanley Wealth Management or its affiliates own 1% or more of a class of common equity securities of the issuers. For all other issuers mentioned in Morgan Stanley Wealth Management Research, Morgan Stanley Wealth Management or its affiliates may have an investment of less than 1% in securities/instruments or derivatives of
R E S E A R C H US MODEL OCTOBER 31, 2014
Please refer to important information, disclosures and qualifications at the end of this material.
17
securities/instruments of companies and may trade them in ways different from those discussed in Morgan Stanley Wealth Management Research. Employees of Morgan Stanley Wealth Management Research are not involved in the preparation of Morgan Stanley Wealth Management Research, may have investments in securities/instruments or derivatives of securities/instruments of issuers mentioned and may trade them in ways different from those discussed in Morgan Stanley Wealth Management Research. Morgan Stanley Wealth Management Research is based on public information. Morgan Stanley Wealth Management makes every effort to use reliable, comprehensive information, but we make no representation that it is accurate or complete. We have no obligation to tell you when opinions or information in Morgan Stanley Wealth Management Research change apart from when we intend to discontinue equity research coverage of a subject company. Facts and views presented in Morgan Stanley Wealth Management Research have not been reviewed by, and may not reflect information known to, professionals in other Morgan Stanley Wealth Management business areas, including investment banking personnel. Morgan Stanley Wealth Management Research personnel conduct site visits from time to time but are prohibited from accepting payment or reimbursement by the company of travel expenses for such visits. The value of and income from your investments may vary because of changes in interest rates, foreign exchange rates, default rates, prepayment rates, securities/instruments prices, market indexes, operational or financial conditions of companies or other factors. There may be time limitations on the exercise of options or other rights in securities/instruments transactions. Past performance is not necessarily a guide to future performance. Estimates of future performance are based on assumptions that may not be realized. If provided, and unless otherwise stated, the closing price on the cover page is that of the primary exchange for the subject company's securities/instruments. Morgan Stanley Wealth Management may make investment decisions or take proprietary positions that are inconsistent with the recommendations or views in this report. Investing in closed-end funds involves risks. These include the general risks associated with investing in securities, possible changes in market prices relative to net asset values and manager performance. Besides the general risk of holding securities that may decline in value, closed-end funds have risks related to leverage and the potential for discounts to widen.
Morgan Stanley Wealth Management's Global Research Department produces and distributes research products for clients of Morgan Stanley Wealth Management.
This research is disseminated in Australia to "retail clients" within the meaning of the Australian Corporations Act by Morgan Stanley Wealth Management Australia Pty Ltd (A.B.N. 19 009 145 555, holder of Australian financial services license No. 240813).
Morgan Stanley Wealth Management is not incorporated under the People's Republic of China ("PRC") law and the research in relation to this report is conducted outside the PRC. In the PRC, this report will be distributed only upon request of a specific recipient. This report does not constitute an offer to sell or the solicitation of an offer to buy any securities in the PRC. PRC investors must have the relevant qualifications to invest in such securities and must be responsible for obtaining all relevant approvals, licenses, verifications and or registrations from PRC's relevant governmental authorities.
If your financial adviser is based in Australia, Dubai, Germany, Italy, Switzerland or the United Kingdom, then please be aware that this report is being distributed by the Morgan Stanley entity where your financial adviser is located, as follows: Australia: Morgan Stanley Wealth Management Australia Pty Ltd (ABN 19 009 145 555, AFSL No. 240813); Dubai: Morgan Stanley Private Wealth Management Limited (DIFC Branch), regulated by the Dubai Financial Services Authority (the DFSA), and is directed at Professional Clients only, as defined by the DFSA; Germany: Morgan Stanley Private Wealth Management Limited, Munich branch authorized by the Prudential Regulation Authority and regulated by the Financial Conduct Authority and the Bundesanstalt fuer Finanzdienstleistungsaufsicht; Italy: Morgan Stanley Bank International Limited, Milan Branch, authorized by the Prudential Regulation Authority and regulated by the Financial Conduct Authority and the Prudential Regulation Authority, the Banca d'Italia and the Commissione Nazionale per Le Societa' E La Borsa; Switzerland: Bank Morgan Stanley AG regulated by the Swiss Financial Market Supervisory Authority; or United Kingdom: Morgan Stanley Private Wealth Management Ltd, authorized and regulated by the Financial Conduct Authority, approves for the purposes of section 21 of the Financial Services and Markets Act 2000 this research for distribution in the United Kingdom.
Morgan Stanley Wealth Management is not acting as a municipal advisor to any municipal entity or obligated person within the meaning of Section 15B of the Securities Exchange Act (the "Municipal Advisor Rule") and the opinions or views contained herein are not intended to be, and do not constitute, advice within the meaning the Municipal Advisor Rule. This material is disseminated in the United States of America by Morgan Stanley Wealth Management. The trademarks and service marks contained in Morgan Stanley Wealth Management Research are the property of their respective owners. Third-party data providers make no warranties or representations of any kind relating to the accuracy, completeness, or timeliness of the data they provide and shall not have liability for any damages of any kind relating to such data. Morgan Stanley Wealth Management Research, or any portion thereof may not be reprinted, sold or redistributed without the written consent of Morgan Stanley Smith Barney LLC. Morgan Stanley Wealth Management Research is disseminated and available primarily electronically, and, in some cases, in printed form.
Additional information on recommended securities/instruments is available on request. © 2014 Morgan Stanley Smith Barney LLC. Member SIPC.