research dynamics, impact, and dissemination : a topic ...ey86/papers/researchdynamics.pdf ·...
TRANSCRIPT

1
Research dynamics, impact, and dissemination: A topic-level analysis
Erjia Yan1
College of Computing and Informatics, Drexel University, 3141 Chestnut Street, Philadelphia, PA 19104, USA. Phone: (215)895-1459; Fax: (215)895-2494; Email: [email protected]
Abstract
In informetrics, journals have been used as a standard unit to analyze research impact, productivity, and scholarship. The increasing practice of interdisciplinary research challenges the effectiveness of journal-based assessments. The goal of this paper is to highlight topics as a valuable unit of analysis. A set of topic-based approaches is applied to a data set on library and information science publications. Results show that topic-based approaches are capable of revealing the research dynamics, impact, and dissemination of the selected data set. The paper also identifies a non-significant relationship between topic popularity and impact, and argues for the need to use both variables in describing topic characteristics. Additionally, a flow map illustrates critical topic-level knowledge dissemination channels.
Introduction
Informetric studies primarily focus on two threads of research. One employs journals as the unit of analysis: a paper is published in a journal and a journal is assigned to certain subject areas or research domains. The other thread is based on authorship: a paper is written by an author, an author is affiliated to an institution, and an institution is located in a certain geographical area. For the first thread, journals have been used as the de facto unit to address questions related to impact assessment (e.g., Pinski & Narin, 1976; Bollen, Rodriguez, & Van de Sompel, 2006), clustering and mapping (e.g., Ding, Chowdhury, & Foo, 2000; Van Eck & Waltman, 2010), and scientific trading (e.g., Borgman & Rice, 1992; Leydesdorff & Probst, 2009).
While journals serve as a fixed research instrument to study scholarship and design policies (e.g., Holton, 1978; Van Raan, 2004), science is becoming more collaborative and interdisciplinary (Metzger & Zare, 1999; Berners-Lee et al., 2006). Likewise, the effectiveness of journal-based analyses has been challenged (e.g., Rafols & Leydesdorff, 2009; Waltman & Van Eck, 2012). The prevalence of multidisciplinary, open access journals and online social media (e.g., Mendeley and CiteULike) has further intensified this issue (Evans & Reimer, 2009; Björk et al., 2010).
To reconcile this tension, scholars are calling for a more fine-grained analysis to classify research and assess impact. A set of solutions has been proposed: it includes the use of clustering techniques (e.g., Waltman & Van Eck, 2012; Boyack & Klavans, 2014) and probabilistic topic models (e.g., Blei, Ng, & Jordan, 2003; Blei & Lafferty, 2007; Ramage et al., 2009) to identify research specialties or topics from papers. These studies focused largely on delineating topics and evaluating algorithmic performances. Consequently, we have a limited understanding of topic-level impact distribution and knowledge dissemination. A topic-level analysis enables research on science dynamics, influence assessment, and knowledge diffusion, filling the gap left by previous research.
1 Corresponding author

2
The central research question is how to use topic-based approaches to explore research dynamics, impact, and knowledge dissemination. Using a data set on library and information science (LIS) publications, the following questions will be addressed:
• What are the dynamic characteristics of topic popularity and impact in LIS? • What topics are more self-contained? Do popular topics tend to be highly cited? • What are the knowledge dissemination patterns of topics in LIS?
This study aims to expand the landscape of informetric research by exemplifying topics as a valuable unit of analysis. Although the findings are only applicable to LIS, the approaches and methods proposed in this paper are domain independent and should inform the studies of topic-level popularity and impact across different fields.
Literature review
Identifying research specialties through network methods
Bibliometric networks have been used to identify research specialties long before the recent proliferation of network analyses. Based on the level of analysis, bibliometric networks can be examined from paper-, author-, and journal-levels. The clustering of papers is made available through paper co-citation networks (Small, 1973) and paper bibliographic coupling networks (Kessler, 1963). The clustering results have been used to compare the topic similarity of papers (Kessler, 1963; Small, 1973) and to find intellectual turning points (Chen, 2004, 2006). Because co-citation relations reveal research specialties, scholars have used multidimensional scaling (e.g., White & McCain, 1998), factor analysis (e.g., White & Griffith, 1981), and pathfinder networks (e.g., White, 2003) to identify the subdivisions of research domains represented by author co-citation relations. At the journal-level, subject categories provide a fixed and consistent journal classification system, but the accuracy of this classification system has been questioned in recent years (e.g., Boyack, Klavans, Börner, 2005; Rafols & Leydesdorff, 2009). Accordingly, alternative journal classification schemes have been proposed through the use of journal-level bibliometric networks (e.g., Glänzel & Schubert, 2003; Leydesdorff & Vaughan, 2006; Zhang et al., 2010).
In addition to these co-occurrence-based approaches, there is a trend in bibliometrics to use hybrid networks to identify research specialties (e.g., Liu et al., 2010; Janssens, Glänzel, & De Moor, 2008; Boyack & Klavans, 2010; Zitt, Lelu, & Bassecoulard, 2011). It has been shown that hybrid approaches yielded more accurate clustering results than the use of only one type of network (e.g., Boyack & Klavans, 2010; Janssens, Glänzel, & De Moor, 2008). The limitation of these network-based analyses is that they rely on the interpretation of author or journal clusters. Thus, they may not provide sufficiently detailed information for a fine-grained analysis of the cognitive structure of research fields. This is largely attributed to the fact that authors or journals may represent a mixture of different specialties.
Identifying research specialties through topic models
Topic models have garnered much attention in recent years. We focus on two aspects: citation-aware topic models – models that consider cited references of text corpora, and dynamics topic models – models that are capable of distilling dynamic features from text corpora. Latent Dirichlet allocation (LDA)

3
models each document as a mixture of probabilistic topics. Through LDA, each topic is defined as a multinomial distribution over words (e.g., Blei, Ng, & Jordan, 2003; Rosen-Zvi et al., 2004; Steyvers, Smyth, & Griffiths, 2004; Blei & Lafferty, 2007; Tang et al., 2008; Tu et al., 2010). These topic models treat a document as a bag of words without considering its cited references, and can be referred to as citation-unaware models. Citation-aware models, on the other hand, used probabilistic latent semantic analysis (PLSA) or LDA as the generative process on both texts and citations (e.g., Cohn & Hoffman, 2000; Erosheva, Fienberg, & Lafferty, 2004; Dietz, Bickel, & Scheffer, 2007; Nallapati et al., 2008; He et al., 2009; Yang, Yin, & Davison, 2011; Masada & Takasu, 2012).
The dynamic aspect of topics has been investigated primarily through three approaches: post-hoc analysis (e.g., Griffiths & Steyvers, 2004; Hall, Jurafsky, & Manning, 2008), segmented approaches (e.g., Bolelli et al., 2009), and continuous-time models (Wang & McCallum, 2006). While post-hoc method used topic-document probability distributions to determine topic dynamics, segmented approaches divided document corpora into segments that have contingent time stamps. Both methods rely on the Markov assumption that the state at a single time point is independent from others. Wang and McCallum (2006) found that their non-Markov continuous-time model provided better prediction and more interpretable topical trends.
Data and methods
Data set
The field of library and information science (LIS) was chosen as a sample domain to address the proposed research questions. Publications in the Journal Citation Report subject category of Information Science and Library Science were harvested as the data set. The following filters were used: (1) year of publication: between 1955 and 2013; (2) document type: article, review article, or proceeding paper; (3) language: English; and (4) records that have no author, title, or cited reference were removed. The intermediate data set comprised 51,156 publications.
Because the LDA model needs meaningful words to conduct the inference, further data preprocessing of publications’ titles was implemented. To achieve this, (1) title words that have less than three letters (i.e., single-letter words and double-letter words) were removed from titles; (2) ten most frequently occurred words were removed from titles; and (3) those words that occurred in less than three publications were also removed; (4) finally, publications whose titles have less than three words were removed from the data set. The final resulted data set comprised 47,137 publications.
The LDA model
The Latent Dirichlet Allocation (LDA) model was proposed by Blei, Ng, and Jordan (2003) to identify topics from large publication corpora. The model assumes that words for each paper are derived from a mixture of topics and each topic follows a multinomial distribution and is defined on a collection of vocabulary. The basic procedures are (Wang & Blei, 2011, p. 450):
For each document in the data set:
• Draw topic proportions 𝜃𝑑~Dirichlet (𝛼) • For each word n
o Draw topic assignment 𝑧𝑑,𝑛~Mult(𝜃𝑑)

4
o Draw word 𝑤𝑑,𝑛~Mult(𝛽𝑧𝑑,𝑛)
𝜃𝑑 is the per-document topic proportion for the dth document; 𝑧𝑑,𝑛 is the per-word topic assignment for the nth word in the dth document; 𝑤𝑑,𝑛 is the nth word in the dth document. To better understand LDA, we refer to the graphic model with plate notations (Blei, 2012, pp. 78, 81): N in Figure 1 denotes the number of words in a document, D denotes the number of documents, and K denotes the number of topics.
Figure 1. A graphic model presentation of LDA (Blei, 2012)
The graphic model shows the generative process of LDA. It assumes that each document comprises multiple topics in different proportions (𝜃𝑑~Dirichlet (𝛼)); for instance, the current paper is mainly about topic modeling (high proportion), but also covers research dynamics (medium proportion), citation analysis (medium proportion), and knowledge diffusion (medium proportion). These topics are then derived from the per-document topic proportions (𝑧𝑑,𝑛~Mult(𝜃𝑑)) and words in the document are drawn

5
from these topics (𝑤𝑑,𝑛~Mult(𝛽𝑧𝑑,𝑛)). The generative process is an “imaginary random process by which the model assumes the documents arose (p. 78).” Words in a document are the only observed variable (highlighted in Figure 1); per-word topic assignment, per-document topic proportions, and topics are the latent variables to be identified. To achieve this, we rely on the inference process. This process uses the observed variable in the joint distribution to compute the conditional distributions (p. 80): 𝑝(𝛽,𝜃, 𝑧,𝑤) =
�∏ 𝑝(𝛽𝑖|𝜂)𝐾𝑖=1 ��∏ 𝑝(𝜃𝑑|𝛼)𝐷
𝑑=1 � �∏ 𝑝�𝑧𝑑,𝑛|𝜃𝑑�𝑁𝑛=1 𝑝�𝑤𝑑,𝑛|𝛽1:𝐾,𝑧𝑑,𝑛��. For extensive discussions on
computing the posterior distribution from the joint distribution, we refer to Steyvers and Griffiths (2007), Blei and Lafferty (2009), and Blei (2012).
One advantage of the LDA model is that the words of each document are predicated on a mixture of topics, allowing a document to be assigned into multiple topics. This multi-assignment strategy delivers more flexible estimations than the classic co-citation analysis (e.g., White & McCain, 1998) or distance-based clustering (e.g., Yan, Ding, & Jacob, 2012). Limitations of the LDA model, however, arise from its rigid assumptions (Blei, 2012): the model assumes that the order of the words in the document is not relevant, nor does the order of documents in the data set, and the model also assumes that the number of topics is known and fixed. These assumptions help improve the computational efficiency, but they also cause complications when a text corpus does not comply with these assumptions. Solutions to relax these assumptions have been provided (see Blei, 2012). Previous studies on examining the cognitive structure of LIS have employed a variety of approaches and identified different numbers of research clusters, ranging from a few to more than a dozen (e.g., Åström, 2007; Järvelin & Vakkari, 2007; Prebor, 2010; Sugimoto et al., 2011; Yan, 2014; Zhao & Strotmann, 2014). Considering these scholarly efforts in relation to the size, diversity, and duration of the current data set, the number of topics was set at 50 for this study. This allows for a detailed diachronical analysis of the cognitive landscape of LIS. The result is evaluated in two ways: first, through Jensen-Shannon divergence (JSD); second, through a qualitative comparison of clusters obtained from previous studies (see discussion section).
Topic popularity and impact
We use Figure 2 to show the major steps to calculate topic popularity and impact. We started off on downloading scholarly data from academic databases. The data set was then prepared in two ways. One involved the use of citing articles and cited references to construct a paper citation network; the other took publication titles and used these textual data as the input for topic modeling. The raw input data were then processed based on certain pre-defined rules as to what words should be processed by a certain topic model. The Stanford Topic Modeling Toolbox (Stanford TMT: http://nlp.stanford.edu/downloads/tmt/tmt-0.4/) was used to perform the topic modeling. Other recognized toolkits include MALLET (http://mallet.cs.umass.edu/topics.php) and a series of open-source software packages by the Blei group at Princeton (https://www.cs.princeton.edu/~blei/topicmodeling.html). One output files from these topic model implementations is the document-topic proportion file (or simply the 𝜃 file). By aggregating 𝜃 for each topic, we are informed by the topic popularity; by multiplying 𝜃 with paper citation network (𝜃′ × 𝑃𝑃𝑃 × 𝜃), we can obtain a topic citation network – this in turn informs us of the topic impact and topical knowledge paths. The way to calculate topic popularity and impact as well as topical knowledge paths is elaborated in the following paragraphs.

6
Figure 2. A flow chart showing the steps to obtain topic popularity and impact
Topic popularity was calculated through 𝜃𝑑, the per-document topic proportion for document d. It shows that if the topic proportion for a certain topic is high among a number of papers, this topic is considered as popular (e.g., Griffiths & Steyvers, 2004). Figure 3 shows an example of assigning three papers into five topics. As illustrated, the popularity of each topic 𝑃𝑃𝑝(𝑡(𝑗)) can be calculated through aggregating 𝜃𝑑,𝑡(𝑗)for each topic t(j).
Figure 3. An example of topic proportions for three papers
The topic popularity score 𝑃𝑃𝑝(𝑡(𝑗)) for topic j was calculated through aggregating 𝜃𝑑,𝑡(𝑗):
𝑃𝑃𝑝(𝑡(𝑗)) = �𝜃𝑑,𝑡(𝑗)𝑑
where 𝑡(𝑗) denotes 𝑗th topic and 𝜃𝑑,𝑡(𝑗) denotes the per-document proportion of document 𝑑 for topic 𝑡(𝑗).The topic popularity for topic j in year t can be expressed as:
𝑃𝑃𝑝(𝑡(𝑗), 𝑡) = � 𝜃𝑑,𝑡(𝑗)𝑑|𝑝𝑝(𝑑)=𝑡
where 𝑝𝑝(𝑑) denotes the publication year of document 𝑑.
For an effective comparison of topic popularity across different years, 𝑃𝑃𝑝(𝑡(𝑗), 𝑡) was normalized by the sum of popularity scores of all topics for year t (i.e., the total number of publications of year t):
7
𝑃_𝑃𝑃𝑝(𝑡(𝑗), 𝑡) =∑ 𝜃𝑑,𝑡(𝑗)𝑑|𝑝𝑝(𝑑)=𝑡
∑ ∑ 𝜃𝑑,𝑡(𝑗)𝑑|𝑝𝑝(𝑑)=𝑡𝑗
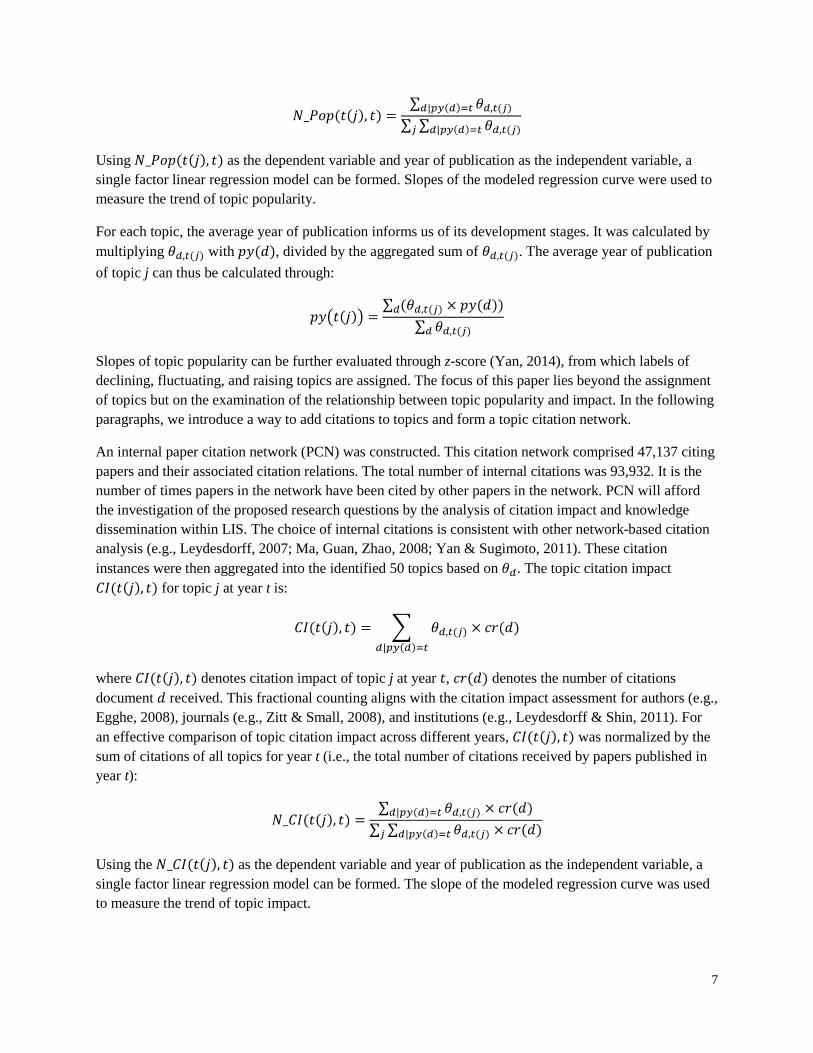
Using 𝑃_𝑃𝑃𝑝(𝑡(𝑗), 𝑡) as the dependent variable and year of publication as the independent variable, a single factor linear regression model can be formed. Slopes of the modeled regression curve were used to measure the trend of topic popularity.
For each topic, the average year of publication informs us of its development stages. It was calculated by multiplying 𝜃𝑑,𝑡(𝑗) with 𝑝𝑝(𝑑), divided by the aggregated sum of 𝜃𝑑,𝑡(𝑗). The average year of publication of topic j can thus be calculated through:
𝑝𝑝�𝑡(𝑗)� =∑ (𝜃𝑑,𝑡(𝑗) × 𝑝𝑝(𝑑))𝑑
∑ 𝜃𝑑,𝑡(𝑗)𝑑
Slopes of topic popularity can be further evaluated through z-score (Yan, 2014), from which labels of declining, fluctuating, and raising topics are assigned. The focus of this paper lies beyond the assignment of topics but on the examination of the relationship between topic popularity and impact. In the following paragraphs, we introduce a way to add citations to topics and form a topic citation network.
An internal paper citation network (PCN) was constructed. This citation network comprised 47,137 citing papers and their associated citation relations. The total number of internal citations was 93,932. It is the number of times papers in the network have been cited by other papers in the network. PCN will afford the investigation of the proposed research questions by the analysis of citation impact and knowledge dissemination within LIS. The choice of internal citations is consistent with other network-based citation analysis (e.g., Leydesdorff, 2007; Ma, Guan, Zhao, 2008; Yan & Sugimoto, 2011). These citation instances were then aggregated into the identified 50 topics based on 𝜃𝑑. The topic citation impact 𝑃𝐶(𝑡(𝑗), 𝑡) for topic j at year t is:
𝑃𝐶(𝑡(𝑗), 𝑡) = � 𝜃𝑑,𝑡(𝑗)𝑑|𝑝𝑝(𝑑)=𝑡
× 𝑐𝑐(𝑑)
where 𝑃𝐶(𝑡(𝑗), 𝑡) denotes citation impact of topic j at year 𝑡, 𝑐𝑐(𝑑) denotes the number of citations document 𝑑 received. This fractional counting aligns with the citation impact assessment for authors (e.g., Egghe, 2008), journals (e.g., Zitt & Small, 2008), and institutions (e.g., Leydesdorff & Shin, 2011). For an effective comparison of topic citation impact across different years, 𝑃𝐶(𝑡(𝑗), 𝑡) was normalized by the sum of citations of all topics for year t (i.e., the total number of citations received by papers published in year t):
𝑃_𝑃𝐶(𝑡(𝑗), 𝑡) =∑ 𝜃𝑑,𝑡(𝑗)𝑑|𝑝𝑝(𝑑)=𝑡 × 𝑐𝑐(𝑑)∑ ∑ 𝜃𝑑,𝑡(𝑗)𝑑|𝑝𝑝(𝑑)=𝑡 × 𝑐𝑐(𝑑)𝑗
Using the 𝑃_𝑃𝐶(𝑡(𝑗), 𝑡) as the dependent variable and year of publication as the independent variable, a single factor linear regression model can be formed. The slope of the modeled regression curve was used to measure the trend of topic impact.

8
Let PCN be the 47,137 by 47,137 paper citation network; 𝜃 is the per-document topic proportion for all documents that has a dimension of 47,137 by 50. The topic-to-topic citation network (TCN) can thus be obtained by matrix manipulation 𝜃′ × 𝑃𝑃𝑃 × 𝜃. The dimension of TCN is 50 by 50. Using the same example topic proportion in Figure 3 and a three-paper PCN, Figure 4 shows the way to form a topic citation network.
Figure 4. The formation of a topic citation network with five topics
As with disciplines, topics may exhibit different citation behaviors: some topics may be more permeable and “inter-topical” whereas others may be more self-contained. Topic permeability was measured through topic self-citations:
𝑃𝑃𝑐(𝑡(𝑗)) =𝑇𝑃𝑃𝑗𝑗∑ 𝑇𝑃𝑃𝑖𝑗𝑖
where 𝑃𝑃𝑐(𝑡(𝑗)) denotes permeability of topic 𝑡(𝑗), 𝑇𝑃𝑃𝑗𝑗 denotes self-citation of topic 𝑡(𝑗), and 𝑇𝑃𝑃𝑖𝑗 denotes citation from topic 𝑡(𝑖) to topic 𝑡(𝑗).
Currently, clustering and mapping techniques are largely designed for co-occurrence based networks (e.g., White & McCain, 1998; White, 2003; Rafols, Porter, & Leydesdorff, 2010). A different mapping strategy is needed to effectively represent a dense, small-scaled, directed network. In this study, shortest path was employed as the instrument to map knowledge flow among topics. Shortest paths characterize the most important knowledge paths in the topic citation network. Shortest path is typically defined in a distance-based network. The topic-to-topic citation network was thus transformed into a distance-based network through 𝑐𝑃𝑟𝑃𝑐𝑟𝑃_𝑓𝑓𝑃𝑤_𝑤𝑖𝑑𝑡ℎ𝑖→𝑗 = 1
𝑛𝑛𝑛𝑛𝑛𝑛 𝑜𝑜 𝑐𝑖𝑡𝑐𝑡𝑖𝑜𝑛𝑐 𝑜𝑛𝑜𝑛 𝑗 𝑡𝑜 𝑖. It shows that the more citations from
one topic to another, the wider the knowledge flow (Yan, in press). All 2,500 paths (i.e., 50 *50 by including paths to themselves) were identified among the 50 topics through the Dijkstra algorithm. The most frequently occurred one-hop paths (i.e., paths that only involve two nodes) were extracted (see an example in Figure 5). They were used as the backbone of topical knowledge diffusion.

9
Figure 5. An Example of finding the most frequently occurred one-hop paths
Results
Topics in library and information science
The 50 topics were labeled by the top five words that have the highest associations with each topic, as seen in Table 1. For each topic, average year of publication, peak year, popularity and slope, and citation impact and slope are also included. Because earlier years may not provide sufficient data points for the linear regression model, slopes for topic popularity were calculated based on publications between 1964 and 2013. Meanwhile, because papers published in 2013 were cited very sparsely due to a narrow citation window, slopes for topic impact were calculated based on publications between 1964 and 2012.
Table 1. Features of the 50 topics in library and information science
ID Topic Average year of
publication
Peak year
Popularity Slope (1964-2013)
Citation impact
Slope (1964-2012)
t1 factors-user-technology-use-effects 2001.69 2011 1103.09 5.19E-04 5261.53 1.06E-03 t2 papers-hot-biology-human-cell 1998.14 1993 613.08 2.54E-04 559.89 1.02E-04
t3 science-review-technology-issues-international 1992.80 1969 901.94 -8.10E-04 2144.57 -1.71E-04
t4 scientific-science-collaboration-international-bibliometric 2000.54 2013 1296.55 5.00E-04 4812.41 7.28E-04
t5 document-review-literature-supply-delivery 1996.89 1987 678.61 -2.28E-05 955.30 1.23E-04
t6 software-development-systems-source-management 2002.15 2013 922.71 4.77E-04 2239.13 7.64E-04
t7 law-model-function-data-new 1997.83 2013 797.12 1.20E-05 2670.05 -1.65E-03 t8 data-using-spatial-gis-model 2003.21 2000 1018.78 5.37E-04 1578.77 5.45E-04 t9 government-public-national-federal-policy 1992.21 1966 1002.58 -7.50E-04 903.35 -2.19E-04 t10 model-theory-models-seeking-design 2000.84 2007 916.93 3.27E-04 2500.87 6.57E-04 t11 systems-support-decision-system-design 1995.48 1987 998.52 -5.11E-05 1415.88 9.19E-05
t12 collections-collection-development-special-problems 1991.39 1965 893.09 -1.11E-03 991.43 -6.51E-04
t13 paper-conservation-effect-treatment-influence 1996.32 1971 604.48 -9.11E-05 1045.20 6.68E-05 t14 cataloging-collection-book-circulation- 1986.85 1965 967.06 -1.89E-03 1030.31 -7.27E-04

10
bibliographic
t15 reference-service-services-virtual-academic 1997.69 1965 789.31 -8.15E-05 1553.20 1.16E-04 t16 citation-impact-journal-science-bibliometric 2001.30 2013 973.37 4.27E-04 4811.42 7.34E-04 t17 books-book-literature-work-years 1984.75 1966 1002.28 -1.73E-03 721.69 -3.64E-04 t18 access-electronic-publishing-digital-scholarly 2001.01 2000 1007.33 3.84E-04 1332.99 2.19E-04
t19 theory-making-communication-systems-practice 2001.15 2013 877.85 3.67E-04 1758.16 3.00E-04
t20 health-informatics-medical-care-sciences 2001.88 2002 900.54 2.81E-04 1182.73 3.47E-04 t21 law-legal-american-history-public 1988.46 1968 892.53 -1.52E-03 725.72 -1.00E-03 t22 classification-indexing-using-text-automatic 1995.68 1971 959.63 -4.07E-04 1140.08 -1.66E-03 t23 retrieval-using-query-relevance-document 1998.09 1971 1241.10 2.31E-05 1221.65 -1.50E-03 t24 empirical-online-technology-electronic-model 2004.23 2013 1143.17 7.92E-04 4033.81 1.38E-03
t25 online-searching-catalog-subject-bibliographic 1990.33 1977 1071.41 -9.59E-04 1816.81 -1.24E-03
t26 health-cancer-communication-internet-among 2004.00 2006 976.63 5.94E-04 1318.15 5.05E-04 t27 language-medical-using-knowledge-data 2000.78 1998 1060.60 3.81E-04 776.74 1.00E-05 t28 use-university-electronic-students-resources 2000.05 1968 903.33 1.10E-04 2796.27 -6.85E-04 t29 scientists-science-researchers-new-with 1995.82 1990 862.59 9.03E-05 1757.27 1.18E-04 t30 more-century-better-people-work 1996.97 1965 684.85 6.16E-06 959.11 7.82E-05 t31 copyright-privacy-policy-issues-security 1997.55 1968 806.68 1.84E-05 895.64 2.11E-04
t32 knowledge-management-organizational-technology-innovation 2003.83 2011 1032.81 6.22E-04 2344.99 9.06E-04
t33 clinical-electronic-care-system-patient 2002.42 1999 1067.18 6.20E-04 598.62 2.61E-04 t34 impact-journals-citation-journal-scientific 2000.90 2013 971.52 3.94E-04 3540.85 6.46E-04 t35 web-sites-world-site-wide 2003.25 2004 846.21 5.36E-04 1985.14 3.80E-04
t36 learning-literacy-students-education-instruction 2001.11 2011 1017.50 2.66E-04 1953.58 5.42E-04
t37 management-systems-information-systems-issues-implementation 1998.38 1994 963.11 1.65E-04 2499.09 1.81E-04
t38 literature-citation-science-scientific-networks 1998.75 1974 1019.32 7.39E-05 3733.02 -1.83E-03
t39 quality-service-university-evaluation-interlibrary 1996.71 1966 858.04 -2.73E-04 1707.26 -7.23E-04
t40 telecommunications-mobile-market-policy-competition 1999.70 1992 1115.86 4.65E-04 1712.36 4.03E-04
t41 search-web-searching-user-users 2001.55 2007 888.70 4.42E-04 1870.88 -1.25E-04 t42 social-online-network-communities-networks 2004.77 2012 907.75 5.36E-04 1273.15 4.68E-04 t43 years-science-next-new-society 1996.60 1987 789.17 -1.17E-04 1020.69 1.58E-04 t44 business-technology-value-process-small 1999.95 1995 884.66 3.41E-04 2405.64 5.72E-04 t45 know-good-question-online-find 1997.54 1965 1044.31 1.31E-04 1955.48 2.22E-04
t46 new-education-future-librarianship-technology 1991.34 1971 932.57 -9.66E-04 1236.03 -2.40E-04
t47 data-digital-system-database-metadata 2000.83 1997 1066.95 4.53E-04 1206.70 7.64E-05
t48 librarians-academic-librarian-faculty-professional 1992.56 1968 1046.59 -7.17E-04 2112.04 -7.26E-04
t49 digital-developing-africa-south-countries 2002.60 2011 878.81 3.62E-04 1248.06 4.69E-04 t50 science-knowledge-theory-social-systems 1998.30 1969 938.24 -6.83E-06 2617.24 6.17E-05

11
Based on average year of publication, 23 topics belong to the 2000s, 25 belong to the 1990s, and 3 belong to the 1980s. The three most recent topics are t42 on online social networks, t24 on online technologies, and t26 on health communications. The three most dated topics are t17 on books and literature, t14 on cataloging, and t21 on history of legal services. Popularity of the 50 topics ranges from 604 to 1,296 with a mean of 942. The three most popular topics are t4 on scientific collaboration, t23 on information retrieval, and t24 on online technologies. Measured by slope of popularity, 34 topics have positive slopes and thus have gained popularity; in the meantime, 16 topics have negative slopes and are thus becoming somewhat less visible in LIS. Citation impact of the 50 topics ranges from 560 to 5,262 with a mean of 1,879. Top three topics that have the highest topic impact are t1 on user and technology, t4 on scientific collaboration, and t16 on citation analysis. Measured by slope of citation impact, 32 topics have positive slopes and 18 topics have negative slopes.
Topic popularity
The dynamic aspect of topic popularity is assessed through 𝑃_𝑃𝑃𝑝(𝑡(𝑗), 𝑡). In Figure 6, x-axis denotes year of publication (1964-2013) and y-axis denotes 𝑃_𝑃𝑃𝑝(𝑡(𝑗), 𝑡) for top five topics that have the steepest popularity loss (left panel) and popularity gain (right panel), measured by slope.
Figure 6. Topics that have the steepest popularity loss (left panel) and popularity gain (right panel)
In Figure 7, while topics on cataloging, collection, and librarianship have experience the most noticeable popularity decrease, topics on online technologies, data and knowledge management, and health communications have the most evident popularity gain.
Topic impact

12
The dynamic aspect of topic impact is measured through 𝑃_𝑃𝐶(𝑡(𝑗), 𝑡). In Figure 7, x-axis denotes year of publication (1964-2012) and y-axis denotes 𝑃_𝑃𝐶(𝑡(𝑗), 𝑡) for top five topics that have the steepest impact loss (left panel) and impact gain (right panel), measured by slope.
Figure 7. Topics that have the steepest impact loss (left panel) and impact gain (right panel)
Compared with dynamics of topic popularity, the dynamics of topic impact is subject to higher degrees of variation. This is attributed to the fact that preeminent papers can receive up to several hundred citations, causing yearly topic impact fluctuations. Topics on literature, classification, and document retrieval were highly cited in the 1960s and 1970s; however, the concentration was shifted to online technologies, knowledge management, and journal citation impact analysis thereafter.
Discussion
Statistical and qualitative evaluations of the results
Jensen-Shannon divergence (JSD) was employed to evaluate the quality of the 50 topics. JSD is calculated based on word topic assignment. The lower bound of JSD is 0, the situation that two word topic assignments are identical; the upper bound is 0.7 (In(2)), the situation that two topics are completely different. Figure 8 shows the heatmap of the topic dissimilarity matrix measured by JSD.

13
Figure 8. A heatmap presentation of Jensen-Shannon divergence for the 50 topics
Figure 8 illustrates that most topics have high JSD scores with respect to other topics. This is a good sign that the topic model has successfully identified distinctive topics. We also see that some topics are topically related to others. This is expected because different topics may share a (small) collection of common lexicons (Blei & Lafferty, 2007); this is especially true for topics from a single field such as LIS. While the use of JSD is able to establish some statistical certainty, the real-world implications should also be examined. Thus, we compare the results of this study with previous analyses of the cognitive structure of LIS and use this as an opportunity to evaluate its empirical implications.
One category of analysis has primarily focused on the identification of the epistemological divisions of LIS. It has been argued that information science and library science have philosophical and theoretical differences (e.g., Brooke, 1980; Hjørland, 2000; Ma, 2012). Quantitative studies have supported such argument; for instance, through co-citation and bibliographic coupling analysis, studies have identified subfields in LIS: library science, information science and technology (information retrieval), and informetrics (Åström, 2002; Milojević et al., 2011; Waltman, Yan, Van Eck, 2011). Results obtained from this study align with the previous analyses in that the 50 topics can be grouped into these three subfields.
In addition top-level divisions, studies have also identified research clusters in LIS. The pioneering author co-citation analysis by White and Griffith (1981) used factor analysis to identify five clusters between 1972 and 1975, including scientific communication, bibliometrics, generalists, information retrieval, and precursors of LIS. The author co-citation analysis was later highlighted by White and McCain (1998) who

14
identified 12 research clusters between 1972 and 1995, including experimental retrieval, citation analysis, online retrieval, bibliometrics, general library systems, science communication, user theory, OPACs, imported ideas, indexing theory, citation theory, and communication theory. In a follow-up article by White (2003), a novel pathfinder network was used to visualize author co-citation relations and the same clusters were revealed (with the exception that citation theory was no longer a standalone cluster). A recent author co-citation analysis by Zhao and Strotmann (2014) has suggested a different set of clusters between 2006 and 2010. These include information behavior, bibliometric distributions, mapping of science, relevance, IR systems, webometrics, bibliometrics and science & innovation systems, use of e-resources, IS theory & foundation, knowledge management, and text categorization. Results obtained from this study are consistent with these previous efforts. For instance, it has delineated topics broadly related to informetrics (t4, t16, and t34), information retrieval (t23, t25, and t41), communication theory (t19), knowledge management (t32 and t37), indexing theory (t22), user theory (t1), information behavior (t10), and use of e-resources (t28). In the meantime, we also identified topics that were not included by previous studies, such as topics on health communication (26), health informatics (t26), electronic clinical record (t33), social networks (t42), software development (t6), and information systems (t11). This study has also identified precursory topics of some of these topics (see section on knowledge flow and inheritance).
By matching the results of this study with previous diachronical analysis, some consensus can be made. For raising trends, this study has found that topics on users, bibliometrics, online technologies, communications, health informatics, and knowledge management are becoming more popular in LIS. It confirms Larivière, Sugimoto, and Cronin’s (2012) study that words such as citation, impact, bibliometrics, use, management, health, clinical, and network have become popular title words in LIS between 1900 and 2010. A study by Milojević and colleagues (2011) has also found that title terms such as citation, impact factor, and web have a rising usage between 1989 and 2008. For declining trends, this study has shown that topics on collections, books and literature, indexing, and librarianship are becoming less popular. The result is consistent with Larivière, Sugimoto, and Cronin’s (2012) study.
The set of approaches used in this study has three advantages. First, the topic modeling technique works directly with words and does not require domain knowledge to interpret the clusters of papers, authors, or journals. From this aspect, this technique relates to co-word analysis (e.g., Janssens, Glänzel, & De Moor, 2008; Milojević et al., 2011; Yan, Ding, & Jacob, 2012). Different from co-word analysis, though, is that the topic modeling technique assigns words to clusters based on certain probabilistic distributions. Co-word analysis, on the other hand, typically partitions words to mutually exclusive clusters. Second, the number of topics identified in this study is considerably larger than those obtained from co-occurrence-based network analyses. The sizable number of topics grants a more granular analysis of the cognitive structure of LIS. In addition to probing into the top-level divisions or major clusters of LIS, this study is able to depict a more detailed research landscape. Such level of analysis is usually not attainable through co-occurrence-based network analysis due to the complexity of some densely connected co-occurrence clusters. Finally, the proposed dynamic analysis method has streamlined the diachronical analysis of topic popularity and impact. The rendering of yearly topic popularity is an improvement over time-sliced methods. Furthermore, the integration of citation information with topic analysis has created an opportunity to examine the inter-topic knowledge diffusion patterns in LIS. These advances have complemented co-occurrence-based network studies.

15
Journal-level topical diversity
To quantitatively measure the journal-level topical diversity, we use a heatmap (Figure 9) to show the distribution of topics on the most productive 30 journals in LIS. Cell values in the heatmap are calculated through aggregating 𝜃𝑑 for each journal under each topic and then normalizing by the total number of topic proportions for each journal. The journal-level topical diversity of journal 𝑗(𝑟) for topic j can thus
be expressed as 𝐽𝑇𝐽𝑗(𝑐) =∑ 𝜃𝑑,𝑡(𝑗)𝑑|𝑑∈𝑗(𝑠)
∑ ∑ 𝜃𝑑,𝑡(𝑗)𝑑|𝑑∈𝑗(𝑠)𝑗. Cell values range from 0 to 1 where 0 being no specialization
in the topic and 1 being exclusively specialized in the topic.
Figure 9. Heatmap presentation of journal topical specializations
While a handful of journals (e.g., INT J GEOGR INF SCI, J HEALTH COMMUN, J AM MED INFORM ASSN, and TELECOMMUN POLICY) have more specialized foci, the majority of journals have wider research specialties. The result suggests that these journals do not necessarily publish papers solely on one research specialty but contribute to an array of specialties. These journals may be able to represent LIS as a field of study but they may not have the granularity to signify the different research specialties within LIS.
Shannon entropy (Figure 10) is adopted to illustrate the dynamic changes of journal topical diversity. It measures, for each journal, the proportions of its papers under each topic:
𝐻 = −∑ (𝐽𝑇𝐽𝑗(𝑐) ln 𝐽𝑇𝐽𝑗(𝑐))50𝑗=1 = −∑
∑ 𝜃𝑑,𝑡(𝑗)𝑑|𝑑∈𝑗(𝑠)
∑ ∑ 𝜃𝑑,𝑡(𝑗)𝑑|𝑑∈𝑗(𝑠)𝑗ln
∑ 𝜃𝑑,𝑡(𝑗)𝑑|𝑑∈𝑗(𝑠)
∑ ∑ 𝜃𝑑,𝑡(𝑗)𝑑|𝑑∈𝑗(𝑠)𝑗
50𝑗=1 for journal s. Similar to JSD,
Shannon entropy is also a measure of dissimilarity in that the higher the value, the more diverse the content; different from JSD, though, it measures the congruence of a single object based on its variables whereas JSD is typically applied to measure the dissimilarity of two objects.

16
Figure 10. Shannon entropy for the most productive 30 journals in LIS
Diachronically, most journals in Figure 10 have either a steady or increased level of diversity, with the exception of two health informatics journals (J AM MED INFORM ASSN and J MED LIBR ASSOC) and two professional journals (LIBR J and ONLINE). A few journals have a steeper diversity gain, such as GOV INFORM Q, J DOC, and LIBR INFORM SCI RES. It indicates that these journals are embracing a broader research scope and publishing papers that cover more extensive topics. As journals are becoming more inter-topical and even interdisciplinary, simply relying on journal-level analyses to examine the substrate of various research fields may be less effective. Based on this evidence, therefore, we argue that topic-level studies are needed to propel the analysis to a newer level of granularity.
Topic popularity vs. impact
Similar to authors and journals, topics also possess multiple attributes. In addition to social and cognitive attributes (e.g., Yan, Ding, Milojević, & Sugimoto, 2012), this study focuses on two other attributes: popularity and impact. It first examines topic dependence though self-citations (Figure 11), then the co-evolving feature of topic popularity and impact between 1964 and 2012 (Figure 12), and finally the correlation relationships among topic popularity, impact, and year of publication (Figure 13).
17
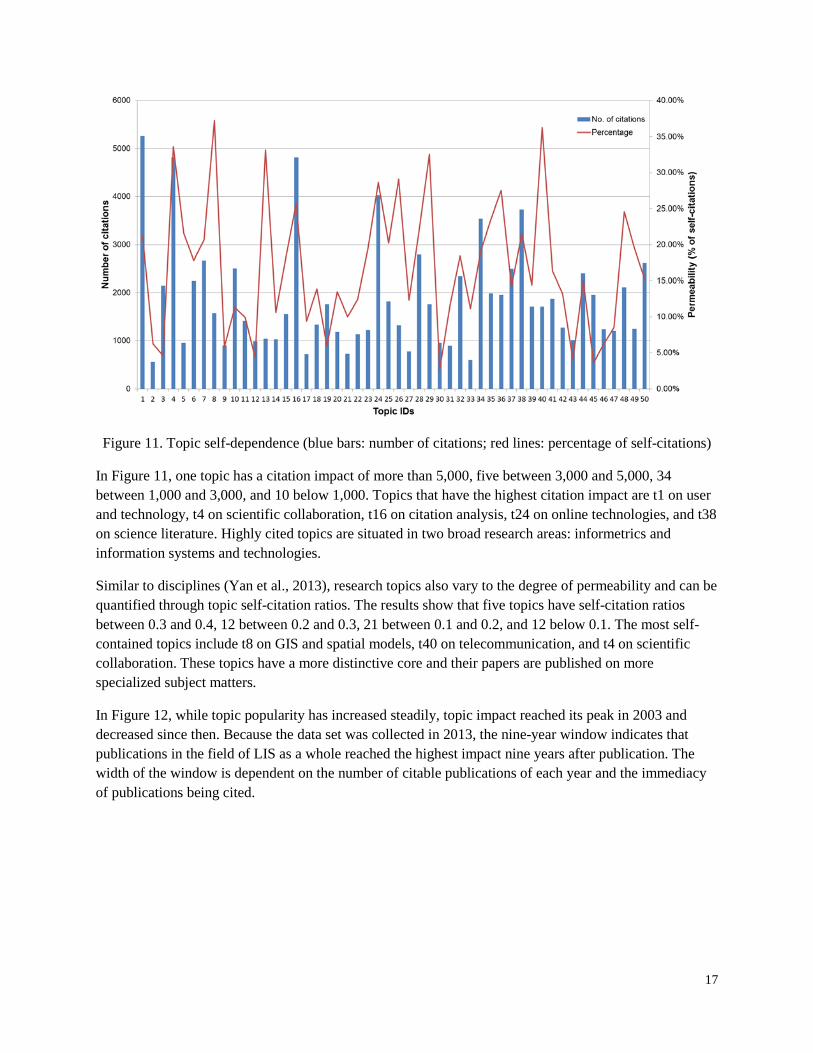
Figure 11. Topic self-dependence (blue bars: number of citations; red lines: percentage of self-citations)
In Figure 11, one topic has a citation impact of more than 5,000, five between 3,000 and 5,000, 34 between 1,000 and 3,000, and 10 below 1,000. Topics that have the highest citation impact are t1 on user and technology, t4 on scientific collaboration, t16 on citation analysis, t24 on online technologies, and t38 on science literature. Highly cited topics are situated in two broad research areas: informetrics and information systems and technologies.
Similar to disciplines (Yan et al., 2013), research topics also vary to the degree of permeability and can be quantified through topic self-citation ratios. The results show that five topics have self-citation ratios between 0.3 and 0.4, 12 between 0.2 and 0.3, 21 between 0.1 and 0.2, and 12 below 0.1. The most self-contained topics include t8 on GIS and spatial models, t40 on telecommunication, and t4 on scientific collaboration. These topics have a more distinctive core and their papers are published on more specialized subject matters.
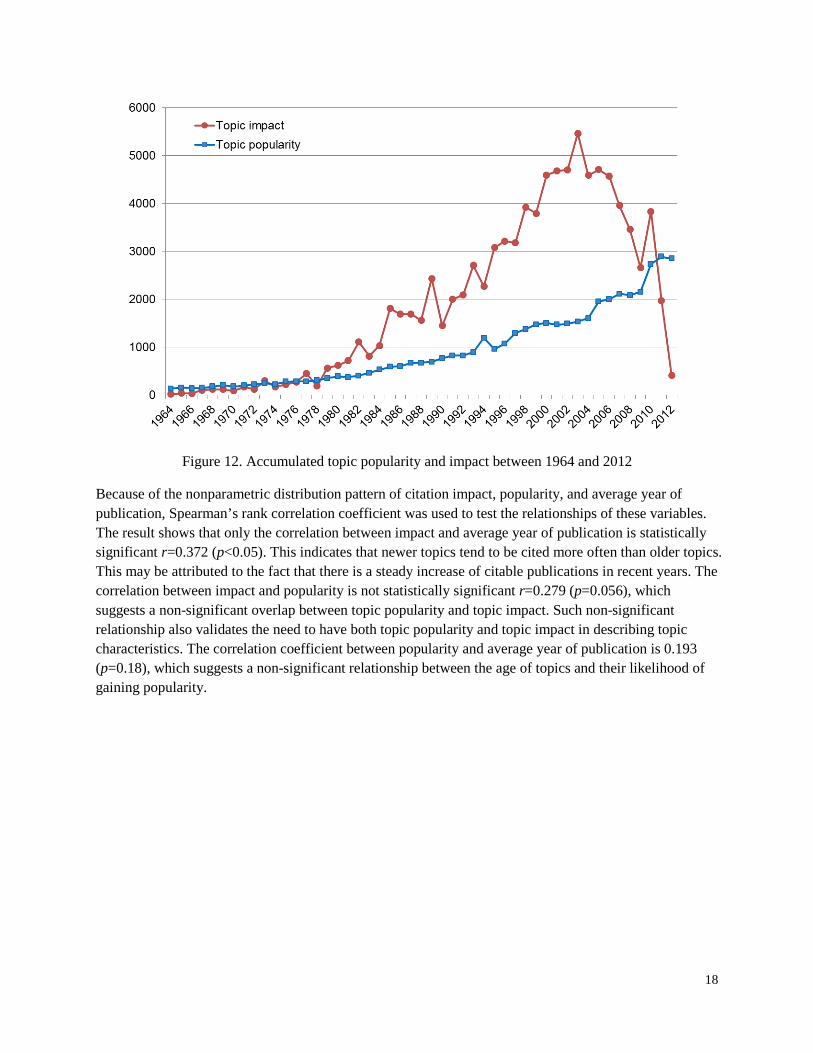
In Figure 12, while topic popularity has increased steadily, topic impact reached its peak in 2003 and decreased since then. Because the data set was collected in 2013, the nine-year window indicates that publications in the field of LIS as a whole reached the highest impact nine years after publication. The width of the window is dependent on the number of citable publications of each year and the immediacy of publications being cited.
18
Figure 12. Accumulated topic popularity and impact between 1964 and 2012
Because of the nonparametric distribution pattern of citation impact, popularity, and average year of publication, Spearman’s rank correlation coefficient was used to test the relationships of these variables. The result shows that only the correlation between impact and average year of publication is statistically significant r=0.372 (p<0.05). This indicates that newer topics tend to be cited more often than older topics. This may be attributed to the fact that there is a steady increase of citable publications in recent years. The correlation between impact and popularity is not statistically significant r=0.279 (p=0.056), which suggests a non-significant overlap between topic popularity and topic impact. Such non-significant relationship also validates the need to have both topic popularity and topic impact in describing topic characteristics. The correlation coefficient between popularity and average year of publication is 0.193 (p=0.18), which suggests a non-significant relationship between the age of topics and their likelihood of gaining popularity.

19
Figure 13. Scatterplots and histograms of topic impact, popularity, and average year of publication
Topical knowledge flow and inheritance
In this subsection, we examine topical knowledge dissemination through the concept of shortest paths. In Figure 14, the most frequently occurred paths are illustrated. Each node represents one topic and is color coded to reflect its average year of publication. The size of a node denotes the number of times a topic occurred on the shortest paths. In total, 511 one-hop knowledge paths are identified. Top 50 paths based on occurrence frequency constitute the primary knowledge path in Figure 14. The frequency ranges from 203 to 29. Eighteen topics are not included by these 50 paths. They are connected through secondary knowledge paths.

20
Figure 14. Topical knowledge flow. Color coding: average year of publication; size of node: number of times a topic is located on the shortest paths; links: most frequently occurred one-hop paths
Several knowledge hubs can be identified: t1 on user and technology, t4 on scientific collaboration, t16 on citation analysis, t24 on online technologies, and t38 on science literature play an important role in transferring and dissemination topical knowledge. Three major topical knowledge paths are:
• From electronic resources to digital data and information systems, then to information retrieval systems, then to telecommunication systems, online social networks, health communication, and knowledge management;
• From journal and paper citation impact analysis to collaboration and bibliometrics, then to web science; and
• From collection, literature and reference to health informatics and GIS.
Older topics are largely connected by secondary knowledge paths. This suggests that these topics are no long active in importing or exporting topical knowledge. They are gradually fading away from the

21
research frontier of LIS. In the meantime, newer topics are tightly connected with the rest of the knowledge flow network. Thus, their topic-level knowledge is expected be incorporated into the knowledge base of LIS in the future.
Conclusion
This study has conducted a topic-level analysis using a data set on library and information science publications. It has highlighted the use of topics in organizing scientific literature and examining research popularity, impact, and dynamics. It has employed a topic modeling technique and conducted a series of data analytics, including dynamic analysis, regression, shortest path, correlation, and similarity analysis. It has found that topics on online technologies, informetrics, information retrieval systems, health communication and informatics, and online social networks have gained popularity over the past decades. Topics related to literature, books, collection, and cataloging, on the other hand, have declined in popularity. These findings, therefore, have addressed the first research question on the dynamic characteristics of topics in LIS. The study has also revealed that LIS journals are becoming more inter-topical. This finding suggests that topic-level studies are necessary to bring more granular perspectives to the existing co-occurrence-based analyses.
By adding citation information, topics with the highest impact have been identified, including those on technology use, collaboration and bibliometrics, citation analysis, and online technologies. This study has also found several topics that are more self-contained than the others, including those on GIS and spatial models, telecommunication, scientific collaboration, and health communication. Through a correlation analysis, this paper has verified a non-significant relationship between topic popularity and topic impact. The result has helped answer the second research question and also validate the need to have both attributes to describe topic characteristics.
Furthermore, a topical knowledge flow network has revealed topic-level knowledge dissemination channels. The study has identified a few major knowledge paths in LIS, including those from electronic resources to online social networks and knowledge management, from journal and paper citation impact to web science, and from collection, literature and reference to health informatics and GIS. It has also found that while older topics are becoming less active in exporting and importing knowledge, newer topics are becoming integral components in the LIS knowledge flow network. These findings have addressed the last research question on the knowledge dissemination patterns of topics in LIS.
This paper has explored topic dynamics and discovered patterns of topic impact and popularity. In order to determine factors that contribute to such dynamic changes, one needs to relate textual data with other data sources (e.g., authorship data and funding information). Future studies will benefit from identifying the mechanism (e.g., shifts in research communities and science policies) that leads to changes in topic impact and popularity.
Acknowledgement
The author would like to thank David McAllister and Yongjun Zhu for their comments to an earlier version of this paper.
References

22
Åström, F. (2002). Visualizing Library and Information Science concept spaces through keyword and citation based maps and clusters. In The fourth international conference on Conceptions of Library and Information Science (CoLIS4) (pp. 185-197). Libraries Unlimited.
Åström, F. (2007). Changes in the LIS research front: Time‐sliced cocitation analyses of LIS journal articles, 1990–2004. Journal of the American Society for Information Science and Technology, 58(7), 947-957.
Berners-Lee, T., Hall, W., Hendler, J., Shadbolt, N., & Weitzner, D. (2006). Creating a science of the Web. Science, 313(5788), 769-771.
Björk, B. C., Welling, P., Laakso, M., Majlender, P., Hedlund, T., & Guðnason, G. (2010). Open access to the scientific journal literature: situation 2009. PLOS ONE, 5(6), e11273.
Blei, D. M. (2012). Probabilistic topic models. Communications of the ACM, 55(4), 77-84.
Blei, D. M., & Lafferty, J. (2009). Topic models. Retrieved March 5, 2014 from http://www.cs.princeton.edu/~blei/papers/BleiLafferty2009.pdf
Blei, D. M., Ng, A. Y., & Jordan, M. I. (2003). Latent Dirichlet Allocation. Journal of Machine Learning Research, 3(4-5), 993-1033.
Bolelli, L., Ertekin, S., Zhou, D., & Giles, C. L. (2009). Finding topic trends in digital libraries. In Proceedings of the 9th ACM/IEEE-CS joint conference on Digital libraries (pp. 69-72). New York: ACM Press.
Bollen, J., Rodriguez, M. A., & Van de Sompel, H. (2006). Journal status. Scientometrics, 69(3), 669-687.
Borgman, C. L., & Rice, R. E. (1992). The convergence of information science and communication: A bibliometric analysis. Journal of the American Society for Information Science, 43(6), 397-411.
Boyack, K. W., & Klavans, R. (2010). Co-citation analysis, bibliographic coupling, and direct citation: Which citation approach represents the research front most accurately? Journal of the American Society for Information Science and Technology, 61(12), 2389-2404.
Boyack, K. W., & Klavans, R. (2014). Creation of a highly detailed, dynamic, global model and map of science. Journal of the Association for Information Science and Technology, 65(4), 670-685.
Boyack, K. W., Klavans, R., & Börner, K. (2005). Mapping the backbone of science. Scientometrics, 64(3), 351-374.
Brookes, B. C. (1980). The foundations of information science Part I. Philosophical aspects. Journal of Information Science, 2(3-4), 125-133.
Chen, C. M. (2004). Searching for intellectual turning points: Progressive knowledge domain visualization. Proceedings of the National Academy of Sciences of the United States of America, 101(Suppl. 1), 5303-5310.

23
Chen, C. M. (2006). CiteSpace II: Detecting and visualizing emerging trends and transient patterns in scientific literature. Journal of the American Society for Information Science and Technology, 57(3), 359-377.
Cohn, D. & Hofmann, T. (2000). The missing link: A probabilistic model of document content and hypertext connectivity. In Advances In Neural Information Processing Systems 13: Proceedings of the 2000 Conference (Vol. 13, pp. 430-437). Cambridge, MA: The MIT Press.
Dietz, L., Bickel, S., & Scheffer, T. (2007). Unsupervised prediction of citation influences. In Proceedings of the 24th International Conference on Machine Learning (pp. 233-240). New York: ACM Press.
Ding, Y., Chowdhury, G., & Foo, S. (2000). Journal as markers of intellectual space: Journal co-citation analysis of information retrieval area, 1987-1997. Scientometrics, 47(1), 55-73.
Egghe, L. (2008). Mathematical theory of the h‐and g‐index in case of fractional counting of authorship. Journal of the American Society for Information Science and Technology, 59(10), 1608-1616.
Erosheva, E., Fienberg, S., & Lafferty, J. (2004). Mixed-membership models of scientific publications. Proceedings of the National Academy of Sciences of the United States of America, 101(Suppl 1), 5220-5227.
Evans, J. A., & Reimer, J. (2009). Open access and global participation in science. Science, 323(5917), 1025-1025.
Glänzel, W., & Schubert, A. (2003). A new classification scheme of science fields and subfields designed for scientometric evaluation purposes. Scientometrics, 56(3), 357-367.
Griffiths, T. L., & Steyvers, M. (2004). Finding scientific topics. Proceedings of the National Academy of Sciences of the United States of America, 101(Suppl 1), 5228-5235.
Hall, D., Jurafsky, D., & Manning, C. D. (2008). Studying the history of ideas using topic models. In Proceedings of the Conference on Empirical Methods in Natural Language Processing (pp. 363-371). Association for Computational Linguistics.
He, Q., Chen, B., Pei, J., Qiu, B., Mitra, P., & Giles, L. (2009). Detecting topic evolution in scientific literature: how can citations help? In Proceeding of the 18th ACM Conference on Information and Knowledge Management (pp. 957-966). New York: ACM Press.
Hjørland, B. (2000). Library and information science: practice, theory, and philosophical basis. Information processing & management, 36(3), 501-531.
Holton, G. (1978). Can Science Be measured? In Scientific Imaginations: Case Studies (pp. 199-228). Cambridge, UK: Cambridge University Press.
Janssens, F., Glänzel, W., & De Moor, B. (2008). A hybrid mapping of information science. Scientometrics, 75(3), 607-631.

24
Järvelin, K., & Vakkari, P. (1993). The evolution of library and information science 1965–1985: A content analysis of journal articles. Information Processing & Management, 29(1), 129-144.
Kessler, M. M. (1963). Bibliographic coupling between scientific papers. American Documentation, 14(1), 10-25.
Larivière, V., Sugimoto, C. R., & Cronin, B. (2012). A bibliometric chronicling of Library and Information Science’s first hundred years. Journal of the American Society for Information Science and Technology, 63(5), 997-1016.
Leydesdorff, L. (2007). Mapping interdisciplinarity at the interfaces between the Science Citation Index and the Social Science Citation Index. Scientometrics, 71(3), 391-405.
Leydesdorff, L., & Probst, C. (2009). The delineation of an interdisciplinary specialty in terms of a journal set: The case of communication studies. Journal of the American Society for Information Science and Technology, 60(8), 1709-1718.
Leydesdorff, L., & Shin, J. C. (2011). How to evaluate universities in terms of their relative citation impacts: Fractional counting of citations and the normalization of differences among disciplines. Journal of the American Society for Information Science and Technology, 62(6), 1146-1155.
Leydesdorff, L., & Vaughan, L. (2006). Co-occurrence matrices and their applications in information science: Extending ACA to the web environment. Journal of the American Society for Information Science and Technology, 57(12), 1616-1628.
Liu, X., Yu, S., Janssens, F., Glanzel, W., Moreau, Y., & De Moor, B. (2010). Weighted hybrid clustering by combining text mining and bibliometrics on a large-scale journal database. Journal of the American Society for Information Science and Technology, 61(6), 1105-1119.
Ma, L. (2012). Meanings of information: The assumptions and research consequences of three foundational LIS theories. Journal of the American Society for Information Science and Technology, 63(4), 716-723.
Ma, N., Guan, J., & Zhao, Y. (2008). Bringing PageRank to the citation analysis. Information Processing and Management, 44(2), 800-810.
Masada, T., & Takasu, A. (2012). Extraction of topic evolutions from references in scientific articles and its GPU acceleration. In Proceedings of the 21st ACM international conference on Information and knowledge management (pp. 1522-1526). New York: ACM Press.
Metzger, N., & Zare, R. N. (1999). Interdisciplinary research: From belief to reality. Science, 283(5402), 642-643.
Milojević, S., Sugimoto, C. R., Yan, E., & Ding, Y. (2011). The cognitive structure of library and information science: Analysis of article title words. Journal of the American Society for Information Science and Technology, 62(10), 1933-1953.

25
Nallapati, R. M., Ahmed, A., Xing, E. P., & Cohen, W. W. (2008). Joint latent topic models for text and citations. In Proceeding of the 14th ACM SIGKDD International Conference on Knowledge Discovery and Data Mining (pp. 542-550). New York: ACM Press.
Pinski, G., & Narin, F. (1976). Citation influence for journal aggregates of scientific publications: Theory, with application to the literature of physics. Information Processing & Management, 12(5), 297-312.
Prebor, G. (2010). Analysis of the interdisciplinary nature of library and information science. Journal of Librarianship and Information Science, 42(4), 256-267.
Rafols, I., & Leydesdorff, L. (2009). Content-based and algorithmic classifications of journals: perspectives on the dynamics of scientific communication and indexer effects. Journal of the American Society for Information Science and Technology, 60(9), 1823-1835.
Rafols, I., Porter, A. L., & Leydesdorff, L. (2010). Science overlay maps: A new tool for research policy and library management. Journal of the American Society for Information Science and Technology, 61(9), 1871-1887.
Ramage, D., Hall, D., Nallapati, R., & Manning, C. D. (2009). Labeled LDA: A supervised topic model for credit attribution in multi-labeled corpora. In Proceedings of the 2009 Conference on Empirical Methods in Natural Language Processing (pp. 248-256). Association for Computational Linguistics.
Rosen-Zvi, M., Griffiths, T., Steyvers, M., & Smyth, P. (2004). The author-topic model for authors and documents. In Proceedings of the 20th Conference on Uncertainty in Artificial Intelligence (pp. 487-494). AUAI Press.
Small, H. (1973). Co-citation in the scientific literature: A new measure of the relationship between two documents. Journal of the American Society for Information Science, 24(4), 265-269.
Steyvers, M., & Griffiths, T. (2007). Probabilistic topic models. Handbook of latent semantic analysis, 427(7), 424-440.
Steyvers, M., Smyth, P., Rosen-Zvi, M., & Griffiths, T. (2004). Probabilistic author-topic models for information discovery. In Proceedings of the tenth ACM SIGKDD International Conference on Knowledge Discovery and Data Mining (pp. 306-315). New York: ACM Press.
Sugimoto, C. R., Li, D., Russell, T. G., Finlay, S. C., & Ding, Y. (2011). The shifting sands of disciplinary development: Analyzing North American Library and Information Science dissertations using latent Dirichlet allocation. Journal of the American Society for Information Science and Technology, 62(1), 185-204.
Tang, J., Zhang, J., Yao, L., Li, J., Zhang, L., & Su, Z. (2008). ArnetMiner: extraction and mining of academic social networks. In Proceeding of the 14th ACM SIGKDD International Conference on Knowledge Discovery and Data Mining (pp. 990-998). New York: ACM Press.
Tu, Y., Johri, N., Roth, D., & Hockenmaier, J. (2010). Citation author topic model in expert search. In Proceedings of the 23rd International Conference on Computational Linguistics (pp. 1265-1273). Stroudsburg, PA: Association for Computational Linguistics.

26
Van Eck, N.J., & Waltman, L. (2010). Software survey: VOSviewer, a computer program for bibliometric mapping. Scientometrics, 84(2), 523-538.
Van Raan, A. F. J. (2004). Measuring science: Capita Selecta of current issues. In H.F. Moed, W. Glänzel, & U. Schmoch (Eds.), Handbook of Quantitative Science and Technology Research (pp.19-50). Dordrecht, Germany: Kluwer Academic Publishers.
Waltman, L., & Van Eck, N. J. (2012). A new methodology for constructing a publication-level classification system of science. Journal of the American Society for Information Science and Technology, 63(12), 2378-2392.
Waltman, L., Yan, E., & Van Eck., N. J. (2011). A recursive field-normalized bibliometric performance indicator: An application to the field of library and information science. Scientometrics, 89(1), 301-314.
Wang, C., & Blei, D. M. (2011). Collaborative topic modeling for recommending scientific articles. In Proceedings of the 17th ACM SIGKDD International Conference on Knowledge Discovery and Data Mining (pp. 448-456). New York: ACM Press.
Wang, X., & McCallum, A. (2006). Topics over time: a non-Markov continuous-time model of topical trends. In Proceedings of the 12th ACM SIGKDD International Conference on Knowledge Discovery and Data Mining (pp. 424-433). New York: ACM Press.
White, H. D. (2003). Pathfinder networks and author cocitation analysis: A remapping of paradigmatic information scientists. Journal of the American Society for Information Science, 54(5), 423-434.
White, H. D., & Griffith, B. C. (1981). Author cocitation: A literature measure of intellectual structure. Journal of the American Society for Information Science, 32(3), 163-171.
White, H. D., & McCain, K. W. (1998). Visualizing a discipline: An author co-citation analysis of information science, 1972-1995. Journal of the American Society for Information Science, 49(4), 327-355.
Yan, E. (in press). Finding knowledge paths among scientific disciplines. Journal of the American Society for Information Science & Technology.
Yan, E. (2014). Research dynamics: Measuring the continuity and popularity of research topics. Journal of Informetrics, 8(1), 98-110.
Yan, E., & Sugimoto, C. R. (2011). Institutional interactions: Exploring social, cognitive, and geographic relationships between institutions as demonstrated through citation networks. Journal of the American Society for Information Science and Technology, 62(8), 1498-1514.
Yan, E., Ding, Y., & Jacob, E. K. (2012). Overlaying communities and topics: An analysis on publication networks. Scientometrics, 90(2), 499-513.
Yan, E., Ding, Y., Milojević, S., & Sugimoto, C. R. (2012). Topics in dynamic research communities: An exploratory study for the field of information retrieval. Journal of Informetrics, 6(1), 140-153.
Yan, E., Ding, Y., Cronin, B., & Leydesdorff, L. (2013). A bird's-eye view of scientific trading: Dependency relations among fields of science. Journal of Informetrics, 7(2), 249-264.

27
Yang, Z., Yin, D., & Davison, B. D. (2011). Award prediction with temporal citation network analysis. In Proceedings of the 34th International ACM SIGIR Conference on Research And Development in Information Retrieval (pp. 1203-1204). New York: ACM Press.
Zhang, L., Liu, X., Janssens, F., Liang, L., & Glänzel, W. (2010). Subject clustering analysis based on ISI category classification. Journal of Informetrics, 4(2), 185-193.
Zhao, D., & Strotmann, A. (2014). The knowledge base and research front of information science 2006–2010: An author cocitation and bibliographic coupling analysis. Journal of the Association for Information Science and Technology, 65(5), 995-1006.
Zitt, M., & Small, H. (2008). Modifying the journal impact factor by fractional citation weighting: The audience factor. Journal of the American Society for Information Science and Technology, 59(11), 1856-1860.
Zitt, M., Lelu, A., & Bassecoulard, E. (2011). Hybrid citation‐word representations in science mapping: Portolan charts of research fields? Journal of the American Society for Information Science and Technology, 62(1), 19-39.