research conference 2019 - consumer financial protection
TRANSCRIPT

Shocked by Bank Funding Shocks:Evidence from 500 Million Consumer Credit Cards
Sudheer Chava1 Rohan Ganduri2
Nikhil Paradkar1 Linghang Zeng3
1Georgia Institute of Technology
2Emory University
3Babson College
CFPB Research ConferenceDecember 2019
1 / 22

Motivation
• What explains the sharp decline in consumption after the financial crisis?
• Also, puzzling slow recovery post-crisis (esp. non-durables, services)?
• Household balance sheet effects (Mian, Rao, and Sufi, 2013):
• Housing-wealth effect.
• Debt overhang effect.
• Borrowing constraints due to reduced collateral values.
• Financial intermediaries’ balance sheet effects: Did bank health affect consumers’balance sheets?
• Bank health: Fragile funding structures (reliance on uninsured short-term liabilities).
• What is the transmission mechanism? Who gets affected? Are the effects short-termor long-term?
• Effects on Durables vs. Non-durables/services/staples. Consumption financed bySecured (e.g., mortgage, auto) vs. Unsecured debt (e.g., credit cards).
• This paper: Did bank health affect consumption through credit cards?
2 / 22

Motivation
• Credit card spending accounts for 25% of personal consumption expenditure(PCE) (∼ $10 trillion in 2010, typically ∼ 70% of GDP).
• Most households consume services and non-durable goods such as food, apparel,gasoline, transportation, and healthcare through credit cards.
• Important source of marginal borrowing:
• Can you cover an emergency $400 expense?
• Answer is NO for 40% of U.S. households.
3 / 22
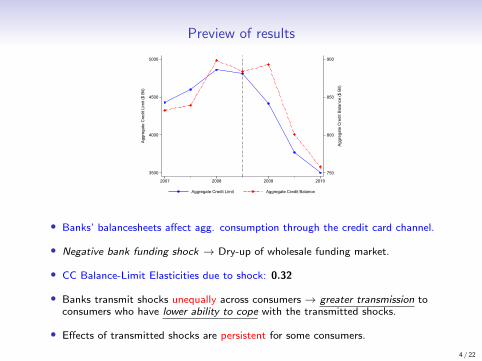
Preview of results
750
800
850
900
Aggr
egat
e C
redi
t Bal
ance
($ B
il)
3500
4000
4500
5000
Aggr
egat
e C
redi
t Lim
it ($
Bil)
2007 2008 2009 2010
Aggregate Credit Limit Aggregate Credit Balance
• Banks’ balancesheets affect agg. consumption through the credit card channel.
• Negative bank funding shock → Dry-up of wholesale funding market.
• CC Balance-Limit Elasticities due to shock: 0.32
• Banks transmit shocks unequally across consumers → greater transmission toconsumers who have lower ability to cope with the transmitted shocks.
• Effects of transmitted shocks are persistent for some consumers.
4 / 22

Identification challenges• Main challenge: Isolate the changes in credit supply from the changes in credit
demand.
• Implementation: Within-individual comparison (ala Khwaja & Mian, 2008)
• Same individual exposed to high-shock and low-shock credit cards.
• The within individual comparison controls for changes in individual-specific demandfactors (e.g., income changes).
• Leave-out mean credit limit to mitigate individual-bank specific demand.
• Unique data advantages:
• Observe CC limits separately from CC balances.
• Observe data on ALL credit cards for a given individual (advantage over previous papers).
• Identify shock’s effect on consumption:
• ∂CB
∂S=
∂CL
∂S×
∂CB
∂CL
• Isolate ∆ (Credit Limits) due to the sudden bank liquidity shock.
• Next, examine ∆ (Balances) resulting from ∆ (Credit Limits) induced by the bankliquidity shock.
5 / 22

Transmission of bank shocks through credit cards
• Hedged consumers?: Ex-ante, the bank lending channel through credit cards isnot obvious.
• Consumers have multiple credit cards and unutilized credit.• 59.8% of the households held two or more credit cards in 2007 (source: 2007 SCF).
• Average utilization ratio is about 27%.
• Substitutes: Households have access to other sources of financing (personal loans,
home equity lines of credit)
• Thus, frictions that constrain consumers in the credit market are necessary for areal impact of bank shocks transmitted through the credit card channel.
• We highlight which credit market frictions are binding.
6 / 22

Data
• Data from one of the three major credit bureaus in the United States – observecredit limits and balances on all credit cards of an individual (∼ 500 million CCs.)
• Sample: 18 BHCs with non-zero wholesale funding dependence that are CCissuers; account for 65% of market; cover 7 of top 10 CC issuers which accountfor 50% of market share.• Dropped 4 foreign issuers, 1 specializing in retail store cards, 1 targeting a particular segment of U.S.
population (veterans), 1 with insufficient data.
• Omit cards closed in the post-shock period → so that we don’t pick up changesin credit limits and balances due to personal bankruptcies or CC cancellations.
• Two main samples: Within-individual sample (158 million CCs, 54 million individuals),
Aggregate sample (500 million CCs, 134 million individuals).
• Bank data from BHC Y-9C filings.
7 / 22

Bank liquidity shock• Bank exposure to liquidity shock: ratio of bank’s short-term wholesale funding to deposits.
• Exposure measure: bank’s runnable funding (short-term wholesale funding) as a proportion
of its stable funding (deposits).
• Exposure measure: Relatively stable in the pre-crisis period, and declines sharply in thepost-crisis period.
0.15
0.20
0.25
0.30
0.35
0.40
0.45
Shor
t-ter
m w
hole
sale
fund
ing
/ Dep
osits
2002q1 2004q1 2006q1 2008q1 2010q1 2012q1 2014q1
8 / 22

Bank liquidity shock
• Banks vary in the extent to which they depend on short-term wholesale funding→ liquidity shock should vary across banks.
• Short-term wholesale funding: non-deposit financing (e.g., repos, commercial paper,
interbank borrowing) with maturity less than one year.
• Mainly provided by institutional investors such as, money market funds (MMFs) andother banks.
• Advantages: Alternative to deposits when they need to quickly cover any funding gap
(supply of deposits is highly inelastic with respect to the interest rates offered (Amel & Hannan,
1999)
• Disadvantages: Expensive and prone to runs when compared to deposit financing
• Ex-ante, less risky/strong banks should have a comparative advantage in accessing thewholesale funding market (Choi & Choi, 2017)
9 / 22

Validity of liquidity shock
Depvar: ∆ST Wholesale ∆Wholesale ∆Tot Liabilities ∆Tot Equity(1) (2) (3) (4)
Exposure -0.425*** -0.324*** -0.272*** -0.151(-4.03) (-2.95) (-3.34) (-1.75)
N 18 18 18 18Adj. R2 0.469 0.334 0.412 0.181
Controls Assets Assets Assets Assets
Orthog-Exposure R2 0.531 0.412 0.481 0.278
• Banks with high exposure experienced larger decline in short-term wholesalefunding
• High exposure banks also experienced declines in total liabilities
• Equities/deposits unaffected
• The exposure measure explains ∼ 53% of the decline in short-term wholesalefunding, and ∼ 48% of decline in total liabilities in banks.
10 / 22

Empirical setup: Collapsed cross-sectional analysis
• Collapse the time-series credit card account-level data to obtain a single creditcard-level cross-section separately in the pre-shock and post-shock period byaveraging across time.
• Estimate credit card-level regression:
∆CreditLimiti,c,b = α+ βExposureb + f(Xi,c,b) + ηi + εi,c,b
• Sample period:
• Pre-shock – Jan-2007, Jul-2007, and Jan-2008 semi-annual archives.
• Post-shock – Jan-2009, July-2009, and Jan-2010 archives.
• Analysis is similar to including Individual×Archive FE which absorbs alltime-varying individual-level factors.
11 / 22

Summary stats
• High-exposure banks significantly larger than low-exposure banks
• Insignificant differences in equity capital, liquid assets, business mix, performancebetween high- and low-exposure banks.
• Greater decline in credit card limits for high-exposure banks:
• Mean ∆CCLimitHigh−exposure = −3.96%
• Mean ∆CCLimitLow−exposure = −0.30%
• Greater decline in credit card balances for high-exposure banks:
• Mean ∆CCBalanceHigh−exposure = −49.07%
• Mean ∆CCBalanceLow−exposure = −19.13%
• High-exposure banks lend to relatively higher quality borrowers
• Better credit scores, higher monthly income, lower delinquency rates, lower subprimeshare.
• Consumers of high-exposure banks have higher credit card balance, mortgage balance,differences in debt composition (auto, mortgage, credit card etc.), but similar DTI.
12 / 22

Bank exposure and ∆ CC limits: Credit card-level analysis
Individual FE OLS
Depvar: ∆CC Limit (1) (2) (3) (4)
Exposure -3.811*** -5.050*** -4.750*** -4.035***(-9.85) (-13.32) (-12.89) (-8.66)
Bank characteristics X X X XBank quality X X XCredit card controls X X
N 158,432,533 158,432,533 158,432,533 158,432,533Adj. R2 0.072 0.084 0.090 0.036
Clustering Bank×State
• FE estimate implies 1 SD (16%) greater bank exposure leads to a reduction of $434 in creditlimit (Avg. pre-shock credit limit 9131.60×4.750%).
• FE and OLS estimates are similar → demand factors that drive increases in credit limitsseem uncorrelated with liquidity shock exposure in the cross-section.
• Robust after controlling for bank quality (size, size2 , capital ratio, CC business, ROE, non-perf loans etc.) andcredit card controls (CC utilization, CC age, bank-individual relationship).
• Robust to alternate measures of bank exposure (exposure defined w.r.t assets, exposure orthogonalized to bank
size) and different levels of clustering (bank-level).
13 / 22

Bank exposure and ∆ CC balances
• Why should changes in credit limits affect credit card balances?
• Permanent income hypothesis: Corr(∆CCLimits, ∆CCBalances)=0 if ∆(Permanentincome)=0.
• Liquidity constraints: Corr(∆CCLimits, ∆CCBalances)>0 only if binding liquidityconstraints (e.g.: high CC utilization individuals.)
• Buffer stock models: Corr(∆CCLimits, ∆CCBalances)>0 if liquidity constraintsexpected to be binding in future affects currently unconstrained individuals too.
• Corr(∆CCLimits, ∆CCBalances) 6=0 because of demand factors.
• Consumers apply for credit limit increase.
• Lenders can anticipate future demand changes.
• Important to control for Individual FE!
14 / 22

Bank exposure and ∆ CC balances: Card-level analysis
OLS FE OLS FE 2SLSDepvar: ∆CC Balance (1) (2) (3) (4) (5)
∆ CC limit 0.744*** 0.854***(46.40) (25.05)
Exposure -3.080 -9.805***(-1.02) (-4.57)
∆ CC limit (instrumented) 2.064***(4.52)
Individual FE X X X
Bank characteristics X X X X XBank quality X X X X XCredit card controls X X X X X
N 158,432,533 158,432,533 158,432,533 158,432,533 158,432,533Adj. R2 0.04 0.16 0.02 0.15 0.13F -stat (Excl. Instru) 97.1
• OLS and FE estimates suggest that individual demand factors bias against finding results→ high exposurebanks were lending to better borrowers.
• IV estimate captures LATE→ 2.06% card-level consumption foregone due to 1% reduction in credit limitsfrom short-term wholesale funding shock (Assumption: Shock affects balances only through limits.)
• Results robust to using a “leave-out” mean credit supply measure instead of credit limits→ mitigatesbank-specific individual demand concerns.
15 / 22
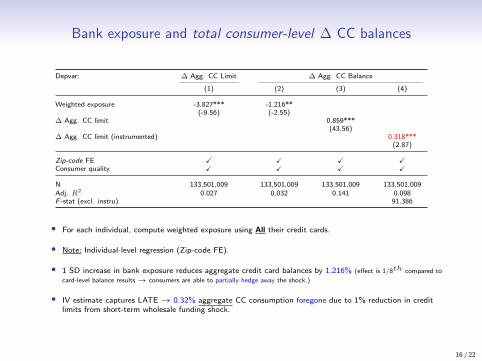
Bank exposure and total consumer-level ∆ CC balances
Depvar: ∆ Agg. CC Limit ∆ Agg. CC Balance
(1) (2) (3) (4)
Weighted exposure -3.827*** -1.216**(-9.56) (-2.55)
∆ Agg. CC limit 0.859***(43.56)
∆ Agg. CC limit (instrumented) 0.318***(2.87)
Zip-code FE X X X XConsumer quality X X X X
N 133,501,009 133,501,009 133,501,009 133,501,009Adj. R2 0.027 0.032 0.141 0.098F -stat (excl. instru) 91.386
• For each individual, compute weighted exposure using All their credit cards.
• Note: Individual-level regression (Zip-code FE).
• 1 SD increase in bank exposure reduces aggregate credit card balances by 1.216% (effect is 1/8th compared to
card-level balance results→ consumers are able to partially hedge away the shock.)
• IV estimate captures LATE→ 0.32% aggregate CC consumption foregone due to 1% reduction in creditlimits from short-term wholesale funding shock.
16 / 22

Dollar Regressions
Depvar: $ Changes: ∆ CC Limit ∆ CC Balance ∆ Agg. CC BalanceFE 2SLS 2SLS
(1) (2) (3)
Exposure -475.35***(-13.31)
∆ CC limit (instrumented) 0.235***(7.30)
∆ Agg. CC limit (instrumented) 0.071***(13.03)
N 158,432,533 158,432,533 133,501,009F -stat (excl. instru) 177.15 104.48
• 1 SD increase in bank exposure reduces credit card balance by $475.35.
• Funding-shock induced credit limit cuts:
• Credit card level: ↓ $1 Credit Limit =⇒ Balance 23.5 cents ↓
• Individual level: ↓ $1 Credit Limit =⇒ Balance 7.1 cents ↓
• Other Studies:
• Gross and Souleles (2002): ↑ $1 Credit Limit =⇒ Balance 10 – 14 cents ↑
• Mian, Rao, and Sufi (2013): ↓ $1 House Price =⇒ Spending 5 – 7 cents ↓
17 / 22

Heterogeneity: Credit card level analysis
Panel A: CC-level Util Panel B: Ind-level Util Panel C: Credit Score
Depvar: ∆CC Limit (1) Depvar: ∆CC Limit (2) Depvar: ∆CC Limit (3)
Exposure -4.052*** Exposure -4.232*** Exposure -4.038***(-10.61) (-10.87) (-10.26)
Exposure×CC util (50–90%) -4.298*** Exposure×Agg. util (50–90%) -4.994*** Exposure×Near-prime -4.145***(-10.61) (-11.68) (-9.92)
Exposure×CC util (>90%) -6.587*** Exposure×Agg. util (>90%) -8.185*** Exposure×Subprime -7.887***(-15.16) (-15.37) (-14.88)
N 158,432,533 151,449,029 158,423,518Adj. R2 0.089 0.089 0.089
• Banks transmit shocks differentially across consumers! → Banks cut credit limits more forhigher utilization and lower credit score consumers.
• Evidence consistent with greater costs of lending to consumers with greater informationfrictions (e.g., moral hazard for high utilization ratio consumers).
18 / 22

Heterogeneity: Individual level analysis
Change in Credit Card Balances Across All Cards
Utilization Credit score
0-50% 50-90% 90%+ Sub-prime Near-prime Prime(1) (2) (3) (4) (5) (6)
∆ Agg. CC Limit (instru) 0.232 1.078*** 1.325*** 1.475*** 0.639*** 0.120(1.14) (21.11) (44.16) (36.59) (12.50) (0.66)
Change in Total Debt Balances Across All Debt-related Accounts
Utilization Credit score
0-50% 50-90% 90%+ Sub-prime Near-prime Prime(1) (2) (3) (4) (5) (6)
∆ Agg. CC limit (instru) -0.890*** -0.001 0.199*** 0.596*** 0.123** -0.723***(-4.91) (-0.03) (6.48) (10.23) (2.13) (-5.43)
• Aggregate consumption elasticity is decreasing in an individual’s ability to hedge.
• Individuals with lower credit score, higher utilization reduce consumption on their credit cards at theaggregate level.
• Elasticities for total debt balances are smaller compared to total credit card balances. → Individuals able tosubstitute to other credit sources.
• Overall, suggests credit constrained individuals were not able to hedge away the funding shock to their bankat the aggregate level.
19 / 22

Long-run effects of the funding shock
• Total inflation-adjusted real credit extended by banks on credit cards recoveredto pre-crisis levels over time.
0.6
0.7
0.8
0.9
1.0
Cre
dit L
imits
0 2 4 6 8 10Years Post-shock
High-exposure Banks Low-exposure Banks
20 / 22

Long-run effects of the funding shock
• Persistent effects of funding shock for the near-prime and subprime consumers inthe long-run.
-1.5
-1.0
-0.5
0.0
Elas
ticiti
es (n
egat
ive)
0 2 4 6 8 10Years Post-shock
Subprime Near-prime
Prime
21 / 22

Conclusion• Results:
• Funding structure of banks affects aggregate consumption through the credit cardschannel.
• Heterogeneity in bank response: Banks transmit shocks more to the credit constrainedconsumers.
• Heterogeneity in consumption elasticities: Consumption sensitivity to funding shock ishigher for credit constrained consumers.
• Overall, when faced with liquidity shocks, banks pass them on to consumers who areleast able to cope with them.
• Ours + prior studies shed light on the winners and losers in a credit boom-bust cycle:Credit constrained consumers enjoy less gains in boom and suffer more costs in bust.
• Contribution:• Banks’ balance sheets can affect aggregate consumption through the credit card
channel with significant distributional consequences over the long-term.
• Post-crisis regulatory reform focused on addressing the vulnerabilities of a bank’sfunding structure, especially the reliance on wholesale funding (Tarullo, 2014).
22 / 22