research article sound richness of music might be mediated
TRANSCRIPT

Research ArticleSound Richness of Music Might Be Mediated byColor Perception: A PET Study
Masayuki Satoh,1 Ken Nagata,2 and Hidekazu Tomimoto1,3
1Department of Dementia Prevention andTherapeutics, Graduate School of Medicine, Mie University, 2-174 Edobashi,Tsu, Mie 514-8507, Japan2Department of Neurology, Research Institute for Brain and Blood Vessels, 6-10 Senshu-Kubota-Machi, Akita 010-0874, Japan3Department of Neurology, Mie University Graduate School of Medicine, 2-174 Edobashi, Tsu, Mie 514-8507, Japan
Correspondence should be addressed to Masayuki Satoh; [email protected]
Received 6 March 2015; Accepted 17 May 2015
Academic Editor: Michael E. Behen
Copyright © 2015 Masayuki Satoh et al.This is an open access article distributed under the Creative CommonsAttribution License,which permits unrestricted use, distribution, and reproduction in any medium, provided the original work is properly cited.
Objects.We investigated the role of the fusiform cortex inmusic processing with the use of PET, focusing on the perception of soundrichness.Method. Musically naıve subjects listened to familiarmelodies with three kinds of accompaniments: (i) an accompanimentcomposed of only three basic chords (chord condition), (ii) a simple accompaniment typically used in traditional music text booksin elementary school (simple condition), and (iii) an accompaniment with rich and flowery sounds composed by a professionalcomposer (complex condition). Using a PET subtraction technique, we studied changes in regional cerebral blood flow (rCBF) insimpleminus chord, complexminus simple, and complexminus chord conditions.Results.The simpleminus chord, complexminussimple, and complex minus chord conditions regularly showed increases in rCBF at the posterior portion of the inferior temporalgyrus, including the LOC and fusiform gyrus. Conclusions. We may conclude that certain association cortices such as the LOC andthe fusiform cortex may represent centers of multisensory integration, with foreground and background segregation occurring atthe LOC level and the recognition of richness and floweriness of stimuli occurring in the fusiform cortex, both in terms of visionand audition.
1. Introduction
Historically, the style of music has developed from simpleto complex. Such development was typically classified as achange from monophony, that is, music for a single voiceor part [1], to polyphony, in which two or more strandssound simultaneously, or to homophony in which therewas a clear distinction between melody and accompanyingharmony [1]. In music with a monophonic style, only themelody is produced and there is no accompaniment. Inhomophony, to whichmost nursery and folk songs of westernmusic belong, music consists of melody and its accompa-niment. As music with homophonic or polyphonic styleshas developed, harmonies have become more complex. Forexample, music of Mozart or Haydn in the 18th centuryrarely utilized dissonant chords, while the 20th centurymusicof Ravel or Debussy had several kinds of chords includingdissonant ones. Listening to homophonic music is different
from listening to monophonic music according to the fol-lowing. First, with homophonic music, listeners discriminatemelody and its accompaniment. Even if the melody andthe accompaniment are played by the same instrument (i.e.,with the identical timbre), we can easily and instantaneouslyperceive the melody and the accompaniment. The neuralbasis of this is still unknown, but we previously reported ina positron emission tomography (PET) activation study thatthe lateral occipital complex (LOC), which participates inforeground and background segregation in vision, plays animportant role in the discrimination between melody andits accompaniment [2]. The melody and the accompanimentcould be regarded, in auditory terms, as the foreground andbackground, respectively. We suggested that the same neuralsubstrates carried out similar functions beyond the simplediscrimination of sensory modalities. Second, the sounds ofhomophonic music could be richer than monophonic music.The quality of sound is generally called “timbre.” The timbre
Hindawi Publishing CorporationBehavioural NeurologyVolume 2015, Article ID 241804, 10 pageshttp://dx.doi.org/10.1155/2015/241804

2 Behavioural Neurology
is operationally defined as the attribute that distinguishessounds of equal pitch, loudness, location, and duration [3].The term “timbre” not only relates to the individual musicalinstrument, but also relates to expressing the characteristicsof the sound of musical pieces. For example, it is generallyconsidered that the timbre of impressionist music of Ravelor Debussy is richer and more flowery than the classicalmusic of Mozart or Haydn. In the above-mentioned PETstudy, the melody with accompaniment also activated thefusiform cortex (in addition to the LOC) compared to themelody without the accompaniment [2]. We interpreted theactivation of the fusiform cortex to reflect the rich sound fromthe accompaniment, but much still remains to be done toidentify the role of that area in listening to music.
Over the past few decades, a considerable number ofPET activation studies have been made on various aspectsof music, sounds, and the brain [4–6], not only in healthysubjects [4, 6] but also in patients with tinnitus [5]. Basedon our previous researches, we performed another PETstudy that investigated brain region activity while subjectslistened to melodies with various kinds of accompaniments.Musically naıve subjects listened to melodies of familiarnursery songs with various degrees of sound richness of theaccompaniment. According to a visual analogue scale (VAS),for each piece of music we also ascertained to what extentthe subjects felt the sound was rich. Using a PET subtractiontechnique, brain regions that were significantly activated bysound richness were identified.
2. Subjects and Methods2.1. Subjects. Ten right-handed male volunteers (mean age21.7 ± 0.95 years; range 20–24) participated in the study.All were students at the Schools of Engineering or Mining,Akita University, and met criteria for Grison’s second levelof musical culture [7]. None had received any formal orprivate musical education, and none had any signs or historyof neurological, cardiovascular, or psychiatric disease. Allsubjects gave written informed consent after the purposeand procedure of the examination had been fully explained.The study was approved by the Ethics Committee of theResearch Institute for Brain and Blood Vessels, Akita, Japan,and all experiments were conducted in accordance with theDeclaration of Helsinki.
2.2. Task Procedures. The stimuli in this experiment were sixmelodies of well-known Japanese nursery songs. All subjectswere very familiar with these melodies. For each melody,the following three kinds of accompaniment were composed:(i) an accompaniment composed by using only three basicchords (tonic, dominant, and subdominant chord), one ofwhich was set on each bar (chord condition), (ii) a simpleaccompaniment that is typically used in the traditionalmusic text books in Japanese elementary schools (simplecondition), and (iii) an accompaniment with rich and flowerysounds composed by a professional composer [8] (complexcondition). The (i) chord and (ii) simple condition accom-paniments were composed by one of the authors (MasayukiSatoh). The accompaniment of simple condition consisted of
quarter tones of a chord on awhole note of fundamental tone.The first beat of each cord in the bar was rest, so only thefundamental tone was played at the first beat. All musicalstimuli were played using the “FINALE” software [9]. TheauthorMasayuki Satohwrotemusical scores ofmusical piecesused in this experiment on the “FINALE,” and the softwareplayed each piece with piano timbre. Each performance wasrecorded on a compact disc. Melodies with the three typesof accompaniments were randomly presented. Subjects wereinstructed to listen to each melody, and PET measurementswere obtained while listening to these melodies (proceduresdescribed below). Subjects were required to make a sign withthe index finger of the right hand as the melody of each songfinished. All stimuli were presented binaurally via inset stereoearphones.
The instruction to the subjects was as follows: Close youreyes. You will listen to a melody of a familiar nursery song. Ifyou feel that the melody has finished, please make a sign withthe index finger of your right hand.
2.3. Positron Emission Tomography Measurements. The pro-tocol used in this study has been previously described indetail [2, 10–12]. Briefly, PET data were acquired in 3D acqui-sition mode using Headtome V (Shimadzu, Kyoto, Japan).Scans were performed in a darkened room with subjectslying supine with eyes closed. Nine CBF measurementswere determined for each subject, three during the chord,three during the simple, and three during the complex con-dition. Employing 15O-labeled water (H2
15O) intravenousbolus technique [13], emission data were collected for 90seconds for each measurement following intravenous bolusinjection of about 15mL (40mCi) H2
15O. A musical piecewas initiated 15 seconds prior to data acquisition, followedby another musical piece, and this in total continued forabout 120 seconds. Emission data were corrected for atten-uation by acquiring 10 minutes of transmission data utilizing68Ge orbiting rod source performed prior to the activationscans. A wash-out period of approximately 10 minutes wasallowed between successive scans. For anatomic reference, allsubjects underwent axial T1-weighted imaging (T1WI) andT2-weighted imaging (T2WI) using a 1.5 T magnetic reso-nance system (Vision, Siemens, Germany). T1WI (TR/TE =665/14ms) and T2WI (TR/TE = 3600/96ms) were obtainedusing a slice thickness of 5mmwith an interslice gap of 1mm.
2.4. Data Analysis. PET data analysis was performed on aSGI Indy running IRIX 6.5 (Silicon Graphics, California),using an automated PET activation analysis package [14]composed of six main processing stages which has beenpreviously described in detail [2, 10–12]. The six main stagesconsisted of intrasubject coregistration, intrasubject normal-ization, automatic detection of the AC-PC line, detectionof multiple stretching points and surface landmarks onintrasubject averaged image sets, intersubject summation andstatistical analyses, and superimposition of statistical resultsonto the stereotactic MRI. Deformation of individual brainsto correspond with the standard atlas brain was achieved byspatially matching individual landmarks to the correspond-ing predefined standard surface landmarks and minimizing

Behavioural Neurology 3
Figure 1: Visual analogue scale (VAS) for the assessment ofsubjective impression of sound richness of each musical stimulus.The length of color bar is 140mm.
correlation coefficients of regional profile curves betweenthe stretching centers. Activation foci were considered to besignificantly activated if the corresponding 𝑝 value was lessthan a predetermined threshold (𝑝 < 0.001, Bonferroni cor-rection for multiple comparisons). Anatomical identificationof activation foci was achieved by referring the stereotacticcoordinates of the peak activated pixels to the standardTalairach brain atlas [15].
2.5. Visual Analogue Scale (VAS) of Sound Richness. Afterthe PET measurement, the degree of sound richness ofeach melody with the three types of accompaniments wasinvestigated in each subject. In a quiet room, each subjectlistened to the stimuli and was required to subjectively markthe VAS (Figure 1) according to the degree of sound richnessthe subject felt. Three colors (yellow, blue, and red) wereused because the lyrics of some songs had a relationshipwith a specific color, for example, the sea related to blueand the sunset to red. Subjects marked to the right to thedegree that they felt that the sound of the music was rich.We measured the distance from the left end to the markedposition (mm) and, using the Wilcoxon signed rank test,statistically compared the distance between the three kindsof accompaniments, namely, chord, simple, and complexcondition.
3. ResultsRegarding the VAS of sound richness, the mean distancefrom the left end was significantly longer as the accompa-niment became more complex (Figure 2): chord condition54.2 ± 34.2; simple condition 71.3 ± 30.1; complex condition101.4 ± 31.1mm (mean ± standard deviation (sd)). We canreasonably conclude that, as expected, the more complex theaccompaniment became, the richer the subjects reported thesound.
The results of subtractions providing significant regionsactivated as the sound became more complex are given inTables 1, 2, and 3 and Figures 3, 4, and 5. The regionsactivated during the simple condition but not during thechord condition are listed in Table 1 together with stereo-tactic coordinates based on the brain atlas of Talairach and
0
20
40
60
80
100
120
Dist
ance
(mm
)
AccompanimentChord Simple Complex
p < 0.001
p < 0.001
p = 0.004
Figure 2: Results of VAS of each accompaniment condition. As theaccompaniment became more complex, the subjects regarded thesound of musical pieces as being richer.
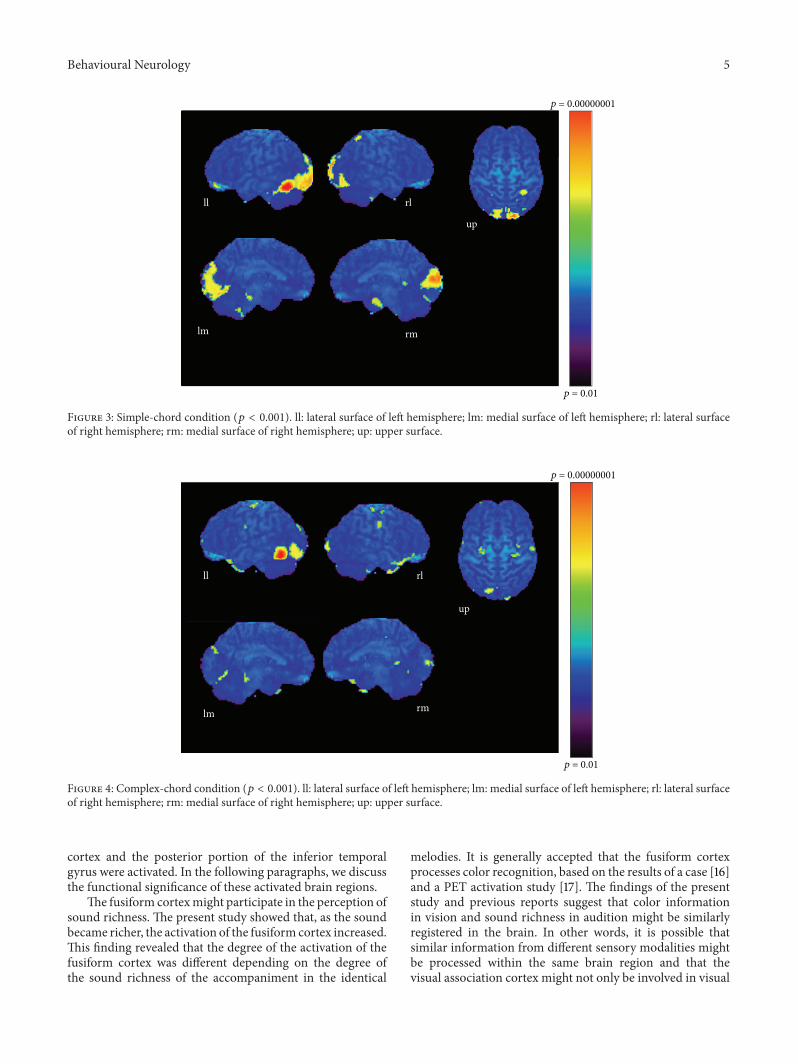
Tournoux [15]. These results show areas of relative bloodflow changes that emphasize differences between the twoconditions and minimize areas that are common to bothconditions. Significant increases in relative cortical bloodflow were found in the posterior portion of the left inferiortemporal gyrus, bilateral fusiform gyri, the medial surfaceof the bilateral frontal lobes, the right superior parietallobule, and the left orbital frontal cortex (Table 1, Figure 3).Compared to the chord condition, the complex conditionproduced significant activation at the posterior portion of theleft inferior temporal gyrus, left fusiform gyrus, right medialsurface of the occipital lobe, the lateral surface of the leftoccipital lobe, and the anterior portion of the left middletemporal gyrus (Table 2, Figure 4). Between the complex andsimple condition, the former condition significantly activatedthe posterior portion of the left inferior temporal gyrus,the left fusiform gurus, the left retrosplenial region, theanterior portion of the right middle temporal gyrus, theright cingulate gyrus, and the bilateral cerebellum (Table 3,Figure 5). The important point to note is that the activationof the posterior portion of the inferior temporal gyrus andthe fusiform gyrus was observed in all results after everysubtraction, that is, simple minus chord, complex minuschord, and complex minus simple condition. The oppositesubtraction of chord minus simple, chord minus complex,and simple minus complex conditions revealed almost thesame activation pattern. The activation was observed at thebilateral orbital frontal cortex, the bilateral or left superiorfrontal gyrus, and the right superior temporal gyrus (Tables4–6, Figures 6–8).
4. DiscussionThe findings of this experiment are summarized as follows:as an accompaniment became more complex, (i) the subjectsfelt that the sound of music was richer and (ii) the fusiform

4 Behavioural Neurology
Table 1: Regions showing significant changes in rCBF by the subtraction of simple minus chord condition.
Anatomical structures Brodmann area Talairach coordinate𝑧-score
𝑥 𝑦 𝑧
Posterior portion of inferior temporal gyrus 37L −48 −55 −16 5.20
Fusiform gyrusL 18/19 −19 −58 −9 4.38R 19 30 −67 −7 4.32
Medial surface of occipital lobe 17/18L −17 −87 −4 3.83R 10 −87 11 4.024
Superior parietal lobule 7R 33 −53 56 3.32
Orbital frontal cortex 11L −17 50 −16 3.08
Coordinates x, y, and z are in millimetres corresponding to the atlas of Talairach and Tournoux. The 𝑥-coordinate refers to medial-lateral position relativeto midline (negative = left); 𝑦-coordinate refers to anterior-posterior position relative to the anterior commissure (positive = anterior); 𝑧-coordinate refersto superior-inferior position relative to the anterior commissure-posterior commissure line (positive = superior). 𝑧-score refers to the maximum pixel of theregion. L and R refer to the left and right hemisphere, respectively.
Table 2: Regions showing significant changes in rCBF by the subtraction of complex minus chord condition.
Anatomical structures Brodmann area Talairach coordinate𝑧-score
𝑥 𝑦 𝑧
Posterior portion of inferior temporal gyrus 37L −53 −58 −11 4.97
Fusiform gyrusL 19/37 −30 −49 −11 3.58
Medial surface of occipital lobeR 17 17 −96 2 3.10
Lateral surface of occipital lobeL 18 −39 −73 −2 3.00
Anterior portion of middle temporal gyrusR 38 35 8 −40 3.96
Details as for Table 1.
Table 3: Regions showing significant changes in rCBF by the subtraction of complex minus simple condition.
Anatomical structures Brodmann area Talairach coordinate𝑧-score
𝑥 𝑦 𝑧
Posterior portion of inferior temporal gyrus 37L −60 −58 −7 3.81
Fusiform gyrusL 36 −33 −26 −25 4.27
Retrosplenial regionL 29 −6 −51 18 3.91
Anterior portion of middle temporal gyrusR 38 37 8 −40 3.44
Cingulate gyrusR 31 10 −28 40 3.29
CerebellumL −51 −49 −38 3.34
R 39 −64 −32 3.34
Details as for Table 1.
Behavioural Neurology 5
ll rl
rm
up
lm
p = 0.01
p = 0.00000001
Figure 3: Simple-chord condition (𝑝 < 0.001). ll: lateral surface of left hemisphere; lm: medial surface of left hemisphere; rl: lateral surfaceof right hemisphere; rm: medial surface of right hemisphere; up: upper surface.
ll rl
lm rm
up
p = 0.01
p = 0.00000001
Figure 4: Complex-chord condition (𝑝 < 0.001). ll: lateral surface of left hemisphere; lm: medial surface of left hemisphere; rl: lateral surfaceof right hemisphere; rm: medial surface of right hemisphere; up: upper surface.
cortex and the posterior portion of the inferior temporalgyrus were activated. In the following paragraphs, we discussthe functional significance of these activated brain regions.
The fusiform cortexmight participate in the perception ofsound richness. The present study showed that, as the soundbecame richer, the activation of the fusiform cortex increased.This finding revealed that the degree of the activation of thefusiform cortex was different depending on the degree ofthe sound richness of the accompaniment in the identical
melodies. It is generally accepted that the fusiform cortexprocesses color recognition, based on the results of a case [16]and a PET activation study [17]. The findings of the presentstudy and previous reports suggest that color informationin vision and sound richness in audition might be similarlyregistered in the brain. In other words, it is possible thatsimilar information from different sensory modalities mightbe processed within the same brain region and that thevisual association cortex might not only be involved in visual

6 Behavioural Neurology
ll rl
lm rm
up
p = 0.01
p = 0.00000001
Figure 5: Complex-simple condition (𝑝 < 0.001). ll: lateral surface of left hemisphere; lm: medial surface of left hemisphere; rl: lateral surfaceof right hemisphere; rm: medial surface of right hemisphere; up: upper surface.
Table 4: Regions showing significant changes in rCBF by the subtraction of chord minus simple condition.
Anatomical structures Brodmann area Talairach coordinate𝑧-score
𝑥 𝑦 𝑧
Orbital frontal cortex 11L −6 26 −16 2.97R 5 24 −14 2.73
Superior frontal gyrus 6/8L −24 30 43 3.13R 21 19 58 3.29
Superior temporal gyrusR 22 51 3 2 3.06
CerebellumL −17 −62 −36 3.82R 51 −46 −36 3.43
Details as for Table 1.
Table 5: Regions showing significant changes in rCBF by the subtraction of chord minus complex condition.
Anatomical structures Brodmann area Talairach coordinate𝑧-score
𝑥 𝑦 𝑧
Orbital frontal cortex 10/11L −3 26 −18 5.39
R 12 64 −11 3.20
Superior frontal gyrusL 8 −24 28 50 3.05
Superior temporal gyrusR 22 62 −37 7 3.75
Details as for Table 1.

Behavioural Neurology 7
Table 6: Regions showing significant changes in rCBF by the subtraction of simple minus complex condition 3.
Anatomical structures Brodmann area Talairach coordinate𝑧-score
𝑥 𝑦 𝑧
Orbital frontal cortex 11L −1 28 −20 4.79
R 12 32 −18 4.06
Anterolateral portion of superior frontal gyrusL 21/22 −48 5 −14 2.97
Superior temporal gyrusR 22 62 −37 7 2.90
CerebellumL −51 −37 −25 3.17
Details as for Table 1.
ll rlup
lm rm
p = 0.01
p = 0.00000001
Figure 6: Chord-simple condition (𝑝 < 0.001). ll: lateral surface of left hemisphere; lm: medial surface of left hemisphere; rl: lateral surfaceof right hemisphere; rm: medial surface of right hemisphere; up: upper surface.
processing. Recent studies have revealed that some sensorymodalities are related to each other. This phenomenon iscalled “cross-modal integration” and was observed betweentaste and audition [18], taste and smell [19–22], taste and color[23], odor and color [24], taste and music [25], pitch andvisual size [26, 27], brightness and frequency of vibrotactilestimuli [28], sound and color [29, 30], and vision andaudition [31]. It was reported that cross-modal associationsare ubiquitously present in normal mental function [25, 32,33]. Recent research suggests that cortical auditory processingis divided into separate processing streams [31, 34]. Poste-rior temporoparietal regions, labeled the “where” or “how”stream, may be specialized for processing sound motionand location [31]. Regions anterior and ventral to primaryauditory cortex, labeled the “what” stream,may be specializedfor processing characteristic auditory features [31]. Neuronsin “what” stream respond directly to auditory and visualsensory stimuli and are important for forming the association
between auditory and visual objects [31]. Therefore, we mayconclude that cross-modal integration also occurs at thefusiform cortex between color and sound richness whenlistening to music.
In the present study, the posterior portion of the inferiortemporal gyrus was also activated. This area is called thelateral occipital complex (LOC) and is known to participate inforeground and background segregation in vision [35]. It wassuggested that the LOCalso participates in the discriminationbetween melody and its accompaniment [2]. In our previousstudy, we considered that the LOC might play a similarrole of foreground and background segregation in bothvision and audition. This finding reinforced the hypothesisthat some association cortices carry out a similar functionbeyond the differences in sensorymodalities (Figure 9). Afterthe perception of sounds at the auditory cortex level, theinformation might be sent to the LOC and fusiform cortex.The former and the latter might participate in the foreground

8 Behavioural Neurology
ll rl up
lm rm
p = 0.01
p = 0.00000001
Figure 7: Chord-complex condition (𝑝 < 0.001). ll: lateral surface of left hemisphere; lm: medial surface of left hemisphere; rl: lateral surfaceof right hemisphere; rm: medial surface of right hemisphere; up: upper surface.
ll rl up
lm rm
p = 0.01
p = 0.00000001
Figure 8: Simple-complex condition (𝑝 < 0.001). ll: lateral surface of left hemisphere; lm: medial surface of left hemisphere; rl: lateral surfaceof right hemisphere; rm: medial surface of right hemisphere; up: upper surface.
and background segregation and the recognition of soundrichness, respectively, both in vision and audition.
The opposite subtraction, namely, chord minus simple,chord minus complex, and simple minus complex condition,all produced an activation of the bilateral orbital frontalcortex. The functional significance of this region in thisexperiment is unclear. However, this region is known asa structure within Yakovlev’s circuit that participates inemotion and memory. Damage to this region often results in
disinhibition, impairment in control over impulsive behaviorbased on instinct and emotion. It is possible that activationof the orbital frontal cortex was caused by the comfortableand pleasant feeling of listening to familiar nursery songsor by inhibiting the desire to sing along with these familiarmelodies.
In summary, the fusiform cortex and the LOC mighthave a similar function in vision and audition. The fusiformcortex recognizes color and sound richness, and the LOC

Behavioural Neurology 9
LOC
Fusiform cortexAuditory cortex
Discrimination between melody and its accompaniment
Recognition of sound richnessPerception of sounds
Figure 9: Diagram of cognitive processing during listening tomusicwith accompaniment.
participates in foreground and background segregation.We may conclude that the association cortices might playa similar role across multiple sensory modalities. Furtherstudies are needed to clarify the multimodal integration ofassociation cortices.
Conflict of Interests
The authors declare that there is no conflict of interestsregarding the publication of this paper.
References
[1] S. Sadie,TheGrove Concise Dictionary of Music, TheMacmillanPress, London, UK, 1994.
[2] M. Satoh, K. Takeda, K. Nagata, and H. Tomimoto, “The lateraloccipital complex is activated by melody with accompaniment:foreground and background segregation in auditory process-ing,” Journal of Behavioral and Brain Science, vol. 1, no. 3, pp.94–101, 2011.
[3] S. M. Town and J. K. Bizley, “Neural and behavioral investiga-tions into timbre perception,” Frontiers in Systems Neuroscience,vol. 7, article 88, 2013.
[4] R. J. Zatorre, A. R. Halpern, D. W. Perry, E. Meyer, and A. C.Evans, “Hearing in the mind’s ear: a PET investigation of musi-cal imagery and perception,” Journal of Cognitive Neuroscience,vol. 8, no. 1, pp. 29–46, 1996.
[5] F. Mirz, C. B. Pedersen, K. Ishizu et al., “Positron emissiontomography of cortical centers of tinnitus,” Hearing Research,vol. 134, no. 1-2, pp. 133–144, 1999.
[6] D. Klein, R. J. Zatorre, B.Milner, andV. Zhao, “A cross-linguisticPET study of tone perception inMandarin Chinese and Englishspeakers,” NeuroImage, vol. 13, no. 4, pp. 646–653, 2001.
[7] B. Grison, Une etude sur les alterations musicales au coursdes lesions hemispheriques [M.S. thesis], 1972, (Cited by A. L.Benton, “The amusias” in: M. Critchley and R. A. HensonEds, Music and the Brain, William Heinemann Medical BooksLimited, London, UK, 378–397, 1977).
[8] H. Hoshina and H. Tabata, The Enjoyment of the Applica-tion of Harmony, Ongaku-no-Tomo-sha, Tokyo, Japan, 1985,(Japanese).
[9] FINALE 2004 FOR WINDOWS, MakeMusic, Coda MusicTechnology, CAMEO Interactive, 2004.
[10] M. Satoh, K. Takeda, K. Nagata, J. Hatazawa, and S. Kuzuhara,“Activated brain regions in musicians during an ensemble: aPET study,” Cognitive Brain Research, vol. 12, no. 1, pp. 101–108,2001.
[11] M. Satoh, K. Takeda, K. Nagata, J. Hatazawa, and S. Kuzuhara,“The anterior portion of the bilateral temporal lobes participatesin music perception: a positron emission tomography study,”American Journal of Neuroradiology, vol. 24, no. 9, pp. 1843–1848, 2003.
[12] M. Satoh, K. Takeda, K. Nagata, E. Shimosegawa, and S.Kuzuhara, “Positron-emission tomography of brain regionsactivated by recognition of familiar music,” American Journalof Neuroradiology, vol. 27, no. 5, pp. 1101–1106, 2006.
[13] I. Kanno, H. Iida, S. Miura et al., “A system for cerebral bloodflow measurement using an H15
2O autoradiographic method
and positron emission tomography,” Journal of Cerebral BloodFlow and Metabolism, vol. 7, no. 2, pp. 143–153, 1987.
[14] S. Minoshima, R. A. Koeppe, J. A. Fessler et al., “Integrated andautomated data analysis method for neuronal activation studiesusing [O-15] water PET,” in Quantification of Brain Function,Tracer Kinetics and Image Analysis in Brain PET, K. Uemura, N.A. Lasen, T. Jones, and I. Kannno, Eds., pp. 409–417, ExcerptaMedica/Elsevier, Amsterdam, The Netherlands, 1993.
[15] J. Talairach and P. Tournoux, Co-Planar Stereotaxic Atlas of theHuman Brain, Thieme, New York, NY, USA, 1988.
[16] A. Damasio, T. Yamada, H. Damasio, J. Corbett, and J. McKee,“Central achromatopsia: behavioral, anatomic, and physiologicaspects,” Neurology, vol. 30, no. 10, pp. 1064–1071, 1980.
[17] M. Corbetta, F. M. Miezin, S. Dobmeyer, G. L. Shulman, andS. E. Petersen, “Attentional modulation of neural processing ofshape, color, and velocity in humans,” Science, vol. 248, no. 4962,pp. 1556–1559, 1990.
[18] J. Simner, C. Cuskley, and S. Kirby, “What sound does thattaste? Cross-modal mappings across gustation and audition,”Perception, vol. 39, no. 4, pp. 553–569, 2010.
[19] M. Auvray and C. Spence, “The multisensory perception offlavor,”Consciousness and Cognition, vol. 17, no. 3, pp. 1016–1031,2008.
[20] J. Djordjevic, R. J. Zatorre, and M. Jones-Gotman, “Odor-induced changes in taste perception,” Experimental BrainResearch, vol. 159, no. 3, pp. 405–408, 2004.
[21] D. M. Small and J. Prescott, “Odor/taste integration and theperception of flavor,” Experimental Brain Research, vol. 166, no.3-4, pp. 345–357, 2005.
[22] R. J. Stevenson and C. Tomiczek, “Olfactory-induced synesthe-sias: a review and model,” Psychological Bulletin, vol. 133, no. 2,pp. 294–309, 2007.
[23] M. O’Mahony, “Adapting short cut signal detection measuresto the problem of multiple difference testing: the R-Index,” inSensory Quality in Foods and Beverages, A. A. Williams and R.K. Atkin, Eds., pp. 69–80, Chapman, London, UK, 1983.
[24] M. L. Dematte, D. Sanabria, and C. Spence, “Cross-modalassociations between odors and colors,”Chemical Senses, vol. 31,no. 6, pp. 531–538, 2006.
[25] B. Mesz, M. A. Trevisan, and M. Sigman, “The taste of music,”Perception, vol. 40, no. 2, pp. 209–219, 2011.
[26] K. K. Evans and A. Treisman, “Natural cross-modal mappingsbetween visual and auditory features,” Journal of Vision, vol. 10,no. 1, 2010.
[27] C. Parise andC. Spence, “Synesthetic congruencymodulates thetemporal ventriloquism effect,” Neuroscience Letters, vol. 442,no. 3, pp. 257–261, 2008.
[28] G. Martino and L. E. Marks, “Cross-modal interaction betweenvision and touch: the role of synesthetic correspondence,”Perception, vol. 29, no. 6, pp. 745–754, 2000.

10 Behavioural Neurology
[29] V. S. Ramachandran and E. M. Hubbard, “Hearing colors,tasting shapes,” Scientific American, vol. 288, no. 5, pp. 52–59,2003.
[30] J.Ward, B. Huckstep, and E. Tsakanikos, “Sound-colour synaes-thesia: to what extent does it use cross-modal mechanismscommon to us all?” Cortex, vol. 42, no. 2, pp. 264–280, 2006.
[31] M. S. Beauchamp, K. E. Lee, B. D. Argall, and A. Martin,“Integration of auditory and visual information about objectsin superior temporal sulcus,”Neuron, vol. 41, no. 5, pp. 809–823,2004.
[32] E. M. Hubbard and V. S. Ramachandran, “Neurocognitivemechanisms of synesthesia,”Neuron, vol. 48, no. 3, pp. 509–520,2005.
[33] R. E. Cytowic and D. M. Eagleman, Wesnesday is Indigo Blue:Discovering the Brain of Synesthesis, MIT Press, Cambridge,Mass, USA, 2009.
[34] J. P. Rauschecker and B. Tian, “Mechanisms and streams forprocessing of ‘what’ and ‘where’ in auditory cortex,” Proceedingsof the National Academy of Sciences of the United States ofAmerica, vol. 97, no. 22, pp. 11800–11806, 2000.
[35] K. Grill-Spector, T. Kushnir, S. Edelman, Y. Itzchak, and R.Malach, “Cue-invariant activation in object-related areas of thehuman occipital lobe,” Neuron, vol. 21, no. 1, pp. 191–202, 1998.

Submit your manuscripts athttp://www.hindawi.com
Stem CellsInternational
Hindawi Publishing Corporationhttp://www.hindawi.com Volume 2014
Hindawi Publishing Corporationhttp://www.hindawi.com Volume 2014
MEDIATORSINFLAMMATION
of
Hindawi Publishing Corporationhttp://www.hindawi.com Volume 2014
Behavioural Neurology
EndocrinologyInternational Journal of
Hindawi Publishing Corporationhttp://www.hindawi.com Volume 2014
Hindawi Publishing Corporationhttp://www.hindawi.com Volume 2014
Disease Markers
Hindawi Publishing Corporationhttp://www.hindawi.com Volume 2014
BioMed Research International
OncologyJournal of
Hindawi Publishing Corporationhttp://www.hindawi.com Volume 2014
Hindawi Publishing Corporationhttp://www.hindawi.com Volume 2014
Oxidative Medicine and Cellular Longevity
Hindawi Publishing Corporationhttp://www.hindawi.com Volume 2014
PPAR Research
The Scientific World JournalHindawi Publishing Corporation http://www.hindawi.com Volume 2014
Immunology ResearchHindawi Publishing Corporationhttp://www.hindawi.com Volume 2014
Journal of
ObesityJournal of
Hindawi Publishing Corporationhttp://www.hindawi.com Volume 2014
Hindawi Publishing Corporationhttp://www.hindawi.com Volume 2014
Computational and Mathematical Methods in Medicine
OphthalmologyJournal of
Hindawi Publishing Corporationhttp://www.hindawi.com Volume 2014
Diabetes ResearchJournal of
Hindawi Publishing Corporationhttp://www.hindawi.com Volume 2014
Hindawi Publishing Corporationhttp://www.hindawi.com Volume 2014
Research and TreatmentAIDS
Hindawi Publishing Corporationhttp://www.hindawi.com Volume 2014
Gastroenterology Research and Practice
Hindawi Publishing Corporationhttp://www.hindawi.com Volume 2014
Parkinson’s Disease
Evidence-Based Complementary and Alternative Medicine
Volume 2014Hindawi Publishing Corporationhttp://www.hindawi.com