research article simulation of sediment discharges during
TRANSCRIPT

Research ArticleSimulation of Sediment Discharges duringan Outfall Dredging Operation
Anton Purnama,1 Mahad S. Baawain,2 and Dongdong Shao3
1Department of Mathematics and Statistics, Sultan Qaboos University, P.O. Box 36, Al-Khod, 123 Muscat, Oman2Department of Civil and Architectural Engineering, Sultan Qaboos University, P.O. Box 33, Al-Khod, 123 Muscat, Oman3State Key Laboratory of Water Environment Simulation & School of Environment, Beijing Normal University, Beijing 100875, China
Correspondence should be addressed to Anton Purnama; [email protected]
Received 31 October 2015; Accepted 31 December 2015
Academic Editor: Heinrich Huhnerfuss
Copyright © 2016 Anton Purnama et al.This is an open access article distributed under theCreativeCommonsAttribution License,which permits unrestricted use, distribution, and reproduction in any medium, provided the original work is properly cited.
CORMIX-GTS simulations are carried out to study suspended muddy sediment plumes following the discharge of the spoilstaken from the seabed during a marine outfall pipeline dredging operation. Single port discharges are considered at three differentlocations at 400m, 800m, and 1200m from the shoreline with water depths ranging from 3.5m to 10.5m. For discharges in theshallow near-shore region at 400m offshore, most of the dredge materials are deposited at the seabed and the simulated suspendedsediment plumes are found to be carrying a concentration of less than 1 kg/m3 of mainly fine silt and clay. For discharges in thedeeper far-shore region at 1200m offshore, the sediment plumes are more elongated and carrying a concentration of more than3 kg/m3. Iterative simulations are also conducted to analyse the inherent uncertainty in the input data by varying the ambientvelocity and the port’s horizontal angle of discharge.
1. Introduction
For coastal capital cities, the practical strategy of wastewaterdisposal through an effective marine outfall is an affordable,effective, and reliable solution that is simple to operate andwith minimal health and environmental impacts [1]. Modernwastewater treatment plants build a sufficiently long outfallpipeline for continuous discharges of treated wastewatersinto the open sea. Underwater seabed excavation is thereforeneeded to establish a channel for laying and burying asubmerged outfall pipeline, where the unwanted dredgedmaterial is disposed of at sea. The bar channel’s length couldbe more than 1 km offshore, and the diameter of the pipe tobe buried in the channel could be as large as up to 1.5m.
In the shallow near-shore region, less than 400m fromthe shoreline, a mechanical dredger is usually used to removethe soil by scooping it with buckets from the seabed andplacing it onto a waiting flat barge. Once the barge is full,it will transport the collected materials to a designateddisposal site, where the dredged (suspended) sediment isdischarged from the bottom of the barge. With the usage
of two or more disposal barges, dredging operations canproceed continuously, only interrupted by changing bargesor moving the dredger. However, since these mechanicaldredgers are mounted on a large barge and are towed tothe dredging site, they are not well suited for areas of roughseas. Therefore, in the far offshore region more than 400maway from the shore, the side-casting disposal of dredgedsediment is adopted, where the dredgedmaterials taken fromthe seabed are directly discharged overboard to the sidethrough an elevated discharge pipe into the sea surface.
The main environmental concerns for the underwaterchannel excavation and discharging dredged materials incoastal waters are associated with suspended sediments andincreases in turbidity, which may result in an extendedreduction in light penetration into the water column [2–7]. In general, however, these effects are short term andconfined to the near field. Turbidity represents a complexcomposite of several variables that collectively influence thetransparency of water. Frequently, as it may also containplankton and microorganisms, it is poorly correlated withmeasurements of suspended solids [8]. The environmental
Hindawi Publishing CorporationInternational Journal of OceanographyVolume 2016, Article ID 8097861, 10 pageshttp://dx.doi.org/10.1155/2016/8097861

2 International Journal of Oceanography
effects of dredging aremainly dependent onwhere the spoil isdeposited, and since temporarily suspended sediment plumesaremixed and dispersed by tidal currents, one of the purposesof the discharges is to make sure that dredged sedimentsare not deposited back to the bar channel. The particle sizeof sediments is of importance in understanding their likelyimpact in coastal waters. For example, sand particles settlequickly (the fall velocity of sand is about 31mm/s comparedto that of fine silt being 0.026mm/s) and are unlikely tomove from the disposal site unless subject to extremely strongcurrents. Muddy sediment (up to fine silt size) in turbidityplumes is expected to settle more slowly, and this dredgedparticle could remain in suspension and be carried for morethan 20 km downstream of the discharge point [2, 4, 6, 7].
The aim of this paper is to study the dispersion of dredgedplume discharges during the seabed dredging work for layingand burying sea outfall pipelines. CORMIX-GTS (v9.0)simulations are carried out to assess the impact of dredging-induced turbidity plumes on the marine environment. Thefirst simulation sets correspond to side-casting (near-shore)discharges at 400m offshore with a shallow water depth of3.5m, the second sets correspond to (midshore) dischargesat 800m offshore with a water depth of 7.0m, and the thirdsets correspond to (far-shore) discharges at 1200m with adeeper water depth of 10.5m, where the dredged sedimentsare released through a single port at 1m above the sea surface.
2. CORMIX Mixing Zone Model
The CORMIX modelling package (http://www.cormix.info/)is a software system for the analysis, prediction, and designof marine outfall mixing zones resulting from a continuouspoint discharge of effluents into open coastal waters [9]. Itemploys an easy-to-use rule-based expert system to screeninput data and check for consistency and selects the appro-priate hydrodynamic model to simulate the physical mixingprocesses likely to be present for many complex flow patternswithin a given discharge-environment interaction (e.g., seeFigure 1). Efficient computational algorithms provide sim-ulation results in seconds for mixing zone problems withspatial scales of meters to kilometers. Extensive comparisonwith available field and laboratory data has shown that theCORMIX system predictions on plume concentrations (withassociated plume geometries) are reliable for the majority ofcases [10, 11].
The hydrodynamic flow classification schemes in theCORMIX system are developed based on dimensional anal-ysis arguments as the detailed methods for modelling thedynamics of effluent discharges in complex physical situ-ations are not available. Using the user input parameters,CORMIX classifies the flow class of the effluent discharge inthe receiving water body based on the relative magnitudes oflength scales (e.g., see Figure 1). These length scales, whichmeasure the influence of each potential mixing process dueto momentum flux and buoyancy of the discharge in relationto boundary interactions, are then used to predict steady-state mixing zone characteristics and plume dynamics suchas free jets, shoreline-attached jets, wall jets, and upstream
intruding plumes [9, 10]. The model system has the ability tocapture the key stages of effluent plume evolution: (i) in thenear field region, where jet/plume dynamics are dominatedby the momentum of the discharge; (ii) in the buoyantspreading region, where the buoyancy of the effluent streamis dynamically important; and (iii) in the ambient spreadingregion, where full vertical mixing has occurred and theeffluent plume is controlled by the ambient flow.
CORMIX-GTS has advanced tools for suspended sedi-ment (dredge sediments option) that extends the capabilityof CORMIX to simulate the initial mixing and dispersionof dredge sediment discharge, which includes side-castingsurface discharge of sediments [11], and the (hydrodynamicmodule) DHYDRO simulates dense suspended sedimentdischarges (submerged, surface, and above surface) from asingle port. CORMIX-GTS was developed in part throughcooperation with the US EPA, the US Army Corps ofEngineers, and the US Bureau of Reclamation [12].
The model includes the Stokes effect of particle settlingon plume behaviour, with emphasis on the resulting plumedensity current, and accounts for the settling of five particlesize classes, when using the default dredge sediments option[9, 11]: chunks: large, nonsuspended solids and stones whichwill separate out immediately from the plume; sand: sus-pended particles with settling velocity 0.031m/s; coarse silt:suspended particles with settling velocity 0.42×10⁻³m/s; finesilt: suspended particles with settling velocity 0.26×10⁻⁴m/s;and clay: suspended particles with settling velocity 0.65 ×10⁻⁶m/s. For the shallow water depth of 3.5m, the settling
time for sand particles is about 2minutes, for coarse silt about2.3 hours, for fine silt about 1.6 days, and for clay particlemorethan 62 days.
3. Near-Shore Discharges at400 m from the Shoreline
The input data for the (above surface) side-casting dischargeof dredge sediments at a distance of 400m from the shorelineare summarized in Table 1, where the dredged sedimentswith a (total) concentration of 200 kg/m3 (set as 100%) aredischarged overboard of the barge through an elevated (45∘inclined) pipe at 1m above the sea surface to an unbounded,uniform sloping bed coastal environment. According to theparticle sizes, this initial dredge sediment discharge consistsof sand 20 kg/m3, coarse silt 40 kg/m3, fine silt 60 kg/m3, andclay 80 kg/m3. For the impact assessment study of effluentdischarges in the marine environment, the region of interestswould be a circular distance up to 500m around the outfalldischarge, and thus the CORMIX-GTS base simulation willbe terminated at 1000m downstream (in the ambient flowdirection, 𝑥-axis). The ambient density is calculated at atemperature of 30∘C (with a seawater salinity of 38 ppt), andsimilarly, using total sediment concentration of 200 kg/m3,CORMIX calculates the effluent sediment density to be1146.7 kg/m3. Since the effluent density is greater than thesurrounding water density 1023.98 kg/m3, the resuspended

International Journal of Oceanography 3
Flow classificationNear-surface negatively buoyant
discharges in uniform density layer
Verticalangle
angle
ShallowDeepShallow layerwith strongmomentum
Momentum
Momentum
Momentum
Weakly buoyantbuoyant
Weaklybuoyant
Weaklybuoyant
Buoyancy
Buoyancy
Buoyancy
Buoyancy
Co-fl
ow
Cross-flow
Counter-flow
Plan
Plan
Plan
Plan
layerlayer
StronglybuoyantStrongly
buoyantStrongly
Momentumdominatesdominates
Buoyancydominates
Buoyancydominates
Momentumdominates
Momentumdominates
Deep layerwith weak
momentum
(Near) vertical (Near) horizontal
Hor.
1200m 400m800moffshoreoffshoreoffshore
<1
<1
<1
<1
<1<1
<1 <1
<1
<1
<1
<1
>1
>1
>1
>1 >1
>1
>1
>1
>1
>1
−90∘ < < −45∘ > −45∘
<45
∘
≥45∘
≤135∘
>135 ∘
II
II
Lm
Hs
Lb
Hs
Lb
Hs
Lb
Hs
LM
Hs
LM
Hs
LM
Hs
Lm
Hs
LM
Hs
LT
Hs
Hs
LT
Hs
IV1 IV2 IV3 IV4 IV5 IV6 IH1 IH2 IH3
IH4-0
IH5-0
IH4-90
IH5-90
IH4-180
IH5-180
“H”“V”
𝜃
𝜃
𝜃
𝜎
Figure 1: CORMIX flow classification for single port discharge in a uniform density layer [9].
Table 1: Input data for the CORMIX-GTS base simulations of dredge sediment discharges.
Parameter Side-casting discharge UnitAmbient (unbounded environment)
Velocity of the currents 0.3 0.5 0.6 m/sDepth at discharge 3.5 7.0 10.5 mWind speed 3 m/s(Single) bottom slope 0.5 ∘
Temperature 30 ∘CSalinity 38 ppt(Uniform) density 1023.98 kg/m3
Discharge (single port)Distance to nearest (right) bank 400 800 1200 mPort diameter 0.5 mPort height above the surface 1.0 mTheta = vertical angle 45 ∘
Sigma = horizontal angle 90 ∘
Sediment = effluent flow rate 0.5 m3/sEffluent density 1146.7 kg/m3
Effluent (dredge sediment)Concentration 200 (= 100%) kg/m3
Chunks (nonsuspended sediments > 2mm) 0 %Sand (suspended sediments 0.062–2mm) 10 %Coarse silt (suspended sediments 0.016–0.062mm) 20 %Fine silt (suspended sediments 0.004–0.016mm) 30 %Clay (suspended sediments < 0.004mm) 40 %

4 International Journal of Oceanography
0 100 200 300 400 500
Distance X (m)
Fine silt
Total
Coarse silt
Clay0.2
0.4
0.6
0.8
1.0C
once
ntra
tion
(kg/
m3)
(a)
0 100 200 300 400 500
Distance X (m)
Fine silt
TotalCoarse silt
Clay
0.2
0.4
0.6
0.8
1.0
Mas
s flux
rem
aini
ng (%
)
(b)
Figure 2: CORMIX-GTS simulations of near-shore discharges of dredge sediment at 400m from the shoreline: (a) suspended sedimentdistribution (in the ambient flow direction) up to 500m downstream from the discharge position and (b) sediment concentration (in %)remaining in the suspension.
sediment (dense) plume is negatively buoyant and eventuallysinks at the seabed.
To account for any lateral displacement from the dis-charge pipe to the point of entry at the water surface,CORMIX recomputed an additional distance travelled by theeffluent discharge as 1.21mwith a vertical angle at entry −69∘.The new discharge position is thus set at 401.21m from theshoreline. CORMIX classifies this kind of sediment flow asthe flow class IV5 [9], a (surface) negatively buoyant flow ina (shallow) uniform density layer corresponding to the waterdepth 3.51m. This discharge configuration is claimed to behydrodynamically stable, and as the initial jet-like dischargeis weakly deflected by the ambient current into the flow direc-tion, but due to the strong discharge buoyancy, the slightlybent over plume rapidly sinks to the sloping bed and impingeson the seabed within 21.84m downstream (below the entrypoint). Impingement is a complex three-dimensional process,with more or less radial spreading, where the sedimentaccumulation of bottom deposit is formed [11]. Thereafter, asthe suspended muddy plume loses its buoyancy by particledeposition at seabed, the plume continues to spread laterallyas a bottom density current at the seabed while it is beingadvected by the ambient current, resulting in thinning of theplume and increased nonlinear lateral spreading.
After the sediment deposition at seabed, the muddyplume starts to resuspend with an initial mass flux remain-ing of 0.72% carrying a total suspended concentration of0.22 kg/m3, which mainly consists of coarse silt 0.05 kg/m3,fine silt 0.07 kg/m3, and clay 0.10 kg/m3. As shown in Figure 2,the total suspended concentration is increased in a shortdistance, reaches a maximum value of 0.83 kg/m3, and thendisperses downstream.Thedominant particle sizes in the sus-pended plume are clay, fine silt, and coarse silt, as representedin CORMIX-GTS by the sediment mass flux remaining, and,at the end of simulation (1000m downstream), there is claywith more than 0.27%, fine silt with 0.26%, and coarse siltwith 0.13%.
The (total) concentration contours of the simulated sus-pended sediment plume are shown in Figure 3 at 100mintervals. The total concentration is steadily reducing (afterloss of suspended particles by settling) from 0.79 kg/m3 at
0 100 200 300 400 500 600
Distance X (m)−100
−40
10
60
110
160
210
Dist
ance
Y(m
)
0.540.58
0.63
0.69
0.79
Figure 3: Contours of the suspended sediment concentration (inkg/m3) as simulated by CORMIX-GTS following discharge at 400moffshore.
100m to 0.54 kg/m3 at 500m downstream, and eventually itreaches a value of 0.42 kg/m3 at 1000m downstream (end ofsimulation). The lateral spreading of the contour centerlineat 100m is 61m, and it is increased to 174m at 500mdownstream.
A sensitivity analysis is carried out to address CORMIXmodel performance due to inherent uncertainty in the inputdata [13]. First, to investigate the uncertainty in sea condi-tions, iterative simulations were carried out by varying theambient velocity, while holding the other input parametersthe same as the base simulation given in Table 1. TheCORMIX-GTS simulation results for increasing the ambientvelocity values from 0.2 to 0.7m/s are presented in Table 2,where there is flow class change from IV5 to IV4 for velocitieslarger than 0.6m/s. As the velocity values are reduced from0.55m/s, the size of bed deposition region increases and thereare less particles resuspended. The flow class IV4 is classifiedas hydrodynamically unstable in CORMIX system [9, 11], asthemomentumflux dominates and there is weak buoyancy ofthe discharge. The flow becomes unstable after impingementand forms a recirculating region immediately downstreamover the full (shallow) water depth.The simulation results forflow class IV4 show overall higher sediment concentrationsthan that of class IV5.
The end of the (total) sediment concentration sharp drop(due to the initial seabed impingement) as shown in Figure 2

International Journal of Oceanography 5
Table 2: Summary of CORMIX-GTS iterative simulations results on varying the ambient velocity for discharges at 400m offshore.
Ambientvelocity(m/s)
Flow classInitial resuspension 100m 500m 1000m
At(m)
Total(kg/m3)
Clay(kg/m3)
Total(kg/m3)
Clay(kg/m3)
Total(kg/m3)
Clay(kg/m3)
Total(kg/m3)
Clay(kg/m3)
0.2 IV5 24.95 0.06 0.03 0.37 0.18 0.28 0.14 0.23 0.130.25 IV5 23.03 0.13 0.06 0.56 0.26 0.41 0.20 0.33 0.170.3 IV5 21.84 0.22 0.10 0.79 0.36 0.54 0.26 0.42 0.210.35 IV5 21.02 0.36 0.16 1.07 0.49 0.68 0.33 0.50 0.250.4 IV5 20.46 0.61 0.27 1.44 0.65 0.82 0.39 0.58 0.290.45 IV5 19.97 1.06 0.46 1.94 0.87 0.98 0.47 0.67 0.330.5 IV5 19.54 2.01 0.85 2.69 1.20 1.24 0.59 0.81 0.410.55 IV5 19.58 3.30 1.38 4.25 1.91 1.85 0.89 1.18 0.610.6 IV4 22.91 14.11 6.06 12.68 5.79 5.35 2.76 3.34 1.900.65 IV4 23.30 14.83 6.36 13.26 6.06 5.59 2.88 3.49 1.970.7 IV4 23.60 15.40 6.59 13.82 6.31 5.83 3.00 3.64 2.05
y
x
𝜎
Ambient flow
Figure 4: Diagram of the horizontal angle of discharge.
is referred to as the initial resuspension of sediment (inTable 2), and the subsequent suspended sediment concen-trations are also reported at 100m and 500m downstreamand finally at the end of CORMIX-GTS simulation at 1000mdownstream.
Next, the iterative CORMIX-GTS simulations were car-ried out to investigate the uncertainty in single port positionby varying the horizontal angle of discharge 𝜎 from 0 to 135∘,while holding the other input parameters the same as the basesimulation given in Table 1 (and CORMIX system reportsunstable configuration for angles bigger than 135∘) [9]. Assketched in Figure 4, the port’s horizontal angle of dischargeis defined as the angle measured counterclockwise from thedirection of ambient velocity (𝑥-axis) to the plan projectionof the port (centerline), and thus, a coflow discharge (in theambient flow direction) refers to the port position when 𝜎 =0∘, a cross-flow discharge (in the direction perpendicular tothe ambient flow) when 𝜎 = 90∘, and a counterflow dischargewhen 𝜎 = 180∘. Ideally, a counterflow discharge in theopposite direction of the ambient current velocity should beavoided.
The CORMIX-GTS simulation results for increasing thehorizontal angle of discharge values from 0 to 135∘ arepresented in Table 3, where there are no changes in the flow
class IV5 reported. For this shallow water depth, CORMIXextends the specification of the counterflow discharges from𝜎 = 120
∘, and thus the CORMIX (steady-state) results forboth 𝜎 = 120∘ and 𝜎 = 135∘ are unrealistic and shouldbe ignored. Similarly, CORMIX also specifies the coflowdischarges for 𝜎 ≤ 30∘, and the prediction is that muddysuspended plumes are more elongated (in the ambient flowdirection) with less dispersion. It is suggested that CORMIXpreferred horizontal angle of discharge is between 30∘ and105∘.
4. Midshore Discharges at800 m from the Shoreline
The input data for the CORMIX-GTS base simulation for theside-casting dredge sediment discharge through an elevated(45∘ inclined) pipe at 1m above the sea surface at a distance of800m from the shoreline are summarized in Table 1. Similarto the previous discharge of sediment at 400m offshore,CORMIX recomputed the discharge conditions at entry pointat the water surface to account for any lateral displacementand sets a new discharge position at 801.21m from theshoreline with a vertical discharge angle −69∘. The sedimentflow is classified as the flow class IV2, a (surface) negativelybuoyant flow in a (deep) uniformdensity layer correspondingto the water depth 7.01m [9]. The initial jet-like dischargein weak cross-flow is deflected by the ambient current andslowly sinks to the sloping bed. Deposition of sediments isoccurring on the seabed within 23.79m downstream (belowthe entry point), and, thereafter, as the suspended plume losesits buoyancy by particle settling, the muddy plume continuesto spread laterally as a bottom density current at the seabedwhile it is being advected by the ambient current.
After sedimentation at the seabed (mainly due to theinitial mass of larger sediment particles settling), the plumestarts to resuspend with an initial mass flux remain-ing of 4.87% carrying a total suspended concentration of7.64 kg/m3, which mainly consists of sand 0.33 kg/m3, coarsesilt 1.61 kg/m3, fine silt 2.44 kg/m3, and clay 3.26 kg/m3. As
6 International Journal of Oceanography
Table 3: Summary ofCORMIX-GTS iterative simulations results on varying the horizontal angle of discharge for discharges at 400moffshore.
Sigma(degrees) Flow class
Initial resuspension 100m 500m 1000mat(m)
Total(kg/m3)
Clay(kg/m3)
Total(kg/m3)
Clay(kg/m3)
Total(kg/m3)
Clay(kg/m3)
Total(kg/m3)
Clay(kg/m3)
0 IV5 22.12 3.76 1.58 4.12 1.86 1.70 0.84 1.07 0.5815 IV5 21.91 3.61 1.52 4.11 1.86 1.71 0.85 1.07 0.5830 IV5 21.27 3.46 1.45 4.13 1.86 1.73 0.86 1.09 0.5945 IV5 30.99 0.23 0.11 0.67 0.31 0.42 0.20 0.32 0.1660 IV5 29.24 0.23 0.10 0.70 0.31 0.45 0.21 0.34 0.1775 IV5 26.25 0.22 0.10 0.72 0.33 0.49 0.23 0.37 0.1990 IV5 21.84 0.22 0.10 0.79 0.36 0.54 0.26 0.42 0.21105 IV5 15.94 0.22 0.10 0.87 0.41 0.63 0.31 0.50 0.26120 IV5 9.40 0.21 0.09 0.74 0.34 0.35 0.17 0.21 0.11135 IV5 8.98 0.21 0.09 0.70 0.32 0.37 0.18 0.23 0.12
0 100 200 300 400 500
Distance X (m)
Fine silt
Total
Coarse silt
Clay
SandCon
cent
ratio
n (k
g/m
3)
8
6
4
2
10
(a)
0 100 200 300 400 500
Distance X (m)
2
4
6
8
10
Mas
s flux
rem
aini
ng (%
)
Total
Coarse silt
Clay
Sand
(b)
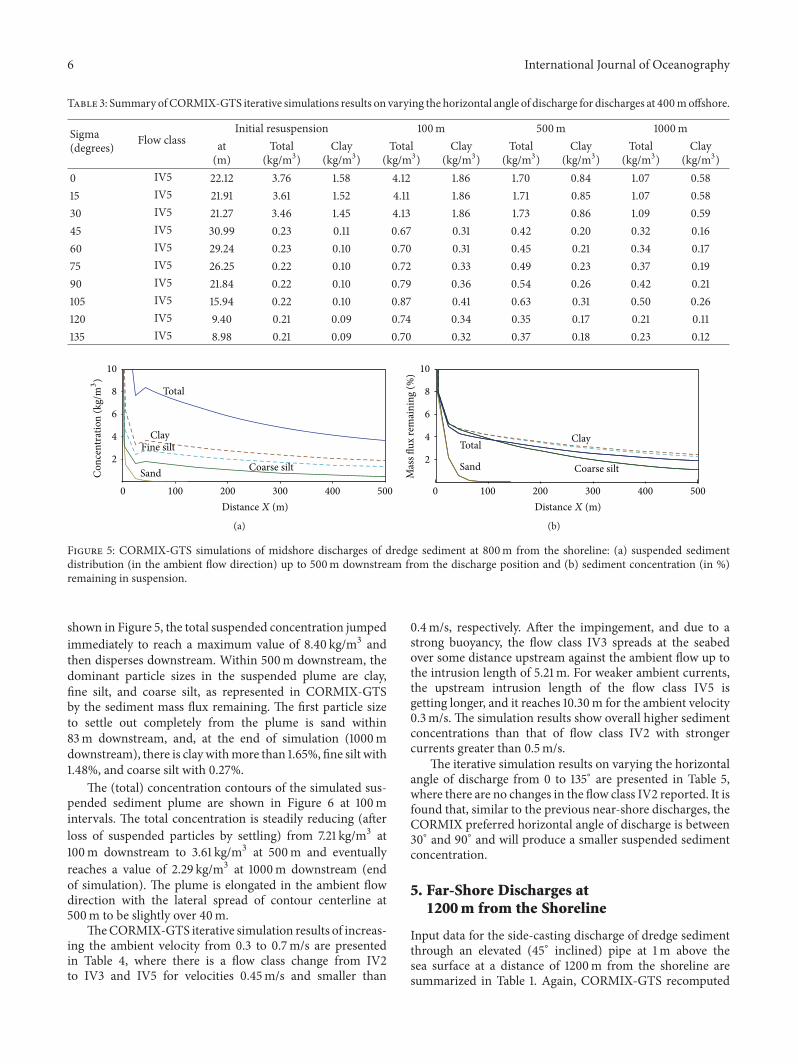
Figure 5: CORMIX-GTS simulations of midshore discharges of dredge sediment at 800m from the shoreline: (a) suspended sedimentdistribution (in the ambient flow direction) up to 500m downstream from the discharge position and (b) sediment concentration (in %)remaining in suspension.
shown in Figure 5, the total suspended concentration jumpedimmediately to reach a maximum value of 8.40 kg/m3 andthen disperses downstream. Within 500m downstream, thedominant particle sizes in the suspended plume are clay,fine silt, and coarse silt, as represented in CORMIX-GTSby the sediment mass flux remaining. The first particle sizeto settle out completely from the plume is sand within83m downstream, and, at the end of simulation (1000mdownstream), there is clay withmore than 1.65%, fine silt with1.48%, and coarse silt with 0.27%.
The (total) concentration contours of the simulated sus-pended sediment plume are shown in Figure 6 at 100mintervals. The total concentration is steadily reducing (afterloss of suspended particles by settling) from 7.21 kg/m3 at100m downstream to 3.61 kg/m3 at 500m and eventuallyreaches a value of 2.29 kg/m3 at 1000m downstream (endof simulation). The plume is elongated in the ambient flowdirection with the lateral spread of contour centerline at500m to be slightly over 40m.
TheCORMIX-GTS iterative simulation results of increas-ing the ambient velocity from 0.3 to 0.7m/s are presentedin Table 4, where there is a flow class change from IV2to IV3 and IV5 for velocities 0.45m/s and smaller than
0.4m/s, respectively. After the impingement, and due to astrong buoyancy, the flow class IV3 spreads at the seabedover some distance upstream against the ambient flow up tothe intrusion length of 5.21m. For weaker ambient currents,the upstream intrusion length of the flow class IV5 isgetting longer, and it reaches 10.30m for the ambient velocity0.3m/s. The simulation results show overall higher sedimentconcentrations than that of flow class IV2 with strongercurrents greater than 0.5m/s.
The iterative simulation results on varying the horizontalangle of discharge from 0 to 135∘ are presented in Table 5,where there are no changes in the flow class IV2 reported. It isfound that, similar to the previous near-shore discharges, theCORMIX preferred horizontal angle of discharge is between30∘ and 90∘ and will produce a smaller suspended sedimentconcentration.
5. Far-Shore Discharges at1200 m from the Shoreline
Input data for the side-casting discharge of dredge sedimentthrough an elevated (45∘ inclined) pipe at 1m above thesea surface at a distance of 1200m from the shoreline aresummarized in Table 1. Again, CORMIX-GTS recomputed

International Journal of Oceanography 7
Table 4: Summary of CORMIX-GTS iterative simulations results on varying the ambient velocity for discharges at 800m offshore.
Ambientvelocity(m/s)
Flow classInitial resuspension 100m 500m 1000m
At(m)
Total(kg/m3)
Clay(kg/m3)
Total(kg/m3)
Clay(kg/m3)
Total(kg/m3)
Clay(kg/m3)
Total(kg/m3)
Clay(kg/m3)
0.3 IV5 26.12 11.89 5.42 9.13 4.45 4.85 2.92 3.36 2.210.35 IV5 25.47 11.53 5.21 9.38 4.49 4.96 2.92 3.37 2.170.4 IV5 25.00 11.03 4.95 9.20 4.33 5.02 2.89 3.36 2.120.45 IV3 24.80 10.47 4.66 8.81 4.10 5.01 2.81 3.31 2.050.5 IV2 23.79 7.64 3.26 7.21 3.28 3.61 1.87 2.29 1.300.55 IV2 24.37 7.56 3.21 7.06 3.20 3.85 1.98 2.45 1.390.6 IV2 24.94 7.49 3.17 6.81 3.09 4.06 2.07 2.60 1.460.65 IV2 25.53 7.02 2.95 6.35 2.87 4.18 2.11 2.74 1.530.7 IV2 26.21 6.58 2.75 5.81 2.62 4.18 2.08 2.86 1.580.75 IV2 26.88 6.20 2.59 5.29 2.38 4.04 1.99 2.94 1.610.8 IV2 27.69 5.90 2.45 4.84 2.17 3.84 1.87 2.96 1.60
Table 5: Summary ofCORMIX-GTS iterative simulations results on varying the horizontal angle of discharge for discharges at 800moffshore.
Sigma(degrees) Flow class
Initial resuspension 100m 500m 1000mAt(m)
Total(kg/m3)
Clay(kg/m3)
Total(kg/m3)
Clay(kg/m3)
Total(kg/m3)
Clay(kg/m3)
Total(kg/m3)
Clay(kg/m3)
0 IV2 26.15 9.10 3.88 7.05 3.21 3.34 1.71 2.10 1.1915 IV2 26.04 8.58 3.65 6.93 3.15 3.34 1.71 2.11 1.1930 IV2 25.83 8.16 3.47 6.84 3.11 3.36 1.72 2.12 1.2045 IV2 25.49 7.84 3.34 6.81 3.09 3.39 1.74 2.14 1.2160 IV2 25.03 7.65 3.26 6.85 3.12 3.44 1.77 2.18 1.2375 IV2 24.46 7.58 3.23 6.48 3.18 3.51 1.81 2.23 1.2690 IV2 23.79 7.64 3.26 7.21 3.28 3.61 1.87 2.29 1.30105 IV2 23.12 7.82 3.34 7.51 3.42 3.72 1.93 2.36 1.35120 IV2 22.56 8.15 3.49 7.82 3.56 3.81 1.99 2.41 1.39135 IV2 22.15 8.71 3.74 8.14 3.71 3.87 2.02 2.44 1.41
0 100 200 300 400 500 600
Distance X (m)−100
Dist
ance
Y(m
)
3.614.134.845.83
7.21
−20
80
60
40
20
0
Figure 6: Contours of the suspended sediment concentration (inkg/m3) as simulated by CORMIX-GTS following discharge at 800moffshore.
the discharge conditions to account for any lateral displace-ment and set a new discharge position of 1201.21m fromthe shoreline with a vertical discharge angle −69∘ at entrypoint at the water surface. The sediment flow is classified
as the flow class IV1, a (surface) negatively buoyant flow ina (deep) uniform density layer corresponding to the waterdepth 10.51m [4]. The initial jet/plume in strong cross-flowis strongly deflected by the ambient current and rapidly fallstoward the sloping seabed within 30.38m downstream, andthe plume stays at the seabed due to its negative buoyancywith loss of suspended particles by sedimentation.Thereafter,the plume continues to travel downslope as a bottom densitycurrent at the seabedwhile it is being advected by the ambientcurrent.
As shown in Figure 7, the suspended sediment plumedisperses downstream with an initial mass flux remain-ing of 2.13% carrying a total suspended concentration of4.09 kg/m3, which mainly consists of sand 0.27 kg/m3, coarsesilt 0.84 kg/m3, fine silt 1.27 kg/m3, and clay 1.7 kg/m3. Similarto the previous sediment discharge at 800m offshore, thedominant particle sizes in the muddy suspended plume are,as represented in CORMIX-GTS by the sediment mass fluxremaining, clay, fine silt, and coarse silt. The first particlesize to settle out completely from the plume is sand within

8 International Journal of Oceanography
0 100 200 300 400 500
Distance X (m)
0
1
2
3
4
5C
once
ntra
tion
(kg/
m3)
Total
Coarse silt
Clay
Sand
Fine silt
(a)
0 100 200 300 400 500
Distance X (m)
Mas
s flux
rem
aini
ng (%
)
0
1
2
3
4
5
TotalCoarse silt
Clay
Sand
(b)
Figure 7: CORMIX-GTS simulations of far-shore discharges of dredge sediment at 1200m from the shoreline: (a) suspended sedimentdistribution (in the ambient flow direction) up to 500m downstream from the discharge position and (b) sediment concentration (in %)remaining in the suspension.
0 100 200 300 400 500 600
Distance X (m)−100
Dist
ance
Y(m
)
−10
40
30
20
10
0
2.612.792.983.193.49
Figure 8: Contours of the suspended sediment concentration(in kg/m3) as simulated by CORMIX-GTS following discharge at1200m offshore.
150m downstream and, at the end of simulation (1000mdownstream), there is clay withmore than 1.25%, fine silt with1.17%, and coarse silt with 0.44%.
The (total) concentration contours of the simulated sus-pended sediment plume are shown in Figure 8 at 100mintervals. The total concentration is steadily reducing (afterloss of suspended particles by settling) from 3.49 kg/m3 at100m to 2.61 kg/m3 at 500m downstream and eventuallyreaches a value of 1.86 kg/m3 at 1000m downstream (endof simulation). The plume is more elongated in the flowdirection with the lateral spread of the contour centerline at500m at slightly less than 20m, that is, half the width of theprevious midshore discharges.
TheCORMIX-GTS iterative simulation results of increas-ing the ambient velocity from 0.4 to 0.9m/s are presented inTable 6, where there is a flow class change from IV1 to IV3for velocities smaller than 0.4m/s. Due to strong buoyancyand weaker current, and, after the impingement, the flowclass IV3 spreads at the seabed over some distance upstreamagainst the ambient flow up to the intrusion length of 7.01m.As the current is increased from 0.45m/s, the size of thebed deposition region increases and there are less sedimentsresuspended.
Next, the iterative CORMIX-GTS simulations were car-ried out by varying the position of discharge from 0 to135∘. The results are presented in Table 7, where there areno changes in the flow class IV1 reported. Again, it is clear
that, for the near coflow discharges for 𝜎 ≤ 30∘, CORMIXpredictions are only slightly different, and, however, the nearcounterflow discharges for 𝜎 ≥ 105∘ should be avoided.
6. Conclusion
CORMIX-GTS simulations were run for three scenarios ofside-casting (above surface) discharges of seabed dredgesediments during an outfall dredging operation at 400m,800m, and 1200m from the shoreline, where the initialdredged seabed spoil consists of sand 20 kg/m3, coarse silt40 kg/m3, fine silt 60 kg/m3, and clay 80 kg/m3.Thedredging-induced turbidity plumes with a concentration of more than0.03 are visible from the surface.
CORMIX-GTS simulation results for discharges in thenear shore (at 400m from the shoreline) with a shallowwater depth of 3.5m show that most of the sedimentsare immediately deposited at the seabed due to the initialmomentum and buoyancy of discharge, and the muddyturbidity plumes with a concentration of less than 1 kg/m3of mainly coarse silt, fine silt, and clay are remained insuspension for large distances more than 500m downstream.For discharges in the far shore (at 1200m from the shoreline)with a deeper water depth of 10.5m, the results show thatbottom sedimentation is formed by sediments settling out,and the suspended sediment plumes are more elongated (inthe ambient flow direction) and carrying a concentration ofmore than 3 kg/m3 of coarse silt, fine silt, and clay. Therefore,if a suitable disposal site can be chosen from the regionalbathymetry of the coastline to absorb the accumulation ofbottom deposit, then discharges in the near shore are thepreferred and best option.
CORMIX-GTS simulations also predict that, for the nearcoflow discharges with the horizontal angle of discharge𝜎 ≤ 30
∘, the muddy suspended sediment plumes aremore elongated with less dispersion. The near counterflowdischarges for 𝜎 ≥ 105∘ (i.e., in the opposite direction of theambient velocity) should be avoided. It is suggested that theCORMIX preferred horizontal angle of discharge is between30∘ and 105∘.

International Journal of Oceanography 9
Table 6: Summary of CORMIX-GTS iterative simulations results on varying the ambient velocity for discharges at 1200m offshore.
Ambientvelocity(m/s)
Flow classInitial resuspension 100m 500m 1000m
At(m)
Total(kg/m3)
Clay(kg/m3)
Total(kg/m3)
Clay(kg/m3)
Total(kg/m3)
Clay(kg/m3)
Total(kg/m3)
Clay(kg/m3)
0.4 IV3 28.06 5.81 2.57 5.00 2.29 3.20 1.71 2.13 1.260.45 IV1 26.99 4.96 2.09 4.35 1.96 2.42 1.21 1.55 0.850.5 IV1 27.97 4.74 1.99 4.11 1.85 2.56 1.27 1.67 0.910.55 IV1 29.15 4.49 1.88 3.83 1.72 2.64 1.30 1.78 0.960.6 IV1 30.38 4.09 1.70 3.49 1.55 2.61 1.26 1.86 0.990.65 IV1 31.65 3.77 1.56 3.11 1.38 2.44 1.17 1.89 0.990.7 IV1 33.04 3.48 1.44 2.80 1.23 2.26 1.07 1.85 0.960.75 IV1 34.48 3.19 1.31 2.55 1.12 2.08 0.98 1.78 0.900.8 IV1 35.95 2.94 1.21 2.36 1.03 1.93 0.90 1.68 0.840.85 IV1 37.60 2.73 1.12 2.23 0.97 1.80 0.83 1.59 0.780.9 IV1 39.25 2.55 1.04 2.10 0.91 1.69 0.78 1.50 0.73
Table 7: Summary of CORMIX-GTS iterative simulations results on varying the horizontal angle of discharge for discharges at 1200moffshore.
Sigma(degrees) Flow class
Initial resuspension 100m 500m 1000mAt(m)
Total(kg/m3)
Clay(kg/m3)
Total(kg/m3)
Clay(kg/m3)
Total(kg/m3)
Clay(kg/m3)
Total(kg/m3)
Clay(kg/m3)
0 IV1 28.06 3.97 1.65 3.31 1.48 2.47 1.19 1.78 0.9415 IV1 26.99 3.94 1.63 3.28 1.45 2.45 1.18 1.77 0.9430 IV1 27.97 3.91 1.62 3.24 1.44 2.44 1.18 1.77 0.9445 IV1 29.15 3.88 1.61 3.24 1.44 2.44 1.18 1.78 0.9460 IV1 30.38 3.89 1.61 3.28 1.46 2.47 1.19 1.80 0.9575 IV1 31.65 3.96 1.64 3.36 1.50 2.52 1.22 1.82 0.9790 IV1 33.04 4.09 1.70 3.49 1.55 2.61 1.26 1.86 0.99105 IV1 34.48 4.27 1.78 3.67 1.64 2.69 1.31 1.91 1.02120 IV1 35.95 4.49 1.87 3.86 1.73 2.79 1.36 1.95 1.05135 IV1 37.60 4.75 1.98 4.06 1.81 2.88 1.41 1.98 1.07
One major inherent limitation in the CORMIX system isthe representation of the coastal environment as a uniformlysloping cross section channel where the ambient velocityis assumed to be uniform. Another limitation is the flowclassification based on hydrodynamic criteria using lengthscale analysis, where the subsequent simulation is carried outwithout detailed numerical analysis and computation. Forexample, as shown in Table 2, a slight variation in the inputparameters may result in different flow classes. The steady-state sediment depositing density current on a sloping bed isused for the calculation, and the effect of ambient cross-flowis ignored.
Conflict of Interests
The authors declare that there is no conflict of interestsregarding the publication of this paper.
References
[1] P. J. W. Roberts, H. J. Salas, F. M. Reiff, M. Libhaber, A. Labbe,and J. C. Thomson,Marine Wastewater Outfalls and TreatmentSystems, IWA Publishing, Amsterdam, The Netherlands, 2010.
[2] C.-H. Je, D. F.Hayes, andK.-S. Kim, “Simulation of resuspendedsediments resulting from dredging operations by a numericalflocculent transport model,” Chemosphere, vol. 70, no. 2, pp.187–195, 2007.
[3] D. D. Shao, A. Purnama, and T. Sun, “Modeling the temporalevolution of dredging-induced turbidity in the far field,” Journalof Waterway, Port, Coastal, and Ocean Engineering, vol. 141, no.5, Article ID 04015001, 2015.
[4] R. N. Bray, Environmental Aspects of Dredging, Taylor & Francis,London, UK, 2008.
[5] A. Y. Kuo and D. F. Hayes, “Model for turbidity plume inducedby bucket dredge,” Journal ofWaterway, Port, Coastal andOceanEngineering, vol. 117, no. 6, pp. 610–623, 1991.

10 International Journal of Oceanography
[6] J. Roman-Sierra, M. Navarro, J. J. Munoz-Perez, and G. Gomez-Pina, “Turbidity and other effects resulting from Trafalgarsandbank dredging and Palmar beach nourishment,” Journal ofWaterway, Port, Coastal and Ocean Engineering, vol. 137, no. 6,pp. 332–343, 2011.
[7] G. F. Wu, J. de Leeuw, A. K. Skidmore, H. H. T. Prins, and Y.L. Liu, “Concurrent monitoring of vessels and water turbidityenhances the strength of evidence in remotely sensed dredgingimpact assessment,” Water Research, vol. 41, no. 15, pp. 3271–3280, 2007.
[8] C. L. Truitt, “Dredged material behavior during open-waterdisposal,” Journal of Coastal Research, vol. 4, no. 3, pp. 489–497,1988.
[9] R. L. Doneker and G. H. Jirka, CORMIX User Manual: AHydrodynamicMixing ZoneModel and Decision Support Systemfor Pollutant Discharges Into Surface Waters, MixZon, Portland,Ore, USA, 2007, http://www.cormix.info.
[10] G. H. Jirka, “Integral model for turbulent buoyant jets inunbounded stratified flows. Part I: single round jet,” Environ-mental Fluid Mechanics, vol. 4, no. 1, pp. 1–56, 2004.
[11] R. L. Doneker, J. D. Nash, and G. H. Jirka, “Pollutant transportand mixing zone simulation of sediment density currents,”Journal of Hydraulic Engineering, vol. 130, no. 4, pp. 349–359,2004.
[12] USEPA, “Review of the D-CORMIX model,” Science AdvisoryBoard Report EPA-SAB-EC-99-011, USEPA, Washington, DC,USA, 1999, http://www.epa.gov/science1/ec99011.pdf.
[13] I. Alameddine and M. El-Fadel, “Brine discharge from desali-nation plants: a modeling approach to an optimized outfalldesign,” Desalination, vol. 214, no. 1–3, pp. 241–260, 2007.

Submit your manuscripts athttp://www.hindawi.com
Hindawi Publishing Corporationhttp://www.hindawi.com Volume 2014
ClimatologyJournal of
EcologyInternational Journal of
Hindawi Publishing Corporationhttp://www.hindawi.com Volume 2014
EarthquakesJournal of
Hindawi Publishing Corporationhttp://www.hindawi.com Volume 2014
Hindawi Publishing Corporationhttp://www.hindawi.com
Applied &EnvironmentalSoil Science
Volume 2014
Mining
Hindawi Publishing Corporationhttp://www.hindawi.com Volume 2014
Journal of
Hindawi Publishing Corporation http://www.hindawi.com Volume 2014
International Journal of
Geophysics
OceanographyInternational Journal of
Hindawi Publishing Corporationhttp://www.hindawi.com Volume 2014
Journal of Computational Environmental SciencesHindawi Publishing Corporationhttp://www.hindawi.com Volume 2014
Journal ofPetroleum Engineering
Hindawi Publishing Corporationhttp://www.hindawi.com Volume 2014
GeochemistryHindawi Publishing Corporationhttp://www.hindawi.com Volume 2014
Journal of
Atmospheric SciencesInternational Journal of
Hindawi Publishing Corporationhttp://www.hindawi.com Volume 2014
OceanographyHindawi Publishing Corporationhttp://www.hindawi.com Volume 2014
Advances in
Hindawi Publishing Corporationhttp://www.hindawi.com Volume 2014
MineralogyInternational Journal of
Hindawi Publishing Corporationhttp://www.hindawi.com Volume 2014
MeteorologyAdvances in
The Scientific World JournalHindawi Publishing Corporation http://www.hindawi.com Volume 2014
Paleontology JournalHindawi Publishing Corporationhttp://www.hindawi.com Volume 2014
ScientificaHindawi Publishing Corporationhttp://www.hindawi.com Volume 2014
Hindawi Publishing Corporationhttp://www.hindawi.com Volume 2014
Geological ResearchJournal of
Hindawi Publishing Corporationhttp://www.hindawi.com Volume 2014
Geology Advances in