research article performance of dual-axis solar tracker...
TRANSCRIPT
Hindawi Publishing CorporationInternational Journal of PhotoenergyVolume 2013 Article ID 820714 13 pageshttpdxdoiorg1011552013820714
Research ArticlePerformance of Dual-Axis Solar Tracker versus Static SolarSystem by Segmented Clearness Index in Malaysia
Jhee Fhong Lee12 Nasrudin Abd Rahim13 and Yusuf A Al-Turki3
1 UM Power Energy Dedicated Advanced Centre (UMPEDAC) University of Malaya 59990 Kuala Lumpur Malaysia2 Faculty of Engineering University of Malaya 50603 Kuala Lumpur Malaysia3 King Abdulaziz University Jeddah 21589 Saudi Arabia
Correspondence should be addressed to Jhee Fhong Lee wallacelee86gmailcom
Received 17 July 2013 Accepted 21 October 2013
Academic Editor Mahmoud M El-Nahass
Copyright copy 2013 Jhee Fhong Lee et alThis is an open access article distributed under the Creative Commons Attribution Licensewhich permits unrestricted use distribution and reproduction in any medium provided the original work is properly cited
The performance of Dual-Axis Solar Tracker (DAST) and Static Solar System (SSS) with respect to clearness index in Malaysia ispresented An attempt to investigate the correlation between clearness index with energy gain and efficiency of DAST over SSSis being done experimentally A good correlation could not be found out from the daily clearness index It is due to the moreprofound advantage of DAST in the morning and evening compared to midday as it is able to follow the sunrsquos position Hencethe daily clearness index is divided into three segments which are morning midday and evening to interpret the energy gain andefficiency better A clearer correlation with low standard deviation can be observed on the segmented clearness index analysis Theenergy gain and efficiency of seven cities in Malaysia is being estimated with the segmented clearness index and compared to theresult generated from anisotropic radiation model A similar trend is obtained and it has shown that the segmented clearness indexcould be utilized as a graphical method for estimation of energy gain and efficiency of DAST over SSS
1 Introduction
Solar energy has gained tremendous attention in recent yearsdue to various reasons such as the fluctuating of the priceof crude oil awareness of public on environment issuessupporting policies and subsidies taken by local governmentto boost renewable energy sectors and price reduction ofphotovoltaic (PV) panels Many large-scale solar farms werecommissioned in USA Europe and China as the global PVprice is dropping rapidly in recent years which agrees withthe Swansonrsquos law [1] However the PV generated electricityis not competitively enough compared to fossil fuel (oil gasand coal) especially in urban areas Hence more intensiveresearch and development on PV cell material science arerequired in order to overleap the conversion efficiency hurdleand reduce the manufacturing cost Meanwhile there areseveral approaches available for increasing the performanceof PV system other than exploring on new material forPV cell For instance Maximum Power Point Tracking(MPPT) which able to draw maximum power by tracking
and operating on the maximum power point of the PV arrays[2] solar tracking that able to maximize the power capturedfrom sun by following the sun path [3] and so forth Aboveall solar tracking poses great advantage to enhance the PVsystem efficiency as compared to a static solar system [4]Dual-Axis Solar Tracker (DAST) is a type of solar tracker withtwo rotational axes which enable it to align the PV panelsand point directly towards the solar disk at all times [3 5]Solar irradiance (Wm2) is a measure of amount of sunlightfall on a surface It is the most crucial factor in determiningthe performance of a PV panel The solar energy captured byPV panels is directly proportional with the solar irradiancereceived by PV panels With PV panels facing the sun at alltimes it ensures that maximum solar energy being convertedinto electrical energy during the course of the day Hencesubstantial gain can be obtained by using DAST comparedto Static Solar System (SSS)
From the literature various tracking methods have beenproposed and validated around the world in previous worksand each of them has its pros and cons in terms of efficiency
2 International Journal of Photoenergy
complexity and cost Figure 1 shows the minimum maxi-mum and average efficiency of some solar tracking worksbeing reported experimentally and by simulation in othercountries [6ndash18] Apparently the difference in solar trackingefficiency that varies greatly among the countries reporteddue to different geographic location local landscape andclimate [19] Moreover the efficiency of solar tracking in thesame region during different seasons also differs significantlyThe efficiency normally top in the summer with a marginalperformance in winter and the spring and fall have averageefficiency
Malaysia as a country which lies at 1∘ to 7∘ north ofequator has an equatorial climate and long hours of sunshinethroughout the year There are enormous potential for solarenergy to be successful at this land However the potentialfor the DAST is rarely reported and investigated in thisregion Hence a quantitative advantage of DAST over SSS inthis country still remains unknown although the consistentlylong sun hours suggested a promising outcome Thus itwould be one of the endeavors for this study to carry out aninvestigation on some of the cities inMalaysia regarding theirperformance enhancement for installation of DAST over SSSThe advantage on the financial perspective would also beanalyzed and a comparison can be made on the suitability forDAST installation on seven cities in Peninsular Malaysia
While having better efficiency over SSS the additionalcosts for the DAST could not be overlooked The trackingmechanism requires extra mechanical structure and motorsto rotate the PV panels according to the sunrsquos positionOperational and maintenance cost of the DAST will also behigher than SSS Hence estimation of the efficiencyenergygain of DAST over SSS is essential and need to be partof the site evaluation criteria As a rule of thumb thegain from the DAST over SSS would have to surpass theadditional costs whereby the profitability and sustainabilityof the DAST especially in large scale solar power plant areguaranteed However as shown in Figure 1 the reportedefficiency improvement can vary from as low as 10 to as highas 75The large variation ofDAST efficiency complicates theevaluation process for adopting DAST over SSS Besides thatperformance enhancement of DAST over SSS for an equatorregion as Malaysia is not being investigated so far
So far comparison of efficiency and energy gain of DASTover SSS has been done by physically installing both systemson the site of interest This method is not only expensivebut also time consuming since data over a sufficientlylong period of time is needed to facilitate a meaningfulcomparison between the two systems Moreover the resultsobtained are not directly applicable onto other sites Hencethere is a need for a method to estimate the gain of DASTover SSS in a more cost- and time-effective manner such thatthe site evaluation can be made more straightforward
Cruz-Peragon et al quantify the extra solar gain of DASTover SSS with respect to latitude of the cities in Spain basedon the Reindl anisotropic model and Liu amp Jordan isotropicmodel [20 21] Based on his finding the former method ismore useful and better represent the climate of Spain territoryas compared to isotropic model Most of the cities in Spainterritory are suitable for DAST while a few cities are not
recommended due to various reasons including high latitudehigh rainfall and coastal region
In this paper an attempt is made to correlate the perfor-mance enhancement of DAST based on the clearness indexof the sites in Malaysia Subsequently this correlation is usedto estimate the performance boost of DAST at seven cities inMalaysia
2 Literature Review
21 Clearness Index Clearness index is chosen as the solevariable in this work as it is derived from solar irradiancethe most fundamental factor that influences the performanceof a PV system Clearness index represents the ratio of theaverage global solar irradiation 119866 on a horizontal surface tothe extraterrestrial solar irradiation 119867
119900on the same surface
and given by the following Equations for daily and hourlyvalues respectively [22]
For daily
119870119879=119866
119867119900
(1)
For hourly
119896119879=119868119866
119868119900
(2)
The data of global solar radiation over a day and overan hour 119868
119866 are available from measurements of total solar
radiation on a horizontal surface by using a pyranometerThehourly clearness index function could be utilized to calculateclearness index for longer period by replacing the global solarradiation and extraterrestrial radiation for the desired periodinto (2) Meanwhile the extraterrestrial solar radiations 119867
119900
and 119868119900can be defined as the solar radiations incident on
a horizontal plane outside the atmosphere over a day anda designated period of time within a day respectively Inother words this is the sunlight reaching the ground of theearth without the presence of atmosphere The amount ofextraterrestrial radiation reaching the earth ground relies onthe relative position of the earth to the sun on its ellipticalorbit around the sun and the earth declination through thisorbit119867
119900and 119868119900can be calculated by using (3) as follows
119867119900=24 times 3600
120587119866SC [1 + 0033 cos(
360119899
365)]
times (cos120601 cos 120575 sin120596119904+120587120596119904
180sin120601 sin 120575)
119868119900=12 times 3600
120587119866SC [1 + 0033 cos(
360119899
365)]
times [ cos120601 cos 120575 (sin1205962minus sin120596
1)
+120587 (1205962minus 1205961)
180sin120601 sin 120575]
(3)
International Journal of Photoenergy 3
Jordan
Spain
Romania
Iraq
Estonia
MongoliaAvg 72
Mexico
Germany
Egypt Avg 62
UK
Syria Max 62
Taiwan Avg 245
Tajikistan Avg 30
Greece Avg 46510ndash2018ndash40
Max 23
10ndash40
Avg 28
176ndash383
35ndash75
326ndash487
Figure 1 Efficiency of solar tracker works reported around the world
Atmosphere scattering
Diffused
Ground-reflected
Diffused
AbsorbedBeam
Figure 2 The three components of global solar radiation
The parameters in the equations can be found in thenomenclature
119867119900from the sun passes through and is attenuated by
the atmosphere before reaching the surface on the earth as119866 Global solar irradiation consists of directbeam radiationdiffuse radiation and reflected radiation Beam radiation iscoming directly from the solar disk on a clear sky withoutbeing obstructed by the clouds while diffuse radiation isthe radiation found in cloudy day with the direct solar raybeing firstly scattered by molecules and particles on theclouds before reaching the solar panels There is also a verymeager amount of radiation reflected from the clouds andground surface namely reflected radiation The componentsof global solar radiation are illustrated in Figure 2
The clearness index is higher in a sunny day as the solarradiation is dominated by beam radiation and less energy lossthrough diffusion and reflection A higher clearness indexwill lead to a higher energy generated and efficiency forDAST Hence the relationship of clearness index with energygain and efficiency of DAST is quantified and investigatedexperimentally With the knowledge of the correlation itis able to offer an alternative guideline for evaluating theperformance enhancement of DAST to a specific site
Circumsolardiffused
Beam
Horizontal brighteningcomponent
Isotropicallydiffused
Figure 3 Circumsolar and horizon brightening components addedto the isotropic component in diffusion model [24]
22 Diffuse Radiation Model Diffuse radiation model isuseful for evaluating the global irradiation over tilted surfaceby using the global solar radiation over horizontal surfaceLiu and Jordan isotropic model [23] is widely used as it is thesimplest diffusion model for obtaining the global irradiationover tilted surface It assumes a uniform distribution ofthe ground-reflected radiation and sky-diffuse radiation onthe celestial hemisphere However its simplistic nature haslead to some weaknesses It neglected the contribution ofcircumsolar diffuse radiation and horizontal brightening tothe total diffused radiationThese two components contributea remarkable portion in the clear days Circumsolar diffusedradiation resulted from forward scattering of beam radiationandwasmainly concentrated in the part of the sky around thesolar disk
Meanwhile the horizon brightening component is con-centrated near the horizon and is most profound in clearskies [24] These additional components are schematicallyshown in Figure 3 Isotropic model tends to underestimatethe amount of diffuse radiation in clear skies which leads itinto poorer response in clear daysThus the whole estimatedirradiation can fall below the actual value from 3 to 9[23 24]
4 International Journal of Photoenergy
In order to have better estimation on the diffuse radiationanisotropic models has to be adopted as larger diffuse com-ponents such as circumsolar diffuse radiation and horizontalbrightening are taken into account By analyzing variousmethodologies of anisotropic models HDKR anisotropicmodel (Hay Davies Klucher Reindl model) [21] is foundto be fairly suitable as some correction factors are added toaccount for the horizon brightening on clear days as well ascloudiness
Anisotropic model considers that the radiation on thetilted surface is contributed by three components whichare beam anisotropic diffuse and solar radiation diffuselyreflected form the ground as in
119868119879= (119868119861+ 119868119863119860119894) 119877119861+ 119868119863(1 minus 119860
119894) (1 + cos120573
2)
times (1 + 119891sin3 (120573
2)) + 119868
119866120588(
1 minus cos1205732
)
(4)
Erbs et al correlation [25] in (5a) (5b) and (5c) makesit possible to obtain the isotropic diffuse component ofradiation 119868
119863 by using the clearness index 119896
119905at each timewhile
the beam radiation is then being found from the differencebetween global solar radiation over horizontal surface 119868
119866and
119868119863as in (6) Consider
119868119863
119868119866
= 10 minus 009119896119905 for 119896
119905le 022 (5a)
119868119863
119868119866
= 09511 minus 01604119896119905+ 4488119896
2
119905minus 16638119896
3
119905
+ 123361198964
119905for 022 lt 119896
119905le 08
(5b)
119868119863
119868119866
= 0165 for 119896119905gt 08 (5c)
119868119866= 119868119863+ 119868119861 (6)
Geometric factor 119877119861is the ratio of beam radiation on
tilted surface to that on a horizontal surface at any time[22] that can be obtained from (7) Anisotropy index 119860
119894
is a function of the transmittance of the atmosphere forbeam radiation A modulating factor 119891 is added into HDKRdiffusion model by Klucher to account for cloudiness of thesky as follows
119877119861=
cos 120579cos 120579119911
(7)
119860119894=119868119861
119868119900
(8)
119891 = radic119868119861
119868119866
(9)
Equation (10) is the angle of incidence of the solar beamradiation on a tilted surface which is one of the important
expressions to construct the anisotropic diffuse radiationmodel The solar radiation obtained from this model iscompared to the experimental result of the proposed DASTprototype The DAST prototype is using equatorial trackingsystem Photoresistors are used as the sensors to track theposition of the sun Hence angle of incidence of the solarbeam which is one of the elements of mathematical approachis not adopted for the solar tracking purpose of the proposedDAST prototype
120579119911is the angle of incidence of beam radiation on tilted
surface and solar zenith angle Consider
cos 120579 = sin 120575 sin120601 cos120573 minus sin 120575 cos120601 sin120573 cos 120574
+ cos 120575 cos120601 cos120573 cos120596
+ cos 120575 sin120601 sin120573 cos 120574 cos120596
+ cos 120575 sin120573 sin 120574 sin120596
(10)
cos 120579119911= cos120601 cos 120575 cos120596 + sin120601 sin 120575 (11)
In addition the albedo120588 (dimensionless) is the compositeground reflectance which is required to estimate the reflectedirradiance It normally takes a value of 02 except for the caseof snowy ground it would have a higher value 120573 is the slopeof the tilted surface and together with solar azimuth angle 120574would make sure that the PV system face the sunrsquos positionat all times The location latitude 120601 declination 120575 and Julianday 119899 are some additional variables to be considered in thismodel
120574 = sign (120596)10038161003816100381610038161003816100381610038161003816
cosminus1cos 120579119911sin120601 minus sin 120575
sin 120579119911cos120601
10038161003816100381610038161003816100381610038161003816
120575 = 2345 sin(360284 + 119899365
)
(12)
3 Experimental Setup
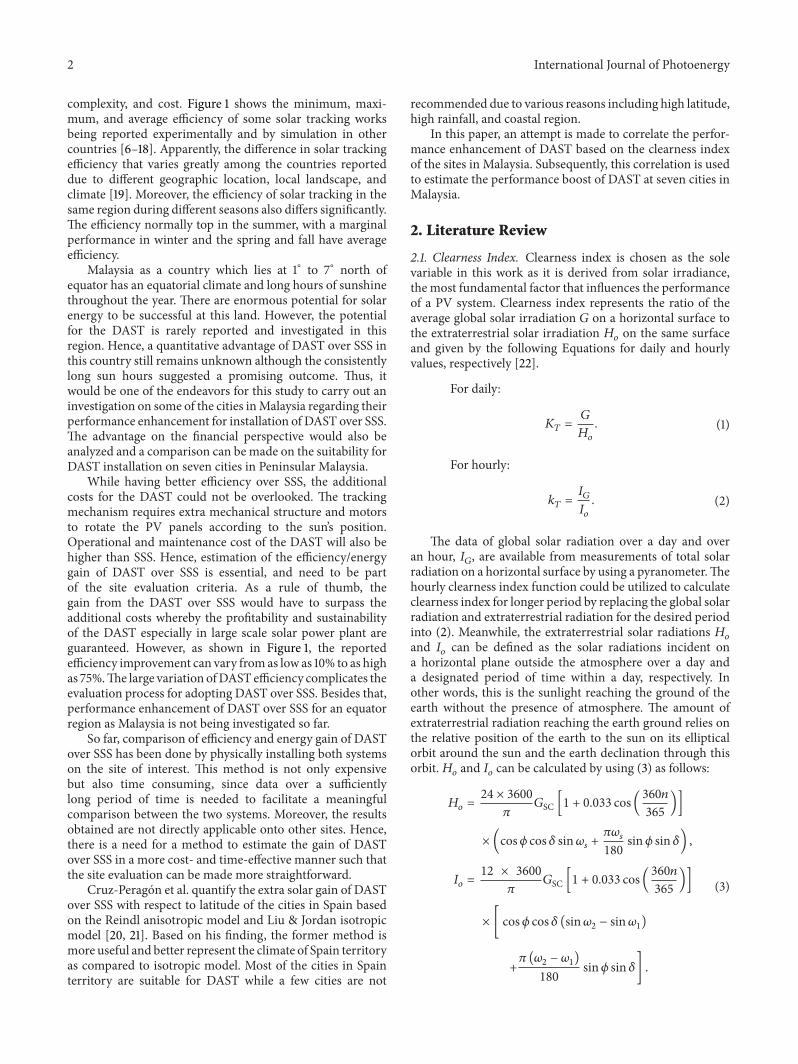
A Dual-Axis Solar Tracker (DAST) and a Static Solar System(SSS) with horizontal orientation are used in this experimentThe solar tracker has two axis of rotation which enable it torotate along the eastwest and northsouth axis The type ofDual-Axis Tracking System that is used in this research fallsinto the category of equatorial as categorized by Alexandru[26]The DAST proposed here is able to track the sun on twoindependent axes The hardware prototype of the DAST andits rotational axes are shown in Figure 4 The daily motionof the sun (from east at dawn to the west at dusk) is trackedby the DAST on first axis (axis ldquo1rdquo daily motion E EastW West) The rotational range of this axis is plusmn70∘ with theposition of solar noon as the reference position (0∘) Onthe other hand the seasonal variation of the Sun position istracked by the DAST via the second axis (axis ldquo2rdquo elevationN North S South) This axis has plusmn30∘ rotational rangefor tracking the altitude angle of sun during the differentseasonsThe reference (ldquozerordquo) positions for the angular fieldsof the two rotational axes is better illustrated by referringto Figure 5 Figure 5(a) shows the DAST on a horizontalposition at which both daily (eastwest) axis and elevation
International Journal of Photoenergy 5
(northsouth) axis on their reference (ldquozerordquo) position Thenormal of the PV panel is coincided with the zenith axisat this position and acts as the reference position of therotational ranges The individual reference positions androtational range of both axes are shown in Figures 5(b) and5(c) respectively The sun-tracking mechanism is based ontwo pairs of Photoresistors as sensors to locate the position ofthe sun Two direct-current (DC) linear actuators rotate thePV panel towards the sunrsquos position upon the signals frommicrocontroller The tracking is done on a fifteen-minute-basis as the sunmoves at a slow speed along the sun pathThecontrol technique adopted in the proposed DAST is a closed-loop (with photosensor) approach The DAST would trackthe sunrsquos position based on the light intensity received by thephoto-sensor As the movement of the sun is slow in naturecontinuous tracking of the sunrsquos position is not necessaryHence DAST tracks the sun once in every fifteen minutesIn other words the fifteen minutes is an interval betweenconsecutive tracking This main purpose of this approachis to reduce the power consumption for doing redundanttracking A Sanyo 210Watt Monocrystalline PV panel is usedin the DAST and static system respectively The technicalcharacteristics of the PV panel are shown in Table 5 In orderto make sure the PV panels on both systems are operating onthe Maximum Power Point (MPP) Constant Voltage (CV)Maximum Power Point Tracker (MPPT) with buck converteris connected to PVpanels [27]Theopen-circuit voltage (119881oc)short-circuit current (119868sc) maximum-power voltage (119881mp)andmaximum-power current (119868mp) are measured and loggedwith an interval of 1 minute The maximum power can beobtained via the product 119881mp and 119868mp The energy generatedin a day or an hour could be obtained by integrating themaximum power along the period of time The energy gainΔ119864 (kWhr) and efficiency 120578 () of DAST over SSS which willbe widely used in this work can be calculated from energygenerated by DAST 119864DAST and energy generated by SSS 119864SSSand the energy consumption for performing the tracking 119864
119862
as follows
Δ119864 = 119864DAST minus 119864SSS minus 119864119862
120578 =Δ119864
119864SSStimes 100
119864119862=119881track (119881) times 119868drawn times (119860) times time (hr)
Area of Panel (m2)
(13)
Indeed the energy consumption is an essential part incalculating the energy gain (Δ119864) If the energy consumedin tracking is substantial it might not be worthwhile foradopting a solar tracker The energy gained from the benefitof tracking could not justify the energy consumed in doingthe tracking The Global Solar Irradiance of both systemsis measured by using a well-calibrated Li-Cor (LI 210SA)pyranometer respectively The daily data collection startsfrom 7 am until 7 pm corresponding to the typical day timein Kuala Lumpur Malaysia where the experimental setup isinstalled The data are logged into EEPROMs and extractedout at the end of the day for analysis in Microsoft Excel andMatlab
E
W
N
S
Axis ldquo1rdquo
Axis ldquo2rdquo
Figure 4 The hardware prototype of the DAST and its rotationalaxes
4 Result
41 Results of Daily Power Generation Themaximum powerobtained by DAST in a low clearness index day and highclearness index day has substantial difference Figures 6 and7 show an example of electrical power generation along a dayfor an overcast day with 119870
119879of 034 and a sunny day with
119870119879of 062 In a day with low 119870
119879 the sun ray is blocked
by the clouds which leads to no beam radiation falling onthe solar panels This is clearly indicated on the morningsession (7 am to 9 am) and evening session (3 pm to 7 pm)on Figure 8 The diffused radiation is dominant in these twoperiods and there is no advantage for DAST over the SSSKelly and Gibson [28 29] have shown that diffuse radiationis isotropically distributed over the whole sky in an overcastday Hence a PV panel positioned horizontally will receivemaximum amount of isotropically distributed sky radiationcompared to tilted position Conversely in a day with high119870119879 the beam radiation is playing a dominant role 90 of
the global solar radiation is made up by beam radiation [20]DAST follows the position of the solar disk and ensuresthat maximum amount of beam radiation strikes the PVpanels throughout the day Figure 8 shows the difference ofinstantaneous power of DAST and SSS along the sunny dayand cloudy day Tremendous gain is obtained during themorning and evening sessions while the gain at Table 1 showsthe efficiency (120578) and energy gained by the DAST over SSS intwodayswith different value of clearness indexThe efficiencyof DAST over SSS varies from 2491 at an overcast day to8212 at a clear day Likewise the electrical energy generatedalso increases drastically from 108Whrm2 at a cloudy day to603Whrm2 at a clear day Apparently the efficiency of DASTover SSS and additional electrical energy generated in a dayare influenced by the clearness index
Figure 9 presented an example for a day with the mea-sured instantaneous irradiance of DAST and horizontally-positioned SSS together with the modeled irradiance of
6 International Journal of Photoenergy
E
S
Normal
S
N
EWplusmn70∘
plusmn30∘
(a)
Normal
W E
70∘
(b)
SN
Normal
30∘
(c)
Figure 5 The reference (ldquozerordquo) positions for the angular fields of the two rotational axes
Table 1The efficiency (120578) energy gained by theDAST over SSS andenergy consumption under different clearness index
Clearnessindex 119870
119879
Efficiency 120578()
Energy generated(Whrm2)
Energyconsumption(Whrm2)
034 2491 108 030062 8212 603 030
07 08 09 10 11 12 13 14 15 16 17 18 190
20
40
60
80
100
120
140
160
Local time (hr)
Electrical power generation versus local time
SSSDAST
Elec
tric
al p
ower
gen
erat
ion
(Wm
2)
Figure 6 Electrical power generation in an overcast day
DAST The modeled irradiance of DAST is generated fromthe global irradiance of horizontally positioned SSS
There are two noticeable findings that can be interpretedfrom it The first finding is that the anisotropic has demon-strated an inspiring result for estimating the irradiance of the
07 08 09 10 11 12 13 14 15 16 17 18 190
20
40
60
80
100
120
140
160
Local time (hr)
Electrical power generation versus local time
SSSDAST
Elec
tric
al p
ower
gen
erat
ion
(Wm
2)
Figure 7 Electrical power generation in a sunny day
DAST as both measured and modeled irradiance have verysimilar value The experimental and modeled DAST wouldtrack the sun on a similar path in order to have the similarresult shown Hence HDKR anisotropic diffused model canbe reliably used to infer the instantaneous irradiances ofDASTThe second finding is that the irradiances captured byboth DAST and SSS are not far off from each other duringthe midday It means the incidence angle of sun ray falling onboth does not differ much at this period compared to otherperiods of the day It agrees with the result from Figure 8 thatthe advantage of DAST lies on morning and evening session
For the proposedDAST the energy consumed ismarginalcompared to the additional energy gain from trackingThus the energy consumption (119864
119862) is not included in the
International Journal of Photoenergy 7
07 08 09 10 11 12 13 14 15 16 17 18 19Local time (hr)
Difference of instantaneous power versus local time
Midday EveningMorning
K = 034
K = 062
minus10
0
10
20
30
40
50
60
70
80
Diff
eren
ce o
f ins
tant
aneo
us p
ower
(Wm
2)
Figure 8 Difference of instantaneous power of DAST and SSS alongthe sunny day and cloudy day
calculation of the energy gain The voltage of the trackingsystem119881track and the current drawn 119868drawn during the trackingprocess are shown in Figure 10
The DAST tracking is done within fifteen seconds dura-tion for consecutive fifteen minutes The tracking time isshort as the sun movement does not vary much in fifteenminutes The DAST tracks the sun from 7 am to 7 pmwhich is equivalent to twelve hours The approximate energyconsumption used for tracking in a day can be calculated asfollows
119864119862=13 times 06 times ((1560 times 60) times 12)
158 lowast 0812
119864119862= 030Whrm2
(14)
The energy consumption (119864119862) is compared to the differ-
ence between the energy generated between DAST and StaticSolar System (SSS) in a low and high clearness index dayrespectively Apparently the energy consumption is relativelysmall compared to the energy difference of DAST and SSS forthe DAST proposed in both high clearness index (sunny) andlow clearness index (cloudy) day as shown in Table 1 Hencethe energy consumption (119864
119862) can be safely left out from
the calculation of the energy gained by the DAST over SSSwithout significant impact on the final result However theimpact of energy consumption (119864
119862) should not be overlooked
in a larger system as its value would loom large and becomesignificant to the difference of energy betweenDAST and SSS
42 Results of Energy Obtained by DAST and SSS Figure 11presented the daily energy captured by DAST and SSS for a
5 10 15 200
200
400
600
800
1000 Irradiance versus local time
Local time (hr)
DAST (measured)DAST (modelled)Horizontal
Irra
dian
ce (W
m2)
Figure 9 Measured and modeled (anisotropic diffuse model)instantaneous irradiance of DAST and measured irradiance ofhorizontally positioned SSS
Tracking
Tracking voltage 13V
Current drawn 06ADuration sim15 s
Figure 10The voltage of the tracking system119881track and the currentdrawn 119868drawn during the tracking process
month in a bar chart There are various conditions such assunny days cloudy days and rainy days during this monthwhich is the typical climate of Malaysia The weather in amonth could act as a miniature of the weather in a year
Hence the underlying factor that determines the amountof advantage of DAST over SSS has to be found out Asa result it leads to the investigation of the energy gain ofboth DAST and SSS with respect to clearness index Theclearness index is imperative for the performance evaluationof a PV system It indicates the clarity of a day and the
8 International Journal of Photoenergy
0 5 10 15 20 25 30 350
05
1
15
2
25Daily energy of DAST and SSS (month)
Day
DASTSSS
Ener
gy (k
Whr
m2)
Figure 11The daily energy captured by DAST and SSS for a month
potential amount of sunlight for converting the solar energyinto electrical energy by the PV system The availability ofabundant direct sunlight in a day has a profound impact onthe energy generated by a PV system
Generally a direct proportional relationship could behypothesized for bothDASTand SSSwith respect to clearnessindex Based on the performance of both clear and overcastdays reported on previous section it could be deducedthat DAST responds to clearness index on a more sensitivemanner compared to a SSS This is due to its ability to trackthe position of the sun and capturedmaximum sunlight fromsunrise to sunset
Figure 12 shows the energy captured by theDAST and SSSplotted against clearness index for a month The trend linesfor both systems are generated by using basic fitting inMatlabThe standard deviation of DAST and SSS is 00418 kWhrm2and 00175 kWhrm2 respectivelyThe slope for both systemswith respect to clearness index is apparently distinct fromeach other Both trends of SSS and DAST have shown a lineargrowth with respect to clearness index However DAST has asteeper slope compared to SSS On the other hand at the dayswith low clearness index (below 022) presumably rainy daysDAST would have lower energy gain than SSS as shown inthe extrapolation from the graph It is due to the fact that theavailable solar radiation in those days is dominantly diffuseradiation Direct radiation would be absent or at a relativelyminimal levelTherefore DAST has no advantage over SSS atthis range of clearness index
On the other side of the clearness index the energycaptured by DAST increases in a steeper slope compared toSSS as the clearness index climbs from medium (04) to high(06) level Thus it fortifies the inference that greater amountof energy will be captured by DAST compared to SSS as theclearness index increase In other words the application ofDAST ensures a performance boost of a PV system and theoutcome is exceptionally well as the clearness index increasesIn addition the trends of both DAST and SSS with respectto clearness index show that a clearness index offers a goodestimation for energy generation on different weather
43 Results of Daily Clearness Index An endeavor to dis-cover the relationship between clearness index and trackingadvantage of DAST is made by plotting both efficiency and
0 02 04 06 080
02
04
06
08
1
12
14 Energy versus clearness index
Clearness index
SSSSSS trend
DASTDAST trend
Ener
gy (k
Whr
m2)
Figure 12 The energy captured by DAST and SSS against clearnessindex for a month
additional electrical energy gained over the clearness indexfor one month duration There are different kinds of weatherwithin the period which includes sunny overcast partialcloudy and rainy days Figures 13 and 14 show the graphs ofefficiency (120578) and Energy Gain (119864
119866) versus daily Clearness
Index (119870119879) by one month data of May 2013 A linear trend
line is plotted via basic fitting for both graphs respectivelyGenerally these two graphs exhibit a weak trend of 120578 and 119864
119866
proportional to 119870119879 The standard deviation of the efficiency
and energy gain is 71757 and 00355 kWhrm2The advantage of DAST over SSS is more remarkable at
sunny day with high 119870119879(between 05 and 06) compared
to the overcast and rainy day with low 119870119879(between 02
and 04) A clear and quantitative conclusion could notbe drawn on the advantage of DAST based on the dailyclearness index It appears that there are some days thatthe efficiency and energy gain is scattered far off from thelinear trend lines Hence a look on the energy gain versustime on Figure 8 would give a more detailed insight on howthe slope of the DAST tracking advantage changes in a dayIt has been found that the effectiveness or energy gain ofDAST is particularly well in the morning and evening ascompared to during themiddayThis explains the weak trendabove as the daily clearness index lump the slopes of theDAST tracking advantage on morning midday and eveningwithout considering that they have different value of slope
44 Results of Segmented Clearness Index It is necessary todivide the clearness index into three segments period whichare morning (0700ndash1100) midday (1101ndash1500) and evening(1501ndash1900) for a better visualization of the influence of
International Journal of Photoenergy 9
02 03 04 05 06 0710
20
30
40
50
60Efficiency versus clearness index
Clearness index
Effici
ency
()
Figure 13 Efficiency of DAST over SSS versus daily clearness index
clearness index Nevertheless the splitting of the day intothree segments is not without a tradeoff Since the clearnessindex is split into three periods the efficiency of DAST overSSS for a single day could not be established as the portioncontributed by efficiency for three periods and could not besummed into a total amount as energy gain Thus the totalefficiency of a single day could not be obtained although thetotal energy gain of DAST can be summed from the threesegments The tradeoff is justified as a more accurate energygain of DAST over SSS resulted from the segmented analysisAn accurate energy gain is extremely handy for estimatingthe additional profit generated by DAST as the Feed-In Tariff(FID) is based on the energy generated (kWhr) instead ofefficiency Figure 15 shows the energy gain of DAST over SSSversus clearness index on three segments period The threetrend lines are generatedwith polyfit and polyval functions inMatlab by fitting the experimental data points in least squaresense The trend lines on morning midday and evening forenergy gain versus clearness index are fitted in second-orderpolynomial based on the scattered data points Apparentlythe trend of energy gain with respect to clearness index isclearer as the day is being segmented into three periodsAgain the sharp slopes of the efficiency and energy gainof DAST over SSS during the morning and evening periodare different compared to the smaller slope in midday Theslope of the energy gain is lower at midday because SSS ispositioned on a horizontal orientation During the middaysun light strikes on the PV panel of SSS with a smallerincidence angle compared to morning and evening Mostof the solar energy is captured by SSS within this periodThus the energy gained by DAST over SSS increases in asmaller slope as clearness index increases During morningand evening DAST has the advantage of facing the solar diskwhile SSS stay on its static horizontal position As a result theenergy gained byDAST is a lot greater as the day is clearer and
02 03 04 05 06 070
01
02
03
04
05 Energy gain versus clearness index
Clearness index
Ener
gy g
ain
(kW
hm
2)
Figure 14 Energy gain of DAST over SSS versus daily clearnessindex
more solar energy is availableHowever the advantage dimin-ishes as the clearness index drops As clearness index dropsbelow approximately 015 the energy captured by DAST isless than SSS as there is only diffuse radiation availableA horizontally positioned SSS inclined position Anyway theenergy captured on this level of clearness index is marginalThe standard deviation for the trend lines and data pointsare 00113 kWhrm2 00133 kWhrm2 and 00109 kWhrm2for morning midday and evening respectively It seems thatthe data points are distributed in a smaller range in the threesegments clearness index compared to the daily clearnessindex shown in previous section Hence the energy gain of aDAST over SSS can be estimated in a better accuracy by usingsegmented clearness index graph given the clearness index ofa site
45 Comparison of Energy Gain of Seven Cities by Using Seg-mented Clearness Index and Anisotropic Model The energygain versus segmented clearness index graph is used toestimate the energy gain of other cities in PeninsularMalaysiabased on the segmented clearness index of the cities respec-tively The performance improvement of DAST over SSS inseven cities of Peninsular Malaysia including Bayan LepasIpoh KuantanMuadzam Shah Langkawi Senai and Subangare being estimated by the segmented clearness index graphmethod as shown in Figure 16 The hourly data of globalirradiation over horizontal surface in 2009 for the seven citiesis obtained fromMalaysiaMeteorological DepartmentThesedata were measured by using pyranometer in the weatherstations at the seven cities respectively Segmented clearnessindex can be generated from these data and plotted on thesegmented clearness index graphs to compute the energy gainof DAST over SSS Moreover these data are also put intoHDKR anisotropic model to develop the global irradiationover the DAST [21] Electrical energy generated by both
10 International Journal of Photoenergy
0 02 04 06
Energy gain versus clearness index
Clearness index
MorningMorning trendMidday
Midday trendEveningEvening trend
minus005
0
005
01
015
02
Ener
gy g
ain
(kW
hm
2)
Figure 15 Energy gain of DAST over SSS on 3 segments period
DAST and SSS can be converted from the global irradiationrespectively by using the average effectiveness of the PVpanel on DAST and SSS 015 The energy generated for bothsystems in a year are being averaged into a mean daily energygenerated and divided into three segments Subsequentlyaverage energy gain of DAST over SSS on the three periodscan be obtained by using the mean energy generated for bothsystems in three segments
The average efficiency and energy gain of DAST overSSS in three segments of a day by using anisotropic modelare plotted on the segmented clearness index graphs It isobserved that there are some similarities on the response ofefficiency and energy gain of DAST over SSS with respectto the segmented clearness index in both anisotropic modeland segmented clearness index curve from experimentalThe slopes of both anisotropic model and experimentalgenerally agree with each other albeit some discrepanciesappearing due to some reasons The value generated fromanisotropic model tends to be slightly higher due to thehorizon brightening component that may be estimated ona higher level than the actual level [22] Besides that anaccurate estimation of the irradiation for anisotropic modelcannot be obtained as there are a few days in a year thatthe weather stations in the seven cities were undergoingmaintenance and data are not available during the short stintNonetheless it has shown that the segmented experimentalgenerated curve that can be used to estimate the energy gainof DAST over SSS with a low margin of error The energygain of DAST over SSS based on both anisotropic modeland segmented experimental generated curve are tabulatedon Tables 2 3 and 4 for morning midday and eveningIt has been shown that in terms of energy gain of DAST
02 03 04 05 06 070
005
01
015
02Energy gain versus clearness index
Clearness index
Morning citiesMorningMidday cities
MiddayEvening citiesEvening
Ener
gy g
ain
(kW
hm
2)
Figure 16 Energy gain of DAST over SSS for 7 cities developed byanisotropic model on 3 segments clearness index
Table 2 Energy gain based on experimental curve and isotropicmodel on morning segment
Cities 119870119879
Energy gain (kWhrm2)Experiment Anisotropic
Bayan Lepas 0458 0083 0071Ipoh 0476 0091 0088Kuantan 0515 0112 0119Langkawi 0619 0175 0183Muadzam Shah 0455 0081 0074Senai 0417 0064 0055Subang 0492 0099 0095
over SSS Langkawi has the greatest potential for installingDAST while Senai has the least advantage among the sevencities Langkawi is an island and is close to the coastal areathe clearness index is higher and clearer days are availablethroughout the year Senai is on the southern part of thePeninsular Malaysia and in an inland site which leads tohigher precipitation and relatively regular rainfall Hence ithas lower clearness index on three segments of the day andlower energy gain of using DAST
Consider a proposed 1MWPV solar farm in Langkawiwhich is expected to produce 1310MWhr from horizontalorientation system per year from 4800 solar panels Theadditional profit by incorporating DAST onto this solarfarm is calculated The Malaysia feed-in-tariffs (FIT) forgrid-connected PV systems with 1MW capacity are up to$035kWhr as of year 2013 The additional energy gain ofDAST in Langkawi is 031 kWhrm2 A 1MWPV systemwith 210W and an area of 1283m2 PV panels could generate
International Journal of Photoenergy 11
Table 3 Energy gain based on experimental curve and isotropicmodel on midday segment
Cities 119870119879
Energy gain (kWhrm2)Experiment Anisotropic
Bayan Lepas 0561 0071 0075Ipoh 0564 0071 0073Kuantan 0494 0060 0062Langkawi 0529 0066 0073Muadzam Shah 0495 0060 0062Senai 0418 0049 0053Subang 0570 0072 0074
Table 4 Energy gain based on experimental curve and isotropicmodel on evening segment
Cities 119870119879
Energy gain (kWhrm2)Experiment Anisotropic
Bayan Lepas 0490 0105 0101Ipoh 0370 0048 0052Kuantan 0391 0056 0046Langkawi 0420 0069 0064Muadzam Shah 0354 0041 0035Senai 0262 0015 0020Subang 0401 0061 0071
Table 5 Technical characteristics of PV panel
Sanyo HIP-210NKHB5Maximum power (119875max) [W] 210Max power voltage (119881mp) [V] 413Max power current (119868mp) [A] 509Open circuit voltage (119881oc) [V] 509Short circuit current (119868sc) [A] 557Dimension (119871 lowast119882 lowast 119863) [m] 158 lowast 0812 lowast 0035
Weight [kg] 15Cell efficiency [] 189Module efficiency [] 164
an additional energy of 1909 kWhr per day Assume a 10inverter loss for converting the DC (Direct Current) powerfrom PV into AC (Alternating Current) for feeding into grid$60134 daily extra profit can be obtained by using DASTAn annual additional profit of $219499 is the advantage ofDAST over SSS Similar financial analyses on the other citieswhich are being done and the additional financial gain dueto the advantage of DAST over SSS are shown in Figure 17The estimated profit could offer important information forsolar farm investor in making decision whether the long-term investment is sustainable after deducting the one-offadditional cost of mechanical structure and motor for DASTMore detailed studies on the cost estimation of DAST and itsvariation with respect to capacity will be the goal for futurework In this analysis the focus is put upon the averageadditional energy gain of DAST over SSS with respect toclearness index
B L
epas
Ipoh
Kuan
tan
Lang
kaw
i
M S
hah
Sena
i
Suba
ng
0
05
1
15
2
25 Estimated profit for 7 cities with DAST
Cities
US
dolla
r ($)
times105
Figure 17 Estimated additional financial gain for seven cities withDAST
5 Conclusion
This work demonstrates the correlation of clearness indexwith energy gain and efficiency of DAST over SSS basedon experimental setup Apparent advantage of DAST occursin morning and evening sessions due to the ability ofDAST to follow the sunrsquos position throughout the day ascompared to the static position of SSS A segmented clearnessindex graph for the experimental result is plotted and itshows a lower standard deviation and better correlationfor clearness index with both energy gain and efficiencyduring morning midday and evening This correlation hasbeen used respectively to estimate the energy gain of sevencities in Peninsular Malaysia and compared with their valuedeveloped by anisotropic model A similar trend for theresponse of energy gain and efficiency to clearness index isfound It shows that this correlation can offer an estimationof the energy gain of DAST over SSS while consideringthe potential of installing PV system on a site Additionalfinancial gain due to the advantage of DAST over SSS forseven cities is also calculated based on a 1MWPV solar farmcase study and Malaysia feed-in-tariffs (FIT) Moreover thiswork could be a starting point for further detailed economicanalysis for DAST More economical details included costanalysis of DAST ground field price and payback periodcould be explored to validate the investment model of DASTsolar farm in the future works
Nomenclature
DAST Dual Axis Solar TrackerSSS Static Solar SystemPV Photovoltaic
12 International Journal of Photoenergy
119870119879 Clearness index for a day (-)
119896119879 Clearness index for an hour (-)
119866 Global solar radiation over a day (Wm2)119867119900 Extraterrestrial radiation over a day (Wm2)
119868119866 Global solar radiation over an hour (Wm2)
119868119900 Extraterrestrial radiation over an hour
(Wm2)119866SC Solar constant 1367 (Wm2)119899 Julian day (-)120601 Latitude (∘)120575 Declination (∘)120596119904 Sunset hour angle (∘)
1205961 Hour angle for start of an hour (∘)
1205962 Hour angle for end of an hour (∘)
Δ119864 Energy gain of DAST over SSS (kWhrm2)119864DAST Energy generated by DAST (kWhrm2)119864SSS Energy generated by SSS (kWhrm2)119864119862 Energy consumed by DAST (kWhrm2)
119881track The voltage of the tracking system (V)119868drawn The current drawn by the tracking system (A)MPPT Maximum Power Point Tracking (-)CV Constant Voltage method for MPPT (-)120578 Efficiency of DAST over SSS (-)119868119879 Radiation received by tilted surface (Wm2)
119868119861 Beam component of irradiance over horizon-
tal surface (Wm2)119877119861 Geometric factor (-)
119860119894 Anisotropy index (-)
119891 Modulating factor account for cloudiness (-)119868119863 Diffusive component of irradiance over hori-
zontal surface (Wm2)120573 Slope of tilted surface (∘)120588 Albedo (-)119868119866 Radiation received by horizontal surface
(Wm2)120579 Angle of incidence of beam radiation on tilted
surface (∘)120579119885 Solar zenith angle (∘)
120574 Solar azimuth angle (∘)
Acknowledgments
The authors thank the technical and financial assistanceof UM Power Energy Dedicated Advanced Centre(UMPEDAC) and the High Impact Research Grant (H-16001-00-D000032)
References
[1] T M Razykov C S Ferekides D Morel E Stefanakos HS Ullal and H M Upadhyaya ldquoSolar photovoltaic electricitycurrent status and future prospectsrdquo Solar Energy vol 85 no 8pp 1580ndash1608 2011
[2] K V K Reddy and M V Kumar ldquoModeling and a MPPTmethod for solar cellsrdquo Journal of Engineering and AppliedSciences vol 3 no 1 pp 128ndash133 2008
[3] H Mousazadeh A Keyhani A Javadi H Mobli K Abriniaand A Sharifi ldquoA review of principle and sun-trackingmethodsfor maximizing solar systems outputrdquo Renewable and Sustain-able Energy Reviews vol 13 no 8 pp 1800ndash1818 2009
[4] G K Singh ldquoSolar power generation by PV (photovoltaic)technology a reviewrdquo Energy vol 53 pp 1ndash13 2013
[5] J Rizk and Y Chaiko Solar Tracking System More Efficient Useof Solar Panels vol 41 World Academy of Science Engineeringand Technology 2008
[6] A-J N Khalifa and S S Al-Mutawalli ldquoEffect of two-axissun tracking on the performance of compound parabolicconcentratorsrdquo Energy Conversion andManagement vol 39 no10 pp 1073ndash1079 1998
[7] G C Bakos ldquoDesign and construction of a two-axis suntracking system for Parabolic TroughCollector (PTC) efficiencyimprovementrdquo Renewable Energy vol 31 no 15 pp 2411ndash24212006
[8] S Abdallah and S Nijmeh ldquoTwo axes sun tracking system withPLC controlrdquo Energy Conversion and Management vol 45 no11-12 pp 1931ndash1939 2004
[9] C Alexandru and M Comsit ldquoThe energy balance of the pho-tovoltaic tracking systems using virtual prototyping platformrdquoin Proceedings of the 5th International Conference on European(EEM rsquo08) pp 1ndash6 Electricity Market May 2008
[10] T Tomson ldquoDiscrete two-positional tracking of solar collec-torsrdquo Renewable Energy vol 33 no 3 pp 400ndash405 2008
[11] B Ai H Shen Q Ban B Ji and X Liao ldquoCalculation ofthe hourly and daily radiation incident on three step trackingplanesrdquo Energy Conversion andManagement vol 44 no 12 pp1999ndash2011 2003
[12] E Lorenzo M Perez A Ezpeleta and J Acedo ldquoDesignof tracking photovoltaic systems with a single vertical axisrdquoProgress in Photovoltaics vol 10 no 8 pp 533ndash543 2002
[13] P Y Vorobiev J Gonzalez-Hernandez and Y V VorobievldquoOptimization of the solar energy collection in tracking andnon-tracking photovoltaic solar systemrdquo in Proceedings of the1st International Conference on Electrical and Electronics Engi-neering (ICEEE rsquo04) pp 310ndash314 Acapulco Mexico 2004
[14] N H Helwa A B G Bahgat A M R El Shafee and E T ElShenawy ldquoMaximum collectable solar energy by different solartracking systemsrdquo Energy Sources vol 22 no 1 pp 23ndash34 2000
[15] M A M Shaltout A Ghettas and M Sabry ldquoV-troughconcentrator on a photovoltaic full tracking system in a hotdesert climaterdquo Renewable Energy vol 6 no 5-6 pp 527ndash5321995
[16] M J Clifford and D Eastwood ldquoDesign of a novel passive solartrackerrdquo Solar Energy vol 77 no 3 pp 269ndash280 2004
[17] A Al-Mohamad ldquoEfficiency improvements of photo-voltaicpanels using a sun-tracking systemrdquoApplied Energy vol 79 no3 pp 345ndash354 2004
[18] K S Karimov M A Saqib P Akhter M M Ahmed J AChattha and S A Yousafzai ldquoA simple photo-voltaic trackingsystemrdquo Solar Energy Materials and Solar Cells vol 87 no 1ndash4pp 49ndash59 2005
[19] W D Lubitz ldquoEffect of manual tilt adjustments on incidentirradiance on fixed and tracking solar panelsrdquo Applied Energyvol 88 no 5 pp 1710ndash1719 2011
[20] F Cruz-Peragon P J Casanova-Pelaez F A Dıaz R Lopez-Garcıa and J M Palomar ldquoAn approach to evaluate the energyadvantage of two axes solar tracking systems in Spainrdquo AppliedEnergy vol 88 no 12 pp 5131ndash5142 2011
International Journal of Photoenergy 13
[21] D T Reindl W A Beckman and J A Duffie ldquoEvaluation ofhourly tilted surface radiationmodelsrdquo Solar Energy vol 45 no1 pp 9ndash17 1990
[22] J A Duffie and W A Beckman Solar Engineering of ThermalProcesses John Wiley amp Sons New York NY USA 2004
[23] B Y H Liu and R C Jordan ldquoThe long-term average perfor-mance of flat-plate solar-energy collectors with design data forthe US its outlying possessions and Canadardquo Solar Energy vol7 no 2 pp 53ndash74 1963
[24] R Perez R Seals P Ineichen R Stewart and D Menicucci ldquoAnew simplified version of the perez diffuse irradiance model fortilted surfacesrdquo Solar Energy vol 39 no 3 pp 221ndash231 1987
[25] D G Erbs S A Klein and J A Duffie ldquoEstimation of thediffuse radiation fraction for hourly daily andmonthly-averageglobal radiationrdquo Solar Energy vol 28 no 4 pp 293ndash302 1982
[26] C Alexandru ldquoA novel open-loop tracking strategy for photo-voltaic systemsrdquo The Scientific World Journal vol 2013 ArticleID 205396 12 pages 2013
[27] K A Aganah and A W Leedy ldquoA constant voltage maximumpower point tracking method for solar powered systemsrdquo inProceedings of the 43rd IEEE Southeastern Symposium on SystemTheory (SSST rsquo11) pp 125ndash130 Auburn Ala USA March 2011
[28] N A Kelly and T L Gibson ldquoImproved photovoltaic energyoutput for cloudy conditions with a solar tracking systemrdquo SolarEnergy vol 83 no 11 pp 2092ndash2102 2009
[29] N A Kelly and T L Gibson ldquoIncreasing the solar photovoltaicenergy capture on sunny and cloudy daysrdquo Solar Energy vol 85no 1 pp 111ndash125 2011
Submit your manuscripts athttpwwwhindawicom
Hindawi Publishing Corporationhttpwwwhindawicom Volume 2014
Inorganic ChemistryInternational Journal of
Hindawi Publishing Corporation httpwwwhindawicom Volume 2014
International Journal ofPhotoenergy
Hindawi Publishing Corporationhttpwwwhindawicom Volume 2014
Carbohydrate Chemistry
International Journal of
Hindawi Publishing Corporationhttpwwwhindawicom Volume 2014
Journal of
Chemistry
Hindawi Publishing Corporationhttpwwwhindawicom Volume 2014
Advances in
Physical Chemistry
Hindawi Publishing Corporationhttpwwwhindawicom
Analytical Methods in Chemistry
Journal of
Volume 2014
Bioinorganic Chemistry and ApplicationsHindawi Publishing Corporationhttpwwwhindawicom Volume 2014
SpectroscopyInternational Journal of
Hindawi Publishing Corporationhttpwwwhindawicom Volume 2014
The Scientific World JournalHindawi Publishing Corporation httpwwwhindawicom Volume 2014
Medicinal ChemistryInternational Journal of
Hindawi Publishing Corporationhttpwwwhindawicom Volume 2014
Chromatography Research International
Hindawi Publishing Corporationhttpwwwhindawicom Volume 2014
Applied ChemistryJournal of
Hindawi Publishing Corporationhttpwwwhindawicom Volume 2014
Hindawi Publishing Corporationhttpwwwhindawicom Volume 2014
Theoretical ChemistryJournal of
Hindawi Publishing Corporationhttpwwwhindawicom Volume 2014
Journal of
Spectroscopy
Analytical ChemistryInternational Journal of
Hindawi Publishing Corporationhttpwwwhindawicom Volume 2014
Journal of
Hindawi Publishing Corporationhttpwwwhindawicom Volume 2014
Quantum Chemistry
Hindawi Publishing Corporationhttpwwwhindawicom Volume 2014
Organic Chemistry International
ElectrochemistryInternational Journal of
Hindawi Publishing Corporation httpwwwhindawicom Volume 2014
Hindawi Publishing Corporationhttpwwwhindawicom Volume 2014
CatalystsJournal of
2 International Journal of Photoenergy
complexity and cost Figure 1 shows the minimum maxi-mum and average efficiency of some solar tracking worksbeing reported experimentally and by simulation in othercountries [6ndash18] Apparently the difference in solar trackingefficiency that varies greatly among the countries reporteddue to different geographic location local landscape andclimate [19] Moreover the efficiency of solar tracking in thesame region during different seasons also differs significantlyThe efficiency normally top in the summer with a marginalperformance in winter and the spring and fall have averageefficiency
Malaysia as a country which lies at 1∘ to 7∘ north ofequator has an equatorial climate and long hours of sunshinethroughout the year There are enormous potential for solarenergy to be successful at this land However the potentialfor the DAST is rarely reported and investigated in thisregion Hence a quantitative advantage of DAST over SSS inthis country still remains unknown although the consistentlylong sun hours suggested a promising outcome Thus itwould be one of the endeavors for this study to carry out aninvestigation on some of the cities inMalaysia regarding theirperformance enhancement for installation of DAST over SSSThe advantage on the financial perspective would also beanalyzed and a comparison can be made on the suitability forDAST installation on seven cities in Peninsular Malaysia
While having better efficiency over SSS the additionalcosts for the DAST could not be overlooked The trackingmechanism requires extra mechanical structure and motorsto rotate the PV panels according to the sunrsquos positionOperational and maintenance cost of the DAST will also behigher than SSS Hence estimation of the efficiencyenergygain of DAST over SSS is essential and need to be partof the site evaluation criteria As a rule of thumb thegain from the DAST over SSS would have to surpass theadditional costs whereby the profitability and sustainabilityof the DAST especially in large scale solar power plant areguaranteed However as shown in Figure 1 the reportedefficiency improvement can vary from as low as 10 to as highas 75The large variation ofDAST efficiency complicates theevaluation process for adopting DAST over SSS Besides thatperformance enhancement of DAST over SSS for an equatorregion as Malaysia is not being investigated so far
So far comparison of efficiency and energy gain of DASTover SSS has been done by physically installing both systemson the site of interest This method is not only expensivebut also time consuming since data over a sufficientlylong period of time is needed to facilitate a meaningfulcomparison between the two systems Moreover the resultsobtained are not directly applicable onto other sites Hencethere is a need for a method to estimate the gain of DASTover SSS in a more cost- and time-effective manner such thatthe site evaluation can be made more straightforward
Cruz-Peragon et al quantify the extra solar gain of DASTover SSS with respect to latitude of the cities in Spain basedon the Reindl anisotropic model and Liu amp Jordan isotropicmodel [20 21] Based on his finding the former method ismore useful and better represent the climate of Spain territoryas compared to isotropic model Most of the cities in Spainterritory are suitable for DAST while a few cities are not
recommended due to various reasons including high latitudehigh rainfall and coastal region
In this paper an attempt is made to correlate the perfor-mance enhancement of DAST based on the clearness indexof the sites in Malaysia Subsequently this correlation is usedto estimate the performance boost of DAST at seven cities inMalaysia
2 Literature Review
21 Clearness Index Clearness index is chosen as the solevariable in this work as it is derived from solar irradiancethe most fundamental factor that influences the performanceof a PV system Clearness index represents the ratio of theaverage global solar irradiation 119866 on a horizontal surface tothe extraterrestrial solar irradiation 119867
119900on the same surface
and given by the following Equations for daily and hourlyvalues respectively [22]
For daily
119870119879=119866
119867119900
(1)
For hourly
119896119879=119868119866
119868119900
(2)
The data of global solar radiation over a day and overan hour 119868
119866 are available from measurements of total solar
radiation on a horizontal surface by using a pyranometerThehourly clearness index function could be utilized to calculateclearness index for longer period by replacing the global solarradiation and extraterrestrial radiation for the desired periodinto (2) Meanwhile the extraterrestrial solar radiations 119867
119900
and 119868119900can be defined as the solar radiations incident on
a horizontal plane outside the atmosphere over a day anda designated period of time within a day respectively Inother words this is the sunlight reaching the ground of theearth without the presence of atmosphere The amount ofextraterrestrial radiation reaching the earth ground relies onthe relative position of the earth to the sun on its ellipticalorbit around the sun and the earth declination through thisorbit119867
119900and 119868119900can be calculated by using (3) as follows
119867119900=24 times 3600
120587119866SC [1 + 0033 cos(
360119899
365)]
times (cos120601 cos 120575 sin120596119904+120587120596119904
180sin120601 sin 120575)
119868119900=12 times 3600
120587119866SC [1 + 0033 cos(
360119899
365)]
times [ cos120601 cos 120575 (sin1205962minus sin120596
1)
+120587 (1205962minus 1205961)
180sin120601 sin 120575]
(3)
International Journal of Photoenergy 3
Jordan
Spain
Romania
Iraq
Estonia
MongoliaAvg 72
Mexico
Germany
Egypt Avg 62
UK
Syria Max 62
Taiwan Avg 245
Tajikistan Avg 30
Greece Avg 46510ndash2018ndash40
Max 23
10ndash40
Avg 28
176ndash383
35ndash75
326ndash487
Figure 1 Efficiency of solar tracker works reported around the world
Atmosphere scattering
Diffused
Ground-reflected
Diffused
AbsorbedBeam
Figure 2 The three components of global solar radiation
The parameters in the equations can be found in thenomenclature
119867119900from the sun passes through and is attenuated by
the atmosphere before reaching the surface on the earth as119866 Global solar irradiation consists of directbeam radiationdiffuse radiation and reflected radiation Beam radiation iscoming directly from the solar disk on a clear sky withoutbeing obstructed by the clouds while diffuse radiation isthe radiation found in cloudy day with the direct solar raybeing firstly scattered by molecules and particles on theclouds before reaching the solar panels There is also a verymeager amount of radiation reflected from the clouds andground surface namely reflected radiation The componentsof global solar radiation are illustrated in Figure 2
The clearness index is higher in a sunny day as the solarradiation is dominated by beam radiation and less energy lossthrough diffusion and reflection A higher clearness indexwill lead to a higher energy generated and efficiency forDAST Hence the relationship of clearness index with energygain and efficiency of DAST is quantified and investigatedexperimentally With the knowledge of the correlation itis able to offer an alternative guideline for evaluating theperformance enhancement of DAST to a specific site
Circumsolardiffused
Beam
Horizontal brighteningcomponent
Isotropicallydiffused
Figure 3 Circumsolar and horizon brightening components addedto the isotropic component in diffusion model [24]
22 Diffuse Radiation Model Diffuse radiation model isuseful for evaluating the global irradiation over tilted surfaceby using the global solar radiation over horizontal surfaceLiu and Jordan isotropic model [23] is widely used as it is thesimplest diffusion model for obtaining the global irradiationover tilted surface It assumes a uniform distribution ofthe ground-reflected radiation and sky-diffuse radiation onthe celestial hemisphere However its simplistic nature haslead to some weaknesses It neglected the contribution ofcircumsolar diffuse radiation and horizontal brightening tothe total diffused radiationThese two components contributea remarkable portion in the clear days Circumsolar diffusedradiation resulted from forward scattering of beam radiationandwasmainly concentrated in the part of the sky around thesolar disk
Meanwhile the horizon brightening component is con-centrated near the horizon and is most profound in clearskies [24] These additional components are schematicallyshown in Figure 3 Isotropic model tends to underestimatethe amount of diffuse radiation in clear skies which leads itinto poorer response in clear daysThus the whole estimatedirradiation can fall below the actual value from 3 to 9[23 24]
4 International Journal of Photoenergy
In order to have better estimation on the diffuse radiationanisotropic models has to be adopted as larger diffuse com-ponents such as circumsolar diffuse radiation and horizontalbrightening are taken into account By analyzing variousmethodologies of anisotropic models HDKR anisotropicmodel (Hay Davies Klucher Reindl model) [21] is foundto be fairly suitable as some correction factors are added toaccount for the horizon brightening on clear days as well ascloudiness
Anisotropic model considers that the radiation on thetilted surface is contributed by three components whichare beam anisotropic diffuse and solar radiation diffuselyreflected form the ground as in
119868119879= (119868119861+ 119868119863119860119894) 119877119861+ 119868119863(1 minus 119860
119894) (1 + cos120573
2)
times (1 + 119891sin3 (120573
2)) + 119868
119866120588(
1 minus cos1205732
)
(4)
Erbs et al correlation [25] in (5a) (5b) and (5c) makesit possible to obtain the isotropic diffuse component ofradiation 119868
119863 by using the clearness index 119896
119905at each timewhile
the beam radiation is then being found from the differencebetween global solar radiation over horizontal surface 119868
119866and
119868119863as in (6) Consider
119868119863
119868119866
= 10 minus 009119896119905 for 119896
119905le 022 (5a)
119868119863
119868119866
= 09511 minus 01604119896119905+ 4488119896
2
119905minus 16638119896
3
119905
+ 123361198964
119905for 022 lt 119896
119905le 08
(5b)
119868119863
119868119866
= 0165 for 119896119905gt 08 (5c)
119868119866= 119868119863+ 119868119861 (6)
Geometric factor 119877119861is the ratio of beam radiation on
tilted surface to that on a horizontal surface at any time[22] that can be obtained from (7) Anisotropy index 119860
119894
is a function of the transmittance of the atmosphere forbeam radiation A modulating factor 119891 is added into HDKRdiffusion model by Klucher to account for cloudiness of thesky as follows
119877119861=
cos 120579cos 120579119911
(7)
119860119894=119868119861
119868119900
(8)
119891 = radic119868119861
119868119866
(9)
Equation (10) is the angle of incidence of the solar beamradiation on a tilted surface which is one of the important
expressions to construct the anisotropic diffuse radiationmodel The solar radiation obtained from this model iscompared to the experimental result of the proposed DASTprototype The DAST prototype is using equatorial trackingsystem Photoresistors are used as the sensors to track theposition of the sun Hence angle of incidence of the solarbeam which is one of the elements of mathematical approachis not adopted for the solar tracking purpose of the proposedDAST prototype
120579119911is the angle of incidence of beam radiation on tilted
surface and solar zenith angle Consider
cos 120579 = sin 120575 sin120601 cos120573 minus sin 120575 cos120601 sin120573 cos 120574
+ cos 120575 cos120601 cos120573 cos120596
+ cos 120575 sin120601 sin120573 cos 120574 cos120596
+ cos 120575 sin120573 sin 120574 sin120596
(10)
cos 120579119911= cos120601 cos 120575 cos120596 + sin120601 sin 120575 (11)
In addition the albedo120588 (dimensionless) is the compositeground reflectance which is required to estimate the reflectedirradiance It normally takes a value of 02 except for the caseof snowy ground it would have a higher value 120573 is the slopeof the tilted surface and together with solar azimuth angle 120574would make sure that the PV system face the sunrsquos positionat all times The location latitude 120601 declination 120575 and Julianday 119899 are some additional variables to be considered in thismodel
120574 = sign (120596)10038161003816100381610038161003816100381610038161003816
cosminus1cos 120579119911sin120601 minus sin 120575
sin 120579119911cos120601
10038161003816100381610038161003816100381610038161003816
120575 = 2345 sin(360284 + 119899365
)
(12)
3 Experimental Setup
A Dual-Axis Solar Tracker (DAST) and a Static Solar System(SSS) with horizontal orientation are used in this experimentThe solar tracker has two axis of rotation which enable it torotate along the eastwest and northsouth axis The type ofDual-Axis Tracking System that is used in this research fallsinto the category of equatorial as categorized by Alexandru[26]The DAST proposed here is able to track the sun on twoindependent axes The hardware prototype of the DAST andits rotational axes are shown in Figure 4 The daily motionof the sun (from east at dawn to the west at dusk) is trackedby the DAST on first axis (axis ldquo1rdquo daily motion E EastW West) The rotational range of this axis is plusmn70∘ with theposition of solar noon as the reference position (0∘) Onthe other hand the seasonal variation of the Sun position istracked by the DAST via the second axis (axis ldquo2rdquo elevationN North S South) This axis has plusmn30∘ rotational rangefor tracking the altitude angle of sun during the differentseasonsThe reference (ldquozerordquo) positions for the angular fieldsof the two rotational axes is better illustrated by referringto Figure 5 Figure 5(a) shows the DAST on a horizontalposition at which both daily (eastwest) axis and elevation
International Journal of Photoenergy 5
(northsouth) axis on their reference (ldquozerordquo) position Thenormal of the PV panel is coincided with the zenith axisat this position and acts as the reference position of therotational ranges The individual reference positions androtational range of both axes are shown in Figures 5(b) and5(c) respectively The sun-tracking mechanism is based ontwo pairs of Photoresistors as sensors to locate the position ofthe sun Two direct-current (DC) linear actuators rotate thePV panel towards the sunrsquos position upon the signals frommicrocontroller The tracking is done on a fifteen-minute-basis as the sunmoves at a slow speed along the sun pathThecontrol technique adopted in the proposed DAST is a closed-loop (with photosensor) approach The DAST would trackthe sunrsquos position based on the light intensity received by thephoto-sensor As the movement of the sun is slow in naturecontinuous tracking of the sunrsquos position is not necessaryHence DAST tracks the sun once in every fifteen minutesIn other words the fifteen minutes is an interval betweenconsecutive tracking This main purpose of this approachis to reduce the power consumption for doing redundanttracking A Sanyo 210Watt Monocrystalline PV panel is usedin the DAST and static system respectively The technicalcharacteristics of the PV panel are shown in Table 5 In orderto make sure the PV panels on both systems are operating onthe Maximum Power Point (MPP) Constant Voltage (CV)Maximum Power Point Tracker (MPPT) with buck converteris connected to PVpanels [27]Theopen-circuit voltage (119881oc)short-circuit current (119868sc) maximum-power voltage (119881mp)andmaximum-power current (119868mp) are measured and loggedwith an interval of 1 minute The maximum power can beobtained via the product 119881mp and 119868mp The energy generatedin a day or an hour could be obtained by integrating themaximum power along the period of time The energy gainΔ119864 (kWhr) and efficiency 120578 () of DAST over SSS which willbe widely used in this work can be calculated from energygenerated by DAST 119864DAST and energy generated by SSS 119864SSSand the energy consumption for performing the tracking 119864
119862
as follows
Δ119864 = 119864DAST minus 119864SSS minus 119864119862
120578 =Δ119864
119864SSStimes 100
119864119862=119881track (119881) times 119868drawn times (119860) times time (hr)
Area of Panel (m2)
(13)
Indeed the energy consumption is an essential part incalculating the energy gain (Δ119864) If the energy consumedin tracking is substantial it might not be worthwhile foradopting a solar tracker The energy gained from the benefitof tracking could not justify the energy consumed in doingthe tracking The Global Solar Irradiance of both systemsis measured by using a well-calibrated Li-Cor (LI 210SA)pyranometer respectively The daily data collection startsfrom 7 am until 7 pm corresponding to the typical day timein Kuala Lumpur Malaysia where the experimental setup isinstalled The data are logged into EEPROMs and extractedout at the end of the day for analysis in Microsoft Excel andMatlab
E
W
N
S
Axis ldquo1rdquo
Axis ldquo2rdquo
Figure 4 The hardware prototype of the DAST and its rotationalaxes
4 Result
41 Results of Daily Power Generation Themaximum powerobtained by DAST in a low clearness index day and highclearness index day has substantial difference Figures 6 and7 show an example of electrical power generation along a dayfor an overcast day with 119870
119879of 034 and a sunny day with
119870119879of 062 In a day with low 119870
119879 the sun ray is blocked
by the clouds which leads to no beam radiation falling onthe solar panels This is clearly indicated on the morningsession (7 am to 9 am) and evening session (3 pm to 7 pm)on Figure 8 The diffused radiation is dominant in these twoperiods and there is no advantage for DAST over the SSSKelly and Gibson [28 29] have shown that diffuse radiationis isotropically distributed over the whole sky in an overcastday Hence a PV panel positioned horizontally will receivemaximum amount of isotropically distributed sky radiationcompared to tilted position Conversely in a day with high119870119879 the beam radiation is playing a dominant role 90 of
the global solar radiation is made up by beam radiation [20]DAST follows the position of the solar disk and ensuresthat maximum amount of beam radiation strikes the PVpanels throughout the day Figure 8 shows the difference ofinstantaneous power of DAST and SSS along the sunny dayand cloudy day Tremendous gain is obtained during themorning and evening sessions while the gain at Table 1 showsthe efficiency (120578) and energy gained by the DAST over SSS intwodayswith different value of clearness indexThe efficiencyof DAST over SSS varies from 2491 at an overcast day to8212 at a clear day Likewise the electrical energy generatedalso increases drastically from 108Whrm2 at a cloudy day to603Whrm2 at a clear day Apparently the efficiency of DASTover SSS and additional electrical energy generated in a dayare influenced by the clearness index
Figure 9 presented an example for a day with the mea-sured instantaneous irradiance of DAST and horizontally-positioned SSS together with the modeled irradiance of
6 International Journal of Photoenergy
E
S
Normal
S
N
EWplusmn70∘
plusmn30∘
(a)
Normal
W E
70∘
(b)
SN
Normal
30∘
(c)
Figure 5 The reference (ldquozerordquo) positions for the angular fields of the two rotational axes
Table 1The efficiency (120578) energy gained by theDAST over SSS andenergy consumption under different clearness index
Clearnessindex 119870
119879
Efficiency 120578()
Energy generated(Whrm2)
Energyconsumption(Whrm2)
034 2491 108 030062 8212 603 030
07 08 09 10 11 12 13 14 15 16 17 18 190
20
40
60
80
100
120
140
160
Local time (hr)
Electrical power generation versus local time
SSSDAST
Elec
tric
al p
ower
gen
erat
ion
(Wm
2)
Figure 6 Electrical power generation in an overcast day
DAST The modeled irradiance of DAST is generated fromthe global irradiance of horizontally positioned SSS
There are two noticeable findings that can be interpretedfrom it The first finding is that the anisotropic has demon-strated an inspiring result for estimating the irradiance of the
07 08 09 10 11 12 13 14 15 16 17 18 190
20
40
60
80
100
120
140
160
Local time (hr)
Electrical power generation versus local time
SSSDAST
Elec
tric
al p
ower
gen
erat
ion
(Wm
2)
Figure 7 Electrical power generation in a sunny day
DAST as both measured and modeled irradiance have verysimilar value The experimental and modeled DAST wouldtrack the sun on a similar path in order to have the similarresult shown Hence HDKR anisotropic diffused model canbe reliably used to infer the instantaneous irradiances ofDASTThe second finding is that the irradiances captured byboth DAST and SSS are not far off from each other duringthe midday It means the incidence angle of sun ray falling onboth does not differ much at this period compared to otherperiods of the day It agrees with the result from Figure 8 thatthe advantage of DAST lies on morning and evening session
For the proposedDAST the energy consumed ismarginalcompared to the additional energy gain from trackingThus the energy consumption (119864
119862) is not included in the
International Journal of Photoenergy 7
07 08 09 10 11 12 13 14 15 16 17 18 19Local time (hr)
Difference of instantaneous power versus local time
Midday EveningMorning
K = 034
K = 062
minus10
0
10
20
30
40
50
60
70
80
Diff
eren
ce o
f ins
tant
aneo
us p
ower
(Wm
2)
Figure 8 Difference of instantaneous power of DAST and SSS alongthe sunny day and cloudy day
calculation of the energy gain The voltage of the trackingsystem119881track and the current drawn 119868drawn during the trackingprocess are shown in Figure 10
The DAST tracking is done within fifteen seconds dura-tion for consecutive fifteen minutes The tracking time isshort as the sun movement does not vary much in fifteenminutes The DAST tracks the sun from 7 am to 7 pmwhich is equivalent to twelve hours The approximate energyconsumption used for tracking in a day can be calculated asfollows
119864119862=13 times 06 times ((1560 times 60) times 12)
158 lowast 0812
119864119862= 030Whrm2
(14)
The energy consumption (119864119862) is compared to the differ-
ence between the energy generated between DAST and StaticSolar System (SSS) in a low and high clearness index dayrespectively Apparently the energy consumption is relativelysmall compared to the energy difference of DAST and SSS forthe DAST proposed in both high clearness index (sunny) andlow clearness index (cloudy) day as shown in Table 1 Hencethe energy consumption (119864
119862) can be safely left out from
the calculation of the energy gained by the DAST over SSSwithout significant impact on the final result However theimpact of energy consumption (119864
119862) should not be overlooked
in a larger system as its value would loom large and becomesignificant to the difference of energy betweenDAST and SSS
42 Results of Energy Obtained by DAST and SSS Figure 11presented the daily energy captured by DAST and SSS for a
5 10 15 200
200
400
600
800
1000 Irradiance versus local time
Local time (hr)
DAST (measured)DAST (modelled)Horizontal
Irra
dian
ce (W
m2)
Figure 9 Measured and modeled (anisotropic diffuse model)instantaneous irradiance of DAST and measured irradiance ofhorizontally positioned SSS
Tracking
Tracking voltage 13V
Current drawn 06ADuration sim15 s
Figure 10The voltage of the tracking system119881track and the currentdrawn 119868drawn during the tracking process
month in a bar chart There are various conditions such assunny days cloudy days and rainy days during this monthwhich is the typical climate of Malaysia The weather in amonth could act as a miniature of the weather in a year
Hence the underlying factor that determines the amountof advantage of DAST over SSS has to be found out Asa result it leads to the investigation of the energy gain ofboth DAST and SSS with respect to clearness index Theclearness index is imperative for the performance evaluationof a PV system It indicates the clarity of a day and the
8 International Journal of Photoenergy
0 5 10 15 20 25 30 350
05
1
15
2
25Daily energy of DAST and SSS (month)
Day
DASTSSS
Ener
gy (k
Whr
m2)
Figure 11The daily energy captured by DAST and SSS for a month
potential amount of sunlight for converting the solar energyinto electrical energy by the PV system The availability ofabundant direct sunlight in a day has a profound impact onthe energy generated by a PV system
Generally a direct proportional relationship could behypothesized for bothDASTand SSSwith respect to clearnessindex Based on the performance of both clear and overcastdays reported on previous section it could be deducedthat DAST responds to clearness index on a more sensitivemanner compared to a SSS This is due to its ability to trackthe position of the sun and capturedmaximum sunlight fromsunrise to sunset
Figure 12 shows the energy captured by theDAST and SSSplotted against clearness index for a month The trend linesfor both systems are generated by using basic fitting inMatlabThe standard deviation of DAST and SSS is 00418 kWhrm2and 00175 kWhrm2 respectivelyThe slope for both systemswith respect to clearness index is apparently distinct fromeach other Both trends of SSS and DAST have shown a lineargrowth with respect to clearness index However DAST has asteeper slope compared to SSS On the other hand at the dayswith low clearness index (below 022) presumably rainy daysDAST would have lower energy gain than SSS as shown inthe extrapolation from the graph It is due to the fact that theavailable solar radiation in those days is dominantly diffuseradiation Direct radiation would be absent or at a relativelyminimal levelTherefore DAST has no advantage over SSS atthis range of clearness index
On the other side of the clearness index the energycaptured by DAST increases in a steeper slope compared toSSS as the clearness index climbs from medium (04) to high(06) level Thus it fortifies the inference that greater amountof energy will be captured by DAST compared to SSS as theclearness index increase In other words the application ofDAST ensures a performance boost of a PV system and theoutcome is exceptionally well as the clearness index increasesIn addition the trends of both DAST and SSS with respectto clearness index show that a clearness index offers a goodestimation for energy generation on different weather
43 Results of Daily Clearness Index An endeavor to dis-cover the relationship between clearness index and trackingadvantage of DAST is made by plotting both efficiency and
0 02 04 06 080
02
04
06
08
1
12
14 Energy versus clearness index
Clearness index
SSSSSS trend
DASTDAST trend
Ener
gy (k
Whr
m2)
Figure 12 The energy captured by DAST and SSS against clearnessindex for a month
additional electrical energy gained over the clearness indexfor one month duration There are different kinds of weatherwithin the period which includes sunny overcast partialcloudy and rainy days Figures 13 and 14 show the graphs ofefficiency (120578) and Energy Gain (119864
119866) versus daily Clearness
Index (119870119879) by one month data of May 2013 A linear trend
line is plotted via basic fitting for both graphs respectivelyGenerally these two graphs exhibit a weak trend of 120578 and 119864
119866
proportional to 119870119879 The standard deviation of the efficiency
and energy gain is 71757 and 00355 kWhrm2The advantage of DAST over SSS is more remarkable at
sunny day with high 119870119879(between 05 and 06) compared
to the overcast and rainy day with low 119870119879(between 02
and 04) A clear and quantitative conclusion could notbe drawn on the advantage of DAST based on the dailyclearness index It appears that there are some days thatthe efficiency and energy gain is scattered far off from thelinear trend lines Hence a look on the energy gain versustime on Figure 8 would give a more detailed insight on howthe slope of the DAST tracking advantage changes in a dayIt has been found that the effectiveness or energy gain ofDAST is particularly well in the morning and evening ascompared to during themiddayThis explains the weak trendabove as the daily clearness index lump the slopes of theDAST tracking advantage on morning midday and eveningwithout considering that they have different value of slope
44 Results of Segmented Clearness Index It is necessary todivide the clearness index into three segments period whichare morning (0700ndash1100) midday (1101ndash1500) and evening(1501ndash1900) for a better visualization of the influence of
International Journal of Photoenergy 9
02 03 04 05 06 0710
20
30
40
50
60Efficiency versus clearness index
Clearness index
Effici
ency
()
Figure 13 Efficiency of DAST over SSS versus daily clearness index
clearness index Nevertheless the splitting of the day intothree segments is not without a tradeoff Since the clearnessindex is split into three periods the efficiency of DAST overSSS for a single day could not be established as the portioncontributed by efficiency for three periods and could not besummed into a total amount as energy gain Thus the totalefficiency of a single day could not be obtained although thetotal energy gain of DAST can be summed from the threesegments The tradeoff is justified as a more accurate energygain of DAST over SSS resulted from the segmented analysisAn accurate energy gain is extremely handy for estimatingthe additional profit generated by DAST as the Feed-In Tariff(FID) is based on the energy generated (kWhr) instead ofefficiency Figure 15 shows the energy gain of DAST over SSSversus clearness index on three segments period The threetrend lines are generatedwith polyfit and polyval functions inMatlab by fitting the experimental data points in least squaresense The trend lines on morning midday and evening forenergy gain versus clearness index are fitted in second-orderpolynomial based on the scattered data points Apparentlythe trend of energy gain with respect to clearness index isclearer as the day is being segmented into three periodsAgain the sharp slopes of the efficiency and energy gainof DAST over SSS during the morning and evening periodare different compared to the smaller slope in midday Theslope of the energy gain is lower at midday because SSS ispositioned on a horizontal orientation During the middaysun light strikes on the PV panel of SSS with a smallerincidence angle compared to morning and evening Mostof the solar energy is captured by SSS within this periodThus the energy gained by DAST over SSS increases in asmaller slope as clearness index increases During morningand evening DAST has the advantage of facing the solar diskwhile SSS stay on its static horizontal position As a result theenergy gained byDAST is a lot greater as the day is clearer and
02 03 04 05 06 070
01
02
03
04
05 Energy gain versus clearness index
Clearness index
Ener
gy g
ain
(kW
hm
2)
Figure 14 Energy gain of DAST over SSS versus daily clearnessindex
more solar energy is availableHowever the advantage dimin-ishes as the clearness index drops As clearness index dropsbelow approximately 015 the energy captured by DAST isless than SSS as there is only diffuse radiation availableA horizontally positioned SSS inclined position Anyway theenergy captured on this level of clearness index is marginalThe standard deviation for the trend lines and data pointsare 00113 kWhrm2 00133 kWhrm2 and 00109 kWhrm2for morning midday and evening respectively It seems thatthe data points are distributed in a smaller range in the threesegments clearness index compared to the daily clearnessindex shown in previous section Hence the energy gain of aDAST over SSS can be estimated in a better accuracy by usingsegmented clearness index graph given the clearness index ofa site
45 Comparison of Energy Gain of Seven Cities by Using Seg-mented Clearness Index and Anisotropic Model The energygain versus segmented clearness index graph is used toestimate the energy gain of other cities in PeninsularMalaysiabased on the segmented clearness index of the cities respec-tively The performance improvement of DAST over SSS inseven cities of Peninsular Malaysia including Bayan LepasIpoh KuantanMuadzam Shah Langkawi Senai and Subangare being estimated by the segmented clearness index graphmethod as shown in Figure 16 The hourly data of globalirradiation over horizontal surface in 2009 for the seven citiesis obtained fromMalaysiaMeteorological DepartmentThesedata were measured by using pyranometer in the weatherstations at the seven cities respectively Segmented clearnessindex can be generated from these data and plotted on thesegmented clearness index graphs to compute the energy gainof DAST over SSS Moreover these data are also put intoHDKR anisotropic model to develop the global irradiationover the DAST [21] Electrical energy generated by both
10 International Journal of Photoenergy
0 02 04 06
Energy gain versus clearness index
Clearness index
MorningMorning trendMidday
Midday trendEveningEvening trend
minus005
0
005
01
015
02
Ener
gy g
ain
(kW
hm
2)
Figure 15 Energy gain of DAST over SSS on 3 segments period
DAST and SSS can be converted from the global irradiationrespectively by using the average effectiveness of the PVpanel on DAST and SSS 015 The energy generated for bothsystems in a year are being averaged into a mean daily energygenerated and divided into three segments Subsequentlyaverage energy gain of DAST over SSS on the three periodscan be obtained by using the mean energy generated for bothsystems in three segments
The average efficiency and energy gain of DAST overSSS in three segments of a day by using anisotropic modelare plotted on the segmented clearness index graphs It isobserved that there are some similarities on the response ofefficiency and energy gain of DAST over SSS with respectto the segmented clearness index in both anisotropic modeland segmented clearness index curve from experimentalThe slopes of both anisotropic model and experimentalgenerally agree with each other albeit some discrepanciesappearing due to some reasons The value generated fromanisotropic model tends to be slightly higher due to thehorizon brightening component that may be estimated ona higher level than the actual level [22] Besides that anaccurate estimation of the irradiation for anisotropic modelcannot be obtained as there are a few days in a year thatthe weather stations in the seven cities were undergoingmaintenance and data are not available during the short stintNonetheless it has shown that the segmented experimentalgenerated curve that can be used to estimate the energy gainof DAST over SSS with a low margin of error The energygain of DAST over SSS based on both anisotropic modeland segmented experimental generated curve are tabulatedon Tables 2 3 and 4 for morning midday and eveningIt has been shown that in terms of energy gain of DAST
02 03 04 05 06 070
005
01
015
02Energy gain versus clearness index
Clearness index
Morning citiesMorningMidday cities
MiddayEvening citiesEvening
Ener
gy g
ain
(kW
hm
2)
Figure 16 Energy gain of DAST over SSS for 7 cities developed byanisotropic model on 3 segments clearness index
Table 2 Energy gain based on experimental curve and isotropicmodel on morning segment
Cities 119870119879
Energy gain (kWhrm2)Experiment Anisotropic
Bayan Lepas 0458 0083 0071Ipoh 0476 0091 0088Kuantan 0515 0112 0119Langkawi 0619 0175 0183Muadzam Shah 0455 0081 0074Senai 0417 0064 0055Subang 0492 0099 0095
over SSS Langkawi has the greatest potential for installingDAST while Senai has the least advantage among the sevencities Langkawi is an island and is close to the coastal areathe clearness index is higher and clearer days are availablethroughout the year Senai is on the southern part of thePeninsular Malaysia and in an inland site which leads tohigher precipitation and relatively regular rainfall Hence ithas lower clearness index on three segments of the day andlower energy gain of using DAST
Consider a proposed 1MWPV solar farm in Langkawiwhich is expected to produce 1310MWhr from horizontalorientation system per year from 4800 solar panels Theadditional profit by incorporating DAST onto this solarfarm is calculated The Malaysia feed-in-tariffs (FIT) forgrid-connected PV systems with 1MW capacity are up to$035kWhr as of year 2013 The additional energy gain ofDAST in Langkawi is 031 kWhrm2 A 1MWPV systemwith 210W and an area of 1283m2 PV panels could generate
International Journal of Photoenergy 11
Table 3 Energy gain based on experimental curve and isotropicmodel on midday segment
Cities 119870119879
Energy gain (kWhrm2)Experiment Anisotropic
Bayan Lepas 0561 0071 0075Ipoh 0564 0071 0073Kuantan 0494 0060 0062Langkawi 0529 0066 0073Muadzam Shah 0495 0060 0062Senai 0418 0049 0053Subang 0570 0072 0074
Table 4 Energy gain based on experimental curve and isotropicmodel on evening segment
Cities 119870119879
Energy gain (kWhrm2)Experiment Anisotropic
Bayan Lepas 0490 0105 0101Ipoh 0370 0048 0052Kuantan 0391 0056 0046Langkawi 0420 0069 0064Muadzam Shah 0354 0041 0035Senai 0262 0015 0020Subang 0401 0061 0071
Table 5 Technical characteristics of PV panel
Sanyo HIP-210NKHB5Maximum power (119875max) [W] 210Max power voltage (119881mp) [V] 413Max power current (119868mp) [A] 509Open circuit voltage (119881oc) [V] 509Short circuit current (119868sc) [A] 557Dimension (119871 lowast119882 lowast 119863) [m] 158 lowast 0812 lowast 0035
Weight [kg] 15Cell efficiency [] 189Module efficiency [] 164
an additional energy of 1909 kWhr per day Assume a 10inverter loss for converting the DC (Direct Current) powerfrom PV into AC (Alternating Current) for feeding into grid$60134 daily extra profit can be obtained by using DASTAn annual additional profit of $219499 is the advantage ofDAST over SSS Similar financial analyses on the other citieswhich are being done and the additional financial gain dueto the advantage of DAST over SSS are shown in Figure 17The estimated profit could offer important information forsolar farm investor in making decision whether the long-term investment is sustainable after deducting the one-offadditional cost of mechanical structure and motor for DASTMore detailed studies on the cost estimation of DAST and itsvariation with respect to capacity will be the goal for futurework In this analysis the focus is put upon the averageadditional energy gain of DAST over SSS with respect toclearness index
B L
epas
Ipoh
Kuan
tan
Lang
kaw
i
M S
hah
Sena
i
Suba
ng
0
05
1
15
2
25 Estimated profit for 7 cities with DAST
Cities
US
dolla
r ($)
times105
Figure 17 Estimated additional financial gain for seven cities withDAST
5 Conclusion
This work demonstrates the correlation of clearness indexwith energy gain and efficiency of DAST over SSS basedon experimental setup Apparent advantage of DAST occursin morning and evening sessions due to the ability ofDAST to follow the sunrsquos position throughout the day ascompared to the static position of SSS A segmented clearnessindex graph for the experimental result is plotted and itshows a lower standard deviation and better correlationfor clearness index with both energy gain and efficiencyduring morning midday and evening This correlation hasbeen used respectively to estimate the energy gain of sevencities in Peninsular Malaysia and compared with their valuedeveloped by anisotropic model A similar trend for theresponse of energy gain and efficiency to clearness index isfound It shows that this correlation can offer an estimationof the energy gain of DAST over SSS while consideringthe potential of installing PV system on a site Additionalfinancial gain due to the advantage of DAST over SSS forseven cities is also calculated based on a 1MWPV solar farmcase study and Malaysia feed-in-tariffs (FIT) Moreover thiswork could be a starting point for further detailed economicanalysis for DAST More economical details included costanalysis of DAST ground field price and payback periodcould be explored to validate the investment model of DASTsolar farm in the future works
Nomenclature
DAST Dual Axis Solar TrackerSSS Static Solar SystemPV Photovoltaic
12 International Journal of Photoenergy
119870119879 Clearness index for a day (-)
119896119879 Clearness index for an hour (-)
119866 Global solar radiation over a day (Wm2)119867119900 Extraterrestrial radiation over a day (Wm2)
119868119866 Global solar radiation over an hour (Wm2)
119868119900 Extraterrestrial radiation over an hour
(Wm2)119866SC Solar constant 1367 (Wm2)119899 Julian day (-)120601 Latitude (∘)120575 Declination (∘)120596119904 Sunset hour angle (∘)
1205961 Hour angle for start of an hour (∘)
1205962 Hour angle for end of an hour (∘)
Δ119864 Energy gain of DAST over SSS (kWhrm2)119864DAST Energy generated by DAST (kWhrm2)119864SSS Energy generated by SSS (kWhrm2)119864119862 Energy consumed by DAST (kWhrm2)
119881track The voltage of the tracking system (V)119868drawn The current drawn by the tracking system (A)MPPT Maximum Power Point Tracking (-)CV Constant Voltage method for MPPT (-)120578 Efficiency of DAST over SSS (-)119868119879 Radiation received by tilted surface (Wm2)
119868119861 Beam component of irradiance over horizon-
tal surface (Wm2)119877119861 Geometric factor (-)
119860119894 Anisotropy index (-)
119891 Modulating factor account for cloudiness (-)119868119863 Diffusive component of irradiance over hori-
zontal surface (Wm2)120573 Slope of tilted surface (∘)120588 Albedo (-)119868119866 Radiation received by horizontal surface
(Wm2)120579 Angle of incidence of beam radiation on tilted
surface (∘)120579119885 Solar zenith angle (∘)
120574 Solar azimuth angle (∘)
Acknowledgments
The authors thank the technical and financial assistanceof UM Power Energy Dedicated Advanced Centre(UMPEDAC) and the High Impact Research Grant (H-16001-00-D000032)
References
[1] T M Razykov C S Ferekides D Morel E Stefanakos HS Ullal and H M Upadhyaya ldquoSolar photovoltaic electricitycurrent status and future prospectsrdquo Solar Energy vol 85 no 8pp 1580ndash1608 2011
[2] K V K Reddy and M V Kumar ldquoModeling and a MPPTmethod for solar cellsrdquo Journal of Engineering and AppliedSciences vol 3 no 1 pp 128ndash133 2008
[3] H Mousazadeh A Keyhani A Javadi H Mobli K Abriniaand A Sharifi ldquoA review of principle and sun-trackingmethodsfor maximizing solar systems outputrdquo Renewable and Sustain-able Energy Reviews vol 13 no 8 pp 1800ndash1818 2009
[4] G K Singh ldquoSolar power generation by PV (photovoltaic)technology a reviewrdquo Energy vol 53 pp 1ndash13 2013
[5] J Rizk and Y Chaiko Solar Tracking System More Efficient Useof Solar Panels vol 41 World Academy of Science Engineeringand Technology 2008
[6] A-J N Khalifa and S S Al-Mutawalli ldquoEffect of two-axissun tracking on the performance of compound parabolicconcentratorsrdquo Energy Conversion andManagement vol 39 no10 pp 1073ndash1079 1998
[7] G C Bakos ldquoDesign and construction of a two-axis suntracking system for Parabolic TroughCollector (PTC) efficiencyimprovementrdquo Renewable Energy vol 31 no 15 pp 2411ndash24212006
[8] S Abdallah and S Nijmeh ldquoTwo axes sun tracking system withPLC controlrdquo Energy Conversion and Management vol 45 no11-12 pp 1931ndash1939 2004
[9] C Alexandru and M Comsit ldquoThe energy balance of the pho-tovoltaic tracking systems using virtual prototyping platformrdquoin Proceedings of the 5th International Conference on European(EEM rsquo08) pp 1ndash6 Electricity Market May 2008
[10] T Tomson ldquoDiscrete two-positional tracking of solar collec-torsrdquo Renewable Energy vol 33 no 3 pp 400ndash405 2008
[11] B Ai H Shen Q Ban B Ji and X Liao ldquoCalculation ofthe hourly and daily radiation incident on three step trackingplanesrdquo Energy Conversion andManagement vol 44 no 12 pp1999ndash2011 2003
[12] E Lorenzo M Perez A Ezpeleta and J Acedo ldquoDesignof tracking photovoltaic systems with a single vertical axisrdquoProgress in Photovoltaics vol 10 no 8 pp 533ndash543 2002
[13] P Y Vorobiev J Gonzalez-Hernandez and Y V VorobievldquoOptimization of the solar energy collection in tracking andnon-tracking photovoltaic solar systemrdquo in Proceedings of the1st International Conference on Electrical and Electronics Engi-neering (ICEEE rsquo04) pp 310ndash314 Acapulco Mexico 2004
[14] N H Helwa A B G Bahgat A M R El Shafee and E T ElShenawy ldquoMaximum collectable solar energy by different solartracking systemsrdquo Energy Sources vol 22 no 1 pp 23ndash34 2000
[15] M A M Shaltout A Ghettas and M Sabry ldquoV-troughconcentrator on a photovoltaic full tracking system in a hotdesert climaterdquo Renewable Energy vol 6 no 5-6 pp 527ndash5321995
[16] M J Clifford and D Eastwood ldquoDesign of a novel passive solartrackerrdquo Solar Energy vol 77 no 3 pp 269ndash280 2004
[17] A Al-Mohamad ldquoEfficiency improvements of photo-voltaicpanels using a sun-tracking systemrdquoApplied Energy vol 79 no3 pp 345ndash354 2004
[18] K S Karimov M A Saqib P Akhter M M Ahmed J AChattha and S A Yousafzai ldquoA simple photo-voltaic trackingsystemrdquo Solar Energy Materials and Solar Cells vol 87 no 1ndash4pp 49ndash59 2005
[19] W D Lubitz ldquoEffect of manual tilt adjustments on incidentirradiance on fixed and tracking solar panelsrdquo Applied Energyvol 88 no 5 pp 1710ndash1719 2011
[20] F Cruz-Peragon P J Casanova-Pelaez F A Dıaz R Lopez-Garcıa and J M Palomar ldquoAn approach to evaluate the energyadvantage of two axes solar tracking systems in Spainrdquo AppliedEnergy vol 88 no 12 pp 5131ndash5142 2011
International Journal of Photoenergy 13
[21] D T Reindl W A Beckman and J A Duffie ldquoEvaluation ofhourly tilted surface radiationmodelsrdquo Solar Energy vol 45 no1 pp 9ndash17 1990
[22] J A Duffie and W A Beckman Solar Engineering of ThermalProcesses John Wiley amp Sons New York NY USA 2004
[23] B Y H Liu and R C Jordan ldquoThe long-term average perfor-mance of flat-plate solar-energy collectors with design data forthe US its outlying possessions and Canadardquo Solar Energy vol7 no 2 pp 53ndash74 1963
[24] R Perez R Seals P Ineichen R Stewart and D Menicucci ldquoAnew simplified version of the perez diffuse irradiance model fortilted surfacesrdquo Solar Energy vol 39 no 3 pp 221ndash231 1987
[25] D G Erbs S A Klein and J A Duffie ldquoEstimation of thediffuse radiation fraction for hourly daily andmonthly-averageglobal radiationrdquo Solar Energy vol 28 no 4 pp 293ndash302 1982
[26] C Alexandru ldquoA novel open-loop tracking strategy for photo-voltaic systemsrdquo The Scientific World Journal vol 2013 ArticleID 205396 12 pages 2013
[27] K A Aganah and A W Leedy ldquoA constant voltage maximumpower point tracking method for solar powered systemsrdquo inProceedings of the 43rd IEEE Southeastern Symposium on SystemTheory (SSST rsquo11) pp 125ndash130 Auburn Ala USA March 2011
[28] N A Kelly and T L Gibson ldquoImproved photovoltaic energyoutput for cloudy conditions with a solar tracking systemrdquo SolarEnergy vol 83 no 11 pp 2092ndash2102 2009
[29] N A Kelly and T L Gibson ldquoIncreasing the solar photovoltaicenergy capture on sunny and cloudy daysrdquo Solar Energy vol 85no 1 pp 111ndash125 2011
Submit your manuscripts athttpwwwhindawicom
Hindawi Publishing Corporationhttpwwwhindawicom Volume 2014
Inorganic ChemistryInternational Journal of
Hindawi Publishing Corporation httpwwwhindawicom Volume 2014
International Journal ofPhotoenergy
Hindawi Publishing Corporationhttpwwwhindawicom Volume 2014
Carbohydrate Chemistry
International Journal of
Hindawi Publishing Corporationhttpwwwhindawicom Volume 2014
Journal of
Chemistry
Hindawi Publishing Corporationhttpwwwhindawicom Volume 2014
Advances in
Physical Chemistry
Hindawi Publishing Corporationhttpwwwhindawicom
Analytical Methods in Chemistry
Journal of
Volume 2014
Bioinorganic Chemistry and ApplicationsHindawi Publishing Corporationhttpwwwhindawicom Volume 2014
SpectroscopyInternational Journal of
Hindawi Publishing Corporationhttpwwwhindawicom Volume 2014
The Scientific World JournalHindawi Publishing Corporation httpwwwhindawicom Volume 2014
Medicinal ChemistryInternational Journal of
Hindawi Publishing Corporationhttpwwwhindawicom Volume 2014
Chromatography Research International
Hindawi Publishing Corporationhttpwwwhindawicom Volume 2014
Applied ChemistryJournal of
Hindawi Publishing Corporationhttpwwwhindawicom Volume 2014
Hindawi Publishing Corporationhttpwwwhindawicom Volume 2014
Theoretical ChemistryJournal of
Hindawi Publishing Corporationhttpwwwhindawicom Volume 2014
Journal of
Spectroscopy
Analytical ChemistryInternational Journal of
Hindawi Publishing Corporationhttpwwwhindawicom Volume 2014
Journal of
Hindawi Publishing Corporationhttpwwwhindawicom Volume 2014
Quantum Chemistry
Hindawi Publishing Corporationhttpwwwhindawicom Volume 2014
Organic Chemistry International
ElectrochemistryInternational Journal of
Hindawi Publishing Corporation httpwwwhindawicom Volume 2014
Hindawi Publishing Corporationhttpwwwhindawicom Volume 2014
CatalystsJournal of
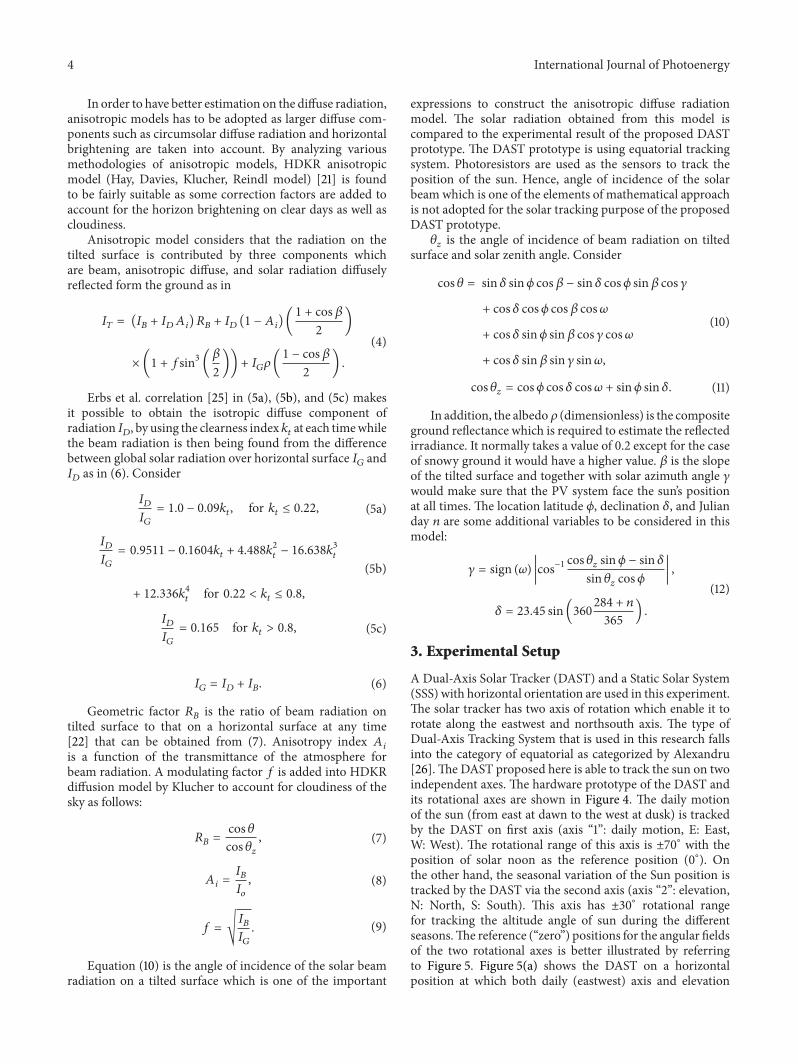
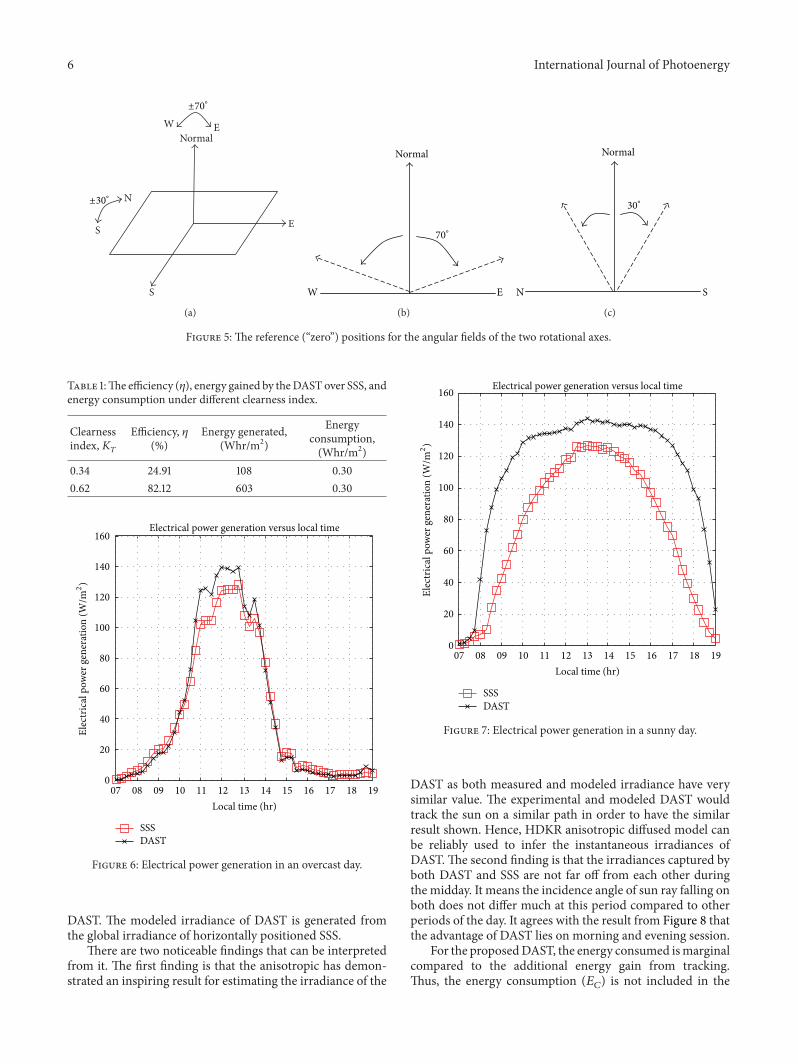