research article open access patterns of species … · research article open access patterns of...
TRANSCRIPT

Tripathi and Shankar Forest Ecosystems (2014) 1:23 DOI 10.1186/s40663-014-0023-2
RESEARCH ARTICLE Open Access
Patterns of species dominance, diversity anddispersion in ‘Khasi hill sal’ forest ecosystem innortheast IndiaAmit Kumar Tripathi and Uma Shankar*
Abstract
Background: The ‘Khasi hill sal’ forest ecosystem in Meghalaya, India represents the easternmost limit of saldistribution. We tested if tree diversity and compositional heterogeneity of this ecosystem was higher than othersal-dominated forests due to moister environment.
Methods: Vegetation was sampled in 11 transects of 10 m width and up to 500 m length covering 5.2 ha area. Allstems ≥ 10 cm girth at breast height were enumerated.
Results: We found a pattern of mixed dominance of Shorea robusta (sal) and Schima wallichii and co-dominance ofPinus kesiya and Careya arborea. The Shannon’s diversity index (H′) was 3.395 nats. This value is remarkably high andcompetitive to that of moist sal forests of eastern Himalayan foothills and sal-dominated forests of Tripura. A highvalue of H′ was manifested by: a) high species richness (S = 123), b) good equitability (70.6%), c) ‘fair’ resourceapportionment, and d) abundance of rare species (84% species with less than one per cent of total individuals, 67%species with two or less individuals ha−1 and 59% species with one or less individuals ha−1). The compositionalheterogeneity was ‘fair’ (Whittaker’s βw = 3.15). The presence of Fagaceae with six species commanding 4.3% ofimportance value (IVI) and of a pine (P. kesiya) in sal forest was remarkable. As many as 58 species showed ‘lowdensity (≤ 10 individuals ha−1), uniform dispersion’, five species achieved ‘higher density (> 10 individuals ha−1),uniform dispersion’ and six of the top 10 species were ‘clumped’. The forest showed an exponential demographiccurve illustrating ‘good’ regeneration of an expanding community. Vertical stratification was simple with a poorcanopy and fair subcanopy, which together with low basal area (15.65 m2 · ha−1 for individuals ≥ 10 cm gbh)indicated logging of mature sal trees in the past.
Conclusions: The ‘Khasi hill sal’ forest ecosystem is richer in alpha and beta diversity than most sal-dominatedforests, but past logging has reduced basal area. Selective removal of small timber and firewood, slash-and-burnagriculture and recurrent burning of forest floor are the principal anthropogenic factors controlling forest structureand regeneration of species.
Keywords: Forest structure; Phytosociology; Floristics; Beta diversity; Abundance; Species dispersion; Populationstructure; Regeneration; Shorea robusta
BackgroundSal (Shorea robusta)-dominated forest ecosystems occurmainly in India, Nepal, Bangladesh and Bhutan (Troup1921), and as a single forest formation, occupy max-imum geographical area of nearly 12 million ha in SouthAsia (Tiwari 1995; Gautam and Devoe 2006). The excep-tional presence of trees of sal is reported from Myanmar
* Correspondence: [email protected] of Botany, North-Eastern Hill University, Shillong 793 022, India
© 2014 Tripathi and Shankar; licensee SpringerCommons Attribution License (http://creativecoreproduction in any medium, provided the orig
and southwestern China, but sal-dominated forests are un-known. Sal forests occur in areas receiving 100 cm or moreannual rainfall on alluvial and lateritic soils. In centralIndia, sal predominates in Vindhya and Satpura ranges.The eastern limit of natural range of sal forests is in theState of Assam in northeast India. Nearly 2000 km longarc of sal distribution at the foothills (terai) of Himalayaextends from Shivalik hills in Himachal Pradesh toSonitpur district in northern reaches of Brahmaputra
. This is an Open Access article distributed under the terms of the Creativemmons.org/licenses/by/4.0), which permits unrestricted use, distribution, andinal work is properly credited.

Tripathi and Shankar Forest Ecosystems (2014) 1:23 Page 2 of 20
valley. In the south of Brahmaputra river, sal forestsextend eastward up to Nagaon district (Dutta and Devi2013a, b). In Meghalaya, sal forests occur on foothillsof the plateau and are predominant on northern slopes.Our study sites in Ri-Bhoi district represent a commu-nity of sal, which is a continuum of the eastern limit ofsal forests in adjacent Nagaon district. On the south ofMeghalaya, sal forests occur mainly in central part ofBangladesh (Rahman 2011) and in the State of Tripuraof India (Majumdar et al. 2012, 2014). The sal forests inGaro-Khasi-Jaintia hill range of Meghalaya form a partof the Patkai complex of mountains. In these hills, saloccurs up to about 900 m, which is probably the high-est altitude known for occurrence of sal. These sitesalso represent an ecotone between two ecoregions, viz.,Brahmaputra valley semievergreen forests and Meghalayasubtropical forests (Olson and Dinerstein 1998). This zoneis characterized by gradual disappearance of sal and occur-rence of pine (Pinus kesiya).After the dawn of forestry management in Bengal in 1865
by the colonial government (Shankar et al. 1998a), sal for-ests were the principal source of timber for railway sleepers,house building and furniture. Areas blanked by extractionof sal trees were planted with teak (Tectona grandis), espe-cially in eastern and northeastern India (Tewari et al. 2014).In most sal forests, S. robusta is generally the most domin-ant species commanding up to three-fourth of density andimportance value and even greater proportion of basal area.Historically, sal forests were regarded ‘species poor’ as notmany other species and their individuals were suitable fortimber extraction. A study from foothills of DarjeelingHimalaya showed that the diversity of tree species is muchhigher in sal forests than previously hypothesized (Shankar2001). Subsequent studies from the same region confirmedthe trend (Kushwaha and Nandy 2012).The large expanse of sal forests in South Asia encom-
passes a variety of climate: dry habitats in west to moisthabitats in east, plain to foothills, high to moderate tem-peratures and low to high latitudes in the northern trop-ical region of Indian subcontinent. These variations havecaused differences in floristic composition and structureof sal forests. Although an appreciable number of studieson sal forests are available, many sal-dominated forestsstill need inventory. In this study, we analyze the pat-terns of dominance, diversity and dispersion of tree spe-cies in a previously undocumented ‘Khasi hill sal’ forestin Meghalaya, which not only represents the eastern-most limit of sal forests, but also occupies the highest al-titudes among sal-dominated forests. We presumed thattree diversity and compositional heterogeneity (beta diver-sity) would be greater in sal forests of Meghalaya due tomoister environment as compared to sal forests of centraland northern India. We collated phytosociological attri-butes of sal forests of similar environment in eastern and
northeastern India to compare and discuss our results.The study produced a pattern of mixed dominance of spe-cies, uniform dispersion of most rare species and a highvalue of Shannon’s diversity index (H′) which is close tothe highest value known from sal forests.
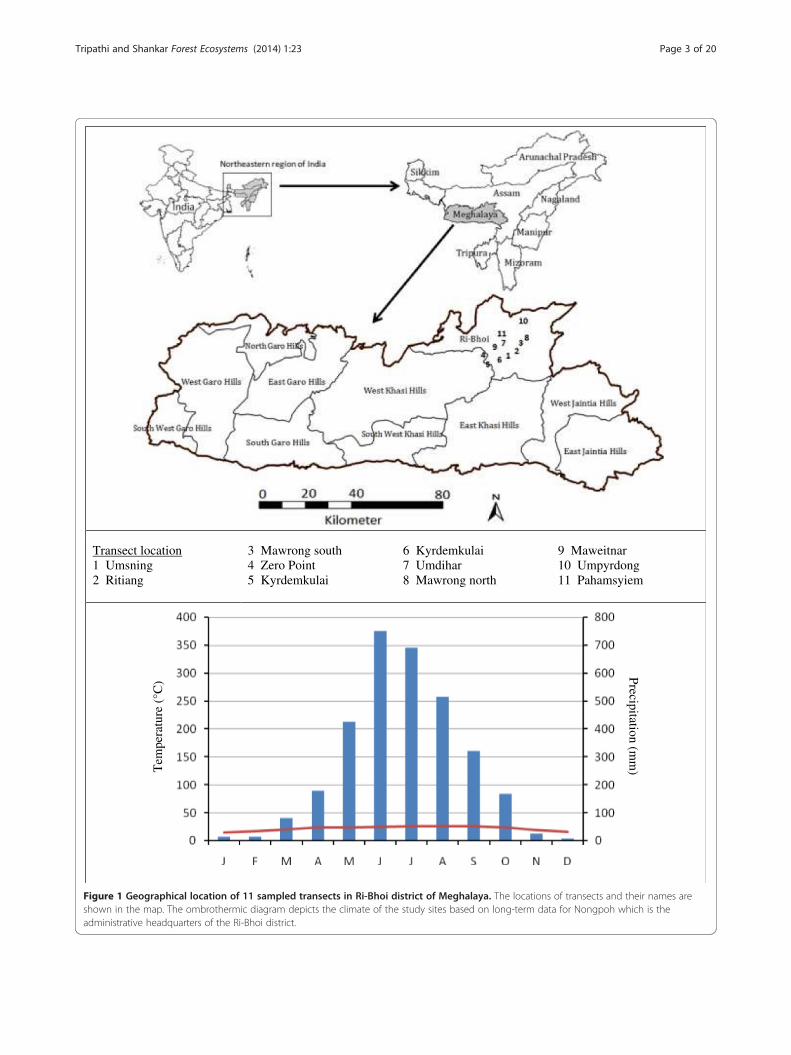
MethodsStudy areaThe hilly State of Meghalaya lies between 24°02′ and 26°07′ N latitude and 89°48′ and 92°51′ E longitude andcovers a geographical area of 22429 km2 (Figure 1). Themost area of Meghalaya is included in ‘Indo-Burma’global hotspot of biodiversity (Myers 2003). The lowelevations all along the periphery of Meghalaya plateauexperience fairly high temperature, whereas the higherelevations in the centre of the plateau have the benefit ofmoderate temperature (Figure 1). The average annualtemperature is 21.8°C and rainfall is 3200 mm at Nongpoh(572 m) close to the study sites (Anonymous 2014). Thewarmest month of the year is August with an averagetemperature of 25.9°C and the coolest month is Januarywith an average temperature of 15.1°C. The southwestmonsoon moving from the Bay of Bengal causes heavyrainfall on the southern aspect of the plateau and thenit diminishes northward, creating a rainfall gradient(Shankar et al. 1993). About 80% of the rain falls duringrainy season and the most of the remainder falls inspring, rendering the winter cool and dry (Shankar et al.1991). The climate is controlled by Asia-Pacific monsoonwith following distinct seasons: spring (March–April), rainy(May–September), autumn (October–mid-November) andwinter (mid-November–February).The incredible variation in geology, topography and cli-
mate has resulted in formation of red sandy loam, clayloam and alluvial soils. The red loam soils occur in thecentral part of the Garo Hills and on the uplands of cen-tral and eastern Meghalaya. Alluvial soils occur at foothillsand along river courses along the northern, western andsouthern border of the State. The most soils are lateritic(oxisol) type derived from Archaen gneisses, schists andgranites (Gnasser 1964). The soils of Meghalaya are acidicwith pH varying from 3.8 to 6.9 (Shankar et al. 1991).Meghalaya has six principal forest types: i) tropical ever-
green forest, ii) tropical moist mixed deciduous forest, iii)‘Khasi hill sal’ forest, iv) Khasi-Jaintia subtropical pine for-est, v) Khasi subtropical mixed broadleaved forest, and vi)Khasi subtropical oak-dominated forest. The sal foreststudied here corresponds to ‘Khasi hill sal’ forests [cat-egory 3C/C1 Ia(ii)] of the seminal work of Champion andSeth (1968) on forest types of India. Champion and Seth(1968) considered ‘Khasi hill sal’ forest as ‘true climax’ andremarked that continued burning for jhum (slash-and-burn agriculture) is extending its territory on higher alti-tudes where Schima wallichii is a major component.
Transect location1 Umsning2 Ritiang
3 Mawrong south4 Zero Point5 Kyrdemkulai
6 Kyrdemkulai7 Umdihar8 Mawrong north
9 Maweitnar 10 Umpyrdong11 Pahamsyiem
Precipitation (mm
)Tem
pera
ture
(°C
)
Figure 1 Geographical location of 11 sampled transects in Ri-Bhoi district of Meghalaya. The locations of transects and their names areshown in the map. The ombrothermic diagram depicts the climate of the study sites based on long-term data for Nongpoh which is theadministrative headquarters of the Ri-Bhoi district.
Tripathi and Shankar Forest Ecosystems (2014) 1:23 Page 3 of 20

Tripathi and Shankar Forest Ecosystems (2014) 1:23 Page 4 of 20
Champion and Seth (1968) did not record presence ofpine (P. kesiya) in this forest type probably because theyobserved this forest below 650 m altitude. Our study hasplots in the upper limits of ‘Khasi hill sal’ forest, between500 and 900 m, where it forms an ecotone with sub-tropical pine forest which is a predominant vegetationtype ranging from 1000 to 1900 m altitude. Championand Seth (1968) also remarked that ‘Khasi hill sal’ isclosely allied to Himalayan sal forests.
MethodologyField samplingThe vegetation was sampled in 5.2 ha area of 11 tran-sects in Ri-Bhoi District in Meghalaya. Each transect hada width of 10 m and a length up to 500 m depending onthe accessibility of the sampling site (Table 1). A transectencompasses contiguous subplots of 500 m2 (i.e., 10 m ×50 m). All individuals (stems) ≥ 10 cm girth at breastheight (1.37 m above the ground level) were included inenumeration. Each stem was measured for girth (cm),height (m) and damage (top broken, lopping, disease etc.)following Murali et al. (1996) and Shankar et al. (1998b).The voucher specimens of species were collected, packedin polythene bags, dried in a herbarium press and proc-essed to put up on the herbarium sheets following Jainand Rao (1976).The plant species were identified and their habits veri-
fied from the regional floras (Hooker 1872–1897; Kanjilalet al. 1934–1940; Balakrishnan 1981 & 1983; Haridasanand Rao 1985 & 1987). The herbarium at the BotanicalSurvey of India, Eastern Circle, Shillong was consulted foridentification. The accepted names of species as well asfamily were adopted from The Plant List (2013).The species were classified into large tree, medium tree,
small tree, shrub, woody climber and scandent shrub
Table 1 Transect-wise distribution of sampled area, species recut and multi-stemmed categories in ‘Khasi hill sal’ forest of
Category Transect number
T1 T2 T3 T4 T5
Altitude 705 749 856 637 738
Transect width (m) 10 10 10 10 10
Transect length (m) 500 500 500 400 500
Transect area (ha) 0.5 0.5 0.5 0.4 0.5
All stems 349 622 442 328 328
Cut stems 10 9 19 19 30
Live stems 339 613 423 309 298
Forks 8 71 89 57 76
Individual stems 331 542 334 252 222
Species recorded 29 23 37 28 36
following Shankar (2001). The species in emergent can-opy, subcanopy and understory were considered as largetree, medium tree and small tree, respectively. The multi-stemmed species with < 30 cm girth were considered asshrub and the climbers ≥ 10 cm girth were labelled aswoody climber. The perennial species which exhibitedclimbing nature at the top were scandent shrubs.
Data analysisThe occurrences of a species in contiguous subplots of500 m2 were taken into account for calculation of fre-quency (Mueller-Dombois and Ellenberg 1974). The dens-ity of a species in a hectare was determined by dividingthe count of individuals in all transects by the total areasampled. The stand density was the sum of the densitiesof all species in the community. The basal area of each in-dividual was calculated from its respective girth and inmulti-stemmed individuals, basal area of each stem wascalculated separately (Shankar 2001). The basal areas of allindividuals of a species were summed to arrive at the totalbasal area of the respective species. The stand basal areawas the sum of the basal areas of all species in the com-munity. For each species, the values of frequency, densityand basal area were converted into relative values bydividing respectively by sums of frequencies, densities andbasal areas of all species. The importance value index(IVI) of a species was computed by summing up relativedensity, relative frequency and relative basal area (Curtisand McIntosh 1950).The synthetic characters of the community were com-
puted following standard methods. The dispersion of thespecies was studied by variance-to-mean ratio (Greig-Smith1983). A ratio of 1.0 indicates a random dispersion, < 1 auniform dispersion and > 1 an increasingly clumped disper-sion. The diversity indices were calculated using IVI values
corded and individuals ≥ 10 cm girth encountered in live,Meghalaya
Total
T6 T7 T8 T9 T10 T11
734 552 738 630 534 688 687
10 10 10 10 10 10 10
500 500 400 500 500 400 5200
0.5 0.5 0.4 0.5 0.5 0.4 5.2
487 343 388 678 421 414 4800
6 49 21 23 10 15 211
481 294 367 655 411 399 4589
52 33 61 86 11 53 597
429 261 306 569 400 346 3992
25 39 29 28 26 26 123

Tripathi and Shankar Forest Ecosystems (2014) 1:23 Page 5 of 20
of individual species in the community. The Shannon’sdiversity index was calculated following Shannon (1948) as:
H 0 ¼ −Xs
i¼1
niN
logeniN
The Simpson’s index of dominance was calculated fol-lowing Simpson (1949) as:
D ¼Xs
i¼1
ni ni−1ð ÞN N−1ð Þ
The Pielou’s index of evenness was calculated follow-ing Pielou (1975) as:
E ¼ H 0
H 0max
where ni = IVI of ith species, N = sum of IVI of all spe-cies, S = number of species in the community, H′max islogeS.The beta diversity (β) which refers to compositional
heterogeneity among sampling units (i.e., places in a re-gion, or transects in a vegetation type) was calculatedfrom species presence-absence data of sampled transectsfollowing Whittaker (1972) as follows:
βw ¼ γ=�αð Þ−1
where γ is total species diversity at regional or land-scape level and �α ¼ the mean species diversity at thelocal or within-habitat scale. The beta diversity is zero ifall species in all samples are same and is maximum ifthere is no overlap of species among all samples.The population structure of the forest (pool of all spe-
cies) as well as of individual species was studied in nine30 cm wide girth classes, viz., <30, 30 – < 60, 60 – < 90,90 – < 120, 120 – < 150, 150 – < 180, 180 – < 210,210 – < 240 and ≥ 240 cm. Similarly, the height structureof the forest (pool of all species) as well as of individualspecies was studied in six 5 m wide height classes, viz., <5,5 – < 10, 10 – < 15, 15 – < 20, 20 – < 25 and ≥ 25 m.The data were statistically treated and graphically plot-
ted in MS-Excel. The rank-abundance plot used naturallog-transformed values of IVI. A linear fit was applied torank-abundance plot to delineate resource sharing pat-tern by the species in the community (Magurran 1988).An exponential curve was fitted to depict stand’s popula-tion structure (girth and height class distributions) and achi-square test of goodness of fit evaluated the curve fit.The transects were clustered using paired-group algo-rithm and Bray-Curtis similarity measure in PAST soft-ware Version 2.17c (Hammer et al. 2001).
ResultsOf 4800 stems sampled in 5.2 ha area of 11 transects, 16stems of Musa paradisiaca, 42 clumps of bamboos, and153 cut stems were excluded and the remaining 4589 in-dividuals were included in further analysis (Table 1). Inall, 367 individuals were multi-stemmed (forked) with597 forks which were accounted for calculation of basalarea only (Table 1). Hence, 3992 live individuals were of10 cm or more girth and of these, 2331 individuals were30 cm or more girth.
Floristic compositionThe woody layer of ‘Khasi hill sal’ forest exhibited a totalof 3992 individuals of ≥ 10 cm girth in 5.2 ha sampledarea. These individuals represented 123 species in 89genera and 47 families (Table 2). A total of 119 speciescould be identified with certainty up to species level, twoup to genus level, and two up to family level (Table 2).As much as 27 families had one species, nine families twospecies, one family four species, three families five speciesand seven families more than five species. Leguminosaehad 11 species followed by Moraceae (10), Lauraceae (9),Phyllanthaceae (9), Rubiaceae (8), Fagaceae (6) and Malva-ceae (6). At generic level, Leguminosae topped with eightgenera followed by Malvaceae with six genera (Table 2).Majority of species (46) had small tress, 36 had mediumtrees, and 29 species had large trees. There were 5 shrubs,4 scandent shrubs and 3 woody climbers.Three families accounted for almost 50.0% of total in-
dividuals (Figure 2a): Dipterocarpaceae (25.7%), Thea-ceae (17.4%) and Pinaceae (6.6%). The next 17 families,each with one per cent or more but less than six per centindividuals, contributed 45.0% individuals. The remaining27 families, each with less than one per cent individuals,contributed only 5.4% individuals. Three families (Clusia-ceae, Magnoliaceae and Rosaceae) had only one individualeach and another five families (Araliaceae, Boraginaceae,Pandanceae, Proteaceae and Styracaceae) had only two in-dividuals each (Table 2).The top three families accounted 61.7% basal area
(Figure 2b): Dipterocarpaceae (25.8%), Theaceae (22.2%)and Pinaceae (13.7%). The next 10 families, each withone per cent or more but less than six per cent basalarea, contributed 30.8% basal area. The remaining 34families, each with less than one per cent basal area,contributed only 7.5% basal area.The top three families accounted 43.2% of total im-
portance value (Figure 2c): Dipterocarpaceae (19.4%),Theaceae (16.1%) and Pinaceae (7.8%). The next 17 fam-ilies, each with one per cent or more but less than sixper cent importance value, contributed 50.1% import-ance value. The remaining 27 families, each with lessthan one per cent importance value, shared only 6.6%importance value.

Table 2 Distribution of number of species, individuals (≥ 10 cm girth) and importance values (IVI) in different familiesaccording to their habit
Plant family Large tree Medium tree Small tree Shrub Climber Total IVI (%)
Actinidiaceae 492 492 1.0
Anacardiaceae 3 1674 1705 4.2
Apocynaceae 1 19 202 0.6
Aquifoliaceae 12 12 0.3
Araliaceae 2 2 0.0
Arecaceae 2 1 32 0.2
Bignoniaceae 3 6 92 0.5
Boraginaceae 2 2 0.1
Burseraceae 13 13 0.5
Cannabaceae 55 55 0.7
Clusiaceae 1 1 0.0
Dilleniaceae 4 4 0.2
Dipterocarpaceae 1026 1026 19.4
Elaeocarpaceae 5 5 0.2
Euphorbiaceae 873 42 915 2.3
Fagaceae 684 282 966 4.3
Iteaceae 3 3 0.1
Juglandaceae 69 69 1.7
Lamiaceae 63 1403 2 2055 6.0
Lauraceae 1 435 83 529 1.6
Lecythidaceae 211 211 4.8
Leguminosae 283 35 73 324 10211 3.9
Lythraceae 76 76 1.9
Magnoliaceae 1 1 0.1
Malvaceae 3 353 52 436 1.9
Meliaceae 6 5 112 0.4
Moraceae 73 22 264 2 3710 1.9
Myrtaceae 90 492 2 1414 4.1
Oleaceae 4 4 0.1
Pandanaceae 2 2 0.1
Pentaphylacaceae 21 21 0.6
Phyllanthaceae 132 2027 2159 5.6
Pinaceae 264 264 7.8
Primulaceae 3 2 32 0.1
Proteaceae 2 2 0.1
Rhamnaceae 42 42 1.0
Rosaceae 1 1 0.1
Rubiaceae 2 1207 1228 2.8
Rutaceae 3 3 0.1
Sabiaceae 32 32 0.1
Salicaceae 51 2 532 1.2
Sapindaceae 6 6 0.2
Smilacaceae 10 10 0.2
Tripathi and Shankar Forest Ecosystems (2014) 1:23 Page 6 of 20

Table 2 Distribution of number of species, individuals (≥ 10 cm girth) and importance values (IVI) in different familiesaccording to their habit (Continued)
Styracaceae 2 2 0.1
Symplocaceae 202 202 0.5
Theaceae 693 693 16.1
Vitaceae 17 17 0.5
Grand Total 235329 100836 522 46 245 857 3992123 100
A superscript indicates the number of species, if more than one.
Tripathi and Shankar Forest Ecosystems (2014) 1:23 Page 7 of 20
The ‘Khasi hill sal’ forests harbour many rare andsome threatened species. We could not determine withcertainty if any of 123 species were endemic to the areaof study or to the State of Meghalaya. However, somespecies appeared in IUCN Redlist (IUCN 2014): LowerRisk/Least Concern ver. 2.3 (Alstonia scholaris, Engelhard-tia spicata, S. robusta and Toona ciliata), Least Concernver. 3.1 (Bauhinia purpurea, Holarrhena pubescens, P.kesiya and Spatholobus parviflorus) and Data Deficientver. 2.3 (Mangifera indica).
Species richness and diversitySpecies varied from 23 to 39 per transect with a mean of29.6 and coefficient of variation 17.9% (Table 1). Themost species common to any two transects were 20 be-tween T3 and T8 and the least were six between T1 andT11. Nearly 51% species occurred in a single transect,18% in two, 9% in three, 6% in four and 16% in six ormore transects (Figure 3). S. robusta and S. wallichiioccurred in all transects. The cluster analysis yielded aCophenetic correlation value of 0.8638 (Figure 4). T7was the most distinct transect in terms of species com-position. The remaining transects broadly clustered intotwo groups: T1, T2, T6, T9, T10 and T11 in one and T3,T4, T5 and T8 in another. The similarity within transectsof both groups was of nearly same magnitude (Figure 4).Whittaker’s species richness index was 33.9, Shannon’s
diversity index (H′) was 3.395 nats (or 4.898 bits), max-imum diversity (H′max) was 4.81, Pielou’s evenness orhomogeneity index (E) was 0.706 and Simpson’s domin-ance index (D) was 0.076. The compositional heterogen-eity at landscape level as measured by Whittaker’s betadiversity (βw) was 3.15.
Density, basal area and importance value indexThe stand density and basal area of individuals ≥ 10 cmgirth were 767.7 ha−1 and 15.65 m2 · ha−1, respectively(Table 3). These values were 448.3 ha−1 and 13.79 m2 · ha−1
for individuals ≥30 cm girth. The basal area of an averageindividual was 203.9 cm2 (which is equal to 50.6 cm girth)for individuals ≥ 10 cm girth and 307.6 cm2 (which is equalto 62.2 cm girth) for individuals ≥ 30 cm girth.Six species with 100 or more individuals each accounted
for 61.2% of total individuals: S. robusta (1026 individuals),
S. wallichii (693), P. kesiya (264), Careya arborea (211),Semecarpus anacardium (135) and Callicarpa arborea(114). The next 37 species, each with ten or more butless than hundred individuals, contributed 33.3% indi-viduals. The remaining 80 species, each with less thanten individuals, shared only 5.5% individuals. Most spe-cies were rare: 103 species with less than one per cent oftotal individuals, 82 species with two or less individualsper hectare and 72 species with one or less individualper hectare (Table 3).Twelve species, with at least 1 m2 basal area, accounted
80.2% of total basal area: S. robusta (20.97 m2), S. wallichii(18.07 m2), P. kesiya (11.16 m2), C. arborea (3.38 m2), Ery-thrina stricta (2.12 m2), Syzygium cumini (1.75 m2), Cas-tanopsis lanceifolia (1.71 m2), S. anacardium (1.35 m2),Castanopsis purpurella (1.29 m2), Aporosa octandra(1.19 m2), Callicarpa arborea (1.19 m2) and Vitex ped-uncularis (1.10 m2). The next 43 species, each with ≥ 0.1but < 1 m2, contributed 17.3% basal area. The remaining68 species, each with < 0.1 m2, shared only 2.5% basalarea (Table 3).Thirteen species, with at least five or more IVI value,
accounted 68.7% of total IVI: S. robusta (58.2), S. walli-chii (48.2), P. kesiya (23.3), C. arborea (14.5), Callicarpaarborea (9.5), S. anacardium (8.7), S. cumini (8.5), A.octandra (7.2), Phyllanthus emblica (6.5), Lagerstroemiaparviflora (5.8), C. lanceifolia (5.2), V. peduncularis (5.2)and E. spicata (5.1). The next 27 species, each with morethan one but less than five IVI value, contributed 21.5%IVI. The remaining 83 species, each with less than oneIVI value, shared only 9.8% IVI (Table 3).The abundances of species (importance value index)
followed a fair lognormal pattern of resource sharing witha few common species with high abundance (S. robusta, S.wallichii, P. kesiya and C. arborea), several intermediatespecies with moderate abundance and some very rarespecies with very low abundance (Figure 5). The rank-abundance plot was significantly (p < 0.01) explained bya linear fit with R2 = 0.912 which was marginally higher(R2 = 0.954) if top four species were excluded (Figure 5).
Spatial dispersion of speciesThe variance-to-mean (V/M) ratio revealed that 63species showed ‘uniform’ dispersion, none had ‘random’

Figure 2 Pattern of dominance of plant families, in decreasing order, in ‘Khasi hill sal’ forests of Meghalaya in terms of: a) concentrationof individuals, b) accumulation of basal area, and c) importance value index. Only top 25 families are shown and the remaining families aretruncated from the graphs. Nearly all truncated families had less than 1 per cent contribution in all cases.
Tripathi and Shankar Forest Ecosystems (2014) 1:23 Page 8 of 20
dispersion and 23 had ‘clumped’ dispersion (Tables 3and 4). The dispersion pattern of 37 species was ‘ob-scure’ due to zero variance as these species appeared ina single sampling unit (Table 4). The top four dominant
species in terms of IVI, S. robusta, S. wallichii, P. keisyaand C. arborea were clumped (Table 3). However, among14 species with a density of ten or more individuals perhectare, six were uniform and the rest clumped (Table 3).

Figure 3 Frequency of occurrence of species in sampled transects in ‘Khasi hill sal’ forests of Meghalaya.
Tripathi and Shankar Forest Ecosystems (2014) 1:23 Page 9 of 20
Most species with less than ten individuals per hectarewere uniform, but few were clumped.
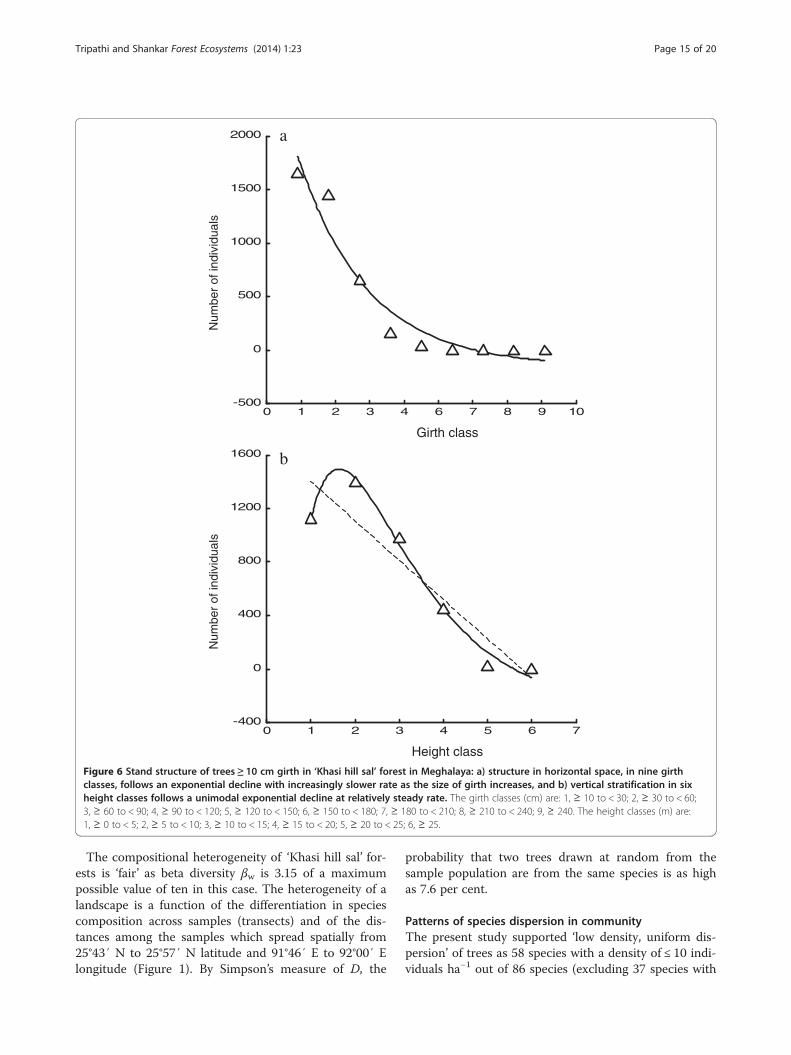
Stand structure and regenerationThe population structure exhibited an exponential declinein concentration of individuals (R2 = 0.939, p < 0.001,Durbin-Watson statistic = 1.939), at initially faster rateand then at increasingly slower rate, from a lower to thenext higher girth class (Figure 6a), indicating ‘good’ re-generation at community level. The girth class 10 to <
Figure 4 A cluster analysis of sampled transects in ‘Khasi hill sal’ fore
30 cm comprised 41.6% individuals comprising mostlysaplings of trees (94.5%) and few shrubs (1.4%) andclimbers (4.1%).The vertical stratification showed an average height of
8.18 ± 4.43 m of individuals having ≥ 10 cm girth and10.98 ± 3.58 m of individuals with ≥ 30 cm girth. Thedistribution of individuals in height classes showed aunimodal exponential pattern with mode in 5 to 10 mheight class (R2 = 0.990, p < 0.001, Durbin-Watson statis-tic = 2.687), and then a decline to the next higher class
st in Meghalaya based on similarity in floristic composition.

Table 3 Floristic composition and phytosociology of the woody layer (individuals ≥ 10 cm girth) of ‘Khasi hill sal’ forestof Meghalaya
Species Family Growthform
Occurrence Density(ha−1)
Basal area(cm2 · ha−1)
IVI Variance-to-mean ratio
Dispersion
1. Shorea robusta Gaertn. Dipterocarpaceae LT 73 197.3 40328.4 58.249 25.9 C
2. Schima wallichii Choisy Theaceae LT 93 133.3 34757.6 48.205 3.5 C
3. Pinus kesiya Royle ex Gordon Pinaceae LT 32 50.8 21452.8 23.293 8.7 C
4. Careya arborea Roxb. Lecythidaceae MT 55 40.6 6505.7 14.549 2.3 C
5. Callicarpa arborea Roxb. Lamiaceae MT 56 21.9 2291.1 9.519 0.9 U
6. Semecarpus anacardium L.f. Anacardiaceae MT 39 26.0 2589.6 8.658 1.2 C
7. Syzygium cumini (L.) Skeels Myrtaceae LT 44 17.3 3367.6 8.492 0.8 U
8. Aporosa octandra var. octandra Phyllanthaceae ST 37 18.1 2291.9 7.255 1.9 C
9. Phyllanthus emblica L. Phyllanthaceae ST 39 18.3 840.6 6.538 0.7 U
10. Lagerstroemia parviflora Roxb. Lythraceae MT 35 14.6 1068.5 5.836 0.8 U
11. Castanopsis lanceifolia (Oerst.) Hickel& A.Camus
Fagaceae LT 22 8.7 3289.8 5.272 1.4 C
12. Vitex peduncularis Wall. ex Schauer Lamiaceae LT 24 12.1 2112.9 5.157 2.0 C
13. Engelhardtia spicata Lechen ex Blume Juglandaceae LT 29 13.3 1094.9 5.121 1.5 C
14. Erythrina stricta Roxb. Leguminosae MT 12 6.7 4082.1 4.599 1.3 C
15. Croton joufra Roxb. Euphorbiaceae MT 21 11.9 1496.3 4.459 0.8 U
16. Sterculia villosa Roxb. Malvaceae MT 22 5.6 1104.1 3.475 0.3 U
17. Catunaregam spinosa (Thunb.) Tirveng. Rubiaceae ST 17 10.6 522.2 3.290 1.3 C
18. Casearia glomerata Roxb. Salicaceae MT 18 9.8 426.0 3.221 3.1 C
19. Albizia chinensis (Osbeck) Merr. Leguminosae LT 18 4.4 1361.2 3.117 0.3 U
20. Syzygium nervosum A.Cunn. ex DC. Myrtaceae MT 17 8.8 599.9 3.114 1.1 C
21. Ziziphus rugosa Lam. Rhamnaceae SS 18 8.1 377.9 2.965 2.4 C
22. Castanopsis purpurella (Miq.) N. P. Balakr. Fagaceae LT 10 3.1 2483.6 2.916 0.2 U
23. Lannea coromandelica (Houtt.) Merr. Anacardiaceae MT 14 5.4 1295.9 2.829 1.3 C
24. Saurauia roxburghii Wall. Actinidiaceae ST 12 9.0 838.9 2.828 3.9 C
25. Litsea monopetala (Roxb.) Pers. Lauraceae MT 16 6.3 779.0 2.810 0.8 U
26. Pavetta indica L. Rubiaceae ST 17 7.5 204.2 2.686 1.5 C
27. Castanopsis armata (Roxb.) Spach Fagaceae MT 8 3.5 1600.4 2.216 0.5 U
28. Trema orientalis (L.) Blume Cannabaceae MT 4 10.6 524.1 2.084 8.8 C
29. Macaranga denticulata (Blume) Müll.Arg. Euphorbiaceae MT 11 4.4 470.2 1.898 1.5 C
30. Gmelina arborea Roxb. Lamiaceae MT 9 2.5 883.1 1.726 0.2 U
31. Eurya acuminata DC. Pentaphylacaceae ST 11 4.0 175.4 1.660 0.7 U
32. Holarrhena pubescens Wall. Apocynaceae ST 10 3.7 275.2 1.580 0.5 U
33. Castanopsis tribuloides (Sm.) A.DC. Fagaceae MT 7 1.9 1027.6 1.557 0.2 U
34. Leea asiatica (L.) Ridsdale Vitaceae SH 11 3.3 80.4 1.499 0.4 U
35. Garuga pinnata Roxb. Burseraceae LT 7 2.5 817.5 1.498 0.6 U
36. Ficus hispida L. f. Moraceae ST 9 2.1 409.5 1.373 0.2 U
37. Dalbergia stipulacea Roxb. Leguminosae WC 8 3.3 256.5 1.333 0.9 U
38. Premna mollissima Roth Lamiaceae MT 4 2.5 945.9 1.301 1.3 C
39. Symplocos khasiana Brand Symplocaceae ST 7 3.3 261.8 1.243 0.7 U
40. Bridelia retusa (L.) A. Juss. Phyllanthaceae MT 9 2.3 158.8 1.238 0.4 U
41. Ilex umbellulata (Wall.) Loes. Aquifoliaceae ST 6 2.3 201.7 0.987 1.4 C
Tripathi and Shankar Forest Ecosystems (2014) 1:23 Page 10 of 20

Table 3 Floristic composition and phytosociology of the woody layer (individuals ≥ 10 cm girth) of ‘Khasi hill sal’ forestof Meghalaya (Continued)
42. Wendlandia tinctoria (Roxb.) DC. Rubiaceae ST 6 2.1 135.6 0.919 0.3 U
43. Lithocarpus elegans (Blume) Hatus.ex Soepadmo
Fagaceae LT 5 1.2 223.7 0.757 0.2 U
44. Smilax zeylanica L. Smilacaceae SS 5 1.9 19.3 0.727 0.8 U
45. Oroxylum indicum (L.) Kurz Bignoniaceae ST 5 1.2 150.5 0.711 0.2 U
46. Artocarpus heterophyllus Lam. Moraceae MT 1 0.2 918.2 0.705 O
47. Mangifera indica L. Anacardiaceae LT 3 0.6 537.6 0.697 0.0 U
48. Acacia pennata (L.) Willd. Leguminosae SS 4 1.7 116.8 0.672 0.4 U
49. Stereospermum chelonoides (L. f.) DC. Bignoniaceae LT 3 0.6 497.1 0.671 0.0 U
50. Elaeocarpus floribundus Blume Elaeocarpaceae LT 2 1.0 558.4 0.668 1.8 C
51. Wendlandia puberula DC. Rubiaceae ST 4 1.5 122.2 0.650 0.3 U
52. ML077T21 Meliaceae MT 4 1.0 226.5 0.641 0.2 U
53. Ficus curtipes Corner Moraceae LT 2 0.4 605.4 0.623 0.0 U
54. Kydia calycina Roxb. Malvaceae MT 5 1.0 51.6 0.622 0.0 U
55. Toona ciliata M.Roem. Meliaceae LT 4 1.2 131.2 0.606 0.2 U
56. Bombax ceiba L. Malvaceae LT 3 0.6 390.4 0.603 0.0 U
57. Ficus racemosa L. Moraceae LT 1 0.2 720.3 0.578 O
58. Grewia eriocarpa Juss. Malvaceae ST 3 0.6 333.3 0.567 0.0 U
59. Ficus hirta Vahl Moraceae ST 3 1.5 132.0 0.563 3.1 C
60. Artocarpus lakoocha Roxb. Moraceae LT 3 0.8 256.8 0.543 0.3 U
61. Ficus sp.2 Moraceae MT 1 0.2 662.4 0.541 O
62. Litsea glutinosa var. glutinosa Lauraceae ST 4 1.0 57.4 0.533 0.2 U
63. Dillenia pentagyna Roxb. Dilleniaceae LT 3 0.8 225.4 0.523 0.3 U
64. Albizia odoratissima (L. f.) Benth. Leguminosae LT 4 0.8 36.8 0.495 0.0 U
65. ML044T18 Sapindaceae MT 2 1.2 245.7 0.493 0.0 U
66. Glochidion coccineum (Buch.-Ham.)Müll.Arg.
Phyllanthaceae ST 2 1.2 234.1 0.486 0.0 U
67. Antidesma bunius (L.) Spreng. Phyllanthaceae ST 2 0.4 374.3 0.475 0.0 U
68. Archidendron bigeminum (L.) I.C.Nielsen Leguminosae ST 3 0.8 86.7 0.434 0.3 U
69. Syzygium tetragonum (Wight) Wall.ex Walp.
Myrtaceae MT 3 0.6 113.7 0.426 0.0 U
70. Olea salicifolia Wall. ex G.Don Oleaceae ST 3 0.8 63.2 0.419 0.3 U
71. Bridelia tomentosa Blume Phyllanthaceae ST 3 0.6 40.9 0.380 0.0 U
72. Caryota obtusa Griff. Arecaceae MT 1 0.4 343.9 0.363 O
73. Itea macrophylla Wall. Iteaceae ST 2 0.6 143.9 0.353 0.3 U
74. Entada rheedii Spreng. Leguminosae WC 2 0.4 148.6 0.331 0.0 U
75. Acronychia pedunculata (L.) Miq. Rutaceae ST 2 0.6 95.9 0.322 0.3 U
76. Ficus fistulosa Reinw. ex Blume Moraceae ST 2 0.8 40.3 0.312 0.0 U
77. Neolitsea umbrosa (Nees) Gamble Lauraceae MT 2 0.6 74.6 0.309 0.3 U
78. Wendlandia glabrata DC. Rubiaceae ST 2 0.8 30.8 0.306 0.0 U
79. Symplocos racemosa Roxb. Symplocaceae ST 2 0.6 68.9 0.305 0.3 U
80. Styrax serrulatus Roxb. Styracaceae ST 2 0.4 92.6 0.295 0.0 U
81. Archidendron clypearia (Jack) I.C.Nielsen Leguminosae ST 2 0.4 68.2 0.279 0.0 U
82. Helicia nilagirica Bedd. Proteaceae MT 2 0.4 66.1 0.278 0.0 U
Tripathi and Shankar Forest Ecosystems (2014) 1:23 Page 11 of 20

Table 3 Floristic composition and phytosociology of the woody layer (individuals ≥ 10 cm girth) of ‘Khasi hill sal’ forestof Meghalaya (Continued)
83. Ehretia acuminata R.Br. Boraginaceae LT 2 0.4 54.5 0.271 0.0 U
84. Wendlandia ligustrina Wall. ex G.Don Rubiaceae ST 2 0.4 40.7 0.262 0.0 U
85. Premna pinguis C.B.Clarke Lamiaceae SH 2 0.4 39.8 0.261 0.0 U
86. Saurauia fasciculata Wall. Actinidiaceae ST 2 0.4 29.4 0.255 0.0 U
87. Meliosma arnottiana (Wight) Walp. Sabiaceae ST 2 0.4 28.6 0.254 0.0 U
88. Firmiana colorata (Roxb.) R.Br. Malvaceae ST 2 0.4 11.8 0.243 0.0 U
89. Guidonia vareca (Roxb.) Baill. ex Kurz Salicaceae ST 2 0.4 7.5 0.241 0.0 U
90. Machilus glaucescens (Nees) Wight Lauraceae MT 2 0.4 4.4 0.239 0.0 U
91. Eriobotrya bengalensis (Roxb.) Hook. f. Rosaceae LT 1 0.2 155.3 0.217 O
92. Mallotus philippensis (Lam.) Müll.Arg. Euphorbiaceae ST 1 0.2 149.4 0.213 O
93. Spatholobus parviflorus (DC.) Kuntze Leguminosae WC 1 0.8 20.1 0.206 O
94. Magnolia champaca (L.) Baill. ex Pierre Magnoliaceae LT 1 0.2 115.0 0.191 O
95. Mallotus paniculatus var. paniculatus Euphorbiaceae ST 1 0.6 19.6 0.181 O
96. Morus macroura Miq. Moraceae ST 1 0.6 19.3 0.180 O
97. Machilus gamblei King ex Hook. f. Lauraceae MT 1 0.4 56.2 0.179 O
98. Hymenodictyon orixense (Roxb.) Mabb. Rubiaceae LT 1 0.4 46.2 0.172 O
99. Actinodaphne obovata (Nees) Blume Lauraceae MT 1 0.6 6.6 0.172 O
100. Spondias pinnata (L. f.) Kurz Anacardiaceae MT 1 0.6 5.9 0.172 O
101. Castanopsis indica (Roxb. ex Lindl.)A. DC.
Fagaceae LT 1 0.2 79.4 0.169 O
102. Pterospermum lanceifolium Roxb. Malvaceae MT 1 0.2 72.8 0.164 O
103. Decaspermum parviflorum subsp.parviflorum
Myrtaceae ST 1 0.4 30.0 0.162 O
104. Bauhinia purpurea L. Leguminosae ST 1 0.2 68.8 0.162 O
105. Alstonia scholaris (L.) R. Br. Apocynaceae LT 1 0.2 68.7 0.162 O
106. Ficus subincisa Buch.-Ham. ex Sm. Moraceae SH 1 0.4 22.9 0.158 O
107. Litsea salicifolia (Roxburgh ex Nees)Hook. f.
Lauraceae ST 1 0.4 17.0 0.154 O
108. Pandanus furcatus Roxb. Pandanaceae ST 1 0.4 16.5 0.153 O
109. Albizia lebbeck (L.) Benth. Leguminosae LT 1 0.2 53.2 0.152 O
110. Cinnamomum bejolghota (Buch.-Ham.)Sweet
Lauraceae LT 1 0.2 46.6 0.148 O
111. Brassaiopsis hainla (Buch.-Ham.) Seem. Araliaceae ST 1 0.4 5.6 0.147 O
112. Maesa montana A. DC. Primulaceae SH 1 0.4 5.5 0.146 O
113. Macaranga indica Wight Euphorbiaceae MT 1 0.4 3.7 0.145 O
114. Actinodaphne citrata (Blume) Hayata Lauraceae ST 1 0.2 40.4 0.144 O
115. Glochidion khasicum (Müll.Arg.) Hook.f. Phyllanthaceae ST 1 0.2 28.5 0.136 O
116. Toxicodendron succedaneum var.succedaneum
Anacardiaceae MT 1 0.2 16.3 0.128 O
117. Garcinia cowa Roxb. ex Choisy Clusiaceae MT 1 0.2 5.9 0.122 O
118. Glochidion heyneanum (Wight & Arn.)Wight
Phyllanthaceae ST 1 0.2 2.8 0.120 O
119. Wendlandia wallichii Wight & Arn. Rubiaceae ST 1 0.2 2.4 0.119 O
120. Ardisia humilis Vahl Primulaceae SH 1 0.2 2.0 0.119 O
121. Glochidion sphaerogynum (Mull.Arg.)Kurz
Phyllanthaceae MT 1 0.2 1.9 0.119 O
Tripathi and Shankar Forest Ecosystems (2014) 1:23 Page 12 of 20

Table 3 Floristic composition and phytosociology of the woody layer (individuals ≥ 10 cm girth) of ‘Khasi hill sal’ forestof Meghalaya (Continued)
122. Calamus latifolius Roxb. Arecaceae SS 1 0.2 1.5 0.119 O
123. Meliosma sp. Sabiaceae ST 1 0.2 1.5 0.119 O
Total for all species 104 767.7 156496 300.0
The dispersion of species is denoted as: U for uniform (63 species), R for random (no species), C for clumped (23 species) and O for obscure (37 species with asingle occurrence and absolute zero variance).
Tripathi and Shankar Forest Ecosystems (2014) 1:23 Page 13 of 20
(Figure 6b). About 69.4% individuals were less than tenmetre in height, 30.2% individuals between ten and twentymetre height and only 0.4% individuals with more thantwenty metre height shaping a ‘cuspidate pyramidal’ struc-ture. The maximum height recorded was 30 m. Only 28individuals of six species attained a height of 20 m ormore: Caryota obtusa (1 individual), C. purpurella (1),Entada rheedii (2), P. kesiya (1), S. robusta (12) and S.wallichii (11).The dominant species in the community showed a
broadly similar pattern of population structure and regen-eration (Figure 7). S. robusta, predominant in canopy,showed a better regeneration than other species as it hadonly marginally lower number of individuals in 10 to30 cm than in 30–60 cm girth class (Figure 7a), and simi-larly in < 5 m than in 5 to 10 m height class (Figure 7b).S. wallichii (Figures 7c, 7d), and C. arborea (Figures 7e,7f) showed greater paucity of younger individuals in 10 to30 cm girth class. P. kesiya showed a lack of regenerationwith total absence of younger individuals in 10 to 30 cmgirth class (Figure 7g, h).
Figure 5 Pattern of distribution of species abundances in ‘Khasi hill sln-transformed importance value index (IVI) of species. A fit of unweign = 123, R2 = 0.912). On exclusion of top four species, the fit was marginallyfive species in descending order of IVI are: S. robusta, S. wallichii, P. kesiya, C
DiscussionFloristics and species richnessThe tree of sal is native to South Asia (Troup 1921).Generally, sal is the dominant tree in the forests where itoccurs. The canopies of sal-dominated forests appearsimilar across regions, but vary in floristic composition,patterns of species diversity, coverage of basal area, can-opy height and regeneration of species. Historically, for-esters viewed sal forests ‘species poor systems’ and utilizedfor timber extractions. However, a case of high tree diver-sity in a sal forest was reported from Mahananda wildlifesanctuary in foothills of eastern Himalaya in the beginningof this century (Shankar 2001). Further investigationspanning larger geographical area of eastern Himalayanterai (including Darjeeling, Jalpaiguri and Coochbehar)endorsed that sal forests of this region harbour high levelsof woody species diversity (Kushwaha and Nandy 2012).Floristic inventories in sal forests vary dramatically in plotsize, sampled area, and measurement threshold of mini-mum stem diameter, imposing a restriction in comparisonof species richness (Table 5). Nonetheless, studies on sal-
al’ forest of Meghalaya in a rank-abundance plot based onhted simple least square was significant (solid line, y = –0.037x + 1.924,better (dashed line, y = –0.034x + 1.688, n = 119, R2 = 0.954). The top. arborea and Callicarpa arborea.

Table 4 Number of species, density and basal area in dispersion categories based on inventory of individuals ≥ 10 cmgirth in ‘Khasi hill sal’ forest of Meghalaya
Speciesgroup
Species Species in dispersion categories Density Basal area
(#) (%) Uniform Random Clumped Obscure (ha−1) (%) (m2 · ha−1) (%)
Large trees 29 23.6 14 0 7 8 452.5 58.9 11.59 74.1
Medium trees 36 29.2 16 0 9 11 193.8 25.2 3.07 19.6
Small trees 46 37.4 27 0 6 13 100.4 13.1 0.88 5.6
Shrubs 5 4.1 2 0 0 3 4.6 0.6 0.02 0.1
Climbers 7 5.7 4 0 1 2 16.4 2.2 0.09 0.6
All species 123 100.0 63 0 23 37 767.7 100.0 15.65 100.0
Tripathi and Shankar Forest Ecosystems (2014) 1:23 Page 14 of 20
dominated forests offer a range from 17 species in 0.5 ha(Dutta and Devi 2013a) to 152 species in 4 ha (Majumdaret al. 2014) in eastern and northeastern India (Table 5)and from three species in 0.3 ha (Singh et al. 1995) to 177species in 24 ha in India (Pandey and Shukla 2003). In thisstudy, ‘Khasi hill sal’ forests revealed 123 species in 5.2 hasampled area. The species richness in ‘Khasi hill sal’forests appears close to 134 species in 3.2 ha sample areain moist sal forests of eastern Himalayan terai (Kushwahaand Nandy 2012).In ‘Khasi hill sal’ forests, species richness of indivi-
duals ≥ 10 cm girth is principally due to trees (90.2%).The shrubs (4.1%) and climbers (5.7%) contribute littleto species richness. The dominance of trees over othergrowth forms (shrubs, scandent shrubs and climbers) iscommon in lowland forests in India, primarily due torecurrent fire and grazing. In sal-dominated lowlandforests composed of 87 species in Darjeeling terai, treeswere 87.4%, shrubs 5.7% and climbers 6.9% (Shankar2001). However, in taungya-raised, mature sal planta-tions in Gorakhpur, Pandey and Shukla (2003) observedgreater proportion of shrubs and lianas.The ‘Khasi hill sal’ forests display an evergreen phy-
siognomy as the three most dominant species are ever-green. Although the foliage becomes prominently thinduring winter, most trees are never rendered naked. Atmost, the deciduous phase lasts one to two weeks for in-dividual trees of S. robusta. Corroborating other studies(Shankar et al. 1998a; Shankar 2001; Pandey and Shukla2003; Kushwaha and Nandy 2012), Euphorbiaceae (includ-ing Phyllanthaceae) and Leguminosae were the most spe-ciose families with 14 and 11 species, respectively. Thesewere followed by Moraceae (10 species), Lauraceae (9),Rubiaceae (8), Fagaceae (6) and Malvaceae (6). The fam-ilies of predominantly tropical distribution (megatherms)were commanding dominance although some families ofpredominantly montane environment (microtherms) suchas Fagaceae, Pentaphylacaceae, Primulaceae, Symploca-ceae and Theaceae were also present. Among these, Thea-ceae with one species (S. wallichii) commanded nearly16.1% IVI value. In eastern and northeastern India, S.
wallichii occurs throughout lowland and lower montaneforests with varying dominance (Shankar et al. 1998a;Majumdar et al. 2014). An obvious difference between‘Khasi hill sal’ forests and most other sal forests listed inTable 5 is the representation of Fagaceae with six speciescommanding 4.3% of IVI. Fagaceae is also represented, bytwo species (Castanopsis tribuloides and Quercus spicata)in sal forests of Darjeeling terai (Shankar 2001) and bytwo species (Castanopsis armata and Lithocarpus spicata)in Tripura (Majumdar et al. 2012), but with only one percent or less contribution to IVI. Yet another strikingdifference is the occurrence of pine.
Patterns of species diversity and evennessThe value of Shannon diversity index (H′ = 3.395 natswith 123 species) of ‘Khasi hill sal’ forests was close toso far known highest value of H′ = 3.59 nats among nat-ural sal forests of India from Mahananda wildlife sanctu-ary in Darjeeling with 87 species in 2 ha (Shankar 2001).However, the present value was greater than H′ = 3.10with 134 tree species from moist sal forests of easternHimalayan terai (Kushwaha and Nandy 2012). A recentstudy from ‘moist plain sal forests’ occurring below100 m altitude in South district of Tripura (Majumdaret al. 2014) has revealed values of H′ greater than thosefrom Darjeeling in three of five sal associations studied:S. robusta–Diperocarpus turbinatus (H′ = 3.93), S. ro-busta–C. arborea (H′ = 3.73) and S. robusta–S. wallichii(H′ = 3.82). Another association S. robusta–Artocarpuschama is rather close (H′ = 3.42). Pandey and Shukla(2003) recorded a value of H′ = 3.96 nats from taungya-raised sal plantations of Gorakhpur with 208 species in-cluding herbs. A value of H′, as high as recorded in thepresent study, is a manifestation of high species richness(S = 123) coupled with fair equitability in the community(Pielou’s E = 0.706). As compared to the maximum di-versity (H′max = 4.81), the realized H′ is 70.6% in thisstudy. A reasonably high equitability of resource appor-tionment among species is evident as the resource distri-bution in the community follows a lognormal pattern.
Num
ber
of in
divi
dual
s
-500
0
500
1000
1500
2000
0 1 2 3 4 6 7 8 9 10
Girth class
Num
ber
of in
divi
dual
s
-400
0
400
800
1200
1600
0 1 2 3 4 5 6 7
Height class
b
a
Figure 6 Stand structure of trees ≥ 10 cm girth in ‘Khasi hill sal’ forest in Meghalaya: a) structure in horizontal space, in nine girthclasses, follows an exponential decline with increasingly slower rate as the size of girth increases, and b) vertical stratification in sixheight classes follows a unimodal exponential decline at relatively steady rate. The girth classes (cm) are: 1, ≥ 10 to < 30; 2, ≥ 30 to < 60;3, ≥ 60 to < 90; 4, ≥ 90 to < 120; 5, ≥ 120 to < 150; 6, ≥ 150 to < 180; 7, ≥ 180 to < 210; 8, ≥ 210 to < 240; 9, ≥ 240. The height classes (m) are:1, ≥ 0 to < 5; 2, ≥ 5 to < 10; 3, ≥ 10 to < 15; 4, ≥ 15 to < 20; 5, ≥ 20 to < 25; 6, ≥ 25.
Tripathi and Shankar Forest Ecosystems (2014) 1:23 Page 15 of 20
The compositional heterogeneity of ‘Khasi hill sal’ for-ests is ‘fair’ as beta diversity βw is 3.15 of a maximumpossible value of ten in this case. The heterogeneity of alandscape is a function of the differentiation in speciescomposition across samples (transects) and of the dis-tances among the samples which spread spatially from25°43′ N to 25°57′ N latitude and 91°46′ E to 92°00′ Elongitude (Figure 1). By Simpson’s measure of D, the
probability that two trees drawn at random from thesample population are from the same species is as highas 7.6 per cent.
Patterns of species dispersion in communityThe present study supported ‘low density, uniform dis-persion’ of trees as 58 species with a density of ≤ 10 indi-viduals ha−1 out of 86 species (excluding 37 species with

a) Shorea robusta b) Shorea robusta
d) Schima wallichiic) Schima wallichii
h) Pinus kesiya g) Pinus kesiya
Nu
mb
er o
f in
div
idu
als
in 2
.45
ha
f) Careya arborea e) Careya arborea
Figure 7 Girth and height structure of four dominant species in ‘Khasi hill sal’ forest in Meghalaya. The girth and height classes are asdefined in Figure 6.
Tripathi and Shankar Forest Ecosystems (2014) 1:23 Page 16 of 20
obscure dispersion) were uniformly dispersed. The uni-form dispersion of abundant species is uncommon innatural communities, but five species, viz., M. esculenta,C. tribuloides, C. armata, Q. lineata and S. tetragonumcould achieve ‘higher density (> 10 individuals ha−1),uniform dispersion’ in this study. Nonetheless, 6 of the
10 most important species were ‘clumped’. The clump-ing was more pronounced in trees than in shrubs andclimbers. Uniform dispersion of a large number of spe-cies meant smaller differences in climate and habitatdiversity across sampled transects. The conclusion froma tropical dry forest, ‘rare species more clumped than

Table 5 A comparison of phytosociological attributes of ‘Khasi hill sal’ forest with sal-dominated forests of easternIndia
Study site Vegetation type Girthsize (cm)
Sampledarea (ha)
Speciesrichness (S)
Stand density(ha−1)
Basal area(m2 · ha−1)
Source
Natural sal-dominated forests
Ri Bhoi District, Meghalaya Khasi hill sal ≥ 10 gbh 5.2 123 767.7 15.6 Present study
Ri Bhoi District, Meghalaya Khasi hill sal ≥ 30 gbh 5.2 95 448.3 13.8 Present study
Mahananda, Darjeeling Eastern Himalayan terai sal ≥ 10 gbh 2 87 484 26.3 Shankar (2001)
West Bengal Moist sal forest (EasternHimalayan terai sal)
≥ 30 gbh 3.2 134 438 56.5 Kushwaha andNandy (2012)
West Bengal Dry sal forests ≥ 30 gbh 2.8 35 1006 19.6 Kushwaha andNandy (2012)
Kamrup, Assam Alluvial plain sal ≥ 10 gbh 1.2 71* 2559 27.6 Deka et al. (2012)
Hojai Reserve Forest, Assam Alluvial plain sal ≥ 30 gbh 0.5 18 240 66.9 Dutta and Devi(2013a)
Kumorakata Reserve Forest,Assam
Alluvial plain sal ≥ 30 gbh 0.5 17 138 73.6 Dutta and Devi(2013a)
Doboka Reserve Forest,Assam
Alluvial plain sal ≥ 30 gbh 0.5 74 422 88.9 Dutta and Devi(2013b)
South District, Tripura S. robusta – Anogeissusacuminata
≥ 30 gbh 5.5 105 464.8 26.1 Majumdar et al.(2012)
South District, Tripura S. robusta – Artocarpuschama
≥ 10 gbh 2 131 876 37.5 Majumdar et al.(2014)
South District, Tripura S. robusta – Dipterocarpusturbinatus
≥ 10 gbh 5.5 120 808 30.4 Majumdar et al.(2014)
South District, Tripura S. robusta – Terminaliabellirica
≥ 10 gbh 2.5 85 983 21.4 Majumdar et al.(2014)
South District, Tripura S. robusta – Careya arborea ≥ 10 gbh 2 99 1000 27.7 Majumdar et al.(2014)
South District, Tripura S. robusta – Schima wallichii ≥ 10 gbh 4 152 872 38.6 Majumdar et al.(2014)
Sal plantations
Sohagibarawa wildlifesanctuary, Gorakhpur
Sal plantation ≥ 10 gbh 24 208* 20413 23.1 Pandey andShukla (2003)
Sohagibarawa wildlife sanctuary,Gorakhpur
Sal plantation ≥ 30 gbh 24 208* 404 22.2 Pandey andShukla (2003)
Garo Hills, Meghalaya Sal plantation ≥ 30 gbh 4.0 42 887 54.0 Kumar et al.(2006)
*includes herb species.
Tripathi and Shankar Forest Ecosystems (2014) 1:23 Page 17 of 20
common species’ (Hubbell 1979), was not strongly sup-ported in our study. The pattern of dispersion of speciesin this forest was in contrast with that noticed in salforest of Darjeeling wherein only 2 of 87 species wereuniform, nearly one-half clumped and the remaining ran-dom or near-random, presumably due to greater habitatdiversity (Shankar 2001).
Patterns of abundances (density, basal area andimportance value)A stand density of 767.7 ha−1 of individuals having ≥ 10 cmgirth and that of 448.3 ha−1 of individuals with ≥ 30 cmgirth was well within the range revealed by the sal forests
(Table 5). The density values of individuals of ≥ 30 cm girthwere close to the values from eastern Himalayan terai(Shankar 2001; Kushwaha and Nandy 2012), Gorakhpur(Pandey and Shukla 2003), Tripura (Majumdar et al. 2012,2014) and Doboka Reserve Forest (Dutta and Devi 2013b).Apparently, there appears a great consistency in stockingpattern of stems of 30 cm or more girth in sal forests ofeastern region of India.The individuals below 30 cm girth comprise not only
saplings of tree species present in higher girth class butalso saplings of immigrant or reappearing species. Inaddition, shrubs, scandent shrubs and climbers that willprobably never exceed a girth of 30 cm also occur (Shankar

Tripathi and Shankar Forest Ecosystems (2014) 1:23 Page 18 of 20
2001). Hence, < 30 cm girth class is not only an indicatorof regeneration of tree species, but also an accumulator ofsmaller life forms.The basal area of 15.6 m2 · ha−1 for individuals
with ≥10 cm girth and of 13.8 m2 · ha−1 for individualswith ≥30 cm girth was substantially lower than the rangedepicted by the sal forests of the region (Table 5). Thestudies from Darjeeling (Shankar 2001), Kamrup (Dekaet al. 2012), Tripura (Majumdar et al. 2012) and Gorakh-pur (Pandey and Shukla 2003) suggest a value of basalarea around 26 m2 per hectare. The values exceptionallyhigher than this occur in managed plantations such as inGaro Hills (Kumar et al. 2006), in well stocked sal forestswith large girth trees as in moist sal forests of easternHimalayan terai (Kushwaha and Nandy 2012) or a resultof overestimation due to inadequate and biased sampling(Dutta and Devi 2013a, b). The maximum girth of S.robusta was below 150 cm which is far lower than thepotential maximum girth this tree could attain in pris-tine environment. Apparently, anthropogenic interfer-ence in form of past logging of trees by the foresters forsupply of sal logs, and small timber extraction for house-holds (especially poles) have eliminated large girth treesfrom the forest.The ‘Khasi hill sal’ forest showed a mixed dominance
of S. robusta and S. wallichii and co-dominance of P.kesiya and C. arborea. These species respectively had adensity of 197.3, 133.3, 50.8 and 40.6 individuals ha−1, abasal area of 4.0, 3.5, 2.1 and 0.7 m2 · ha−1, and an IVI of58.2, 48.2, 23.3 and 14.5 (Table 3). In sal forests, mixeddominance of two or more species is not common as S.robusta alone weaves the framework of the forest. S. ro-busta commanded three-fourth of IVI in Kamrup (Dekaet al. 2012), three-fourth of density in Gorakhpur (Pandeyand Shukla 2003), two-third of IVI in Hojai (Dutta andDevi 2013a), one-half of IVI in eastern Himalayan terai(Kushwaha and Nandy 2012), and one-third of density inTripura (Majumdar et al. 2014) and Doboka (Dutta andDevi 2013b). Mixed dominance of species in a sal-dominated forest occurs in Darjeeling (Shankar 2001). S.wallichi as second or third dominant species occurs ineastern Himalayan terai (Shankar 2001; Kushwaha andNandy 2012), Garo Hills (Kumar et al. 2006), Kamrup(Deka et al. 2012) and Tripura (Majumdar et al. 2014).
Stand structure and regenerationThe ‘Khasi hill sal’ forest showed a healthy demographiccurve with an exponential fit, illustrating ‘fair’ regener-ation of an expanding community. Clearly, the forest com-munity is able to maintain continual supply of juveniles(stems in 10 to < 30 cm girth size) to higher girth classesin a pool of species despite anthropogenic stresses in formof wood extraction, fire and grazing. However, the individ-uals in < 30 cm girth class were less than two-fold of those
in 30 to < 60 cm girth class, indicating stressed regener-ation. Evidently, 24% (29) species were lacking regener-ation as they were present in ≥ 30 cm girth class but notin < 30 cm girth class. All these species were rare: 27 spe-cies with one or less stems per hectare and two large trees(C. purpurella and Lithocarpus elegans) with > 1 but < 5stems per hectare. The remaining 76% (94) species werepresent in both < 30 and ≥ 30 cm girth classes and appar-ently regenerating well. Of these, 69 species were rare(with one or less stems per hectare) and 25 species withmore than one stem per hectare were not so rare. In apool of species, plenty of juveniles of some species couldbe compensating for the paucity of juveniles of otherspecies and the species might be replacing each othertemporarily in cyclic succession. These observations are inline with the classic ‘Mosaic Theory of Regeneration’(Aubréville 1938) developed from patterns in mixed trop-ical forests on the Ivory Coast (see Richards 1952).The selective removal of poles and collections of fire-
wood, forage and non-timber forest products (NTFPs)was visible during field enumeration and an impact ofthese activities was evident. A noticeable low number ofindividuals of S. wallichii and P. kesiya in 10 to < 30 cmgirth class is attributable to preferential removal of polesize individuals for house building. Firewood is mostlycollected from S. wallichii and P. kesiya although othertree species were also present.The ‘Khasi hill sal’ forests are of low height. Almost
69% of individuals are below 10 m and only 0.4% indi-viduals attain 20 m or more height. The vertical stratifi-cation is ‘cuspidate pyramidal’ with: i) emergent canopy(negligible with few stems ≥ 20 m, 6 species), ii) subca-nopy (well developed with tree dominance in 10 to <20 m space, 76 species), and iii) understory (robust andpredominated by small trees, shrubs and tree saplingsbelow 10 m, 102 species). Past extractions of large treesand incessant removal of small timber appear plausiblereasons for the low height. Broadly, the climate is similaracross sampled transects, but microhabitat conditionsmay vary and cause diversification of species in under-story. Hence, rare species are the principal contributors.
ConclusionsThe present study reveals that the ‘Khasi hill sal’ forestson northern slope of Meghalaya plateau bear close similar-ity with moist sal forests of eastern Himalayan foothills inDarjeeling and sal-dominated moist deciduous forests ofTripura in having high species richness, Shannon’s diver-sity and commonness of species. The number of speciesacross transects (alpha diversity) did not vary greatly, butspecies composition among transects differed appreciablyresulting into a fair compositional heterogeneity (beta di-versity) and a high value of Shannon’s diversity (H′ = 3.395nats). Unlike most other sal forests of India, the presence

Tripathi and Shankar Forest Ecosystems (2014) 1:23 Page 19 of 20
of Fagaceae with six species is remarkable. A pattern ofmixed dominance of S. robusta and S. wallichii and co-dominance of P. kesiya and C. arborea is noteworthy asmost sal forests reveal a very high dominance of S. robustaonly. The high species richness was due to presence ofmany rare species. While the values of density are wellwithin the range for sal forests of India, the values of basalarea are considerably lower than other sal forests. The dis-persion of many infrequent species was uniform and thatof six out of ten most abundant species was clumped. Fivespecies with moderate abundance showed uniform disper-sion. The current disturbance in form of small timber ex-traction, fire and grazing is common and influencingregeneration of some species. As long as the levels of dis-turbance are in control, the ‘Khasi hill sal’ forests shallmaintain a good demographic structure. A rise in disturb-ance levels shall expectedly endanger the robustness offorest structure and further threaten the relict sal forestecosystem.
Competing interestsThe authors declare that they have no competing interests.
Authors’ contributionsAKT carried out the major field work, data collation and preliminary analysis.US designed the study, reviewed literature, analyzed data and developed themanuscript. Both authors read and approved the final manuscript.
Authors’ informationAKT participated in this research as a doctoral student. US is a professor ofbotany and teaches biodiversity and ecology. He has been studyingphytosociology and regeneration of forest ecosystems in northeast Indiaunder doctor of science programme at the North-Eastern Hill University,Shillong.
AcknowledgementsThe Department of Biotechnology (DBT), Government of India, New Delhiprovided principal funding for this work through a project grant to US (grantnumber BT/PR7928/NDB/52/9/2006). AKT sincerely acknowledges a researchfellowship from this project and from UGC’s meritorious fellowshipprogramme. The authors are grateful to Prof. K.N. Ganeshaiah, UAS,Bangalore for project design and encouragement and thank the custodiansof forests in Meghalaya to permit field work, the Botanical Survey of India(BSI), Shillong for access to herbarium, and the Head, Department of Botany,North-Eastern Hill University, Shillong for logistics. Invaluable help in the workrendered by D. Kumar, S. Borah and K. Nongrum is thankfully acknowledged.
Received: 5 August 2014 Accepted: 2 December 2014
ReferencesAnonymous (2014) Climate: Nongpoh., http://en.climate-data.org/location/48848/.
AmbiWeb GmbH, Hans-Thoma-Str. 4, 76593 Gernsbach. Accessed 10 July 2014Aubréville A (1938) La forêt coloniale: les forets de l'Afrique occidentale franҫaise.
Ann Acad Sci Colon Paris 9:1–245Balakrishnan NP (1981 & 1983) Flora of Jowai and Vicinity, Meghalaya, vol I & II.
Botanical Survey of India, Howrah, IndiaChampion HG, Seth SK (1968) A Revised Survey of the Forest Types of India.
Government of India, New DelhiCurtis JT, McIntosh RP (1950) The interrelations of certain analytic and synthetic
phytosociological characters. Ecology 31:435–455Deka J, Tripathi OP, Khan ML (2012) High dominance of Shorea robusta Gaertn. in
Alluvial Plain Kamrup Sal Forest of Assam, N. E. India. Int J Ecosyst 2(4):67–73
Dutta G, Devi A (2013a) Plant diversity and community structure in tropical moistdeciduous sal (Shorea robusta Gaertn.) forest of Assam, northeast India.J Environ Appl Biores 1(3):1–4
Dutta G, Devi A (2013b) Plant diversity, population structure, and regenerationstatus in disturbed tropical forests in Assam, northeast India. J Forest Res24(4):715–720
Gautam KH, Devoe NN (2006) Ecological and anthropogenic niches of sal(Shorea robusta Gaertn. f.) forest and prospects for multiple-product forestmanagement–a review. Forestry 79:81–101
Gnasser A (1964) Geology of the Himalayas. John Wiley & Sons, New YorkGreig-Smith P (1983) Quantitative Plant Ecology, 3rd edn. Blackwell Scientific,
OxfordHammer O, Harper DAT, Ryan PD (2001) PAST: paleontological statistics software
package for education and data analysis. Palaeontola Electron 4(1):9,http://palaeo-electronica.org/2001_1/past/issue1_01.htm
Haridasan K, Rao RR (1985 & 1987) Forest flora of Meghalaya, vol I & II. BishenSingh Mahendra Pal Singh, Dehra Dun, India
Hooker JD (1872–1897) Flora of British India, vol I through VII. L. Reeve andCompany, London
Hubbell SP (1979) Tree dispersion, abundance and diversity in a tropical dryforest. Science 203:1299–1309
IUCN (2014) The IUCN Red List of Threatened Species. Version 2014.1.,http: //www.iucnredlist.org. Accessed 18 July 2014
Jain SK, Rao RR (1976) A Handbook of Field and Herbarium Methods. Today andTomorrow Printers and Publishers, New Delhi
Kanjilal UN, Kanjilal PC, Das A, De RN (1934–1940) Flora of Assam, vol I throughIV. Government of Assam, India
Kumar A, Marcot BG, Saxena A (2006) Tree species diversity and distributionpatterns in tropical forests of Garo Hills. Curr Sci 91(10):1370–1381
Kushwaha SPS, Nandy S (2012) Species diversity and community structure in sal(Shorea robusta) forests of two different rainfall regimes in West Bengal, India.Biodivers Conserv 21:1215–1228
Magurran AE (1988) Ecological Diversity and its Measurement. PrincetonUniversity Press, New Jersey, USA
Majumdar K, Shankar U, Dutta BK (2012) Tree species diversity and stand structurealong major community types in lowland primary and secondary moistdeciduous forests in Tripura, Northeast India. J Forest Res 23(4):553–568
Majumdar K, Dutta BK, Shankar U (2014) Lower altitudinal variation in habitatassociations, tree diversity and co-dominant population structures alongmoist deciduous forests dominated by sal (Shorea robusta) in northeast India.Forest Sci Technol 10:1–12
Mueller-Dombois D, Ellenberg H (1974) Aims and Methods of VegetationEcology. John Wiley and Sons, Inc., New York
Murali KS, Shankar U, Uma Shaanker R, Ganeshaiah KN, Bawa KS (1996) Extractionof non-timber forest products in the forest of Biligiri Rangan hills, India. 2. Im-pact of NTFP extraction on regeneration, population structure and speciescomposition. Econ Bot 50:252–269
Myers N (2003) Biodiversity hotspots revisited. Bioscience 53:916–917Olson DM, Dinerstein E (1998) The Global 200: a representation approach to
conserving the Earth’s most biologically valuable ecoregions. Conserv Biol12:502–515
Pandey SK, Shukla RP (2003) Plant diversity in managed sal (Shorea robustaGaertn.) forests of Gorakhpur, India: species composition, regeneration andconservation. Biodivers Conserv 12:2295–2319
Pielou EC (1975) Ecological Diversity. Wiley, New YorkRahman MM, Nishat A, Vacik H (2011) Anthropogenic disturbances and plant
diversity of the Madhupur Sal forests (Shorea robusta C.F. Gaertn) ofBangladesh. Int J Biodivers Sci, Ecosyst Serv Manage 5(3):162–173
Richards PW (1952) The Tropical Rain Forest: an Ecological Study, 1st edn.Cambridge University Press, Cambridge, p 450
Shankar U (2001) A case of high tree diversity in sal (Shorea robusta)-dominatedlowland forest of eastern Himalaya: floristic composition, regeneration andconservation. Curr Sci 81:776–786
Shankar U, Tripathi RS, Pandey HN (1991) Structure and seasonal dynamics ofhumid tropical grasslands in Meghalaya, India. J Veg Sci 2:711–714
Shankar U, Pandey HN, Tripathi RS (1993) Phytomass dynamics and primaryproductivity in humid grasslands along altitudinal and rainfall gradients. ActaOecol 14:197–209
Shankar U, Lama SD, Bawa KS (1998a) Ecosystem reconstruction through‘taungya’ plantations following commercial logging of a dry, mixeddeciduous forest in Darjeeling Himalaya. Forest Ecol Manage 102:131–142

Tripathi and Shankar Forest Ecosystems (2014) 1:23 Page 20 of 20
Shankar U, Murali KS, Uma Shaanker R, Ganeshaiah KN, Bawa KS (1998b)Extraction of non-timber forest products in the forest of Biligiri Rangan hills,India. 4. Impact on floristic diversity and population structure in a thorn scrubforest. Econ Bot 52:302–315
Shannon CE (1948) A mathematical theory of communication. Bell Syst Tech J27(379–423):623–656
Simpson EH (1949) Measurement of diversity. Nature 163:688Singh A, Reddy VS, Singh JS (1995) Analysis of woody vegetation of Corbett
National Park. India Vegetatio 120:69–79Tewari VP, Álvarez-gonzález JG, García O (2014) Developing a dynamic growth model
for teak plantations in India. Forest Ecosyst 1:9, doi:10.1186/2197-5620-1-9The Plant List (2013) Version 1.1, http://www.theplantlist.org/. Accessed 10 July 2014Tiwari DN (1995) A Monograph on Sal (Shorea robusta). International Book
Distributors, Dehra Dun, IndiaTroup RS (1921) The Silviculture of Indian Trees, vol I–III. Clarendon, OxfordWhittaker RH (1972) Evolution and measurement of species diversity. Taxon
21:213–251
Submit your manuscript to a journal and benefi t from:
7 Convenient online submission
7 Rigorous peer review
7 Immediate publication on acceptance
7 Open access: articles freely available online
7 High visibility within the fi eld
7 Retaining the copyright to your article
Submit your next manuscript at 7 springeropen.com