research article magnetic resonance sialography findings...
TRANSCRIPT

Hindawi Publishing CorporationBioMed Research InternationalVolume 2013, Article ID 417052, 6 pageshttp://dx.doi.org/10.1155/2013/417052
Research ArticleMagnetic Resonance Sialography Findings of SubmandibularDucts Imaging
Nezahat Karaca ErdoLan,1 Canan Altay,2 Nesibe Özenler,3 TuLba Bozkurt,1
Engin Uluç,1 Berna Dirim Mete,1 and Esmail Özdemir4
1 Department of Radiology, Izmir Ataturk Research and Training Hospital, Basın Sitesi, Karabaglar, 35360 Izmir, Turkey2Department of Radiology, Medical School, Dokuz Eylul University, Inciralti, 35340 Izmir, Turkey3 Department of Radiology, Balıkesir Ataturk State Hospital, Yıldız Mahallesi Soma Caddesi No. 1, 10100 Balıkesir, Turkey4Universal Ege Health Hospital, 35220 Izmir, Turkey
Correspondence should be addressed to Canan Altay; [email protected]
Received 2 April 2013; Revised 29 May 2013; Accepted 12 June 2013
Academic Editor: Yoshito Tsushima
Copyright © 2013 Nezahat Karaca Erdogan et al.This is an open access article distributed under theCreativeCommonsAttributionLicense, which permits unrestricted use, distribution, and reproduction in anymedium, provided the originalwork is properly cited.
Purpose. We aimed to assess the problem solving capability of magnetic resonance sialography (MR sialography), a noninvasivemethod for imaging submandibular gland ducts and determining duct-related pathologies, by comparing diseased and healthycases.Materials and Methods. We conducted radiological assessment on a total of 60 submandibular glands (mean age 44.7) in 20cases and 10 volunteers. MR sialography examinations were conducted with single-shot fast spin-echo sequence by using a surfacecoil placed on the submandibular gland. Each glandwas evaluated in terms of the length, width and stricture of themain duct, aswellas the difference between the intraparenchymal duct width, and the main duct width. Statistical analysis was performed. Results. Inthe MR sialography the primary duct mean length was determined as 51mm (40–57mm) in all submandibular glands. On the MRsialography imaging, the visualization ratio of the ductal system of submandibular gland was evaluated in the cases and volunteers.Conclusion. MR sialography is an effective and a noninvasive method in imaging submandibular gland ducts, demonstrating thepresence, location and degree of stricture/dilatation, and elucidating the disease etiology.
1. Introduction
Conventional and digital sialography, US, CT imaging, andMR sialography (MR-Si) methods are used in the assessmentof major salivary gland ducts [1, 2]. In the imaging ofthe primary submandibular gland duct and intraglandularbranches, conventional sialography is the golden standardtechnique [3]. However, sialographic examination is an inva-sive method which requires the use of an iodized contrastagent and causes ionizing radiation exposure. Its use iscontraindicated in cases with iodine allergy, thyroid glanddisease, or active infection [4, 5]. The primary limitation ofconventional sialography is that stricture cannot be overcomeat most times in cases with duct obstruction and thereforeexamination cannot be carried out, and even if the examina-tion is performed, the proximal segment of the stricture of thesubmandibular duct cannot be evaluated.
The most prevalent pathology of submandibular glandducts is calculus and calculus-induced inflammations [6].
80–82%of all salivary gland calculi are traced in submandibu-lar ducts [6, 7].
In recent years, conventional sialography has been re-placed by MR-Si examinations in which the patient’s ownsalivary secretion is used as a natural contrast agent andwhich can be conducted quickly and without any com-plications [6, 8–10]. In this study, we aimed to assess theproblem solving capability of MR-Si, a noninvasive methodfor imaging submandibular gland ducts and determiningduct-related pathologies, by comparing diseased and healthycases.
2. Materials and Methods
In our study, we conducted radiological assessment on a totalof 60 submandibular glands, 40 submandibular glands of 20cases (13 females and 7 males) between 18 and 71 years ofage (mean age 42.9) who applied to our hospital between

2 BioMed Research International
September 2007 and July 2011 with complaints of pain andswelling in submandibular glands, and 20 submandibularglands of 10 volunteers (6 females and 4 males) between 17and 38 years of age (mean age 26.1). No statistical comparisonwas performed in the age groups between cases and vol-unteers. All patients were referred from the otolaryngologyoutpatient clinic for MR-Si with presenting symptoms ofintermittent pain and swelling of the submandibular glandsrelated to eating (45%), persistent swelling (38%), and chronicsialadenitis (16%). Persistent bilateral swelling was present intwo patients. Twenty submandibular glands were clinicallynormal and thirteen of them found normal ultrasonographicfindings in disease group. The normal sides of the diseasegroup were not included into the control group in this study.Conventional sialography was not performed in any of thedisease group cases.
The study was approved by the review board of ourdepartment. All patients gave informed consent to participatebefore beginning the study.
The cases were first subjected to MRI with conventionalsequences and then to MR-Si examination by stimulatingtheir salivary secretion with lemon.
2.1. Conventional MRI. In MRI, fast spin echo (FSE) T1-weighted axial images (TR: 400msec, TE: 17, number of signalacquisitions (NSA): 3, matrix: 256 × 256, FOV: 250, sectionthickness: 4mm, intersection gap: 1mm, and examinationperiod: 3min 4 sec), fat-suppressed FSE T2-weighted axialimages (TR: 2500, TE: 110, NSA: 2, echo train length: 15,matrix: 256 × 256, FOV: 250, section thickness: 4mm, inter-section gap: 1mm, and examination period: 3min 16 sec),and FSE T2-weighted images in the coronal plane (TR: 4872,TE: 100, NSA: 2, echo train length: 15, matrix: 256 × 256,FOV: 250, section thickness: 4mm, intersection gap: 1mm,and examination period: 1min 57 sec) were obtained by 1.5 Tscanner (Gyroscan Intera, Philips Medical Systems, Best,The Netherlands) in the maxillofacial area by using a 20 cmsurface coil (flex M coil). Fat saturation was suppressed thesignals from the subcutaneous fat. Intravenous paramagneticagent was not used in the examination, since it could obscurethe signal changes in the gland parenchyma. The size ofsubmandibular glands, signal properties in T1- and T2-weighted axial images, duct content, and the presence ofmasswere evaluated in the conventional MRI.
2.2. MR Sialography. Each patient underwent MR-Si usingT2-weighted sequences. MR-Si examinations were con-ducted with 2D single-shot fast spin-echo (SSFSE) sequence(TR/TE/NSA: 8000/800/5, matrix: 192 × 256, FOV: 110 ×110mm, bandwidth: 32 kHz, TSE factor 54, spectral presat-uration with inversion recovery (SPIR), and examinationperiod: 2min 20 sec) with parallel imaging (SENSE) by usingsurface coil (synergy flex M) placed on the submandibu-lar gland. The slice thickness was 3-4 cm, depending onthe submandibular gland volume. Gadolinium-containingcontrast agent was not administered. 2D SSFSE sequenceswere acquired in a sagittal-oblique plane parallel to theWharton duct at 2–4 different angular planes to display
Figure 1: Submandibular gland ducts byMR sialography. 1: primary,2: secondary, and 3: tertiary branches.
the submandibular gland and ductal system. Patients werehydrated for 2-3 days prior to the examination in orderto increase salivary secretion and image quality. Before theexamination, lemon juice (5 cc) was given to all patients toincrease the salivary secretion. Patients, who have parotitisor Stensen’s duct obstruction, are very sensitive to the lemonjuice which stimulates salivation and may cause pain. Priorto investigation, patients should be questioned for the parotidgland disease.
The morphology of submandibular gland ducts and thepresence of accessory ductus were evaluated in the MR-Siimages. Intraparenchymal ducts were classified as primary,secondary, and tertiary branches for terminological conve-nience and ease of identification (Figure 1) [1, 9]. Each glandwas evaluated in terms of the length, width, and strictureof the primary duct, as well as the difference between theintraparenchymal duct width and the primary duct width.
Diameter measurements were obtained as follows. First,sagittal-oblique 2D SSFSE images at 2–4 different angularplanes were reviewed, and the one with a well-demonstratedductal system of submandibular gland with the least super-imposed artifacts was used for measurements. This was doneby drawing a line along the center of the primary duct asviewed on theMR-SI image.Thiswas the long-axis viewof theprimary duct. The assessment of the primary ductal lengthof the submandibular gland was performed between thelevel of submandibular gland edge and sublingual caruncle.The long-axis diameter of primary duct was measured usingthe electronic caliper provided by the picture archiving andcommunications system (Angora PACS, Datamed MedicalSystems, Ankara, Turkey). This allowed all anteroposteriordiameter measurements to be obtained in a plane perpen-dicular to the long axis of the primary duct (Figure 1).The inner anteroposterior diameters of the primary ductof submandibular gland were measured at four locationsat 10mm intervals, starting from the origin of the primaryduct at the edge of the submandibular gland (level 1) toa point of the ostium at the sublingual caruncle (level 4).Eachmeasurement was performed three times, and themean
BioMed Research International 3
Table 1: Submandibular gland conventional MRI findings.
Conventional MRI findings in cases with clinical complaints(submandibular gland 𝑛 = 40)
Parenchymal heterogeneity 11Atrophy 4Mass 1Stone 5Ectasia 4Normal 15
values were recorded. onemm was considered the upperlimit of normal values for the diameter of the primaryduct of submandibular gland [10]. The inner diameters ofthe primary branch were obtained with the same methodbetween the origin point from primary duct and the levelof ramification of the primary branches. The relationshipbetween primary duct and branch width in patients withstone and sialoadenitis and normal volunteers was studiedusing independent samples 𝑡-test for independent samples.In our study, the longitudinal diameter measurements onprimary, secondary, and tertiary branches of submandibulargland were not performed.
3. Results
In our study, a total of 60 submandibular glands (40 sub-mandibular glands of 20 patients and 20 submandibularglands of 10 volunteers without any clinical complaints) wereassessed initially by MRI and then by MR-Si examination.
3.1. Conventional MRI. In the MRI of 20 submandibularglands obtained from the volunteer group, submandibularglanddimensions, parenchyma signal, andhomogeneitywerefound to be normal.
In the MRI of 40 (𝑛 = 40) submandibular glandsobtained from the diseased cases, parenchymal heterogeneityand extension in intraparenchymal ducts (𝑛 = 11), atrophyand fat infiltration (𝑛 = 4), mass lesion next to the posteriorof the submandibular gland (𝑛 = 1), findings of stone andobstruction in the main distal of the duct (𝑛 = 5), and focalsegmental dilatations in the intraparenchymal ducts (𝑛 = 4)were detected (Table 1). In the rest of the group (𝑛 = 15),MRI findings of the submandibular gland were observed tobe normal.
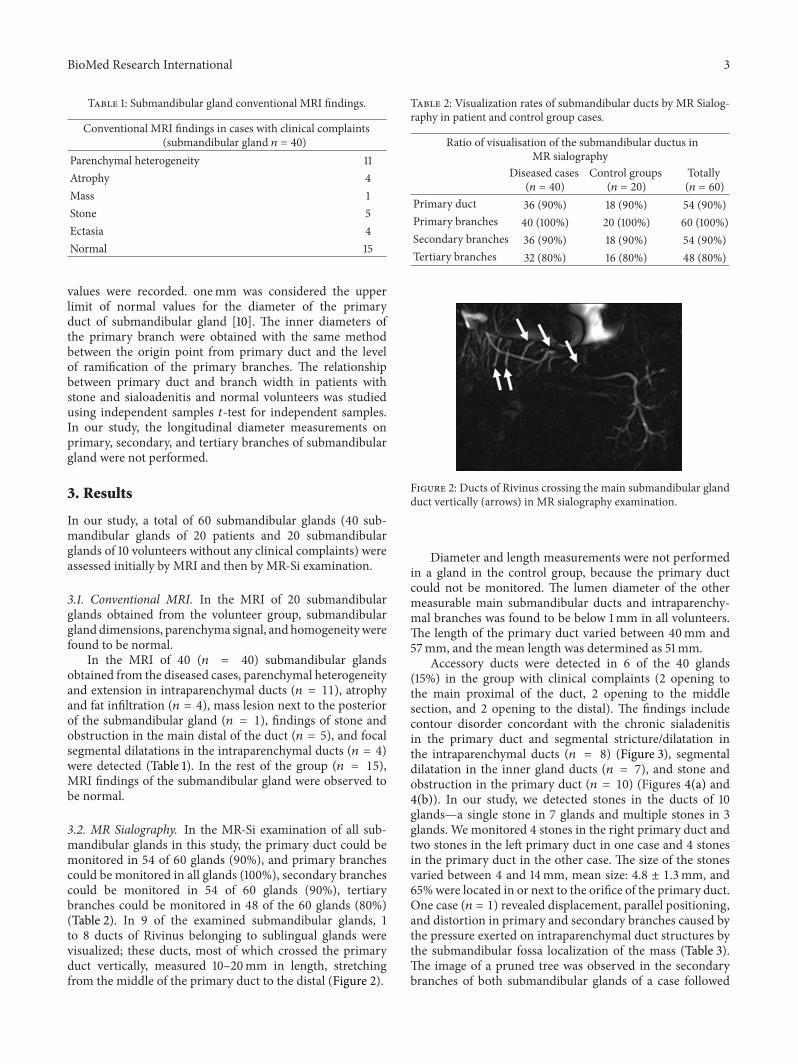
3.2. MR Sialography. In the MR-Si examination of all sub-mandibular glands in this study, the primary duct could bemonitored in 54 of 60 glands (90%), and primary branchescould be monitored in all glands (100%), secondary branchescould be monitored in 54 of 60 glands (90%), tertiarybranches could be monitored in 48 of the 60 glands (80%)(Table 2). In 9 of the examined submandibular glands, 1to 8 ducts of Rivinus belonging to sublingual glands werevisualized; these ducts, most of which crossed the primaryduct vertically, measured 10–20mm in length, stretchingfrom the middle of the primary duct to the distal (Figure 2).
Table 2: Visualization rates of submandibular ducts by MR Sialog-raphy in patient and control group cases.
Ratio of visualisation of the submandibular ductus inMR sialography
Diseased cases(𝑛 = 40)
Control groups(𝑛 = 20)
Totally(𝑛 = 60)
Primary duct 36 (90%) 18 (90%) 54 (90%)Primary branches 40 (100%) 20 (100%) 60 (100%)Secondary branches 36 (90%) 18 (90%) 54 (90%)Tertiary branches 32 (80%) 16 (80%) 48 (80%)
Figure 2: Ducts of Rivinus crossing the main submandibular glandduct vertically (arrows) in MR sialography examination.
Diameter and length measurements were not performedin a gland in the control group, because the primary ductcould not be monitored. The lumen diameter of the othermeasurable main submandibular ducts and intraparenchy-mal branches was found to be below 1mm in all volunteers.The length of the primary duct varied between 40mm and57mm, and the mean length was determined as 51mm.
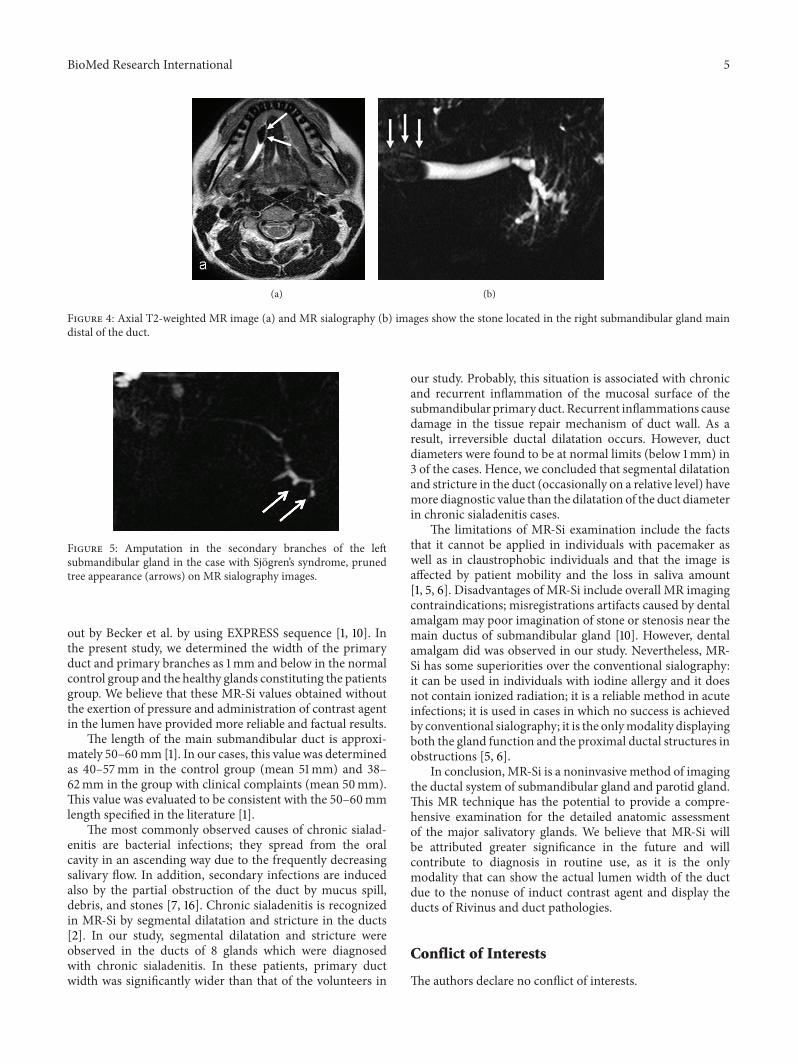
Accessory ducts were detected in 6 of the 40 glands(15%) in the group with clinical complaints (2 opening tothe main proximal of the duct, 2 opening to the middlesection, and 2 opening to the distal). The findings includecontour disorder concordant with the chronic sialadenitisin the primary duct and segmental stricture/dilatation inthe intraparenchymal ducts (𝑛 = 8) (Figure 3), segmentaldilatation in the inner gland ducts (𝑛 = 7), and stone andobstruction in the primary duct (𝑛 = 10) (Figures 4(a) and4(b)). In our study, we detected stones in the ducts of 10glands—a single stone in 7 glands and multiple stones in 3glands. We monitored 4 stones in the right primary duct andtwo stones in the left primary duct in one case and 4 stonesin the primary duct in the other case. The size of the stonesvaried between 4 and 14mm, mean size: 4.8 ± 1.3mm, and65%were located in or next to the orifice of the primary duct.One case (𝑛 = 1) revealed displacement, parallel positioning,and distortion in primary and secondary branches caused bythe pressure exerted on intraparenchymal duct structures bythe submandibular fossa localization of the mass (Table 3).The image of a pruned tree was observed in the secondarybranches of both submandibular glands of a case followed
4 BioMed Research International
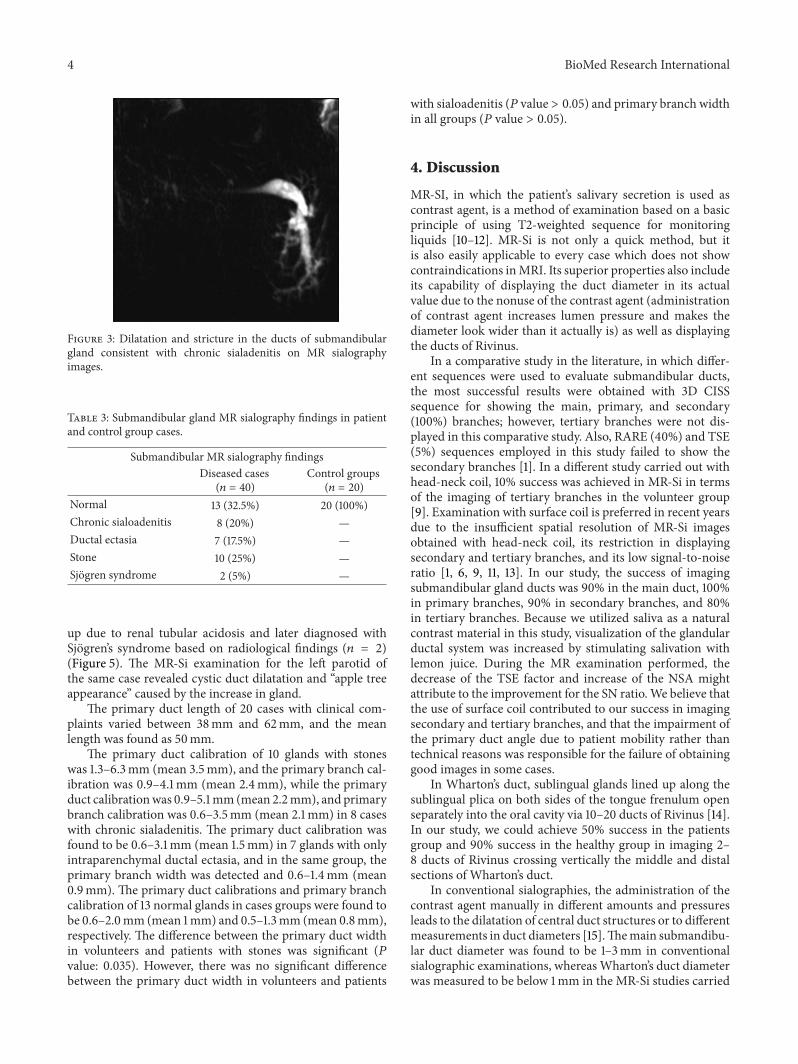
Figure 3: Dilatation and stricture in the ducts of submandibulargland consistent with chronic sialadenitis on MR sialographyimages.
Table 3: Submandibular gland MR sialography findings in patientand control group cases.
Submandibular MR sialography findingsDiseased cases
(𝑛 = 40)Control groups
(𝑛 = 20)Normal 13 (32.5%) 20 (100%)Chronic sialoadenitis 8 (20%) —Ductal ectasia 7 (17.5%) —Stone 10 (25%) —Sjogren syndrome 2 (5%) —
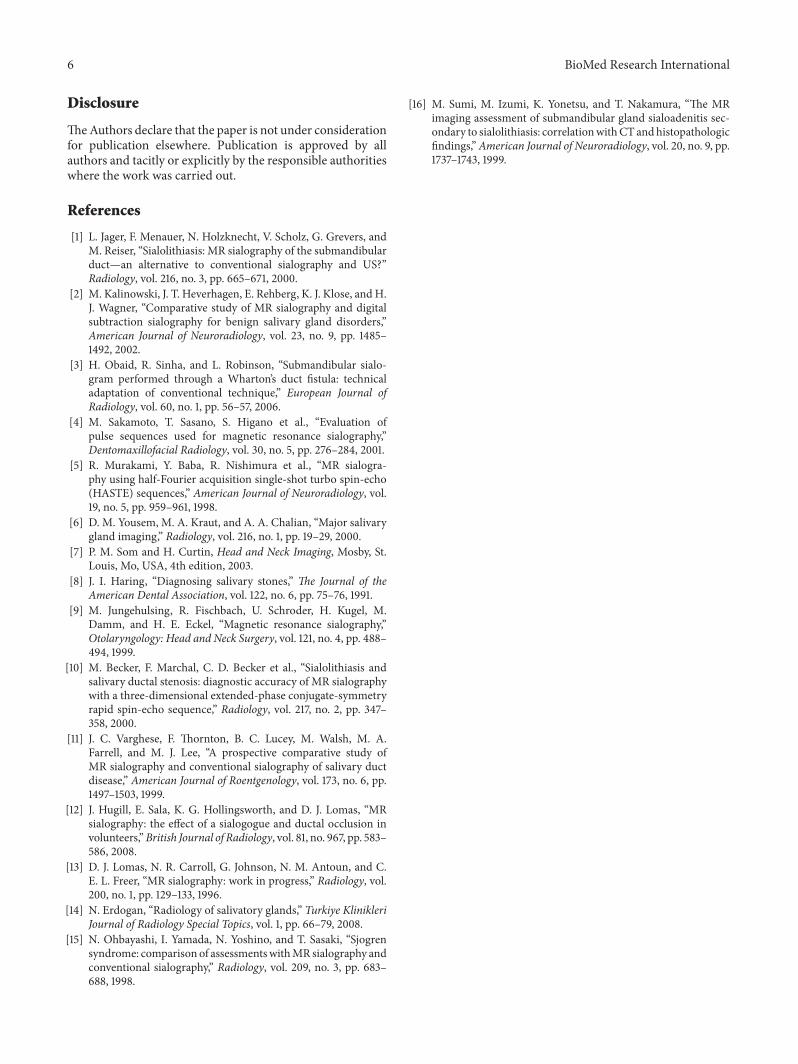
up due to renal tubular acidosis and later diagnosed withSjogren’s syndrome based on radiological findings (𝑛 = 2)(Figure 5). The MR-Si examination for the left parotid ofthe same case revealed cystic duct dilatation and “apple treeappearance” caused by the increase in gland.
The primary duct length of 20 cases with clinical com-plaints varied between 38mm and 62mm, and the meanlength was found as 50mm.
The primary duct calibration of 10 glands with stoneswas 1.3–6.3mm (mean 3.5mm), and the primary branch cal-ibration was 0.9–4.1mm (mean 2.4mm), while the primaryduct calibrationwas 0.9–5.1mm (mean 2.2mm), and primarybranch calibration was 0.6–3.5mm (mean 2.1mm) in 8 caseswith chronic sialadenitis. The primary duct calibration wasfound to be 0.6–3.1mm (mean 1.5mm) in 7 glands with onlyintraparenchymal ductal ectasia, and in the same group, theprimary branch width was detected and 0.6–1.4mm (mean0.9mm). The primary duct calibrations and primary branchcalibration of 13 normal glands in cases groups were found tobe 0.6–2.0mm (mean 1mm) and 0.5–1.3mm (mean 0.8mm),respectively. The difference between the primary duct widthin volunteers and patients with stones was significant (𝑃value: 0.035). However, there was no significant differencebetween the primary duct width in volunteers and patients
with sialoadenitis (𝑃 value > 0.05) and primary branch widthin all groups (𝑃 value > 0.05).
4. Discussion
MR-SI, in which the patient’s salivary secretion is used ascontrast agent, is a method of examination based on a basicprinciple of using T2-weighted sequence for monitoringliquids [10–12]. MR-Si is not only a quick method, but itis also easily applicable to every case which does not showcontraindications inMRI. Its superior properties also includeits capability of displaying the duct diameter in its actualvalue due to the nonuse of the contrast agent (administrationof contrast agent increases lumen pressure and makes thediameter look wider than it actually is) as well as displayingthe ducts of Rivinus.
In a comparative study in the literature, in which differ-ent sequences were used to evaluate submandibular ducts,the most successful results were obtained with 3D CISSsequence for showing the main, primary, and secondary(100%) branches; however, tertiary branches were not dis-played in this comparative study. Also, RARE (40%) and TSE(5%) sequences employed in this study failed to show thesecondary branches [1]. In a different study carried out withhead-neck coil, 10% success was achieved in MR-Si in termsof the imaging of tertiary branches in the volunteer group[9]. Examination with surface coil is preferred in recent yearsdue to the insufficient spatial resolution of MR-Si imagesobtained with head-neck coil, its restriction in displayingsecondary and tertiary branches, and its low signal-to-noiseratio [1, 6, 9, 11, 13]. In our study, the success of imagingsubmandibular gland ducts was 90% in the main duct, 100%in primary branches, 90% in secondary branches, and 80%in tertiary branches. Because we utilized saliva as a naturalcontrast material in this study, visualization of the glandularductal system was increased by stimulating salivation withlemon juice. During the MR examination performed, thedecrease of the TSE factor and increase of the NSA mightattribute to the improvement for the SN ratio.We believe thatthe use of surface coil contributed to our success in imagingsecondary and tertiary branches, and that the impairment ofthe primary duct angle due to patient mobility rather thantechnical reasons was responsible for the failure of obtaininggood images in some cases.
In Wharton’s duct, sublingual glands lined up along thesublingual plica on both sides of the tongue frenulum openseparately into the oral cavity via 10–20 ducts of Rivinus [14].In our study, we could achieve 50% success in the patientsgroup and 90% success in the healthy group in imaging 2–8 ducts of Rivinus crossing vertically the middle and distalsections of Wharton’s duct.
In conventional sialographies, the administration of thecontrast agent manually in different amounts and pressuresleads to the dilatation of central duct structures or to differentmeasurements in duct diameters [15].Themain submandibu-lar duct diameter was found to be 1–3mm in conventionalsialographic examinations, whereasWharton’s duct diameterwas measured to be below 1mm in the MR-Si studies carried
BioMed Research International 5
(a) (b)
Figure 4: Axial T2-weighted MR image (a) and MR sialography (b) images show the stone located in the right submandibular gland maindistal of the duct.
Figure 5: Amputation in the secondary branches of the leftsubmandibular gland in the case with Sjogren’s syndrome, prunedtree appearance (arrows) on MR sialography images.
out by Becker et al. by using EXPRESS sequence [1, 10]. Inthe present study, we determined the width of the primaryduct and primary branches as 1mm and below in the normalcontrol group and the healthy glands constituting the patientsgroup. We believe that these MR-Si values obtained withoutthe exertion of pressure and administration of contrast agentin the lumen have provided more reliable and factual results.
The length of the main submandibular duct is approxi-mately 50–60mm [1]. In our cases, this value was determinedas 40–57mm in the control group (mean 51mm) and 38–62mm in the group with clinical complaints (mean 50mm).This value was evaluated to be consistent with the 50–60mmlength specified in the literature [1].
The most commonly observed causes of chronic sialad-enitis are bacterial infections; they spread from the oralcavity in an ascending way due to the frequently decreasingsalivary flow. In addition, secondary infections are inducedalso by the partial obstruction of the duct by mucus spill,debris, and stones [7, 16]. Chronic sialadenitis is recognizedin MR-Si by segmental dilatation and stricture in the ducts[2]. In our study, segmental dilatation and stricture wereobserved in the ducts of 8 glands which were diagnosedwith chronic sialadenitis. In these patients, primary ductwidth was significantly wider than that of the volunteers in
our study. Probably, this situation is associated with chronicand recurrent inflammation of the mucosal surface of thesubmandibular primary duct. Recurrent inflammations causedamage in the tissue repair mechanism of duct wall. As aresult, irreversible ductal dilatation occurs. However, ductdiameters were found to be at normal limits (below 1mm) in3 of the cases. Hence, we concluded that segmental dilatationand stricture in the duct (occasionally on a relative level) havemore diagnostic value than the dilatation of the duct diameterin chronic sialadenitis cases.
The limitations of MR-Si examination include the factsthat it cannot be applied in individuals with pacemaker aswell as in claustrophobic individuals and that the image isaffected by patient mobility and the loss in saliva amount[1, 5, 6]. Disadvantages of MR-Si include overall MR imagingcontraindications; misregistrations artifacts caused by dentalamalgam may poor imagination of stone or stenosis near themain ductus of submandibular gland [10]. However, dentalamalgam did was observed in our study. Nevertheless, MR-Si has some superiorities over the conventional sialography:it can be used in individuals with iodine allergy and it doesnot contain ionized radiation; it is a reliable method in acuteinfections; it is used in cases in which no success is achievedby conventional sialography; it is the onlymodality displayingboth the gland function and the proximal ductal structures inobstructions [5, 6].
In conclusion, MR-Si is a noninvasive method of imagingthe ductal system of submandibular gland and parotid gland.This MR technique has the potential to provide a compre-hensive examination for the detailed anatomic assessmentof the major salivatory glands. We believe that MR-Si willbe attributed greater significance in the future and willcontribute to diagnosis in routine use, as it is the onlymodality that can show the actual lumen width of the ductdue to the nonuse of induct contrast agent and display theducts of Rivinus and duct pathologies.
Conflict of Interests
The authors declare no conflict of interests.
6 BioMed Research International
Disclosure
TheAuthors declare that the paper is not under considerationfor publication elsewhere. Publication is approved by allauthors and tacitly or explicitly by the responsible authoritieswhere the work was carried out.
References
[1] L. Jager, F. Menauer, N. Holzknecht, V. Scholz, G. Grevers, andM. Reiser, “Sialolithiasis: MR sialography of the submandibularduct—an alternative to conventional sialography and US?”Radiology, vol. 216, no. 3, pp. 665–671, 2000.
[2] M. Kalinowski, J. T. Heverhagen, E. Rehberg, K. J. Klose, and H.J. Wagner, “Comparative study of MR sialography and digitalsubtraction sialography for benign salivary gland disorders,”American Journal of Neuroradiology, vol. 23, no. 9, pp. 1485–1492, 2002.
[3] H. Obaid, R. Sinha, and L. Robinson, “Submandibular sialo-gram performed through a Wharton’s duct fistula: technicaladaptation of conventional technique,” European Journal ofRadiology, vol. 60, no. 1, pp. 56–57, 2006.
[4] M. Sakamoto, T. Sasano, S. Higano et al., “Evaluation ofpulse sequences used for magnetic resonance sialography,”Dentomaxillofacial Radiology, vol. 30, no. 5, pp. 276–284, 2001.
[5] R. Murakami, Y. Baba, R. Nishimura et al., “MR sialogra-phy using half-Fourier acquisition single-shot turbo spin-echo(HASTE) sequences,” American Journal of Neuroradiology, vol.19, no. 5, pp. 959–961, 1998.
[6] D. M. Yousem, M. A. Kraut, and A. A. Chalian, “Major salivarygland imaging,” Radiology, vol. 216, no. 1, pp. 19–29, 2000.
[7] P. M. Som and H. Curtin, Head and Neck Imaging, Mosby, St.Louis, Mo, USA, 4th edition, 2003.
[8] J. I. Haring, “Diagnosing salivary stones,” The Journal of theAmerican Dental Association, vol. 122, no. 6, pp. 75–76, 1991.
[9] M. Jungehulsing, R. Fischbach, U. Schroder, H. Kugel, M.Damm, and H. E. Eckel, “Magnetic resonance sialography,”Otolaryngology: Head and Neck Surgery, vol. 121, no. 4, pp. 488–494, 1999.
[10] M. Becker, F. Marchal, C. D. Becker et al., “Sialolithiasis andsalivary ductal stenosis: diagnostic accuracy of MR sialographywith a three-dimensional extended-phase conjugate-symmetryrapid spin-echo sequence,” Radiology, vol. 217, no. 2, pp. 347–358, 2000.
[11] J. C. Varghese, F. Thornton, B. C. Lucey, M. Walsh, M. A.Farrell, and M. J. Lee, “A prospective comparative study ofMR sialography and conventional sialography of salivary ductdisease,” American Journal of Roentgenology, vol. 173, no. 6, pp.1497–1503, 1999.
[12] J. Hugill, E. Sala, K. G. Hollingsworth, and D. J. Lomas, “MRsialography: the effect of a sialogogue and ductal occlusion involunteers,”British Journal of Radiology, vol. 81, no. 967, pp. 583–586, 2008.
[13] D. J. Lomas, N. R. Carroll, G. Johnson, N. M. Antoun, and C.E. L. Freer, “MR sialography: work in progress,” Radiology, vol.200, no. 1, pp. 129–133, 1996.
[14] N. Erdogan, “Radiology of salivatory glands,” Turkiye KlinikleriJournal of Radiology Special Topics, vol. 1, pp. 66–79, 2008.
[15] N. Ohbayashi, I. Yamada, N. Yoshino, and T. Sasaki, “Sjogrensyndrome: comparison of assessmentswithMR sialography andconventional sialography,” Radiology, vol. 209, no. 3, pp. 683–688, 1998.
[16] M. Sumi, M. Izumi, K. Yonetsu, and T. Nakamura, “The MRimaging assessment of submandibular gland sialoadenitis sec-ondary to sialolithiasis: correlationwithCTandhistopathologicfindings,”American Journal of Neuroradiology, vol. 20, no. 9, pp.1737–1743, 1999.

Submit your manuscripts athttp://www.hindawi.com
Stem CellsInternational
Hindawi Publishing Corporationhttp://www.hindawi.com Volume 2014
Hindawi Publishing Corporationhttp://www.hindawi.com Volume 2014
MEDIATORSINFLAMMATION
of
Hindawi Publishing Corporationhttp://www.hindawi.com Volume 2014
Behavioural Neurology
EndocrinologyInternational Journal of
Hindawi Publishing Corporationhttp://www.hindawi.com Volume 2014
Hindawi Publishing Corporationhttp://www.hindawi.com Volume 2014
Disease Markers
Hindawi Publishing Corporationhttp://www.hindawi.com Volume 2014
BioMed Research International
OncologyJournal of
Hindawi Publishing Corporationhttp://www.hindawi.com Volume 2014
Hindawi Publishing Corporationhttp://www.hindawi.com Volume 2014
Oxidative Medicine and Cellular Longevity
Hindawi Publishing Corporationhttp://www.hindawi.com Volume 2014
PPAR Research
The Scientific World JournalHindawi Publishing Corporation http://www.hindawi.com Volume 2014
Immunology ResearchHindawi Publishing Corporationhttp://www.hindawi.com Volume 2014
Journal of
ObesityJournal of
Hindawi Publishing Corporationhttp://www.hindawi.com Volume 2014
Hindawi Publishing Corporationhttp://www.hindawi.com Volume 2014
Computational and Mathematical Methods in Medicine
OphthalmologyJournal of
Hindawi Publishing Corporationhttp://www.hindawi.com Volume 2014
Diabetes ResearchJournal of
Hindawi Publishing Corporationhttp://www.hindawi.com Volume 2014
Hindawi Publishing Corporationhttp://www.hindawi.com Volume 2014
Research and TreatmentAIDS
Hindawi Publishing Corporationhttp://www.hindawi.com Volume 2014
Gastroenterology Research and Practice
Hindawi Publishing Corporationhttp://www.hindawi.com Volume 2014
Parkinson’s Disease
Evidence-Based Complementary and Alternative Medicine
Volume 2014Hindawi Publishing Corporationhttp://www.hindawi.com