research article fair optimization of video streaming
TRANSCRIPT
Research ArticleFair Optimization of Video Streaming Quality ofExperience in LTE Networks Using Distributed AntennaSystems and Radio Resource Management
Elias Yaacoub1 and Zaher Dawy2
1 Qatar Mobility Innovations Center (QMIC) Qatar Science and Technology Park PO Box 210531 Doha Qatar2 Electrical and Computer Engineering Department Faculty of Engineering and Architecture American University of BeirutRiad El-Solh PO Box 11-0236 Beirut 1107 2020 Lebanon
Correspondence should be addressed to Elias Yaacoub eliasyqmiccom
Received 30 January 2014 Accepted 7 May 2014 Published 25 May 2014
Academic Editor Dritan Nace
Copyright copy 2014 E Yaacoub and Z Dawy This is an open access article distributed under the Creative Commons AttributionLicense which permits unrestricted use distribution and reproduction in any medium provided the original work is properlycited
Network quality of experience (QoE) metrics are proposed in order to capture the overall performance of radio resourcemanagement (RRM) algorithms in terms of video quality perceived by the end users Metrics corresponding to average geometricmean and minimum QoE in the network are measured when Max CI proportional fair and Max-Min RRM algorithms areimplemented in the network The objective is to ensure a fair QoE for all users in the network In our study we investigate boththe uplink (UL) and downlink (DL) directions and we consider the use of distributed antenna systems (DASs) to enhance theperformanceThe performance of the various RRMmethods in terms of the proposed network QoEmetrics is studied in scenarioswith and without DAS deployments Results show that a combination of DAS and fair RRM algorithms can lead to significant andfair QoE enhancements for all the users in the network
1 Introduction
With the increased video traffic in state-of-the art cellularnetworks it is imperative to enhance the quality of service(QoS) of video transmissions usually represented by thevideo peak signal to noise ratio (PSNR) On the other handvideo quality of experience (QoE) is gaining significantinterest as a method to quantify the multimedia experienceof mobile users for example see [1] It can be considered asa ldquoperceived QoSrdquo and reflects better than QoS the qualityof the video as seen by the mobile users QoE measures arebased on subjective assessment of video quality by the usersMean opinion scores (MOS) are then collected and analyzedin order to derive an objective QoE metric translated into amathematical formula similarly to QoS
Most of the QoE investigations in the literature forexample [1ndash4] consider link level QoE that is the QoEperceived by a given user in the network The novelty inthis work is in proposing metrics for assessing the QoE
performance over the whole network taking into accountfairness constraints in the QoE perceived by different usersFurthermore we study the impact of different radio resourcemanagement (RRM) algorithms on optimizing the networkQoE performance and ensuring fairness towards the varioususers in the network
The investigation is performed under the framework ofthe long term evolution (LTE) system In LTE orthogonalfrequency division multiple access (OFDMA) is the accessscheme for the downlink (DL) that is the direction oftransmission from the BS to the users In the LTE uplink(UL) that is the direction of transmission from the usersto the BS single carrier frequency division multiple access(SCFDMA) a modified form of OFDMA is used [5] In LTEthe available spectrum is divided into resource blocks (RBs)each consisting of 12 adjacent subcarriers The assignment ofan RB takes place every 1ms agreed to be the duration ofone transmission time interval (TTI) or the duration of two
Hindawi Publishing CorporationJournal of Applied MathematicsVolume 2014 Article ID 562079 12 pageshttpdxdoiorg1011552014562079
2 Journal of Applied Mathematics
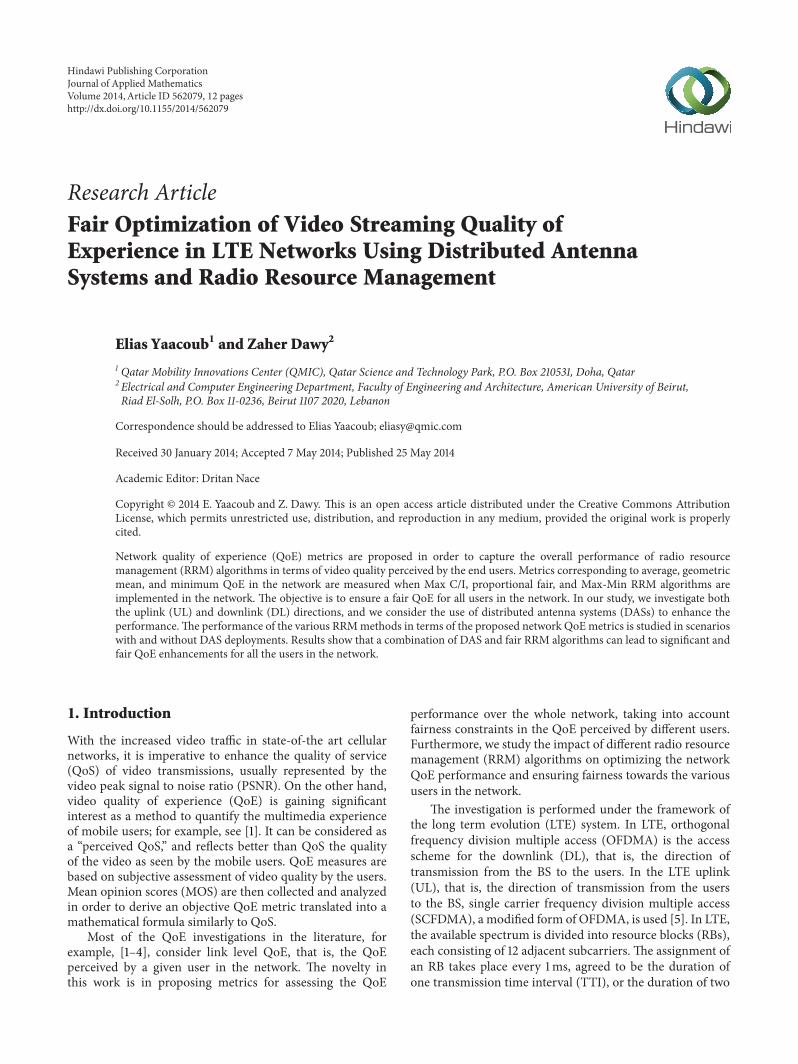
I1 P2 P3 P4 P5 P6 P7 P8 P9 I10 P11 P12
1 2 3 4 4 4 4 4 4 10 11
Error concealment
Coded frames
Displayed frames 12
Figure 1 Error concealment example
05ms slots [6] The LTE standard imposes the UL constraintthat the RBs allocated to a single user should be consecutivewith equal power allocation over the RBs [5ndash7]
An important method to boost performance in cellularsystems is the deployment of distributed antenna systems(DASs) DASs are used to increase the coverage and capacityof wireless networks in a cost effective way Although they areused in previous generations of wireless systems DASs arereceiving significant research attention for their deploymentin LTE for example see [8]The impact ofDASonLTEuplinkscheduling was studied in [9] and their uplink and downlinkperformance were studied in [10] in the context of publicsafety networks
Generally a DAS system consists of a single centralBS connected to several remote antenna heads (RAHs)distributed throughout the cell area The BS controlling theRAHs could be colocated with any of the RAHs or in aseparate location The BS could be connected to RAHs viawired cables (eg fiber optic) Connection topologies includestar chain tree and ring topologies [11] Since an RAH iscomposed of a remote antenna connected to the BS thisallows centralized control to be performed by the BS as in theconventional case while the RAHs allow extended coverageandormore user capacity In addition for fixed coverage anduser capacity the RAHs provide the users with better QoSsince the distance from a user to the nearest RAH will besmaller than the distance to the central BS antenna in theconventional case which leads to a higher signal to noise ratio(SNR)
Another novelty of this work is the investigation ofthe role of LTE DAS systems in enhancing network QoEperformance both in the UL and DL directions LTE RRMalgorithms to ensure fair QoE optimization are investigatedand compared in scenarios with and without DAS deploy-ments
The paper is organized as follows Video transmissionand QoSQoE metrics are overviewed in Section 2 Theproposed network QoE metrics are derived in Section 3LTE resource allocation is described in Section 4 Section 5analyzes radio resource management in LTE with differentutility functions The simulation results are presented andanalyzed in Section 6 Finally conclusions are drawn inSection 7
2 Video Transmission over Wireless Channels
We consider that video sequences are encoded into groups ofpictures (GOPs) according to the H264 standard using thejoint scalable videomodel (JSVM) software EachGOP of119873
119866
frames is considered to consist of one I-frame and119873119866minus 1 P-
framesWhen aGOP is available for real-time transmission itshould be transmitted within a duration of 119879GOP When 119879GOPhas elapsed all the frames that are not received are assumedlost and the transmission of a new GOP begins Due to theinterdependencies of the video frames the loss of a frame ina GOP leads to the loss of all subsequent frames in the GOPuntil the next I-frame is receivedThe loss of an I-frame leadsto the loss of all the frames in the GOP [12]
21 Video QoS Evaluation To measure QoS in video trans-mission one of the most widely used metrics is the mean-squared error distortion Two types of distortion affect avideo sequence source distortion and loss distortion Sourcedistortion depends on the compression method at the sourceand is beyond the scope of this paper Loss distortioncorresponds to the distortion caused by lost frames duringtransmission over the wireless channels Hence in this paperloss distortion is considered The distortion for replacing aframe 119891 of dimensions 119873
1times 1198732pixels with an estimated
frame 119891 can be computed as follows [12]
119863(119891 119891) =1
11987311198732
1198731minus1
sum
1198991=0
1198732minus1
sum
1198992=0
(119891 (1198991 1198992) minus 119891 (119899
1 1198992))2
(1)
where119891(1198991 1198992) indicates the pixel value of frame119891 at position
(1198991 1198992)The peak signal to noise ratio (PSNR) in this case can
be expressed as
119875SNR (119891 119891) =(2119861minus 1)2
119863(119891 119891)
(2)
with 119861 the number of bits used to encode a single pixel in thepicture frame
The total (or cumulative) loss distortion depends on theframe type (I-frame P-frame) and position (in the sameGOP the loss of a P-frame 119891
1leads to more distortion than
the loss of a P-frame 1198912when 119891
1lt 1198912) It also depends
on the coding method used and error concealment methodThemost common approach for error concealment is knownas the previous frame concealment method It consists ofrepeating the last correctly received frame until the nextI-frame is received [12] An example is shown in Figure 1assuming frame number 5 is lost The notation 119883 in Figure 1is used to indicate that frame119883 is used for error concealmentto replace the lost frame at a given position In the shownexample frame number 4 would be used to replace all theremaining frames in the GOP The total loss distortion whenframe 119891 is lost in a GOP of 119873
119866frames with one I-frame
Journal of Applied Mathematics 3
and119873119866minus 1 P-frames using the previous frame concealment
method can be obtained from (1) as follows
119863(119891)
=
119873119866
sum
119910=119891
119863(119910 119891 minus 1) (3)
The expression in (3) is obtained due to replacing all lostframes in theGOP from frame119891 onwards by the last correctlyreceived frame 119891 minus 1 When an I-frame is lost it is replacedby the last correctly received frame from the previous GOP
22 Video QoE Metric QoE is gaining significant interest asa method to quantify the multimedia experience of mobileusers for example see [1ndash4] A survey of QoE techniques ispresented in [1] QoE tries to measure the QoS as it is finallyperceived by the enduser For example following [2] theQoEcan be related to the PSNR as follows
119876 =1
1 + 1198901198871(119875SNRminus1198872) (4)
where 1198871and 119887
2are parameters that depend on the video
characteristics and 119875SNR is the PSNR expressed in dB In (4)119876 = 0 indicates the best quality and 119876 = 1 indicates theworst quality The relation between QoE and QoS to PSNRand distortion is an ongoing research activity for examplesee [13 14] In [13] subjective quality assessment of video isperformed in order to determine novel QoE metrics In [3]an empirical QoE metric taking into account PSNR spatialresolution and frame rate in addition to spatial and temporalvariances was derived AQoEmetric derived in [4] based onthe metric in [2] is expressed as
119876119898 = 119876max (1 minus1
1 + 1198901198871(119875SNRminus1198872)) sdot
1 minus 119890minus1198873(119891119891max)
1 minus 119890minus1198873 (5)
where 1198873 is another parameter that depends on the videocharacteristics 119876max is a constant corresponding to max-imum quality 119891 is the frame rate at which the video isdisplayed and 119891max is the maximum frame rate The QoEderivations take into account user experience while playingthe video and are not inherently designed to assess thetransmission over wireless channels Using the previousframe error concealment method the same frame rate canbe maintained after error concealment (ie 119891 = 119891max) andhence (5) can be simplified to
119876119898 = 119876max (1 minus1
1 + 1198901198871(119875SNRminus1198872)) (6)
Hence in this paper we use (6) with 119876max = 100 thusdisplaying QoE on a scale from 0 to 100
In practice during the streaming of a stored video atthe streaming server or BS the video characteristics can beextracted offline and used to determine 119887
1 1198872 and 119887
3in
the QoE metrics Although these parameters are difficult toextract during the streaming of a live video an approach fortheir dynamic real-time estimation is presented in [4]
3 Network QoE
The QoE metric of (6) is an ldquoindividualrdquo metric reflectingthe QoE experience of a particular user The objective of thispaper is to investigate radio resource management (RRM)algorithms that ensure a fair QoE satisfaction for all usersin the network Hence ldquonetworkrdquo QoE metrics reflectingthe overall performance of RRM algorithms in terms ofenhancing QoE for all users in the network need to bederived This section presents novel network QoE metricsthat could help assess the fairness of RRM algorithms inensuring QoE satisfaction
31 Proposed Network QoE Metrics The first metric is theaverage QoE It is given by
119876(avg)119898
=1
119870
119870
sum
119896=1
119876119898119896
(7)
where119876119898119896
is the QoEmetric of user 119896 expressed as in (6) forexample The metric in (7) reflects the average performancein the network However in some instances 119876(avg)
119898could be
relatively high when some users have very high QoE whileothers have a relatively low QoE Consequently this couldmask the unfairness towards users with low QoE
A possible solution to this problem is to derive RRMalgorithms maximizing the minimum QoE in the networkgiven by
119876(min)119898
= min119896
119876119898119896 (8)
This allows enhancing the worst case performance Howeverthis could come at the expense of users with good channelconditions (and who could achieve high QoE) that will beunfavored by the RRM algorithms in order to increase theQoE of worst case users
A tradeoff between the metrics in (7) and (8) could be theuse of the geometric mean QoE given by
119876(gm)119898
= (
119870
prod
119896=1
119876119898119896
)
1119870
(9)
Themetric (9) is fair since a user with aQoE close to zero willmake the whole product in119876(gm)
119898go to zero Hence any RRM
algorithm maximizing 119876(gm)119898
would avoid having any userwith very lowQoE In addition themetric (9) will reasonablyfavor users with good wireless channels (capable of achievinghigh QoE) since a high QoE will contribute in increasing theproduct in (9)
32 QoE Optimization Using the metrics derived in (7)ndash(9)the objective is tomaximize a networkQoEmetric as follows
max120572(DL)119896119897119894119897120572(UL)119896119897119894119897119875(DL)119897119875(UL)119896119897
119876(net)119898
(10)
4 Journal of Applied Mathematics
(a) (b)
Figure 2 Deployment scenarios (a) BS only (b) DAS with one BS and six RAHs
subject to
119875(UL)119896119897
le 119875(UL)119896119897max forall119896
119897= 1 119870
119897 forall119897 = 1 119873BS (11)
119875(DL)119897
le 119875(DL)119897max forall119897 = 1 119873BS (12)
119870119897
sum
119896119897=1
120572(UL)119896119897119894119897
le 1 forall119894 = 1 119873(UL)sub forall119897 = 1 119873BS (13)
119870119897
sum
119896119897=1
120572(DL)119896119897119894119897
le 1 forall119894 = 1 119873(DL)sub forall119897 = 1 119873BS (14)
where 119876(net)119898
is one of the metrics in (7)ndash(9) In addition 119870119897
is the number of users in cell 119897 119873BS is the number of basestations (BSs) 119875(UL)
119896119897
is the transmit power of user 119896119897 in cell119897 in the uplink (UL) 119875(UL)
119896119897max is its maximum transmit power
119875(DL)119897
is the transmit power of BS 119897 in the downlink (DL) and119875(DL)119897max is its maximum transmit power Furthermore 119873(UL)sub
and 119873(DL)sub are the numbers of OFDMA subcarriers in the
UL and DL respectively Finally 120572(UL)119896119897119894119897
and 120572(DL)119896119897119894119897
are indicatorvariables for the UL and DL respectively They are set to oneif subcarrier 119894 is allocated to user 119896
119897in cell 119897 and set to zero
otherwiseThe constraints in (11) and (12) indicate that the transmit
power cannot exceed the maximum power for the UL andDL respectively The constraints in (13) and (14) correspondto the exclusivity of subcarrier allocations in each cell for theUL and DL respectively since in each cell a subcarrier canbe allocated at most to a unique user at a given schedulinginstant
It should be noted that using individual QoS metricsinstead of individual QoE metrics in (7)ndash(9) these equationsbecome novel definitions of network QoS metrics insteadof network QoE metrics Indeed Section 62 presents aperformance comparison when network QoS (considered to
be video PSNR in this paper) and network QoE metrics areused
4 LTE Resource Allocation
In this Section we describe the approach used in this paperfor LTE resource allocation
41 SystemModel The systemmodel is displayed in Figure 2where Scenario (a) shows a traditional BS at the cell centerwhereas Scenario (b) shows aDASdeploymentwith sixRAHsdeployed throughout the cell area Consequently Scenario (b)consists of seven RAHs one located at the cell center andsix located at a distance of 2119877
1198883 with 60 degrees angular
separation between themIn this work we consider a single cell and we compare
the LTE performance in the presence and absence of DASsfor the scenarios presented in Figure 2 In the comparisonswe consider the same coverage area and the same number ofusers in the cell in the case of a single centralized BS (Scenario(a) in Figure 2) and in the case of DASs (Scenario (b) inFigure 2) We also consider the same number of subcarriersin both scenarios
In the DL users stream video files coming from the BSin real time We also consider video transmission in the ULwhich could correspond in practice to wireless transmissionof videos captured by surveillance cameras to police or otherpublic safety teams sending real-time videos to a commandcenter during an incident or pursuit among other possibleapplications
In the DAS scenario the presence of RAHs is transparentto the users who act as if there was only a single centralBS in the cell The communication between the central BSand RAHs is via fiber optic (or microwave links having anonoverlapping spectrum with LTE) and consequently doesnot consume any LTE radio resourcesThe presence of RAHscontributes in enhancing the channel states of the differentusers by providing each user with an antenna that is closer to
Journal of Applied Mathematics 5
it than the central BS antennaHence the channel gain of user119896 over subcarrier 119894 on the link with RAH 119909 can be expressedas follows
119867(119909)
119896119894dB = (minus120581 minus 120592log10119889(119909)
119896) minus 120585119896119894 + 10log10119865119896119894 (15)
where the first factor captures propagation loss with 120581 thepath loss constant 119889(119909)
119896the distance in km from mobile 119896 to
RAH 119909 and 120592 the path loss exponent The second factor 120585119896119894
captures log-normal shadowing with zero mean and a stan-dard deviation 120590
120585 whereas the last factor 119865
119896119894 corresponds to
Rayleigh fading power with a Rayleigh parameter 119887 such that119864|119887|2 = 1
In the traditional scenario (Scenario (a)) denoting by119909 = 1 the radio head colocated with the BS at the cell centerthe channel gain between the BS and user 119896 over subcarrier 119894is expressed as 119867
119896119894= 119867(1)
119896119894 With DASs it will transparently
ldquoappearrdquo to user 119896 that its channel gain with the BS oversubcarrier 119894 is
119867119896119894= argmax
119909119867(119909)
119896119894 (16)
It should be noted that the above analysis applies to boththe UL and DL depending on whether 119894 is an UL or DLsubcarrier respectively
42 Throughput Calculations in the Uplink Let 119875(UL)119896119894
be thepower transmitted by user 119896 over subcarrier 119894 119875(UL)
119896max bethe maximum transmission power of user 119896 and 119877
(UL)119896
beits achievable throughput in the UL Then the SCFDMAthroughput of user 119896 is given by
119877(UL)119896
= 119861(UL)sub
10038161003816100381610038161003816I(UL)sub119896
10038161003816100381610038161003816sdot log2(1 + 120573120574
(UL)119896
(P(UL)k I(UL)sub119896119897
))
(17)
where 119861(UL)sub is the UL subcarrier bandwidth |I(UL)sub119896| is thecardinality ofI(UL)sub119896119873
(UL)sub is the number of UL subcarriers
and P(UL)k represents a vector of the transmitted power oneach subcarrier 119875119896119894 120573 is called the SNR gap It indicatesthe difference between the SNR needed to achieve a certaindata transmission rate for a practicalM-QAM system and thetheoretical limit (Shannon capacity) [15] It is given by
120573 =minus15
ln (5119875119887) (18)
where 119875119887
denotes the bit error rate (BER) Finally120574(UL)119896
(P(UL)k I(UL)sub119896) is the SNR of user 119896 after minimum
mean squared error (MMSE) frequency domain equalizationat the receiver [5]
120574(UL)119896
(P(UL)k I(UL)sub119896)
= (1
(110038161003816100381610038161003816I(UL)sub119896
10038161003816100381610038161003816) sum119894isinI(UL)sub119896
(120574(UL)119896119894
(120574(UL)119896119894
+ 1))
minus 1)
minus1
(19)
In (19) 120574(UL)119896119894
is the UL SNR of user 119896 over subcarrier 119894 It isgiven by
120574(UL)119896119894
=
119875(UL)119896119894
119867119896119894
1205902
BS119894 (20)
where119867119896119894
is the channel gain over UL subcarrier 119894 allocatedto user 119896 and 1205902BS119894 is the noise power at the receiver of the BS(ie the receiver of the RAH that is nearest to user 119896)
The LTE standard imposes the constraint that the RBsallocated to a single user should be consecutive with equalpower allocation over the subcarriers of those RBs [5ndash7]The contiguous RB constraint is enforced by Step 4 of thealgorithm in Section 44 To ensure equal power allocationwe set
119875(UL)119896119894
=
119875(UL)119896max
10038161003816100381610038161003816I(UL)sub119896
10038161003816100381610038161003816
(21)
43 Throughput Calculations in the Downlink The DLachievable throughput of user 119896 over RB 119899 is given by
119877(DL)119896119899
= sum
119894isinRB119899119861(DL)sub sdot log
2(1 + 120573120574
(DL)119896119894
) (22)
where 119861(DL)sub is the subcarrier bandwidth In (22) the summa-tion is taken over the consecutive subcarriers that constituteRB 119899 We consider that the BS transmits at the maximumpower 119875BSmax and the power is assumed to be subdividedequally among all the subcarriers Hence the DL SNR of user119896 over a single subcarrier 119894 120574(DL)
119896119894 is given by
120574(DL)119896119894
=
(119875BSmax119873(DL)sub )119867119896119894
1205902
119896119894
(23)
where119873(DL)sub is the total number of DL subcarriers119867119896119894is the
channel gain over DL subcarrier 119894 allocated to user 119896 and 1205902119896119894
is the noise power at the receiver of user 119896
44 LTE Resource Allocation The resource allocation algo-rithm presented in this section was proposed by the authorsin [16] where it was used to enhance individual QoEs It isrepeated here for completeness of the analysis Furthermoreit is used with various utilities in order to maximize thevarious novel network QoE metrics presented in Section 3The algorithm is applicable to both UL and DL Hence wewill drop the superscripts (UL) and (DL) to avoid repetitionWe denote by Isub119896 the set of subcarriers allocated to user119896 IRB119896 the set of RBs allocated to user 119896 119873RB the totalnumber of RBs119870 the number of users and 119877
119896the achievable
throughput of user 119896We define119880(119877119896| IRB119896) as the utility of
user 119896 as a function of the throughput 119877119896given the allocation
IRB119896The resource allocation algorithm presented below con-
sists of allocating RB 119899 to user 119896 in a way to maximize thedifference
Λ119899119896
= 119880 (119877119896| IRB119896 cup 119899) minus 119880 (119877
119896| IRB119896) (24)
6 Journal of Applied Mathematics
where the marginal utility Λ119899119896 represents the gain in the
utility function119880when RB 119899 is allocated to user 119896 comparedto the utility of user 119896 before the allocation of 119899The algorithmis described as follows
(i) Consider the set of available RBs Iavail RB sube
1 2 119873RB and the set of available users Iavail users sube
1 2 119870 At the start of the algorithm Iavail RB =
1 2 119873RB andIavail users = 1 2 119870
Step 1 Find the user that has the highest marginal utilitydefined in (24) among all available users when the firstavailable RB inIavail RB is allocated to it In other words foreach RB 119899 find the user 119896lowast such that
119896lowast= argmax
119896
Λ119899119896 (25)
Step 2 Allocate RB 119899 to user 119896lowastIRB119896lowast = IRB119896lowast cup 119899
Step 3 Delete the RB from the set of available RBs
Iavail RB = Iavail RB minus 119899 (26)
Step 4 This step is only for the UL direction in order toguarantee the contiguity of subcarrier allocations It is notneeded for the DL In the UL if 119896lowast is the same user to whichRB 119899 minus 1 was allocated that is 119896lowast = argmax
119896Λ119899minus1119896
thenkeep 119896lowast inIavail users Otherwise delete user 119896lowast from the setof available users
Iavail users = Iavail users minus 119896lowast (27)
(ii) Repeat Steps 1 2 3 and 4 until there are no availableRBs or no available users
The utility function depends on the data rate and can bechanged depending on the different services and QoSQoErequirementsDifferent utility functions that can be usedwiththe proposed algorithm are presented in Section 5
5 RRM Utility Selection forQoE Maximization
To perform the maximization of (10) we use the utilitymaximization algorithm of Section 44 applicable for theUL and DL The proposed algorithm can be applied with awide range of utility functions being able to achieve variousobjectives with each objective represented by a certain utilityfunction
To explicitly implement RRM algorithms maximizingQoE metrics real-time feedback is needed from mobile ter-minals about the QoE achieved by each user which requiresmodifications to the standards Furthermore this feedbackwould depend on each video sequence being streamed Inthis paper we propose to perform RRM without any QoEfeedback using standard compliant algorithms With theutility maximization algorithm of Section 44 we use utilityfunctions depending on the usersrsquo data rates We investigateMax CI proportional fair and Max-Min utilities for datarates and study the impact of their implementation onthe average geometric mean and minimum QoE networkmetrics
51 Max CI Utility Letting the utility equal to the data rate119880119896= 119877119896 the algorithm of Section 44 leads to amaximization
of the sum rate of the cell (and hence of the average data ratein the cell) However in this case users close to the BS willbe allocated most of the resources and hence will have thehighest QoE However edge users will generally suffer fromstarvation and will have very low data rates and consequentlyvery low QoE
52 Max-Min Utility In this section we discuss utilitiescorresponding to the problem of rate maximization withfairness constraints by attempting tomaximize theminimumdata rate in the network for example [17 18] A vector Rof user data rates is Max-Min fair if and only if for each 119896an increase in 119877
119896leads to a decrease in 119877
119895for some 119895 with
119877119895lt 119877119896[17] Max-Min utilities lead to more fairness by
increasing the priority of users having lower rates [18] It wasshown that Max-Min fairness can be achieved by utilities ofthe form [18]
119880119896(119877119896) = minus
119877minus120572
119896
120572 120572 gt 0 (28)
where the parameter 120572 determines the degree of fairnessMax-Min fairness is attained when 120572 rarr infin [18] We use120572 = 10 in this paper
53 Proportional Fair Utility In this section in order toensure a more fair allocation of wireless resources we modelthe problem as a bargaining gameWe consider that each useris a player who wants to maximize its payoff considered to beits data rate Consequently players should share the resourcesin an optimal way that is a way they cannot jointly improveon The resources to be shared are the OFDMA subcarriersAllocating the shared resources in a way to maximize theplayersrsquo payoffs is equivalent to allocating the subcarriers tousers in a way to maximize each userrsquos data rate given theshares of subcarriers allocated to the other users With eachuser wanting to selfishly maximize its data rate the usersengage in a ldquobargainingrdquo process It is a well-known resultin game theory that the solution to the bargaining problemmaximizes the Nash product119873
119875[19]
max119870
prod
119896=1
119877119896lArrrArr max ln(
119870
prod
119896=1
119877119896)
= max119870
sum
119896=1
ln (119877119896)
(29)
Interestingly the algorithmic implementation of (29) can behandled by the algorithm of Section 44 by using in thatalgorithm 119880119896 = ln(119877119896) as the utility of user 119896 where lnrepresents the natural logarithmMaximizing the sum of log-arithms in (29) is equivalent to maximizing the product andis easier to implement numerically This approach representsproportional fair (PF) scheduling a well-known resourceallocation approach in wireless communications systems PFscheduling is known to correspond to a sumof the logarithms
Journal of Applied Mathematics 7
0 5 10 15 20 25 30 35 40 45 505
10
15
20
25
30
35
40
45
Number of users
QoS
met
ric (d
B)
Sched Max-Min metric min PSNRSched Max-Min metric geom mean PSNRSched Max-Min metric avg PSNRSched PF metric min PSNRSched PF metric geom mean PSNRSched PF metric avg PSNRSched Max CI metric min PSNRSched Max CI metric geom mean PSNRSched Max CI metric avg PSNR
(a) Downlink
0 5 10 15 20 25 30 35 40 45 505
10
15
20
25
30
35
40
45
Number of users
QoS
met
ric (d
B)
Sched Max-Min metric min PSNRSched Max-Min metric geom mean PSNRSched Max-Min metric avg PSNRSched PF metric min PSNRSched PF metric geom mean PSNRSched PF metric avg PSNRSched Max CI metric min PSNRSched Max CI metric geom mean PSNRSched Max CI metric avg PSNR
(b) Uplink
Figure 3 QoS metric
of the user rates and represents the Nash bargaining solution[20] Hence letting119880 = ln(119877) provides proportional fairnessUsing in the logarithm the achievable data rate at thecurrent scheduling instant achieves proportional fairness infrequency (PFF) whereas including the previous schedulinginstants by using the cumulative data rate (since the start ofthe video transmission toby the user) achieves proportionalfairness in time and frequency (PFTF) [9] In this paperPFTF is used since it gives a fair allocation for all users totransmitreceive their videos on the ULDL It can be easilyshown from (29) that PF RRM algorithms maximize thegeometric mean of the user data rates
6 Results and Discussion
This section presents the simulation results obtained bycomparing the scenarios of Figure 2 using RRM with theutilities of Section 5 to maximize the network QoSQoEmetrics of Section 3
61 Simulation Model The simulation model consists ofa single cell with a BS equipped with an omnidirectionalantenna or several RAHs each having an omnidirectionalantenna as shown in Figure 2The simulation parameters areshown in Table 1 LTE parameters are obtained from [7 21]and channel parameters are obtained from [22] Users areconsidered to be uniformly distributed in the cell area
Table 1 Simulation parameters
Parameter Value Parameter Value120581 minus1281 dB 120592 376
120590120585(dB) 8 dB Rayleigh parameter 119887 119864[119887
2] = 1
119861(DL)
5MHz 119861(UL)
5MHz119873(DL)RB 25 119873
(UL)RB 25
119861(DL)sub 15 kHz 119861
(UL)sub 15 kHz
119875(DL)BSmax 5W 119875
(UL)119896max 0125W
To simulate the video transmission in both directions ULand DL the football sequence encoded in QCIF format isused with GOPs consisting of 15 frames one I-frame and 14P-frames having a GOP duration 119879GOP = 1 s The results areaveraged over 2500 iterationswhere in each iteration a videosequence has to be transmitted from the BS to each mobileuser in the DL or from each mobile terminal to the BS in theUL
62 Video QoSQoE Results without DAS Deployment Fig-ures 3 and 4 show the network QoS and QoE resultsrespectively for the DL and UL Comparing the DL and ULperformance in both Figures 3 and 4 it can be noted that theQoSQoE performance in the DL is slightly better than in theUL due to the higher transmission power available at the BS
8 Journal of Applied Mathematics
0 5 10 15 20 25 30 35 40 45 500
10
20
30
40
50
60
70
80
90
100
Number of users
QoE
met
ric (
)
Sched Max-Min metric min QoESched Max-Min metric geom mean QoESched Max-Min metric avg QoESched PF metric min QoESched PF metric geom mean QoESched PF metric avg QoESched Max CI metric min QoESched Max CI metric geom mean QoESched Max CI metric avg QoE
(a) Downlink
0 5 10 15 20 25 30 35 40 45 500
10
20
30
40
50
60
70
80
90
100
Number of users
QoE
met
ric (
)
Sched Max-Min metric min QoESched Max-Min metric geom mean QoESched Max-Min metric avg QoESched PF metric min QoESched PF metric geom mean QoESched PF metric avg QoESched Max CI metric min QoESched Max CI metric geom mean QoESched Max CI metric avg QoE
(b) Uplink
Figure 4 QoE metric
It should be noted that although the same video sequencewas used for simulation purposes the scenario consideredcorresponds in practice to a unicasting scenario wheredifferent videos are transmitted to (by) each user in the DL(UL) Otherwise it would be better to perform multicastingby the BS in the DL and collaborative transmission by theusers in the UL which represent interesting topics for futureresearch
It can be seen that PF scheduling maximizes the averagenetwork QoSQoE both in the DL and UL It also leads tomore fairness in the UL since the best results for geometricmean QoSQoE are achieved with PF scheduling The sameis achieved in the DL when the number of users increasesby maximizing the geometric mean QoSQoE when thenumber of users is above 30 Max-Min scheduling is shownto maximize the minimum QoSQoE in the downlink andto outperform proportional fair scheduling in terms ofgeometric mean QoSQoE when the number of users in theDL is relatively low (below 30) However its performance inthe UL is not as good due to the limited transmit power ofmobile terminals In fact in the UL it is outperformed byPF for all three network QoSQoE metrics and by Max CIscheduling for the average and geometric mean QoSQoEmetrics It is also outperformed by Max CI for the averageQoSQoE metric when the number of users is below 20
RRM using Max CI is extremely unfair in the DL asshown in Figures 3(a) and 4(a) for all threeQoSQoEmetricsrespectively This is due to the fact that it allocates thesubcarriers and power available at the BS to users that are
relatively close to the BS which deprives users that are furtheraway from wireless resources Due to error propagation invideo sequences caused by lost frames this leads to verylow QoSQoE results especially for the metrics involving acertain notion of fairness the min QoSQoE and geometricmean QoSQoE In the UL Max CI performs better mainlydue to the fact that the power is now distributed each userin the UL has its own transmit power conversely to the DLwhere the power is concentrated at a single entity the BSHowever its performance degradation is fast as the numberof users increases especially for the min QoSQoE in thenetwork
Comparing Figure 3 to Figure 4 it can be seen that allcombinations of RRM algorithm network quality metrichave the same performance trends in both figures In otherwords the same conclusions can be reached in terms ofthe superiority of a method over another for both QoS andQoE However the comparison shows that the performancedegradation is faster in the QoE case For example theperformance gap between the average network metric andthe geometric mean metric appears to be reduced in the QoScase (Figure 3) whereas it looks significant in the QoE case(Figure 4) As another example the average QoS metric isnonzero (although low) with Max CI scheduling (Figure 3)whereas the average QoE metric goes to zero when thenumber of users increases with Max CI (Figure 4) Thisexplains the motivation behind using QoE metrics insteadof QoS metrics since they correspond to a more accuraterepresentation of the quality perceived by the end users
Journal of Applied Mathematics 9
10 15 20 25 30 35 40 45 500
10
20
30
40
50
60
70
80
90
100
PSNR (dB)
QoE
met
ric
Figure 5 QoE metric versus PSNR for the football video sequence
In fact Figure 5 shows the plot of QoE versusQoS (PSNR) forthe football video sequence used in the simulations It can beseen that when the PSNR is too high or too low the variationin QoE is unnoticeable However the sensitivity increases inthe intermediate ranges For example a drop of 5 dB from30 dB to 25 dB in PSNR leads to a dramatic fall from 80 to40 in QoE
Therefore in the next section we consider the QoEnetwork metrics and propose the use of DAS to enhance theperformance and ensure more fairness to the users in thenetwork
63 Video QoE Results with DASDeployment In this sectionwe compare the performance of the two scenarios of Figure 2using the QoE network metrics of Section 3 along with theRRM utilities described in Section 5 The DL results arepresented in Figure 6 whereas the UL results are shownin Figure 7 The deployment of DAS leads to significantenhancements for all the investigated scenarios except for theDL case with Max CI scheduling as shown in Figure 6(a)where the enhancement is minor As explained in the pre-vious section Max CI allocates the subcarriers and poweravailable at the BS to users that are relatively close to theBS which deprives users that are further away from wirelessresources This leads to very low QoE results for most usersespecially due to error propagation in video sequences causedby lost frames
A major difference between the results of Figure 6 andFigure 4(a) is that the Max-Min scheduler leads to the bestresults in the DL in the presence of DAS for all three networkQoEmetrics In fact Figure 6(c) shows that the performancefor the three metrics is almost perfect the horizontal curvesindicate that the maximum QoE (885) is reached for allusers The only reason for not having 100 QoE is due tosource distortion caused by lossy compression of the videosequence and not to loss distortion due to packet lossesover the wireless channels The min QoE decreases only
slightly when the number of users exceeds 40 as shownin Figure 6(c) This quasiideal performance was achievedwith a DAS deployment using six RAHs throughout thecell
In the UL the best performance was achieved by PFscheduling as shown in Figure 7 (particularly Figure 7(b))The PF scheduler was also the best UL scheduler in theabsence of DAS (Figure 4(b)) although DAS has led to alarge performance enhancement for all networkQoEmetricsThis difference between the best DL (Max-Min) and UL(PF) schedulers is explained by the difference of powerdistribution between DL and UL In the UL the power isdistributed over all users where each user has an individuallimited powerThe deployment of DAS helps enhance the ULnetwork QoE but the limited transmit power still preventsworst case users from achieving near-optimal performancewhich is captured by the min QoE network metric On theother hand the BS is the single source of power in the DLThe significantly larger transmit power at the BS providesbetter flexibility in power and subcarrier allocations andallows the enhancement of the QoE of the worst case usersFurthermore the DAS deployment enhances the channelconditions for the users in the cell by providing transmitantennas closer to cell edge usersThis allows the achievementof better individual QoE results with a lower transmit powerfor all users including worst case users favored by Max-Minscheduling which enhances the overall performance in thenetwork
Finally it should be noted that the enhancements reachedwithDAS could be reachedwith other solutions For exampledense heterogeneous network deployments where small cellBSs are deployed in large numbers within the coveragearea of large macrocell BSs would lead to the same effectsdue to providing a complete (small) BS closer to the usersinstead of an RAH in a DAS deployment Neverthelessthe DAS deployment when possible leads to a more costeffective solution Furthermore performance enhancements
10 Journal of Applied Mathematics
0 5 10 15 20 25 30 35 40 45 500
10
20
30
40
50
60
70
80
90
100
Number of users
QoE
met
ric (
)
BS only metric min QoEBS only metric geom mean QoEBS only metric avg QoEBS + 6 RRHs metric min QoEBS + 6 RRHs metric geom mean QoEBS + 6 RRHs metric avg QoE
(a) Max CI
0 5 10 15 20 25 30 35 40 45 500
10
20
30
40
50
60
70
80
90
100
Number of users
QoE
met
ric (
)
BS only metric min QoEBS only metric geom mean QoEBS only metric avg QoEBS + 6 RRHs metric min QoEBS + 6 RRHs metric geom mean QoEBS + 6 RRHs metric avg QoE
(b) PF
0 5 10 15 20 25 30 35 40 45 500
10
20
30
40
50
60
70
80
90
100
Number of users
QoE
met
ric (
)
BS only metric min QoEBS only metric geom mean QoE
BS + 6 RRHs metric min QoEBS + 6 RRHs metric geom mean QoEBS + 6 RRHs metric avg QoE
BS only max-min metric avg QoE
(c) Max-Min
Figure 6 DL QoE results with DAS
for indoor users can be reached by deploying femtocell accesspoints (FAPs) Obviously FAP provides an indoor BS closeto the end user which allows the provision of high QoE byovercoming the penetration losses of the macrocell signalcoming from an outdoor BS located further away The in-depth investigation of network QoE optimization in thesespecific scenarios is indeed an interesting topic for furtherresearch
7 Conclusions
Network QoE metrics were proposed in order to capturethe overall performance of radio resource managementalgorithms in terms of video quality perceived by the endusers Metrics corresponding to average geometric meanand minimum QoE in the network were measured whenMax CI proportional fair and Max-Min radio resource
Journal of Applied Mathematics 11
0 5 10 15 20 25 30 35 40 45 500
10
20
30
40
50
60
70
80
90
100
Number of users
QoE
met
ric (
)
BS only metric min QoEBS only metric geom mean QoEBS only metric avg QoEBS + 6 RRHs metric min QoEBS + 6 RRHs metric geom mean QoEBS + 6 RRHs metric avg QoE
(a) Max CI
0 5 10 15 20 25 30 35 40 45 500
10
20
30
40
50
60
70
80
90
100
Number of users
QoE
met
ric (
)
BS only metric min QoEBS only metric geom mean QoEBS only metric avg QoEBS + 6 RRHs metric min QoEBS + 6 RRHs metric geom mean QoEBS + 6 RRHs metric avg QoE
(b) PF
0 5 10 15 20 25 30 35 40 45 500
10
20
30
40
50
60
70
80
90
100
Number of users
QoE
met
ric (
)
BS only metric min QoEBS only metric geom mean QoEBS only metric avg QoEBS + 6 RRHs metric min QoEBS + 6 RRHs metric geom mean QoEBS + 6 RRHs metric avg QoE
(c) Max-Min
Figure 7 UL QoE results with DAS
management algorithms were implemented in the networkBoth the uplink and downlink directions were studiedFurthermore the use of distributed antenna systems toenhance the performance was considered In the absenceof distributed antennas results showed that proportionalfair scheduling maximizes the average network QoE bothin the uplink and downlink It also leads to more fairnessin the uplink and in the downlink when the number ofusers increases by maximizing the geometric mean QoEWhen distributed antennas are deployed proportional fair
scheduling was able to maximize the uplink performancein terms of network QoE whereas Max-Min scheduling ledto remarkably excellent results in the downlink with all theinvestigated network QoE metrics
Conflict of Interests
The authors declare that there is no conflict of interestsregarding the publication of this paper
12 Journal of Applied Mathematics
Acknowledgment
This work was made possible by NPRP Grant no 4-347-2-127from the Qatar National Research Fund (a member of TheQatar Foundation)The statementsmade herein are solely theresponsibility of the authors
References
[1] J-S Lee F de Simone T Ebrahimi N Ramzan and EIzquierdo ldquoQuality assessment of multidimensional video scal-abilityrdquo IEEE Communications Magazine vol 50 no 4 pp 38ndash46 2012
[2] Video Quality Experts Group (VQEG) Final Report on theValidation of Objective Models of Video Quality AssessmentAugust 2003
[3] H Sohn H Yoo W de Neve C S Kim and Y M Ro ldquoFull-reference video qualitymetric for fully scalable andmobile SVCcontentrdquo IEEE Transactions on Broadcasting vol 56 no 3 pp269ndash280 2010
[4] Y-F Ou Z Ma T Liu and YWang ldquoPerceptual quality assess-ment of video considering both frame rate and quantizationartifactsrdquo IEEE Transactions on Circuits and Systems for VideoTechnology vol 21 no 3 pp 286ndash298 2011
[5] H G Myung and D J Goodman Single Carrier FDMA A NewAir Interface for Long Term Evolution Wiley 2008
[6] T Lunttila J Lindholm K Pajukoski E Tiirola andA ToskalaldquoEUTRAN uplink performancerdquo in Proceedings of the 20072nd International Symposium on Wireless Pervasive Computing(ISWPC rsquo07) pp 515ndash519 February 2007
[7] ldquo3rd Generation Partnership Project (3GPP)rdquo 3GPP TS 362133GPP TSG RAN Evolved Universal Terrestrial Radio Access(EUTRA) Physical layer procedures version 1140 Release 112013
[8] X Zhao and X Yang ldquoDownlink ergodic capacity analysis forwireless networks with cooperative distributed antenna sys-temsrdquo in Proceedings of the 2012 IEEE International Conferenceon Communications (ICC rsquo12) pp 5911ndash5915 June 2012
[9] E Yaacoub and Z Dawy Resource Allocation in Uplink OFDMAWireless Systems Optimal Solutions and Practical Implementa-tions John Wiley and SonsIEEE Press New York NY USA2012
[10] E Yaacoub and O Kubbar ldquoOn the performance of distributedbase stations in LTE public safety networksrdquo in Proceedings ofthe 8th IEEE InternationalWireless Communications andMobileComputing Conference (IWCMC rsquo12) pp 927ndash932 August 2012
[11] CPRI Specification V20 ldquoCommon Public Radio Interface(CPRI) interface specificationrdquo Tech Rep 2004
[12] L U Choi M T Ivrlac E Steinbach and J A Nossek ldquoAnalysisof distortion due to packet loss in streaming video transmissionover wireless communication linksrdquo in Proceedings of the IEEEInternational Conference on Image Processing 2005 (ICIP rsquo05)pp 189ndash192 September 2005
[13] J-S Lee F de Simone and T Ebrahimi ldquoSubjective qualityevaluation of foveated video coding using audio-visual focus ofattentionrdquo IEEE Journal on Selected Topics in Signal Processingvol 5 no 7 pp 1322ndash1331 2011
[14] P Goudarzi ldquoScalable video transmission over multi-hop wire-less networks with enhanced quality of experience using swarm
intelligencerdquo Signal Processing Image Communication vol 27no 7 pp 722ndash736 2012
[15] X Qiu ldquoOn the performance of adaptive modulation in cellularsystemsrdquo IEEE Transactions on Communications vol 47 no 6pp 884ndash895 1999
[16] E Yaacoub and N Zorba ldquoEnhancing the quality of experienceof video streaming in LTE networks using distributed antennasystemsrdquo in Proceedings of the International Conference on Com-munications and Information Technology (ICCIT rsquo13) BeirutLebanon June 2013
[17] J-Y le Boudec Rate Adaptation Congestion Control and Fair-ness A Tutorial EPFL 2008
[18] G Song and Y Li ldquoCross-layer optimization for OFDMwirelessnetworks Part I theoretical frameworkrdquo IEEE Transactions onWireless Communications vol 4 no 2 pp 614ndash624 2005
[19] F Carmichael A Guide to GameTheory Prentice Hall 2005[20] E Yaacoub and Z Dawy ldquoAchieving the Nash bargaining
solution in OFDMA uplink using distributed scheduling withlimited feedbackrdquo International Journal of Electronics and Com-munications vol 65 no 4 pp 320ndash330 2011
[21] 3rd Generation Partnership Project (3GPP) 3GPP TS 362113GPP TSG RAN Evolved Universal Terrestrial Radio Access(EUTRA) Physical Channels and Modulation version 1140Release 11 2013
[22] 3rd Generation Partnership Project (3GPP) 3GPP TR 258143GPP TSG RAN Physical Layer Aspects for Evolved UTRAv710 2006
Submit your manuscripts athttpwwwhindawicom
Hindawi Publishing Corporationhttpwwwhindawicom Volume 2014
MathematicsJournal of
Hindawi Publishing Corporationhttpwwwhindawicom Volume 2014
Mathematical Problems in Engineering
Hindawi Publishing Corporationhttpwwwhindawicom
Differential EquationsInternational Journal of
Volume 2014
Applied MathematicsJournal of
Hindawi Publishing Corporationhttpwwwhindawicom Volume 2014
Probability and StatisticsHindawi Publishing Corporationhttpwwwhindawicom Volume 2014
Journal of
Hindawi Publishing Corporationhttpwwwhindawicom Volume 2014
Mathematical PhysicsAdvances in
Complex AnalysisJournal of
Hindawi Publishing Corporationhttpwwwhindawicom Volume 2014
OptimizationJournal of
Hindawi Publishing Corporationhttpwwwhindawicom Volume 2014
CombinatoricsHindawi Publishing Corporationhttpwwwhindawicom Volume 2014
International Journal of
Hindawi Publishing Corporationhttpwwwhindawicom Volume 2014
Operations ResearchAdvances in
Journal of
Hindawi Publishing Corporationhttpwwwhindawicom Volume 2014
Function Spaces
Abstract and Applied AnalysisHindawi Publishing Corporationhttpwwwhindawicom Volume 2014
International Journal of Mathematics and Mathematical Sciences
Hindawi Publishing Corporationhttpwwwhindawicom Volume 2014
The Scientific World JournalHindawi Publishing Corporation httpwwwhindawicom Volume 2014
Hindawi Publishing Corporationhttpwwwhindawicom Volume 2014
Algebra
Discrete Dynamics in Nature and Society
Hindawi Publishing Corporationhttpwwwhindawicom Volume 2014
Hindawi Publishing Corporationhttpwwwhindawicom Volume 2014
Decision SciencesAdvances in
Discrete MathematicsJournal of
Hindawi Publishing Corporationhttpwwwhindawicom
Volume 2014 Hindawi Publishing Corporationhttpwwwhindawicom Volume 2014
Stochastic AnalysisInternational Journal of

2 Journal of Applied Mathematics
I1 P2 P3 P4 P5 P6 P7 P8 P9 I10 P11 P12
1 2 3 4 4 4 4 4 4 10 11
Error concealment
Coded frames
Displayed frames 12
Figure 1 Error concealment example
05ms slots [6] The LTE standard imposes the UL constraintthat the RBs allocated to a single user should be consecutivewith equal power allocation over the RBs [5ndash7]
An important method to boost performance in cellularsystems is the deployment of distributed antenna systems(DASs) DASs are used to increase the coverage and capacityof wireless networks in a cost effective way Although they areused in previous generations of wireless systems DASs arereceiving significant research attention for their deploymentin LTE for example see [8]The impact ofDASonLTEuplinkscheduling was studied in [9] and their uplink and downlinkperformance were studied in [10] in the context of publicsafety networks
Generally a DAS system consists of a single centralBS connected to several remote antenna heads (RAHs)distributed throughout the cell area The BS controlling theRAHs could be colocated with any of the RAHs or in aseparate location The BS could be connected to RAHs viawired cables (eg fiber optic) Connection topologies includestar chain tree and ring topologies [11] Since an RAH iscomposed of a remote antenna connected to the BS thisallows centralized control to be performed by the BS as in theconventional case while the RAHs allow extended coverageandormore user capacity In addition for fixed coverage anduser capacity the RAHs provide the users with better QoSsince the distance from a user to the nearest RAH will besmaller than the distance to the central BS antenna in theconventional case which leads to a higher signal to noise ratio(SNR)
Another novelty of this work is the investigation ofthe role of LTE DAS systems in enhancing network QoEperformance both in the UL and DL directions LTE RRMalgorithms to ensure fair QoE optimization are investigatedand compared in scenarios with and without DAS deploy-ments
The paper is organized as follows Video transmissionand QoSQoE metrics are overviewed in Section 2 Theproposed network QoE metrics are derived in Section 3LTE resource allocation is described in Section 4 Section 5analyzes radio resource management in LTE with differentutility functions The simulation results are presented andanalyzed in Section 6 Finally conclusions are drawn inSection 7
2 Video Transmission over Wireless Channels
We consider that video sequences are encoded into groups ofpictures (GOPs) according to the H264 standard using thejoint scalable videomodel (JSVM) software EachGOP of119873
119866
frames is considered to consist of one I-frame and119873119866minus 1 P-
framesWhen aGOP is available for real-time transmission itshould be transmitted within a duration of 119879GOP When 119879GOPhas elapsed all the frames that are not received are assumedlost and the transmission of a new GOP begins Due to theinterdependencies of the video frames the loss of a frame ina GOP leads to the loss of all subsequent frames in the GOPuntil the next I-frame is receivedThe loss of an I-frame leadsto the loss of all the frames in the GOP [12]
21 Video QoS Evaluation To measure QoS in video trans-mission one of the most widely used metrics is the mean-squared error distortion Two types of distortion affect avideo sequence source distortion and loss distortion Sourcedistortion depends on the compression method at the sourceand is beyond the scope of this paper Loss distortioncorresponds to the distortion caused by lost frames duringtransmission over the wireless channels Hence in this paperloss distortion is considered The distortion for replacing aframe 119891 of dimensions 119873
1times 1198732pixels with an estimated
frame 119891 can be computed as follows [12]
119863(119891 119891) =1
11987311198732
1198731minus1
sum
1198991=0
1198732minus1
sum
1198992=0
(119891 (1198991 1198992) minus 119891 (119899
1 1198992))2
(1)
where119891(1198991 1198992) indicates the pixel value of frame119891 at position
(1198991 1198992)The peak signal to noise ratio (PSNR) in this case can
be expressed as
119875SNR (119891 119891) =(2119861minus 1)2
119863(119891 119891)
(2)
with 119861 the number of bits used to encode a single pixel in thepicture frame
The total (or cumulative) loss distortion depends on theframe type (I-frame P-frame) and position (in the sameGOP the loss of a P-frame 119891
1leads to more distortion than
the loss of a P-frame 1198912when 119891
1lt 1198912) It also depends
on the coding method used and error concealment methodThemost common approach for error concealment is knownas the previous frame concealment method It consists ofrepeating the last correctly received frame until the nextI-frame is received [12] An example is shown in Figure 1assuming frame number 5 is lost The notation 119883 in Figure 1is used to indicate that frame119883 is used for error concealmentto replace the lost frame at a given position In the shownexample frame number 4 would be used to replace all theremaining frames in the GOP The total loss distortion whenframe 119891 is lost in a GOP of 119873
119866frames with one I-frame
Journal of Applied Mathematics 3
and119873119866minus 1 P-frames using the previous frame concealment
method can be obtained from (1) as follows
119863(119891)
=
119873119866
sum
119910=119891
119863(119910 119891 minus 1) (3)
The expression in (3) is obtained due to replacing all lostframes in theGOP from frame119891 onwards by the last correctlyreceived frame 119891 minus 1 When an I-frame is lost it is replacedby the last correctly received frame from the previous GOP
22 Video QoE Metric QoE is gaining significant interest asa method to quantify the multimedia experience of mobileusers for example see [1ndash4] A survey of QoE techniques ispresented in [1] QoE tries to measure the QoS as it is finallyperceived by the enduser For example following [2] theQoEcan be related to the PSNR as follows
119876 =1
1 + 1198901198871(119875SNRminus1198872) (4)
where 1198871and 119887
2are parameters that depend on the video
characteristics and 119875SNR is the PSNR expressed in dB In (4)119876 = 0 indicates the best quality and 119876 = 1 indicates theworst quality The relation between QoE and QoS to PSNRand distortion is an ongoing research activity for examplesee [13 14] In [13] subjective quality assessment of video isperformed in order to determine novel QoE metrics In [3]an empirical QoE metric taking into account PSNR spatialresolution and frame rate in addition to spatial and temporalvariances was derived AQoEmetric derived in [4] based onthe metric in [2] is expressed as
119876119898 = 119876max (1 minus1
1 + 1198901198871(119875SNRminus1198872)) sdot
1 minus 119890minus1198873(119891119891max)
1 minus 119890minus1198873 (5)
where 1198873 is another parameter that depends on the videocharacteristics 119876max is a constant corresponding to max-imum quality 119891 is the frame rate at which the video isdisplayed and 119891max is the maximum frame rate The QoEderivations take into account user experience while playingthe video and are not inherently designed to assess thetransmission over wireless channels Using the previousframe error concealment method the same frame rate canbe maintained after error concealment (ie 119891 = 119891max) andhence (5) can be simplified to
119876119898 = 119876max (1 minus1
1 + 1198901198871(119875SNRminus1198872)) (6)
Hence in this paper we use (6) with 119876max = 100 thusdisplaying QoE on a scale from 0 to 100
In practice during the streaming of a stored video atthe streaming server or BS the video characteristics can beextracted offline and used to determine 119887
1 1198872 and 119887
3in
the QoE metrics Although these parameters are difficult toextract during the streaming of a live video an approach fortheir dynamic real-time estimation is presented in [4]
3 Network QoE
The QoE metric of (6) is an ldquoindividualrdquo metric reflectingthe QoE experience of a particular user The objective of thispaper is to investigate radio resource management (RRM)algorithms that ensure a fair QoE satisfaction for all usersin the network Hence ldquonetworkrdquo QoE metrics reflectingthe overall performance of RRM algorithms in terms ofenhancing QoE for all users in the network need to bederived This section presents novel network QoE metricsthat could help assess the fairness of RRM algorithms inensuring QoE satisfaction
31 Proposed Network QoE Metrics The first metric is theaverage QoE It is given by
119876(avg)119898
=1
119870
119870
sum
119896=1
119876119898119896
(7)
where119876119898119896
is the QoEmetric of user 119896 expressed as in (6) forexample The metric in (7) reflects the average performancein the network However in some instances 119876(avg)
119898could be
relatively high when some users have very high QoE whileothers have a relatively low QoE Consequently this couldmask the unfairness towards users with low QoE
A possible solution to this problem is to derive RRMalgorithms maximizing the minimum QoE in the networkgiven by
119876(min)119898
= min119896
119876119898119896 (8)
This allows enhancing the worst case performance Howeverthis could come at the expense of users with good channelconditions (and who could achieve high QoE) that will beunfavored by the RRM algorithms in order to increase theQoE of worst case users
A tradeoff between the metrics in (7) and (8) could be theuse of the geometric mean QoE given by
119876(gm)119898
= (
119870
prod
119896=1
119876119898119896
)
1119870
(9)
Themetric (9) is fair since a user with aQoE close to zero willmake the whole product in119876(gm)
119898go to zero Hence any RRM
algorithm maximizing 119876(gm)119898
would avoid having any userwith very lowQoE In addition themetric (9) will reasonablyfavor users with good wireless channels (capable of achievinghigh QoE) since a high QoE will contribute in increasing theproduct in (9)
32 QoE Optimization Using the metrics derived in (7)ndash(9)the objective is tomaximize a networkQoEmetric as follows
max120572(DL)119896119897119894119897120572(UL)119896119897119894119897119875(DL)119897119875(UL)119896119897
119876(net)119898
(10)
4 Journal of Applied Mathematics
(a) (b)
Figure 2 Deployment scenarios (a) BS only (b) DAS with one BS and six RAHs
subject to
119875(UL)119896119897
le 119875(UL)119896119897max forall119896
119897= 1 119870
119897 forall119897 = 1 119873BS (11)
119875(DL)119897
le 119875(DL)119897max forall119897 = 1 119873BS (12)
119870119897
sum
119896119897=1
120572(UL)119896119897119894119897
le 1 forall119894 = 1 119873(UL)sub forall119897 = 1 119873BS (13)
119870119897
sum
119896119897=1
120572(DL)119896119897119894119897
le 1 forall119894 = 1 119873(DL)sub forall119897 = 1 119873BS (14)
where 119876(net)119898
is one of the metrics in (7)ndash(9) In addition 119870119897
is the number of users in cell 119897 119873BS is the number of basestations (BSs) 119875(UL)
119896119897
is the transmit power of user 119896119897 in cell119897 in the uplink (UL) 119875(UL)
119896119897max is its maximum transmit power
119875(DL)119897
is the transmit power of BS 119897 in the downlink (DL) and119875(DL)119897max is its maximum transmit power Furthermore 119873(UL)sub
and 119873(DL)sub are the numbers of OFDMA subcarriers in the
UL and DL respectively Finally 120572(UL)119896119897119894119897
and 120572(DL)119896119897119894119897
are indicatorvariables for the UL and DL respectively They are set to oneif subcarrier 119894 is allocated to user 119896
119897in cell 119897 and set to zero
otherwiseThe constraints in (11) and (12) indicate that the transmit
power cannot exceed the maximum power for the UL andDL respectively The constraints in (13) and (14) correspondto the exclusivity of subcarrier allocations in each cell for theUL and DL respectively since in each cell a subcarrier canbe allocated at most to a unique user at a given schedulinginstant
It should be noted that using individual QoS metricsinstead of individual QoE metrics in (7)ndash(9) these equationsbecome novel definitions of network QoS metrics insteadof network QoE metrics Indeed Section 62 presents aperformance comparison when network QoS (considered to
be video PSNR in this paper) and network QoE metrics areused
4 LTE Resource Allocation
In this Section we describe the approach used in this paperfor LTE resource allocation
41 SystemModel The systemmodel is displayed in Figure 2where Scenario (a) shows a traditional BS at the cell centerwhereas Scenario (b) shows aDASdeploymentwith sixRAHsdeployed throughout the cell area Consequently Scenario (b)consists of seven RAHs one located at the cell center andsix located at a distance of 2119877
1198883 with 60 degrees angular
separation between themIn this work we consider a single cell and we compare
the LTE performance in the presence and absence of DASsfor the scenarios presented in Figure 2 In the comparisonswe consider the same coverage area and the same number ofusers in the cell in the case of a single centralized BS (Scenario(a) in Figure 2) and in the case of DASs (Scenario (b) inFigure 2) We also consider the same number of subcarriersin both scenarios
In the DL users stream video files coming from the BSin real time We also consider video transmission in the ULwhich could correspond in practice to wireless transmissionof videos captured by surveillance cameras to police or otherpublic safety teams sending real-time videos to a commandcenter during an incident or pursuit among other possibleapplications
In the DAS scenario the presence of RAHs is transparentto the users who act as if there was only a single centralBS in the cell The communication between the central BSand RAHs is via fiber optic (or microwave links having anonoverlapping spectrum with LTE) and consequently doesnot consume any LTE radio resourcesThe presence of RAHscontributes in enhancing the channel states of the differentusers by providing each user with an antenna that is closer to
Journal of Applied Mathematics 5
it than the central BS antennaHence the channel gain of user119896 over subcarrier 119894 on the link with RAH 119909 can be expressedas follows
119867(119909)
119896119894dB = (minus120581 minus 120592log10119889(119909)
119896) minus 120585119896119894 + 10log10119865119896119894 (15)
where the first factor captures propagation loss with 120581 thepath loss constant 119889(119909)
119896the distance in km from mobile 119896 to
RAH 119909 and 120592 the path loss exponent The second factor 120585119896119894
captures log-normal shadowing with zero mean and a stan-dard deviation 120590
120585 whereas the last factor 119865
119896119894 corresponds to
Rayleigh fading power with a Rayleigh parameter 119887 such that119864|119887|2 = 1
In the traditional scenario (Scenario (a)) denoting by119909 = 1 the radio head colocated with the BS at the cell centerthe channel gain between the BS and user 119896 over subcarrier 119894is expressed as 119867
119896119894= 119867(1)
119896119894 With DASs it will transparently
ldquoappearrdquo to user 119896 that its channel gain with the BS oversubcarrier 119894 is
119867119896119894= argmax
119909119867(119909)
119896119894 (16)
It should be noted that the above analysis applies to boththe UL and DL depending on whether 119894 is an UL or DLsubcarrier respectively
42 Throughput Calculations in the Uplink Let 119875(UL)119896119894
be thepower transmitted by user 119896 over subcarrier 119894 119875(UL)
119896max bethe maximum transmission power of user 119896 and 119877
(UL)119896
beits achievable throughput in the UL Then the SCFDMAthroughput of user 119896 is given by
119877(UL)119896
= 119861(UL)sub
10038161003816100381610038161003816I(UL)sub119896
10038161003816100381610038161003816sdot log2(1 + 120573120574
(UL)119896
(P(UL)k I(UL)sub119896119897
))
(17)
where 119861(UL)sub is the UL subcarrier bandwidth |I(UL)sub119896| is thecardinality ofI(UL)sub119896119873
(UL)sub is the number of UL subcarriers
and P(UL)k represents a vector of the transmitted power oneach subcarrier 119875119896119894 120573 is called the SNR gap It indicatesthe difference between the SNR needed to achieve a certaindata transmission rate for a practicalM-QAM system and thetheoretical limit (Shannon capacity) [15] It is given by
120573 =minus15
ln (5119875119887) (18)
where 119875119887
denotes the bit error rate (BER) Finally120574(UL)119896
(P(UL)k I(UL)sub119896) is the SNR of user 119896 after minimum
mean squared error (MMSE) frequency domain equalizationat the receiver [5]
120574(UL)119896
(P(UL)k I(UL)sub119896)
= (1
(110038161003816100381610038161003816I(UL)sub119896
10038161003816100381610038161003816) sum119894isinI(UL)sub119896
(120574(UL)119896119894
(120574(UL)119896119894
+ 1))
minus 1)
minus1
(19)
In (19) 120574(UL)119896119894
is the UL SNR of user 119896 over subcarrier 119894 It isgiven by
120574(UL)119896119894
=
119875(UL)119896119894
119867119896119894
1205902
BS119894 (20)
where119867119896119894
is the channel gain over UL subcarrier 119894 allocatedto user 119896 and 1205902BS119894 is the noise power at the receiver of the BS(ie the receiver of the RAH that is nearest to user 119896)
The LTE standard imposes the constraint that the RBsallocated to a single user should be consecutive with equalpower allocation over the subcarriers of those RBs [5ndash7]The contiguous RB constraint is enforced by Step 4 of thealgorithm in Section 44 To ensure equal power allocationwe set
119875(UL)119896119894
=
119875(UL)119896max
10038161003816100381610038161003816I(UL)sub119896
10038161003816100381610038161003816
(21)
43 Throughput Calculations in the Downlink The DLachievable throughput of user 119896 over RB 119899 is given by
119877(DL)119896119899
= sum
119894isinRB119899119861(DL)sub sdot log
2(1 + 120573120574
(DL)119896119894
) (22)
where 119861(DL)sub is the subcarrier bandwidth In (22) the summa-tion is taken over the consecutive subcarriers that constituteRB 119899 We consider that the BS transmits at the maximumpower 119875BSmax and the power is assumed to be subdividedequally among all the subcarriers Hence the DL SNR of user119896 over a single subcarrier 119894 120574(DL)
119896119894 is given by
120574(DL)119896119894
=
(119875BSmax119873(DL)sub )119867119896119894
1205902
119896119894
(23)
where119873(DL)sub is the total number of DL subcarriers119867119896119894is the
channel gain over DL subcarrier 119894 allocated to user 119896 and 1205902119896119894
is the noise power at the receiver of user 119896
44 LTE Resource Allocation The resource allocation algo-rithm presented in this section was proposed by the authorsin [16] where it was used to enhance individual QoEs It isrepeated here for completeness of the analysis Furthermoreit is used with various utilities in order to maximize thevarious novel network QoE metrics presented in Section 3The algorithm is applicable to both UL and DL Hence wewill drop the superscripts (UL) and (DL) to avoid repetitionWe denote by Isub119896 the set of subcarriers allocated to user119896 IRB119896 the set of RBs allocated to user 119896 119873RB the totalnumber of RBs119870 the number of users and 119877
119896the achievable
throughput of user 119896We define119880(119877119896| IRB119896) as the utility of
user 119896 as a function of the throughput 119877119896given the allocation
IRB119896The resource allocation algorithm presented below con-
sists of allocating RB 119899 to user 119896 in a way to maximize thedifference
Λ119899119896
= 119880 (119877119896| IRB119896 cup 119899) minus 119880 (119877
119896| IRB119896) (24)
6 Journal of Applied Mathematics
where the marginal utility Λ119899119896 represents the gain in the
utility function119880when RB 119899 is allocated to user 119896 comparedto the utility of user 119896 before the allocation of 119899The algorithmis described as follows
(i) Consider the set of available RBs Iavail RB sube
1 2 119873RB and the set of available users Iavail users sube
1 2 119870 At the start of the algorithm Iavail RB =
1 2 119873RB andIavail users = 1 2 119870
Step 1 Find the user that has the highest marginal utilitydefined in (24) among all available users when the firstavailable RB inIavail RB is allocated to it In other words foreach RB 119899 find the user 119896lowast such that
119896lowast= argmax
119896
Λ119899119896 (25)
Step 2 Allocate RB 119899 to user 119896lowastIRB119896lowast = IRB119896lowast cup 119899
Step 3 Delete the RB from the set of available RBs
Iavail RB = Iavail RB minus 119899 (26)
Step 4 This step is only for the UL direction in order toguarantee the contiguity of subcarrier allocations It is notneeded for the DL In the UL if 119896lowast is the same user to whichRB 119899 minus 1 was allocated that is 119896lowast = argmax
119896Λ119899minus1119896
thenkeep 119896lowast inIavail users Otherwise delete user 119896lowast from the setof available users
Iavail users = Iavail users minus 119896lowast (27)
(ii) Repeat Steps 1 2 3 and 4 until there are no availableRBs or no available users
The utility function depends on the data rate and can bechanged depending on the different services and QoSQoErequirementsDifferent utility functions that can be usedwiththe proposed algorithm are presented in Section 5
5 RRM Utility Selection forQoE Maximization
To perform the maximization of (10) we use the utilitymaximization algorithm of Section 44 applicable for theUL and DL The proposed algorithm can be applied with awide range of utility functions being able to achieve variousobjectives with each objective represented by a certain utilityfunction
To explicitly implement RRM algorithms maximizingQoE metrics real-time feedback is needed from mobile ter-minals about the QoE achieved by each user which requiresmodifications to the standards Furthermore this feedbackwould depend on each video sequence being streamed Inthis paper we propose to perform RRM without any QoEfeedback using standard compliant algorithms With theutility maximization algorithm of Section 44 we use utilityfunctions depending on the usersrsquo data rates We investigateMax CI proportional fair and Max-Min utilities for datarates and study the impact of their implementation onthe average geometric mean and minimum QoE networkmetrics
51 Max CI Utility Letting the utility equal to the data rate119880119896= 119877119896 the algorithm of Section 44 leads to amaximization
of the sum rate of the cell (and hence of the average data ratein the cell) However in this case users close to the BS willbe allocated most of the resources and hence will have thehighest QoE However edge users will generally suffer fromstarvation and will have very low data rates and consequentlyvery low QoE
52 Max-Min Utility In this section we discuss utilitiescorresponding to the problem of rate maximization withfairness constraints by attempting tomaximize theminimumdata rate in the network for example [17 18] A vector Rof user data rates is Max-Min fair if and only if for each 119896an increase in 119877
119896leads to a decrease in 119877
119895for some 119895 with
119877119895lt 119877119896[17] Max-Min utilities lead to more fairness by
increasing the priority of users having lower rates [18] It wasshown that Max-Min fairness can be achieved by utilities ofthe form [18]
119880119896(119877119896) = minus
119877minus120572
119896
120572 120572 gt 0 (28)
where the parameter 120572 determines the degree of fairnessMax-Min fairness is attained when 120572 rarr infin [18] We use120572 = 10 in this paper
53 Proportional Fair Utility In this section in order toensure a more fair allocation of wireless resources we modelthe problem as a bargaining gameWe consider that each useris a player who wants to maximize its payoff considered to beits data rate Consequently players should share the resourcesin an optimal way that is a way they cannot jointly improveon The resources to be shared are the OFDMA subcarriersAllocating the shared resources in a way to maximize theplayersrsquo payoffs is equivalent to allocating the subcarriers tousers in a way to maximize each userrsquos data rate given theshares of subcarriers allocated to the other users With eachuser wanting to selfishly maximize its data rate the usersengage in a ldquobargainingrdquo process It is a well-known resultin game theory that the solution to the bargaining problemmaximizes the Nash product119873
119875[19]
max119870
prod
119896=1
119877119896lArrrArr max ln(
119870
prod
119896=1
119877119896)
= max119870
sum
119896=1
ln (119877119896)
(29)
Interestingly the algorithmic implementation of (29) can behandled by the algorithm of Section 44 by using in thatalgorithm 119880119896 = ln(119877119896) as the utility of user 119896 where lnrepresents the natural logarithmMaximizing the sum of log-arithms in (29) is equivalent to maximizing the product andis easier to implement numerically This approach representsproportional fair (PF) scheduling a well-known resourceallocation approach in wireless communications systems PFscheduling is known to correspond to a sumof the logarithms
Journal of Applied Mathematics 7
0 5 10 15 20 25 30 35 40 45 505
10
15
20
25
30
35
40
45
Number of users
QoS
met
ric (d
B)
Sched Max-Min metric min PSNRSched Max-Min metric geom mean PSNRSched Max-Min metric avg PSNRSched PF metric min PSNRSched PF metric geom mean PSNRSched PF metric avg PSNRSched Max CI metric min PSNRSched Max CI metric geom mean PSNRSched Max CI metric avg PSNR
(a) Downlink
0 5 10 15 20 25 30 35 40 45 505
10
15
20
25
30
35
40
45
Number of users
QoS
met
ric (d
B)
Sched Max-Min metric min PSNRSched Max-Min metric geom mean PSNRSched Max-Min metric avg PSNRSched PF metric min PSNRSched PF metric geom mean PSNRSched PF metric avg PSNRSched Max CI metric min PSNRSched Max CI metric geom mean PSNRSched Max CI metric avg PSNR
(b) Uplink
Figure 3 QoS metric
of the user rates and represents the Nash bargaining solution[20] Hence letting119880 = ln(119877) provides proportional fairnessUsing in the logarithm the achievable data rate at thecurrent scheduling instant achieves proportional fairness infrequency (PFF) whereas including the previous schedulinginstants by using the cumulative data rate (since the start ofthe video transmission toby the user) achieves proportionalfairness in time and frequency (PFTF) [9] In this paperPFTF is used since it gives a fair allocation for all users totransmitreceive their videos on the ULDL It can be easilyshown from (29) that PF RRM algorithms maximize thegeometric mean of the user data rates
6 Results and Discussion
This section presents the simulation results obtained bycomparing the scenarios of Figure 2 using RRM with theutilities of Section 5 to maximize the network QoSQoEmetrics of Section 3
61 Simulation Model The simulation model consists ofa single cell with a BS equipped with an omnidirectionalantenna or several RAHs each having an omnidirectionalantenna as shown in Figure 2The simulation parameters areshown in Table 1 LTE parameters are obtained from [7 21]and channel parameters are obtained from [22] Users areconsidered to be uniformly distributed in the cell area
Table 1 Simulation parameters
Parameter Value Parameter Value120581 minus1281 dB 120592 376
120590120585(dB) 8 dB Rayleigh parameter 119887 119864[119887
2] = 1
119861(DL)
5MHz 119861(UL)
5MHz119873(DL)RB 25 119873
(UL)RB 25
119861(DL)sub 15 kHz 119861
(UL)sub 15 kHz
119875(DL)BSmax 5W 119875
(UL)119896max 0125W
To simulate the video transmission in both directions ULand DL the football sequence encoded in QCIF format isused with GOPs consisting of 15 frames one I-frame and 14P-frames having a GOP duration 119879GOP = 1 s The results areaveraged over 2500 iterationswhere in each iteration a videosequence has to be transmitted from the BS to each mobileuser in the DL or from each mobile terminal to the BS in theUL
62 Video QoSQoE Results without DAS Deployment Fig-ures 3 and 4 show the network QoS and QoE resultsrespectively for the DL and UL Comparing the DL and ULperformance in both Figures 3 and 4 it can be noted that theQoSQoE performance in the DL is slightly better than in theUL due to the higher transmission power available at the BS
8 Journal of Applied Mathematics
0 5 10 15 20 25 30 35 40 45 500
10
20
30
40
50
60
70
80
90
100
Number of users
QoE
met
ric (
)
Sched Max-Min metric min QoESched Max-Min metric geom mean QoESched Max-Min metric avg QoESched PF metric min QoESched PF metric geom mean QoESched PF metric avg QoESched Max CI metric min QoESched Max CI metric geom mean QoESched Max CI metric avg QoE
(a) Downlink
0 5 10 15 20 25 30 35 40 45 500
10
20
30
40
50
60
70
80
90
100
Number of users
QoE
met
ric (
)
Sched Max-Min metric min QoESched Max-Min metric geom mean QoESched Max-Min metric avg QoESched PF metric min QoESched PF metric geom mean QoESched PF metric avg QoESched Max CI metric min QoESched Max CI metric geom mean QoESched Max CI metric avg QoE
(b) Uplink
Figure 4 QoE metric
It should be noted that although the same video sequencewas used for simulation purposes the scenario consideredcorresponds in practice to a unicasting scenario wheredifferent videos are transmitted to (by) each user in the DL(UL) Otherwise it would be better to perform multicastingby the BS in the DL and collaborative transmission by theusers in the UL which represent interesting topics for futureresearch
It can be seen that PF scheduling maximizes the averagenetwork QoSQoE both in the DL and UL It also leads tomore fairness in the UL since the best results for geometricmean QoSQoE are achieved with PF scheduling The sameis achieved in the DL when the number of users increasesby maximizing the geometric mean QoSQoE when thenumber of users is above 30 Max-Min scheduling is shownto maximize the minimum QoSQoE in the downlink andto outperform proportional fair scheduling in terms ofgeometric mean QoSQoE when the number of users in theDL is relatively low (below 30) However its performance inthe UL is not as good due to the limited transmit power ofmobile terminals In fact in the UL it is outperformed byPF for all three network QoSQoE metrics and by Max CIscheduling for the average and geometric mean QoSQoEmetrics It is also outperformed by Max CI for the averageQoSQoE metric when the number of users is below 20
RRM using Max CI is extremely unfair in the DL asshown in Figures 3(a) and 4(a) for all threeQoSQoEmetricsrespectively This is due to the fact that it allocates thesubcarriers and power available at the BS to users that are
relatively close to the BS which deprives users that are furtheraway from wireless resources Due to error propagation invideo sequences caused by lost frames this leads to verylow QoSQoE results especially for the metrics involving acertain notion of fairness the min QoSQoE and geometricmean QoSQoE In the UL Max CI performs better mainlydue to the fact that the power is now distributed each userin the UL has its own transmit power conversely to the DLwhere the power is concentrated at a single entity the BSHowever its performance degradation is fast as the numberof users increases especially for the min QoSQoE in thenetwork
Comparing Figure 3 to Figure 4 it can be seen that allcombinations of RRM algorithm network quality metrichave the same performance trends in both figures In otherwords the same conclusions can be reached in terms ofthe superiority of a method over another for both QoS andQoE However the comparison shows that the performancedegradation is faster in the QoE case For example theperformance gap between the average network metric andthe geometric mean metric appears to be reduced in the QoScase (Figure 3) whereas it looks significant in the QoE case(Figure 4) As another example the average QoS metric isnonzero (although low) with Max CI scheduling (Figure 3)whereas the average QoE metric goes to zero when thenumber of users increases with Max CI (Figure 4) Thisexplains the motivation behind using QoE metrics insteadof QoS metrics since they correspond to a more accuraterepresentation of the quality perceived by the end users
Journal of Applied Mathematics 9
10 15 20 25 30 35 40 45 500
10
20
30
40
50
60
70
80
90
100
PSNR (dB)
QoE
met
ric
Figure 5 QoE metric versus PSNR for the football video sequence
In fact Figure 5 shows the plot of QoE versusQoS (PSNR) forthe football video sequence used in the simulations It can beseen that when the PSNR is too high or too low the variationin QoE is unnoticeable However the sensitivity increases inthe intermediate ranges For example a drop of 5 dB from30 dB to 25 dB in PSNR leads to a dramatic fall from 80 to40 in QoE
Therefore in the next section we consider the QoEnetwork metrics and propose the use of DAS to enhance theperformance and ensure more fairness to the users in thenetwork
63 Video QoE Results with DASDeployment In this sectionwe compare the performance of the two scenarios of Figure 2using the QoE network metrics of Section 3 along with theRRM utilities described in Section 5 The DL results arepresented in Figure 6 whereas the UL results are shownin Figure 7 The deployment of DAS leads to significantenhancements for all the investigated scenarios except for theDL case with Max CI scheduling as shown in Figure 6(a)where the enhancement is minor As explained in the pre-vious section Max CI allocates the subcarriers and poweravailable at the BS to users that are relatively close to theBS which deprives users that are further away from wirelessresources This leads to very low QoE results for most usersespecially due to error propagation in video sequences causedby lost frames
A major difference between the results of Figure 6 andFigure 4(a) is that the Max-Min scheduler leads to the bestresults in the DL in the presence of DAS for all three networkQoEmetrics In fact Figure 6(c) shows that the performancefor the three metrics is almost perfect the horizontal curvesindicate that the maximum QoE (885) is reached for allusers The only reason for not having 100 QoE is due tosource distortion caused by lossy compression of the videosequence and not to loss distortion due to packet lossesover the wireless channels The min QoE decreases only
slightly when the number of users exceeds 40 as shownin Figure 6(c) This quasiideal performance was achievedwith a DAS deployment using six RAHs throughout thecell
In the UL the best performance was achieved by PFscheduling as shown in Figure 7 (particularly Figure 7(b))The PF scheduler was also the best UL scheduler in theabsence of DAS (Figure 4(b)) although DAS has led to alarge performance enhancement for all networkQoEmetricsThis difference between the best DL (Max-Min) and UL(PF) schedulers is explained by the difference of powerdistribution between DL and UL In the UL the power isdistributed over all users where each user has an individuallimited powerThe deployment of DAS helps enhance the ULnetwork QoE but the limited transmit power still preventsworst case users from achieving near-optimal performancewhich is captured by the min QoE network metric On theother hand the BS is the single source of power in the DLThe significantly larger transmit power at the BS providesbetter flexibility in power and subcarrier allocations andallows the enhancement of the QoE of the worst case usersFurthermore the DAS deployment enhances the channelconditions for the users in the cell by providing transmitantennas closer to cell edge usersThis allows the achievementof better individual QoE results with a lower transmit powerfor all users including worst case users favored by Max-Minscheduling which enhances the overall performance in thenetwork
Finally it should be noted that the enhancements reachedwithDAS could be reachedwith other solutions For exampledense heterogeneous network deployments where small cellBSs are deployed in large numbers within the coveragearea of large macrocell BSs would lead to the same effectsdue to providing a complete (small) BS closer to the usersinstead of an RAH in a DAS deployment Neverthelessthe DAS deployment when possible leads to a more costeffective solution Furthermore performance enhancements
10 Journal of Applied Mathematics
0 5 10 15 20 25 30 35 40 45 500
10
20
30
40
50
60
70
80
90
100
Number of users
QoE
met
ric (
)
BS only metric min QoEBS only metric geom mean QoEBS only metric avg QoEBS + 6 RRHs metric min QoEBS + 6 RRHs metric geom mean QoEBS + 6 RRHs metric avg QoE
(a) Max CI
0 5 10 15 20 25 30 35 40 45 500
10
20
30
40
50
60
70
80
90
100
Number of users
QoE
met
ric (
)
BS only metric min QoEBS only metric geom mean QoEBS only metric avg QoEBS + 6 RRHs metric min QoEBS + 6 RRHs metric geom mean QoEBS + 6 RRHs metric avg QoE
(b) PF
0 5 10 15 20 25 30 35 40 45 500
10
20
30
40
50
60
70
80
90
100
Number of users
QoE
met
ric (
)
BS only metric min QoEBS only metric geom mean QoE
BS + 6 RRHs metric min QoEBS + 6 RRHs metric geom mean QoEBS + 6 RRHs metric avg QoE
BS only max-min metric avg QoE
(c) Max-Min
Figure 6 DL QoE results with DAS
for indoor users can be reached by deploying femtocell accesspoints (FAPs) Obviously FAP provides an indoor BS closeto the end user which allows the provision of high QoE byovercoming the penetration losses of the macrocell signalcoming from an outdoor BS located further away The in-depth investigation of network QoE optimization in thesespecific scenarios is indeed an interesting topic for furtherresearch
7 Conclusions
Network QoE metrics were proposed in order to capturethe overall performance of radio resource managementalgorithms in terms of video quality perceived by the endusers Metrics corresponding to average geometric meanand minimum QoE in the network were measured whenMax CI proportional fair and Max-Min radio resource
Journal of Applied Mathematics 11
0 5 10 15 20 25 30 35 40 45 500
10
20
30
40
50
60
70
80
90
100
Number of users
QoE
met
ric (
)
BS only metric min QoEBS only metric geom mean QoEBS only metric avg QoEBS + 6 RRHs metric min QoEBS + 6 RRHs metric geom mean QoEBS + 6 RRHs metric avg QoE
(a) Max CI
0 5 10 15 20 25 30 35 40 45 500
10
20
30
40
50
60
70
80
90
100
Number of users
QoE
met
ric (
)
BS only metric min QoEBS only metric geom mean QoEBS only metric avg QoEBS + 6 RRHs metric min QoEBS + 6 RRHs metric geom mean QoEBS + 6 RRHs metric avg QoE
(b) PF
0 5 10 15 20 25 30 35 40 45 500
10
20
30
40
50
60
70
80
90
100
Number of users
QoE
met
ric (
)
BS only metric min QoEBS only metric geom mean QoEBS only metric avg QoEBS + 6 RRHs metric min QoEBS + 6 RRHs metric geom mean QoEBS + 6 RRHs metric avg QoE
(c) Max-Min
Figure 7 UL QoE results with DAS
management algorithms were implemented in the networkBoth the uplink and downlink directions were studiedFurthermore the use of distributed antenna systems toenhance the performance was considered In the absenceof distributed antennas results showed that proportionalfair scheduling maximizes the average network QoE bothin the uplink and downlink It also leads to more fairnessin the uplink and in the downlink when the number ofusers increases by maximizing the geometric mean QoEWhen distributed antennas are deployed proportional fair
scheduling was able to maximize the uplink performancein terms of network QoE whereas Max-Min scheduling ledto remarkably excellent results in the downlink with all theinvestigated network QoE metrics
Conflict of Interests
The authors declare that there is no conflict of interestsregarding the publication of this paper
12 Journal of Applied Mathematics
Acknowledgment
This work was made possible by NPRP Grant no 4-347-2-127from the Qatar National Research Fund (a member of TheQatar Foundation)The statementsmade herein are solely theresponsibility of the authors
References
[1] J-S Lee F de Simone T Ebrahimi N Ramzan and EIzquierdo ldquoQuality assessment of multidimensional video scal-abilityrdquo IEEE Communications Magazine vol 50 no 4 pp 38ndash46 2012
[2] Video Quality Experts Group (VQEG) Final Report on theValidation of Objective Models of Video Quality AssessmentAugust 2003
[3] H Sohn H Yoo W de Neve C S Kim and Y M Ro ldquoFull-reference video qualitymetric for fully scalable andmobile SVCcontentrdquo IEEE Transactions on Broadcasting vol 56 no 3 pp269ndash280 2010
[4] Y-F Ou Z Ma T Liu and YWang ldquoPerceptual quality assess-ment of video considering both frame rate and quantizationartifactsrdquo IEEE Transactions on Circuits and Systems for VideoTechnology vol 21 no 3 pp 286ndash298 2011
[5] H G Myung and D J Goodman Single Carrier FDMA A NewAir Interface for Long Term Evolution Wiley 2008
[6] T Lunttila J Lindholm K Pajukoski E Tiirola andA ToskalaldquoEUTRAN uplink performancerdquo in Proceedings of the 20072nd International Symposium on Wireless Pervasive Computing(ISWPC rsquo07) pp 515ndash519 February 2007
[7] ldquo3rd Generation Partnership Project (3GPP)rdquo 3GPP TS 362133GPP TSG RAN Evolved Universal Terrestrial Radio Access(EUTRA) Physical layer procedures version 1140 Release 112013
[8] X Zhao and X Yang ldquoDownlink ergodic capacity analysis forwireless networks with cooperative distributed antenna sys-temsrdquo in Proceedings of the 2012 IEEE International Conferenceon Communications (ICC rsquo12) pp 5911ndash5915 June 2012
[9] E Yaacoub and Z Dawy Resource Allocation in Uplink OFDMAWireless Systems Optimal Solutions and Practical Implementa-tions John Wiley and SonsIEEE Press New York NY USA2012
[10] E Yaacoub and O Kubbar ldquoOn the performance of distributedbase stations in LTE public safety networksrdquo in Proceedings ofthe 8th IEEE InternationalWireless Communications andMobileComputing Conference (IWCMC rsquo12) pp 927ndash932 August 2012
[11] CPRI Specification V20 ldquoCommon Public Radio Interface(CPRI) interface specificationrdquo Tech Rep 2004
[12] L U Choi M T Ivrlac E Steinbach and J A Nossek ldquoAnalysisof distortion due to packet loss in streaming video transmissionover wireless communication linksrdquo in Proceedings of the IEEEInternational Conference on Image Processing 2005 (ICIP rsquo05)pp 189ndash192 September 2005
[13] J-S Lee F de Simone and T Ebrahimi ldquoSubjective qualityevaluation of foveated video coding using audio-visual focus ofattentionrdquo IEEE Journal on Selected Topics in Signal Processingvol 5 no 7 pp 1322ndash1331 2011
[14] P Goudarzi ldquoScalable video transmission over multi-hop wire-less networks with enhanced quality of experience using swarm
intelligencerdquo Signal Processing Image Communication vol 27no 7 pp 722ndash736 2012
[15] X Qiu ldquoOn the performance of adaptive modulation in cellularsystemsrdquo IEEE Transactions on Communications vol 47 no 6pp 884ndash895 1999
[16] E Yaacoub and N Zorba ldquoEnhancing the quality of experienceof video streaming in LTE networks using distributed antennasystemsrdquo in Proceedings of the International Conference on Com-munications and Information Technology (ICCIT rsquo13) BeirutLebanon June 2013
[17] J-Y le Boudec Rate Adaptation Congestion Control and Fair-ness A Tutorial EPFL 2008
[18] G Song and Y Li ldquoCross-layer optimization for OFDMwirelessnetworks Part I theoretical frameworkrdquo IEEE Transactions onWireless Communications vol 4 no 2 pp 614ndash624 2005
[19] F Carmichael A Guide to GameTheory Prentice Hall 2005[20] E Yaacoub and Z Dawy ldquoAchieving the Nash bargaining
solution in OFDMA uplink using distributed scheduling withlimited feedbackrdquo International Journal of Electronics and Com-munications vol 65 no 4 pp 320ndash330 2011
[21] 3rd Generation Partnership Project (3GPP) 3GPP TS 362113GPP TSG RAN Evolved Universal Terrestrial Radio Access(EUTRA) Physical Channels and Modulation version 1140Release 11 2013
[22] 3rd Generation Partnership Project (3GPP) 3GPP TR 258143GPP TSG RAN Physical Layer Aspects for Evolved UTRAv710 2006
Submit your manuscripts athttpwwwhindawicom
Hindawi Publishing Corporationhttpwwwhindawicom Volume 2014
MathematicsJournal of
Hindawi Publishing Corporationhttpwwwhindawicom Volume 2014
Mathematical Problems in Engineering
Hindawi Publishing Corporationhttpwwwhindawicom
Differential EquationsInternational Journal of
Volume 2014
Applied MathematicsJournal of
Hindawi Publishing Corporationhttpwwwhindawicom Volume 2014
Probability and StatisticsHindawi Publishing Corporationhttpwwwhindawicom Volume 2014
Journal of
Hindawi Publishing Corporationhttpwwwhindawicom Volume 2014
Mathematical PhysicsAdvances in
Complex AnalysisJournal of
Hindawi Publishing Corporationhttpwwwhindawicom Volume 2014
OptimizationJournal of
Hindawi Publishing Corporationhttpwwwhindawicom Volume 2014
CombinatoricsHindawi Publishing Corporationhttpwwwhindawicom Volume 2014
International Journal of
Hindawi Publishing Corporationhttpwwwhindawicom Volume 2014
Operations ResearchAdvances in
Journal of
Hindawi Publishing Corporationhttpwwwhindawicom Volume 2014
Function Spaces
Abstract and Applied AnalysisHindawi Publishing Corporationhttpwwwhindawicom Volume 2014
International Journal of Mathematics and Mathematical Sciences
Hindawi Publishing Corporationhttpwwwhindawicom Volume 2014
The Scientific World JournalHindawi Publishing Corporation httpwwwhindawicom Volume 2014
Hindawi Publishing Corporationhttpwwwhindawicom Volume 2014
Algebra
Discrete Dynamics in Nature and Society
Hindawi Publishing Corporationhttpwwwhindawicom Volume 2014
Hindawi Publishing Corporationhttpwwwhindawicom Volume 2014
Decision SciencesAdvances in
Discrete MathematicsJournal of
Hindawi Publishing Corporationhttpwwwhindawicom
Volume 2014 Hindawi Publishing Corporationhttpwwwhindawicom Volume 2014
Stochastic AnalysisInternational Journal of
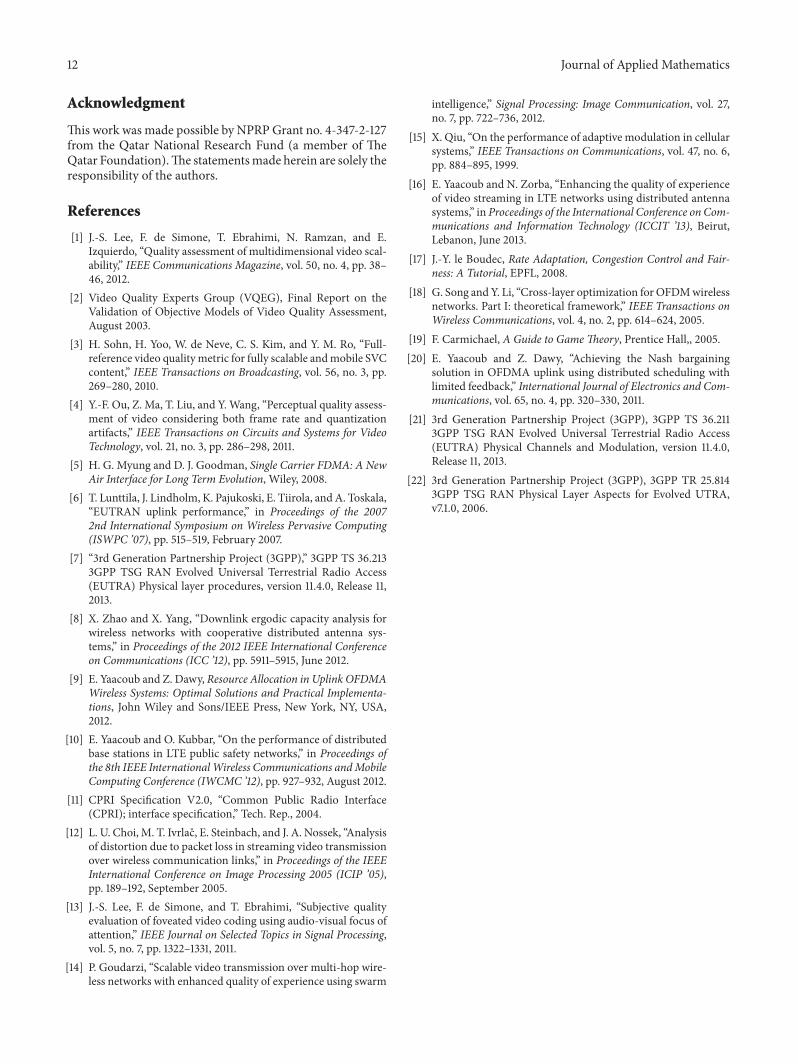