research article compatibility studies on elastomers and
TRANSCRIPT
Research ArticleCompatibility Studies on Elastomers and Polymers with EthanolBlended Gasoline
J S Dhaliwal M S Negi G S Kapur and Shashi Kant
Indian Oil Corporation Limited RampD Division Sector 13 Faridabad Haryana 121007 India
Correspondence should be addressed to G S Kapur kapurgsindianoilin
Received 26 June 2013 Accepted 29 October 2013 Published 29 January 2014
Academic Editors X Lu and A W Mohammad
Copyright copy 2014 J S Dhaliwal et al This is an open access article distributed under the Creative Commons Attribution Licensewhich permits unrestricted use distribution and reproduction in any medium provided the original work is properly cited
This paper reports the compatibility studies of 10 ethanol blended gasoline (E10) with four types of elastomer materials namelyNeoprene rubber Nitrile rubber hydrogenated Nitrile butadiene rubber (HNBR) and Polyvinyl chlorideNitrile butadiene rubberblend (PVCNBR) and two types of plastic materials namely Nylon-66 and Polyoxymethylene (Delrin) These materials haveapplications in automotives as engine seals gaskets fuel system seals and hoses and so forth Two types of the ethanol blendedgasoline mixtures were used (a) gasoline containing 5 ethanol (E5) which is commercial form of gasoline available in India and(b) gasoline containing 10 ethanol (E10) The above materials were immersed in E5 and E10 for 500 hrs at 55∘C A set of eightdifferent properties in E5 and E10 (visual inspection weight change volume change tensile strength percent elongation flexuralstrength impact strength and hardness) were measured after completion of 500 hrs and compared with reference specimens(specimens at 55∘C without fuel and specimens at ambient conditions) Variation observed in different materials with respect tothe above eight properties has been used to draw inference about the compatibility of these elastomericpolymer materials with E10fuel vis-a-vis E5 fuels The data presented in this study is comparative in nature between the results of E10 and E5
1 Introduction
Ethanol is today used as an automotive fuel and currently5 of ethanol is mixed in commercial gasoline available inIndia though in many countries the dosage of ethanol incommercial gasoline can vary from 5 to 20 and even upto 86 in Brazil Though ethanol blended gasoline has itsown advantages there are certain issues associated with itsusage Blending of ethanol leads to formation of azeotropewith lower boiling point which results in higher volatility ofblend and its higher vapor pressure [1 2] Ethanol moleculescan also result in breaking bond between resins and fillersin fiberglass gas tanks causing them to leak resulting insticking of resins to valves and other internal engine partscausing deposits and clogged intake valves Another problemof blending ethanol in gasoline is that ethanol attracts waterleading to increased corrosion in metal gas tanks increasedknocking and decreased performance Another importantissue is the compatibility of various elastomer and plasticmaterials of different chemistry used in different automobileparts with ethanol These issues have been studied and
addressed in various internal studies and research papers [3ndash17] A major study on 20 percent ethanol blended gasoline(E20) has been reported by the Orbital Engine CompanyAustralia for the Government of Australia [3ndash5] This studywas focused on the effect of E20 on automobiles and smallengines in regard to emissions drivability andmaterial com-patibility Study found that E20 caused significant problemsin many plastic rubber and metal components
In 2008 Minnesota Center for Automotive ResearchUSA carried out extensive work on the effect of blendingethanol in different percentages with gasoline on differenttypes of polymers and elastomers used in automotivesmarines small engines fuel systems and fuel dispensingequipment [7 8] Three types of fuel mixtures (5050 tolueneisooctane mixture 10 ethanol in gasoline and 20 ethanolin gasoline) were used to investigate their effect on 8 differ-ent types of polymers and elastomers (Nylon-66 Nylon-6Polyethylene terephthalate (PET) Polyvinyl chloride (PVC)Polybutylene terephthalate (PBT) Acrylonitrile butadienestyrene (ABS) Acrylic rubber (ACM) Epichlorohydrin rub-ber (CO) Polychloroprene rubber (CR) NitrilePVC blend
Hindawi Publishing CorporationJournal of FuelsVolume 2014 Article ID 429608 8 pageshttpdxdoiorg1011552014429608
2 Journal of Fuels
Table 1 Showing specimen dimensions used for studies
S number Specimen type Specimen dimension ReferenceElastomers
1 Visual appearance 110158401015840
times 210158401015840
times 08 (t) (rectangular shaped) [9]2 Tensile strength 115 times 25 times 2mm plusmn 025 Type C (dumbbell shaped) [10]3 Hardness Done on tensile specimens [11]
Plastics4 Visual appearance 210158401015840 dia times 0125 (t) (disk shaped) [9]5 Tensile strength 165 times 19 times 16mm Type 1 (dumbbell shaped) [12]6 Izod impact 635 (l) times 127 (w) times 254 (notch) times 3175 (t) mm [13]7 Flexural strength 25 times 50 times 2 (t) mm [14]
etc) Different materials responded differently dependingupon the fuel system Four polymer materials Nylon-6Nylon-66 PET and Polyetherimide (PEI) showed goodcompatibility towards each type of fuel
As the Government of India is contemplating an increasein the blending percentage of ethanol in commercial gasolinefrom 5 to 10 in the present work compatibility studies offour types of elastomermaterials that is Neoprene PolyvinylchlorideNitrile butadiene rubber blend (PVCNBR) hydro-genated Nitrile butadiene rubber (HNBR) and Nitrile rub-ber and two types of plastic materials (Nylon-66 and Delrin)in 10 ethanol blended gasoline (E10) have been carriedout vis-a-vis 5 ethanol blended gasoline (E5) Eight prop-erties (visual inspection weight change volume changetensile strength percent elongation flexural strength impactstrength and hardness) were measured after completion of500 hrs of testing in E5 and E10 and the results comparedwith reference specimens (specimens at 55∘C without fueland specimens at ambient temperature) Variation observedin different materials with respect to above eight propertieshas been used to draw inference about the compatibility ofthese polymeric materials with E10 fuel vis-a-vis E5 fuels
2 Experimental
21 Materials Four types of elastomers namely NeoprenerubberNitrile rubber hydrogenatedNitrile butadiene rubber(HNBR) and Polyvinyl chlorideNitrile butadiene rubberblend (PVCNBR) and two types of plasticmaterials namelyNylon-66 and Polyoxymethylene (Delrin) were thankfullymade available by Ms Tata Motors Limited and Honda SielCars India Limited
22 Specimens Preparation
221 Elastomers and Plastics In case of elastomers spec-imens of two different shapes were made whereas threedifferent shaped test specimens were required for plastictesting Five specimens per fuel per material were used foreach testing related to change in appearance tensile strengthand flexural strength For measuring the Izod impact tenspecimens per fuel per plastic type were used [18] Furtherone set of specimens of each elastomer and plastic type were
Table 2 Showing physiochemical properties of ethanol
Snumber Characteristicsproperty Value
1 Appearance visual Clear amp bright2 Specific gravity at 60∘F 079423 Purity ( vv) 9988 vv4 Acidity (as CH3COOH) mgL 113mgL5 Aldehyde content (as CH3CHO) mgL lt60mgL6 Copper mgkg 00947 Miscibility with water Miscible
used as reference specimens The set of five specimens werehanged in the bottles at 55 + 2∘Cwithout fuel andwere termedas Air-55 Table 1 shows the various types of specimens usedand their dimensions
23 Testing Procedures
231 Fuels Used SAE J1748 [18] describes methods fordetermination of physical properties of polymeric materialsexposed to gasolineoxygenate fuel mixtures SAE J1748applies to determining worst case fuel conditioning testspecimens in these fuels prior to testing various tests fordetermination of properties and typical calculations used arementioned in this test SAE J1748 was taken asmain referencein our study dimensions of the specimens conditioningparameters and testing protocols were taken into account asper standard Table 2 shows the characteristic properties ofethanol used in the study Two different types of fuels wereused for the study First type of fuel used had 5 ethanolblended gasoline which is currently used as commercial fuelin India (E5) Second type of fuel used had 10 ethanolblended in gasoline (E10) Table 3 shows detailed physio-chemical properties of fuel used for the study
232 Preimmersion Measurements Before the specimenswere immersed after conditioning as per ASTM D618 [19]both types of samples (elastomers and plastics) wereweightedon an analytical balance up to four decimal places [18 2021] Volume of all the appearance specimens was measuredboth in air and fuels Further hardness of all the elastomer
Journal of Fuels 3
Table 3 Showing physiochemical properties of fuels
Snumber Properties E5 E10
1 Color Pale yellow Lightorange
2 Density at 15 deg C kgm3 7411 75443 Octane number 928 954 Sulphur (ppm) 110 1055 Lead content gL mx lt10 ppm lt10 ppm6 Benzene content vol 074 067 Olefin content vol 1991 1788 Aromatics content vol 2823 280
specimens was measured at the clamping ends of tensilespecimens since this will not influence the tensile testing [22]
233 Specimen Immersion in Test Fuels Five specimens ofeach elastomer and plastic type were immersed in E5 andE10 fuels for a continuous period of 500 hrs at 55 + 2∘CBesides the specimens were also kept in Air (ie withoutfuels) at ambient as well as at 55 + 2∘C (ie without fuels)for 500 hours Specimens were placed and suspended inglass bottles in such manner to avoid contact with the wallsor bottom of the container using aluminum wires Glassbeads were used to separate specimens from one anotherAppearance specimens of plastics and elastomers plasticimpact and flexural specimens were immersed in 500mLbottles whereas for plastic tensile specimens 2 L bottles wereusedGlass bottles were filledwith appropriate test fluids untilthe fluid level was 3 cm above the top of the specimens asper ASTM D471 [23] and were placed in oven to reach 55∘Cplusmn 2∘C Once temperature in ovens was stabilized specimenswere placed inside the bottles Fuels in each bottle werereplaced daily for the first three days and weekly thereafterfor elastomers for plastics it was replaced weekly [18] Theimmersion of the specimens was continued up to 500 hoursAfter completion of 500 hours prior to the testing specimenswere treated under two different conditions which areas follows
(1) Specimens of both elastomers and plastics after500 hrs of immersion in fuel were wiped with a tissueto soak the surface gasolinemdashWET specimen
(2) Specimens of elastomers after 500 hrs were dried for40 hrs in an oven at 55∘C before taking measurement(only for elastomers)mdashDRY specimen
234 Properties Measured and Procedures The followingproperties weremeasured before and after the tests were com-pleted and compared with reference samples Appearanceweight and volume change properties were determined onthe same set of specimens
Appearance After completion of 500 hrs glass containerswere removed from the oven and allowed to cool for 24 hoursbefore themeasurements were taken Photographs and visual
inspection of the specimens were noted before immersionafter immersion (WET) and after complete dryout (DRY) inorder to observe any changes in color surface texture glosscracking and so forthWhile small changes in color and glossare generally acceptable changes in texture cracking andso forth are considered unacceptable as these may lead tocomponent failure
Weight Change Specimens were dried with filter paper(WET) and weighted within 10 seconds to minimize evapo-rative weight loss Specimensrsquo weight were measured beforeimmersion after immersion (WET) and after completedryout (DRY) and were compared with each other Fur-ther changes in weight of WET and DRY specimens werecompared in E10 and E5 in order to see the effect offuel composition Comparison between change in weight ofspecimen before and after immersion will indicate howmuchfuel was absorbed into the material a similar comparisonbetween the specimens before immersion and dryout (DRY)will indicate quantity of material leached out [18] Specimensat 55∘C inside oven without fuel were allowed to coolbefore carrying out weight measurements For measuringthe weight SARTORIUS BP2215 analytical balance was usedto measure the weight and volume of the test samples Thebalance has a resolution of 00001 g
Volume Change Similarly specimensrsquo volumes were mea-sured before immersion after immersion (WET) and aftercomplete dryout (DRY) and were compared with each otherFurther change in volume of WET and DRY specimen wascompared in E10 and E5 in order to see the effect of fuelcomposition This change in volume will indicate swelling orshrinkage of the material in a particular fuel Both excessiveshrinkage and swelling are considered unacceptable becausethey can cause problems like accelerated wear and bending ofmaterial Volume of the appearance specimens was measuredby fluid displacement method [23] within 10 seconds afterremoving specimens from bottles Specimens at 55∘C insideoven without fuel were allowed to cool before carrying outmeasurements The volume of each specimen was calculatedusing the following relation
119881 =(MA minusMF)119889 (1)
where119881 is volume (cc) MA is mass in Air (g) MF is mass infuel (g) and 119889 is density (gcc)
Durometer Hardness The hardness of the specimens wasmeasured before immersion after immersion (WET) andafter complete dryout (DRY) and was compared with thatof others Further change in hardness of WET and DRYspecimen was compared in E10 and E5 in order to see theeffect of fuel composition Excessive hardening or softeningof a material is not desirable as it can lead to componentfailure under load In case ofWET specimen after cooling thespecimens hardness test was performed within 3 minutes tominimize dryout effect on tensile specimens clamping endsSince the same tensile specimens were to be used for hardnesstesting hardness measurements were taken on the clamping
4 Journal of Fuels
ends of the specimen [18] Measurements were made on eachspecimen according to ASTM D2240 [22]
Tensile Strength and Percentage of Elongation The tensilestrengths of the specimens were measured before immersionafter immersion (WET) and after complete dryout (DRY)and were compared with each other Further change intensile strength and percent elongation of WET and DRYspecimen was compared in E10 and E5 in order to see theeffect of fuel composition The testing was carried out aftercompleting hardness Test in case of elastomers and speci-mens were immediately put into universal testing machine(UTM) for tensile measurements TIRA test 2710 UniversalTestingMachine (UTM) was used formeasurement of tensilestrength and percent elongation Tensile testing was done ata rate of 5mmmin plusmn 25 [21 24]
Impact Strength and Flexural Strength (Plastics Only) Theimpact and flexural strength of the specimens were mea-sured before immersion and after immersion (WET) TIRATest 2710 Universal Testing Machine (UTM) was used formeasurement of flexural properties After cooling specimenswere wiped with tissue paper (WET specimen) and testingwas completed within 5 minutes to minimize the effects ofdryout For impact strengthCEAST RESIL Impact Tester wasused to determine the impact strengthNotchwasmade on allthe impact specimens as per ASTM requirement using Ceastnotch cutter [25]
24 Other Apparatuses Used The test specimens were placedin special glass bottles of two different sizes (2 liters and500mL) from DURAN which have the capability of with-standing high temperature and pressure Bottle lids weremade of polypropylene with a special type of Teflon mem-brane at top of lid Aluminumwires were used to suspend thesamples in the test fluid and glass beads were used to keep thesamples separated from each other during the soaking period(Figure 1(a)) Different specimens were placed in differentbottles depending upon their dimensions Ovens used for thestudy had a centrally mounted fan for circulating heated Airinside the oven having temperature range from 5∘C to 250∘Cwith an accuracy of plusmn10∘C SARTORIUS BP2215 analyticalbalance was used to measure the weight and volume of thetest specimens The balance had a resolution of 00001 g
3 Results and Discussions
31 Visual Inspection
311 Elastomers
(a) WET Specimens Neoprene E10 specimens were found tobe relatively very soft and brittle when compared to E5 andAir-55 specimens Pits and depressions were also observedin E10 specimen (Figure 1(b)) For Nitrile HNBR andPVCNBR specimens no significant change was observedeither in E5 or in E10 specimens
(b) DRY SpecimensNeoprene E10 specimens became hard ascompared to E5 specimens Shrinkage was also observed in
the E10 and E5 specimens after drying Pits and depressionsin neoprene specimens (Figure 1(b)) kept in E10 fuel givean indication that material has leached out during exposuretime which can potentially cause problems in the fuel systemand engine Leaching of a product represents rapid degrada-tion of thematerial since it can clog up other components Noshrinkage was observed in E10 specimens of Nitrile HNBRand PVCNBR elastomers Minor change in gloss was seen inHNBR and PVCNBR specimens
312 Plastics Nylon-66 E10 specimens (Figure 2(a)) showedsignificant change in color as compared to correspondingE5 specimens Color of E10 specimens changed from off-white to pale yellow whereas slight yellowish tinge wasobserved in corresponding E5 specimens No other visiblechange was observed Slight change in color of Delrin E10 andE5 specimens was also observed (Figure 2(b)) However nocracks roughness tackiness or degradation was observed ineither of the Nylon or Delrin specimens
32 Weight Change
321 Elastomers From Table 4 Neoprene Nitrile andHNBR E10 WET specimens showed almost 100 percentincrease in weight compared to E5 WET specimens How-ever in case of DRY specimens both E5 and E10 showedalmost similar decrease in weight except in case of Neoprenewhere E10 showed more decrease in weight compared toE5 specimens E10 specimens of Neoprene showed moreleaching than E5 specimens In case of PVCNBR specimensboth WET and DRY specimens of E10 and E5 showeddecrease in weight Though the decrease in case of E5 andE10WET specimen were very less (lt1 wt) E5 and E10 DRYspecimens showed a significant decrease of about 20 inweight Air-55 specimens of each type of above elastomersalso showed slight decrease in weight which can be due tothe evaporation of entrapped moisture or volatiles
322 Plastics E10 and E5 specimens of both Nylon-66 andDelrin showed marginal change in weight Weight change inE10 specimens was observed to be lower than E5 specimens(Table 5) Decrease in weight by about 3 percent in Nylon-66 Air-55 specimens can be attributed to the loss of absorbedmoisture due to hygroscopic nature of Nylon
33 Volume Change
331 Elastomers E10 WET specimens of all elastomersshowed 100 percent increase in volume compared to E5WETspecimens which can be attributed to more absorbance ofethanol by the specimens From Table 4 due to swelling ofspecimens during exposure to E10 fuel about 96 increasein volume was observed in Neoprene E10 WET specimensIn case of DRY specimens a decrease in volume ranging from2 to 34 was observed in all types of elastomers Neopreneand PVCNBR showed maximum decrease in volume Theloss in volume in these elastomers is due to the shrinkage
Journal of Fuels 5
(a) (b)
Figure 1 (a) Plastic specimens in hanging position from bottle lid separated with glass beads (b) Neoprene E10 specimens after 500 hoursof immersion
(a) (b)
Figure 2 (a) Appearance specimens Nylon-66 E5 and E10 (b) Appearance specimens Delrin E5 and E10
effect which takes place during drying of these specimensbefore the commencement of property measurement
332 Plastics Both Nylon-66 and Delrin specimens placedin E5 and E10 specimens showedmarginal change in volume
34 Tensile Strength and Elongation
341 Elastomers Decreasing trend in tensile strength wasobserved in both E5 and E10 WET specimens comparedto corresponding Air-55 specimens E10 WET specimensshowed further reduction in the tensile strength comparedto E5 WET specimens in Nitrile HNBR and PVCNBRwhereas Neoprene decomposed completely in E10 fuel
The tensile strength of all the E5 and E10 DRY specimensof elastomers increased as compared to WET specimenswith exception of Neoprene in E10 fuel It was observed thatNitrileHNBR andPVCNBRmaterials showed considerablereduction in percent elongation for both E5 and E10 WETspecimens when compared to Air-55 specimens Howeverno difference was observed in case of E10 WET specimens
to compared E5 WET specimens which indicates that bothE10 and E5 have similar effect on the values of elongation forthese three elastomers In case of Neoprene E5WET showedslightly higher value of elongation when compared to Air-55 specimens indicating some softening of the material InHNBR lower elongation was observed in E10 DRY comparedto E5 and Air-55 specimens However comparing E10 andE5 DRY specimens data while Nitrile showed increase inelongation both HNBR and PVCNBR showed reduction inelongation
342 Plastics Considerable reduction in the tensile strengthwas observed in case of E5 and E10 specimens of Nylon-66 to Air-55 specimens (Table 5) A decrease of 33 intensile strength of Nylon-66 E10 specimen as comparedto E5 was observed The tensile strength of Delrin E10specimens though found comparable to E5 specimens wasfound to be lower than the Air-55 specimens No significantchange in elongation in E5 and E10 specimens of Nylon-66was observed Delrin E5 and E10 specimens showed higherelongation compared to Air-55 specimens
6 Journal of Fuels
Table 4 Elastomers properties after immersion in fuels
Material Air-55 E5 WET E10 WET E5 DRY E10 DRYWeight change ()
Neoprene minus32 plusmn 03 248 plusmn 06 516 plusmn 24 minus210 plusmn 40 minus266 plusmn 30
Nitrile minus07 plusmn 002 102 plusmn 003 219 plusmn 02 minus71 plusmn 006 minus64 plusmn 01
HNBR minus07 plusmn 01 134 plusmn 01 259 plusmn 14 minus41 plusmn 03 minus30 plusmn 06
PVCNBR minus06 plusmn 02 minus09 plusmn 01 minus04 plusmn 01 minus201 plusmn 01 minus201 plusmn 01
Volume change ()Neoprene minus45 plusmn 10 496 plusmn 10 963 plusmn 40 minus284 plusmn 40 minus342 plusmn 30
Nitrile minus14 plusmn 01 205 plusmn 40 397 plusmn 04 minus93 plusmn 01 minus97 plusmn 02
HNBR minus08 plusmn 01 194 plusmn 70 338 plusmn 30 minus20 plusmn 60 10 plusmn 30
PVCNBR minus12 plusmn 03 25 plusmn 40 53 plusmn 20 minus252 plusmn 30 minus273 plusmn 20
Tensile strength (Mpa)Neoprene 11 plusmn 1 8 plusmn 05 mdash 11 plusmn 1 mdashNitrile 9 plusmn 05 4 plusmn 05 2 plusmn 05 8 plusmn 2 10 plusmn 1
HNBR 19 plusmn 1 8 plusmn 1 3 plusmn 1 18 plusmn 2 12 plusmn 1
PVCNBR 10 plusmn 05 8 plusmn 05 6 plusmn 1 11 plusmn 1 10 plusmn 05
Elongation ()Neoprene 146 plusmn 30 154 plusmn 3 mdash 81 plusmn 9 mdashNitrile 102 plusmn 4 56 plusmn 6 56 plusmn 10 79 plusmn 11 92 plusmn 6
HNBR 204 plusmn 53 149 plusmn 24 147 plusmn 42 201 plusmn 29 131 plusmn 19
PVCNBR 115 plusmn 4 85 plusmn 4 83 plusmn 6 51 plusmn 7 33 plusmn 3
Shore hardnessNeoprene 74 plusmn 1 50 plusmn 3 mdash 83 plusmn 1 mdashNitrile 73 plusmn 4 67 plusmn 2 63 plusmn 1 80 plusmn 2 82 plusmn 3
HNBR 73 plusmn 1 57 plusmn 3 44 plusmn 6 68 plusmn 3 67 plusmn 2
PVCNBR 75 plusmn 2 72 plusmn 3 63 plusmn 1 77 plusmn 3 78 plusmn 2
Table 5 Plastics properties after immersion in fuels
Air-55 E5 WET E5 DRY E10 WET E10 DRYWeight change ()
Nylon-66 minus31 plusmn 01 minus30 plusmn 01 -NA- minus10 plusmn 002 -NA-Delrin minus03 plusmn 001 10 plusmn 01 -NA- 15 plusmn 01 -NA-
Volume change ()Nylon-66 minus40 plusmn 10 minus39 plusmn 14 -NA- minus11 plusmn 01 -NA-Delrin minus10 plusmn 01 11 plusmn 01 -NA- 20 plusmn 003 -NA-
Tensile strength (Mpa)Nylon-66 72 plusmn 1 51 plusmn 9 -NA- 34 plusmn 13 -NA-Delrin 63 plusmn 1 53 plusmn 3 -NA- 53 plusmn 1 -NA-
Elongation ()Nylon-66 12 plusmn 5 5 plusmn 1 -NA- 6 plusmn 3 -NA-Delrin 8 plusmn 4 10 plusmn 3 -NA- 15 plusmn 2 -NA-
Impact strength (Jm)Nylon-66 45 plusmn 4 35 plusmn 5 -NA- 61 plusmn 11 -NA-Delrin 36 plusmn 4 45 plusmn 7 -NA- 46 plusmn 11 -NA-
Flexural strength (Mpa)Nylon-66 7 plusmn 1 8 plusmn 1 -NA- 5 plusmn 05 -NA-Delrin 7 plusmn 02 6 plusmn 03 -NA- 5 plusmn 02 -NA-
Journal of Fuels 7
Table 6 Comparison of E10 versus E5 after 500 hours of immersion by taking E5 as the reference data
Material Appearance Weight change Volume change Hardness Tensile ElongationWET DRY WET DRY WET DRY WET DRY WET DRY WET DRY
Neoprene Pitting Pittingand brittle +100 No +100 No Sample got decomposedcrumbled completely
Nitrile No No +100 No +100 No minus4 units No minus100 (2MPa) No No NoHNBR No No +100 No +100 No minus13 units No minus62 (5MPa) minus33 (6MPa) No minus35 (70mm)PVCNBR No No No No No No minus11 units No minus25 (2MPa) No No minus35 (18mm)
Material Appearance Weight change Volumechange Impact strength Tensile Elongation Flexural
Nylon-66 Significant change No No +74 (26 Jm) No No minus37 (3MPa)Delrin No No No No No No No(minus) decrease (+) increase No no difference between E5 and E10 (within repeatability)
35 Shore Hardness
351 Elastomers Neoprene E10 specimens were decom-posed during test period so hardness was only performedon E5 specimens The WET specimens of all the elastomersin E5 and E10 fuels became softer when compared to Air-55specimens with specimens in E10 showing more softeningcompared to E5 After the dryout Neoprene E5 andNitrile E5and E10 specimens became harder while HNBR specimenswere slightly softer compared to Air-55 specimens The E5and E10 DRY PVCNBR specimens showed no change inhardness compared to Air-55 specimens Shore hardness ofE10 DRY specimens was comparable with E5 DRY specimensin all the elastomers (except Neoprene) ForWET specimensthe hardness of E10 specimens was found to be lower than theE5 specimens
36 Impact and Flexural Properties
361 Plastics It was observed that the impact strength of E5specimens of Nylon-66 decreased whereas impact strengthof E10 specimens increased compared to Air-55 specimensDelrin E5 and E10 specimens showed slightly better strengthcompared to Air-55 specimens Nylon-66 E10 specimensshowed higher impact strength than E5 specimens whereasno change was observed for Delrin E5 and E10 specimensFor Nylon-66 flexural strength of E5 specimens was foundto be comparable to Air-55 specimens whereas flexuralstrength of E10 specimens was lower From the results it wasobserved that E10 specimens of both Nylon-66 and Delrinshowed lower change in flexural strength as compared to E5specimens
4 Summary
The basic objective of the study was to compare the effectsof E10 with respect to E5 type of fuel on the various typesof elastomers and plastics found in automotive applicationsTable 6 shows the changes observed in different materials inE10 vis-a-vis in E5 that is data observed in E5 has been usedas the reference If E10 fuel did not result in a significantchange in elastomerplasticmaterial compared to E5 then the
material can be deemed compatible with E10 fuel Pits anddepressions were observed in Neoprene E10 visual appear-ance specimens A 100 increase in weight and volumewas observed in E10 specimens Tensile specimens crumbledduring exposure time Results indicate that Neoprene isnot compatible with E10 fuel No major change in textureor shape in visual appearance specimens of both Nitrileand HNBR was observed Weight and volume increased by100 in specimens of both HNBR and Nitrile Hardnessand tensile strength of both elastomers decreased Fromresults it can be concluded that both HNBR and Nitrile arenot compatible with E10 PVCNBR E10 specimens showedbetter resistance as compared to other elastomers Therewas no significant change in E10 visual appearance weightor volume specimens as compared to E5 specimens Sincethere was decrease in hardness and tensile strength of E10specimens HNBR can also can considered as incompatiblewith E10 fuel Nylon visual appearance specimens colorchanged from off-white to pale yellow An increase in impactstrength and decrease in flexural strength of E10 specimensindicate that under long exposure E10 fuel can deteriorate themechanical properties of Nylon-66 material Thus Nylon-66as such cannot be a favorable material for E10 fuel Delrinshowed good resistance towards E10 fuel No significantchange in physical and mechanical properties indicates thatDelrin is compatible with E10 fuel
5 Conclusion
To test and compare the effects of E10 fuel to those of E5 fuelthis study was conducted on four different elastomers andtwo types of plastics which come in contact of fuel directlyor indirectly used in automotive engine fuel systems andfuel dispensing equipment Both fuel types caused slight anddrastic changes in some materials In appearance specimenspits depressions and decomposition were observed in Neo-prene E10 specimens There was change in color of Nylon-66 and Delrin E10 specimens E10 showed significant effecton Nylon-66 and Delrin appearance specimens there wasvisible change in color from off-white to pale yellow andcreamish Swelling was observed in all elastomers E5 andE10WET specimens except PVCNBR specimens whereas all
8 Journal of Fuels
DRY specimens showed leaching signs Maximum leachingwas observed in PVCNBR E5 and E10 specimens There wasabout 100 increase in volume of all elastomers E10 WETspecimens as compared to E5 WET specimens Maximumshrinkage was observed in Neoprene dryout specimensDelrin showed better resistance to shrinkage swelling andleaching as compared to Nylon-66 No uniform trend intensile strength or elongation was observed in elastomer andplastic specimens E10 WET specimens showed lower tensilestrength as compared to E5 WET specimens but for DRYspecimensrsquo trend was nonuniform
Conflict of Interests
The authors declare that there is no conflict of interestsregarding the publication of this paper
Acknowledgments
The authors wish to acknowledge the support of Tata MotorsHonda Motors and SIAM (Society of Indian AutomobileManufacturers) for providing the samples and the manage-ment of Indian Oil Corporation Limited for permission topublish this work
References
[1] R Da Silva R Cataluna E W D Menezes D Samios and CM S Piatnicki ldquoEffect of additives on the antiknock propertiesand Reid vapor pressure of gasolinerdquo Fuel vol 84 no 7-8 pp951ndash959 2005
[2] J A Pumphrey J I Brand andW A Scheller ldquoVapour pressuremeasurements and predictions for alcohol-gasoline blendsrdquoFuel vol 79 no 11 pp 1405ndash1411 2000
[3] Orbital Engine Company Report Market barriers to the uptakeof biofuels study A testing based assessment to determineimpacts of a 10 and 20 ethanol gasoline fuel blend on non-automotive enginesmdash2000hrs material compatibility testing2003
[4] Orbital Engine Company Report Market barriers to the uptakeof biofuels study A testing based assessment to determineimpacts of a 20 ethanol gasoline fuel blend on the Australianpassenger vehicle fleetmdash2000hrs material compatibility testing2003
[5] Orbital Engine Company Report Market barriers to the uptakeof biofuels study A testing based assessment to determineimpacts of a 20 ethanol gasoline fuel blend on the Australianpassenger vehicle fleet 2003
[6] I Nihalani R D A Paulmer and Y P Rao Compatibility ofelastomericmaterials with gasoline SAE international technicalpaper number 2004-28-0062
[7] B Jones GMead and P Steevens ldquoThe effects of E20 on plasticautomotive fuel systemcomponentsrdquo Tech Rep 20082212008Minnesota Center for Automotive Research
[8] B Jones G Mead P Steevens and C Connors ldquoThe effects ofE20 on elastomers automotive fuel system componentsrdquo TechRep 2222008 Minnesota Center for Automotive Research2008
[9] A Ertekin and N Sridhar ldquoPerformance of elastomeric mate-rials in gasoline-ethanol blends-a reviewrdquo NACE InternationalCorrosion Conference 2009
[10] M R ShanmugamN Saravanan L Srinivasan VHosur and SSridhar ldquo An experimental investigation on 14LMPFI gasolineengine to study its performance emission and compatibilitywith E10 fuelrdquo SAE International Technical Paper Number2009-01-0611
[11] E W Thomas ldquoFluoroelastomer compatibility with bioalcoholfuelsrdquo SAE International Technical Paper 2009-01-0994
[12] G Micallef ldquoElastomer selection for bio-fuel requires a systemsapproachrdquo Sealing Technology vol 2009 no 1 pp 7ndash10 2009
[13] C Berlanga-Labari A Albistur-Goni I Barado-Pardo MGutierrez-Peinado and J Fernandez-Carrasquilla ldquoCompat-ibility study of high density polyethylene with bioethanol-gasoline blendsrdquo Materials and Design vol 32 no 1 pp 441ndash446 2011
[14] M D Kass T J Theiss C J Janke S J Pawel and S A LewisldquoIntermediate Ethanol Blends Infrastructure Materials com-patibility studyrdquo Tech Rep ORNLTM-2010326 ElastomersMetals and Sealants Oak Ridge National Laboratory 2011
[15] M D Kass T J Theiss C J Janke and S J Pawel ldquoCom-patibility study for plastics elastomeric and metallic fuellinginfrastructure materials exposed to aggressive formulations ofethanol-blended gasolinerdquo Tech Rep ORNLTM-201288 OakRidge National Laboratory 2012
[16] V M D Pasa A V Maciel J C Machado and G O BarraldquoCompatibility study of NBRPVC blend with gasoline andethanol fuelrdquoRubber Chemistry andTechnology vol 85 pp 195ndash206 2012
[17] L Baena F Jaramillo and J A Calderon ldquoAggressiveness of a20 bioethanol 80 gasoline mixture on autoparts II Behaviorof polymeric materialsrdquo Fuel vol 95 pp 312ndash319 2012
[18] Methods for determining physical properties of polymericmaterials exposed to gasolineoxygenate fuel mixtures SAEJ1748
[19] Standard practice for conditioning plastics for testing ASTMD618 2010
[20] Standard Practices for Evaluating the Resistance of Plastics toChemical Reagents ASTM D543 2010
[21] Standard test methods for rubber and thermoplasticelastomers-Tension ASTM D412
[22] Standard test methods for rubber properties-durometer hard-ness ASTM D2240
[23] Standard test methods for rubber property-Effect of liquidASTM D471
[24] Standard test method for tensile properties of plastics ASTMD638 2010
[25] Standard Test methods for determining the Izod pendulumimpact resistance of plastics ASTM D256 2010
TribologyAdvances in
Hindawi Publishing Corporationhttpwwwhindawicom Volume 2014
International Journal of
AerospaceEngineeringHindawi Publishing Corporationhttpwwwhindawicom Volume 2014
FuelsJournal of
Hindawi Publishing Corporationhttpwwwhindawicom Volume 2014
Journal ofPetroleum Engineering
Hindawi Publishing Corporationhttpwwwhindawicom Volume 2014
Industrial EngineeringJournal of
Hindawi Publishing Corporationhttpwwwhindawicom Volume 2014
Power ElectronicsHindawi Publishing Corporationhttpwwwhindawicom Volume 2014
Advances in
CombustionJournal of
Hindawi Publishing Corporationhttpwwwhindawicom Volume 2014
Journal of
Hindawi Publishing Corporationhttpwwwhindawicom Volume 2014
Renewable Energy
Submit your manuscripts athttpwwwhindawicom
Hindawi Publishing Corporationhttpwwwhindawicom Volume 2014
StructuresJournal of
International Journal of
RotatingMachinery
Hindawi Publishing Corporationhttpwwwhindawicom Volume 2014
EnergyJournal of
Hindawi Publishing Corporationhttpwwwhindawicom Volume 2014
Hindawi Publishing Corporation httpwwwhindawicom
Journal ofEngineeringVolume 2014
Hindawi Publishing Corporation httpwwwhindawicom Volume 2014
International Journal ofPhotoenergy
Hindawi Publishing Corporationhttpwwwhindawicom Volume 2014
Nuclear InstallationsScience and Technology of
Hindawi Publishing Corporationhttpwwwhindawicom Volume 2014
Solar EnergyJournal of
Hindawi Publishing Corporationhttpwwwhindawicom Volume 2014
Wind EnergyJournal of
Hindawi Publishing Corporationhttpwwwhindawicom Volume 2014
Nuclear EnergyInternational Journal of
Hindawi Publishing Corporationhttpwwwhindawicom Volume 2014
High Energy PhysicsAdvances in
The Scientific World JournalHindawi Publishing Corporation httpwwwhindawicom Volume 2014
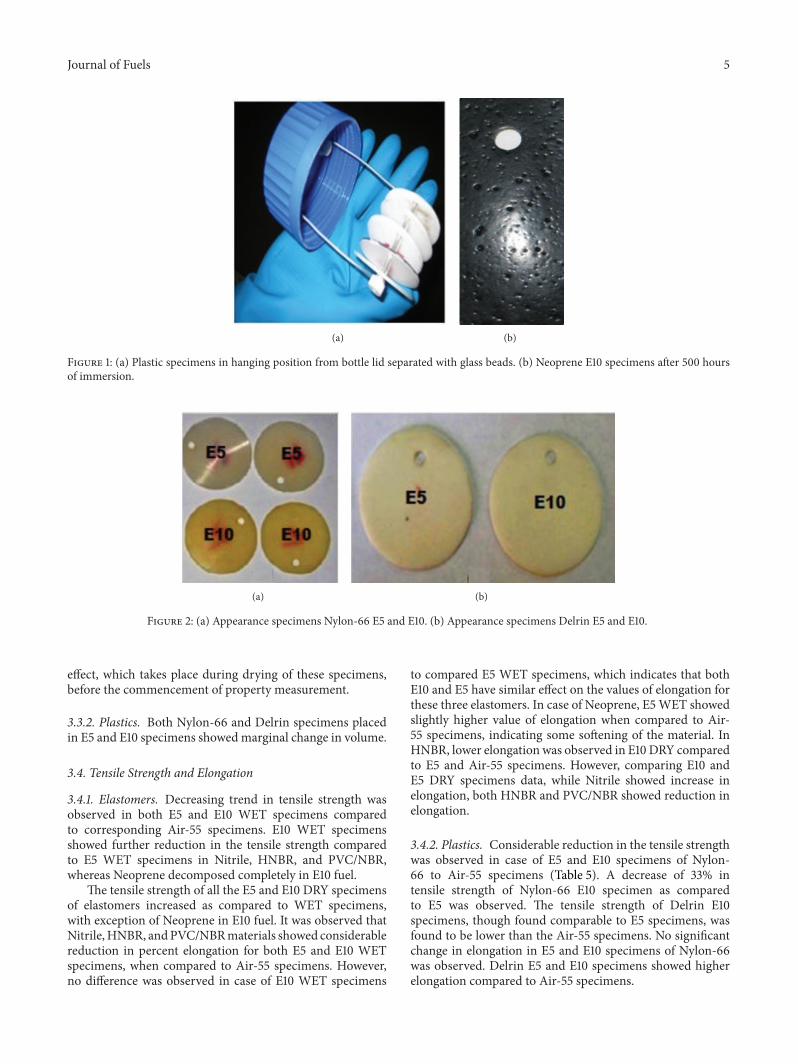
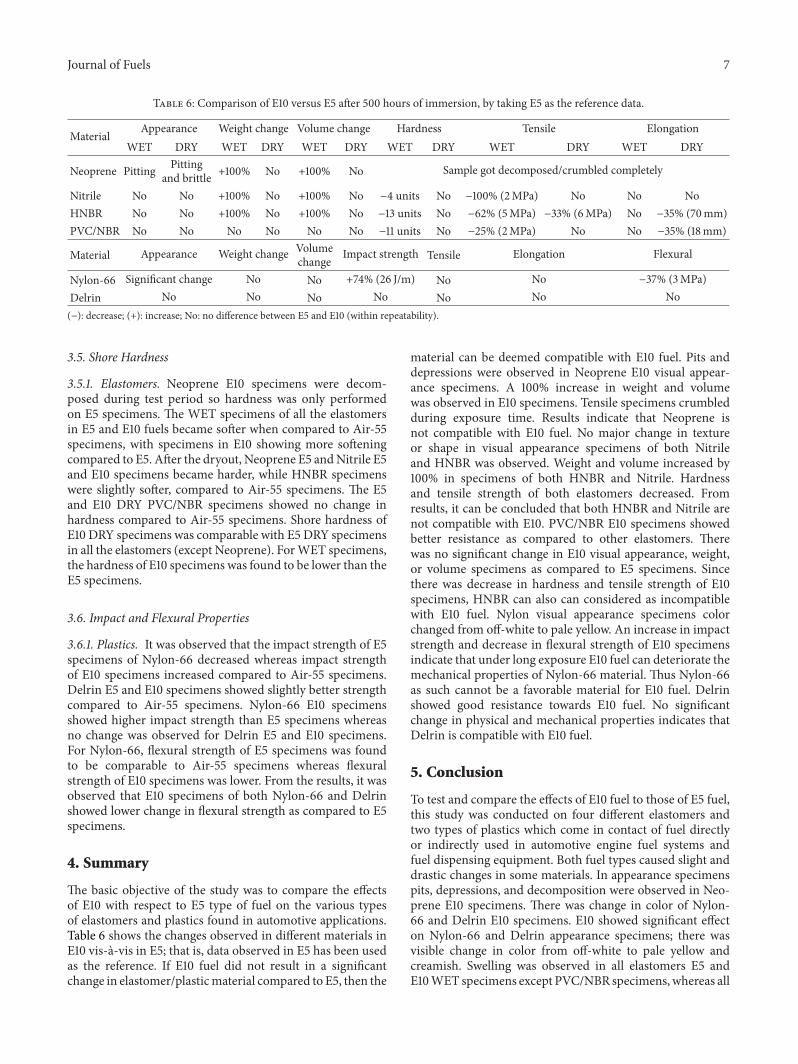