research article characterization of some nigerian...
TRANSCRIPT
Research ArticleCharacterization of Some Nigerian Coals for Power Generation
M. Chukwu, C. O. Folayan, G. Y. Pam, and D. O. Obada
Department of Mechanical Engineering, Ahmadu Bello University, Zaria 810222, Nigeria
Correspondence should be addressed to D. O. Obada; [email protected]
Received 30 November 2015; Accepted 31 March 2016
Academic Editor: Kalyan Annamalai
Copyright © 2016 M. Chukwu et al. This is an open access article distributed under the Creative Commons Attribution License,which permits unrestricted use, distribution, and reproduction in any medium, provided the original work is properly cited.
Five coal samples from Odagbo (Kogi State), Owukpa (Benue State), Ezimo (Enugu State), Amansiodo (Enugu State), and Inyi(Enugu State) of Nigerian coal deposits were subjected to proximate analysis, ultimate analysis, calorific value determination, andpetrographic and thermogravimetric analysis to determine their suitability for power generation. Based on results of tests carriedout, Amansiodo coal is a bituminous, low sulphur, and medium ash coal, while Owukpa coal is a subbituminous A, low sulphur,low ash coal rich in huminites, Odagbo coal is a subbituminous B, medium sulphur, low ash coal rich in huminites, Ezimo coal is asubbituminous C, low sulphur, high ash coal, and Inyi coal is a subbituminous C, low sulphur, high ash coal. Between Odagbo andOwukpa subbituminous coals, Owukpa has a lower ignition temperature (283.63∘C) due to its higher volatilematter content (39.1%).However, Ezimo subbituminous coal, which has a lower volatile matter (31.1%), unexpectedly has the same ignition temperature asOwukpa (283.63∘C) due to its higher liptinite content (7.2%) when compared with that of Owukpa (2.9%). The ease of combustionof the coal samples in decreasing order is Odagbo < Owukpa < Inyi < Ezimo < Amansiodo.
1. Introduction
Access to energy, especially electricity, is a driving force foreconomic and social development [1]. Coal is the key fuel forgenerating electricity on almost all continents, with almostall developed and developing countries relying on coal for thestable and secure supply of electricity [2]. Coal also provides areliable source of electricity and remains the cheapest sourceof electricity in the world today. The proportion of electricitygenerated from coal is currently increasing, especially indeveloping economies [3]. Coal does not presently contributeto Nigeria’s electricity generation in spite of its abundantdeposits in Nigeria [1]. The proven reserves of coal so far inthe country are 639million tonnes while the inferred reservesare about 2.75 billion tonnes, consisting approximately of 49%subbituminous, 39% bituminous, and 12% lignitic coals [4].Against the backdrop of severe shortages in much neededsupply of electricity, it is inevitable that Nigeria must movefrom rhetoric to concrete action in the development andaddition of coal-fired electricity to the nation’s electricitysupply mix.
By IEA, the top 10 coal producers in 2011 were (Mt)China 3,576 (46%), United States 1,004 (13%), India 586 (8%),Australia 414 (5%), Indonesia 376 (5%), Russia 334 (4%),
South Africa 253 (3%), Germany 189 (2%), Poland 139 (2%),and Kazakhstan 117 (2%). In 2011 total coal production was7,783million tonnes (Mt) [5]. Top coal producers in 2012were(Mt) China 3,549, United States 935, India 595, Indonesia 443,Australia 421, Russia 354, South Africa 259, Germany 197,Poland 144, andKazakhstan 126. In 2012 total coal productionwas 7,832Mt.World coal production increased from year 2011to 2012 [6]. Nigeria still holds large coal reserves estimated tobe at least 2 billion metric tons [7].
Over the years, some works have been done on thecharacterization of Nigerian coals. Nasir et al. [8] reported anexperiment using Enugu subbituminous coal of size 850 𝜇m.The particle size distribution of the coal batch sizes wasinvestigated by feeding the coal over-bed in batches of 0.15,0.25, 0.35, and 0.45 kg/batch.The bed and free-board temper-atures were measured using accurate digital thermocouplesacross the diameter of the bed. The minimum fluidisationvelocity was obtained to be 1.64 and 1.91m/s for a coal batchfeed of 150 and 450 g, respectively. Jauro and Chukwu [9]investigated three Nigerian coals (Onyeama, Lafia-Obi, andGarin Maiganga) to determine their suitability in developingformed coke for use as blast furnace coke. Parameters thatwere used include the shatter index expressed as percent-age stability and friability and mecum index. The highest
Hindawi Publishing CorporationJournal of CombustionVolume 2016, Article ID 9728278, 11 pageshttp://dx.doi.org/10.1155/2016/9728278
2 Journal of Combustion
cumulative percentage stability and the lowest cumulativepercentage friability were observed in Lafia-Obi with valuesof 67.54% and 32.46%, followed byOnyeamawith 66.92% and33.08% and then Garin Maiganga with 55.04% and 44.96%,respectively. Medium and low temperature carbonization ofOnyeama and Lafia-Obi coal samples gave an improved andsatisfactory percentage stability and friability for semicokes.
In the search for a Nigerian coking coal, Aderonpe [10]carried out the assessment of blends of high volatile (30%–36%) bituminous coals with low volatile (<20%) bituminouscoals. In another investigation, Onyeama and Okaba coalswere reported to be poorly caking and Lafia/Obi to be weaklycaking [11]. The cakeability of Enugu coal blended with someimported coals was also studied [11].
Most research work on Nigerian coals is focused on theirusefulness in the metallurgical industry. The few researchworks carried out on Nigerian coals as regards power genera-tion have not comprehensively characterized Nigerian coalsbased on the contemporary requirements of power plantdesigners and operators. The usual tests such as proximateanalysis, ultimate analysis, calorific value determination, andash analysis have extensively been carried out. However,contemporary tests required for a comprehensive charac-terization of Nigerian coals for power generation such asthermogravimetric analysis, petrographic analysis, and droptube furnace tests, to the best of our knowledge, have rarelybeen carried out.
Therefore, this paper covers the characterization of coalfrom five deposits in Nigeria which include Odagbo (KogiState), Owukpa (Benue State), Ezimo (Enugu State), Aman-siodo (Enugu State), and Inyi (Enugu State). Estimatedreserves of these deposits are 250, 75, 156, 1000, and 50million tonnes, respectively. Analyses carried out includedetermination of proximate analysis, calorific value, ulti-mate analysis, ash composition, ash fusion temperature (inoxidizing and reducing atmospheres), petrographic analysis,and thermogravimetric analysis. Results of the analyses arecompared with specification values derived from both theliterature and a survey of coal-fired power plant operatorsin order to determine the suitability of the coal samples forpower generation.
2. Materials and Methods
Coal samples were obtained through the Nigerian Coal Cor-poration, Enugu, for five different deposits in Nigeria, whichinclude Odagbo (Kogi State), Owukpa (Benue State), Ezimo(Enugu State), Amansiodo (Enugu State), and Inyi (EnuguState). The samples were stored in appropriately labeled air-tight containers to retain their as-received conditions.
2.1. General Sample Preparation. The principle of mixing andthen dividing, using either mechanical or manual methods asdescribed in the International Organization for Standardisa-tion (ISO) 13909-4:2001 specifications, was used to generate arepresentative pulverised sample of each coal and then usedto prepare each sample to the desired analytical specificationsusing an array of sample preparation equipment. Osborn10 × 6-inch jaw crusher, double roller crusher, and Retsch
ZM200 ultra centrifugal mill were some of the equipmentused to reduce the coal samples from a top size of 150mm to asuitable size distribution range of 150–212𝜇m. An automaticsieve shaker was used for sieving the samples to the desiredsize distribution required for each test, while a hand rifle wasused to split the samples into representative subsamples.
2.2. Proximate Analysis. 1 g of each coal sample passing a212 𝜇m test sieve was used for proximate analysis. Moisturecontent was analysed using the air oven method basedon South African National Standards (SANS) 5925:2007specifications with a LABCON air oven. Volatile matter wasdetermined based on ISO 562:1998 with a volatile furnacemanufactured by Ultra-furn (SA) (PTY) Ltd. Ash contentwas analysed based on ISO 1171:1997 using a LENTONprogrammable furnace. Fixed carbon was calculated bydifference using the formula
% Fixed Carbon
= 100
− (% Moisture +% Ash +% Volatile Matter) .
(1)
2.3. Ultimate Analysis. 1 g of coal sample passing througha sieve having an aperture of 212 𝜇m was used for ultimateanalysis in a LECO TRUSPEC CHN elemental determiningdevice based on ISO 12902-CHN instrumental method.Oxygen was calculated by difference on an air-dried basis asfollows:
Oxygen (%) = 100 − (Carbon +Hydrogen
+Nitrogen + Ash +Moisture) .(2)
2.4. Calorific Value, Total Sulphur, and Ash Analyses. 1 g ofcoal sample passing through a sieve with an aperture of212 𝜇m was used to determine gross calorific value in aParr 6400 Isoperibol Calorimeter based on ISO 1928:1995specifications. For the total sulphur determination, 0.35 gof coal sample passing through a sieve with an aperture of212 𝜇m was used to determine total sulphur using infraredspectroscopy method as specified by ISO 19579. A LECO S-144 dual range sulphur detector was the equipment used.Theash analyses evaluation entailed the heating of the coals toabout 815∘C at a constant weight under standard conditionsto form ash, a process referred to as “bulk ashing,” using theLENTONAshFurnace. Ash composition analysis was carriedout using the ASTM D-4326 X-ray fluorescence method.Ash fusion temperatures in oxidizing and reducing atmo-spheres were investigated using ISO 540:2008 specificationsin a CARBOLITE CAF Digital Furnace with a maximumoperating temperature of 1550∘C. Carbon dioxide gas wasused for the oxidizing atmosphere, while a combination ofcarbon dioxide and hydrogen gases was used for the reducingatmosphere.
2.5. Petrographic Analysis. The method used is thatrecommended by the International Committee for Coaland Organic Petrology (ICCP) as published in ISO 7404
Journal of Combustion 3
handbooks. Coal samples passing a sieve of 850𝜇m, eachweighing 15 g, were used to produce 30mm diameterparticulate blocks using M Resin (epoxy resin) mixed withHY 956 modified polyamide hardener in a ratio of 5 : 1. Theblocks were ground and polished in a SAPHIR 520 grinderwith the aid of abrasive cloth and colloidal silica liquid. Thehighly polished particulate block representing a sample wascoated with nondrying immersion oil and placed under anOrtholux 32x lens microscope. An automatic point countermoves the microscope crosshairs over the polished surfaceof the particulate block at traverse spacing of 0.4mm andintervals between the traverses of 0.5mm. A point is anobservation of a portion of the particulate block under thecrosshair. At least 500 points (excluding binding resin andvisible minerals) were counted by tapping on the counter keyallotted to each maceral spotted. At the end of 500 counts,the total count obtained for each maceral was used to obtainthe percentage maceral composition of each coal sample.
2.6. Thermogravimetric Analysis. The combustion in airmethod was used for this analysis. The instrument usedfor this analysis was an SDT Q600 simultaneous DSC/TGAinstrument. This is capable of performing both differentialscanning calorimetry (DSC) and thermogravimetric analysis(TGA) simultaneously. Coal samples passing through a testsieve with an aperture of 212𝜇mwere used for this test. 25mgof the coal sample was carefully weighed and loaded into theinstrument’s lidless alumina crucible with a volume of 90 𝜇L.The sample was heated in air from 25∘C to 1000∘C at a heatingrate of 10∘C/min and an air flow rate of 50mL/min. Thechange in weight of the sample was automatically recordeduntil therewas no further change inweight.The residue in thecrucible represents the ash content of the sample.The ignitiontemperature on the thermograms for the various coals wascalculated following this procedure: through the DSC (dif-ferential thermogravimetric) peak point, a vertical line wasmade upward to meet the TG oblique line. A tangent line toTG curve was created whichmet the extended TG initial levelline. The vertical line which projects downwards and meetsthe cross axle is defined as the ignition temperature. This isread from the corresponding value on the temperature axis.
Correlation Coefficient between Some Properties and CalorificValue of Coal. Equation (3) was used to investigate thecorrelation of the results obtained for some of the propertiesof the coals sampled. Results for fixed carbon, volatile matter,carbon, and hydrogen were correlated against calorific value:
𝑟 =
𝑛∑ (𝑥𝑦) − (∑𝑥) (∑𝑦)2
√{[𝑛∑𝑥2
− (∑𝑥)2
] [𝑛∑𝑦2
− (∑𝑦2
)]}
, (3)
where 𝑟 is correlation coefficient, 𝑛 is number of samples, 𝑥and 𝑦 are variables (properties) investigated.
3. Results and Discussion
3.1. Proximate Analysis. Results obtained from proximateanalyses of the five coal samples are shown inTable 1 on an air-dried basis, while the calculated fuel ratio of each sample is
Table 1: Results of proximate analyses of the five coal samples.
Properties SamplesOdagbo Owukpa Ezimo Amansiodo Inyi
Inherent moisture (%) 14.9 11.5 6.6 5.4 3.8Ash content (%) 5.3 3.3 23.4 8.6 30.4Volatile matter, VM (%) 38.7 39.1 31.1 38.1 29.9Fixed carbon, FC (%) 41.1 46.1 38.9 47.9 35.9
shown in Figure 2. Fixed carbon was calculated by differenceusing (1).
The inherent moisture contents range from 3.80% to14.9%. The Odagbo coal sample had the highest moisturecontent of 14.9%, followed by Owukpa, Ezimo, Amansiodo,and then Inyi coal samples with 11.5%, 6.6%, 5.4%, and3.8%, respectively. There is no much difference between thevolatilematter contents ofOdagbo, Owukpa, andAmansiodocoal samples. The Inyi coal sample had the lowest volatilematter content (29.90%). The highest fixed carbon contentof 47.9% was recorded in Amansiodo coal sample, followedby Owukpa, Odagbo, Ezimo, and Inyi coal samples withvalues of 46.1%, 41.1%, 38.9%, and 35.9%, respectively. TheAmansiodo coal sample had the highest gross calorific valueof 27.48MJ/kg, followed by the Owukpa coal sample with26.51MJ/kg, the Odagbo coal sample with 22.60MJ/kg, theEzimo coal sample with 20.96MJ/kg, and then the Inyi coalsample with 19.39MJ/kg. It is noteworthy that Inyi coal sam-ple with the lowest inherent moisture content (3.8%) wouldbe the easiest to handle and store followed by Amansiodo(5.4%), Ezimo (6.6%), Owukpa (11.5%), and then Odagbo(14.9%) coal samples.
Ash content affects coal and ash handling systems, pulver-isers (abrasion), furnace, superheater, reheater, economiser,soot-blowing intervals (slagging and fouling propensity,erosion, and corrosion), pollution control equipment, andunburnt carbon in ash [13]. Owukpa coal sample withthe lowest ash content (3.3%) would cost less in termsof investment in ash handling equipment and pulveriserabrasion followed by Odagbo (5.3%), Amansiodo (8.6%),Ezimo (23.4%), and Inyi (30.4%) coal samples.
The volatile matter content of coal affects storagebehaviour (oxidation, danger of spontaneous combustion,and loss of heating value), pulveriser outlet temperature andrequired fineness for pulverisation, burner settings, furnace,combustion behaviour, and efficiency (ignition, flame shapeand stability, and burnout and carbon content of fly ash)[13]. Inyi coal sample with the lowest volatile matter (29.9%)would have the least danger of spontaneous combustion.Thisis followed by Ezimo (31.1%), Amansiodo (38.1%), Owukpa(39.1%), and Odagbo (38.7%) samples.
The fuel ratio has also been computed by the ratio of fixedcarbon to volatilematter; this is as represented in Figure 1.Theratio of fixed carbon to volatile matter (fuel ratio) indicatesthe ease of ignition and burnout, but the heat content of thevolatilematter is amore reliable guide to ignition.The volatilematter content influences NOx formation. Generally for thesame burner and constant nitrogen content, the higher the

4 Journal of Combustion
1.062
1.179
1.25 1.257
1.201
0.95
1
1.05
1.1
1.15
1.2
1.25
1.3
Fuel ratio (fixed carbon/volatile matter)
Fuel
ratio
OdagboOwukpaEzimo
AmansiodoInyi
Figure 1: Fuel ratio of the five coal samples.
22.6
26.51
20.96
27.48
19.39
0
5
10
15
20
25
30
Coal samples
Calo
rific v
alue
(MJ/k
g)
OdagboOwukpaEzimo
AmansiodoInyi
Figure 2: Calorific value of the five coal samples.
volatilematter, the lower theNOx. It can be seen fromFigure 1that Amansiodo possesses the highest fuel ratio.
3.2. Ultimate Analysis. Results obtained from the ultimateanalysis carried out on the five coal samples were evaluatedon air-dried basis. Oxygen was calculated by difference onan air-dried basis using (2). The elemental composition ofcarbon, hydrogen, nitrogen, sulphur, and oxygen in the coalsamples is shown in Table 2.The percentages of the elementalcarbon of Odagbo, Owukpa, Ezimo, Amansiodo, and Inyicoal samples were as follows: 62.16%, 67.82%, 54.21%, 66.95%,and 49.27%, and those of hydrogen are 5.87%, 5.88%, 4.42%,5.62%, and 4.19%. Ezimo and Inyi coal samples had low totalsulphur contents of 0.56% each, respectively, while Odagbosample had the highest value of 1.07%. The oxygen contentsof the coal samples fell between 9.34% and 10.93%. TheOdagbo coal sample had the lowest oxygen content of 9.34%,followed by Owukpa, Ezimo, Inyi, and Amansiodo coalsamples with 9.47%, 9.59%, 10.53%, and 10.93%, respectively.
Table 2: Results of ultimate analyses of the five coal samples.
Elements SamplesOdagbo Owukpa Ezimo Amansiodo Inyi
Carbon (%) 62.16 67.82 54.21 66.95 49.27Hydrogen (%) 5.87 5.88 4.42 5.62 4.19Nitrogen (%) 1.37 1.43 1.22 1.58 1.24Total sulphur (%) 1.07 0.60 0.56 0.92 0.56Oxygen (%) 9.34 9.47 9.59 10.93 10.53
TheAmansiodo coal sample had the highest nitrogen contentof 1.58%, followed by theOwukpa coal sample with 1.43%, theOdagbo coal samplewith 1.37%, and the Inyi coal samplewith1.24%, while the Ezimo had the lowest value of 1.22%. Carbonand hydrogen are the major combustible constituents of coal,and both of them are high in the coal samples.The higher thecarbon content, the higher the calorific value and the betterthe quality of the coal for power generation.
3.3. Calorific Value. Results obtained from the gross calorificvalue determination carried out on the five coal samplesare shown in Figure 2. The calorific value gives the heatingvalue or the heat of combustion of a substance. It has beensuggested that the calorific value of power plant coals is in therange of 9.5MJ/kg to 27MJ/kg [14].Thus, all the coal sampleswould be suitable for power generation.The Amansiodo coalsample, with the highest heating value of 27.48MJ/kg, wouldbe the best for heating and power generation.
The heat of combustion of any organic compound isassociatedwith the bond energies between the atoms formingthe chemical structure of the compound and therefore withthe character of the bonds. However, in spite of the absence offundamental scientific validation, the possibility that the heatof combustion might be calculated for solid fuels (e.g., coals)with fair accuracy from elementary composition alone hasled many researchers to establish empirical correlations fromtheir commonlymeasured characteristics.Those correlationsare often expressed in the form of linear combinations ofthe weight percentages of the atom elements C, H, and O,sometimes expanded to S and N. The reason is that majorelements in the chemical composition of fossil fuels areactually limited to C, H, O, N, and S in their organic part [15].A formula for the gross heating value (HV) of fossil fuels wasdeveloped by [16]. The empirical equation was expressed asfollows:
HV, KJ/kg = 35.160C + 116.225H − 11.090O
+ 6.280N + 10.465S.(4)
Oxygen has a negative coefficient because it ties up some ofthe carbon and hydrogen in the form of CO, H
2O, phenols
(OH), and so forth. Depending upon the chemical functionalgroups of the fuels, the heating values may differ. Generally,the greater the oxygen percentage, the lower the percentageof C and H available for combustion and hence the lowerthe heating value [17]. A comparison of heating rates of thesample coals estimated from the Boie equation is given inTable 3.
Journal of Combustion 5
Table 3: Comparison of heating values of sample coals estimated from the Boie equation with measured values.
SamplesUltimate analysis, % dry weight Heating value MJ/kg
Error%Carbon Hydrogen Oxygen Nitrogen Sulphur Measured
MJ/kgEstimatedMJ/kg
Odagbo 62.16 5.87 9.34 1.37 1.07 22.60 27.00 +19.46Owukpa 67.82 5.88 9.47 1.43 0.60 26.51 29.78 +12.33Ezimo 54.21 4.42 9.59 1.22 0.56 20.96 23.26 +9.88Amansiodo 66.95 5.62 10.93 1.58 0.92 27.48 29.02 +5.60Inyi 49.27 4.19 10.53 1.24 0.56 19.39 22.82 +17.68
Table 4: Results of ash composition tests of the five coal samples.
Constituents SamplesOdagbo Owukpa Ezimo Amansiodo Inyi
Al2
O3
(%) 25.78 27.60 20.76 29.13 19.02CaO (%) 2.15 0.95 0.60 0.34 0.05Cr2
O3
(%) 0.03 0.03 0.02 0.04 0.01Fe2
O3
(%) 7.98 4.48 2.93 6.90 1.70K2
O (%) 0.31 0.06 1.13 1.32 0.36MgO (%) 1.31 0.04 0.16 0.35 0.06MnO (%) 0.41 0.03 0.04 0.05 —Na2
O (%) 0.07 0.02 0.03 0.06 0.01P2
O5
(%) 0.06 0.77 0.21 0.22 0.06SiO2
(%) 56.81 61.64 70.92 58.94 75.92TiO2
(%) 1.98 2.98 2.29 2.13 2.29V2
O5
(%) 0.09 0.03 0.02 0.04 0.02ZrO2
(%) 0.10 0.13 0.11 0.07 0.15Ba (%) 0.20 0.17 0.08 0.06 0.02Sr (%) 0.04 0.13 0.04 0.05 0.01SO3
(%) 1.74 — 0.28 — —
Table 5: Results of ash fusion temperature test (in oxidizingatmosphere) of the five coal samples.
Temperatures SamplesOdagbo Owukpa Ezimo Amansiodo Inyi
Initial deformation(∘C) 1461 >1550 >1550 >1550 >1550
Softening (∘C) 1489 >1550 >1550 >1550 >1550Hemispherical (∘C) 1518 >1550 >1550 >1550 >1550Fluid (∘C) >1550 >1550 >1550 >1550 >1550
3.4. AshAnalyses. Results obtained from the ash compositiontest of the five coals samples using the X-ray fluorescence(XRF) technique are shown in Table 4.
Results obtained from the ash fusion temperature test (inoxidizing atmosphere) of the five coals samples are shown inTable 5.
Results obtained from the ash fusion temperature tests ofthe five coals samples are shown in Table 6.
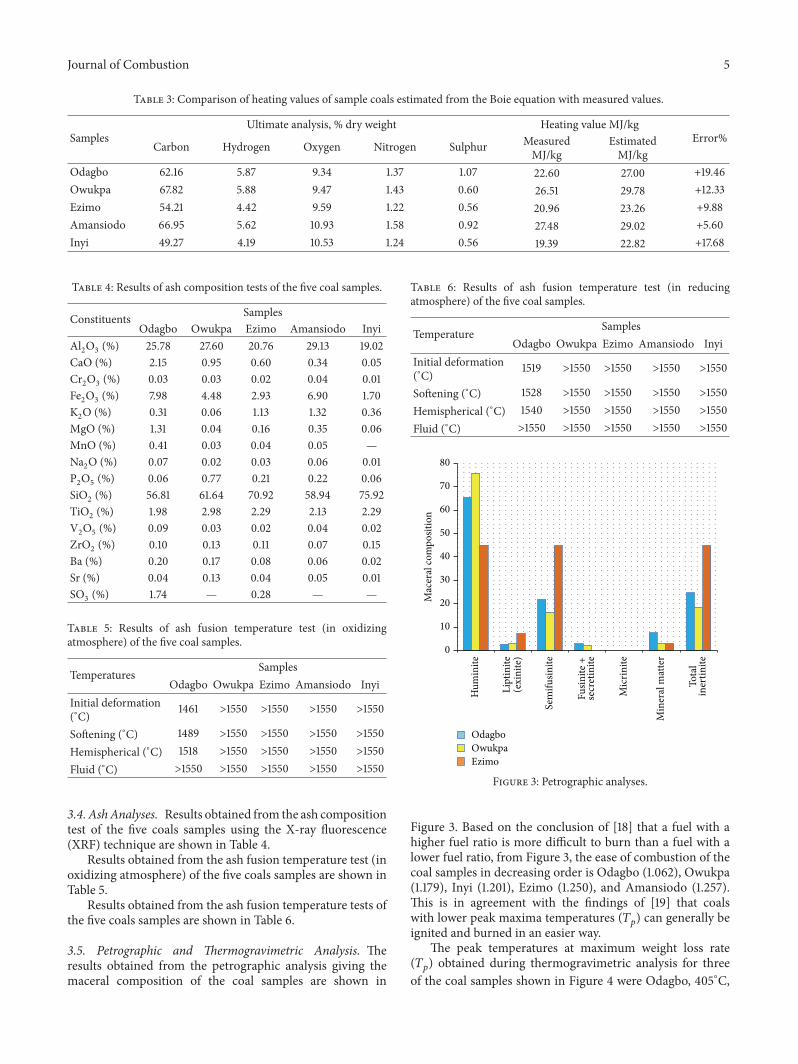
3.5. Petrographic and Thermogravimetric Analysis. Theresults obtained from the petrographic analysis giving themaceral composition of the coal samples are shown in
Table 6: Results of ash fusion temperature test (in reducingatmosphere) of the five coal samples.
Temperature SamplesOdagbo Owukpa Ezimo Amansiodo Inyi
Initial deformation(∘C) 1519 >1550 >1550 >1550 >1550
Softening (∘C) 1528 >1550 >1550 >1550 >1550Hemispherical (∘C) 1540 >1550 >1550 >1550 >1550Fluid (∘C) >1550 >1550 >1550 >1550 >1550
0
10
20
30
40
50
60
70
80
Mac
eral
com
posit
ion
OdagboOwukpaEzimo
Hum
inite
(exi
nite
)Li
ptin
ite
Sem
ifusin
ite
Fusin
ite +
secr
etin
ite
Mic
rinite
Min
eral
mat
ter
Tota
lin
ertin
ite
Figure 3: Petrographic analyses.
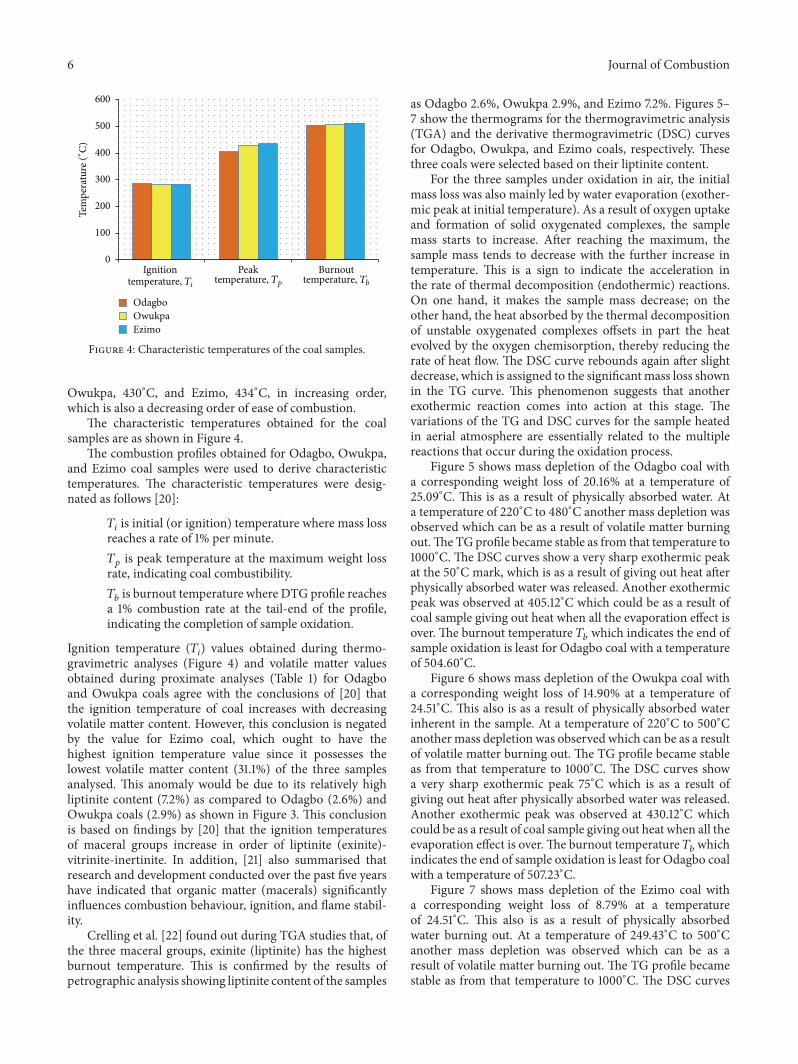
Figure 3. Based on the conclusion of [18] that a fuel with ahigher fuel ratio is more difficult to burn than a fuel with alower fuel ratio, from Figure 3, the ease of combustion of thecoal samples in decreasing order is Odagbo (1.062), Owukpa(1.179), Inyi (1.201), Ezimo (1.250), and Amansiodo (1.257).This is in agreement with the findings of [19] that coalswith lower peak maxima temperatures (𝑇
𝑝) can generally be
ignited and burned in an easier way.The peak temperatures at maximum weight loss rate
(𝑇𝑝) obtained during thermogravimetric analysis for three
of the coal samples shown in Figure 4 were Odagbo, 405∘C,
6 Journal of Combustion
0
100
200
300
400
500
600
OdagboOwukpaEzimo
Tem
pera
ture
(∘C)
Burnouttemperature, Tb
Peaktemperature, Tp
Ignitiontemperature, Ti
Figure 4: Characteristic temperatures of the coal samples.
Owukpa, 430∘C, and Ezimo, 434∘C, in increasing order,which is also a decreasing order of ease of combustion.
The characteristic temperatures obtained for the coalsamples are as shown in Figure 4.
The combustion profiles obtained for Odagbo, Owukpa,and Ezimo coal samples were used to derive characteristictemperatures. The characteristic temperatures were desig-nated as follows [20]:
𝑇𝑖is initial (or ignition) temperature where mass loss
reaches a rate of 1% per minute.𝑇𝑝is peak temperature at the maximum weight loss
rate, indicating coal combustibility.𝑇𝑏is burnout temperature where DTG profile reaches
a 1% combustion rate at the tail-end of the profile,indicating the completion of sample oxidation.
Ignition temperature (𝑇𝑖) values obtained during thermo-
gravimetric analyses (Figure 4) and volatile matter valuesobtained during proximate analyses (Table 1) for Odagboand Owukpa coals agree with the conclusions of [20] thatthe ignition temperature of coal increases with decreasingvolatile matter content. However, this conclusion is negatedby the value for Ezimo coal, which ought to have thehighest ignition temperature value since it possesses thelowest volatile matter content (31.1%) of the three samplesanalysed. This anomaly would be due to its relatively highliptinite content (7.2%) as compared to Odagbo (2.6%) andOwukpa coals (2.9%) as shown in Figure 3. This conclusionis based on findings by [20] that the ignition temperaturesof maceral groups increase in order of liptinite (exinite)-vitrinite-inertinite. In addition, [21] also summarised thatresearch and development conducted over the past five yearshave indicated that organic matter (macerals) significantlyinfluences combustion behaviour, ignition, and flame stabil-ity.
Crelling et al. [22] found out during TGA studies that, ofthe three maceral groups, exinite (liptinite) has the highestburnout temperature. This is confirmed by the results ofpetrographic analysis showing liptinite content of the samples
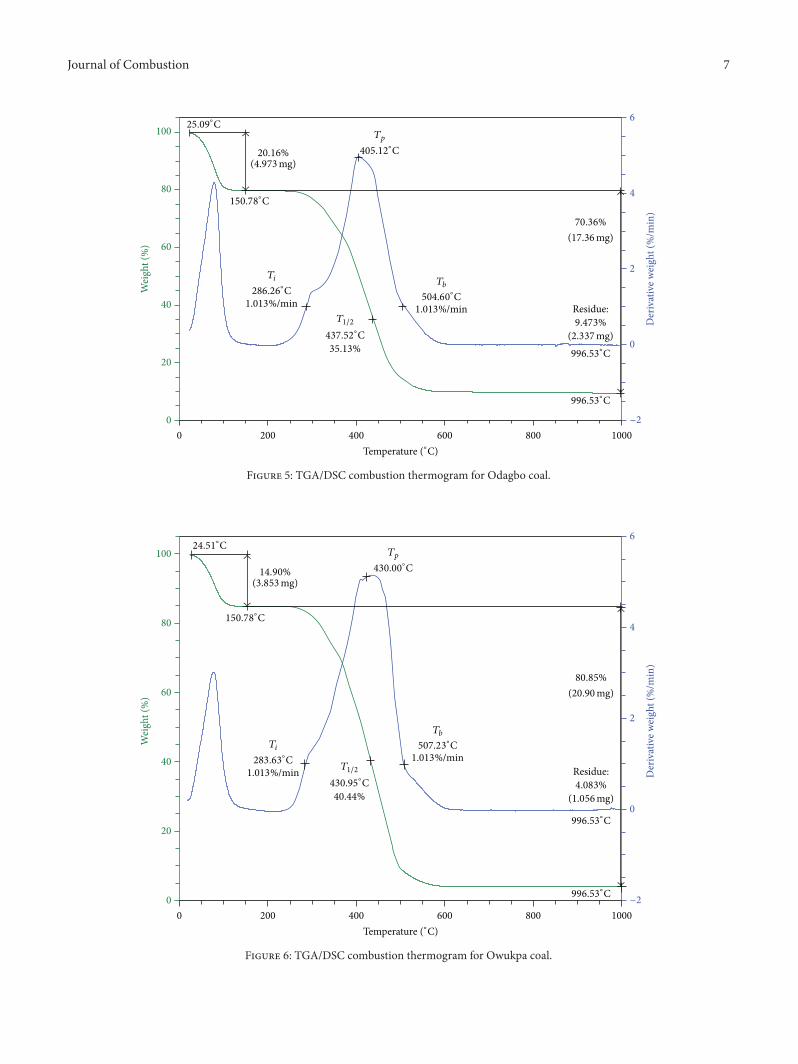
as Odagbo 2.6%, Owukpa 2.9%, and Ezimo 7.2%. Figures 5–7 show the thermograms for the thermogravimetric analysis(TGA) and the derivative thermogravimetric (DSC) curvesfor Odagbo, Owukpa, and Ezimo coals, respectively. Thesethree coals were selected based on their liptinite content.
For the three samples under oxidation in air, the initialmass loss was also mainly led by water evaporation (exother-mic peak at initial temperature). As a result of oxygen uptakeand formation of solid oxygenated complexes, the samplemass starts to increase. After reaching the maximum, thesample mass tends to decrease with the further increase intemperature. This is a sign to indicate the acceleration inthe rate of thermal decomposition (endothermic) reactions.On one hand, it makes the sample mass decrease; on theother hand, the heat absorbed by the thermal decompositionof unstable oxygenated complexes offsets in part the heatevolved by the oxygen chemisorption, thereby reducing therate of heat flow. The DSC curve rebounds again after slightdecrease, which is assigned to the significant mass loss shownin the TG curve. This phenomenon suggests that anotherexothermic reaction comes into action at this stage. Thevariations of the TG and DSC curves for the sample heatedin aerial atmosphere are essentially related to the multiplereactions that occur during the oxidation process.
Figure 5 shows mass depletion of the Odagbo coal witha corresponding weight loss of 20.16% at a temperature of25.09∘C. This is as a result of physically absorbed water. Ata temperature of 220∘C to 480∘C another mass depletion wasobserved which can be as a result of volatile matter burningout.The TG profile became stable as from that temperature to1000∘C. The DSC curves show a very sharp exothermic peakat the 50∘C mark, which is as a result of giving out heat afterphysically absorbed water was released. Another exothermicpeak was observed at 405.12∘C which could be as a result ofcoal sample giving out heat when all the evaporation effect isover. The burnout temperature 𝑇
𝑏which indicates the end of
sample oxidation is least for Odagbo coal with a temperatureof 504.60∘C.
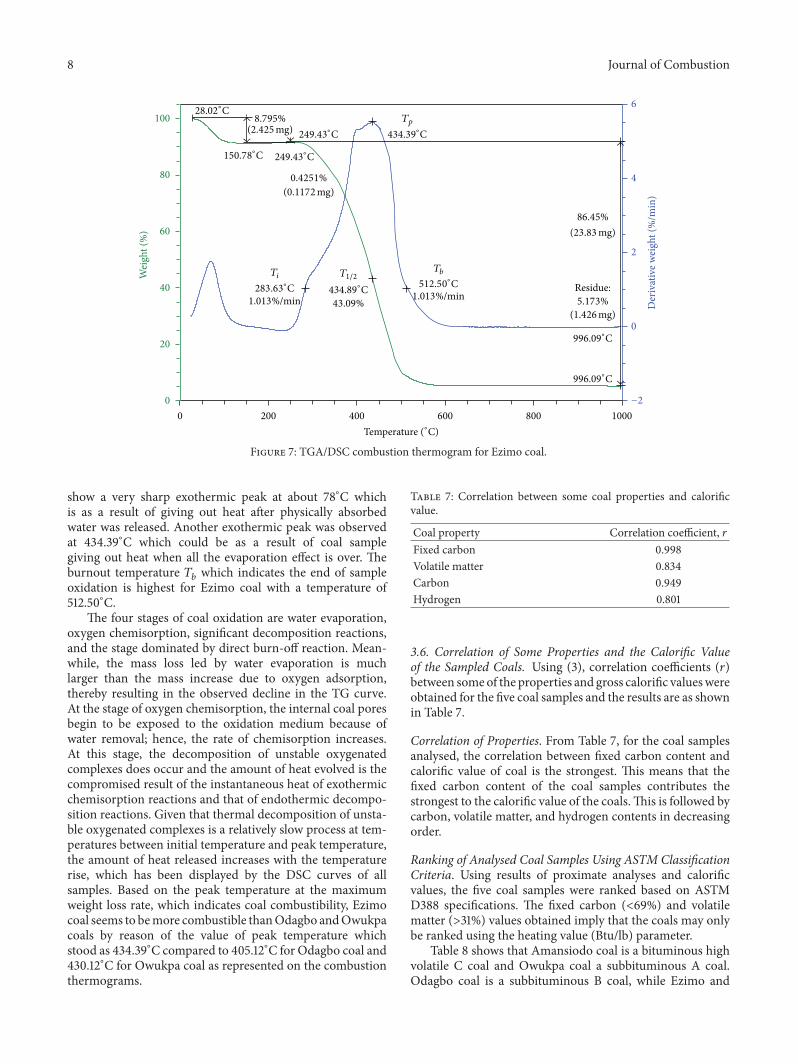
Figure 6 shows mass depletion of the Owukpa coal witha corresponding weight loss of 14.90% at a temperature of24.51∘C. This also is as a result of physically absorbed waterinherent in the sample. At a temperature of 220∘C to 500∘Canother mass depletion was observed which can be as a resultof volatile matter burning out. The TG profile became stableas from that temperature to 1000∘C. The DSC curves showa very sharp exothermic peak 75∘C which is as a result ofgiving out heat after physically absorbed water was released.Another exothermic peak was observed at 430.12∘C whichcould be as a result of coal sample giving out heat when all theevaporation effect is over.The burnout temperature 𝑇
𝑏which
indicates the end of sample oxidation is least for Odagbo coalwith a temperature of 507.23∘C.
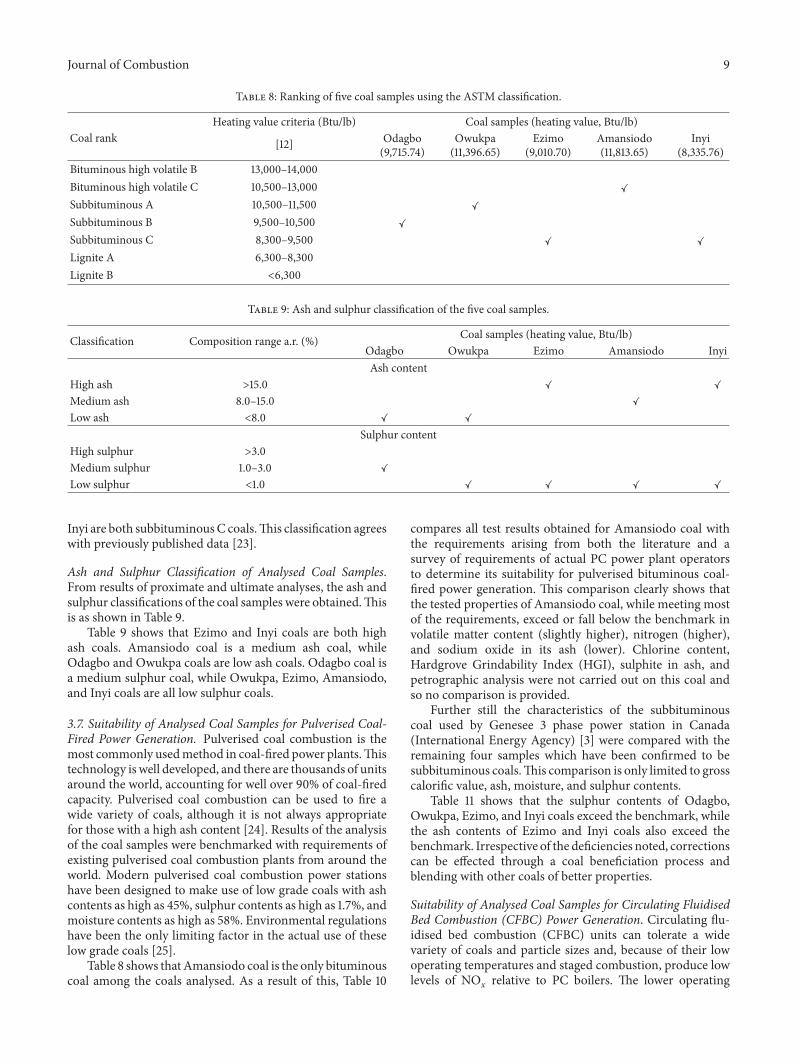
Figure 7 shows mass depletion of the Ezimo coal witha corresponding weight loss of 8.79% at a temperatureof 24.51∘C. This also is as a result of physically absorbedwater burning out. At a temperature of 249.43∘C to 500∘Canother mass depletion was observed which can be as aresult of volatile matter burning out. The TG profile becamestable as from that temperature to 1000∘C. The DSC curves
Journal of Combustion 7
Wei
ght (
%)
Temperature (∘C)
Der
ivat
ive w
eigh
t (%
/min
)
100
80
60
40
20
0
0 200 400 600 800 1000
6
4
2
0
−2
Tp
TbTi
T1/2
150.78∘C
405.12∘C
437.52∘C
286.26∘C
504.60∘C
996.53∘C
996.53∘C
20.16%
35.13%
1.013%/min1.013%/min
70.36%
Residue:9.473%
(4.973mg)
(17.36mg)
(2.337mg)
25.09∘C
Figure 5: TGA/DSC combustion thermogram for Odagbo coal.
Wei
ght (
%)
Temperature (∘C)
100
80
60
40
20
0
0 200 400 600 800 1000
6
4
2
0
−2
Tp
Tb
Ti
T1/2
150.78∘C
430.00∘C
430.95∘C
283.63∘C
507.23∘C
996.53∘C
996.53∘C
14.90%
40.44%
1.013%/min1.013%/min
80.85%
Residue:4.083%
(3.853mg)
(20.90mg)
(1.056mg)
24.51∘C
Der
ivat
ive w
eigh
t (%
/min
)
Figure 6: TGA/DSC combustion thermogram for Owukpa coal.
8 Journal of Combustion
Wei
ght (
%)
Temperature (∘C)
100
80
60
40
20
0
0 200 400 600 800 1000
6
4
2
0
−2
Tp
TbTi T1/2
28.02∘C
150.78∘C 249.43
∘C
249.43∘C 434.39
∘C
434.89∘C283.63
∘C 512.50∘C
996.09∘C
996.09∘C
8.795%
0.4251%
43.09%1.013%/min 1.013%/min
86.45%
Residue:5.173%
(2.425mg)
(0.1172mg)
(23.83mg)
(1.426mg)
Der
ivat
ive w
eigh
t (%
/min
)
Figure 7: TGA/DSC combustion thermogram for Ezimo coal.
show a very sharp exothermic peak at about 78∘C whichis as a result of giving out heat after physically absorbedwater was released. Another exothermic peak was observedat 434.39∘C which could be as a result of coal samplegiving out heat when all the evaporation effect is over. Theburnout temperature 𝑇
𝑏which indicates the end of sample
oxidation is highest for Ezimo coal with a temperature of512.50∘C.
The four stages of coal oxidation are water evaporation,oxygen chemisorption, significant decomposition reactions,and the stage dominated by direct burn-off reaction. Mean-while, the mass loss led by water evaporation is muchlarger than the mass increase due to oxygen adsorption,thereby resulting in the observed decline in the TG curve.At the stage of oxygen chemisorption, the internal coal poresbegin to be exposed to the oxidation medium because ofwater removal; hence, the rate of chemisorption increases.At this stage, the decomposition of unstable oxygenatedcomplexes does occur and the amount of heat evolved is thecompromised result of the instantaneous heat of exothermicchemisorption reactions and that of endothermic decompo-sition reactions. Given that thermal decomposition of unsta-ble oxygenated complexes is a relatively slow process at tem-peratures between initial temperature and peak temperature,the amount of heat released increases with the temperaturerise, which has been displayed by the DSC curves of allsamples. Based on the peak temperature at the maximumweight loss rate, which indicates coal combustibility, Ezimocoal seems to bemore combustible thanOdagbo andOwukpacoals by reason of the value of peak temperature whichstood as 434.39∘C compared to 405.12∘C for Odagbo coal and430.12∘C for Owukpa coal as represented on the combustionthermograms.
Table 7: Correlation between some coal properties and calorificvalue.
Coal property Correlation coefficient, 𝑟Fixed carbon 0.998Volatile matter 0.834Carbon 0.949Hydrogen 0.801
3.6. Correlation of Some Properties and the Calorific Valueof the Sampled Coals. Using (3), correlation coefficients (𝑟)between someof the properties and gross calorific valueswereobtained for the five coal samples and the results are as shownin Table 7.
Correlation of Properties. From Table 7, for the coal samplesanalysed, the correlation between fixed carbon content andcalorific value of coal is the strongest. This means that thefixed carbon content of the coal samples contributes thestrongest to the calorific value of the coals.This is followed bycarbon, volatile matter, and hydrogen contents in decreasingorder.
Ranking of Analysed Coal Samples Using ASTM ClassificationCriteria. Using results of proximate analyses and calorificvalues, the five coal samples were ranked based on ASTMD388 specifications. The fixed carbon (<69%) and volatilematter (>31%) values obtained imply that the coals may onlybe ranked using the heating value (Btu/lb) parameter.
Table 8 shows that Amansiodo coal is a bituminous highvolatile C coal and Owukpa coal a subbituminous A coal.Odagbo coal is a subbituminous B coal, while Ezimo and
Journal of Combustion 9
Table 8: Ranking of five coal samples using the ASTM classification.
Coal rankHeating value criteria (Btu/lb) Coal samples (heating value, Btu/lb)
[12] Odagbo(9,715.74)
Owukpa(11,396.65)
Ezimo(9,010.70)
Amansiodo(11,813.65)
Inyi(8,335.76)
Bituminous high volatile B 13,000–14,000Bituminous high volatile C 10,500–13,000 ✓
Subbituminous A 10,500–11,500 ✓
Subbituminous B 9,500–10,500 ✓
Subbituminous C 8,300–9,500 ✓ ✓
Lignite A 6,300–8,300Lignite B <6,300
Table 9: Ash and sulphur classification of the five coal samples.
Classification Composition range a.r. (%) Coal samples (heating value, Btu/lb)Odagbo Owukpa Ezimo Amansiodo InyiAsh content
High ash >15.0 ✓ ✓
Medium ash 8.0–15.0 ✓
Low ash <8.0 ✓ ✓
Sulphur contentHigh sulphur >3.0Medium sulphur 1.0–3.0 ✓
Low sulphur <1.0 ✓ ✓ ✓ ✓
Inyi are both subbituminousC coals.This classification agreeswith previously published data [23].
Ash and Sulphur Classification of Analysed Coal Samples.From results of proximate and ultimate analyses, the ash andsulphur classifications of the coal samples were obtained.Thisis as shown in Table 9.
Table 9 shows that Ezimo and Inyi coals are both highash coals. Amansiodo coal is a medium ash coal, whileOdagbo and Owukpa coals are low ash coals. Odagbo coal isa medium sulphur coal, while Owukpa, Ezimo, Amansiodo,and Inyi coals are all low sulphur coals.
3.7. Suitability of Analysed Coal Samples for Pulverised Coal-Fired Power Generation. Pulverised coal combustion is themost commonly usedmethod in coal-fired power plants.Thistechnology is well developed, and there are thousands of unitsaround the world, accounting for well over 90% of coal-firedcapacity. Pulverised coal combustion can be used to fire awide variety of coals, although it is not always appropriatefor those with a high ash content [24]. Results of the analysisof the coal samples were benchmarked with requirements ofexisting pulverised coal combustion plants from around theworld. Modern pulverised coal combustion power stationshave been designed to make use of low grade coals with ashcontents as high as 45%, sulphur contents as high as 1.7%, andmoisture contents as high as 58%. Environmental regulationshave been the only limiting factor in the actual use of theselow grade coals [25].
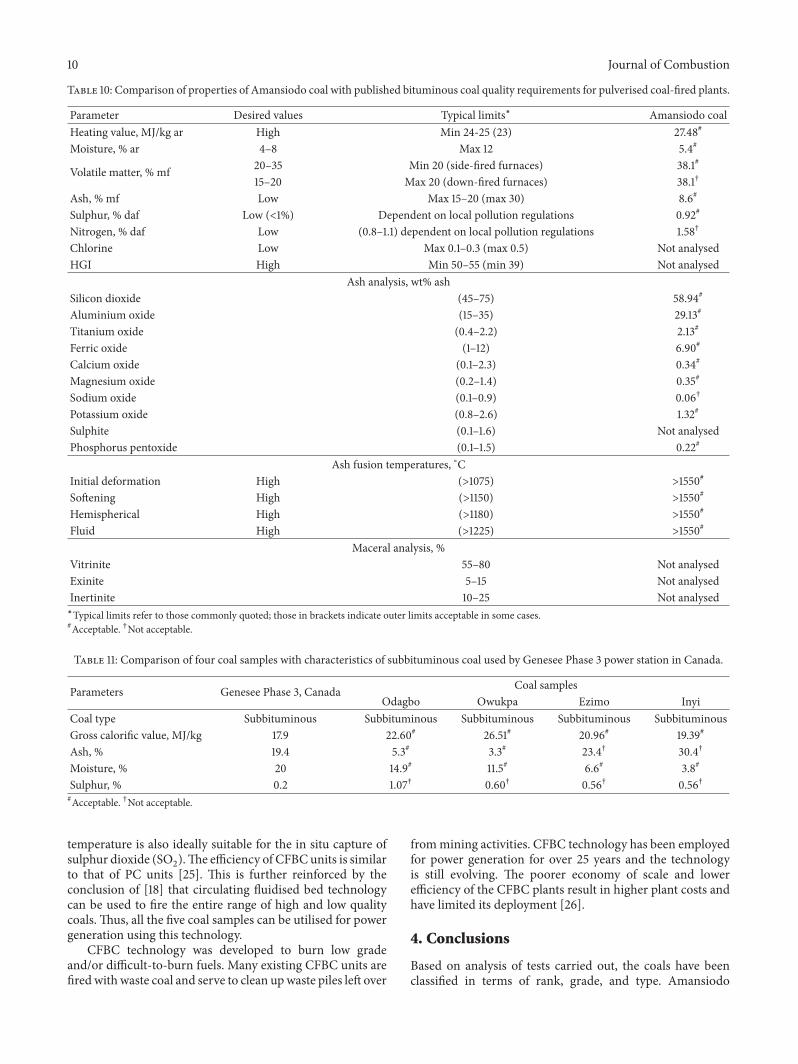
Table 8 shows thatAmansiodo coal is the only bituminouscoal among the coals analysed. As a result of this, Table 10
compares all test results obtained for Amansiodo coal withthe requirements arising from both the literature and asurvey of requirements of actual PC power plant operatorsto determine its suitability for pulverised bituminous coal-fired power generation. This comparison clearly shows thatthe tested properties of Amansiodo coal, while meeting mostof the requirements, exceed or fall below the benchmark involatile matter content (slightly higher), nitrogen (higher),and sodium oxide in its ash (lower). Chlorine content,Hardgrove Grindability Index (HGI), sulphite in ash, andpetrographic analysis were not carried out on this coal andso no comparison is provided.
Further still the characteristics of the subbituminouscoal used by Genesee 3 phase power station in Canada(International Energy Agency) [3] were compared with theremaining four samples which have been confirmed to besubbituminous coals.This comparison is only limited to grosscalorific value, ash, moisture, and sulphur contents.
Table 11 shows that the sulphur contents of Odagbo,Owukpa, Ezimo, and Inyi coals exceed the benchmark, whilethe ash contents of Ezimo and Inyi coals also exceed thebenchmark. Irrespective of the deficiencies noted, correctionscan be effected through a coal beneficiation process andblending with other coals of better properties.
Suitability of Analysed Coal Samples for Circulating FluidisedBed Combustion (CFBC) Power Generation. Circulating flu-idised bed combustion (CFBC) units can tolerate a widevariety of coals and particle sizes and, because of their lowoperating temperatures and staged combustion, produce lowlevels of NOx relative to PC boilers. The lower operating
10 Journal of Combustion
Table 10: Comparison of properties of Amansiodo coal with published bituminous coal quality requirements for pulverised coal-fired plants.
Parameter Desired values Typical limits∗ Amansiodo coalHeating value, MJ/kg ar High Min 24-25 (23) 27.48#
Moisture, % ar 4–8 Max 12 5.4#
Volatile matter, % mf 20–35 Min 20 (side-fired furnaces) 38.1#
15–20 Max 20 (down-fired furnaces) 38.1†
Ash, % mf Low Max 15–20 (max 30) 8.6#
Sulphur, % daf Low (<1%) Dependent on local pollution regulations 0.92#
Nitrogen, % daf Low (0.8–1.1) dependent on local pollution regulations 1.58†
Chlorine Low Max 0.1–0.3 (max 0.5) Not analysedHGI High Min 50–55 (min 39) Not analysed
Ash analysis, wt% ashSilicon dioxide (45–75) 58.94#
Aluminium oxide (15–35) 29.13#
Titanium oxide (0.4–2.2) 2.13#
Ferric oxide (1–12) 6.90#
Calcium oxide (0.1–2.3) 0.34#
Magnesium oxide (0.2–1.4) 0.35#
Sodium oxide (0.1–0.9) 0.06†
Potassium oxide (0.8–2.6) 1.32#
Sulphite (0.1–1.6) Not analysedPhosphorus pentoxide (0.1–1.5) 0.22#
Ash fusion temperatures, ∘CInitial deformation High (>1075) >1550#
Softening High (>1150) >1550#
Hemispherical High (>1180) >1550#
Fluid High (>1225) >1550#
Maceral analysis, %Vitrinite 55–80 Not analysedExinite 5–15 Not analysedInertinite 10–25 Not analysed∗Typical limits refer to those commonly quoted; those in brackets indicate outer limits acceptable in some cases.#Acceptable. †Not acceptable.
Table 11: Comparison of four coal samples with characteristics of subbituminous coal used by Genesee Phase 3 power station in Canada.
Parameters Genesee Phase 3, Canada Coal samplesOdagbo Owukpa Ezimo Inyi
Coal type Subbituminous Subbituminous Subbituminous Subbituminous SubbituminousGross calorific value, MJ/kg 17.9 22.60# 26.51# 20.96# 19.39#
Ash, % 19.4 5.3# 3.3# 23.4† 30.4†
Moisture, % 20 14.9# 11.5# 6.6# 3.8#
Sulphur, % 0.2 1.07† 0.60† 0.56† 0.56†#Acceptable. †Not acceptable.
temperature is also ideally suitable for the in situ capture ofsulphur dioxide (SO
2).The efficiency of CFBC units is similar
to that of PC units [25]. This is further reinforced by theconclusion of [18] that circulating fluidised bed technologycan be used to fire the entire range of high and low qualitycoals. Thus, all the five coal samples can be utilised for powergeneration using this technology.
CFBC technology was developed to burn low gradeand/or difficult-to-burn fuels. Many existing CFBC units arefiredwith waste coal and serve to clean upwaste piles left over
frommining activities. CFBC technology has been employedfor power generation for over 25 years and the technologyis still evolving. The poorer economy of scale and lowerefficiency of the CFBC plants result in higher plant costs andhave limited its deployment [26].
4. Conclusions
Based on analysis of tests carried out, the coals have beenclassified in terms of rank, grade, and type. Amansiodo

Journal of Combustion 11
coal is a bituminous, low sulphur, and medium ash coal,while Owukpa coal is a subbituminous A, low sulphur, lowash coal rich in huminites. In addition, Odagbo coal is asubbituminous B, medium sulphur, low ash coal rich inhuminites, Ezimo coal is a subbituminous C, low sulphur,high ash coal, and Inyi coal is a subbituminousC, low sulphur,high ash coal.
The ease of combustion of the coal samples in decreasingorder is Odagbo < Owukpa < Inyi < Ezimo < Amansiodo.While the ignition temperatures of the coals increase withdecreasing volatile matter content, their calorific values arestrongly correlated with the fixed carbon, elemental carbon,volatile matter, and hydrogen contents in decreasing order.
Benchmarking the properties of the five coal samplesagainst requirements of existing PC plants from aroundthe world shows that these coals meet most requirements.Deficiencies observed can be corrected through beneficiationand/or blending with coals of better properties. The five coalsamples analysed can be used for power generation usingcirculating fluidised bed combustion (CFBC) technology.CFBC technology was developed to burn low grade and/ordifficult-to-burn fuels and can therefore tolerate a widevariety of coals and particle sizes.
Competing Interests
The authors declare no conflict of interests.
References
[1] A. S. Sambo, B. Garba, I. H. Zarma, andM.M. Gaji, “Electricitygeneration and the present challenges in the Nigerian powersector,” 2009, http://www.energy.gov.ng/.
[2] World Coal Association, Coal Matters 3/Coal and Elec-tricity Generation, 2012, http://www.worldcoal.org/resources/wca-publications.
[3] International Energy Agency, “Fossil fuel-fired powergeneration: case studies of recently constructed coal- andgas-fired power plants,” 2007, http://www.iea.org/publications/freepublications/publication/fossil-fuel-fired-powergeneration.html.
[4] The Presidency. Federal Republic of Nigeria, “National energypolicy,” 2003, http://www.energy.gov.ng/.
[5] IEA, Key Energy Statistics 2012, IEA, 2012.[6] Ministry of Solid Minerals Development, Investment and Min-
ing Opportunities, Ministry of Solid Minerals Development,Abuja, Nigeria, 2008, https://www.pdffiller.com/250587217.
[7] Key world statistics 2013 IEA page 11 gas, page 13 oil, page 15coal.
[8] A. Nasir, S. N. Mohammed, and A. Mohammed, “Performanceof enugu sub-bituminous coal in fluidized bed combustor,” inProceedings of theWorld Congress on Engineering (WCE ’15), vol.2, pp. 1102–1106, London , UK, July 2015.
[9] A. Jauro and C. J. Chukwu, “Production of formed coke fromNigerian coals,” Petroleum&Coal, vol. 53, no. 1, pp. 22–25, 2011.
[10] W. I. A. Aderonpe, “Coal blending: application toNigerian coalsfor the iron and steel industries,” inNigerianCoal: AResource forEnergy and Investments, H. C. Okolo and M. C. Mkpadi, Eds.,pp. 125–137, RMRDC, Abuja, Nigeria, 1996.
[11] A. A. Afonja, “Production of metallurgical coke from non-coking coals,” in Nigerian Coal: A Resource for Energy andInvestments, H. C. Okolo and M. C. Mkpadi, Eds., pp. 89–105,RMRDC, Abuja, Nigeria, 1996.
[12] B. G. Miller, Coal EnergySytems, Elsevier, Academic Press, NewYork, NY, USA.
[13] A. M. Carpenter, S. Niksa, SRI International, D. H. Scott, and Z.Wu, Fundamentals of Coal Combustion, IEA Clean Coal Center,London, UK, 2007.
[14] J. Zactruba, Burning Coals in Power Plants—Calorific Value andMoisture, 2009.
[15] G. Marlair, C. Cwiklinski, and A. Tewarson, “An analysis ofsome practical methods for estimating heats of combustion infire safety studies,” in Proceedings of the International InterflamConference (Interflam ’99), Edinburgh, UK, June 1999.
[16] W. Boie, Wissenschaftliche Zeitschrift der TechnischenHochschule Dresden, vol. 2, 1952-1953.
[17] K. Annamalai, J. M. Sweeten, and S. C. Ramalingam, “Estima-tion of gross heating values of biomass fuels,”Transactions of theASAE, vol. 30, no. 4, pp. 1205–1208, 1987.
[18] S. J. Goidich, “Supercritical boiler options to match fuel com-bustion characteristics,” Indian Journal of Power and RiverValley Development, vol. 60, no. 5, p. 81, 2010.
[19] S. P. Marinov, L. Gonsalvesh, M. Stefanova et al., “Com-bustion behaviour of some biodesulphurized coals assessedby TGA/DTA,” 2009, http://research.sabanciuniv.edu/12435/1/Thermochimica Acta 75157.pdf.
[20] S. Kizgut, D. Cuhadaroglu, and I. Toroglu, “Thermogravimetriccharacterisation of Turkish bituminous coals for combustion,”Turkish Journal of Chemistry, vol. 27, pp. 521–528, 2003.
[21] R. Falcon and A. J. Ham, “The characterization of southernAfrican coals,” Journal of the Southern African Institute ofMining and Metallurgy, vol. 88, no. 5, pp. 145–161, 1988, https://www.yumpu.com/en/document/view/13417142/the-charac-teristics-of-southern-african-coals-saimm.
[22] J. C. Crelling, E. J. Hippo, B. A. Woerner, and D. P. WestJr., “Combustion characteristics of selected whole coals andmacerals,” Fuel, vol. 71, no. 2, pp. 151–158, 1992.
[23] M. M. Kibiya, Properties of some Nigerian coals for power gen-eration [M.S. thesis], Ahmadu Bello University, Zaria, Nigeria,2012.
[24] International Energy Agency, “Pulverized coal combustion,”2010, http://www.iea-coal.org.uk/site/2010/database-section/clean-coal-technologies.
[25] K. Burnard and S. Bhattacharya, “Power generation fromcoal: ongoing developments and outlook,” Information Paper,International Energy Agency, Paris, France, 2011.
[26] IEA Clean Coal Center, “Developments in circulating fluidisedbed combustion,” Profiles issue no. 13/7, 2013, http://www.iea-coal.org.uk/documents/83172/8753/Developments-in-cir-culating-fluidised-bed-combustion,-CCC/219.

International Journal of
AerospaceEngineeringHindawi Publishing Corporationhttp://www.hindawi.com Volume 2014
RoboticsJournal of
Hindawi Publishing Corporationhttp://www.hindawi.com Volume 2014
Hindawi Publishing Corporationhttp://www.hindawi.com Volume 2014
Active and Passive Electronic Components
Control Scienceand Engineering
Journal of
Hindawi Publishing Corporationhttp://www.hindawi.com Volume 2014
International Journal of
RotatingMachinery
Hindawi Publishing Corporationhttp://www.hindawi.com Volume 2014
Hindawi Publishing Corporation http://www.hindawi.com
Journal ofEngineeringVolume 2014
Submit your manuscripts athttp://www.hindawi.com
VLSI Design
Hindawi Publishing Corporationhttp://www.hindawi.com Volume 2014
Hindawi Publishing Corporationhttp://www.hindawi.com Volume 2014
Shock and Vibration
Hindawi Publishing Corporationhttp://www.hindawi.com Volume 2014
Civil EngineeringAdvances in
Acoustics and VibrationAdvances in
Hindawi Publishing Corporationhttp://www.hindawi.com Volume 2014
Hindawi Publishing Corporationhttp://www.hindawi.com Volume 2014
Electrical and Computer Engineering
Journal of
Advances inOptoElectronics
Hindawi Publishing Corporation http://www.hindawi.com
Volume 2014
The Scientific World JournalHindawi Publishing Corporation http://www.hindawi.com Volume 2014
SensorsJournal of
Hindawi Publishing Corporationhttp://www.hindawi.com Volume 2014
Modelling & Simulation in EngineeringHindawi Publishing Corporation http://www.hindawi.com Volume 2014
Hindawi Publishing Corporationhttp://www.hindawi.com Volume 2014
Chemical EngineeringInternational Journal of Antennas and
Propagation
International Journal of
Hindawi Publishing Corporationhttp://www.hindawi.com Volume 2014
Hindawi Publishing Corporationhttp://www.hindawi.com Volume 2014
Navigation and Observation
International Journal of
Hindawi Publishing Corporationhttp://www.hindawi.com Volume 2014
DistributedSensor Networks
International Journal of