research article...
TRANSCRIPT

Hindawi Publishing CorporationScience and Technology of Nuclear InstallationsVolume 2011, Article ID 862812, 9 pagesdoi:10.1155/2011/862812
Research Article
CFD Analysis of Passive Autocatalytic Recombiner
B. Gera, P. K. Sharma, R. K. Singh, and K. K. Vaze
Reactor Safety Division, Bhabha Atomic Research Centre, Trombay, Mumbai 400085, India
Correspondence should be addressed to B. Gera, [email protected]
Received 10 May 2011; Revised 27 July 2011; Accepted 27 July 2011
Academic Editor: Iztok Tiselj
Copyright © 2011 B. Gera et al. This is an open access article distributed under the Creative Commons Attribution License, whichpermits unrestricted use, distribution, and reproduction in any medium, provided the original work is properly cited.
In water-cooled nuclear power reactors, significant quantities of hydrogen could be produced following a postulated loss-of-coolant accident (LOCA) along with nonavailability of emergency core cooling system (ECCS). Passive autocatalytic recombiners(PAR) are implemented in the containment of water-cooled power reactors to mitigate the risk of hydrogen combustion. In thepresence of hydrogen with available oxygen, a catalytic reaction occurs spontaneously at the catalyst surfaces below conventionalignition concentration limits and temperature and even in presence of steam. Heat of reaction produces natural convection flowthrough the enclosure and promotes mixing in the containment. For the assessment of the PAR performance in terms of maximumtemperature of catalyst surface and outlet hydrogen concentration an in-house 3D CFD model has been developed. The code hasbeen used to study the mechanism of catalytic recombination and has been tested for two literature-quoted experiments.
1. Introduction
Within the nuclear industry, passive autocatalytic recom-biners (PARs) are installed in advanced water-cooled powerreactor containments as a combustible gas control systemduring severe accident conditions. During a severe accidentin a nuclear power plant, the high-temperature zirconiumfuel cladding can react with high-temperature steam to pro-duce hydrogen. Hydrogen thus generated has the potential tocause uncontrolled combustion in the containment building,which represents a threat to the integrity of the confine-ment due to pressure and temperature levels. Numeroustechniques have been developed for mitigating the potentialfor such accidents. A number of strategies for mitigatingthis potential have been adopted. Preinerting, postaccidentinerting, electrical recombiner, catalytic recombiner, igniters,and mixing by use of fans are several methods to mitigate thehydrogen hazards in nuclear containments. The one basedon passive catalytic recombination of H2 with O2 in airappears to be the most promising one [1]. Autocatalyticrecombiners are passive; that is, they are self-starting andself-feeding; they have no moving parts and require no exter-nal energization. They come into action spontaneously assoon as the hydrogen concentration begins to increase in theatmosphere. The gas mixture flows through the recombinerby natural convection, pushed by the gas heated as a result of
the reaction. These natural convective flow currents promotemixing of combustible gases in the containment.
Most commonly PARs use platinum or palladium as thecatalyst as they have the ability to adsorb hydrogen andoxygen. The recombination reaction occurs spontaneouslyat the catalyst surfaces, and the heat of reaction produces anatural convection flow through the enclosure. Water vaporas a product of reaction along with remaining hydrogen-air mixture moves upward because of buoyancy, and freshhydrogen-air mixture enters through the bottom inlet sec-tion. However, limited conversion capacities that may notbe sufficient at high hydrogen release rates or overheatingof the catalyst elements caused by strong reaction heatgeneration that may lead to unintended ignition of thegaseous mixture are known important issues for improvingtoday’s systems. However, the present lack of detailedknowledge with regard to the processes inside a passiveautocatalytic recombiner makes any optimization effortdifficult. A profound understanding of the processes insidea recombiner, such as reaction kinetics or heat and masstransfer requires detailed investigation of a small recombinersection under well-defined steady-state conditions. Undercontrolled and conservative conditions the function of therecombiner sheets is assessed by means of the temperaturemeasured on the catalyst sheets and the remaining hydrogenconcentration at the outlet of the test device.

2 Science and Technology of Nuclear Installations
Various experimental and theoretical investigations havebeen performed worldwide to evaluate and improve theperformance of PARs. Several analytical models have beendeveloped to study the recombiner behaviour. Avakian andBraillard [2] have developed an analytical model for catalyticrecombiner in a closed vessel and validated this with exper-imental data from KALI test facility. Tahara et al. [3] haveused the STAR-CD code for 3-D modeling of recombinationin Battelle Model Containment. Heitsch [4] has used theCFX code to study the detailed fluid dynamics for a separateeffect recombiner test used in Battelle Model Containment.Dharwadkar [5] and Prabhudharwadkar et al. [6] have usedthe FLUENT code for modeling hydrogen distribution alongwith catalytic recombination in Indian pressurised heavywater reactor (IPHWR) containment. Goyal [7] has alsodeveloped analytical model for predicting the performanceof the recombiner in HYMIS (hydrogen mitigation studies)test facility.
To provide optimal and reliable conditions and tounderstand the internal processes inside the recombiner,modeling the device in detail is required. This requirementsuggested making use of computational fluid dynamicstechniques to simulate hydrogen recombiners, aiming at amultidimensional analysis of the reaction zone with theuse of discretization of the relevant balance equations. Forthe analysis of the processes inside a passive autocatalyticrecombiner such as reaction kinetics or heat and masstransfer a 3D in-house CFD code has been developed. Thecode calculates the catalyst temperature and the concen-tration regression along the catalyst plates. The code hasbeen validated against REKO experiment [8] and has beenused to predict maximum catalyst surface temperature andrecombiner outlet hydrogen concentration. The code hasbeen utilized to simulate recombiner device used in the Gx-test series at the Battelle Model Containment (B-MC) [4] andREKO test facility [9]. The paper briefly describes some ofthe details of the experiments, salient features of the CFDnumerical model, and results of the studies carried out forthe recombiner device.
2. Physical Problem
CFD computations have been carried out for two recombinergeometries. These tests have been chosen because of theirsimplified geometry and easily available results from openliterature. The simplified geometry for the computation isshown in Figure 1. The dimensions used for the computationand other parameters are mentioned in next subsection.
2.1. REKO Test Facility. This test facility consists of a verticalflow channel with a rectangular cross section 46 mm wide(W) and 146 mm deep. The channel is 504 mm high (L1 +L2 + L3) with about 180 mm of channel length above thesheets (L3). For the current experiments four sheets made ofstainless steel and coated with wash coat/platinum catalystmaterial were arranged in parallel inside the flow channel.The plates used were 1.5 mm thick and 143 mm high (L2). Inthe experimental setup they were arranged in parallel with aseparation of 8.5 mm. The catalyst elements were exposed to
Adiabatic inert wall
Catalyst plates
Outlet
Inlet
W
L2
L3
L1
Figure 1: Simplified geometry for CFD computation.
a constant flow of a mixture of air, hydrogen, and/or steam.The hydrogen conversion efficiency was determined fromgas analysis measurements during experiments. The catalystsheets were equipped with thermocouples for measuringthe distribution of the catalyst temperature. Experimentshave been performed for different flow velocities (0.25, 0.50,and 0.80 m/s) at different inlet temperatures (298, 343, and383 K). Inlet hydrogen concentrations were varied between0.5 and 4% v/v. Few experiments were also conducted withsteam injection at inlet.
2.2. Gx-Test Series at the Battelle-Model Containment (B-MC). This test facility consists of a vertical flow channel witha rectangular cross section 116 mm wide (W) and 160 mmdeep. The channel is 1600 mm high (L1 + L2 + L3) withabout 740 mm of channel length above the sheets (L3) toenhance natural convection of the hot exhaust gas. Duringthe experiments 16 sheets made of stainless steel and coatedwith wash coat/platinum catalyst material were arrangedin parallel inside the flow channel. The plates used were0.5 mm thick and 150 mm high (L2). In the experimentalsetup they were arranged in parallel with a separation of10 mm. Temperatures, hydrogen mole fractions, and localvelocities were measured at inlet and exit of the recombinerbox. During the experiments steady-state conditions wereachieved and recorded for basic validation. Two conditionsunder equilibrium conditions were identified: one with ahydrogen mole fraction of 2.93% (Gx6, 30% v/v steam)and the other with a value of hydrogen mole fraction of8% (Gx8.1, 60% v/v steam). At the recombiner inlet regionmixture temperature, hydrogen mole fraction and velocitywere measured. At the outlet temperature and hydrogenmole fraction were recorded. But, along the sheets onlysurface temperature was measured at two locations.
Experiments at REKO test facility were carried out underforced flow condition and controlled injection. The inlethydrogen concentration and mixture temperature were lesscompared to realistic accident condition. The facility hasgenerated useful data for validation of CFD code sincedetailed measurement was possible. On the other hand, in

Science and Technology of Nuclear Installations 3
experiments at B-MC test facility recombiner was placedin containment atmosphere. The flow through recombinerwas due to natural convection, and steady states wereachieved. The inlet hydrogen concentration was high butmeasurements were made only at few locations.
3. Mathematical Model
Detailed analysis of passive autocatalytic recombiner isrequired to explore the interactions of reaction kinetics,temperature distribution, heat, and mass transfer as wellas thermal hydraulic phenomena. The investigation wasconcentrated on heat generation and its removal and thusmaximum temperature obtained by the catalyst plate. In thepresent CFD model, the interaction of reaction kinetics, heattransfer and associated fluid flow in the catalytic recombiner,and radiation heat loss from plates to surroundings hasbeen studied. The simplified geometry shown in Figure 1 hasbeen modeled by cartesian structured mesh. The governingmass, momentum, energy, and conservation equations forhydrogen, oxygen, nitrogen, and water vapor have beensolved in 3D space. The governing equations are as follows.
Continuity:
∇ · u = 0, (1)
Momentum:
(∇ · ρuu) = −∇p −[∇ ·
(τi, j)]
+ ρg, (2)
where
τi, j = −μ(∂uj
∂xi+∂ui∂xj
)
. (3)
Energy:
∇.(ρCpTu) = ∇ · (k∇T) + ST. (4)
Species:
∇ · (ρYiu) = ∇ · (ρD∇Yi
)+ Syi . (5)
Surface reaction takes places at catalytic plate. Thisreaction can be modeled by detailed reaction mechanism asmentioned by Deutschmann and another one proposed byKasemo both reported by [10]. The interest was focused onheat transfer not on the detailed chemical reaction. Thus thereaction has been modeled as a one-step reaction mechanismas proposed by [11]
H2 +12
O2 = H2O, (6)
with following reaction rate
Rate = 14∗ exp
(
−14.9∗ 106
RuT
)
∗ [H2] kmol/m2/s. (7)
These reaction mechanisms are specific to experiment.Above reaction rate which is valid for temperature rangesfrom 450 K to 1200 K and is suitable for present work. Theabove reaction rate has been modelled as the additionalsource term for energy and water vapor and sinks termfor hydrogen and oxygen transport equation. All the sourceor sink terms were applied in the very first fluid celladjacent to solid plate. Flow speeds are in the range of0.25–0.8 m/s resulting in Reynolds number (VL/ν) rangingfrom 2000 to 6400. The characteristic length is the lengthof the reactive plate. The corresponding Grashof number(L3βgΔT)/ν2 as a characteristic of free convection heattransfer is approximately 6.0 × 10⁷. Both values are verylow and suggest that the flow is essentially laminar. Thehigh energy output from the hydrogen oxygen reactionresults in a considerable heat transmission from surfaces byconvection and radiation to environment. Heat transfer byradiation from plate to surrounding has not been modelledin the present work. However to model radiation losses afixed fraction of energy, that is, 30%, has been consideredas lost to surroundings (recombiner box and inlet andoutlet boundary) from catalyst plates. During simulationfor REKO test facility, at the inlet known value of velocity,temperature and species mass fraction have been applied.Outflow boundary condition was used at the outlet whilefor Gx-test series simulation inlet and outlet were specifiedas atmospheric pressure boundaries where flow rate wascalculated based on mass conservation. Pressure boundariesimpose zero normal gradients on temperature and speciesmass fractions at outlet. At the inlet region the measuredinlet values of temperature and species mass fractions werespecified. Other boundary conditions were same for boththe simulations. Reacting plates have been modelled asconducting walls to model the conjugate heat transfer insolid plates. It was also assumed that water produced bythe oxidation reaction is always remaining in vapour form.Hence condensation on the walls has not been modelled.The external wall has been modelled as adiabatic no-slipwall. The governing equations were discretized using FiniteVolume Method. Equations were solved for 3D configurationunder steady-state condition. The mixture density has beenmodeled as ideal gas law. A uniform grid was used inall the direction, and staggered scheme of solution wasadopted in which fluid velocities were calculated at cellface, and scalars such as pressure, temperature, and speciesmass fraction were calculated at cell center. The governingequations were iteratively solved with Gauss Seidel methodwith Patankar’s SIMPLE algorithm [12]. Power law schemewas utilized as differencing scheme for the convective termsfor all equations, whereas the central difference scheme wasused for the diffusive terms.
4. Results and Discussion
In this context of detailed analysis of PAR the maximumtemperature of catalyst surface and outlet hydrogen concen-tration has been evaluated. Before performing the parametricstudy, a grid size sensitivity study was carried out in orderto obtain the mesh size for mesh-independent results. The
4 Science and Technology of Nuclear Installations
400 500 600 700 800 9000
20
40
60
80
100
120
140
60× 126× 690× 168× 6
120× 252× 12180× 378× 12
Hei
ght
alon
gth
ere
acti
onsh
eet
(mm
)
Temperature (K)
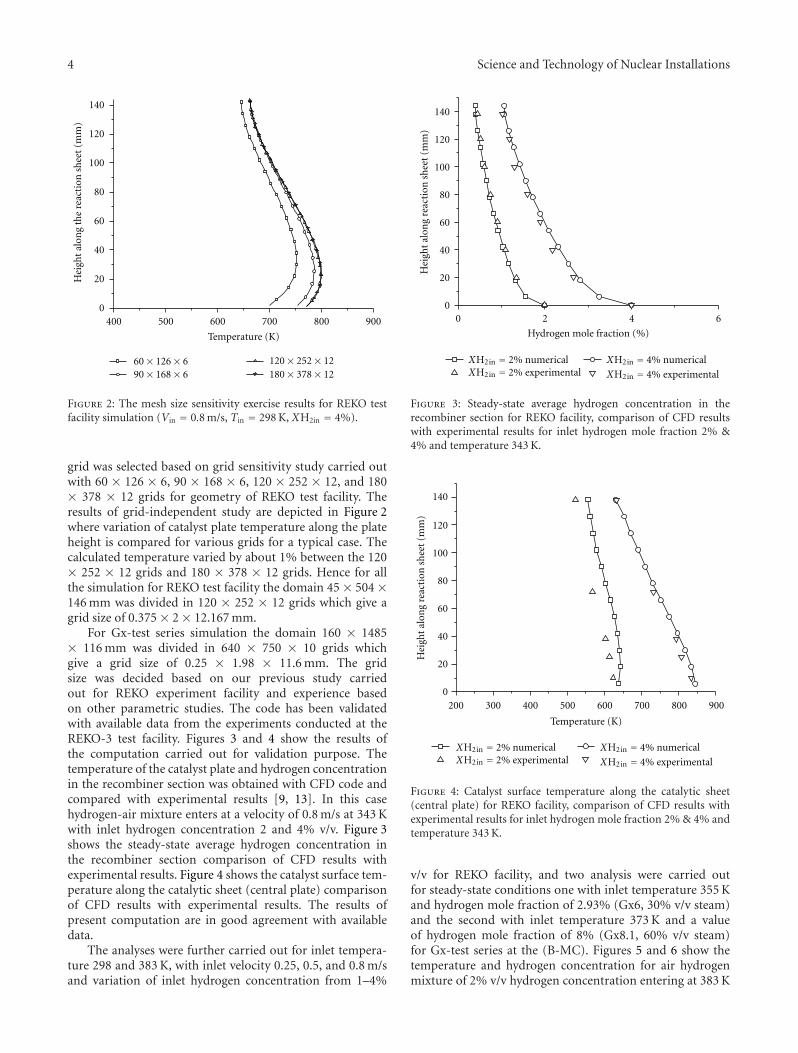
Figure 2: The mesh size sensitivity exercise results for REKO testfacility simulation (Vin = 0.8 m/s, Tin = 298 K, XH2in = 4%).
grid was selected based on grid sensitivity study carried outwith 60 × 126 × 6, 90 × 168 × 6, 120 × 252 × 12, and 180× 378 × 12 grids for geometry of REKO test facility. Theresults of grid-independent study are depicted in Figure 2where variation of catalyst plate temperature along the plateheight is compared for various grids for a typical case. Thecalculated temperature varied by about 1% between the 120× 252 × 12 grids and 180 × 378 × 12 grids. Hence for allthe simulation for REKO test facility the domain 45 × 504 ×146 mm was divided in 120 × 252 × 12 grids which give agrid size of 0.375 × 2 × 12.167 mm.
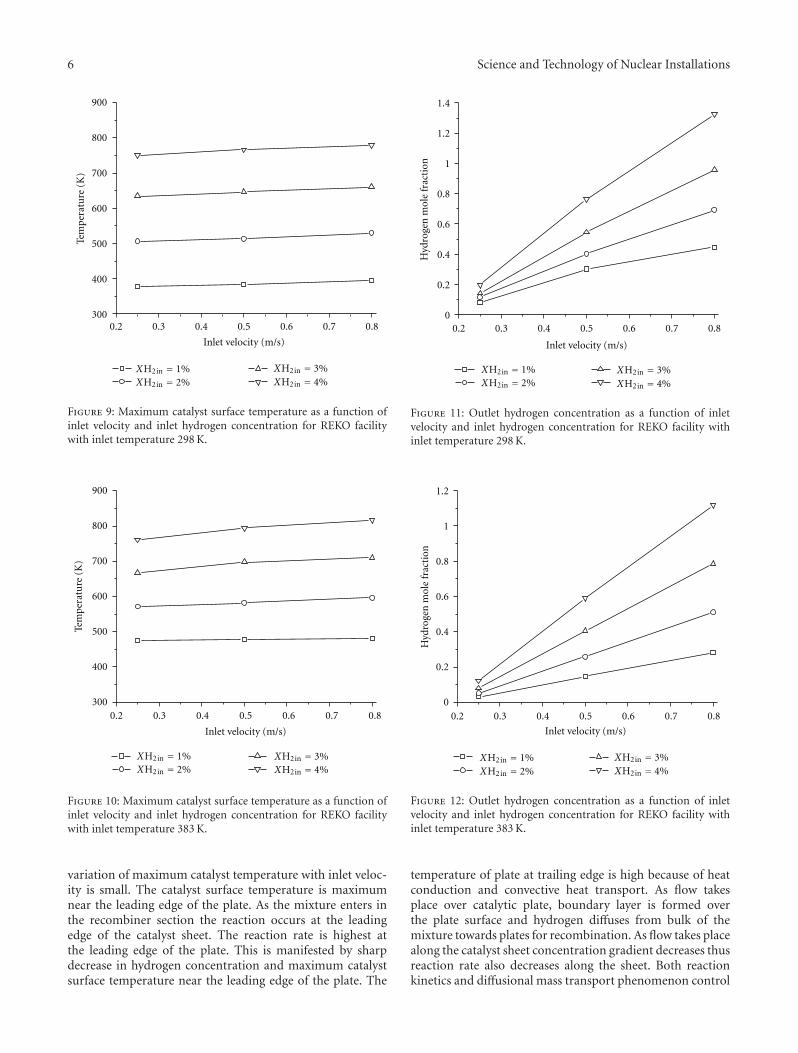
For Gx-test series simulation the domain 160 × 1485× 116 mm was divided in 640 × 750 × 10 grids whichgive a grid size of 0.25 × 1.98 × 11.6 mm. The gridsize was decided based on our previous study carriedout for REKO experiment facility and experience basedon other parametric studies. The code has been validatedwith available data from the experiments conducted at theREKO-3 test facility. Figures 3 and 4 show the results ofthe computation carried out for validation purpose. Thetemperature of the catalyst plate and hydrogen concentrationin the recombiner section was obtained with CFD code andcompared with experimental results [9, 13]. In this casehydrogen-air mixture enters at a velocity of 0.8 m/s at 343 Kwith inlet hydrogen concentration 2 and 4% v/v. Figure 3shows the steady-state average hydrogen concentration inthe recombiner section comparison of CFD results withexperimental results. Figure 4 shows the catalyst surface tem-perature along the catalytic sheet (central plate) comparisonof CFD results with experimental results. The results ofpresent computation are in good agreement with availabledata.
The analyses were further carried out for inlet tempera-ture 298 and 383 K, with inlet velocity 0.25, 0.5, and 0.8 m/sand variation of inlet hydrogen concentration from 1–4%
0 2 4 60
20
40
60
80
100
120
140
XH2in = 2% numericalXH2in = 2% experimental
XH2in = 4% numerical
XH2in = 4% experimental
Hei
ght
alon
gre
acti
onsh
eet
(mm
)
Hydrogen mole fraction (%)
Figure 3: Steady-state average hydrogen concentration in therecombiner section for REKO facility, comparison of CFD resultswith experimental results for inlet hydrogen mole fraction 2% &4% and temperature 343 K.
200 300 400 500 600 700 800 9000
20
40
60
80
100
120
140
Temperature (K)
Hei
ght
alon
gre
acti
onsh
eet
(mm
)
XH2in = 2% numericalXH2in = 2% experimental
XH2in = 4% numerical
XH2in = 4% experimental
Figure 4: Catalyst surface temperature along the catalytic sheet(central plate) for REKO facility, comparison of CFD results withexperimental results for inlet hydrogen mole fraction 2% & 4% andtemperature 343 K.
v/v for REKO facility, and two analysis were carried outfor steady-state conditions one with inlet temperature 355 Kand hydrogen mole fraction of 2.93% (Gx6, 30% v/v steam)and the second with inlet temperature 373 K and a valueof hydrogen mole fraction of 8% (Gx8.1, 60% v/v steam)for Gx-test series at the (B-MC). Figures 5 and 6 show thetemperature and hydrogen concentration for air hydrogenmixture of 2% v/v hydrogen concentration entering at 383 K

Science and Technology of Nuclear Installations 5
620
600
580
560
540
520
500
480
460
440
420
400
Tem
pera
ture
(K
)
Figure 5: Temperature contour for simulation performed for REKOfacility for inlet hydrogen mole fraction 2% and temperature 383 K.
0.019
0.018
0.017
0.016
0.015
0.014
0.013
0.012
0.011
0.01
0.009
0.008
0.007
0.006
0.005
0.004
0.003
0.002
0.001
Mol
e fr
acti
on
Figure 6: Hydrogen mole fraction contour for simulation per-formed for REKO facility for inlet hydrogen mole fraction 2% andtemperature 383 K.
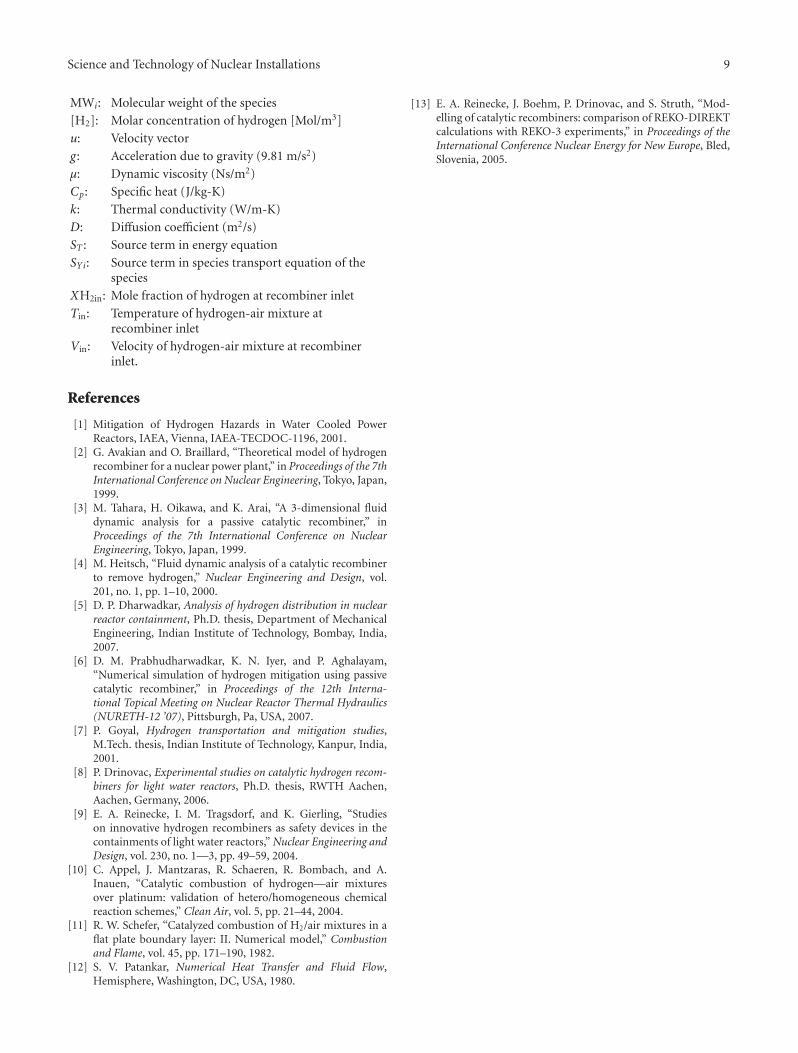
for REKO test facility. Figures 7 and 8 show the numericalresults for Gx-6 experiment. Figures 9 and 10 depict themaximum catalyst surface temperature as a function of inletvelocity at different inlet hydrogen concentration for inletmixture temperature 298 and 383 K, respectively, for REKOtest facility. As the velocity increases, reaction rate increases
640
620
600
580
560
540
520
500
480
380
360
460
440
420
400
Tem
pera
ture
(K
)
Figure 7: Temperature contour for simulation performed for Gx-test series (Gx-6).
0.018
0.016
0.014
0.012
0.01
0.008
0.006
0.004
0.002
Mol
e fr
acti
on
0
0.03
0.028
0.026
0.024
0.022
0.02
Figure 8: Hydrogen mole fraction contour for simulation per-formed for Gx-test series (Gx-6).
as more mass enters into the recombiner section as a resulttemperature of catalytic surface increases. Inlet temperatureof mixture also plays some role, and reaction rate is moreas inlet mixture temperature is high; correspondingly thecatalyst surface temperature is high as the inlet temperatureincreases from 298 to 383 K. However in both the cases
6 Science and Technology of Nuclear Installations
0.2 0.3 0.4 0.5 0.6 0.7 0.8300
400
500
600
700
800
900
Tem
pera
ture
(K)
Inlet velocity (m/s)
XH2in = 1%XH2in = 2%
XH2in = 3%XH2in = 4%
Figure 9: Maximum catalyst surface temperature as a function ofinlet velocity and inlet hydrogen concentration for REKO facilitywith inlet temperature 298 K.
0.2 0.3 0.4 0.5 0.6 0.7 0.8300
400
500
600
700
800
900
XH2in = 1%XH2in = 2%
XH2in = 3%XH2in = 4%
Tem
pera
ture
(K)
Inlet velocity (m/s)
Figure 10: Maximum catalyst surface temperature as a function ofinlet velocity and inlet hydrogen concentration for REKO facilitywith inlet temperature 383 K.
variation of maximum catalyst temperature with inlet veloc-ity is small. The catalyst surface temperature is maximumnear the leading edge of the plate. As the mixture enters inthe recombiner section the reaction occurs at the leadingedge of the catalyst sheet. The reaction rate is highest atthe leading edge of the plate. This is manifested by sharpdecrease in hydrogen concentration and maximum catalystsurface temperature near the leading edge of the plate. The
0.2 0.3 0.4 0.5 0.6 0.7 0.80
0.2
0.4
0.6
0.8
1
1.2
1.4
XH2in = 1%XH2in = 2%
XH2in = 3%XH2in = 4%
Hyd
roge
nm
ole
frac
tion
Inlet velocity (m/s)
Figure 11: Outlet hydrogen concentration as a function of inletvelocity and inlet hydrogen concentration for REKO facility withinlet temperature 298 K.
0.2 0.3 0.4 0.5 0.6 0.7 0.80
0.2
0.4
0.6
0.8
1
1.2
XH2in = 1%XH2in = 2%
XH2in = 3%XH2in = 4%
Hyd
roge
nm
ole
frac
tion
Inlet velocity (m/s)
Figure 12: Outlet hydrogen concentration as a function of inletvelocity and inlet hydrogen concentration for REKO facility withinlet temperature 383 K.
temperature of plate at trailing edge is high because of heatconduction and convective heat transport. As flow takesplace over catalytic plate, boundary layer is formed overthe plate surface and hydrogen diffuses from bulk of themixture towards plates for recombination. As flow takes placealong the catalyst sheet concentration gradient decreases thusreaction rate also decreases along the sheet. Both reactionkinetics and diffusional mass transport phenomenon control

Science and Technology of Nuclear Installations 7
0
0.02
0.04
0.06
0.08
0.1
0.12
0.14
0.16
0 2 4 6 8
Hei
ght
alon
gre
acti
onsh
eet
(m)
Hydrogen mole fraction (%)
Gx6Gx8.1
Figure 13: Steady-state average hydrogen concentration in recom-biner for Gx test series.
0
0.02
0.04
0.06
0.08
0.1
0.12
0.14
0.16
Hei
ght
alon
gre
acti
onsh
eet
(m)
400 500 600 700 800 900 1000
Temperature (K)
Gx6Gx8.1
Figure 14: Catalyst surface temperatures along the catalytic sheetfor Gx test series.
the recombination. Figures 11 and 12 depict the outlethydrogen concentration as a function of inlet velocity atdifferent inlet hydrogen concentration for inlet mixturetemperature 298 and 383 K, respectively, for REKO testfacility. The outlet hydrogen concentration depends stronglyon inlet speed, lowering the speed the mixture remainin the recombiner for more duration; hence hydrogenconsumption is more. Outlet hydrogen concentration is lowas the inlet temperature increases from 298 to 383 K. At lowspeed outlet hydrogen concentration becomes almost zero atboth the inlet temperature. These results are consistent with
Tem
pera
ture
(K)
580
560
540
520
500
480
460
440
420
400
380
360
(a)
Mol
efr
acti
on
0.028
0.026
0.024
0.022
0.02
0.018
0.016
0.014
0.012
0.01
0.008
0.006
0.004
0.002
(b)
Figure 15: (a) Temperature contour and (b) hydrogen molefraction contour zoomed view near catalyst plate for first steady-state condition (Gx-6).
the results obtained by Reinecke et al. [13]. In the centralchannels reaction takes place on both side of the channel,and boundary layer is formed and merges after a particularheight. While in side channels since no reaction occurs atrecombiner wall the boundary layer does not merge in thischannel. The hydrogen removal rate is higher in centralchannel while removal rate is lower in side channel; this isclear from the contour plot of hydrogen mole fraction whichshows that hydrogen mole fraction is higher near catalyticrecombiner box wall. Similarly temperature of the plates incentral channel is slightly higher than plates placed nearrecombiner box wall.
Figure 13 shows the steady-state average hydrogen con-centration in recombiner along the height for the analysiscarried out for Gx-test series. Figure 14 shows the steady-state catalyst surface temperature along the height for Gx-test series. Figures 15(a) and 15(b) show the zoomed viewof temperature and hydrogen concentration near catalystplate for first steady-state condition (Gx-6). Similarly Figures16(a) and 16(b) show the zoomed view of temperatureand hydrogen concentration near catalyst plate for secondsteady-state condition (Gx-8.1). The shape of hydrogenconcentration boundary layer is different in both the cases.For Gx-6 experiment bulk hydrogen concentration is lowgiving a small driving force for hydrogen to move towardscatalyst plate as compared to Gx-8.1 experiment where bulkhydrogen concentration is high. As a result of this thicknessof hydrogen concentration boundary layer is more alongthe reaction sheet for Gx-6 experiment as compared to Gx-8.1 experiment. This program has been utilized to predict

8 Science and Technology of Nuclear Installations
Table 1: Comparison of results for first steady-state condition (At inlet mixture temperature 355 K, mole fraction of hydrogen 2.93%, andmole fraction of steam 30% steam) for Gx-test series.
Experiment Reported CFX results [8] Present results
Maximum surface temperature (K) 632 K 620 K 584 K
Outlet gas temperature (K) 513 K 502 K 470 K
Outlet hydrogen mole fraction (%) 0.4 0.4 0.44
Table 2: Comparison of results for second steady-state condition (At inlet mixture temperature 373 K, mole fraction of hydrogen 8%, andmole fraction of steam 60% steam) for Gx-test series.
Experiment Reported CFX results [8] Present results
Maximum surface temperature (K) 750 K 965 K 973 K
Outlet gas temperature (K) 635 K 735 K 723 K
Outlet hydrogen mole fraction (%) 1.5 0.6 1.8
the maximum catalyst surface temperature, gas temperatureat the recombiner outlet, and hydrogen concentration atrecombiner outlet for both the cases of Gx-test series. Thepresent results and comparison with reported experimentand numerical results are tabulated in Tables 1 and 2. Inthe simulation there is a good match with experimentalvalues. The situation with the lower hydrogen mole fraction(Gx6) is well matched. With 8% of mole fraction there issome overestimation of the maximum catalyst temperaturethan measured. For Gx-6 experiment since hydrogen con-centration and inlet temperature is less compared to Gx-8.1, a comparatively less heat is generated which causes lessflow through the recombiner section. The mixture remainsfor more duration inside the recombiner section; henceefficient conversion of hydrogen takes place. But in Gx-8.1 experiment because of high hydrogen concentrationthe temperature as well as the velocity of mixture remainshigh in recombiner section. Higher mixture velocity reducesthe residual time for mixture remains in the recombiner;hence hydrogen concentration at the outlet is more. Above8% v/v inlet hydrogen concentration the catalyst surfacetemperature reaches to 833 K which is hydrogen autoignitiontemperature; hence some passive cooling of reaction sheetis required to enable such type of recombiner to use above8% v/v hydrogen concentration. Research is going on forsuch type of recombiner design worldwide [9]. Thus detailedanalysis gives more useful results as compared to lumpedparameters codes which give a single uniform temperaturefor the catalyst sheet.
5. Conclusion
3D CFD analysis of PAR has been carried out for the lite-rature-quoted experimental geometries. The CFD model hasbeen validated with the data from the REKO test facility andGx test series experiment and given satisfactory prediction.The present analytical model can be used for a plate-typerecombiner of any chosen dimensions for predicting itsbehaviour. The only uncertainty involved in the presentanalytical model may be in terms of representation of thereaction rate by the chosen Arrhenius equation. These resultsrepresent the global behaviour of the recombiner where it
Tem
per
atu
re(K
)
950
900
850
800
750
700
650
600
550
500
450
400
(a)
Mol
efr
acti
on
0.075
0.07
0.065
0.06
0.055
0.05
0.045
0.04
0.035
0.03
0.025
0.02
0.015
0.01
0.005
(b)
Figure 16: (a) Temperature contour and (b) hydrogen molefraction contour zoomed view near catalyst plate second steady statecondition (Gx-8.1).
is assumed that the reaction is occurring over the wholesurface. In actual case the reaction is heterogeneous in natureand will be at specific sites. Modeling the detailed reactionmechanism for the recombination process can be consideredin future.
Nomenclature
ρ: Density of mixture (kg/m3)
p: Absolute pressure of the mixture (Pa)
T : Absolute temperature of the mixture (K)
Ru: Universal gas constant (8314 J/kmol K)
Yi: Mass fraction of the species
Science and Technology of Nuclear Installations 9
MWi: Molecular weight of the species
[H2]: Molar concentration of hydrogen [Mol/m3]
u: Velocity vector
g: Acceleration due to gravity (9.81 m/s2)
μ: Dynamic viscosity (Ns/m2)
Cp: Specific heat (J/kg-K)
k: Thermal conductivity (W/m-K)
D: Diffusion coefficient (m2/s)
ST : Source term in energy equation
SYi: Source term in species transport equation of thespecies
XH2in: Mole fraction of hydrogen at recombiner inlet
Tin: Temperature of hydrogen-air mixture atrecombiner inlet
Vin: Velocity of hydrogen-air mixture at recombinerinlet.
References
[1] Mitigation of Hydrogen Hazards in Water Cooled PowerReactors, IAEA, Vienna, IAEA-TECDOC-1196, 2001.
[2] G. Avakian and O. Braillard, “Theoretical model of hydrogenrecombiner for a nuclear power plant,” in Proceedings of the 7thInternational Conference on Nuclear Engineering, Tokyo, Japan,1999.
[3] M. Tahara, H. Oikawa, and K. Arai, “A 3-dimensional fluiddynamic analysis for a passive catalytic recombiner,” inProceedings of the 7th International Conference on NuclearEngineering, Tokyo, Japan, 1999.
[4] M. Heitsch, “Fluid dynamic analysis of a catalytic recombinerto remove hydrogen,” Nuclear Engineering and Design, vol.201, no. 1, pp. 1–10, 2000.
[5] D. P. Dharwadkar, Analysis of hydrogen distribution in nuclearreactor containment, Ph.D. thesis, Department of MechanicalEngineering, Indian Institute of Technology, Bombay, India,2007.
[6] D. M. Prabhudharwadkar, K. N. Iyer, and P. Aghalayam,“Numerical simulation of hydrogen mitigation using passivecatalytic recombiner,” in Proceedings of the 12th Interna-tional Topical Meeting on Nuclear Reactor Thermal Hydraulics(NURETH-12 ’07), Pittsburgh, Pa, USA, 2007.
[7] P. Goyal, Hydrogen transportation and mitigation studies,M.Tech. thesis, Indian Institute of Technology, Kanpur, India,2001.
[8] P. Drinovac, Experimental studies on catalytic hydrogen recom-biners for light water reactors, Ph.D. thesis, RWTH Aachen,Aachen, Germany, 2006.
[9] E. A. Reinecke, I. M. Tragsdorf, and K. Gierling, “Studieson innovative hydrogen recombiners as safety devices in thecontainments of light water reactors,” Nuclear Engineering andDesign, vol. 230, no. 1—3, pp. 49–59, 2004.
[10] C. Appel, J. Mantzaras, R. Schaeren, R. Bombach, and A.Inauen, “Catalytic combustion of hydrogen—air mixturesover platinum: validation of hetero/homogeneous chemicalreaction schemes,” Clean Air, vol. 5, pp. 21–44, 2004.
[11] R. W. Schefer, “Catalyzed combustion of H2/air mixtures in aflat plate boundary layer: II. Numerical model,” Combustionand Flame, vol. 45, pp. 171–190, 1982.
[12] S. V. Patankar, Numerical Heat Transfer and Fluid Flow,Hemisphere, Washington, DC, USA, 1980.
[13] E. A. Reinecke, J. Boehm, P. Drinovac, and S. Struth, “Mod-elling of catalytic recombiners: comparison of REKO-DIREKTcalculations with REKO-3 experiments,” in Proceedings of theInternational Conference Nuclear Energy for New Europe, Bled,Slovenia, 2005.

TribologyAdvances in
Hindawi Publishing Corporationhttp://www.hindawi.com Volume 2014
International Journal of
AerospaceEngineeringHindawi Publishing Corporationhttp://www.hindawi.com Volume 2010
FuelsJournal of
Hindawi Publishing Corporationhttp://www.hindawi.com Volume 2014
Journal ofPetroleum Engineering
Hindawi Publishing Corporationhttp://www.hindawi.com Volume 2014
Industrial EngineeringJournal of
Hindawi Publishing Corporationhttp://www.hindawi.com Volume 2014
Power ElectronicsHindawi Publishing Corporationhttp://www.hindawi.com Volume 2014
Advances in
CombustionJournal of
Hindawi Publishing Corporationhttp://www.hindawi.com Volume 2014
Journal of
Hindawi Publishing Corporationhttp://www.hindawi.com Volume 2014
Renewable Energy
Submit your manuscripts athttp://www.hindawi.com
Hindawi Publishing Corporationhttp://www.hindawi.com Volume 2014
StructuresJournal of
International Journal of
RotatingMachinery
Hindawi Publishing Corporationhttp://www.hindawi.com Volume 2014
EnergyJournal of
Hindawi Publishing Corporationhttp://www.hindawi.com Volume 2014
Hindawi Publishing Corporation http://www.hindawi.com
Journal ofEngineeringVolume 2014
Hindawi Publishing Corporation http://www.hindawi.com Volume 2014
International Journal ofPhotoenergy
Hindawi Publishing Corporationhttp://www.hindawi.com Volume 2014
Nuclear InstallationsScience and Technology of
Hindawi Publishing Corporationhttp://www.hindawi.com Volume 2014
Solar EnergyJournal of
Hindawi Publishing Corporationhttp://www.hindawi.com Volume 2014
Wind EnergyJournal of
Hindawi Publishing Corporationhttp://www.hindawi.com Volume 2014
Nuclear EnergyInternational Journal of
Hindawi Publishing Corporationhttp://www.hindawi.com Volume 2014
High Energy PhysicsAdvances in
The Scientific World JournalHindawi Publishing Corporation http://www.hindawi.com Volume 2014