research article catching up, forging ahead or falling …€¦ · · 2015-10-26catching up,...
TRANSCRIPT

RESEARCH ARTICLE
Catching up, forging ahead or falling behind? Central and EasternEuropean development in 1990�2005
Marek Tiits*, Rainer Kattel, Tarmo Kalvet, and Dorel Tamm
Institute of Baltic Studies, Tartu, Estonia
(Received 15 October 2007; final version received 2 November 2007)
This paper aims to assess the economic development and development policies in
the Central and Eastern European (CEE) countries in 1990�2005, from the
collapse of the USSR to the enlargement of the European Union. A great number
of authors have generally seen the transition as a very positive process. They have
concluded that the reform policies focusing on macroeconomic and price stability
have been the key to success for CEE economies. A reliable economic
environment is, of course, instrumental for longer-term economic success, as
exemplified by the prolonged crisis in most of the former Soviet Union. Our
analysis of the economic development and competitive advantages in the region,
however, leads to the conclusion that the specific approach to transition that the
Central and Eastern European countries followed came at a rather high cost.
Comparative neglect and weakness of a set of policies crucial for longer-term
development, such as science, technology and innovation policies, has led to
deterioration in the last decade rather than the strengthening of the competitive
advantages of Central and Eastern European economies. Furthermore, we argue
that, in most cases, CEE countries have unfortunately overlooked or misjudged a
number of development challenges, and have thus implemented policies that have
generated growth at the cost of rapidly increasing risks. This is how the financial
fragility of several Central and Eastern European countries has recently increased
drastically, and the region seems to have virtually arrived at the brink of economic
collapse. Since the CEE countries joined the European Union, the CEE
governments have gradually moved towards acquiring a more active role in
economic development. These policies need, however, to be strengthened
considerably and reinforced by macroeconomic policies that curb current
excessive dependence on foreign-financed growth.
Keywords: Central and Eastern Europe; industrial dynamics; innovation policy;
financial fragility
Introduction
Economic development in the Central and Eastern European countries (CEE)1
during the last decade is seen as a largely positive, if not very positive, process by
both academic and policy circles. To use terms from Abramovitz’s (1986) framework,
CEE countries are seen not only to catch up, but possibly even to forge ahead. The
*Corresponding author. E-mail: [email protected]
ISSN 1351-1610 print/ISSN 1469-8412 online
# 2008 Taylor & Francis
DOI: 10.1080/13511610802002254
http://www.informaworld.com
Innovation: The European Journal of Social Science Research
Vol. 21, No. 1, March 2008, 65�85
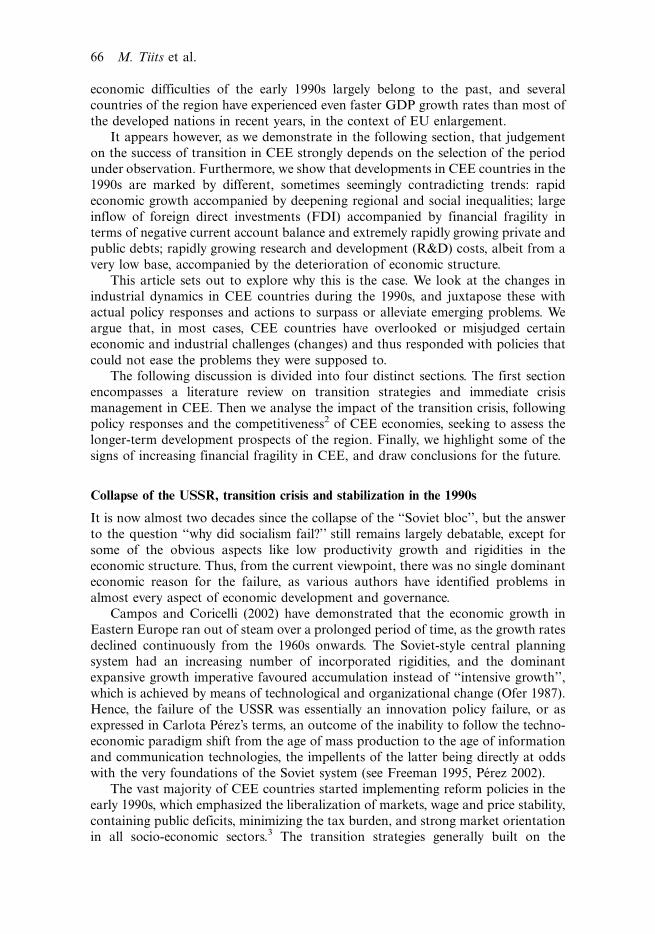
economic difficulties of the early 1990s largely belong to the past, and several
countries of the region have experienced even faster GDP growth rates than most of
the developed nations in recent years, in the context of EU enlargement.
It appears however, as we demonstrate in the following section, that judgement
on the success of transition in CEE strongly depends on the selection of the period
under observation. Furthermore, we show that developments in CEE countries in the
1990s are marked by different, sometimes seemingly contradicting trends: rapid
economic growth accompanied by deepening regional and social inequalities; large
inflow of foreign direct investments (FDI) accompanied by financial fragility in
terms of negative current account balance and extremely rapidly growing private and
public debts; rapidly growing research and development (R&D) costs, albeit from a
very low base, accompanied by the deterioration of economic structure.
This article sets out to explore why this is the case. We look at the changes in
industrial dynamics in CEE countries during the 1990s, and juxtapose these with
actual policy responses and actions to surpass or alleviate emerging problems. We
argue that, in most cases, CEE countries have overlooked or misjudged certain
economic and industrial challenges (changes) and thus responded with policies that
could not ease the problems they were supposed to.
The following discussion is divided into four distinct sections. The first section
encompasses a literature review on transition strategies and immediate crisis
management in CEE. Then we analyse the impact of the transition crisis, following
policy responses and the competitiveness2 of CEE economies, seeking to assess the
longer-term development prospects of the region. Finally, we highlight some of the
signs of increasing financial fragility in CEE, and draw conclusions for the future.
Collapse of the USSR, transition crisis and stabilization in the 1990s
It is now almost two decades since the collapse of the ‘‘Soviet bloc’’, but the answer
to the question ‘‘why did socialism fail?’’ still remains largely debatable, except for
some of the obvious aspects like low productivity growth and rigidities in the
economic structure. Thus, from the current viewpoint, there was no single dominant
economic reason for the failure, as various authors have identified problems in
almost every aspect of economic development and governance.
Campos and Coricelli (2002) have demonstrated that the economic growth in
Eastern Europe ran out of steam over a prolonged period of time, as the growth rates
declined continuously from the 1960s onwards. The Soviet-style central planning
system had an increasing number of incorporated rigidities, and the dominant
expansive growth imperative favoured accumulation instead of ‘‘intensive growth’’,
which is achieved by means of technological and organizational change (Ofer 1987).
Hence, the failure of the USSR was essentially an innovation policy failure, or as
expressed in Carlota Perez’s terms, an outcome of the inability to follow the techno-
economic paradigm shift from the age of mass production to the age of information
and communication technologies, the impellents of the latter being directly at odds
with the very foundations of the Soviet system (see Freeman 1995, Perez 2002).
The vast majority of CEE countries started implementing reform policies in the
early 1990s, which emphasized the liberalization of markets, wage and price stability,
containing public deficits, minimizing the tax burden, and strong market orientation
in all socio-economic sectors.3 The transition strategies generally built on the
66 M. Tiits et al.

assumption that state ownership as such is always unwanted, since the private sector
would in each and every case be capable of demonstrating productivity levels
superior to those of the public sector. Rapidly handing over as much decision-
making power as possible to the private sector therefore became the focal point of
the reforms. Liberalization as an elegant antithesis of an all-embracing state
controlled system was met with great enthusiasm. Liberalization of prices,
dismantling of trade barriers and elimination of pervasive state intervention in the
early 1990s, which was expected to result in large efficiency gains, brought instead the
collapse of outputs and an unexpectedly harsh and prolonged crisis, to the surprise
of many.
In the early 1990s, most CEE countries saw their GDP per capita drop one-third
or more in real terms. With Hungary as a notable exception, the rest of CEE
regained their 1990 GDP per capita levels only 10 years later, i.e. at the turn of the
century. The developments in CEE, nonetheless, still represent a relative success,
considering the even more prolonged transition crisis in most of the former USSR
(newly independent states, NIS). Even by 2005, countries like Russia and Ukraine
had not regained their 1990 level of GDP per capita, and some of the NIS, like
Moldova, are still below 50% of their 1990 GPD per capita.4 Eventually, the 1990s
proved a ‘‘lost decade’’ for most of the CEE countries in terms of GDP per capita
(Figure 1).
In their initial analysis, some observers attempted to explain the collapse of
outputs with a simple Keynesian recession, driven by a fall in consumer demand (see,
e.g., Blanchard et al. 1991, Berg and Sachs 1992). Calvo and Coricelli (1992) were
probably the first to argue that it was not, given the timing and magnitude of the
economic collapse, a Keynesian recession, but a ‘‘trade implosion’’ � a phenomenon
50
75
100
125
150
1990 1991 1992 1993 1994 1995 1996 1997 1998 1999 2000 2001 2002 2003 2004 2005
Belarus Bulgaria Czech Republic Estonia Hungary Latvia Lithuania Poland Romania Russian Federation Slovak Republic Slovenia
Figure 1. GDP per capita in CEE and NIS countries 1990�2005 (constant 2000 US$),
1990�100. Source: World Bank (2007a).
Innovation: The European Journal of Social Science Research 67

ascribed to the break-up of the old system of coordination of production and
exchange. This, in turn, gave rise to a theory of optimal (speed of) transition (see,
e.g., Aghion and Blanchard 1994).
For planning and management purposes, a lot of Soviet industry developed into
large complexes in a specific geographical area, forming something akin to the
phenomena which Alfred Marshall called industrial districts (Marshall, 1890), or
what we today call regional innovation systems (Cooke 1992) or clusters (Porter
1990). If one produced carpets, one often also produced machinery for carpet
production. Such very strong vertical integration meant that the most successful and
progressive Soviet companies often built their own ICT laboratories (however
rudimentary) or had already invested in early biotechnologies in the late 1980s. This
extreme vertical integration created huge interdependencies between different actors
within the system. As a consequence, collapse of one part of the value chain brought
down the entire chain.
We see transition, for the purposes of the following, as a process of creative
destruction (Schumpeter 1942, Drechsler et al. 2006) in which an old production
system is about to be replaced with a new, more knowledge-intensive, and thereby
also more productive one. In this process, liberalization clearly contributed to the
destruction of old, often rather rigid political, economic and social structures.
Creation of new competitive strengths has, however, proved much more difficult in
CEE than expected. We hold the view that various policies aiming at macroeconomic
stabilization, such as controlling inflation or introducing currency boards, are not
likely to be the root cause of the prolonged crisis. Credit contraction during the
stabilization process may have made the impact of the crisis even harsher, but did not
cause it.
It was the hastiness of transition itself, which did not allow enough room for
gradual replacement of former credit allocation and production systems with new
ones, that triggered the collapse of the entire system. This implies that the countries
which were not in the position to opt for a radical transition to a liberalized market
and started with a piecemeal step-by-step approach may have been in some ways
better positioned, since they allowed their economic agents and systems of economic
coordination more time for adjustment. One could, however, also argue that the
choice of the speed of transition in CEE was a historic political necessity, and if no
rapid changes had been undertaken the region would have fallen into prolonged
stagnation, as has happened to most of the ex-USSR. Furthermore, as the experiences
of Russia, Ukraine and Moldova exemplify (see above), postponement of reforms
does not guarantee successful transition either.
Quality of economic change in CEE
By the 1980s, most of the CEE countries were relatively highly industrialized, but still
lagged significantly behind the Western European average.5 For instance, in 1985,
Latvia, Portugal and South Korea all had similar levels of industrial value added per
capita, but since then, these countries’ development paths have been very different in
comparison to the European average. South Korea has experienced a remarkable
increase in industrial value added per capita. The increase of Portugal’s industrial
value added has, at the same time, been quite modest, and in the early 1990s, the
68 M. Tiits et al.

industrial value added per capita was marked by a rather drastic collapse of industry
in Latvia (Figure 2).
Latvia’s case is, however, by no means unique. In the aftermath of the fall of the
Berlin Wall, industry collapsed virtually all across Central and Eastern Europe. Most
CEE countries saw steady growth in industrial value added up to 1990, after which
there was a dramatic decline and countries like Estonia, Romania and the Czech
Republic only recovered to their 1990 levels by 2004�2005 (Figure 3).
Inevitably, dynamic changes in the value added are also reflected in changing
employment structures of economies, and in different sectors’’ changing share of
value added in GDP. While industrial employment declined only 5�10% in CEE in
1990�2005, the share of industrial value added in GDP dropped dramatically.6 These
changes were accompanied by major gains in service employment, e.g. from 36 to
53% of total employment in Poland, and from 37 to 57% in Bulgaria from 1990 to
2005. Similarly, the share of services value added as a percentage of GDP rose very
quickly in CEE countries in the period 1985�2005 (World Bank 2007a; Table 1).
It could be argued that the decline of industry in CEE was expected, as the pre-
1990 economic specialization of CEE countries, and especially their high level of
industrialization, was artificial. It could be argued that it was created by plans, not
by market forces; that it was created by military and strategic needs, rather than
existing comparative advantages in foreign trade, and thereby the decline was simply
about return to equilibrium. However, one can still argue equally easily that the
industrialization of East Asian economies in the second half of the twentieth century
and the technological rise of the US west coast during the Cold War followed a very
similar, largely military, strategic logic (see Wade 2004, Markusen 1999, respectively).
0
1000
2000
3000
4000
5000
6000
7000
8000
1971 1975 1980 1985 1990 1995 2000 2005
Finland Portugal European Monetary Union
Korea, Rep. Latvia
Figure 2. International comparison of industrial value added per capita (millions; constant
2000 US$), 1971�2005. Source: World Bank (2007a) and authors’ calculations.
Innovation: The European Journal of Social Science Research 69

Alternatively, it can be argued that the rapid de-industrialization witnessed in
most CEE countries (and, much more drastically, in all of the former Soviet Union)
after 1990 was, at least partially, a process of natural de-industrialization, reflecting
the nature of modern economic development, by which industrial jobs move to
lower-cost locations and are replaced by relatively higher value added service jobs.7
Indeed, successful catching-up can be seen as ‘‘flying geese’’development, whereby
rapid economic development in a developed country and the gradual relocation of its
economic activities to neighbouring countries, facilitates development of the latter. As
the standard of living increases and the relative cost advantages fade away, the country
catching up will start to abandon the less knowledge- and technology-intensive
economic activities (Akamatsu 1935). This is how Western Europe industrialized step
by step in the nineteenth century (Pollard 1987), and Japan and the East Asian
‘‘tigers’’ have done the same in the second half of the twentieth century.
Developments in CEE in the 1990s do not, however, seem to fit such a pattern
very well. The above-mentioned ‘‘flying geese’’ development would imply rapidly
increasing living standards which trigger the relocation of economic activities to
lower cost locations, yet this is not what we have seen in CEE. Instead, the service
sector in CEE countries by and large witnessed a similar development in the 1990s to
industry: collapse in the early 1990s and recovery from the mid-1990s onwards. The
main difference seems to be that the recovery in services was quicker: many CEE
countries had already regained their 1990s levels of services value added by the late
1990s8 (Figure 4).
Both the industrial and services value added in Central and Eastern Europe
remain, however, much lower than the Western European average in absolute terms.
20
40
60
80
100
120
140
160
1990 1991 1992 1993 1994 1995 1996 1997 1998 1999 2000 2001 2002 2003 2004 2005
Bulgaria Czech Republic Estonia Hungary
Romania Latvia Slovenia Russia
Figure 3. Industrial value added in selected CEE, NIS, European and Asian economies
1980�2005 (constant 2000 US$), 1990�100. Note: The data for Lithuania, Poland and
Slovakia are not available. Source: World Bank (2007a) and authors’ calculations.
70 M. Tiits et al.

Table 1. Value added in industry and services, percentage of GDP.
1985 1990 1995 2000 2005
Industry Services Industry Services Industry Services Industry Services Industry Services
Bulgaria 62.8 25.3 49.2 33.8 35.5 50.0 30.7 55.1 31.6 58.7
Czech Republic 48.8 45.0 38.3 56.7 38.1 58.0 37.2 59.8
Estoniaa 43.6 35.5 49.7 33.7 29.3 62.7 26.5 68.0 29.4 66.6
Hungaryb 47.0 35.2 39.1 46.4 32.3 60.6 33.5 62.1 31.1 65.1
Latvia 43.2 35.2 46.2 31.9 29.8 61.2 23.6 71.8 22.1 73.8
Lithuania 30.9 42.1 33.7 54.7 29.6 62.5 33.5 60.8
Poland 51.4 34.0 50.1 41.6 35.2 56.8 31.7 63.3 30.7 64.5
Romania 49.9 26.3 42.7 35.8 36.4 51.1 35.0 54.9
Slovakia 61.6 31.9 59.1 33.5 34.9 59.7 30.3 65.5 29.4 67.2
High incomeb 34.7 62.0 32.4 64.8 29.7 68.0 28.0 70.2 25.9 72.4
Notes: aThe earliest data available for Estonia is from 1997; bthe latest data available for Hungary and the group of high income countries is from 2004.Source: World Bank (2007a).
Inn
ova
tion
:T
he
Eu
rop
ean
Jou
rna
lo
fS
ocia
lS
cience
Resea
rch7
1

Even though the 2000s have led to a significant increase of value added in CEE
countries both in industry and services, it is difficult to talk about the last decades as
a period of strong catching up.
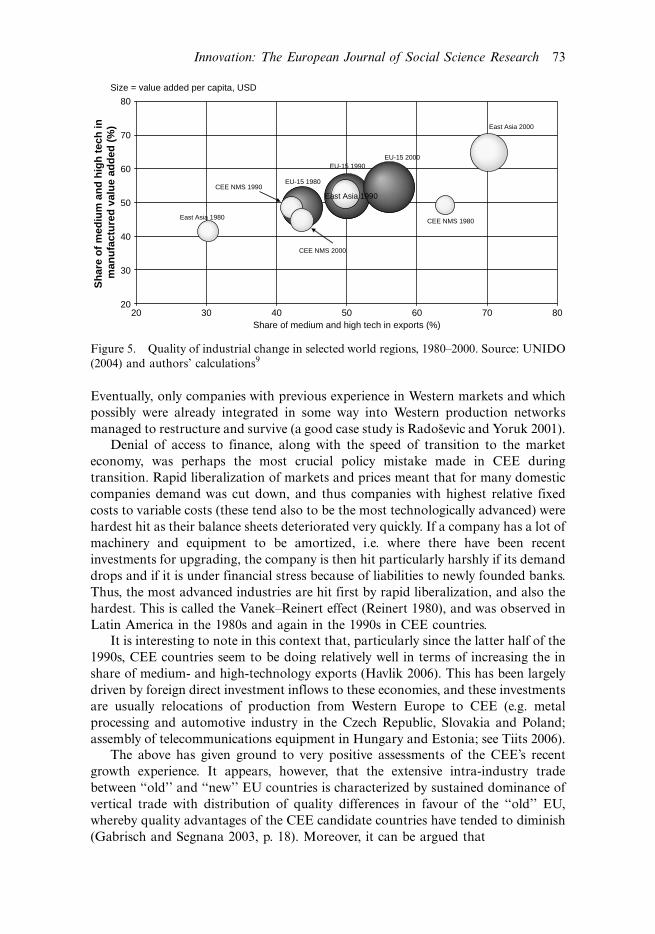
Successful catching up would encompass a gradual increase in the knowledge and
technology intensity of industry (and internationally tradeable services; see
Abramovitz 1986, Tiits et al. 2006), but this is not what we see in CEE. A closer
look at the change in the share of medium- and high-level technology in
manufactured exports (reflecting international competitiveness) and at industrial
value added (reflecting the quality of the industrial structure) reveals that the new
EU member states were more competitive in 1980 in terms of their production
capabilities than in 2000. During the two decades, the East Asian ‘‘tigers’’ have
caught up and bypassed old EU member states, while the CEE countries fell
considerably behind in the 1990s and since then have not managed to improve their
competitive position very much (Figure 5).It should be noted here that dismantling the former planning system did not only
demolish supply chains, but also cut off the (formerly) state-owned enterprises from
their credit markets, as allocation of both production inputs and credits was an
important element of the central planning system. During the transition period,
financial transfers by the state from the Soviet period to the industrial companies
were transformed into loans to the same companies by newly founded banks. Most
of the companies were privatized. This increased the liabilities of already ailing
companies, complicated restructuring of industry and increased risks in the banking
sector. Thus, the approach to transition was prone to crisis from the very beginning.
40
60
80
100
120
140
160
180
200
1990 1991 1992 1993 1994 1995 1996 1997 1998 1999 2000 2001 2002 2003 2004 2005
Bulgaria Czech Republic Estonia Hungary
Romania Latvia Slovenia Russia
Figure 4. Services value added in selected CEE, NIS, European and Asian economies 1980�2005 (constant 2000 US$), 1990�100. Note: The data for Lithuania, Poland and Slovakia are
not available. Source: World Bank (2007a) and authors’ calculations.
72 M. Tiits et al.
Eventually, only companies with previous experience in Western markets and which
possibly were already integrated in some way into Western production networks
managed to restructure and survive (a good case study is Radosevic and Yoruk 2001).
Denial of access to finance, along with the speed of transition to the market
economy, was perhaps the most crucial policy mistake made in CEE during
transition. Rapid liberalization of markets and prices meant that for many domestic
companies demand was cut down, and thus companies with highest relative fixed
costs to variable costs (these tend also to be the most technologically advanced) were
hardest hit as their balance sheets deteriorated very quickly. If a company has a lot of
machinery and equipment to be amortized, i.e. where there have been recent
investments for upgrading, the company is then hit particularly harshly if its demand
drops and if it is under financial stress because of liabilities to newly founded banks.
Thus, the most advanced industries are hit first by rapid liberalization, and also the
hardest. This is called the Vanek�Reinert effect (Reinert 1980), and was observed in
Latin America in the 1980s and again in the 1990s in CEE countries.
It is interesting to note in this context that, particularly since the latter half of the
1990s, CEE countries seem to be doing relatively well in terms of increasing the in
share of medium- and high-technology exports (Havlik 2006). This has been largely
driven by foreign direct investment inflows to these economies, and these investments
are usually relocations of production from Western Europe to CEE (e.g. metal
processing and automotive industry in the Czech Republic, Slovakia and Poland;
assembly of telecommunications equipment in Hungary and Estonia; see Tiits 2006).
The above has given ground to very positive assessments of the CEE’s recent
growth experience. It appears, however, that the extensive intra-industry trade
between ‘‘old’’ and ‘‘new’’ EU countries is characterized by sustained dominance of
vertical trade with distribution of quality differences in favour of the ‘‘old’’ EU,
whereby quality advantages of the CEE candidate countries have tended to diminish
(Gabrisch and Segnana 2003, p. 18). Moreover, it can be argued that
Size = value added per capita, USD
20
30
40
50
60
70
80
20 30 40 50 60 70 80Share of medium and high tech in exports (%)
Sh
are
of
med
ium
an
d h
igh
tec
h in
m
anu
fact
ure
d v
alu
e ad
ded
(%
)
EU-15 2000
EU-15 1980
East Asia 1980
East Asia 2000
EU-15 1990
East Asia 1990
CEE NMS 2000
CEE NMS 1990
CEE NMS 1980
Figure 5. Quality of industrial change in selected world regions, 1980�2000. Source: UNIDO
(2004) and authors’ calculations9
Innovation: The European Journal of Social Science Research 73

foreign direct investment in candidate countries [CEE; authors’’ note] seems to have had
an almost negligible impact on change toward horizontal trade structures. This should
trigger off a more moderate view on the role of foreign direct investment, which is too
often seen as overly optimistic to contribute to catching-up in terms of quality and
technology whenever trade has been liberalised (ibid., p. 32).
In other words, recent relocation of production from ‘‘old’’ to ‘‘new’’ EU countries
has not compensated for the loss of most knowledge- and technology-intensive
industries in CEE in the early 1990s. Landabaso (1997) concluded in his earlier
analysis of cross-country economic variations in the ‘‘old’’ EU that ‘‘there is a
‘technology gap’ twice as great as the so-called ‘cohesion gap’ (measured in terms of
inter-regional differences in income, productivity and employment) between the
developed and the less developed regions of the European Union’’. The technology
gap in the enlarged European Union is, however, even wider than the variation
between most of the EU’s old member states. Furthermore, the increasing knowledge
intensity of developed economies, intensifying global market competition and
shortening technology life cycles contribute to widening, rather than lessening, such
a technology gap.
Innovation and innovation policy in CEE
Perhaps the longest-lasting effect of the transition in the CEE described in previous
sections appears in the education and R&D sectors. While the changes in industry
and services described in the previous section were very rapid and often disruptive,
education and R&D systems were left to their own devices in most CEE and NIS
countries and with no significant structural change or resources for upgrading.10
Enterprises in CEE are typically in the lower end of the global value chain and
the innovations they introduce are typically less knowledge-intensive � the role of
practical experiences and related tacit knowledge is much higher than that of formal
R&D, owing to their industrial specialization (for theoretical argument see, e.g.,
Perez 2001). Although the share of R&D financed by the business enterprise sector
has grown in some countries (e.g. the Czech Republic, Hungary, Estonia) rather
rapidly in recent years, industrial R&D investment in 2005 still remained around a
modest 0.2�0.4% of GDP11 in most CEE countries (Eurostat 2007).
Many new companies in CEE have in fact been highly innovative in finding creative
new ways to apply existing technologies, despite low formal R&D investment, by
offering themselves, e.g., as cost-effective and reliable partners for outsource
production. One of the most fundamental characteristics of CEE industry (and
services) since 1990 has been that the majority of companies who have engaged
predominantly in process innovation and have sought to become more and more cost-
effective in the new market place while gaining quality advantages through the deve-
lopment of new products with market potential, have remained largely unsuccessful.Both the cost of acquisition of machinery and private R&D investment, and
thereby also innovation expenditure of enterprises, are of course very closely
dependent on the structure of the industry of a given country. Science-based
industries, such as bio-pharmaceuticals, ICT and electronics quite obviously
demonstrate high R&D investment. Yet private R&D investments in countries
with a limited science-based industry also appear low. Similarly, one would expect
74 M. Tiits et al.
scale-intensive and supplier-dominated industries, such as, for example, the produc-
tion of metals and machinery, to demonstrate higher than average investment in
equipment (Pavitt et al. 1989).
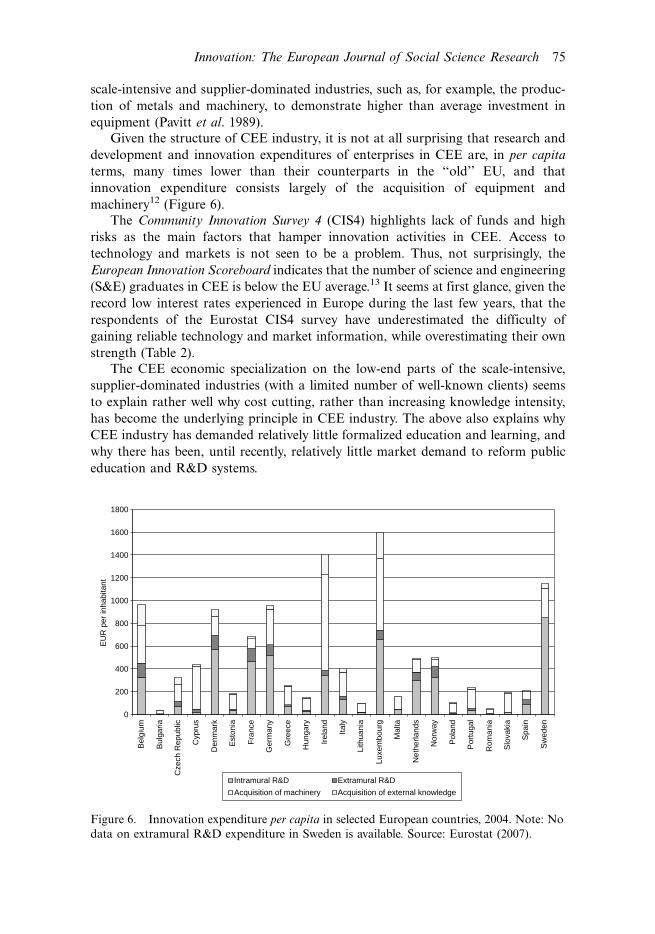
Given the structure of CEE industry, it is not at all surprising that research and
development and innovation expenditures of enterprises in CEE are, in per capita
terms, many times lower than their counterparts in the ‘‘old’’ EU, and that
innovation expenditure consists largely of the acquisition of equipment and
machinery12 (Figure 6).
The Community Innovation Survey 4 (CIS4) highlights lack of funds and high
risks as the main factors that hamper innovation activities in CEE. Access to
technology and markets is not seen to be a problem. Thus, not surprisingly, the
European Innovation Scoreboard indicates that the number of science and engineering
(S&E) graduates in CEE is below the EU average.13 It seems at first glance, given the
record low interest rates experienced in Europe during the last few years, that the
respondents of the Eurostat CIS4 survey have underestimated the difficulty of
gaining reliable technology and market information, while overestimating their own
strength (Table 2).
The CEE economic specialization on the low-end parts of the scale-intensive,
supplier-dominated industries (with a limited number of well-known clients) seems
to explain rather well why cost cutting, rather than increasing knowledge intensity,
has become the underlying principle in CEE industry. The above also explains why
CEE industry has demanded relatively little formalized education and learning, and
why there has been, until recently, relatively little market demand to reform public
education and R&D systems.
0
200
400
600
800
1000
1200
1400
1600
1800
Bel
gium
Bul
garia
Cze
ch R
epub
lic
Cyp
rus
Den
mar
k
Est
onia
Fra
nce
Ger
man
y
Gre
ece
Hun
gary
Irel
and
Italy
Lith
uani
a
Luxe
mbo
urg
Mal
ta
Net
herla
nds
Nor
way
Pol
and
Por
tuga
l
Rom
ania
Slo
vaki
a
Spa
in
Sw
eden
EU
R p
er in
habi
tant
Intramural R&D Extramural R&D
Acquisition of machinery Acquisition of external knowledge
Figure 6. Innovation expenditure per capita in selected European countries, 2004. Note: No
data on extramural R&D expenditure in Sweden is available. Source: Eurostat (2007).
Innovation: The European Journal of Social Science Research 75

Until the early 2000s, scientists remained almost the only protagonists of science
and technology policy in CEE. This is also probably why the R&D and innovation
policies emerging in CEE in the late 1990s, and in particular with looming EU
accession in the early 2000s, were rife with a quite specific, and often mystified, way
of understanding innovation. Innovation was seen, in line with the post-World War
II tradition, as a phenomenon close to science, believing that there is a more or less
linear correspondence between scientific discovery and high innovation performance.
Therefore, the technology push linear innovation models prevailed. Limited market
demand for domestic science and technology competence was, however, taken as the
inability of the public R&D sector to cooperate and commercialize research results
and cater to the needs of private enterprises. Much of the policy learning in CEE was
inspired by the ideas circulating among Western European policy-makers. It was thus
understood that CEE was experiencing its own version of the ‘‘European paradox’’:
good public research and high levels of education, but little commercialization of
research results in the private sector.14
We can see how CEE innovation policies attempting to imitate those of advanced
industrial economies have concentrated on R&D-related activities, such as the
commercialization of public research and the development of technology parks for
research-intensive start-ups, etc., and have left the bulk of local industry simply out
of consideration (see a very good summary in Radosevic and Reid 2006).
Havlik et al. (2001) demonstrate at the same time that the adoption of the EU
acquis communautaire has had a much stronger impact on the modernization of CEE
industry than official innovation policy. Here, we see essentially a form of
‘‘unconscious innovation policy’’, whereby, with the introduction of new regulation,
Table 2. Hampered innovation activities: percentage of enterprises with innovation activities,
2004.
BG CZ EE LV LT HU PL RO SI SK
Lack of funds within your
enterprise or enterprise group
24% 22% 28% 68% 25% 27% 31% 8% 31% 24%
Lack of finance from sources
outside your enterprise
21% 12% 19% 58% 19% 20% 26% 30% 24% 16%
Innovation costs too high 26% 18% 21% 72% 22% 26% 32% 30% 24% 21%
Lack of qualified personnel 9% 10% 23% 72% 14% 7% 7% 14% 20% 8%
Lack of information on technology 6% 2% 4% 67% 7% 2% 5% 7% 5% 2%
Lack of information on markets 6% 4% 3% 64% 8% 3% 5% 0% 9% 4%
Difficulty in finding cooperation
partners for innovation
11% 3% 6% 58% 8% 5% : 16% 11% 7%
Markets dominated by established
enterprises
15% 19% 16% 68% 19% 15% : 21% 26% 14%
Uncertain demand for innovative
goods or services
15% 12% 11% 62% 11% 15% 17% 16% 9% 12%
No need to innovate due to prior
innovations
4% 3% 5% 37% 5% 2% : 5% 1% :
No need to innovate because no
demand for innovations
5% 3% 6% 43% 2% 3% : 4% 5% :
Note: Latvia has been excluded due to obvious problems with quality of data.Source: Eurostat (2007).
76 M. Tiits et al.

the industry is made to choose either to modernize their products and production
facilities rather drastically, to subject themselves to mergers with bigger players
with greater economies of scale, or to close down altogether. In addition, such
harmonization with Western European standards made outsourcing and relocation
of production much easier.
In some countries, for instance Estonia, EU accession triggered a very significantpolicy change which brought innovation policy onto the agenda very strongly; in
others, for instance in Slovenia and Hungary, the changes in policy focus occurred
earlier and were more vocal. However, the changes were and are often accompanied
by relatively little increase in actual funding and, as importantly, by relatively little
public attention and discussion of policy strategy. The existing case studies seem to
also reveal that the Regional Innovation Strategy initiatives have had an equally
limited impact on the economic development of target regions. All in all, the policy
analysis and strategic planning capacity existing in CEE at the regional level seem to
be even weaker than policy intelligence at the national level (Euro-Coop 2007).
The few policy and academic debates on R&D and innovation in CEE in the
early and mid-1990s were largely plagued by a simple misunderstanding of
innovation as something normatively and economically always positive. It is of
course true that successful introduction of new products and services allows an
enterprise with a relatively strong market position to sustain and strengthen its
competitive position by commanding supreme prices in a specific market. Yet sinceHans Singer’s (1950) work, it is quite clear that innovation can also have a negative
impact, especially when one operates in a sub-contracting or services industry facing
severe cost competition and diminishing returns. In fact, this is why developing
countries mostly experience globalization, in essence, as a process that brings more
competition, lower prices and commodification. Particularly in agriculture and
simpler services, innovation is often an emulation of competitors (e.g. using similar
machinery) or a process readily available to all (e.g. ICT in the hotel industry). These
bring lower prices to consumers, but also a so-called ‘‘commodity hell’’ to many
companies, to their wages and profits.
On the other hand, there are clearly innovations that have the opposite effect:
they bring new products, services and processes that are difficult to copy (or are
protected with intellectual property rights), and thus bring higher profits and wages.
This very often has to do with technological change and scale economies or, as
Schumpeter put it, with historical increasing returns that lead to quickly rising
market power and often to near-monopolistic competition (think of Microsoft).We argue that in many CEE countries there are strong changes towards a more
active role of the state in supporting the existing industry since EU accession, and
that such changes have often taken place in policy discussions and coordination with
EU officials rather than in local policy debates. More importantly, CEE innovation
and industrial policy changes take place in a macroeconomic policy environment
that has not really changed since the early 1990s. This environment is still based on
the assumption that most of the industrial change that took place in the 1990s in
CEE increased the competitiveness of these countries, and that the reasons for this
lay in neoliberal policies that should be reinforced again today: lower taxes, balanced
budgets and lower inflation that should result in the price and fiscal stability required
for Euro accession. Such a policy environment has little to do with the industrial
realities of many CEE companies; in fact, this policy environment reinforces the
Innovation: The European Journal of Social Science Research 77

economic specialization established during the 1990s, and brings with it almost no
incentives for modernization of CEE education and R&D systems, which would
allow for the gradual upgrading of competitive advantages of CEE economies.
Increasing financial fragility in CEE
Financial deepening or capital accumulation has classically been seen by economists
as the main source of economic development (see e.g. Marx, 1867, Friedman and
Friedman 1980). It is certainly one way of explaining the recent growth in CEE.
Additionally, analysts focusing on the developments in the supply side of the CEE
economies have highlighted one-off structural change related to trade reorientation,
inflow of FDI and relocation of production as the main factors behind rapid growth
in CEE countries since 1995 (see most recently Stephan 2003, Piech and Radosevic
2006). However, rapid GDP growth and industrial change have not so far brought an
increase of competitiveness to the CEE economies, but a deterioration of production
systems. This can be seen both in the quality of industrial change and from the
weakness of innovation systems in these economies.
Furthermore, recent developments in the most vulnerable CEE countries seem
increasingly similar to pre-crisis developments in Finland and Sweden in the early
1990s, or in East Asia in the late 1990s (Kokko and Suzuki 2002). As on earlier
occasions, the observed developments have seemed rational, as the CEE economies
have been growing comparatively faster than those of the ‘‘old’’ EU. Rapid growth of
foreign financing, including record high inflows of foreign direct investment (EIU
2007) sparked by relocation of production within Europe, have led to booming stock
and real estate markets and bank lending (Figure 7). It has been easy to describe the
rapid growth of asset prices in CEE, among other explanations, as a process of
‘‘natural economic convergence’’ and not an increasingly risky development pattern.
This, in turn, has attracted more foreign funding, which has led to further
deterioration of the CEE countries’ external positions.
Figure 7. Bank credit to private sector, percentage of GDP, 1995�2005. Source: World Bank
(2007b, p. 4).
78 M. Tiits et al.

The countries with fastest growth of private debt also experienced the greatest
trade deficits in 2006, reaching 20% of GDP in Latvia and Bulgaria and 10% of
GDP in Estonia, Lithuania and Romania (Eurostat 2007). Housing loans alone
increased in Bulgaria between 2004 and 2005 by more than 95%, in Latvia and
Lithuania by 90%, in Estonia by 75%, and in Poland, the Czech Republic and
Slovakia by around 35�40%. As it happens, the most peripheral new EU member
states which have experienced the fastest credit growth tend to be the least favourably
integrated into European production networks and have the smallest foreign
exchange reserves (Eurostat 2007); their commercial banks have the smallest loan
loss reserves, reaching only 1% of gross loans in the Baltic States and about 2% in
Romania and Bulgaria (for a detailed review, see, e.g., World Bank 2007b).
Since the early 1990s most of the CEE countries have experienced current
account deficits resulting from the weakness of their industry, which has not allowed
CEE countries to close their trade deficits. Modest current account deficits are usual
in a catching-up environment, as a developing economy may need foreign
technologies and other inputs to be able to do this successfully. However, as we
have shown above, over the last 10�15 years CEE countries have experienced
primitivization rather than strengthening of their competitive advantages and no
significant bettering of external balances has taken place. Instead, recent foreign-
financed growth has led to further worsening of current account deficits (Figure 8).
Some CEE countries, like Estonia and Latvia, have already witnessed the
lowering of their credit risk ratings by various rating agencies, while a number of
others, e.g. Hungary, Bulgaria and Romania, have become the subject of constant
concern by the same rating agencies (see, e.g., Fitch 2007a�c). Similarly, the IMF, the
World Bank and others have issued a number of warnings (Hilbers et al. 2005, World
Bank 2007b). Equally, CEE policy makers have in recent years issued a number of
public statements on increasing risks, attempting in this way to persuade consumers
-20%
-15%
-10%
-5%
0%
5%
10%
15%
20%
1993 1994 1995 1996 1997 1998 1999 2000 2001 2002 2003 2004 2005 2006
Bulgaria Czech Republic Estonia Latvia Lithuania Hungary Poland Romania Slovenia Slovakia
Figure 8. Current account balance 1993�2006. Source: Eurostat (2007).
Innovation: The European Journal of Social Science Research 79

against much stronger economic incentives to limit their long-term borrowing.
Increasing the reserve requirements and maintaining a modest surplus on govern-
ment budgets have perhaps been the strongest policy responses undertaken, but as
shown above, these are clearly insufficient. Finally, CEE policy makers have missed
the right moment to intervene effectively in the financial markets by restraining
excessive credit growth. Therefore, excessive dependence on foreign funding and/or
inability to mobilize adequate domestic savings have increased the financial fragility
of the CEE economies (see also Nurkse 1952, on the role of the mobilization of
domestic savings).
Speculative economic growth fuelled by domestic consumption based on foreign
borrowing can, however, only be sustained as long as markets believe that these
funds will yield higher expected returns than will be required to service them. As
soon as this confidence is lost, massive outflow of funds from the country follows
(see, e.g., Kregel 2004, Furman and Stiglitz 1998). This is the pattern we have
witnessed in the last decades in a number of emerging economies. It is, however,
perhaps the main difference from the financial crises witnessed in the last decades
that, this time, excessive borrowing and booming asset markets are characteristic not
only of CEE countries, but of a much broader set of both developed and emerging
economies.
It is important to note that, in the context of the fragility of CEE economies,
global financial issues and instabilities play only a secondary role. The difficulties of
CEE economies in maintaining their external balances are still first and foremost a
result of domestically chosen transition environments that enabled quick industrial
restructuring with significant loss of skill and complexity; this has been reinforced
further by recent speculative growth. Thus, we summarize our review with the
realization that the CEE countries have counted too much on automatic develop-
mental effects of market forces, and need not only to rethink and reinforce the role of
the state and public funding in innovation and industrial policies, but moreover, their
macroeconomic policies.
Conclusion
Developments in CEE countries since the early 1990s have been marked by different,
sometimes seemingly contradictory, trends. While the short-term economic outlook
in general still seems good, there are increasing concerns about the long-term
sustainability of the current development pattern of CEE countries. Our analysis of
the competitiveness of the CEE economies shows that they have not been catching
up with, and in fact are falling behind, industrialized economies. The 1990s were, for
most CEE countries, largely a ‘‘lost decade’’ in terms of GDP per capita growth.
The vast majority of the CEE countries implemented transition strategies which
predominantly emphasized liberalization of markets, wage and price stability,
containing public deficits, minimizing the tax burden, and strong market orientation
in all socio-economic sectors. While some of these steps were of the utmost
importance to enable the private sector to develop at all, it was mostly only
companies with previous experience in Western markets and possibly already
integrated in some way into Western production networks that managed to
restructure and survive. Alongside changes in industry and services that were very
rapid and often disruptive, education and R&D systems were at the same time left to
80 M. Tiits et al.

their own devices in most CEE and NIS countries with no significant structural
change nor resources for upgrading. Emergence of R&D and innovation policies
became noticeable only in the late 1990s, and in particular, with looming EU
accession in the early 2000s. Previously, innovation was viewed in a linear way, and
applied innovation policies were actually research policies that had little to do with
the average enterprise.In spite of the fact that the share of R&D financed by the business enterprise
sector is very small, many companies in CEE have in fact been highly innovative in
finding creative new ways to apply existing technologies, by offering themselves as
cost-effective and reliable partners to outsource production, and so forth. It has been
one of the most fundamental characteristics of CEE industry (and services) since
1990 that the majority of companies predominantly engaged in process innovation
have sought to become more and more cost-effective in the new market place, while
gaining quality advantages by developing new products with supreme characteristics;
however, these companies have remained largely unsuccessful.
At the same time, CEE countries have profited from trading with European
economies, which has often brought the need to manage production (in an
outsourcing factory, for instance) in terms acceptable to Western partners,
particularly in terms of quality. What has essentially happened is that CEE countries
have specialized in industrial (and often also service) activities where Western Europe
has lost its cost competitiveness. Thus, the loss of skill in the 1990s can be easily
overlooked, as with the relocation of production � new ‘‘Zara’’ or ‘‘Ikea’’ factories
keep popping up all over the CEE.However, one-off developmental resources stemming from market liberalization
and privatization, the boosting of the private entrepreneurial spirit and the
reorganization of the existing production system seem to be largely exhausted.
CEE countries mistook initial and continuing rapid growth for a response to their
development policies. In reality, large parts of this success are attributable to two
factors: techno-economic paradigm change and globalization with liberalization of
markets. Technological revolution in information and communications technologies
has indeed unleashed very powerful economic dynamics in the form of outsourcing
and general mobility of industries and within industries. These aspects strongly
enabled inflow of FDI and have allowed CEE to replace Soviet-style factories with
modern industries, from mobile phones and ICT to designer clothing and furniture,
giving the illusion of managing the economy and doing things right.
In 1980, CEE countries had qualitatively better industrial structures and were
more similar to the East Asian economies than they are today. However, by 2000 the
difference between these two groups of countries was remarkable. The quality of
industrial change in the CEE countries in the 1990s indicates that the incentivescreated by the transition architecture for the private sector have not changed
significantly over time, nor have these incentives significantly increased productivity
of labour and, consequently, more income has not been generated.
Furthermore, recent foreign-funded speculative growth has led to a considerable
weakening of the external positions of the CEE economies, and the region seems to
have virtually arrived at the brink of economic collapse. The East Asian crisis forced
Asian policy makers to rethink the risks related to excessive foreign currency-
denominated borrowing and increased the volatility of global financial markets
stemming from the liberalization of capital markets. The same also seems to be in
Innovation: The European Journal of Social Science Research 81

store for the CEE. Since joining the European Union, the CEE countries have
gradually moved towards a more active role of the state in economic development.
These policies, however, need to be strengthened considerably and reinforced by
macroeconomic policies that curb current excessive dependence on foreign-financedgrowth.
Acknowledgements
The research for this paper was partially supported by European Commission EURO-COOP
project, and Estonia Science Foundation grant no 6703.
Notes
1. In the context of this article, Central and Eastern European countries are the following 10
new member states of the European Union: Bulgaria, the Czech Republic, Hungary,
Estonia, Latvia, Lithuania, Poland, Romania, Slovakia and Slovenia.
2. Competitiveness is understood hereafter as the ability ‘‘to produce internationally
competitive products and services (export), while at the same time maintaining or
increasing the actual income of people’’ (OECD, 1992).
3. In particular, the Washington institutions (the World Bank and the IMF) have been strong
advocates of such policies. However, also within academic discourse, such analysis
abounds; see Broadman et al. (2005), for a recent example from numerous studies.
4. For a more detailed account, see, for example, Havlik (2006) and Bracho and Lopez
(2005).
5. This section builds partially on Reinert and Kattel (2007).
6. As a result, the share of CEE and NIS manufacturing in world manufacturing[0]
plummeted from 19.3% in 1980 to 2.7% in 2001 (UNCTAD 2004, p. 89).
7. This is how today’s developed countries benefit from globalization, by shifting
manufacturing to various low-cost locations while maintaining control over product
development, coordination of offshore production networks, marketing, etc. Vernon’s
(1966) work on interrelations of industry life cycles and evolution of international trade is
a good way of explaining this.
8. We use here statistical definitions given by the World Bank WDI online database: services
correspond to ISIC divisions 50�99. They include wholesale and retail trade (including
hotels and restaurants), transport, and government, financial, professional and personal
services such as education, health care and real estate services.
9. The calculations are based on averages. For some CEE countries, data is missing; however,
most of the larger CEE economies like Hungary, Poland, Bulgaria and Romania are well
represented, as are the Baltic States. East Asia includes South Korea, Singapore, Malaysia
and Thailand.
10. Radosevic (1999) uses the term ‘‘gradualism without therapy’’, and for some countries
even ‘‘shock without therapy’’ to describe the patterns of restructuring of R&D systems in
CEE.
11. The Czech Republic and Slovenia, with their business sector R&D investment reaching
0.9% of GDP, are exceptions here.
12. There are a number of methodological problems with the Community Innovation Survey
that make cross-national comparison difficult: for a small or medium-size subcontracting
company in the low end of global production networks, each new contract may bring
about new products or services and virtually complete reorganization of production,
which CIS would record as ‘‘innovative activity’’.
13. The case study by Kattel and Kalvet (2006) reveals that, besides the problems of quantity
of labour, there are also problems with quality.
82 M. Tiits et al.

14. As it currently seems, the high quality of European science and education is largely a myth
(Dosi et al., 2006). CEE scientific output is, in comparison to leading European countries
like Sweden and Finland, dwarfed (see Must, 2006).
References
Abramovitz, M., 1986. Catching up, forging ahead, and falling behind. Journal of economic
history, 46 (2), 385�406.
Aghion, P. and Blanchard, O., 1994. On the speed of transition in Central Europe. In: S.
Fischer and J. Rotemberg, eds. NBER macroeconomics annual 1994. Cambridge, MA: MIT
Press.
Akamatsu, K., 1935. Waga kuni yomo kogyohin no susei [Trend of Japanese Trade in Woolen
Goods]. Shogyo keizai ronso, 13, 129�212.
Berg, A. and Sachs, J., 1992. Structural adjustment in international trade in Eastern Europe:
the case of Poland. Economic policy, 7 (14) (Eastern Europe), 117�173.
Blanchard, O., Rudiger D., Krugman, P., Layard, R., and Summers, L., 1991. Reform in
Eastern Europe. Cambridge, MA: MIT Press.
Bracho, G. and Lopez, J., 2005. The economic collapse of Russia, November 2005. Available
from: http://www.ideaswebsite.org/featart/nov2005/fa11_Economic_Collapse.htm [Accessed
March 2008].
Broadman, H.G., Paas, T., and Welfens, P.J.J., eds 2005. Economic liberalization and integration
policy. Options for Eastern Europe and Russia. Berlin: Springer.
Calvo, G. and Coricelli, F., 1992. Output collapse in Eastern Europe: the role of credit. IMF
Staff Paper no 92/64, August.
Campos, N. and Coricelli, F., 2002. Growth in transition: what we know, what we don’t and
what we should. Journal of economic literature, 40, 793�836.
Cooke, P., 1992. Regional innovation systems: competitive regulation in the new Europe.
Geoforum, 23, 365�382.
Dosi, G., Llerena, P., and Labini, M., 2006. The relationships between science, tecnhnologies
and their exploitation: an illustration through the myths and realities of the so-called
‘‘European paradox’’. Research policy, 35, 1450�1464.
Drechsler, W., Backhaus, J.G., Burlamaqui, L., Chang, H.-J., Kalvet, T., Kattel, R., Kregel, J.,
and Reinert, E.S., 2006. Creative destruction management in Central and Eastern Europe:
meeting the challenges of the techno-economic paradigm shift. In: T. Kalvet and R. Kattel,
eds. Creative destruction management: meeting the challenges of the techno-economic
paradigm shift. Tallinn: PRAXIS Center for Policy Studies, 15�30.
EIU, 2007. Over the hill?, Economist Intelligence Unit viewswire, 25 July.
Euro-Coop, 2007. Report about data collection in the partner regions, June. Available from:
http://www.iccr-international.org/euro-coop/
European Innovation Scoreboard, 2006. Available from: http://www.proinno-europe.eu/doc/
EIS2006_final.pdf.
Eurostat, 2007. Eurostat on-line database. Available from: http://ec.europa.eu/eurostat
[Accessed September 2007].
Fitch, 2007a. Risks rising in the Baltic States? Special report, 6 March.
Fitch, 2007b. Bulgaria, Croatia, Romania � how sustainable are external imbalances? Special
report, 20 March.
Fitch, 2007c. The Baltic states: risks rising in the trailblazers of emerging Europe? Special
report, 8 June.
Freeman, C., 1995. The ‘‘National System of Innovation’’ in historical perspective. Cambridge
journal of economics, 19, 5�24.
Friedman, M. and Friedman, R., 1980. Free to choose. London: Harcourt.
Innovation: The European Journal of Social Science Research 83

Furman, J. and Stiglitz, J.E., 1998. Economic crises: evidence and insights from East Asia.
Brookings Papers on Economic Activity, no 2.
Gabrisch, H. and Segnana M.L., 2003. Vertical and horizontal patterns of intra-industry trade
between EU and candidate countries. Halle: Institut fur Wirtschaftsforschung Halle.
Available from: http://www.iwh-halle.de/projects/productivity-gap/publications/Report_
WP2.pdf.
Havlik, P., 2006. Macroeconomic restructuring in the new EU Member States and selected newly
independent states: effects on growth, employment and productivity. Indeunis Papers,
February. Available from: http://indeunis.wiiw.ac.at.
Havlik, P., Landesmann, M., Stehrer. R., Romisch, R., and Gilsatter, B., 2001. Competitiveness
of industry in CEE candidate countries: composite paper. Vienna: Vienna Institute for
International Economic Studies.
Hilbers, P., Otker-Robe, I., Pasarbasioglu, C., and Jonsen, G., 2005. Assessing and managing
rapid credit growth and the role of supervisory and prudential policies. IMF Working Paper
05/151, July.
Kattel, R. and Kalvet, T., 2006. Knowledge-based economy and ICT-related education: overview
of the current situation and challenges for the education system. Tallinn: PRAXIS Center for
Policy Studies.
Kokko, A. and Suzuki, K., 2002. The Nordic and Asian crises � common causes, different
outcomes, October, manuscript.
Kregel, J., 2004. External financing for development and international financial instability. G-24
Discussion Paper Series, United Nations. Available from: http://www.unctad.org/en/docs/
gdsmdpbg2420048_en.pdf.
Landabaso, M., 1997. The promotion of innovation in regional policy: proposals for a
regional innovation strategy. Entrepreneurship and regional development, 9 (January�March).
Markusen, A., 1999. National contexts and the emergence of second tier cities. In: A.
Markusen et al., eds. Second tier cities. Rapid growth beyond the metropolis. Minneapolis,
MN: University of Minnesota Press, 65�94.
Marshall, A., 1890. Principles of economics. London: Macmillan.
Marx, K., 1867. Das Kapital. Hamburg: Verlag von Otto Meissner.
Must, U., 2006. ‘New’ countries in Europe � research, development and innovation strategies
vs. bibliometric data. Scientometrics, 66 (2), 241�248.
Nurkse, R., 1952. Some international aspects of the problem of economic development. The
American economic review, 42 (2), 571�583.
OECD, 1992. Technology and the economy, the key relationships. Paris: OECD.
Ofer, G., 1987. Soviet economic growth: 1928�85. Journal of economic literature, 25 (4), 1767�1833.
Pavitt, P., Robson, M., and Townsend, J., 1989. Technological accumulation, diversification
and organisation in UK companies, 1945�1983. Management science, 35 (1), 81�98.
Perez, C., 2001. Technological change and opportunities for development as a moving target.
CEPAL review, 75, 109�130.
Perez, C., 2002. Technological revolutions and financial capital: the dynamics of bubbles and
golden ages. Cheltenham: Edward Elgar.
Piech, K. and Radosevic, S., eds, 2006. The knowledge-based economy in Central and Eastern
Europe: countries and industries in a process of change. London: Palgrave Macmillan.
Pollard, S., 1987. Peaceful conquest: the industrialization of Europe, 1760�1970. Oxford: Oxford
University Press.
Porter, M.E., 1990. The competitive advantage of nations. London: Macmillan.
Radosevic, S., 1999. Restructuring and reintegration of science and technology systems in
economies in transition. Final Report of the TSER Project, contract no. SOE1-CT95-1008.
Radosevic, S. and Reid, A., 2006. Innovation policy for a knowledge-based economy in central
and Eastern Europe: driver of growth or new layer of bureaucracy? In: Piech, K. and
84 M. Tiits et al.

Radosevic, S., eds. The knowledge-based economy in Central and East European countries;
countries and industries in a process of change. London: Palgrave Macmillan, 295�313.
Radosevic, S. and Yoruk, D.E., 2001. Videoton: the growth of enterprise through entrepreneur-
ship and network alignment. London: University College London, Center for the Study of
Economic and Social Change in Europe, Working Paper no. 3.
Reinert, E.S., 1980. International trade and the economic mechanisms of underdevelopment. PhD
Thesis, Cornell University. Ann Arbor, MI, University Microfilms.
Reinert, E.S. and Kattel, R., 2007. European Eastern enlargement as Europe’s attempted
economic suicide? The Other Canon and Tallinn University of Technology Working Papers
in Technology Governance and Economic Dynamics, no. 14.
Schumpeter, J., 1942. Capitalism, socialism and democracy. New York: Harper, 1975.
[Originally published 1942.]
Singer, H., 1950. The distribution of gains between investing and borrowing countries.
American economic review, 40 (2), 473�485.
Stephan, J., 2003. Evolving structural patterns in the enlarging European division of labour:
sectoral and branch specialisation and the potentials for closing the productivity gap. Halle:
Institut fur Wirtschaftsforschung Halle.
Tiits, M., Kattel, R., and Tarmo, K., 2006. Made in Estonia. Tartu: Institute of Baltic Studies.
Tiits, M., 2006. Industrial and trade dynamics in the Baltic Sea Region since 1990s. In: R.
Kattel and T. Kalvet, Creative destruction management: meeting the challenges of the techno-
economic paradigm shift. Tallinn: PRAXIS Center for Policy Studies, 101�118.
UNCTAD, 2004. Development and globalization: facts and figures. New York and Geneva:
United Nations.
UNIDO, 2004. Industrial development report 2004. Industrialization, environment and the
Millennium Development Goals in sub-Saharan Africa. Vienna: UNIDO.
Vernon, R., 1966. International investment and international trade in the product cycle. The
quarterly journal of economics, 80(2), 190�207.
Wade, R., 2004. Governing the market. Economic theory and the role of government in East
Asian industrialization, 2nd edn. Princeton, NJ: Princeton University Press.
World Bank, 2007a. WDI online database. Available from: http://publications.worldbank.org/
WDI [Accessed June 2007].
World Bank, 2007b. Credit expansion in emerging Europe: a cause for concern? World Bank
EU8�2 Regular Economic Report, Part II, January.
Innovation: The European Journal of Social Science Research 85