research article a simple analytical method for high...
TRANSCRIPT
Research ArticleA Simple Analytical Method for High-ThroughputScreening of Major Sugars from Soybean by Normal-PhaseHPLC with Evaporative Light Scattering Detection
Babu Valliyodan Haiying Shi and Henry T Nguyen
National Center for Soybean Biotechnology and Division of Plant Sciences University of Missouri Columbia MO 65211 USA
Correspondence should be addressed to Henry T Nguyen nguyenhenrymissouriedu
Received 26 March 2015 Accepted 16 June 2015
Academic Editor Masami Shibukawa
Copyright copy 2015 Babu Valliyodan et alThis is an open access article distributed under theCreativeCommonsAttribution Licensewhich permits unrestricted use distribution and reproduction in any medium provided the original work is properly cited
This paper presents a simple analytical method for determining sugars in soybean (Glycine max (L) Merr) tissues Samplepreparation was modified from several early published methods High-performance liquid chromatography (HPLC) equippedwith an evaporative light scattering detector (ELSD) was used to separate identify and quantify seven sugars including glucosegalactose fructose sucrose melibiose raffinose and stachyose Twomobile phases were programed into a gradient elution Mobilephase A is pure water andmobile phase B is amixture of acetonitrile and acetone 75 25 (vv) Total chromatographic retention timeis less than 20minutesThismethod has been validated for detection limit calibration range and intraday and interday repeatabilityThis method has been used analyzing more than 5000 soybean samples in the experiments studying natural genetic variation ofsugar contents and components in soybean seeds and other tissues
1 Introduction
Soybeans are naturally enriched with oil protein and carbo-hydrates In food industries soybeans are processed to severalconsumable soya products such as soy milk tofu miso soysauce natto and soy meals Soybeans are also importantconstituent of animal feeds Flavors and nutritive values ofsoya foods are greatly affected by sugar contents of soybeansMajor sugar components in soybean are fructose glucosesucrose raffinose and stachyose Fructose and glucose aremonosaccharide while sucrose is a disaccharide and thesethree sugars are easily digestible Raffinose and stachyose aretrisaccharide and tetrasaccharide respectively and belong toraffinose family oligosaccharides (RFOs) Human and othermonogastric animals are not able to digest RFOs due to lack ofan enzyme called alpha-galactosidase in their small intestine[1ndash3] This allows RFOs to move to the lower gut where theyact as substrate for fermentation by gutmicrobes and increasethe flatulence inducing gases such as CO
2 CH4 and H
2S
causing abdominal discomfort and diarrhea [4 5] It has beenreported that removal of RFOs from soybean meal resultsin a large increase in the metabolizable energy for chickens
These adverse effects such as flatulence and poor digestibilitycan severely limit the use of soybean in animal includinghuman diets All these studies suggest that the production ofsoybeans with low levels of RFOs and higher levels of sucroseis desirable for its enhanced food and feed qualities
Sugar analysis has been primarily carried out by highperformance liquid chromatography (HPLC) because ofsimplicity accuracy and separation ability Chromatographicseparation is achieved by appropriate combination of sta-tionary phase and mobile phase Stationary phases or HPLCcolumns for separating sugars aremainly categorized in threetypes with regard to packing materials ligand exchangenormal phase and anion-exchange Mobile phases are pre-pared solutions that facilitate separation of sugars when theycarry a sample through a column Ligand-exchange columnsare backboned with sulfonated polystyrene carrying a metalcounter ion such as calcium ions or sodium ions They areenvironment friendly because of the use of pure water asthe mobile phase [6] and are generally used for separatingmono- and disaccharides In the case of a normal phasethe packing material is silica gel or a polymer bonded withamino groups Solutions of mixed water and acetonitrile
Hindawi Publishing CorporationChromatography Research InternationalVolume 2015 Article ID 757649 8 pageshttpdxdoiorg1011552015757649
2 Chromatography Research International
are normally used as the mobile phase [7] Normal phasecan be used for separating sugars from a complex matrixAnion-exchange columns are packed with polymeric resinattachedwith quaternary ammonium and such columns haveto incorporate with a strong basic mobile phase (pH gt 12) insugar analysis
Preferred chromatographic detection of sugars includesrefractive index UV-visible fluoresce pulsed amperometricdetector mass spectrometry and evaporative light scatteringRefractive index (RI) detector has been used for analyzingoligosaccharides from soybean since the 70rsquos [8] and it is still apopular detector in soybean sugar analyses [9 10] Neverthe-less sensitivity and selectivity of this detector are poor Dueto the lack of chromophore atmid-UVwavelengths carbohy-drates are only detectable byUV-visible detector at the deeperUV range of 190 nmndash195 nm At such short wavelengthsinterference from mobile phase is inevitable since most ofthe solvents absorb strongly as well To enhance UV absorp-tion of carbohydrate some researchers resorted to samplederivatization [11ndash13] Such sample treatment complicated theanalytical procedures and contributed to preventable assayvariability Pulsed amperometric detector coupled with anionexchange column (HPAEC-PAD) is one of the popular HPLCsystems for carbohydrate analysis due to its better sensitivityand selectivity [14ndash17] However reliability of HPAEC-PADis dependent on the chemical purity of the mobile phaseThe HPAEC-PAD requires high alkaline (pH gt 12) mobilephase Dissolved carbon dioxide from the atmosphere orcarbonate contamination of mobile phase reduces columnretaining power as a result of the buildup of interferinganions in the stationary phase A common problem of theabove detectors is baseline drifting with gradient elutionPopularity of evaporative light scattering detection (ELSD) isfast growing in chemical and biochemical analysis In the pastdecade ELSDhas beenwidely utilized for analyzing lipids andcarbohydrates in plants fruits beverages milks and severalother different tissues and organisms [18ndash25]Theprinciple ofevaporating solvents prior to detection employed in the ELSDresolves baseline shifting and therefore enhances baselinestability and response intensity
Sample preparation is an important step inmethod devel-opment for soybean and other plants The procedure nor-mally consists of sample extraction and sample purificationIn some studies soybean flour or powder was first defattedusing hexane or other appropriate solvents The defattedsamples were then refluxed in ethanol aqueous solutions atelevated temperatures for a certain length of time [26 27]Giannoccaro et al reported that water extracts sugars mostefficiently from the nondefatted soybeans [28] The extractsolution was then purified with an organic solvent such asacetonitrile or ethanol to remove soluble proteins [14 29]
In this paper we report a simplified method to analyzesugars from soybean Sample preparation was successivelyconducted in the same sample vial It overcame long andelaborate procedures engaged in early methods such as toseparate soybean tissues from the extract to allocate todry and to redissolve the extracted solution The HPLCconditions of this method were optimized for high chro-matographic resolution and short run time Addition of 25
acetone to acetonitrile mobile phase was found critical toimprove separation of galactose from its adjacent epimerglucoseThismethod is highly useful for screening large scalesoybean populations in genetic and breeding programs forcrop improvement with value-added traits
2 Materials and Methods
21 Materials and HPLC System Sugar standards D-fructose D-(+) galactose D-(+) glucose sucrose D-(+)meli-biose D-(+) raffinose pentahydrate and stachyose hydratewere purchased from Sigma Aldrich (St Louis MO USA)HPLC grade of acetonitrile acetone and water were pur-chased from Fisher Scientific (Hampton NH USA) Com-pressed nitrogen of ultrahigh-purity (UHP) grade was pur-chased from Praxair (Danbury CT USA)The HPLC-ELSDsystem was Agilent 1200 series (Agilent USA) The PrevailCarbohydrate ES columns 5 120583 250mm times 46mm and guardcolumns 75 times 46mm were from Grace Davison DiscoverySciences (Deerfield IL USA) Soybean seeds were harvestedfrom the Bradford Research Farm Columbia Missouri andDelta Research Center Portageville Missouri
22 Sample and Standard Preparation Approximately onegram of soybean seeds was ground using Thomas WileyMini-Mill fitted with 20-mesh screen The ground powderwas lyophilized for two days in a Labconco Freeze DrySystem (Labconco USA) Dried soybean powder of 9025(plusmn025)mgwas weighed andmixedwith 900 120583LHPLC-gradewater in 2mL centrifuge vials The vials were incubated at55∘C with 250 rpm agitation for 30 minutes followed by30-second high speed vortex After cooling down to roomtemperature 900 120583L HPLC grade acetonitrile was blendedin The suspension was centrifuged for 30 minutes at 133 times1000minminus1 timesgThe supernatant was further diluted five timeswith acetonitrile water mixture of 65 35 (vv) before beingsubjected to HPLC analysis Sugar standards were preparedin water with concentrations of 50 100 200 300 400 500and 1000 120583gmL
23 HPLC Analysis Two kinds of mobile phase were pre-pared mobile phase A was pure water and mobile phase Bwas acetonitrile acetone mixture of 75 25 (vv) Flow rateand gradient of phases A and B (Table 1) were optimized forcomplete separation of the sugars in the shortest run timeColumn temperature was maintained at 35∘C throughoutthe gradient program Detector temperature was isothermalat 55∘C Nebulizer pressure was 34 bar Ultrapurity-gradenitrogen (grade 50) was used as the nebulizer gas Sampleinjection volume was 5 120583L
3 Results and Discussion
31 Sample Preparation Soybean is known for high proteinA substantial amount of protein concurrently dissolves inwater during extraction Purification of the extract is there-fore very important to eliminate matrix interference from thedissolved proteins Protein was commonly precipitated with
Chromatography Research International 3
95 or pure acetonitrile Earlier methods required four toseven steps to conduct purification which included prepa-ration of 95 acetonitrile separation of suspended sugarsolution from soybean tissues transferring a given volume ofsupernatant to a new tube blending in acetonitrile remov-ing protein drying and redissolving sugars Our methodrequires only two steps that is directly adding pure acetoni-trile to the same sample vial after the completion of extrac-tion and removing soybean tissue and precipitated proteinssimultaneously This modified method effectively eliminatesprocess variables as less preparation steps were involved
Dilution is another key factor in this method Low con-centration of sugars is desirable not only for optimum peakshape and separation but also for an extended column lifecycle However abundance of different sugars varies greatlyin soybean for example Hou et al showed that soybean iscomposed of 007ndash015 glucose 008ndash019 fructose 56ndash94 sucrose 03ndash14 raffinose and 03ndash6 stachyose [30]After taking consideration of all possible impacts we set thedilution factor as 10 that is solvent-to-sample ratio of 10 1(mgmL)
32 Chromatographic Separation The HPLC mobile phaseplays a crucial role in sugar separation Addition of acetoneto acetonitrile mobile phase differentiates this method fromother publishedmethods As shown in Figure 1 acetone effec-tively improves peak resolution without additional elutiontime Figures 1(a) and 1(b) represent chromatograms obtainedfrom mobile phases with and without acetone The acetonewith a portion of 20 to 30 in acetonitrile was capable ofresolving galactose and glucose isomers although galactosewas under the detection limit (very low concentrations) inmost of the soybean seeds The 10 window of acetoneconcentration inmobile phasemakes thismethod robustTheelution gradient was accomplished with the mixed solventsof acetone and acetonitrile (2575) and water Emergence ofall sugars occurred before 14 minutes Six more minutes wereprogrammed to stabilize the system At retention time of 141minutes the flow rate was promptly reduced to 02mLminfrom 12mLmin and meanwhile the mobile phase ratio of Aand B was changed to 20 80 from 50 50 (see Table 1) Thisgradient change allows the system to reach its initial stagewithout causing high column back pressure
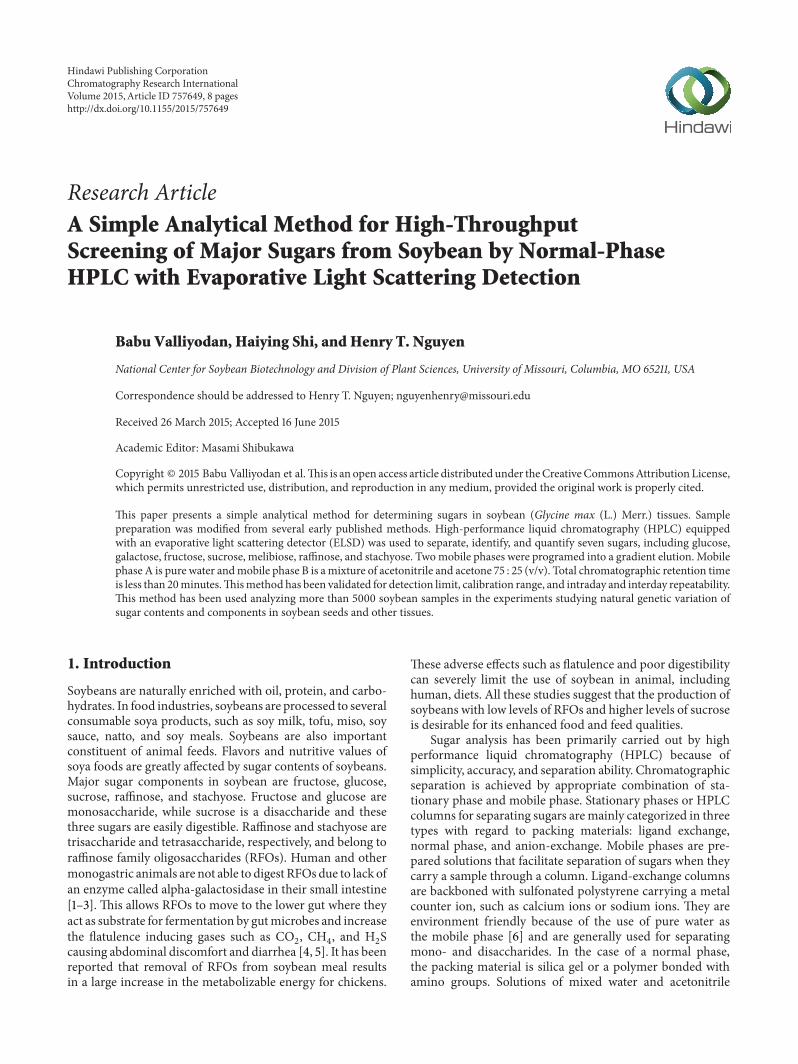
33 Identification andQuantification Each sugar componentwas recognized by its distinctive retention time Commercialreferences were used for confirmation Under the chromato-graphic conditions described in Section 2 sugars eluted inthe order of fructose galactose glucose sucrose melibioseraffinose and stachyose as shown in Figure 2
Figure 3 represents three types of sugar distribution ofsoybean germplasm seeds Figure 3(a) is from a soybeangermplasm that has multiple sugars and each sugar has asignificant amount Figure 3(b) indicates that sucrose andstachyose are predominant components in another soybeangermplasm line The chromatogram (Figure 3(c)) is from adifferent soybean germplasm and this sugar profile is mostdesirable for animal feed usesThis germplasm line with high
Gal
acto
se
8
Glu
cose
(a)
8
Gal
acto
se G
luco
se
(b)
Figure 1 Chromatograms obtained from (a) acetone in mobilephase (b) no acetone in mobile phase
Table 1 Gradient-elution of mobile phases
Time (minutes) A B Flow rate (mLmin)0 20 80 125 20 80 1212 50 50 1214 50 50 12141 20 80 0220 20 80 12
sucrose low raffinose and low stachyose was discoveredafter screening more than 1000 germplasm lines (PlantIntroductions) obtained from the USDA seed bank (USDA-GRIN) and grown in the University of Missouri (MU)research fields During all of the germplasm screeningsgalactose was least abundant and not detectable in most ofthe soybean lines Trace amount of melibiose was detectedonly in few soybean lines
Quantification of the sugars was accomplished by cali-bration curves that ranged from 50 to 1000 120583gmL (Figures4(a) and 4(b)) Fundamentally an ELSD responds to con-centration change in a nonlinear fashion The relationshipbetween measured peak area or peak height and sample con-centrations is reflected by a 2nd-order polynomial equationas shown below
A = aX2 (1)
where A is peak area (or peak height) a is quadraticcoefficient and X is sample concentration To correct thequadratic effect a mathematical model [31ndash33] is usuallyused such as logA = a1015840 + 2 logX We found a solid linear
4 Chromatography Research International
5 10 15
Fruc
tose
Gal
acto
seG
luco
se
Sucr
ose
Meli
bios
eRa
ffino
se
Stac
hyos
e
Figure 2 Chromatogram of sugar standards (concentration of eachsugar is 300 120583gmL)
regression after logarithmic conversion in the specified rangeof 50 to 1000 120583gmL except for galactose which is slightly nar-rowed down to the range of 200 to 1000120583gmL Correlationcoefficient 1198772 values of all sugars were greater than 099 Thismodel allows us to perform quantification directly from (1)without applying other conversion or mathematical models
34 Method Validation Spike Recovery Rate Detection Limitand Precision Test Recovery rate of each sugar was obtainedby spiking known amount of standards at different steps ofsample preparation In one of the spiking experiments stan-dards were added to the dried soybean samples In anotherexperiment spike standards were added to the sugar extractsIn both cases 500120583gmL of each sugar standard was spikedEach experiment was repeated four times The recoveryresult was shown in Table 2 Most of the spiked standardswere recovered close to 100 Detection limit (DL) of eachindividual sugar was calculated based on the formula below
Detection limit (120583gmL) = 50SNtimes 3 (2)
where 50 is the concentration of standard in the unit of120583gmL used for DL determination and SN is the ratio ofsignal over noise produced from the 50 120583gmL standard
Relative standard deviation (RSD) of both interday andintraday was determined and reported in Table 2 Intradayvariation was less than 3 and interday variation was lessthan 10 except for melibiose that is at a trace level andtherefore detected with a higher variation
Accuracy of the method was further evaluated on anHPAEC-PAD system from an external lab Six finely groundand dried soybean seed samples were verified by theHPAEC-PAD for sucrose raffinose and stachyose Table 3 shows thatthe results are close from one method to the other exceptthat raffinose in sample-1 and sample-5 is not detectable byHPAEC-PAD Note that each data in Table 3 is an average
6 8 10 12 14
Fruc
tose
Glu
cose
Sucr
ose
Meli
bios
eRa
ffino
se
Stac
hyos
e
1
3
4 5
6
2
(a)
6 8 10 12 14Su
cros
e
Raffi
nose
Stac
hyos
e
3
5
6
(b)
6 8 10 12 14
Sucr
ose
Raffi
nose
Stac
hyos
e3
56
(c)
Figure 3 Distribution of sugars in different soybean germplasmlines
Chromatography Research International 5
002040608112141618
0
5
10
15
20
25
30
0 200 400 600 800 1000
Inte
nsity
of g
alac
tose
Inte
nsity
(120583gmL)StachyoseFructoseGlucoseSucrose
MelibioseRaffinoseGalactose
(a)
minus3
minus2
minus1
0
1
2
3
4
39 49 59 69
Log(
peak
hei
ght)
Log(concentration)
GlucoseFructoseGalactoseMelibiose
SucroseStachyoseRaffinose
(b)
Figure 4Calibration curves of seven sugars (a)Quadratic regression (b) log(peak intensity) log(standard concentration) linear expression
Table 2 Method validation including detection limit repeatability and spike recovery
Detection limitppm
Repeatability Recovery () plusmn RSDIntraday(RSD)
Interday(RSD)
Spike to driedsample
Spike tosugar extract
(119899 = 6) (119899 = 6) (119899 = 4) (119899 = 4)
Fructose 600 22 60 103 plusmn 15 101 plusmn 20Galactose 1350 mdash mdash 105 plusmn 32 111 plusmn 12Glucose 300 20 90 101 plusmn 11 99 plusmn 10Sucrose 93 12 29 99 plusmn 30 98 plusmn 44Melibiose 194 17 120 73 plusmn 14 92 plusmn 05Raffinose 121 17 29 102 plusmn 28 101 plusmn 16Stachyose 100 12 47 102 plusmn 09 102 plusmn 39
value of three replicates Sample-1 and sample-5 have beenfrequently used in our lab as daily controls tomonitor analysisvariations Their values have been consistently obtained as08 and 06 respectively The present method evidentlydemonstrated high sensitivity
35 Application of the Method This analytical method hasplayed a significant role in the research projects on thenatural genetic variation of sugar contents and components insoybean seeds and other tissues conducted at the Universityof Missouri The soy industry and soy food markets needsoybeans with high-sucrose low-raffinose and stachyosecontent and with low trypsin inhibitor activity as one pack-age This will provide high levels of energy and yield bettertasting food and feed without inducing indigestion problemsThe extensive screening of soybean plant introductions (PIs)and current soybean varieties for natural genetic variationwill help identifying new sources for gene discovery andfurther application in molecular breeding and crop improve-ment programs More than 5000 lines have been screenedSeveral soybean PIswith low raffinose and stachyose and high
sucrose in seed tissues have been identified Table 4 shows theminimum and maximum levels of major sugar componentsafter a statistical analysis of 540 soybean germplasm lineswithmaturity groups III and IV These maturity groups are highlysuitable for Missouri and other US soybean productionareas Total sugars varied from 567 to 1603mgg that wasequivalent to 57 to 160 of dry matter For an exampleFigure 5 shows the distribution of sucrose content in theselected soybean germplasm lines A few lines with as high as9-10 sucrose were selected after screening around 1500 linesfor crossing and population development for gene discovery
4 Conclusion
Developing an HPLC method that can resolve a mixtureof mono- di- tri- and oligosaccharides in a short elutiontime is a challenge Earlier described methods had severalshortcomings and some of the methods have shown anunacceptable long retention time for raffinose and stachyosewhile some others had poor resolution or broad peaks Themethod presented in this paper is simple fast reliable and
6 Chromatography Research International
Table 3 Comparison of sugar content generated from the present method with the HPAEC-PAD method
Presentmethod
HPAEC-PAD
Presentmethod
HPAEC-PAD
Presentmethod
HPAEC-PAD
Sucrose (dry matter) Stachyose (dry matter) Raffinose (dry matter)(119899 = 3) (119899 = 3) (119899 = 3)
Sample-1 71 68 09 05 08 mdashSample-2 58 48 35 31 06 03Sample-3 47 34 43 32 06 03Sample-4 28 21 37 26 11 09Sample-5 57 42 14 10 06 mdashSample-6 31 21 44 32 09 05
Table 4 Maximum and minimum sugar component concentration in the 540 soybean germplasm lines
Fructose Glucose Sucrose Melibiose Raffinose Stachyose Total sugar(sugar content in soybean mgg (dry matter))
Maximum 166 137 734 77 334 709 1603Minimum 21 mdash 150 mdash 34 32 567Average 81 57 422 38 80 411 1088
20
43
65
88
110
0 400 800 1200 1600
Sucr
ose (
)
Number of soybean lines
Figure 5 Distribution of sucrose contents in the seeds of 1500soybean germplasm
successful in the case of high throughput screening TheHPLC of this method is comprised of a column speciallypacked for carbohydrate assay and equipped with an ELSDdetector The mobile phase is 25 acetone in acetonitrile andwater All major sugars in soybean that is fructose glucosesucrose raffinose and stachyose are completely resolvedin less than 14 minutes Sample preparation procedure ismuch simplified and improved from known methods Theoptimal low sample-to-solvent ratio (10mg 1mL) lessenedsample load and extended HPLC column life More than1500 samples can be analyzed on a single HPLC columnThedetection limit in this method is low for example sucroseis 93 ppm and others are lower than 60 ppm The selectionof calibration range allows direct quantification from thenonlinear detector output Robustness and high throughputapplication of this method help soybeans breeding programsincluding the one for developing soybean varieties withreduced RFOs and higher metabolizable energy
Abbreviations
RFO Raffinose family oligosaccharidesHPLC High performance liquid chromatographyUV UltravioletRI Refractive indexHPAEC-PAD High-performance anion-exchange
chromatography with pulsedamperometric detection
ELSD Evaporative light scattering detectorPI Plant introduction
Conflict of Interests
The authors declare that there is no conflict of interestsregarding the publication of this paper
Acknowledgments
This study was supported by the United Soybean BoardGrant no 1236 The authors acknowledge Dr Grover JShannon for soybean germplasm seed increase at the DeltaResearch Center University of Missouri Portageville Mis-souri and Dr Tri D Vuong Department of Plant ScienceUniversity of Missouri for helping collection of more than5000 data using this method
References
[1] J J Rackis ldquoOligosaccharides of food legumes alphagalactosi-dase activity and flatulence problemrdquo in Physilogical Effects ofFood Carbohydrates A Jeanes and J Hodge Eds pp 207ndash222American Chemical Society Washington DC USA 1975
[2] F L Suarez J Springfield J K Furne T T Lohrmann P SKerr and M D Levitt ldquoGas production in humans ingesting
Chromatography Research International 7
a soybean flour derived from beans naturally low in oligosac-charidesrdquo American Journal of Clinical Nutrition vol 69 no 1pp 135ndash139 1999
[3] J D Neus W R Fehr and S R Schnebly ldquoAgronomic andseed characteristics of soybean with reduced raffinose andstachyoserdquo Crop Science vol 45 no 2 pp 589ndash592 2005
[4] V Kumar A Rani L Goyal et al ldquoSucrose and raffinose familyoligosaccharides (RFOs) in soybean seeds as influenced bygenotype and growing locationrdquo Journal of Agricultural andFood Chemistry vol 58 no 8 pp 5081ndash5085 2010
[5] K B Hagely D Palmquist and K D Bilyeu ldquoClassification ofdistinct seed carbohydrate profiles in soybeanrdquo Journal of Agri-cultural and Food Chemistry vol 61 no 5 pp 1105ndash1111 2013
[6] H F Walton ldquoLigand-exchange chromatography a briefreviewrdquo Industrial and Engineering Chemistry Research vol 34no 8 pp 2553ndash2554 1995
[7] C M Montera M C R Dodero D A G Sanchez and CG Barroso ldquoAnalysis of low molecular weight carbohydrates infood and beverages a reviewrdquo Chromatographia vol 59 no 1-2pp 15ndash30 2004
[8] L T Black and E B Bagley ldquoDetermination of oligosaccharidesin soybeans by high pressure liquid chromatography using aninternal standardrdquo Journal of the AmericanOil Chemistsrsquo Societyvol 55 no 2 pp 228ndash232 1978
[9] J L Chavez-Servın A I Castellote and M C Lopez-SabaterldquoAnalysis of mono- and disaccharides in milk-based formulaeby high-performance liquid chromatography with refractiveindex detectionrdquo Journal of Chromatography A vol 1043 no 2pp 211ndash215 2004
[10] J C M Barreira J A Pereira M B P P Oliveira and I C F RFerreira ldquoSugars profiles of different chestnut (Castanea sativaMill) and almond (Prunus dulcis) cultivars by HPLC-RIrdquo PlantFoods for Human Nutrition vol 65 no 1 pp 38ndash43 2010
[11] F N Lamari R Kuhn and N K Karamanos ldquoDerivatization ofcarbohydrates for chromatographic electrophoretic and massspectrometric structure analysisrdquo Journal of Chromatography BAnalytical Technologies in the Biomedical and Life Sciences vol793 no 1 pp 15ndash36 2003
[12] H K Joung H Huang W K Gyoung and J C Won ldquoSimul-taneous quantitative determination ofmonosaccharides includ-ing fructose in hydrolysates of yogurt and orange juice productsby derivatization of monosaccharides with p-aminobenzoicacid ethyl ester followed by HPLCrdquo Bulletin of the KoreanChemical Society vol 26 no 10 pp 1533ndash1538 2005
[13] R Masuda K Kaneko and I Yamashita ldquoSugar and cyclitoldetermination in vegetables by HPLC using postcolumn fluo-rescent derivatizationrdquo Journal of Food Science vol 61 no 6 pp1186ndash1190 1996
[14] A Hou P Chen A Shi B Zhang and Y-J Wang ldquoSugarvariation in soybean seed assessed with a rapid extraction andquantification methodrdquo International Journal of Agronomy vol2009 Article ID 484571 8 pages 2009
[15] S Ouchemoukh P Schweitzer M B Bey H Djoudad-Kadjiand H Louaileche ldquoHPLC sugar profiles of Algerian honeysrdquoFood Chemistry vol 121 no 2 pp 561ndash568 2010
[16] W Widmer ldquoAnalysis of biomass sugars and galacturonic acidby gradient anion exchange chromatography and pulsed amper-ometric detection without post-column additionrdquo Biotechnol-ogy Letters vol 33 no 2 pp 365ndash368 2011
[17] C Corradini A Cavazza and C Bignardi ldquoHigh-performanceanion-exchange chromatography coupled with pulsed electro-chemical detection as a powerful tool to evaluate carbohydrates
of food interest principles and applicationsrdquo InternationalJournal of Carbohydrate Chemistry vol 2012 Article ID 48756413 pages 2012
[18] C Ma Z Sun C Chen L Zhang and S Zhu ldquoSimultaneousseparation and determination of fructose sorbitol glucose andsucrose in fruits by HPLC-ELSDrdquo Food Chemistry vol 145 pp784ndash788 2014
[19] P Shanmugavelan S Y Kim J B Kim et al ldquoEvaluation ofsugar content and composition in commonly consumedKoreanvegetables fruits cereals seed plants and leaves by HPLC-ELSDrdquo Carbohydrate Research vol 380 pp 112ndash117 2013
[20] X Liu N Ai H Zhang et al ldquoQuantification of glucose xylosearabinose furfural andHMF in corncob hydrolysate byHPLC-PDA-ELSDrdquo Carbohydrate Research vol 353 pp 111ndash114 2012
[21] U Sharma P Bhandari N Kumar and B Singh ldquoSimultaneousdetermination of ten sugars inTinospora cordifolia by ultrasonicassisted extraction and LC-ELSDrdquoChromatographia vol 71 no7-8 pp 633ndash638 2010
[22] F A Agblevor B R Hames D Schell and H L ChumldquoAnalysis of biomass sugars using a novel HPLC methodrdquoApplied Biochemistry and Biotechnology vol 136 no 3 pp 309ndash326 2007
[23] R Slimestad and I M Vagen ldquoThermal stability of glucose andother sugar aldoses in normal phase high performance liquidchromatographyrdquo Journal of Chromatography A vol 1118 no 2pp 281ndash284 2006
[24] K Downes and L A Terry ldquoA new acetonitrile-free mobilephase method for LC-ELSD quantification of fructooligosac-charides in onion (Allium cepa L)rdquo Talanta vol 82 no 1 pp118ndash124 2010
[25] R Slimestad R Seljaasen KMeijer and S L Skar ldquoNorwegian-grown Jerusalem artichoke (Helianthus tuberosus L) morphol-ogy and content of sugars and fructo-oligosaccharides in stemsand tubersrdquo Journal of the Science of Food and Agriculture vol90 no 6 pp 956ndash964 2010
[26] EM Bainy SM ToshM Corredig V Poysa and LWoodrowldquoVarietal differences of carbohydrates in defatted soybean flourand soy protein isolate by-productsrdquo Carbohydrate Polymersvol 72 no 4 pp 664ndash672 2008
[27] T M Kuo J F vanMiddlesworth and W J Wolf ldquoContent ofraffinose oligosaccharides and sucrose in various plant seedsrdquoJournal of Agricultural and Food Chemistry vol 36 no 1 pp32ndash36 1988
[28] E Giannoccaro Y-J Wang and P Chen ldquoEffects of solventtemperature time solvent-to-sample ratio sample size anddefatting on the extraction of soluble sugars in soybeanrdquo Journalof Food Science vol 71 no 1 pp C59ndashC64 2006
[29] Y Lv X B Yang Y Zhao Y Ruan Y Yang and Z Z WangldquoSeparation and quantification of component monosaccharidesof the tea polysaccharides from Gynostemma pentaphyllum byHPLCwith indirect UV detectionrdquo Food Chemistry vol 112 no3 pp 742ndash746 2009
[30] A Hou P Chen J Alloatti et al ldquoGenetic variability of seedsugar content in worldwide soybean germplasm collectionsrdquoCrop Science vol 49 no 3 pp 903ndash912 2009
[31] L Fang M Wan M Pennacchio and J Pan ldquoEvaluation ofevaporative light-scattering detector for combinatorial libraryquantitation by reversed phaseHPLCrdquo Journal of CombinatorialChemistry vol 2 no 3 pp 254ndash257 2000
[32] S Man W Gao Y Zhang et al ldquoQualitative and quantitativedetermination of major saponins in Paris and Trillium by
8 Chromatography Research International
HPLC-ELSD and HPLC-MSMSrdquo Journal of ChromatographyB vol 878 no 29 pp 2943ndash2948 2010
[33] Y Tang W Jiang Q Wu et al ldquoComparative characteristic ofthe inflammatory diterpenes in the roots of Euphorbia fisch-eriana with different preparation method using HPLC-ELSDrdquoFitoterapia vol 83 no 3 pp 427ndash433 2012
Submit your manuscripts athttpwwwhindawicom
Hindawi Publishing Corporationhttpwwwhindawicom Volume 2014
Inorganic ChemistryInternational Journal of
Hindawi Publishing Corporation httpwwwhindawicom Volume 2014
International Journal ofPhotoenergy
Hindawi Publishing Corporationhttpwwwhindawicom Volume 2014
Carbohydrate Chemistry
International Journal of
Hindawi Publishing Corporationhttpwwwhindawicom Volume 2014
Journal of
Chemistry
Hindawi Publishing Corporationhttpwwwhindawicom Volume 2014
Advances in
Physical Chemistry
Hindawi Publishing Corporationhttpwwwhindawicom
Analytical Methods in Chemistry
Journal of
Volume 2014
Bioinorganic Chemistry and ApplicationsHindawi Publishing Corporationhttpwwwhindawicom Volume 2014
SpectroscopyInternational Journal of
Hindawi Publishing Corporationhttpwwwhindawicom Volume 2014
The Scientific World JournalHindawi Publishing Corporation httpwwwhindawicom Volume 2014
Medicinal ChemistryInternational Journal of
Hindawi Publishing Corporationhttpwwwhindawicom Volume 2014
Chromatography Research International
Hindawi Publishing Corporationhttpwwwhindawicom Volume 2014
Applied ChemistryJournal of
Hindawi Publishing Corporationhttpwwwhindawicom Volume 2014
Hindawi Publishing Corporationhttpwwwhindawicom Volume 2014
Theoretical ChemistryJournal of
Hindawi Publishing Corporationhttpwwwhindawicom Volume 2014
Journal of
Spectroscopy
Analytical ChemistryInternational Journal of
Hindawi Publishing Corporationhttpwwwhindawicom Volume 2014
Journal of
Hindawi Publishing Corporationhttpwwwhindawicom Volume 2014
Quantum Chemistry
Hindawi Publishing Corporationhttpwwwhindawicom Volume 2014
Organic Chemistry International
ElectrochemistryInternational Journal of
Hindawi Publishing Corporation httpwwwhindawicom Volume 2014
Hindawi Publishing Corporationhttpwwwhindawicom Volume 2014
CatalystsJournal of

2 Chromatography Research International
are normally used as the mobile phase [7] Normal phasecan be used for separating sugars from a complex matrixAnion-exchange columns are packed with polymeric resinattachedwith quaternary ammonium and such columns haveto incorporate with a strong basic mobile phase (pH gt 12) insugar analysis
Preferred chromatographic detection of sugars includesrefractive index UV-visible fluoresce pulsed amperometricdetector mass spectrometry and evaporative light scatteringRefractive index (RI) detector has been used for analyzingoligosaccharides from soybean since the 70rsquos [8] and it is still apopular detector in soybean sugar analyses [9 10] Neverthe-less sensitivity and selectivity of this detector are poor Dueto the lack of chromophore atmid-UVwavelengths carbohy-drates are only detectable byUV-visible detector at the deeperUV range of 190 nmndash195 nm At such short wavelengthsinterference from mobile phase is inevitable since most ofthe solvents absorb strongly as well To enhance UV absorp-tion of carbohydrate some researchers resorted to samplederivatization [11ndash13] Such sample treatment complicated theanalytical procedures and contributed to preventable assayvariability Pulsed amperometric detector coupled with anionexchange column (HPAEC-PAD) is one of the popular HPLCsystems for carbohydrate analysis due to its better sensitivityand selectivity [14ndash17] However reliability of HPAEC-PADis dependent on the chemical purity of the mobile phaseThe HPAEC-PAD requires high alkaline (pH gt 12) mobilephase Dissolved carbon dioxide from the atmosphere orcarbonate contamination of mobile phase reduces columnretaining power as a result of the buildup of interferinganions in the stationary phase A common problem of theabove detectors is baseline drifting with gradient elutionPopularity of evaporative light scattering detection (ELSD) isfast growing in chemical and biochemical analysis In the pastdecade ELSDhas beenwidely utilized for analyzing lipids andcarbohydrates in plants fruits beverages milks and severalother different tissues and organisms [18ndash25]Theprinciple ofevaporating solvents prior to detection employed in the ELSDresolves baseline shifting and therefore enhances baselinestability and response intensity
Sample preparation is an important step inmethod devel-opment for soybean and other plants The procedure nor-mally consists of sample extraction and sample purificationIn some studies soybean flour or powder was first defattedusing hexane or other appropriate solvents The defattedsamples were then refluxed in ethanol aqueous solutions atelevated temperatures for a certain length of time [26 27]Giannoccaro et al reported that water extracts sugars mostefficiently from the nondefatted soybeans [28] The extractsolution was then purified with an organic solvent such asacetonitrile or ethanol to remove soluble proteins [14 29]
In this paper we report a simplified method to analyzesugars from soybean Sample preparation was successivelyconducted in the same sample vial It overcame long andelaborate procedures engaged in early methods such as toseparate soybean tissues from the extract to allocate todry and to redissolve the extracted solution The HPLCconditions of this method were optimized for high chro-matographic resolution and short run time Addition of 25
acetone to acetonitrile mobile phase was found critical toimprove separation of galactose from its adjacent epimerglucoseThismethod is highly useful for screening large scalesoybean populations in genetic and breeding programs forcrop improvement with value-added traits
2 Materials and Methods
21 Materials and HPLC System Sugar standards D-fructose D-(+) galactose D-(+) glucose sucrose D-(+)meli-biose D-(+) raffinose pentahydrate and stachyose hydratewere purchased from Sigma Aldrich (St Louis MO USA)HPLC grade of acetonitrile acetone and water were pur-chased from Fisher Scientific (Hampton NH USA) Com-pressed nitrogen of ultrahigh-purity (UHP) grade was pur-chased from Praxair (Danbury CT USA)The HPLC-ELSDsystem was Agilent 1200 series (Agilent USA) The PrevailCarbohydrate ES columns 5 120583 250mm times 46mm and guardcolumns 75 times 46mm were from Grace Davison DiscoverySciences (Deerfield IL USA) Soybean seeds were harvestedfrom the Bradford Research Farm Columbia Missouri andDelta Research Center Portageville Missouri
22 Sample and Standard Preparation Approximately onegram of soybean seeds was ground using Thomas WileyMini-Mill fitted with 20-mesh screen The ground powderwas lyophilized for two days in a Labconco Freeze DrySystem (Labconco USA) Dried soybean powder of 9025(plusmn025)mgwas weighed andmixedwith 900 120583LHPLC-gradewater in 2mL centrifuge vials The vials were incubated at55∘C with 250 rpm agitation for 30 minutes followed by30-second high speed vortex After cooling down to roomtemperature 900 120583L HPLC grade acetonitrile was blendedin The suspension was centrifuged for 30 minutes at 133 times1000minminus1 timesgThe supernatant was further diluted five timeswith acetonitrile water mixture of 65 35 (vv) before beingsubjected to HPLC analysis Sugar standards were preparedin water with concentrations of 50 100 200 300 400 500and 1000 120583gmL
23 HPLC Analysis Two kinds of mobile phase were pre-pared mobile phase A was pure water and mobile phase Bwas acetonitrile acetone mixture of 75 25 (vv) Flow rateand gradient of phases A and B (Table 1) were optimized forcomplete separation of the sugars in the shortest run timeColumn temperature was maintained at 35∘C throughoutthe gradient program Detector temperature was isothermalat 55∘C Nebulizer pressure was 34 bar Ultrapurity-gradenitrogen (grade 50) was used as the nebulizer gas Sampleinjection volume was 5 120583L
3 Results and Discussion
31 Sample Preparation Soybean is known for high proteinA substantial amount of protein concurrently dissolves inwater during extraction Purification of the extract is there-fore very important to eliminate matrix interference from thedissolved proteins Protein was commonly precipitated with
Chromatography Research International 3
95 or pure acetonitrile Earlier methods required four toseven steps to conduct purification which included prepa-ration of 95 acetonitrile separation of suspended sugarsolution from soybean tissues transferring a given volume ofsupernatant to a new tube blending in acetonitrile remov-ing protein drying and redissolving sugars Our methodrequires only two steps that is directly adding pure acetoni-trile to the same sample vial after the completion of extrac-tion and removing soybean tissue and precipitated proteinssimultaneously This modified method effectively eliminatesprocess variables as less preparation steps were involved
Dilution is another key factor in this method Low con-centration of sugars is desirable not only for optimum peakshape and separation but also for an extended column lifecycle However abundance of different sugars varies greatlyin soybean for example Hou et al showed that soybean iscomposed of 007ndash015 glucose 008ndash019 fructose 56ndash94 sucrose 03ndash14 raffinose and 03ndash6 stachyose [30]After taking consideration of all possible impacts we set thedilution factor as 10 that is solvent-to-sample ratio of 10 1(mgmL)
32 Chromatographic Separation The HPLC mobile phaseplays a crucial role in sugar separation Addition of acetoneto acetonitrile mobile phase differentiates this method fromother publishedmethods As shown in Figure 1 acetone effec-tively improves peak resolution without additional elutiontime Figures 1(a) and 1(b) represent chromatograms obtainedfrom mobile phases with and without acetone The acetonewith a portion of 20 to 30 in acetonitrile was capable ofresolving galactose and glucose isomers although galactosewas under the detection limit (very low concentrations) inmost of the soybean seeds The 10 window of acetoneconcentration inmobile phasemakes thismethod robustTheelution gradient was accomplished with the mixed solventsof acetone and acetonitrile (2575) and water Emergence ofall sugars occurred before 14 minutes Six more minutes wereprogrammed to stabilize the system At retention time of 141minutes the flow rate was promptly reduced to 02mLminfrom 12mLmin and meanwhile the mobile phase ratio of Aand B was changed to 20 80 from 50 50 (see Table 1) Thisgradient change allows the system to reach its initial stagewithout causing high column back pressure
33 Identification andQuantification Each sugar componentwas recognized by its distinctive retention time Commercialreferences were used for confirmation Under the chromato-graphic conditions described in Section 2 sugars eluted inthe order of fructose galactose glucose sucrose melibioseraffinose and stachyose as shown in Figure 2
Figure 3 represents three types of sugar distribution ofsoybean germplasm seeds Figure 3(a) is from a soybeangermplasm that has multiple sugars and each sugar has asignificant amount Figure 3(b) indicates that sucrose andstachyose are predominant components in another soybeangermplasm line The chromatogram (Figure 3(c)) is from adifferent soybean germplasm and this sugar profile is mostdesirable for animal feed usesThis germplasm line with high
Gal
acto
se
8
Glu
cose
(a)
8
Gal
acto
se G
luco
se
(b)
Figure 1 Chromatograms obtained from (a) acetone in mobilephase (b) no acetone in mobile phase
Table 1 Gradient-elution of mobile phases
Time (minutes) A B Flow rate (mLmin)0 20 80 125 20 80 1212 50 50 1214 50 50 12141 20 80 0220 20 80 12
sucrose low raffinose and low stachyose was discoveredafter screening more than 1000 germplasm lines (PlantIntroductions) obtained from the USDA seed bank (USDA-GRIN) and grown in the University of Missouri (MU)research fields During all of the germplasm screeningsgalactose was least abundant and not detectable in most ofthe soybean lines Trace amount of melibiose was detectedonly in few soybean lines
Quantification of the sugars was accomplished by cali-bration curves that ranged from 50 to 1000 120583gmL (Figures4(a) and 4(b)) Fundamentally an ELSD responds to con-centration change in a nonlinear fashion The relationshipbetween measured peak area or peak height and sample con-centrations is reflected by a 2nd-order polynomial equationas shown below
A = aX2 (1)
where A is peak area (or peak height) a is quadraticcoefficient and X is sample concentration To correct thequadratic effect a mathematical model [31ndash33] is usuallyused such as logA = a1015840 + 2 logX We found a solid linear
4 Chromatography Research International
5 10 15
Fruc
tose
Gal
acto
seG
luco
se
Sucr
ose
Meli
bios
eRa
ffino
se
Stac
hyos
e
Figure 2 Chromatogram of sugar standards (concentration of eachsugar is 300 120583gmL)
regression after logarithmic conversion in the specified rangeof 50 to 1000 120583gmL except for galactose which is slightly nar-rowed down to the range of 200 to 1000120583gmL Correlationcoefficient 1198772 values of all sugars were greater than 099 Thismodel allows us to perform quantification directly from (1)without applying other conversion or mathematical models
34 Method Validation Spike Recovery Rate Detection Limitand Precision Test Recovery rate of each sugar was obtainedby spiking known amount of standards at different steps ofsample preparation In one of the spiking experiments stan-dards were added to the dried soybean samples In anotherexperiment spike standards were added to the sugar extractsIn both cases 500120583gmL of each sugar standard was spikedEach experiment was repeated four times The recoveryresult was shown in Table 2 Most of the spiked standardswere recovered close to 100 Detection limit (DL) of eachindividual sugar was calculated based on the formula below
Detection limit (120583gmL) = 50SNtimes 3 (2)
where 50 is the concentration of standard in the unit of120583gmL used for DL determination and SN is the ratio ofsignal over noise produced from the 50 120583gmL standard
Relative standard deviation (RSD) of both interday andintraday was determined and reported in Table 2 Intradayvariation was less than 3 and interday variation was lessthan 10 except for melibiose that is at a trace level andtherefore detected with a higher variation
Accuracy of the method was further evaluated on anHPAEC-PAD system from an external lab Six finely groundand dried soybean seed samples were verified by theHPAEC-PAD for sucrose raffinose and stachyose Table 3 shows thatthe results are close from one method to the other exceptthat raffinose in sample-1 and sample-5 is not detectable byHPAEC-PAD Note that each data in Table 3 is an average
6 8 10 12 14
Fruc
tose
Glu
cose
Sucr
ose
Meli
bios
eRa
ffino
se
Stac
hyos
e
1
3
4 5
6
2
(a)
6 8 10 12 14Su
cros
e
Raffi
nose
Stac
hyos
e
3
5
6
(b)
6 8 10 12 14
Sucr
ose
Raffi
nose
Stac
hyos
e3
56
(c)
Figure 3 Distribution of sugars in different soybean germplasmlines
Chromatography Research International 5
002040608112141618
0
5
10
15
20
25
30
0 200 400 600 800 1000
Inte
nsity
of g
alac
tose
Inte
nsity
(120583gmL)StachyoseFructoseGlucoseSucrose
MelibioseRaffinoseGalactose
(a)
minus3
minus2
minus1
0
1
2
3
4
39 49 59 69
Log(
peak
hei
ght)
Log(concentration)
GlucoseFructoseGalactoseMelibiose
SucroseStachyoseRaffinose
(b)
Figure 4Calibration curves of seven sugars (a)Quadratic regression (b) log(peak intensity) log(standard concentration) linear expression
Table 2 Method validation including detection limit repeatability and spike recovery
Detection limitppm
Repeatability Recovery () plusmn RSDIntraday(RSD)
Interday(RSD)
Spike to driedsample
Spike tosugar extract
(119899 = 6) (119899 = 6) (119899 = 4) (119899 = 4)
Fructose 600 22 60 103 plusmn 15 101 plusmn 20Galactose 1350 mdash mdash 105 plusmn 32 111 plusmn 12Glucose 300 20 90 101 plusmn 11 99 plusmn 10Sucrose 93 12 29 99 plusmn 30 98 plusmn 44Melibiose 194 17 120 73 plusmn 14 92 plusmn 05Raffinose 121 17 29 102 plusmn 28 101 plusmn 16Stachyose 100 12 47 102 plusmn 09 102 plusmn 39
value of three replicates Sample-1 and sample-5 have beenfrequently used in our lab as daily controls tomonitor analysisvariations Their values have been consistently obtained as08 and 06 respectively The present method evidentlydemonstrated high sensitivity
35 Application of the Method This analytical method hasplayed a significant role in the research projects on thenatural genetic variation of sugar contents and components insoybean seeds and other tissues conducted at the Universityof Missouri The soy industry and soy food markets needsoybeans with high-sucrose low-raffinose and stachyosecontent and with low trypsin inhibitor activity as one pack-age This will provide high levels of energy and yield bettertasting food and feed without inducing indigestion problemsThe extensive screening of soybean plant introductions (PIs)and current soybean varieties for natural genetic variationwill help identifying new sources for gene discovery andfurther application in molecular breeding and crop improve-ment programs More than 5000 lines have been screenedSeveral soybean PIswith low raffinose and stachyose and high
sucrose in seed tissues have been identified Table 4 shows theminimum and maximum levels of major sugar componentsafter a statistical analysis of 540 soybean germplasm lineswithmaturity groups III and IV These maturity groups are highlysuitable for Missouri and other US soybean productionareas Total sugars varied from 567 to 1603mgg that wasequivalent to 57 to 160 of dry matter For an exampleFigure 5 shows the distribution of sucrose content in theselected soybean germplasm lines A few lines with as high as9-10 sucrose were selected after screening around 1500 linesfor crossing and population development for gene discovery
4 Conclusion
Developing an HPLC method that can resolve a mixtureof mono- di- tri- and oligosaccharides in a short elutiontime is a challenge Earlier described methods had severalshortcomings and some of the methods have shown anunacceptable long retention time for raffinose and stachyosewhile some others had poor resolution or broad peaks Themethod presented in this paper is simple fast reliable and
6 Chromatography Research International
Table 3 Comparison of sugar content generated from the present method with the HPAEC-PAD method
Presentmethod
HPAEC-PAD
Presentmethod
HPAEC-PAD
Presentmethod
HPAEC-PAD
Sucrose (dry matter) Stachyose (dry matter) Raffinose (dry matter)(119899 = 3) (119899 = 3) (119899 = 3)
Sample-1 71 68 09 05 08 mdashSample-2 58 48 35 31 06 03Sample-3 47 34 43 32 06 03Sample-4 28 21 37 26 11 09Sample-5 57 42 14 10 06 mdashSample-6 31 21 44 32 09 05
Table 4 Maximum and minimum sugar component concentration in the 540 soybean germplasm lines
Fructose Glucose Sucrose Melibiose Raffinose Stachyose Total sugar(sugar content in soybean mgg (dry matter))
Maximum 166 137 734 77 334 709 1603Minimum 21 mdash 150 mdash 34 32 567Average 81 57 422 38 80 411 1088
20
43
65
88
110
0 400 800 1200 1600
Sucr
ose (
)
Number of soybean lines
Figure 5 Distribution of sucrose contents in the seeds of 1500soybean germplasm
successful in the case of high throughput screening TheHPLC of this method is comprised of a column speciallypacked for carbohydrate assay and equipped with an ELSDdetector The mobile phase is 25 acetone in acetonitrile andwater All major sugars in soybean that is fructose glucosesucrose raffinose and stachyose are completely resolvedin less than 14 minutes Sample preparation procedure ismuch simplified and improved from known methods Theoptimal low sample-to-solvent ratio (10mg 1mL) lessenedsample load and extended HPLC column life More than1500 samples can be analyzed on a single HPLC columnThedetection limit in this method is low for example sucroseis 93 ppm and others are lower than 60 ppm The selectionof calibration range allows direct quantification from thenonlinear detector output Robustness and high throughputapplication of this method help soybeans breeding programsincluding the one for developing soybean varieties withreduced RFOs and higher metabolizable energy
Abbreviations
RFO Raffinose family oligosaccharidesHPLC High performance liquid chromatographyUV UltravioletRI Refractive indexHPAEC-PAD High-performance anion-exchange
chromatography with pulsedamperometric detection
ELSD Evaporative light scattering detectorPI Plant introduction
Conflict of Interests
The authors declare that there is no conflict of interestsregarding the publication of this paper
Acknowledgments
This study was supported by the United Soybean BoardGrant no 1236 The authors acknowledge Dr Grover JShannon for soybean germplasm seed increase at the DeltaResearch Center University of Missouri Portageville Mis-souri and Dr Tri D Vuong Department of Plant ScienceUniversity of Missouri for helping collection of more than5000 data using this method
References
[1] J J Rackis ldquoOligosaccharides of food legumes alphagalactosi-dase activity and flatulence problemrdquo in Physilogical Effects ofFood Carbohydrates A Jeanes and J Hodge Eds pp 207ndash222American Chemical Society Washington DC USA 1975
[2] F L Suarez J Springfield J K Furne T T Lohrmann P SKerr and M D Levitt ldquoGas production in humans ingesting
Chromatography Research International 7
a soybean flour derived from beans naturally low in oligosac-charidesrdquo American Journal of Clinical Nutrition vol 69 no 1pp 135ndash139 1999
[3] J D Neus W R Fehr and S R Schnebly ldquoAgronomic andseed characteristics of soybean with reduced raffinose andstachyoserdquo Crop Science vol 45 no 2 pp 589ndash592 2005
[4] V Kumar A Rani L Goyal et al ldquoSucrose and raffinose familyoligosaccharides (RFOs) in soybean seeds as influenced bygenotype and growing locationrdquo Journal of Agricultural andFood Chemistry vol 58 no 8 pp 5081ndash5085 2010
[5] K B Hagely D Palmquist and K D Bilyeu ldquoClassification ofdistinct seed carbohydrate profiles in soybeanrdquo Journal of Agri-cultural and Food Chemistry vol 61 no 5 pp 1105ndash1111 2013
[6] H F Walton ldquoLigand-exchange chromatography a briefreviewrdquo Industrial and Engineering Chemistry Research vol 34no 8 pp 2553ndash2554 1995
[7] C M Montera M C R Dodero D A G Sanchez and CG Barroso ldquoAnalysis of low molecular weight carbohydrates infood and beverages a reviewrdquo Chromatographia vol 59 no 1-2pp 15ndash30 2004
[8] L T Black and E B Bagley ldquoDetermination of oligosaccharidesin soybeans by high pressure liquid chromatography using aninternal standardrdquo Journal of the AmericanOil Chemistsrsquo Societyvol 55 no 2 pp 228ndash232 1978
[9] J L Chavez-Servın A I Castellote and M C Lopez-SabaterldquoAnalysis of mono- and disaccharides in milk-based formulaeby high-performance liquid chromatography with refractiveindex detectionrdquo Journal of Chromatography A vol 1043 no 2pp 211ndash215 2004
[10] J C M Barreira J A Pereira M B P P Oliveira and I C F RFerreira ldquoSugars profiles of different chestnut (Castanea sativaMill) and almond (Prunus dulcis) cultivars by HPLC-RIrdquo PlantFoods for Human Nutrition vol 65 no 1 pp 38ndash43 2010
[11] F N Lamari R Kuhn and N K Karamanos ldquoDerivatization ofcarbohydrates for chromatographic electrophoretic and massspectrometric structure analysisrdquo Journal of Chromatography BAnalytical Technologies in the Biomedical and Life Sciences vol793 no 1 pp 15ndash36 2003
[12] H K Joung H Huang W K Gyoung and J C Won ldquoSimul-taneous quantitative determination ofmonosaccharides includ-ing fructose in hydrolysates of yogurt and orange juice productsby derivatization of monosaccharides with p-aminobenzoicacid ethyl ester followed by HPLCrdquo Bulletin of the KoreanChemical Society vol 26 no 10 pp 1533ndash1538 2005
[13] R Masuda K Kaneko and I Yamashita ldquoSugar and cyclitoldetermination in vegetables by HPLC using postcolumn fluo-rescent derivatizationrdquo Journal of Food Science vol 61 no 6 pp1186ndash1190 1996
[14] A Hou P Chen A Shi B Zhang and Y-J Wang ldquoSugarvariation in soybean seed assessed with a rapid extraction andquantification methodrdquo International Journal of Agronomy vol2009 Article ID 484571 8 pages 2009
[15] S Ouchemoukh P Schweitzer M B Bey H Djoudad-Kadjiand H Louaileche ldquoHPLC sugar profiles of Algerian honeysrdquoFood Chemistry vol 121 no 2 pp 561ndash568 2010
[16] W Widmer ldquoAnalysis of biomass sugars and galacturonic acidby gradient anion exchange chromatography and pulsed amper-ometric detection without post-column additionrdquo Biotechnol-ogy Letters vol 33 no 2 pp 365ndash368 2011
[17] C Corradini A Cavazza and C Bignardi ldquoHigh-performanceanion-exchange chromatography coupled with pulsed electro-chemical detection as a powerful tool to evaluate carbohydrates
of food interest principles and applicationsrdquo InternationalJournal of Carbohydrate Chemistry vol 2012 Article ID 48756413 pages 2012
[18] C Ma Z Sun C Chen L Zhang and S Zhu ldquoSimultaneousseparation and determination of fructose sorbitol glucose andsucrose in fruits by HPLC-ELSDrdquo Food Chemistry vol 145 pp784ndash788 2014
[19] P Shanmugavelan S Y Kim J B Kim et al ldquoEvaluation ofsugar content and composition in commonly consumedKoreanvegetables fruits cereals seed plants and leaves by HPLC-ELSDrdquo Carbohydrate Research vol 380 pp 112ndash117 2013
[20] X Liu N Ai H Zhang et al ldquoQuantification of glucose xylosearabinose furfural andHMF in corncob hydrolysate byHPLC-PDA-ELSDrdquo Carbohydrate Research vol 353 pp 111ndash114 2012
[21] U Sharma P Bhandari N Kumar and B Singh ldquoSimultaneousdetermination of ten sugars inTinospora cordifolia by ultrasonicassisted extraction and LC-ELSDrdquoChromatographia vol 71 no7-8 pp 633ndash638 2010
[22] F A Agblevor B R Hames D Schell and H L ChumldquoAnalysis of biomass sugars using a novel HPLC methodrdquoApplied Biochemistry and Biotechnology vol 136 no 3 pp 309ndash326 2007
[23] R Slimestad and I M Vagen ldquoThermal stability of glucose andother sugar aldoses in normal phase high performance liquidchromatographyrdquo Journal of Chromatography A vol 1118 no 2pp 281ndash284 2006
[24] K Downes and L A Terry ldquoA new acetonitrile-free mobilephase method for LC-ELSD quantification of fructooligosac-charides in onion (Allium cepa L)rdquo Talanta vol 82 no 1 pp118ndash124 2010
[25] R Slimestad R Seljaasen KMeijer and S L Skar ldquoNorwegian-grown Jerusalem artichoke (Helianthus tuberosus L) morphol-ogy and content of sugars and fructo-oligosaccharides in stemsand tubersrdquo Journal of the Science of Food and Agriculture vol90 no 6 pp 956ndash964 2010
[26] EM Bainy SM ToshM Corredig V Poysa and LWoodrowldquoVarietal differences of carbohydrates in defatted soybean flourand soy protein isolate by-productsrdquo Carbohydrate Polymersvol 72 no 4 pp 664ndash672 2008
[27] T M Kuo J F vanMiddlesworth and W J Wolf ldquoContent ofraffinose oligosaccharides and sucrose in various plant seedsrdquoJournal of Agricultural and Food Chemistry vol 36 no 1 pp32ndash36 1988
[28] E Giannoccaro Y-J Wang and P Chen ldquoEffects of solventtemperature time solvent-to-sample ratio sample size anddefatting on the extraction of soluble sugars in soybeanrdquo Journalof Food Science vol 71 no 1 pp C59ndashC64 2006
[29] Y Lv X B Yang Y Zhao Y Ruan Y Yang and Z Z WangldquoSeparation and quantification of component monosaccharidesof the tea polysaccharides from Gynostemma pentaphyllum byHPLCwith indirect UV detectionrdquo Food Chemistry vol 112 no3 pp 742ndash746 2009
[30] A Hou P Chen J Alloatti et al ldquoGenetic variability of seedsugar content in worldwide soybean germplasm collectionsrdquoCrop Science vol 49 no 3 pp 903ndash912 2009
[31] L Fang M Wan M Pennacchio and J Pan ldquoEvaluation ofevaporative light-scattering detector for combinatorial libraryquantitation by reversed phaseHPLCrdquo Journal of CombinatorialChemistry vol 2 no 3 pp 254ndash257 2000
[32] S Man W Gao Y Zhang et al ldquoQualitative and quantitativedetermination of major saponins in Paris and Trillium by
8 Chromatography Research International
HPLC-ELSD and HPLC-MSMSrdquo Journal of ChromatographyB vol 878 no 29 pp 2943ndash2948 2010
[33] Y Tang W Jiang Q Wu et al ldquoComparative characteristic ofthe inflammatory diterpenes in the roots of Euphorbia fisch-eriana with different preparation method using HPLC-ELSDrdquoFitoterapia vol 83 no 3 pp 427ndash433 2012
Submit your manuscripts athttpwwwhindawicom
Hindawi Publishing Corporationhttpwwwhindawicom Volume 2014
Inorganic ChemistryInternational Journal of
Hindawi Publishing Corporation httpwwwhindawicom Volume 2014
International Journal ofPhotoenergy
Hindawi Publishing Corporationhttpwwwhindawicom Volume 2014
Carbohydrate Chemistry
International Journal of
Hindawi Publishing Corporationhttpwwwhindawicom Volume 2014
Journal of
Chemistry
Hindawi Publishing Corporationhttpwwwhindawicom Volume 2014
Advances in
Physical Chemistry
Hindawi Publishing Corporationhttpwwwhindawicom
Analytical Methods in Chemistry
Journal of
Volume 2014
Bioinorganic Chemistry and ApplicationsHindawi Publishing Corporationhttpwwwhindawicom Volume 2014
SpectroscopyInternational Journal of
Hindawi Publishing Corporationhttpwwwhindawicom Volume 2014
The Scientific World JournalHindawi Publishing Corporation httpwwwhindawicom Volume 2014
Medicinal ChemistryInternational Journal of
Hindawi Publishing Corporationhttpwwwhindawicom Volume 2014
Chromatography Research International
Hindawi Publishing Corporationhttpwwwhindawicom Volume 2014
Applied ChemistryJournal of
Hindawi Publishing Corporationhttpwwwhindawicom Volume 2014
Hindawi Publishing Corporationhttpwwwhindawicom Volume 2014
Theoretical ChemistryJournal of
Hindawi Publishing Corporationhttpwwwhindawicom Volume 2014
Journal of
Spectroscopy
Analytical ChemistryInternational Journal of
Hindawi Publishing Corporationhttpwwwhindawicom Volume 2014
Journal of
Hindawi Publishing Corporationhttpwwwhindawicom Volume 2014
Quantum Chemistry
Hindawi Publishing Corporationhttpwwwhindawicom Volume 2014
Organic Chemistry International
ElectrochemistryInternational Journal of
Hindawi Publishing Corporation httpwwwhindawicom Volume 2014
Hindawi Publishing Corporationhttpwwwhindawicom Volume 2014
CatalystsJournal of
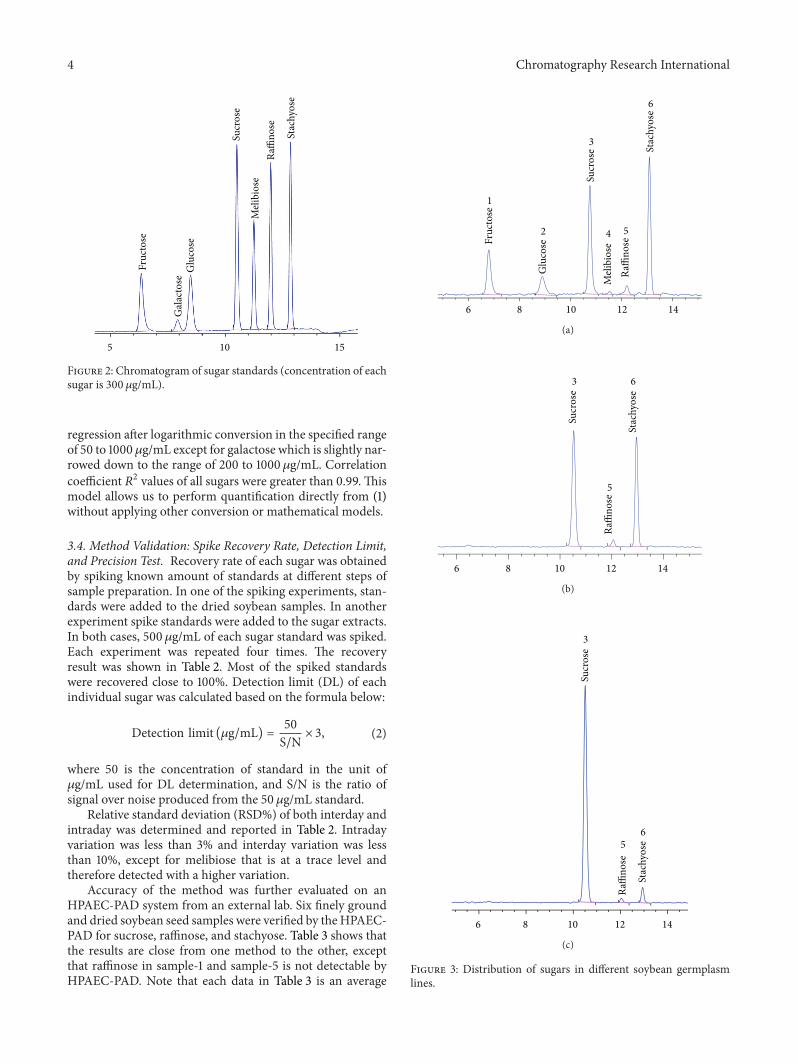
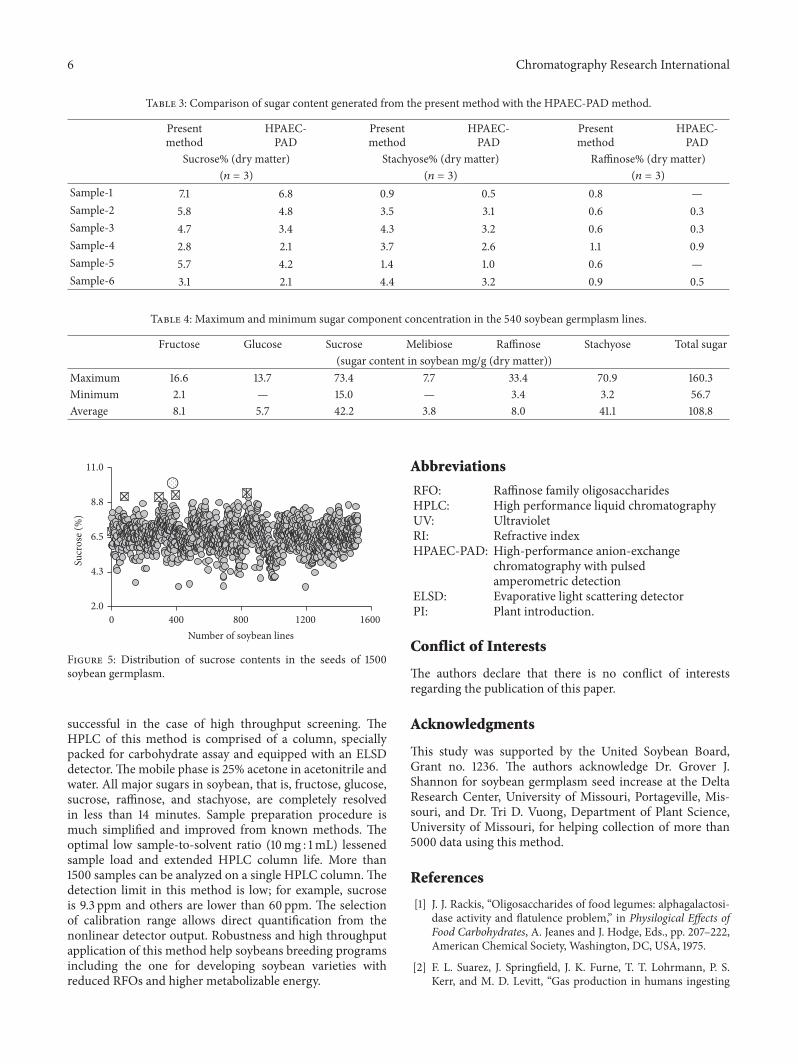