research and development priorities to advance solar
TRANSCRIPT

NREL is a national laboratory of the U.S. Department of Energy Office of Energy Efficiency & Renewable Energy Operated by the Alliance for Sustainable Energy, LLC This report is available at no cost from the National Renewable Energy Laboratory (NREL) at www.nrel.gov/publications.
Contract No. DE-AC36-08GO28308
Technical Report NREL/TP-7A40-80505 October 2021
Research and Development Priorities to Advance Solar Photovoltaic Lifecycle Costs and Performance
Michael Woodhouse, David Feldman, Vignesh Ramasamy, Brittany Smith, Timothy Silverman, Teresa Barnes, Jarett Zuboy, and Robert Margolis

NREL is a national laboratory of the U.S. Department of Energy Office of Energy Efficiency & Renewable Energy Operated by the Alliance for Sustainable Energy, LLC This report is available at no cost from the National Renewable Energy Laboratory (NREL) at www.nrel.gov/publications.
Contract No. DE-AC36-08GO28308
National Renewable Energy Laboratory 15013 Denver West Parkway Golden, CO 80401 303-275-3000 • www.nrel.gov
Technical Report NREL/TP-7A40-80505 October 2021
Research and Development Priorities to Advance Solar Photovoltaic Lifecycle Costs and Performance
Michael Woodhouse, David Feldman, Vignesh Ramasamy, Brittany Smith, Timothy Silverman, Teresa Barnes, Jarett Zuboy, and Robert Margolis
Suggested Citation Woodhouse, Michael, David Feldman, Vignesh Ramasamy, Brittany Smith, Timothy Silverman, Teresa Barnes, Jarett Zuboy, and Robert Margolis. 2021. Research and Development Priorities to Advance Solar Photovoltaic Lifecycle Costs and Performance. Golden, CO: National Renewable Energy Laboratory. NREL/TP-7A40-80505. https://www.nrel.gov/docs/fy22osti/80505.pdf.
NOTICE
This work was authored by the National Renewable Energy Laboratory, operated by Alliance for Sustainable Energy, LLC, for the U.S. Department of Energy (DOE) under Contract No. DE-AC36-08GO28308. Funding provided by U.S. Department of Energy Office of Energy Efficiency and Renewable Energy Solar Energy Technologies Office. The views expressed herein do not necessarily represent the views of the DOE or the U.S. Government.
This report is available at no cost from the National Renewable Energy Laboratory (NREL) at www.nrel.gov/publications.
U.S. Department of Energy (DOE) reports produced after 1991 and a growing number of pre-1991 documents are available free via www.OSTI.gov.
Cover Photo by Dennis Schroeder: NREL 40820.
NREL prints on paper that contains recycled content.

iii This report is available at no cost from the National Renewable Energy Laboratory at www.nrel.gov/publications.
The Solar Futures Study and Supporting Reports The Solar Futures Study, initiated by the U.S. Department of Energy (DOE) Solar Energy Technologies Office and led by the National Renewable Energy Laboratory (NREL), envisions how, over the next few decades, solar could come to power 40% or more of U.S. electricity demand, dramatically accelerating the decarbonization of buildings, transportation, and industry.
Through state-of-the-art modeling, the Solar Futures Study is the most comprehensive review to date of the potential role of solar in decarbonizing the U.S. electric grid and broader energy system. However, not all the detailed analysis that informed the Solar Futures Study could be included within its pages. This further analysis is collected in additional National Renewable Energy Laboratory reports, each dedicated to a different technology or socioeconomic concern.
This report, Research and Development Priorities to Advance Solar Photovoltaic Lifecycle Costs and Performance, focuses on a particular technology area that could contribute to decarbonization.
The Solar Futures Study Reports • Solar Futures Study (main report published by DOE) • Research Priorities for Solar Photovoltaics in a Decarbonized U.S. Grid • The Role of Concentrating Solar-Thermal Power Technologies in a Decarbonized U.S. Grid • The Demand-Side Opportunity: The Roles of Distributed Solar and Building Energy Systems in a
Decarbonized Grid • Maximizing Solar and Transportation Synergies • The Potential for Electrons to Molecules Using Solar Energy • Affordable and Accessible Solar for All: Barriers, Solutions, and On-Site Adoption Potential • Forthcoming Environment and Circular Economy Report
You can learn more about the project and reports on the NREL website at https://www.nrel.gov/analysis/solar-futures.html.

iv This report is available at no cost from the National Renewable Energy Laboratory at www.nrel.gov/publications.
Acknowledgments We would like to acknowledge contributions from the members of our technical review panel: Alex Au (NEXTracker); Todd Barnum (Linton Crystal); Kirt Johnson (REC Silicon); Brian Lynch (LG Electronics USA); David Okawa (SunPower Corporation); Dana Olson (DNV); Scott Stephens (Clearway Energy); and Dirk Weiss (First Solar). We would also like to acknowledge Henry Hieslmair (DNV) for the insightful collaboration regarding PV module reliability. Finally, from within NREL we are sincerely appreciative of Nick Grue and Jane Lockshin for contributions of levelized cost of electricity statistics using the Renewable Energy Potential (rEV) model, Billy Roberts for the levelized cost of electricity maps, Jonathan Ho for U.S. PV deployment scenarios, and Alfred Hicks for the always incredible graphic arts support.

v This report is available at no cost from the National Renewable Energy Laboratory at www.nrel.gov/publications.
List of Acronyms ALD atomic layer deposition ARC antireflection coating a-Si amorphous silicon ATB Annual Technology Baseline BOS balance of system BSF back surface field CA California CapEx capital expenditures C&I commercial and industrial C-AST combined accelerated stress testing CIGS copper indium gallium diselenide c-Si crystalline silicon EPC engineering, procurement, and construction FIT feed-in tariff GCR ground coverage ratio GW gigawatt GWDC gigawatt-direct current HJT heterojunction technology solar cell IBC interdigitated back contact solar cell ILR inverter loading ratio ITC investment tax credit ITRPV International Technology Roadmap for Photovoltaic kW kilowatts kWh kilowatt-hours kWp kilowatt-peak LCOE levelized cost of electricity LPCVD low pressure chemical vapor deposition MACRS Modified Accelerated Cost Recovery System MWh megawatt-hours MWT metal wrap through solar cell NEM net energy metering NREL National Renewable Energy Laboratory O&M operation and maintenance PECVD plasma enhanced chemical vapor deposition PERC passivated emitter and rear cell solar cell PERL passivated emitter and rear locally diffused solar cell PERT passivated emitter and rear totally diffused solar cell PII permitting, inspection, and interconnection PPA power purchase agreement PVD pulsed vapor deposition R&D research and development SAM System Advisor Model TCO transparent conducting oxide TOPCon tunnel oxide passivated contact solar cell TW terawatt

vi This report is available at no cost from the National Renewable Energy Laboratory at www.nrel.gov/publications.
USD U.S. dollars VDC volts-direct current WDC watts-direct current wph wafers per hour

vii This report is available at no cost from the National Renewable Energy Laboratory at www.nrel.gov/publications.
Executive Summary This report in the series of Solar Futures Studies reports articulates solar photovoltaic (PV) technology research and development (R&D) priorities that could enable the PV electricity cost targets within the Solar Futures Study scenarios. We focus on the Advanced scenario, which reaches 1 terawatt (TW) of PV in the United States by 2036 and up to 2 TW of PV in the United States by 2050. These 1–2 TW deployment levels represent a 10- to 20-fold increase over current cumulative U.S. PV deployment levels (Feldman and Margolis 2021).
Figure ES-1 (page viii) illustrates the 2020 benchmarks (Feldman, Ramasamy et al. 2021) and Solar Futures Study Advanced scenario targets across three areas: PV system capital costs, operation and maintenance expenses, and lifetime energy yield. These are the principal drivers of PV levelized cost of electricity (LCOE). The figure also summarizes R&D priorities that could help enable cost reductions in each of these areas. These priorities are discussed in detail throughout this report.
We calculate that achieving these target costs and performance metrics will reduce utility-scale PV LCOE such that all solar resource areas across the continental United States would be below current LCOE benchmarks for even the best solar resource areas in the Southwest (Figure ES-2, page ix). NREL’s Renewable Energy Potential (reV) model results for around 209,000 calculations are that the median and mean Advanced PV real LCOE across the United States (1.6 cents/kWh) would be less than half the calculated 2020 benchmark median and mean real LCOE of 3.5 cents/kWh. Achieving these ultralow LCOE targets would make PV an even more costs-competitive solution for the decarbonizing electricity supply in the United States.

viii This report is available at no cost from the National Renewable Energy Laboratory at www.nrel.gov/publications.
Figure ES-1. PV sector characteristics for the 2020 Benchmark and PV Technology Advanced
scenarios and examples of R&D priorities to achieve the improvements shown

ix This report is available at no cost from the National Renewable Energy Laboratory at www.nrel.gov/publications.
Figure ES-2. Maps (top) and statistics and distribution (bottom) of real LCOE for the U.S. PV 2020
benchmark and advanced technology scenarios

x This report is available at no cost from the National Renewable Energy Laboratory at www.nrel.gov/publications.
Table of Contents 1 Introduction ........................................................................................................................................... 1 2 PV Cost and Performance Benchmarks and Solar Futures Study Targets .................................... 5 3 PV Module Costs ................................................................................................................................ 10
3.1 Benchmark (2020) Module Costs................................................................................................ 10 3.1.1 PV Cell Technologies..................................................................................................... 10 3.1.2 Historical and Projected Improvements in PV Cell and Module Efficiencies and Costs
........................................................................................................................................ 13 3.2 Key R&D Opportunities to Reduce Module Costs ..................................................................... 21
4 Balance-of-System Costs .................................................................................................................. 22 4.1 Benchmark (2020) PV System Costs .......................................................................................... 22 4.2 BOS Cost Reductions in Solar Futures Study Scenarios............................................................. 24
4.2.1 Module Efficiency .......................................................................................................... 24 4.2.2 Power Electronics ........................................................................................................... 25 4.2.3 Installation Labor and Materials .................................................................................... 26 4.2.4 Permitting, Inspection, and Interconnection (PII) .......................................................... 26 4.2.5 Customer Acquisition ..................................................................................................... 26 4.2.6 Overhead and Profit ....................................................................................................... 27 4.2.7 Financing Costs .............................................................................................................. 27
4.3 Key R&D Opportunities to Reduce PV System Capital Costs ................................................... 28 5 Operation and Maintenance Expenses ............................................................................................ 30
5.1 Benchmark (2020) O&M Costs .................................................................................................. 30 5.2 Pathways to Lower O&M Expenses by Improved Reliability .................................................... 32
5.2.1 Improving Product Reliability by Indoor and Outdoor Testing ..................................... 32 5.2.2 Improving Product Reliability and Lowering O&M by Developing Testing and Report
Standards for PV System Components .......................................................................... 32 5.2.3 LCOE Impacts That Are Due to Improvements in O&M Practices ............................... 34
5.3 Key R&D Opportunities to Reduce O&M Expenses .................................................................. 35 6 Lifetime Performance ......................................................................................................................... 37
6.1 Benchmark (2020) Energy Yield and LCOE Modeling .............................................................. 37 6.2 Road Maps to Improved Energy Yield and Lower LCOE in the Solar Futures Study Scenarios 39 6.3 Key R&D Opportunities to Improve PV System Lifetime Power Production ............................ 44
7 Conclusions and Outlook .................................................................................................................. 46 References ................................................................................................................................................. 48

xi This report is available at no cost from the National Renewable Energy Laboratory at www.nrel.gov/publications.
List of Figures Figure ES-1. PV sector characteristics for the 2020 Benchmark and PV Technology Advanced scenarios
and examples of R&D priorities to achieve the improvements shown ................................. viii Figure ES-2. Maps (top) and statistics and distribution (bottom) of real LCOE for the U.S. PV 2020
benchmark and advanced technology scenarios...................................................................... ix Figure 1. Principal components in the c-Si PV module supply chain and a common 2020 monocrystalline
silicon module with half-cut cells ............................................................................................ 1 Figure 2. Principal components of PV systems for utility-scale ground-mount (left) and residential rooftop
(right) applications ................................................................................................................... 1 Figure 3. Residential (top left), commercial (top right), and utility-scale (bottom) PV systems .................. 2 Figure 4. Historical and projected annual U.S. PV installations ................................................................... 3 Figure 5. U.S. and global annual PV installations, 2010–2020 .................................................................... 4 Figure 6. Conceptual overview of PV project pro forma cash flow analyses including LCOE ................... 5 Figure 7. Historical prices and 2030 Solar Futures Study price targets for residential (top), commercial
(middle), and utility-scale (bottom) PV systems ...................................................................... 7 Figure 8. Year-one energy yield statistics (kWhAC/kWDC) for utility PV systems across the United States 7 Figure 9. Schematic of multiple pathways to achieve the Advanced scenario ............................................. 9 Figure 10. Overview of the c-Si architectures covered in this report ......................................................... 10 Figure 11. Overview of the general thin-film cell architecture and module used in this report ................. 13 Figure 12. Summary of results for 2020 benchmark module production cost analysis and market share
compilations from analyst reports and the International Technology Roadmap for Photovoltaic (ITRPV) ............................................................................................................ 15
Figure 13. PV cell and module technology progress .................................................................................. 16 Figure 14. Summary of results for 2020 benchmark and future module costs analysis for monocrystalline
silicon PV ............................................................................................................................... 18 Figure 15. Summary of results for 2020 benchmark and future module costs analysis for CdTe .............. 20 Figure 16. Overview of 2020 benchmark PV system capital costs analysis ............................................... 22 Figure 17. Sensitivity analysis for one-axis tracking utility-scale PV 2020 benchmark capital cost ......... 23 Figure 18. U.S. utility-scale PV capital costs as a function of module efficiency, size, and weight .......... 24 Figure 19. Benchmark 2020 O&M costs including ownership costs (property taxes, insurance, asset
management, site security (if applicable), and operations administration ............................. 31 Figure 20. Most recent evolution of c-Si module technologies .................................................................. 33 Figure 21. LCOE sensitivity to O&M expenses for utility-scale PV in the United States ......................... 35 Figure 22. Utility-scale LCOE as a function of first-year energy yield and subsequent degradation rate,
with constant capital costs ($1.0/WDC) and O&M ($17.5/kWDC-yr) ...................................... 38 Figure 23. 2020 Benchmark utility-scale LCOE maps (top) and statistics and distribution (bottom) for the
continental United States, based upon aggregating about 209,000 data points using NREL’s SAM and reV models ............................................................................................................. 39
Figure 24. Statistics of annual energy yield for the 2020 benchmark and Conservative, Moderate, Advanced, and Breakthrough scenarios ................................................................................. 41
Figure 25. Utility-scale LCOE maps (top) and statistics for the United States from an analysis using NREL’s SAM and reV tools .................................................................................................. 43

xii This report is available at no cost from the National Renewable Energy Laboratory at www.nrel.gov/publications.
List of Tables Table 1. PV O&M and Lifetime Energy Yield Parameters for 2020 U.S. Benchmark and Targets for the
Solar Futures Study Advanced PV 2030 Scenario ................................................................... 8 Table 2. Summary of O&M expenses within Figure 19: 2020 O&M Costs Benchmark for PV Systems in
the United States .................................................................................................................... 31 Table 3. Bifacialities and Temperature Coefficients for Selected Cell Technologies ................................ 40 Table 4. Energy Yield Assumptions and Modeling Results for Solar Futures Study Scenarios: Changes in
System Design and Lifetime Energy Yield Parameters ......................................................... 41 Table 5. Summary of Differences between LCOE Scenarios ..................................................................... 42

1 This report is available at no cost from the National Renewable Energy Laboratory at www.nrel.gov/publications.
1 Introduction This report in the series of Solar Futures Study reports examines research and development (R&D) priorities for solar photovoltaic (PV) modules and systems that could lead to the cost reductions enumerated within the Solar Futures Study scenarios (DOE 2021).
PV electricity production begins at the module level with semiconductor materials that convert sunlight directly into electricity. The semiconductor material varies (see Section 3.1), but crystalline-silicon (c-Si) semiconductors—which have dominated U.S. and global PV module supply to date—constitute about 95% of the modules sold today. Figure 1 illustrates the principal materials in the c-Si PV module supply chain. PV cells combined into modules and arrays of modules—along with various balance-of-system (BOS) components—comprise a PV system (Figure 2).
Figure 1. Principal components in the c-Si PV module supply chain and a common 2020
monocrystalline silicon module with half-cut cells
Figure 2. Principal components of PV systems for utility-scale ground-mount (left) and residential rooftop (right) applications
2 This report is available at no cost from the National Renewable Energy Laboratory at www.nrel.gov/publications.
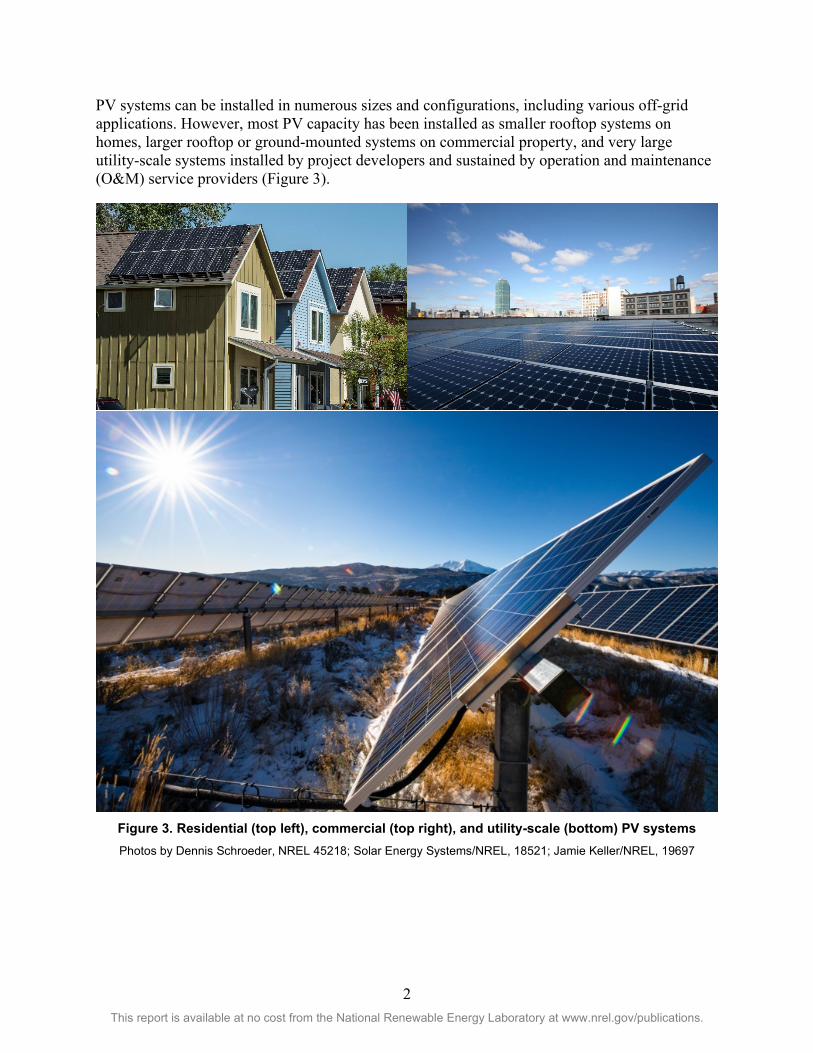
PV systems can be installed in numerous sizes and configurations, including various off-grid applications. However, most PV capacity has been installed as smaller rooftop systems on homes, larger rooftop or ground-mounted systems on commercial property, and very large utility-scale systems installed by project developers and sustained by operation and maintenance (O&M) service providers (Figure 3).
Figure 3. Residential (top left), commercial (top right), and utility-scale (bottom) PV systems Photos by Dennis Schroeder, NREL 45218; Solar Energy Systems/NREL, 18521; Jamie Keller/NREL, 19697

3 This report is available at no cost from the National Renewable Energy Laboratory at www.nrel.gov/publications.
The versatility of PV systems has contributed to their proliferation in recent years as PV system prices have plummeted (see Section 2) and financial incentives from numerous entities have boosted demand. Figure 4 shows 2020 U.S. PV installations, which have become increasingly dominated by utility-scale systems, and projections for the average annual PV capacity additions in the Moderate and Advanced Decarbonization and High Electrification scenarios.
Figure 4. Historical and projected annual U.S. PV installations
For context, Figure 5 shows global annual PV installations by year, where the United States has historically accounted for about 10%–15% of total global demand. Analysts predict cumulative global PV installed capacity will reach more than 900 gigawatts (GW) by the end of 2021. Cumulative U.S. PV installations reached 95.5 GWDC by the end of 2020, which is equivalent to the electricity used by almost 18 million U.S. households (Feldman and Margolis 2021).

4 This report is available at no cost from the National Renewable Energy Laboratory at www.nrel.gov/publications.
Figure 5. U.S. and global annual PV installations, 2010–2020 Sources: Feldman and Margolis 2021; Feldman, Ramasamy et al. 2021
C&I = commercial and industrial
Although PV deployment is growing, it is nowhere near its full technical potential and the United States has some of the best solar resources in the world. One NREL calculation indicated that just 0.6% of the U.S. land area across all 50 states, or 22% of the urban area footprint, could host enough PV to supply all U.S. end-use electricity (Denholm and Margolis 2007). Another NREL study (Gagnon, Margolis et al. 2016) estimated that the rooftops of U.S. buildings alone could host up to 1,118 GW of PV and generate the equivalent of 39% of U.S. electricity demand.
The optimal mix of residential, commercial, and utility-scale PV deployment involves tradeoffs between: (1) the benefits of electricity that is generated and used locally and (2) lower capital costs and higher energy yield for large-scale PV power plants. NREL calculated capital costs equivalent to $5.7/W for new residential, $4.6/W for new commercial, and $4.4/W for new utility-scale PV systems in 2010 (Goodrich, James et al. 2012). That same year, the U.S. Department of Energy set 2020 capital costs targets of $1.5/W for residential, $1.25/W for commercial, and $1.0/W for utility-scale systems for PV as demonstration of significant progress toward a cost-competitive solution for electricity decarbonization (Goodrich, Woodhouse et al. 2012). Ten years later, NREL’s bottom-up system capital cost models returned 2020 benchmark numbers right at the $1.0/W PV system capital cost goal for utility-scale systems but fell short in the residential ($2.7/W) and commercial ($1.7/W) sectors (Feldman, Ramasamy et al. 2021). The Solar Futures Study 2030 Advanced PV scenario sets even more aggressive targets of $0.86/W for residential, $0.78/W for commercial, and $0.50/W for utility-scale PV systems, along with reduced O&M expenses and improved lifetime energy yield (DOE 2021). This report in the series of Solar Futures Study reports explores some potential PV technology improvements and R&D priorities that could assist in bringing these capital costs, O&M, and energy yield goals to fruition and support a more diversified and decarbonized electricity generation system.

5 This report is available at no cost from the National Renewable Energy Laboratory at www.nrel.gov/publications.
2 PV Cost and Performance Benchmarks and Solar Futures Study Targets
The Solar Futures Study scenarios assume specific PV costs and performance metrics are met by 2030, including those related to installed system prices, O&M expenses, and lifetime energy yield. These parameters are the principal inputs to PV project financial modeling (Figure 6). Connecting PV project financial metrics with technology improvement opportunities requires knowing the relationship between initial nameplate efficiency and module and system capital costs, as well as knowing the impacts of energy yield and reliability parameters (including system degradation rate and O&M expenses) on lifecycle cash inflows and outflows. These items determine the most common PV lifecycle economic metric: levelized cost of electricity (LCOE).
Figure 6. Conceptual overview of PV project pro forma cash flow analyses including LCOE
FIT = feed-in tariff, ITC = investment tax credit, PPA = power purchase agreement
Figure 7 shows historical system capital costs and targets in the Conservative, Moderate, Advanced, and Breakthrough scenarios. Table 1 and Figure 8 show the current and Solar Futures Study targets related to O&M expenses and lifetime energy yield parameters. Our 2020 benchmark (Feldman, Ramasamy et al. 2021) and Conservative, Moderate, and Advanced scenarios assume a constant inverter loading ratio (ILR, the DC:AC ratio) and 30-year system lifetimes. The possibility of 50-year PV system lifetimes is explored in the Breakthrough scenario (see Section 6.2).

6 This report is available at no cost from the National Renewable Energy Laboratory at www.nrel.gov/publications.

7 This report is available at no cost from the National Renewable Energy Laboratory at www.nrel.gov/publications.
Figure 7. Historical prices and 2030 Solar Futures Study price targets for residential (top),
commercial (middle), and utility-scale (bottom) PV systems
Figure 8. Year-one energy yield statistics (kWhAC/kWDC) for utility PV systems across the
United States

8 This report is available at no cost from the National Renewable Energy Laboratory at www.nrel.gov/publications.
Table 1. PV O&M and Lifetime Energy Yield Parameters for 2020 U.S. Benchmark and Targets for the Solar Futures Study Advanced PV 2030 Scenario
Residential Commercial Utility-Scale
2020 Advanced PV 2030
2020 Advanced PV 2030
2020 Advanced PV 2030
Total O&M expenses ($/kWDC-yr)
28.94 6.40 18.55 5.70 17.5a 8.1a
Annual system degradation rate
0.70% 0.20% 0.70% 0.20% 0.70% 0.20%
Total DC power losses
13.0% 6.0% 13.0% 6.0% 13.0% 6.0%
Total AC power losses
1.3% 0.5% 1.3% 0.5% 1.3% 0.5%
ILR and ground coverage ratio (GCR)
1.15 1.15 1.15 1.15 1.3 ILR and 0.30 GCR
(monofacial)
1.3 ILR and 0.30 GCRb (bifacial)
System lifetime (years)
30 30 30 30 30 30
a The utility-scale O&M expenses are based on a land leasing model, which is gaining prominence over land purchased as part of the initial capital expense. This is the primary reason why 2030 utility-scale O&M expenses are higher than the 2030 residential and commercial scenarios. b The analysis described in this report works around a boundary condition of using the same ILR and GCR in the 2020 and future scenarios. These parameters can also be adjusted for optimizing bifacial energy yield for specific projects.
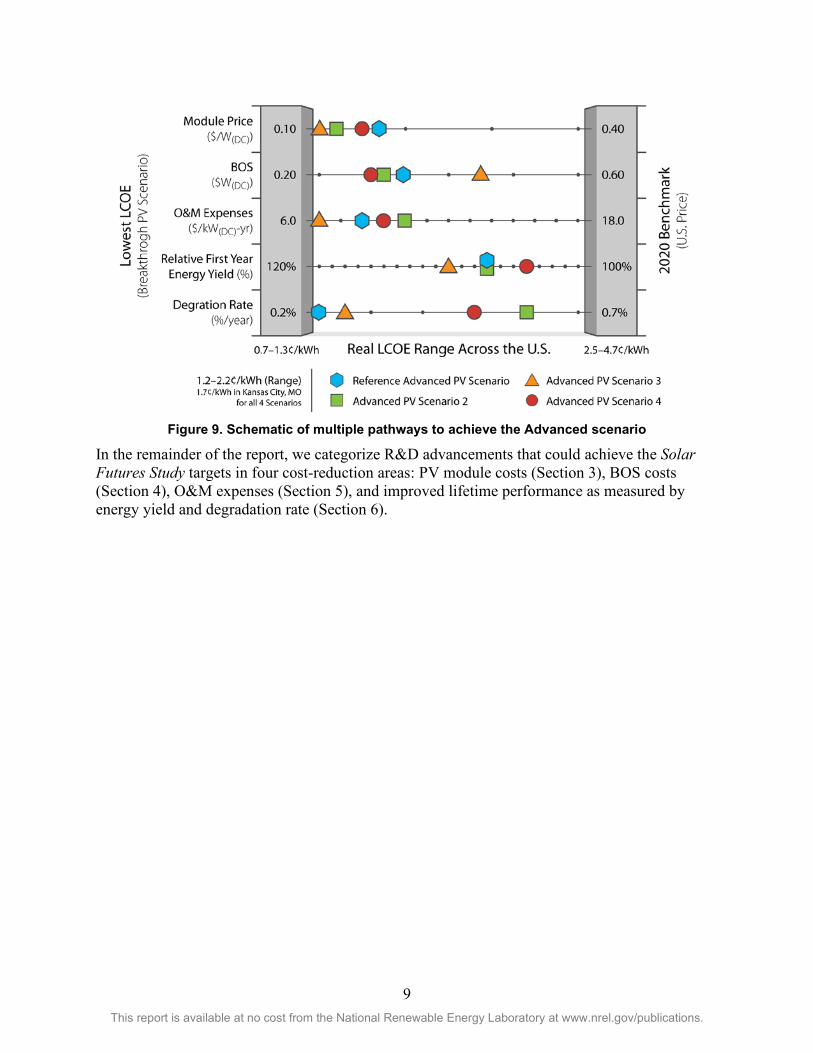
We set specific targets to achieve the LCOE goals related to the Advanced scenario, although numerous other pathways would provide the same systemwide LCOE results. If O&M, energy yield, and/or system lifetime metrics were more favorable, for example, the same LCOE could be achieved at higher installed system prices. Figure 9 illustrates this concept for the Advanced scenario, where the Reference Advanced PV scenario assumptions represented in Table 1 are varied in other scenarios to yield the same LCOE. The potential for multiple combinations to achieve the same LCOE goal—even extending well beyond the four examples shown in the figure—increases confidence that the goal can be achieved.
9 This report is available at no cost from the National Renewable Energy Laboratory at www.nrel.gov/publications.
Figure 9. Schematic of multiple pathways to achieve the Advanced scenario
In the remainder of the report, we categorize R&D advancements that could achieve the Solar Futures Study targets in four cost-reduction areas: PV module costs (Section 3), BOS costs (Section 4), O&M expenses (Section 5), and improved lifetime performance as measured by energy yield and degradation rate (Section 6).

10 This report is available at no cost from the National Renewable Energy Laboratory at www.nrel.gov/publications.
3 PV Module Costs In this section, we address benchmark capital costs for PV modules and discuss advancements that might help the PV module costs envisioned in the Solar Futures Study scenarios be reached.
3.1 Benchmark (2020) Module Costs
3.1.1 PV Cell Technologies Since the effort began in 2010, NREL has utilized a bottom-up cost modeling methodology to benchmark costs and price targets for each step in the c-Si supply chain (Goodrich, Hacke et al. 2013, Woodhouse, Smith et al. 2019). The c-Si cell architectures NREL currently covers for technology costs benchmarking1 are shown in Figure 10. This figure represents our current understanding of the layers and materials within each cell architecture, which determines the steps included in each respective cost model.
Figure 10. Overview of the c-Si architectures covered in this report
Ag silver Al aluminum AlOx aluminum oxide, or alumina
1 See “Solar Technology Cost Analysis,” NREL, https://www.nrel.gov/solar/solar-cost-analysis.html.

11 This report is available at no cost from the National Renewable Energy Laboratory at www.nrel.gov/publications.
ARC antireflection coating BBr3 boron tribromide BSF back surface field Cu copper HJT heterojunction technology IBC interdigitated back contact ITO indium tin oxide LPCVD low pressure chemical vapor deposition Ni nickel PECVD plasma enhanced chemical vapor deposition PERC passivated emitter rear cell PERL passivated emitter rear locally diffused cell PERT passivated emitter rear totally diffused cell POCl3 phosphoryl trichloride PVD pulsed vapor deposition SiNx silicon nitride SiOx silicon oxide Sn tin TCO transparent conducting oxide
The first cell architecture, the passivated emitter rear cell (PERC), was adopted relatively rapidly and currently enjoys the largest market share of all cell technologies. PERC grew from 10% market share in 2015 (Trube et al. 2016) to greater than 80% market share in 2020 because it improves on standard cell efficiencies by at least one whole percentage point (Trube et al. 2021). This efficiency improvement was achieved by introducing two steps beyond the standard full-area metallization approach: an additional passivation layer on the back and a laser contact opening step to allow some direct contact between silicon and aluminum (Steps 6 and 7 of the PERC cell in Figure 10). The additional PERC passivation layer improves cell efficiencies by reducing charge carrier recombination that occurs to a greater degree for full-area metallization. The laser opening still allows for electrical contact between an aluminum paste and silicon, but the recombination area is greatly reduced. Selective emitters have also been incorporated into PERC production, as they help improve efficiency even further and have been easy to implement at high throughputs with laser processing.
The tunnel oxide passivated contact (TOPCon) cell architecture has been the most recent to appear in commercial production. The principal differences between a TOPCon cell on an n-type base wafer and a PERC cell on a p-type base wafer include BBr3 diffusion (instead of POCl3 diffusion) and rear surface passivation achieved using a TOPCon layer (instead of AlOx/SiNx). The TOPCon layer on the bottom of the cell shields the bulk silicon from recombination at the metal contacts (DeCeuster 2019). At the cell level, TOPCon cells currently have around 0.5%–1.0% absolute efficiency gain over PERC and use many of the same manufacturing steps and equipment (Chen, Chen et al. 2019). The net efficiency delta between PERC and TOPCon—and for that matter, all the c-Si architectures that we follow for the NREL solar technology cost benchmarks—can be harder to find at the module level depending on how the cells are cut and interconnected during module assembly (Chunduri 2021). Passivated emitter and rear totally (PERT) or locally (PERL) diffused cells share many features with TOPCon cells. However, we are unaware of any efficiency advantages for commercially produced PERT/PERL cells relative to PERC, and we do calculate higher manufacturing costs for PERT/PERL that are due to more processing steps and the typical use of n-type wafers. The market appeal for PERT/PERL may be a lower temperature coefficient and the potential to avoid some reliability issues inherent to p-type technologies including PERC (Woodhouse, Repins et al. 2020).

12 This report is available at no cost from the National Renewable Energy Laboratory at www.nrel.gov/publications.
Similar cell efficiencies to TOPCon can also be found in silicon heterojunction technology (HJT) and interdigitated back contact (IBC) technologies. HJT and IBC typically provide a measurable efficiency advantage over PERC and—depending on the specific manufacturing process being used—can be within $0.05/W of PERC manufacturing costs.
The HJT technology uses a high-lifetime n-type wafer and plasma enhanced chemical vapor deposition (PECVD) of amorphous silicon (a-Si) layers on the front and back. HJT cells are naturally bifacial, and electron and hole extraction from the device occurs across two materials: (1) a transparent conducting oxide (TCO) that is coated onto the front and back a-Si layers and (2) the metal contacts, which are usually either screen-printed silver pastes or an electroplated metallization (e.g., a Ni/Cu/Sn/Ag stack). Instability in the a-Si layers limits HJT cells to low-temperature processing conditions. For screen-printing, this limits the options to pastes that can be cured at low temperatures. These low-temperature pastes are more expensive than traditional pastes on a dollar-per-kilogram ($/kg) basis, and they have a higher resistivity; therefore, more paste is required for each cell. Electroplating is an alternative offering lower materials cost than purely screen-printed busbars; however, electroplating has higher equipment capital expenditures (CapEx) and maintenance than screen-printing (Huang, Trinastic et al. 2019). One consequential technology advancement for HJT cells has been the demonstration of busbarless cell interconnection technologies, which can help make HJT technologies more cost-competitive by enabling up to 75% reduction in the silver paste that is required (Faes, Lachowicz et al. 2018).
An IBC cell can be fabricated many ways. We currently model a screen-printed IBC method (Kopecek, Libal et al. 2020) that is expected to be more facile than other approaches that rely on polycrystalline silicon layers and copper electroplating (Harley, Smith et al. 2015, Sickmoeller 2020) or copper ribbons (Porter, Durling et al. 2018). The chosen cell architecture can be fabricated using the same high-temperature POCl3 tube furnaces used to establish the emitter layer in PERC cells and the high-temperature BBr3 tube furnaces used to establish the emitter layer in PERT/PERL and TOPCon cells. A SiNx:H antireflection coating (ARC) on the top and a passivation layer on the bottom is also incorporated into the cell, which acts as a diffusion mask that is opened by laser to allow for the creation of locally diffused regions during the subsequent diffusion processing steps (Kopecek, Libal et al. 2020).
Cadmium telluride (CdTe), which represents most thin film module production, captured around 6% of total global PV module capacity at the beginning of 2021 (Osborne 2021). Copper indium gallium diselenide (CIGS), the next most popular thin-film technology, had less than 1% of global manufacturing capacity in 2020 (Mints 2021). In general, these devices are built differently: CdTe is a superstrate structure—with the device and back contact layers built on top of the TCO that faces the sun—and CIGS is a substrate configuration—with layers built on the back contact metal and ending with the TCO. Figure 11 shows an overview of the general thin-film cell architecture and module used in this report.

13 This report is available at no cost from the National Renewable Energy Laboratory at www.nrel.gov/publications.
Figure 11. Overview of the general thin-film cell architecture and module used in this report
Figure 12 (page 15) shows the summary direct manufacturing cost model results for the PV module technologies currently covered by NREL. Although we are also developing a cost model for perovskites and silicon-based tandems, these are not yet represented in Figure 12 because there is no known commercial production with significant sales volume. Several firms are engaged in pilot-scale production of single-junction perovskites and perovskites on silicon. The hundreds-of-dollars-per-watt cost for III-V cells is beyond the scale of the axis; this might help explain why III-Vs technology’s market share currently seems to be limited to space, satellite, and unmanned aerial vehicle applications. The market shares for all PV technologies may change over time as efficiency, costs, reliability, energy yield, and new end-use applications influence market demand and pricing for specific module technologies
3.1.2 Historical and Projected Improvements in PV Cell and Module Efficiencies and Costs
After decades of dedicated public- and private-sector R&D investments, the resultant efficiency gains and production technology advancements have led to better performance and lower manufacturing costs for PV cell and module technologies. Some of the more impactful c-Si production technology advancements to date include larger ingot and wafer sizes with concurrent improvement in material quality and yield, the switch from full-area Al BSF to PERC production, and better cell metallization and interconnection approaches that reduce the derate in efficiency from cells to modules. Figure 13 summarizes our research of the technology trends for c-Si PV modules. In the figure, we have represented the characteristics and features for the technologies that enjoyed majority market share at that time. For a long while, multicrystalline silicon wafers were the norm (e.g., 2010 and 2015 in Figure 13), but the trend within the past couple of years has been back toward monocrystalline silicon. This is because monocrystalline material contains fewer material defects and chemical impurities, which yields higher cell efficiencies.
Around 2010, a typical uncropped monocrystalline ingot was around 140 kg and led to cropped ingots that were 1.5–2.0 m long, had a flat-edge width of 156 mm, and a cross-sectional area standardized to 237 cm2 (Goodrich, Hacke et al. 2013). After accounting for wafer thickness, kerf and yield losses, and cell efficiencies around 16.5% at that time, the net silicon utilization was around 7–8 grams per Watt (g/W) at that time. By 2020, industry-typical ingot mass had

14 This report is available at no cost from the National Renewable Energy Laboratory at www.nrel.gov/publications.
increased to 400–450 kg, and more than 800 kg ingots had been demonstrated at pilot scale. Two separate movements for wafer size standardization also began in 2020 to either the M10 size (182x182 pseudo-square with a diagonal of 260mm) or the G12 size (210x210 full square with a diagonal of 297mm). These larger sizes are following the development of 300 mm diagonal ingots for the semiconductor industry. Solar and semiconductor ingot capabilities now range from 200 mm diameter ingots around 5.5 m in length (400–450 kg) or 300 mm diameter ingots greater than 5 m in length at pilot scale (800 kg).
Although wafer thickness has not changed significantly, kerf losses have been reduced from 130 µm per wafer to 70 µm per wafer by the adoption of diamond wire sawing technologies. Combined with better yields and cell efficiency improvements beyond 22%, today we calculate less than 3.0 g/W silicon utilization. With this lower silicon utilization and combined with improvements in manufacturing equipment we calculate an 85% all-in cost reduction for wafers between our 2010 and 2020 c-Si cost models. Given current technology development efforts to enhance the usable silicon out of an ingot—potentially even including kerfless wafer technologies—we expect wafer cost reductions due to processing advancements to continue.
Process advancements in cell and module technologies have also been significant. One of the largest cost drivers in cell conversion remains the pastes for screen-printing. That cost has decreased owing to a reduction in silver paste requirements from 200 mg per typical cell in 2010 (Thirsk 2011) to 80–100 mg per cell today. The International Technology Roadmap for Photovoltaic (ITRPV) projects further potential reductions in silver paste requirements, perhaps to just 50 mg per cell by 2030 (Trube et al. 2021). Advances in screen-printing equipment and screens, combined with the movement to more busbars, are key to past and future reductions in cell metallization costs. So-called multibusbar technologies, which are 9–12 busbars or more, and even “busbarless” cell interconnection technologies are predicted to grow from 10% market share in 2020 to greater than 40% market share in 2030 (Trube et al. 2021).

15 This report is available at no cost from the National Renewable Energy Laboratory at www.nrel.gov/publications.
Figure 12. Summary of results for 2020 benchmark module production cost analysis and market share compilations from analyst reports and the
International Technology Roadmap for Photovoltaic (ITRPV) The power ratings and efficiency ranges are 2020 benchmarks from a survey of module data sheets.
COGS = cost of goods sold

16 This report is available at no cost from the National Renewable Energy Laboratory at www.nrel.gov/publications.
.
Figure 13. PV cell and module technology progress

17 This report is available at no cost from the National Renewable Energy Laboratory at www.nrel.gov/publications.
Another significant processing achievement over the past 10 years has been greater throughput in cell conversion and module assembly equipment. Today, throughputs greater than 3,000 wafers per hour (wph) are standard, and 10,000 wph tools are available for some wet chemical processing equipment. This is in contrast to 2010, when the best available from state-of-the-art equipment was around 1,000–2,000 wph (Goodrich, Hacke et al. 2013). Higher throughput combined with lower per-tool equipment prices has resulted in lower CapEx for new manufacturing capacity. Higher throughput also coincides with greater automation (and, therefore, lower labor expenses). These processing advancements, along with efficiency improvements, are included in our latest technology projections for standard c-Si products (Figure 14).
In addition to advancements in equipment throughput, technology advancements that improve cell and module efficiency generally lead to lower cost of goods sold. For example, balance-of-module materials—including solar glass, encapsulants, and backsheet—are sold on a dollar-per-square-meter ($/m2) basis (Woodhouse, Smith et al. 2019); therefore, as the watt-per-square-meter-based power rating improves, higher efficiency equals lower dollars-per-watt balance-of-module costs. Operational costs, including labor for cell and module equipment also decline as efficiency improves. This is because as PV manufacturing equipment throughput is commonly measured in cells or modules per hour; and costs decrease as the watts per cell or module increase because staffing requirements for a factory depend on the number of pieces of equipment in the factory.
The summary results in Figure 14 are from our monocrystalline silicon supply chain cost models for 2015 (Woodhouse, Jones-Albertus et al. 2016) and a Q1 2020 benchmark. Also represented as diamonds are the price targets for achieving 15% gross margin and the error bars corresponding to calculations of 5% gross margin to 25% gross margin. From our financial statement analysis of publicly traded companies, gross margins have varied by 5%–25%, while operating margins have often been negative for the industry over the past 10 years. Our estimates for research and development, and for sales, general, and administration, are also from financial statement analysis of publicly traded PV manufacturing firms. The other items within the costs categories are results from our bottom-up cost model results for China, which represents most global PV module production. Our cost models also have capabilities to examine PV manufacturing costs in other countries in Asia, Europe, and the United States. Another report in the Solar Futures Study (DOE 2021) contains the related benchmark costs analysis for the United States.
Our cost projections incorporating processing advancements are based on industry milestones projected by the ITRPV. These include thinner and larger wafers, greater ingot mass and reduced cell metallization, as well as further improvements in tool throughputs. The last projection has both conservative and aggressive assumptions. On the one hand, we do not assume lower materials costs ($/m2) as a result of further economies of scale, which probably makes for a conservative assumption as materials costs for module assembly have actually declined by almost 70% since 2010 (Goodrich, Hacke et al. 2013). We also represent 23% module-area efficiencies in 2025, which matches projections from the ITRPV (Trube et al. 2021) but correspond to less than the historical module efficiency progress (i.e., around 0.5% per year) (Figure 13). However, we carry the PERC cell and module technology scenarios in our cost models to generate Figure 14. A module efficiency of 23% might be an aggressive assumption for PERC. To summarize, we calculate around $0.15/W price target (2020 USD) to achieve 15% gross margins for mainstream PERC modules from Asia by 2025. These price projections do not include value added taxes or export related costs for shipping outside of Asia.

18 This report is available at no cost from the National Renewable Energy Laboratory at www.nrel.gov/publications.
Figure 14. Summary of results for 2020 benchmark and future module costs analysis for monocrystalline silicon PV

19 This report is available at no cost from the National Renewable Energy Laboratory at www.nrel.gov/publications.
The future cost scenarios for CdTe are not as straightforward to project as c-Si because there is not a regularly published document like the ITRPV for CdTe. That being said, we have been engaged in CdTe technology tracking and cost modeling since 2010 and have found several significant historical trends. Our calculated direct cost of goods sold for CdTe manufacturing has declined from around $0.70/W in 2010 (Woodhouse, Goodrich et al. 2013) to $0.23/W in 2020 as module-area efficiencies have advanced from 11% to 18%, as greater automation has factored in, and as module sizes have increased dramatically (Figure 15). The calculated labor intensity has been reduced from 2.4 employees per megawatt of annual production in 2010 to 0.4 employees per megawatt of annual production in our most recent analysis, and total initial equipment and facilities CapEx for CdTe manufacturing has been reduced from $1.2/W in 2010 to $0.30/W in 2020.
The cost projections shown in Figure 15 are based on the achievement of the long-term efficiency potential of single-junction CdTe (Woodhouse, Goodrich et al. 2013). The direct bandgap of CdTe (1.5 eV (Luque and Hegedus 2011)) is close to that of gallium arsenide (GaAs) and the ideal bandgap for highest efficiency in the detailed-balance limit (Shockley and Queisser 1961). In contrast to GaAs, however, commercial CdTe is a polycrystalline material. Therefore, the voltage and fill factor are more limited than GaAs and the detailed balance limit (Geisthardt, Topič et al. 2015). Figure 15 calls out some of the known principal pathways to improve efficiencies for CdTe. Similar items could also be found in the technology development projections for CIGS (Smith, Margolis et al. 2021).

20 This report is available at no cost from the National Renewable Energy Laboratory at www.nrel.gov/publications.
Figure 15. Summary of results for 2020 benchmark and future module costs analysis for CdTe
21 This report is available at no cost from the National Renewable Energy Laboratory at www.nrel.gov/publications.
3.2 Key R&D Opportunities to Reduce Module Costs In consultation with our technical review panel (TRP) for this report, we developed a list of R&D priorities for PV cells and modules that may help the cost and performance targets for the Advanced PV and Breakthrough scenarios be realized. This working list and the rationale for each item are summarized here:
1. Improve module efficiencies, including the development of tandem technologies, and improve module-driven energy yield. Higher efficiency remains a prominent route for reducing manufacturing costs across the PV module supply chain (as well as reducing BOS costs, as covered in Section 4.2.1). However, single-junction efficiency limits in large-scale production will eventually be reached and this will lead to tandems being the next opportunity to reach higher efficiency (Figure 13). For the increased adoption of tandems, at least two technical challenges must be addressed:
A. Because tandems likely have a higher cost ($/m2), a minimum efficiency benefit is needed to provide a net cost benefit.
B. Tandems will need to reach the same reliability targets and demonstrate comparable outdoor performance to traditional c-Si and thin-film module technologies to be accepted in common industry due diligence processes for module procurement.
2. Develop lower-cost cell and module materials with lower environmental impact and extended service life. Balance of module materials currently comprise around half of total module costs (Figure 14 and Figure 15). Though economies of scale might help further reduce these costs, alternative packaging and cell interconnection materials might need to be developed. Opportunities to reduce cell costs include lower-cost wafers, absorbers, thin-film TCOs, and metallization. However, one challenge is that lower costs might not matter if efficiency is compromised or there are reliability concerns about the new materials. Also, it remains to be seen whether aggressive reliability targets like 0.2%/yr and a 50-year module lifetime are compatible with material cost decreases on an initial or upfront cost basis.
3. Increase automation across the module supply chain with equal or lower initial equipment and facility CapEx. Increased automation in manufacturing can help reduce variable costs including labor, materials, and electricity costs. More automation can also improve manufacturing yields and, ultimately, cell and module efficiencies. The challenge is that increased automation typically translates to higher CapEx. Continued growth in manufacturing equipment production and scale and throughput could potentially help offset this challenge.

22 This report is available at no cost from the National Renewable Energy Laboratory at www.nrel.gov/publications.
4 Balance-of-System Costs This section addresses benchmark capital costs for PV systems, focusing on the non-module cost advancements that might help make the capital costs envisioned in the Solar Futures Study scenarios reachable.
4.1 Benchmark (2020) PV System Costs Figure 16 summarizes our 2020 benchmark PV system capital cost analysis (Feldman, Ramasamy et al. 2020). The models for each sector—residential, commercial, and utility—incorporate rigorous component-level details. The residential system model has a separately detailed model for soft costs, including customer acquisition; sales taxes; engineering, procurement, and construction (EPC) costs; developer overhead and profit; and permitting, inspection, and interconnection (PII) costs. The commercial- and utility-scale models use a percentage markup to estimate the soft costs components (Feldman, Ramasamy et al. 2020).
Figure 16. Overview of 2020 benchmark PV system capital costs analysis
Source: Woodhouse, Repins et al. 2020
We model a 7.0-kW residential rooftop system using 60-cell, monocrystalline, 19.5%-efficient modules from a top 10 supplier by production and a standard flush mount, pitched-roof racking system. The residential PV cost benchmark in soft costs represent PII, grid connection, sales tax, and overhead and profit. We model a 200-kW, 1,000-volt DC (VDC), commercial flat-roof system using a ballasted racking solution on a membrane roof, and we model a 500-kW, 1,000-VDC commercial fixed-tilt ground-mounted system using driven-pile foundations. The ground-mounted system is larger because U.S. ground-mounted systems are larger on average than

23 This report is available at no cost from the National Renewable Energy Laboratory at www.nrel.gov/publications.
rooftop systems. We model a baseline 100-MW, 1,500-VDC utility-scale system using 72-cell, monocrystalline, 19.5%-efficient modules from a top ten supplier by production and three-phase central inverters. We model fixed-tilt and one-axis tracking on ground-mounted racking systems using driven-pile foundations as well as a range of system sizes (5–100 MW) for utility-scale PV systems. The numbers in Figure 16 are notably lower than our 2010 benchmarks—around 50% (residential), 60% (commercial), and 75% (utility) lower than our first benchmark system capital cost model results (Goodrich, Woodhouse et al. 2012).
Our bottom-up system cost models enable us to investigate state-level capital costs variations, different system configurations (e.g., module-level power electronics versus non-module-level power electronics, fixed-tilt versus one-axis tracking, and small versus large system size), and different business models (e.g., small installer versus national integrator, and EPC versus developer). To help account for variability among projects in structural design, site requirements, and other factors, we conducted a sensitivity analysis using our one-axis tracking capital cost model. Figure 17 shows a sensitivity analysis for the one-axis tracking utility-scale system benchmark, with cost categories that vary by location and hardware specification. Equipment and material location factor, an index that is calculated as percentage ratio of cost specific to a particular location at any stated time to that of national average cost over the same period, have the largest impact on installed system cost. Figure 17 shows the final costs calculation from our one-axis tracking capital cost models across the lowest and highest costs states within the United States. Figure A-2 in the appendix shows how LCOE varies across the United States at the individual state level.
Figure 17. Sensitivity analysis for one-axis tracking utility-scale PV 2020 benchmark capital cost
Source: Feldman, Ramasamy et al. 2021
CA NEM = California net energy metering

24 This report is available at no cost from the National Renewable Energy Laboratory at www.nrel.gov/publications.
4.2 BOS Cost Reductions in Solar Futures Study Scenarios This section details opportunities to improve non-module costs through module and other technology improvements, including better business practices.
4.2.1 Module Efficiency Cell and module efficiency improvements can lead to lower costs at the system level via several mechanisms. Efficient PV modules can reduce the cost of the modules themselves (Figure 14 and Figure 15). Per-system fixed costs (e.g. land/rooftop, overhead, customer acquisition, and permitting costs) are also lower in dollars per watt as the system capacity increases owing to efficiency gains (Nielson, Horowitz et al. 2020); this is primarily because higher efficiency reduces the number of modules that must be installed and supported by fixed tilt or tracker support structures. As module efficiency improves, each module installed has a higher power rating and so fewer modules are necessary to reach the defined DC system capacity. This leads to reduced electrical BOS costs (less wiring) and related labor costs. Figure 18 shows model results for 100-MWDC U.S. utility-scale PV capital costs as a function of module efficiency, size, and weight.
Figure 18. U.S. utility-scale PV capital costs as a function of module efficiency, size, and weight
The relationship that is calculated is nonlinear because the dollar-per-Watt module cost and the soft cost markup values for the project are assumed to be fixed in this 100-MWDC power-constrained example. An area-constrained analysis for utility-scale is observed to have a similar shape in curves and only around $0.02/W lower costs than power-constrained systems at 40% efficiency. The benefits of high-efficiency panels are even more evident in commercial and residential systems with higher fixed costs and/or area constraints. Most U.S. homes are area-constrained, and the system-level cost savings for installing higher-efficiency panels may even support paying more for the modules (Nielson, Horowitz et al. 2020).

25 This report is available at no cost from the National Renewable Energy Laboratory at www.nrel.gov/publications.
NREL’s Annual Technology Baseline (ATB) estimates a module efficiency of 21.5% in the Conservative scenario and 22.5% in its 2030 Moderate scenario, which is quite close to the 22.3% median module-area efficiency projected by the ITRPV for monocrystalline PERC modules in 2030 (Trube et al. 2021). Also, we also use assume module-area efficiencies equal 25% in the Advanced scenario, which is consistent with maintaining the historical industry average efficiency improvement of 0.5% per year from 2010 to 2020 but in-between the ITRPV 2030 projections for the highest efficiency monocrystalline-silicon cells and silicon-based tandem solar cells (Trube et al. 2021). We assume 30% module-area efficiencies in the PV module technology Breakthrough scenario, which is right at the theoretical limit for single-junction crystalline silicon solar cells (Schäfer and Brendel 2018). To account for nonideal solar cells and to overcome cell-to-module derate, supporting a 30% module-area efficiency assumption would most likely call on significant R&D investments to produce and qualify low-cost tandem solar cells at large scale. Tandem solar cells have a theoretical maximum cell efficiency that is above 45% (Almansouri, Ho-Baillie et al. 2015) and 33% efficiency has been measured for silicon-based tandem solar cells (VanSant, Tamboli et al. 2021). From the 19.7% efficiency assumption for 2020, module-area efficiency improvements in the Moderate, Advanced and Breakthrough scenarios would translate to 13%, 22%, and 35% reductions in module count respectively.
In Figure 18, three curves are shown for changing module size with fixed costs for module and non-labor soft costs. At this time, larger format module areas are calculated to yield lower net system capital costs because of the lower module count. In our model, two laborers are used to move modules from pallets to the trackers and to clamp the modules in place. If the weight of the module does not exceed the general guidelines of weight limits for personnel—50 pounds (23 kg) per person—we can foresee a net cost savings at least as far as labor costs are concerned. However, we have some unanswered questions, including questions about (1) changing inverter designs to account for changing current-voltage characteristics for small versus large format modules and (2) changing tracker design considering wind and snow load differences for changing module size.
4.2.2 Power Electronics Historically, power electronics including inverters have made improvements in performance and achieved cost reductions by scaling manufacturing, by simplifying product design, and the transition to higher-voltage power transmission (for both string and central inverters). Power electronics costs should continue to benefit from the increasing growth of the PV market and economies of scale. Additionally, there is still opportunity for further design simplification and automation, as well as movement to higher-voltage power transmission in the case of utility-scale projects. Project developers and installers choose power electronics that optimize the overall economics, including considerations of energy yield for a specific project location versus the price for the inverter. Sometimes this choice favors central inverters, which traditionally offer a lower price and have fewer maintenance events because of the smaller number or inverters that are needed, and sometimes the choice favors string inverters or module-level power electronics, which can offer better energy optimization in most climates and easier replacement.

26 This report is available at no cost from the National Renewable Energy Laboratory at www.nrel.gov/publications.
4.2.3 Installation Labor and Materials In addition to the labor and material reductions associated with module efficiency improvements, there is potential for further labor and material cost reductions through higher labor productivity and lower future component costs. This is particularly true for the United States and less true for other countries that have lower labor and material costs in part because of preassembly efficiencies and fewer requirements for code compliance and inspection that some have argued have no discernable impact on the resulting safety and quality of solar installations but can significantly reduce labor time and material costs (Birch 2018). There is also the possibility for further cost reduction through continued automation and increased robotics, more labor-efficient system and component designs, and more-efficient mounting and staging. Accelerated R&D in lower weight and lower cost racking and tracking systems could also dramatically cut costs. In the residential and commercial sectors, labor and material reductions could also come from the incorporation of PV systems into new construction, reroofing, or other building upgrade projects that achieve synergistic efficiencies.
4.2.4 Permitting, Inspection, and Interconnection (PII) The U.S. PV market is nonuniform. Thousands of authorities have jurisdiction around the United States, each with potentially different PII practices. Though other countries have more-efficient national-level PII practices in place, in the United States PII practices vary dramatically by local, utility, and state jurisdiction and can take additional months to complete. Instead of a streamlined, consistent set of internal processes, installation and development companies in the United States must spend significant time, labor, and overhead costs learning the rules and following the procedures of the various jurisdictions. This contrasts to Australia where no permit is required—customers only submit a simple online interconnection request. In Germany, many standards are set at the national level and many local jurisdictions have exempted PV from building permitting, and Germany requires utilities to prioritize renewables for interconnection. In general, Germany and Australia also have fewer code requirements. Some have attributed accidental fires from solar PV systems in Australia, but others have claimed no difference in quality or safety from the more onerous set of safety standards in the United States (Birch 2018). We estimate reductions in PII through streamlined permitting processes, such as an online approach and one that is more standardized across jurisdictions, or even, a national permitting process. Also, NREL has developed the Solar Automated Permit Processing platform (SolarAPP), which is an instant online solar permitting tool for residential systems to achieve code compliance. In the case of residential PV systems, significant PII reduction is likely to occur by seamlessly integrating PV into larger construction projects (e.g., new homes and reroofing).
4.2.5 Customer Acquisition Because of the nonuniform, disbursed marketplaces, the benefits of a PV system can be very different for residential customers—even those who might live across the street from one another. Additionally, though the United States is one of the leaders in PV deployment, in absolute terms, it has a lower penetration rate than other countries in terms of percentage of electricity from solar, and therefore many commercial and residential customers may not be as familiar with the product. In short, acquiring a customer can be very time-consuming, as the benefits are very location-specific and customers are not necessarily familiar with the product in the first place. As the overall price of the system reduces, customer acquisition cost may fall
27 This report is available at no cost from the National Renewable Energy Laboratory at www.nrel.gov/publications.
because upfront costs are no longer as great a barrier for solar adoption (i.e., a $5,000 purchase is available to more customers than a $40,000 investment, and potential customers likely do not require as much attention to close a transaction). Further, lower-cost systems might be able to be financed more like other household purchases, like a washer/dryer. Installers could also achieve economies of scale through customer aggregation, selling multiple systems in one offer. For example, the Solarize campaign in the United States is a group purchasing program in which multiple homeowners buy their systems at the same time through a broker. Policymakers could require utilities or state agencies to host quote platforms (i.e., websites that allow customers to receive multiple bids for a project) or provide information about quote platforms or prevailing local prices to their ratepayers or constituents. In addition to encouraging a more transparent marketplace in terms of cost, platforms can also create installer standards with policymakers and utilities to provide more assurances to the quality of each system. PV could be integrated into other related-service marketplaces (e.g., new builds through building code requirements), which would allow customer acquisition costs to be spread over a larger project.
4.2.6 Overhead and Profit Faster and cheaper customer acquisition, PII, and installation practices, as well as lower material and labor costs will likely lead to a reduction, on a per watt basis, in overhead and profit. Additionally, we estimate further reductions in overhead costs in the residential sector through the incorporation of PV into larger project bundles and new housing construction. Business overhead can be greatly reduced by spreading these costs over a larger project. Beyond those cost improvements, we expect module and inverter prices to reduce further as tariff expire over the next few years, which should in turn lower supply chain and/or material costs. Overhead costs associated with financing projects are also likely to reduce as the tax credits phase out, which would in turn reduce the need for potentially complicated financing structures.
4.2.7 Financing Costs Financing costs are lower for solar PV projects than other electricity generation assets (Feldman, Bolinger, & Schwabe 2020). PV financing costs—the costs investors expect for investing in a project or loaning money for a project—are lower by way of a lower interest rate environment; the demand by investors for environmental, social, and governance products; and relative certainty in PV system electricity production and compensation under long-term power purchase agreements. Market conditions may change in the future; however, continued PV R&D that lowers perceived technology risk creates more certainty in PV system electricity production, lifetime, and the value of the energy, are likely to benefit the cost of PV financing (Feldman, Margolis et al. 2020). Additionally, solar financing for distributed PV projects has historically been primarily driven by the credit rating of a homeowner or business. Solar loans, which currently represent most residential PV financings, are personal loans, base their costs and who they will loan to on the credit score and debt-to-income ratio of customers. As solar matures, and its costs are reduced, it has the potential to become more seamlessly integrated into common-place building financing practices, such as low-cost mortgages. Additionally, there may be

28 This report is available at no cost from the National Renewable Energy Laboratory at www.nrel.gov/publications.
opportunities to low the cost and increase the accessibility of financing solar PV systems for low- and moderate-income customers.2
Despite all these potential improvements, there is still great uncertainty about future absolute costs of financing, as rate structures and regulatory practices change and as solar becomes a larger share of U.S. electricity production. For these reasons, the ATB 2020 did not assume a reduction in the cost of equity for PV systems and assumed that debt interest rates would increase by 1% (in absolute terms) by 2030 to reflect the historically low interest rate environment that currently persists.
4.3 Key R&D Opportunities to Reduce PV System Capital Costs In consultation with our technical review panel, we developed a working list of R&D priorities for PV BOS that might help the cost and performance targets for the Advanced and Breakthrough scenarios be realized. This working list and the rationale for each item are summarized here:
1. Develop higher-voltage systems (1,000–1,500 V and above) with improved safety. Higher voltage systems can lead to longer string lengths, and combiner boxes are replaced with DC-to-DC converters (namely, power optimizers), which step up the voltage from strings; this can enable labor and electrical BOS materials savings. These higher-voltage systems would need to be developed safely.
2. Use new module form factors and alternative BOS materials and structures. Examples of BOS and EPC capital costs reduction may include larger modules, building-integrated photovoltaics (BIPV), and new low-cost lightweight materials that reduce the total amount of racking or tracking structural racking materials (structural supports that are currently attached to either a roof or the ground, and that reduce the amount of materials for electrical wiring and interconnections). Inverter costs might also be lowered, but the likelihood of that happening would depend on complex interplay with system voltage and storage coupling opportunities.
3. Reduce labor and other costs by including PV during reroofing or new building construction. It would be beneficial for solar installers to become a standard subcontractor element—just as there are typically plumbing and electrical subcontractors on construction sites. It would also be beneficial to codify best practices and to develop new parts that effectively incorporate solar systems into new roofs without compromising weather resistance or safety.
4. Deploy preassembled PV systems. Preassembled systems could reduce labor hours for installation and present another approach to standardization.
5. Establish minimum standards of construction, product procurement and safety that are commonly understood and applied across the industry. An inefficiency currently exists, as potential residential, commercial, and utility customers are being presented conflicting marketing-style information from installers and EPCs about the systems they
2 For information about affordable and accessible solar, see Heeter et al. (2021), another report in the Solar Futures Study series.

29 This report is available at no cost from the National Renewable Energy Laboratory at www.nrel.gov/publications.
are purchasing. This can create a hesitancy and delay in closing customers, and even potentially missed opportunities as a result of customer uncertainty. A standardized process (perhaps even a national-level process) establishing clear standards of system pricing and construction would reduce customer uncertainty and increase solar accessibility.
6. Achieve additional soft cost reductions by lower overhead and supply chain costs, streamlined permitting, and lower customer acquisition costs. This priority is particularly important for the residential sector. A national and more efficient permitting process may be one opportunity for improvement. Lower upfront system costs, shorter payback times and positive feedback from existing customers would also help attract new customers to solar. Also, a solid public reputation for reliability and robust safety standards would help reduce solar customer uncertainty and lower customer acquisition costs.
Based on these technical improvement opportunities, we projected four scenarios (Conservative, Moderate, Advanced, and Breakthrough) for 2030 PV system costs, as shown earlier in Figure 7.

30 This report is available at no cost from the National Renewable Energy Laboratory at www.nrel.gov/publications.
5 Operation and Maintenance Expenses 5.1 Benchmark (2020) O&M Costs
Operations and maintenance (O&M) expenses include both planned or preventative maintenance and unplanned or corrective maintenance. On the checklist of planned and preventive maintenance items, system operators must check electrical components, monitor the performance and power of system, clean modules as needed, and manage vegetative growth. Unplanned and corrective maintenance issues will also arise, including inverter, module, and other component replacements that are due to failures. Property risks (e.g., damage from wildlife, theft or vandalism, and extreme weather damage) can trigger and O&M response. Finally, office personnel are required for project administration and management, tax reporting and payments, property insurance payments, and pursuing warranty claims as needed. Though project owners may wish for the lowest possible O&M budget, and a wide range in reported O&M prices exists in the PV market, a robust O&M plan is still vital to the uptime and sustainability of a PV system.
Unplanned and corrective O&M activities are generally more difficult to understand and predict than planned and preventative maintenance activities. Unplanned O&M responses are generally triggered when there is an unacceptable breakdown in system power production and energy yield. For example, system power output is critically dependent on module robustness, but predicting manufacturing defects or hail damage can be difficult, for example. Inverter failures are also a leading cause of system failures and downtime, but there are many types of inverters (e.g., central, string, and microinverters) and each type carries its own maintenance issues (Jordan, Sekulic et al. 2015). Indeed, it can be difficult to know ahead-of-time the percentage of any component that must be replaced in any given year. O&M costs in the Walker et al. (2020) O&M cost model established at NREL include preventive maintenance, scheduled at regular intervals with costs increasing at an inflationary rate, as well as corrective maintenance to replace components. The rate of corrective maintenance responses is based on actual field data whenever possible; or the cost model derives corrective maintenance costs by multiplying the replacement cost, including labor, by the probability that a failure will occur in each year. And the model uses Weibull distributions—a classic probability distribution used in reliability and failure engineering—for modeling component failure probabilities for each year (Walker et al. 2020).
The 133 measures in NREL’s O&M cost model, which are sorted into 9 categories (Figure 19), are summarized in Table 3. These PV O&M services are described by a best practices guide published by NREL, Sandia National Laboratories, SunSpec Alliance, and SunShot National Laboratory Multiyear Partnership PV O&M Best Practices Working Group (2018).

31 This report is available at no cost from the National Renewable Energy Laboratory at www.nrel.gov/publications.
Figure 19. Benchmark 2020 O&M costs including ownership costs (property taxes, insurance,
asset management, site security (if applicable), and operations administration Source: Feldman, Ramasamy et al. 2021
Table 2. Summary of O&M expenses within Figure 19: 2020 O&M Costs Benchmark for PV Systems in the United States
Residential Commercial Roof Mount
Commercial Ground- Mounted
Utility Fixed Tilt
Utility One-Axis Tracking
Module cleaning and vegetation management
$1.36 $2.88 $4.01 $3.36 $3.36
System inspection and monitoring
$3.69 $4.16 $2.30 $1.18 $1.84
Module, inverter, and other parts replacement
$17.69 $5.48 $4.69 $4.56 $5.04
Soft costs—other (land lease; property taxes; insurance, asset management and site security; operations administration
$6.20 $6.03 $7.70 $7.22 $7.22
Total $28.94 $18.55 $18.70 $16.32 $17.46
32 This report is available at no cost from the National Renewable Energy Laboratory at www.nrel.gov/publications.
5.2 Pathways to Lower O&M Expenses by Improved Reliability
5.2.1 Improving Product Reliability by Indoor and Outdoor Testing Recognizing the potentially negative exposure from using low-reliability components, U.S. installers, utility-scale project developers, and supporting financial institutions have increasingly relied on partnerships with private independent testing labs and independent engineering firms—in addition to research organizations such as NREL—as standard practice in due diligence. This supporting industry continues to play a very large role in advancing product quality from module, inverter, and battery manufacturing firms with sales in the U.S. market. Many U.S. system owners require that testing labs exceed international testing standards to reduce the risk of product failure, and test protocols vary considerably. Including laboratory testing results of specific components and available field data increases confidence in project cash flows, but it does not completely eliminate financial risk.
In practice, extrapolating future performance is difficult when typical laboratory testing is completed within a short period (weeks or months), given the projected lifetime of systems in the field (decades). All PV stakeholders desire outdoor field data, but the data—for multiple climates for every type of product on the market—are inadequate. Continued design changes result in greater uncertainty in lifetime performance. The rapid product development cycles that have enabled significant module performance improvements and cost reductions require the development of accelerated testing methods for new technologies and the interpretation of outdoor field data. Most degradation analysis methods require at least 3 years of field performance data to determine degradation rates with reasonable confidence, so even the most recent degradation data do not represent the most current products. Accelerated testing has a similar issue if tests are only developed based on observed field degradation or failure. Significant research investment is required to develop accelerated testing methods that can reliably detect weaknesses that can lead to early failure without a priori knowledge of the cause. Also, extending module lifetime beyond 30 years requires development of modeling capabilities informed by fundamental studies of degradation mechanisms that can be extrapolated beyond current module lifetimes.
For these reasons, improved accelerated testing protocols and significantly greater efforts in outdoor reliability testing are seen to be key R&D needs for improved PV system reliability and economics. The PV Fleet Data Initiative and outdoor testing of perovskites are two examples of developing U.S. Department of Energy-sponsored data sets that will be being meaningful for the PV community (Deline, Anderson et al. 2021). Another significant research effort would be to translate field data for projecting technology-specific performance in the field and providing more certainty for cash flow calculations. Also valuable would be the development of testing standards and collection of outdoor data for advanced PV cell and module concepts, including tandems.
5.2.2 Improving Product Reliability and Lowering O&M by Developing Testing and Report Standards for PV System Components
Components, including modules have changed much over the years, and opportunities for further technological changes in the future are abundant (Figure 13, page 16). Variation across the PV module supply chain has resulted in constantly updated options for cell size and interconnection,

33 This report is available at no cost from the National Renewable Energy Laboratory at www.nrel.gov/publications.
encapsulants in glass-glass or glass-backsheet formats, and different physical dimensions, among other features. Figure 20 depicts the evolution in the leading-edge modules for 2018–2020, based on cells cut into two or more pieces. The figure illustrates one way of increasing module power density by overlapping and interconnecting cut cells.
Figure 20. Most recent evolution of c-Si module technologies
Trends toward cut cells in newer module designs have both potential advantages and risks. Cut cells are increasingly popular because they enable closer cell packing and higher energy yields from modules, and they reduce cell operating temperatures owing to lower currents; however, cut cells may introduce additional microcracks depending on the cutting technology, the number of cuts per cell, and the cell size. Electrical “hot spots,” which have been measured to be a leading cause of power losses and module failures, can be caused by cracked cells (Jordan, Kurtz et al. 2016). Although the recent industry trend toward more busbars—or even busbarless low-temperature solder technologies—might be expected to reduce the risk that is due to cracked cells by bridging electrical connectivity across broken cell areas; recent results from PVEL’s product qualification program for PV modules have shown this can vary by manufacturer (PV Evolution Lab Webinar 2020).
Alternative module packaging materials are also a noteworthy technology trend. Many glass-glass modules now incorporate polyolefin encapsulants because the typical ethylene vinyl acetate encapsulant releases acetic acid, which can corrode metallization, including cell metallization and string connector ribbons. Acetic acid release may not be as big a problem when using backsheets, which are more breathable. Also, better encapsulants could be less prone to discoloration, which reduces light transmission to the underlying cells. Switching from ethylene vinyl acetate to thermoplastic polyolefin encapsulants is an example of a near-term balance-of-module adjustment that is quickly gaining acceptance across the industry. Glass-glass module packages are also using thinner glass to reduce weight and optical losses while increasing overall module size. This can lead to reduced module stiffness and different mechanical loading

34 This report is available at no cost from the National Renewable Energy Laboratory at www.nrel.gov/publications.
characteristics. Bifacial modules are increasingly popular owing to increased energy yields when mounted on trackers. Bifaciality requires a minimal change to the cell production process and use of a transparent backsheet. Some module manufacturers are exploring the use of flexible, polymeric, breathable transparent backsheets to replace the back glass, thus reducing weight and cost. Other long-term trends in module packaging—including reduced spacing between cells, more resilient metallization, lead-free metallization, reduced silver use, and eventually tandem technologies—are all intended to increase energy yield while maintaining reliability. Demonstrating reliability in some of these new technologies requires additional research in accelerated testing, fielded module characterization over time, and improved analysis tools for outdoor performance and degradation data.
For example, backsheet materials and structures are evolving and this is a concern as backsheet cracking is known to be a major failure mode (Jordan, Kurtz et al. 2016). Beginning in about 2011 several manufacturers over a few years of module production used a new low cost polyamide-based “AAA” backsheet. These modules generally passed standard reliability tests in use at the time, but catastrophically failed after 5–7 years in the field due to backsheet cracks compromising safety and performance. The PV community regularly updates standard testing procedures in response to new field failure modes, but the AAA backsheets brought a new urgency to develop improved accelerated tests and testing protocols to improve the international standard testing and increase buyer confidence through extended, additional testing. In response, Dupont (a competing backsheet supplier) developed and validated a sequential accelerated test to detect these backsheet failures in 2017 (Gambogi, MacMaster et al. 2017). However, the international IEC standard was not updated to include a backsheet cracking test until a simpler test was designed and validated by Kempe et. al in 2021. Both of these backsheet tests are designed specifically to provoke this specific backsheet failure mode, and they are not intended to probe any other failure modes that could also occur in these modules, meaning that they are an additional required test in an already long list of mechanism specific reliability tests. These module failures and the growing list (and time and cost) demonstrate the need for accelerated testing that can detect module failure modes that we do not already know about in new materials – tests that do not require a priori knowledge of a failure mode and incorporates combined stresses as they occur in the field. NREL’s Combined Accelerated Stress Testing is an example of this new kind of test that can detect susceptibility to many different failure modes in one test based on different environmental conditions experienced outdoors (Owen-Bellini, Moffitt et al. 2019).
As new PV module and system technology variations have not yet been tested over decades of outdoor field exposure, PV project developers and installers may continue to resort to indoor and accelerated testing of components, including modules, inverters, and batteries. Quality and durability testing of components is important and also already generating a tremendous amount of data. As the trial-and-error approach of laboratory testing and outdoor field data creates a tremendous amount of data, it only becomes valuable once it can be synthesized and condensed and used to identify the major failure modes and common materials in the best-performing components.
5.2.3 LCOE Impacts That Are Due to Improvements in O&M Practices Figure 21 shows how LCOE varies for an example of a U.S. utility-scale project depending on the assumptions for O&M expenses and capital costs. The 2020 benchmark of $17.5/kWDC-yr

35 This report is available at no cost from the National Renewable Energy Laboratory at www.nrel.gov/publications.
was calculated by NREL’s bottom-up O&M models (Figure 19) and is included within the real 2020 benchmark LCOE calculation of 3.5 cents/kWhAC for one-axis tracking systems close to the median solar resource (Kansas City, Missouri) and with $1.0/WDC capital cost. These all-in O&M expenses are most likely higher than most reported O&M contract prices that are commonly limited to the first 5 years of a project and may not include module cleaning, vegetation management, land lease, or corrective maintenance. The impacts that are due to lower O&M expenses across three categories is also shown. All in, the movement from $17.5/kWDC-yr all-in O&M expense in 2020 to the advanced technology scenario value of $8/kWDC-yr yields an LCOE of 2.9 cents/kWhAC with $1.0/WDC capital cost. The advanced O&M scenario ($8/kWDC-yr) could provide up to an additional $0.25/W increase in capital costs—to $1.25/W—to break even against the 3.5 cents/kWhAC calculated using the 2020 benchmarks for O&M ($17.5/kWDC-yr). We calculate that the all-in 2020 benchmark utility-scale O&M ($17.5/kWDC-yr) is equivalent to around $0.45/WDC capital cost; that is, $1.45/WDC system capital cost with $0/kWDC-yr O&M also yields 3.5 cents/kWhAC real LCOE in Kansas City, Missouri.
Figure 21. LCOE sensitivity to O&M expenses for utility-scale PV in the United States
5.3 Key R&D Opportunities to Reduce O&M Expenses In consultation with our technical review panel, we developed a working list of R&D priorities for PV system O&M that might help the cost and performance targets for the Advanced and Breakthrough scenarios be realized. This working list and the rationale for each item are summarized here:

36 This report is available at no cost from the National Renewable Energy Laboratory at www.nrel.gov/publications.
1. Reduce module, inverter, and other component failures that may cause downtime and necessitate replacement. Increased lifetime and efficiency and fewer failures would augment power production and lower replacement costs. This comes back to the subject of smarter procurement decisions, as first described in Section 4.3, because O&M issues can often be avoided by purchasing more robust equipment in the first place (even if it does sometimes cost more). At the component level, premature failures in module backsheets, connectors, and other components could also be largely avoided by improved standardization and premanufacturing testing. Improved system design can also help reduce the probability of PV system failures. Our technical review panel also noted tracker and transformer issues as notable sources of availability losses and additional O&M expenses for utility-scale PV systems. One fundamental challenge for decision analysis is quantifying the value of avoided failures to justify potentially more expensive components and system designs.
2. Establish more effective and economical module cleaning and vegetation management solutions. Instituting procedures for module cleaning and vegetation management can help reduce DC losses that are due to module soiling, obstructed solar irradiance, and damage to the PV system. Increased robotics, new and robust antisoiling coatings and other solutions, as well as colocation with agriculture might all help to someday reduce both these O&M expenses. These considerations do strongly depend on climate (e.g., more rain and less dust reduce the need for cleaning), and site-specific considerations (e.g., vegetation helps reduce erosion), so improved site analysis tools and weather forecasting would also help address soiling and vegetation management issues.
3. Develop lower-cost system monitoring capabilities that can identify and correct problems within specific components before they lead to system downtime. Predictive maintenance entails identifying where failures might occur and communicating that information to PV system operators. Enhanced but cost-effective component-level monitoring and analysis and communication to operators would enable more rapid identification of the sources of system losses and more efficiently pinpointed repairs. Provided they would not be cost prohibitive, these capabilities could work to reduce maintenance expenses and improve system uptime. Built-in sensors within components and other tools that measure real time performance and communicate the information back to PV system operators would lead to improvements in system uptime because the failures could be identified and corrected quickly and efficiently. Machine learning and artificial intelligence might also play a role in complex system monitoring, data analysis, and communication.
4. Enable customers to buy more reliable products by establishing more rigorous testing protocols and reporting standards for component testing. Validate new materials and components by executing and reviewing more rigorous protocols for accelerated testing, fielded characterization over time, and improved analysis tools for outdoor performance and degradation data.
5. Reduce O&M overhead expenses by developing more efficient asset-management solutions. Examples include improved system monitoring and communication as well as streamlined tax and insurance policies.

37 This report is available at no cost from the National Renewable Energy Laboratory at www.nrel.gov/publications.
6 Lifetime Performance The many pathways to increasing the amount of electrical power delivered over a complete PV service life include improving system uptime and degradation rate; capitalizing on any opportunities to use lower-temperature coefficient modules, bifacial modules, or modules that harvest light more effectively across changing conditions; and reducing all the various DC and AC losses between PV modules and the electric grid. In this section, we discuss how location and technology-dependent and engineering-dependent variables affect annual first-year energy yield, and we summarize opportunities to lower LCOE by improving subsequent annual energy yields through improvements in degradation rate.
6.1 Benchmark (2020) Energy Yield and LCOE Modeling Seeing the value of improved energy yield requires looking beyond installed PV capital costs ($/W), which merely reflect costs at an initial efficiency measured in an indoor lab with standardized temperature and lighting conditions. In contrast, energy yield (kWhAC/kWDC) is a determination of outdoor performance that varies depending on system location, technology, and mounting configuration. All else being equal, improving annual first-year energy yield reduces LCOE—as does decreasing degradation rate by improving lifetime energy yield in subsequent years.
Figure 22 shows how LCOE varies as a function of energy yield and degradation rate for an example of a 100-MW utility-scale system, assuming constant capital cost and O&M expenses. The figure contains the principal annual first-year energy yield parameters that are considered in this report, including system location (lowest to highest solar resource), mounting configuration (fixed tilt or tracking), monofacial or bifacial, and DC and AC losses between PV modules and the electric grid (Table 1). The improvement in annual first-year energy yield calculated in SAM for moving from fixed tilt to one-axis tracking varies from 14%–20% across the three locations considered: Kansas City, Missouri; Seattle, Washington; and Daggett, California; this rather significant advantage is a principal reason one-axis tracking has become the predominant choice for utility-scale PV projects in the United States. Additional improvements to calculated energy yield can be found by using bifacial module performance parameters and varying assumptions around DC and AC power losses. Moving from monofacial systems with 14% total DC and AC power losses to bifacial systems with 6% total DC and AC power losses, we calculate an improvement in the first full year energy yield equal to 12% in Kansas City, Missouri, and 14% in Daggett, California. Measurements have found bifacial energy yield gain of 11% for bifacial modules on grass and even up to 33% for systems on a white-painted surface (Satpathy 2020).

38 This report is available at no cost from the National Renewable Energy Laboratory at www.nrel.gov/publications.
Figure 22. Utility-scale LCOE as a function of first-year energy yield and subsequent degradation
rate, with constant capital costs ($1.0/WDC) and O&M ($17.5/kWDC-yr)
Another way to visualize and analyze energy-yield-to-LCOE impacts is to use a geographic information system with statistical analysis capabilities. This has been done for the United States (Figure 23) using NREL’s System Advisor Model (SAM) and the Renewable Energy Potential (reV) model (Maclaurin, Grue et al. 2019), which convert high resolution solar irradiance and weather data into system energy yield and LCOE. The source of solar irradiance data for the reV model is the National Solar Radiation Database, which provides 4-km spatial resolution and half-hourly temporal resolution for 1998–2019. Using all 21 years of available data, the reV model calculates the long-term multiyear mean capacity factor for each of the more than 500,000 sites across the United States. Combining the capacity factor with cost inputs, the long-term LCOE is calculated for each site. National Solar Radiation Database sites are geographically aggregated to reduce data volume to sites that are roughly 5.8 km spatial resolution across the country; this yields roughly 210,000 locations. Additionally, lands that are less desirable for development because of land-cover and land-use considerations are excluded. Land classifications including urban areas, national parks, culturally sensitive areas, areas protected for biodiversity reasons, and other land-cover or land-use considerations are applied to mask out locations that are less likely to be developed. The remaining land areas are summarized at the national and state levels to provide average LCOE in $/MWh and annual generation in kWh/kWp-yr. Figure 23 shows the results of our 2020 benchmark LCOE analysis for the continental United States.

39 This report is available at no cost from the National Renewable Energy Laboratory at www.nrel.gov/publications.
Figure 23. 2020 Benchmark utility-scale LCOE maps (top) and statistics and distribution (bottom)
for the continental United States, based upon aggregating about 209,000 data points using NREL’s SAM and reV models
6.2 Road Maps to Improved Energy Yield and Lower LCOE in the Solar Futures Study Scenarios
Several variables that influence energy yield can be adjusted by technology selection. Two module-dependent energy yield parameters that vary by product design and technology are (1) the module temperature coefficient, which represents the percentage decline in performance as the temperature is raised above a standard 25°C and (2) bifaciality, which represents the amount of power generated by the backside divided by the amount of power generated by the frontside

40 This report is available at no cost from the National Renewable Energy Laboratory at www.nrel.gov/publications.
under the same illumination and temperature conditions. Table 3 shows typical 2020 benchmark parameters for several module technologies. PERC and IBC technologies currently have the lowest bifaciality of those listed, but these values can be raised over time by improving cell metallization and interconnection. Module technologies with a lower temperature coefficient and higher bifaciality improve energy yield, although their impacts are climate and design dependent.
Table 3. Bifacialities and Temperature Coefficients for Selected Cell Technologies
PERC n-PERT/PERL TOPCon HJT IBC
Bifaciality 0.65–0.80 0.85–0.90 0.80–0.85 0.80–0.95 0.45–0.75
Temperature coefficient at maximum power (%/°C)
0.40–0.45 0.30–0.40 0.30–0.35 0.25–0.30 0.25–0.32
Module-level bifaciality is affected by the specific cell metallization and interconnection approach that is used, as well as the choice of backsheet or back glass. Module spectral response at less than 1,000 W/m2 AM 1.5G solar spectrum also determines the calculation of module energy yield. The Pmax temperature coefficient of CdTe is 0.32%/oC in 2020.
DC and AC power losses represent the amount of power losses that arise from various factors, including electrical wiring (I2R) losses; module mismatch; snow, soiling and shading (either from other modules or vegetation) losses; tracker losses; and inverter output losses. Figure 24 and Table 4 (page 41) shows 2020 benchmark energy yield results for the United States and projections for the Conservative, Moderate, Advanced, and Breakthrough scenarios, including changes in DC and AC power losses. Projections of energy yield in the first years of operation increase in the Moderate, Advanced, and Breakthrough scenarios owing to lower DC and AC system losses—from 14.3% total losses as a 2020 benchmark (and for the Conservative scenario) to 9% in the Moderate scenario, 6.5% in the Advanced scenario, and 4% in the Breakthrough scenario. From the reductions in DC and AC system losses, we find comparable improvements in annual first-year energy yield (e.g., 4%–7% improvements in annual first-year energy yield across the United States for the Moderate scenario). When combining reductions in DC and AC system losses with bifacial opportunities, we calculate improvements in annual first-year utility-scale module energy yield to be 8%–14% and 12%–16% in the Advanced and Breakthrough scenarios respectively.
Net lifetime power generation is a function of annual first-year energy yield and the degradation in energy yield across each year of the analysis period. To examine the potential impact of improvements in PV system degradation rates, we move degradation rates from 0.7%/yr as a 2020 benchmark to 0.5%/yr by 2030 for the Moderate scenario and 0.2%/yr by 2030 for the Advanced and Breakthrough scenarios. Longer system lifetime (e.g., from 30 years in four of five scenarios to 50 years in the Breakthrough scenario) also increases net lifetime power generation by an amount that depends on the assumed discount rate. Combined with lower DC and AC system losses, and cell and module bifaciality in the Advanced and Breakthrough scenarios, improvements in reliability vis a vis degradation rate and analysis period are calculated to yield improvements in utility-scale lifetime power production to around 10%, 20%, and 40% in the Moderate, Advanced, and Breakthrough scenarios respectively.

41 This report is available at no cost from the National Renewable Energy Laboratory at www.nrel.gov/publications.
Figure 24. Statistics of annual energy yield for the 2020 benchmark and Conservative, Moderate,
Advanced, and Breakthrough scenarios Table 4. Energy Yield Assumptions and Modeling Results for Solar Futures Study Scenarios:
Changes in System Design and Lifetime Energy Yield Parameters
Utility 2020 Benchmark
Conservative Moderate Advanced Breakthrough
Module Monofacial Monofacial Monofacial Bifaciality = 0.85
Bifaciality = 0.95
Total DC power losses
13.0% 13.0% 8.0% 6.0% 3.5%
Total AC power losses
1.3% 1.3% 1.0% 0.5% 0.5%
Relative annual (first year) energy yield
100% 100% 104%–107% (Lower DC and AC losses)
108%–114% (Bifacial and lower DC and AC losses)
112%–116% (Bifacial and lower DC and AC losses)
System degradation rate (%/year) and lifetime
0.70% and 30 years
0.70% and 30 years
0.50% and 30 years
0.2% and 30 years
0.2% and 50 years

42 This report is available at no cost from the National Renewable Energy Laboratory at www.nrel.gov/publications.
Utility 2020 Benchmark
Conservative Moderate Advanced Breakthrough
Net relative lifetime power production including degradation rate
100% 100% 108%–112% 116%–120% 138%–142%
LCOE input assumptions for the 2020 Benchmark and Advanced scenarios are given in Table 6. Figure 25 includes the LCOE maps and statistics for the Advanced scenario and the LCOE statistics for all scenarios. The conservative LCOE statistics are higher than the 2020 benchmark because the small assumed reductions in capital costs and O&M in the Conservative scenario (to $0.89/WDC and $14.3/kWDC-yr) are insufficient to overcome the anticipated LCOE disadvantage of a lower future federal investment tax credit (10% beginning in 2024 and 26% in 2020). The more aggressive assumptions for capital costs and O&M reductions in the Breakthrough scenario ($0.38/WDC and $6.0/kWDC-yr), in addition to the lifetime energy yield improvements given in Table 5, returns a median real LCOE around 1.0 cent per kWhAC.
Table 5. Summary of Differences between LCOE Scenarios
Scenario Capital Costs and O&M Expenses
One-Axis Tracking Configuration
System Degradation
Federal Tax Incentives
2020 Benchmark
$1.0/WDC $17.5/kWDC-yr O&M
Monofacial 1.3 ILR
0.7%/yr 26% investment tax credit
Advanced PV
$0.50/WDC $8/kWDC-yr O&M
Bifacial 1.3 ILR
0.2%/yr 10% investment tax credit

43 This report is available at no cost from the National Renewable Energy Laboratory at www.nrel.gov/publications.
Figure 25. Utility-scale LCOE maps (top) and statistics for the United States from an analysis
using NREL’s SAM and reV tools

44 This report is available at no cost from the National Renewable Energy Laboratory at www.nrel.gov/publications.
6.3 Key R&D Opportunities to Improve PV System Lifetime Power Production
In consultation with our technical review panel, we developed a working list of R&D priorities for improving lifetime performance from PV systems that might help the costs and performance targets for the Advanced PV and Breakthrough scenarios be realized. This working list and the rationale for each item are summarized here:
1. Develop systems that improve energy yield in all climates. Some system-specific optimizations could more carefully consider the temperature experienced by modules within residential racked PV systems. Also, there are ways to adjust energy yield in commercial and utility-scale systems by varying the spacing between solar cells, changing the orientation (e.g., from south-facing to east- or west- facing) and by changing the ground coverage ratio. These priorities and others are site-specific and need to be better understood and developed for each specific application and climate.
2. Improve system reliability and uptime. Annual losses that are due to such things as module and string mismatch, module soiling, or DC losses and the degradation profile influence the total amount of kilowatt-hour power production over a PV system’s service lifetime. In general, better practices that also work to lower O&M costs that are due to component failures also translate to more kilowatt-hour power production by improvements in system uptime. As with our discussion of O&M (Section 5.3), it would be helpful if standardized and enhanced testing protocols for PV system components were implemented to better inform procurement decisions.
3. Develop modules with lower temperature coefficient and improved spectral response. The efficiency rating of a module is a standardized indoor measurement, whereas the deployment of a module entails real world operating conditions. The current-voltage response of a module under varying light conditions and the response to varying temperatures according to the temperature coefficient are two parameters that can be further optimized by evolving to n-type solar cell architectures and by better stringing and interconnection technologies. Early-stage technologies including tandems could bring even higher efficiencies, but this would depend on subcell-level spectral losses and dependencies.
4. Improve bifacial system configurations, including higher bifaciality cells and modules and better tracker design. Higher bifaciality and more accurate tracking algorithms could work to improve energy yield for bifacial PV systems. Opportunities to improve bifaciality are at both the cell level (e.g., cell metallization pattern) and the module level (e.g., transmissivity of back sheet and encapsulant).
5. Develop low-cost materials for enhanced albedo. Though albedo is a significant driver of bifacial energy yield, it is currently difficult to fully understand the cost versus performance tradeoffs for albedo enhancement materials. Nonetheless, lower-cost solutions to this old problem would presumably be very valuable as long as there are no unintended environmental consequences. Increasing the reflectively of ground cover by low cost and environmentally friendly coatings is one example.

45 This report is available at no cost from the National Renewable Energy Laboratory at www.nrel.gov/publications.
6. Lower DC losses by improved system design and components. Improved system design would address some principal sources of DC losses, including racking or tracking wiring across modules and up to the inverter. For example, better module and string connection technologies would help reduce nuisance DC losses that are due to electrical resistive and heat losses, as well as more catastrophic failures such as arc faults leading to system downtime.
7. Lower DC losses from module soiling and vegetative interference. New technologies and deployment options could help improve these climate and sites-specific considerations of system energy yield. New coatings on the module and new aqueous or dry solutions to reduce soiling would work to improve system energy yield by increasing the amount of sunlight reaching the solar cells. Opportunities to reduce vegetative interference entail better site management and may include increased robotics and colocation with agriculture.
8. Reduce cell and module mismatch. Less variation and tighter bins of module power outputs including current and voltage could reduce mismatch losses.
9. Optimize power electronics for lower AC and clipping losses or capture their value by coupling to storage. AC losses and clipping are additional sources of losses in PV system energy yield. Inverter efficiency improvements and optimizations of bifacial PV systems that might include storage are areas of keen interest for future technology development. Systems designed for some amount of clipping at peak production can mitigate and transfer these losses by coupling to storage, which enables solar to become a more dispatchable and valuable power generator.

46 This report is available at no cost from the National Renewable Energy Laboratory at www.nrel.gov/publications.
7 Conclusions and Outlook This report in the series of Solar Futures Study reports details 2020 baseline PV costs and performance benchmarks as well as R&D priorities for further advancements in PV module and system technologies including capital costs, O&M expenses, and lifetime energy yield.
Our 2020 direct manufacturing cost of goods sold benchmark is $0.19/W for monocrystalline monofacial and bifacial silicon PERC modules, $0.24/W for monocrystalline and bifacial silicon n-PERT/PERL modules, $0.24/W for monocrystalline and bifacial silicon HJT modules, $0.23/W for CdTe, and $0.40/W for CIGS. These benchmarks costs are derived from technology-specific process flows and input cost data collected through collaborations with materials and equipment suppliers and integrated manufacturers located across the globe. Using the 2020 ITRPV as our guide for crystalline silicon ingot, wafer, cell, and module manufacturing, we calculate $0.15/W direct manufacturing cost of goods sold for PERC modules by 2025. We calculate similar manufacturing costs projections for CdTe in the same time-frame. These costs are close to the Advanced scenario but not the Breakthrough scenario. Tandems are envisioned to be one potential pathway toward the $0.10/W cost of goods sold for module in the Breakthrough scenario.
2020 benchmark U.S. PV system capital costs are $2.71/WDC for the residential sector, $1.72/WDC for the commercial sector, $0.94/WDC for fixed tilt utility-scale systems and $1.01/WDC for one-axis tracking systems. We use NREL’s PV system capital cost models to calculate EPC and developer direct and overhead costs considering system design, system location and company structure. Based on technology innovations including improved module efficiency and physical dimension; power electronics; lower installation labor and materials costs; and lower remaining soft costs, our Advanced scenario system capital costs are $0.90/WDC for the residential sector, $0.80/WDC for the commercial sector and $0.50/WDC for one-axis tracking systems. The principal R&D priorities to achieve these capital costs reductions include lower cost components, new mounting and stringing configurations, consistent standards of construction and procurement that are applied more universally across the industry, and soft costs reductions by lower overhead and more efficient supply chains, streamlined PII, and lower customer acquisition costs.
2020 benchmark U.S. PV O&M expenses are $28.9/kWDC-yr for the residential sector, $18.6/kWDC-yr for the commercial sector, $16.3/kWDC-yr for fixed tilt utility-scale systems and $17.5/kWDC-yr for one-axis tracking systems. We use NREL’s PV system O&M cost models to estimate benchmark and future O&M expenses related to module, inverter, and other component parts replacement; land leasing costs, taxes; insurance; and asset management. Based on technology innovations, including better component reliability and reduced overhead, we project O&M expenses will hold their historical trend of declining as a proportion of system capital costs across the principal PV sectors. Using the system capital costs projections given above, we estimate future O&M expenses for the Advanced scenario on the order of $6/kWDC-yr for the residential sector, $6/kWDC-yr for the commercial sector and $8/kWDC-yr for one-axis tracking systems. The principal R&D priorities to achieve these reductions in O&M expenses include reduced failures that necessitate component replacements, more cost-effective module cleaning and vegetation management solutions, improved system monitoring, better indoor and testing of

47 This report is available at no cost from the National Renewable Energy Laboratory at www.nrel.gov/publications.
components and enhanced procurement processes, more-efficient asset management approaches, and potential co-benefits, including PV coupled with agriculture.
We use NREL’s SAM and reV models to calculate median 2020 benchmark energy yields of around 1,700 kWhAC/kWDC with a standard deviation of 200 kWhAC/kWDC and with a range of 1,150 kWhAC/kWDC to 2,300 kWhAC/kWDC. Calling on technology advances including bifacial system configurations, lower module temperature coefficient and better spectral response, optimized power electronics, and O&M practices that improve system uptime, we project 4%–7%, 8%–14%, and 12%–16% increases in annual first-year energy yield for our Moderate, Advanced, and Breakthrough scenarios respectively. Together with lower degradation rate, we calculate total lifetime energy yield production improvements of 8%–12%, 16%–20%, and 38%–42% increases in lifetime power production for the Moderate, Advanced, and Breakthrough respectively. We calculate that the median utility-scale LCOE for the continental United States moves from $34.9/MWhAC in our 2020 benchmark to $16.1/MWhAC in the Advanced scenario. The principal R&D priorities to realize these improvements in lifetime energy yield include modules with lower temperature coefficients and improved spectral response across more climates, bifacial system configurations, lower DC and AC losses and lower degradation rates, and overall increased system uptime over a longer service life.
48 This report is available at no cost from the National Renewable Energy Laboratory at www.nrel.gov/publications.
References Almansouri, Ibraheem, Anita Ho-Baillie, Stephen P. Bremner, and Martin A. Green. “Supercharging Silicon Solar Cell Performance by Means of Multijunction Concept.” IEEE Journal of Photovoltaics 5, no. 3 (May 2015): 968–76. https://doi.org/10.1109/JPHOTOV.2015.2395140.
Birch, Andrew. “How to Halve the Cost of Residential Solar in the US.” Greentech Media. January 5, 2018. https://www.greentechmedia.com/articles/read/how-to-halve-the-cost-of-residential-solar-in-the-us.
Chen, Yifeng, Daming Chen, Chengfa Liu, Zigang Wang, Yang Zou, Yu He, Yao Wang, et al. “Mass Production of Industrial Tunnel Oxide Passivated Contacts (i-TOPCon) Silicon Solar Cells with Average Efficiency over 23% and Modules over 345 W.” Progress in Photovoltaics: Research and Applications 27, no. 10 (2019): 827–34. https://doi.org/10.1002/pip.3180.
Chunduri, Shravan. “Not Only High Efficiency Cell Technologies Are Enabling High Efficiencies, Even Products Based On Mainstream PERC Have Also Attained Efficiencies Above 21%.” TaiyangNews, 2021. http://taiyangnews.info/technology/many-module-efficiencies-above-21/.
DeCeuster, D. “Passivating Contacts: Prospects for High Volume Manufacturing.” 2019. IEEE Photovoltaics Specialist Conference.
Deline, Chris, Kevin Anderson, Dirk Jordan, Andy Walker, Jal Desai, Kirsten Perry, Matt Muller, Bill Marion, and Robert White. “PV Fleet Performance Data Initiative: Performance Index-Based Analysis.” NREL/TP-5K00-78720. Golden, CO: National Renewable Energy Laboratory, 2021. https://www.nrel.gov/docs/fy21osti/78720.pdf.
Denholm, Paul, and Robert M. Margolis. “Evaluating the Limits of Solar Photovoltaics (PV) in Traditional Electric Power Systems.” Energy Policy 35, no. 5 (2007): 2852–61. https://doi.org/10.1016/j.enpol.2006.10.014.
DOE. “Solar Futures Study.” Washington, D.C.: U.S. Department of Energy Office of Energy Efficiency and Renewable Energy, 2021. https://www.energy.gov/eere/solar/solar-futures-study.
Faes, Antonin, Agata Lachowicz, Armand Bettinelli, Pierre-Jean Ribeyron, Jean-François Lerat, Delfina Munoz, Jonas Geissbühler, Heng-Yu Li, Christophe Ballif, and Matthieu Despeisse. “Metallization and Interconnection for High-Efficiency Bifacial Silicon Heterojunction Solar Cells and Modules.” Photovoltaics International, no. 3 (2018): 1–12. https://www.pv-tech.org/technical-papers/metallization-and-interconnection-for-highefficiency-bifacial-silicon-heterojunction-solar-cells-and-modules/.
Feldman, David, Mark Bolinger, and Paul Schwabe. “Current and Future Costs of Renewable Energy Project Finance Across Technologies.” NREL/TP-6A20-76881. Golden, CO: National Renewable Energy Laboratory, 2020. https://www.nrel.gov/docs/fy20osti/76881.pdf.

49 This report is available at no cost from the National Renewable Energy Laboratory at www.nrel.gov/publications.
Feldman, David, and Robert Margolis. “H2 2020: Solar Industry Update.” NREL/PR-7A40-79758. Golden, CO: National Renewable Energy Laboratory, 2021. https://doi.org/10.2172/1784533.
———. “Q2/Q3 2020 Solar Industry Update.” NREL/PR-6A20-78625. Golden, CO: National Renewable Energy Laboratory, December 24, 2020. https://www.nrel.gov/docs/fy21osti/78625.pdf.
Feldman, David, Robert Margolis, and Rebecca Jones-Albertus. “Quantifying the Impact of R&D on PV Project Financing Costs.” Energy Policy 142 (2020): 111525. https://doi.org/10.1016/j.enpol.2020.111525.
Feldman, David, Vignesh Ramasamy, Ran Fu, Ashwin Ramdas, Jal Desai, and Robert Margolis. “U.S. Solar Photovoltaic System and Energy Storage Cost Benchmark: Q1 2020.” Golden, CO: National Renewable Energy Laboratory, 2021. NREL/TP-6A20-77324. https://www.nrel.gov/docs/fy16osti/65298.pdf.
Gagnon, Pieter, Robert Margolis, Jennifer Melius, Caleb Phillips, and Ryan Elmore. “Rooftop Solar Photovoltaic Technical Potential in the United States. A Detailed Assessment.” NREL/TP-6A20-65298. Golden, CO: National Renewable Energy Laboratory, 2016. https://www.nrel.gov/docs/fy16osti/65298.pdf.
Gambogi, William, Steven MacMaster, Bao-Ling Yu, Thomas Felder, Hongjie Hu, Kaushik Roy Choudhury, and T. John Trout. “Sequential Testing That Better Predicts Field Performance.” Presented at the Atlas-NIST Workshop 2017, 2017. https://www.nist.gov/system/files/documents/2018/01/09/gambogi-filed_and_laboratpry_correlation-sequential_testing_that_better_predicts_field_performance.pdf.
Geisthardt, Russell M., Marko Topič, and James R. Sites. “Status and Potential of CdTe Solar-Cell Efficiency.” IEEE Journal of Photovoltaics 5, no. 4 (July 2015): 1217–21. https://doi.org/10.1109/JPHOTOV.2015.2434594.
Goodrich, Alan, Peter Hacke, Qi Wang, Bhushan Sopori, Robert Margolis, Ted L. James, and Michael Woodhouse. “A Wafer-Based Monocrystalline Silicon Photovoltaics Road Map: Utilizing Known Technology Improvement Opportunities for Further Reductions in Manufacturing Costs.” Solar Energy Materials and Solar Cells 114 (2013): 110–35. https://doi.org/10.1016/j.solmat.2013.01.030.
Goodrich, Alan, Ted James, and Michael Woodhouse. “Residential, Commercial, and Utility-Scale Photovoltaic (PV) System Prices in the United States: Current Drivers and Cost-Reduction Opportunities.” NREL/TP-6A20-53347. Golden, CO: National Renewable Energy Laboratory, 2012. https://doi.org/10.2172/1036048.
Goodrich, Alan, Michael Woodhouse, and Robert Margolis. “SunShot Vision Study: PV Technologies, Cost and Performance.” DOE SunShot Vision Study. DOE/GO-102012-3037. Washington, D.C.: U.S. Department of Energy, 2012. https://doi.org/10.2172/1039075.

50 This report is available at no cost from the National Renewable Energy Laboratory at www.nrel.gov/publications.
Harley, Gabriel, David D. Smith, and Peter John Cousins. Solar cell contact formation using laser ablation. 9,087,939. San Jose, CA, issued July 21, 2015. https://www.osti.gov/doepatents/biblio/1195928.
Heeter, Jenny, Ashok Sekar, Emily Fekete, Monisha Shah, and Jeffrey Cook. “Affordable and Accessible Solar for All: Barriers, Solutions, and On-Site Adoption Potential.” Golden, CO: National Renewable Energy Laboratory, 2021. https://www.nrel.gov/docs/fy21osti/80532.pdf. Huang, Susan, Jonathan Trinastic, and Michael Woodhouse. “Bottom-up Techno-Economic Cost Model for Silicon Cell Metallization Research Directions.” Presented at the Metallization Workshop at ISC Konstanz, 2019. http://www.metallizationworkshop.info/fileadmin/metallizationworkshop/presentations2019/5.4_Huang.pdf.
Jordan, Dirk C., Sarah R. Kurtz, Kaitlyn VanSant, and Jeff Newmiller. “Compendium of Photovoltaic Degradation Rates.” Progress in Photovoltaics: Research and Applications 24, no. 7 (2016): 978–89. https://doi.org/10.1002/pip.2744.
Jordan, Dirk C., B. Sekulic, B. Marion, and Sarah R. Kurtz. “Performance and Aging of a 20-Year-Old Silicon PV System.” IEEE Journal of Photovoltaics 5, no. 3 (2015): 744–51. https://doi.org/10.1109/JPHOTOV.2015.2396360.
Kempe, Michael D., Derek Holsapple, Kent Whitfield, and Narendra Shiradkar. “Standards Development for Modules in High Temperature Micro-Environments.” Progress in Photovoltaics 29, no. 4 (2021). https://doi.org/10.1002/pip.3389.
Kopecek, Radovan, Joris Libal, Jan Lossen, Valentin D. Mihailetchi, Haifeng Chu, Christoph Peter, Florian Buchholz, et al. “ZEBRA Technology: Low Cost Bifacial IBC Solar Cells in Mass Production with Efficiency Exceeding 23.5%.” In 2020 47th IEEE Photovoltaic Specialists Conference (PVSC), 1008–12. IEEE, 2020. https://doi.org/10.1109/PVSC45281.2020.9300503.
Luque, Antonio, and Steven Hegedus. Handbook of Photovoltaic Science and Engineering. 2nd ed. West Sussex, England: John Wiley & Sons, Ltd, 2011.
Maclaurin, Galen, Nicholas Grue, Anthony Lopez, Donna Heimiller, Michael Rossol, Grant Buster, and Travis Williams. “The Renewable Energy Potential (ReV) Model: A Geospatial Platform for Technical Potential and Supply Curve Modeling.” NREL/TP-6A20-73067. Golden, CO: National Renewable Energy Laboratory, 2019. https://doi.org/10.2172/1563140.
Mints, Paula. “Photovoltaic Manufacturer Capacity, Shipments, Price & Revenues.” SPV Market Research, 2021.
NREL, Sandia National Laboratories, SunSpec Alliance, and SunShot National Laboratory Multiyear Partnership (SuNLaMP) PV O&M Best Practices Working Group. “Best Practices for Operation and Maintenance of Photovoltaic and Energy Storage Systems; 3rd Edition.” NREL/TP-7A40-73822. Golden, CO: National Renewable Energy Laboratory, 2018. https://www.nrel.gov/docs/fy19osti/73822.pdf.

51 This report is available at no cost from the National Renewable Energy Laboratory at www.nrel.gov/publications.
Nielson, Gregory N., Kelsey Horowitz, Ashwin Ramdas, Benjamin Sigrin, Zigurts Majumdar, and Daniel Cunningham. “What’s the Real Value of High-Efficiency Solar Panels? An Analysis of HE Modules in Residential Applications across the U.S.” Solar Builder Magazine, 2020. https://solarbuildermag.com/news/whats-the-value-of-high-efficiency-solar-panels-in-residential-applications/.
NREL. “Annual Technology Baseline.” 2021. https://atb.nrel.gov/.
Osborne, Mark. “First Solar Pushing Capacity Expansions on Robust Demand.” PV Tech, 2021. https://www.pv-tech.org/first-solar-pushing-capacity-expansions-on-robust-demand/.
Owen-Bellini, Michael, Stephanie L. Moffitt, Archana Sinha, Ashley M. Maes, Joseph J. Meert, Todd Karin, Chris Takacs, et al. “Towards Validation of Combined-Accelerated Stress Testing through Failure Analysis of Polyamide-Based Photovoltaic Backsheets.” Scientific Reports 11, no. 1 (2021): 2019. https://doi.org/10.1038/s41598-021-81381-7.
Porter, Daniel L., James P. Durling, and Kimberly Reynolds. “Comments Regarding Requests for Product Exclusions From the Solar Products Safeguard Measure: AC Solar Modules.” United States Trade Representative Exclusion Request, 2018. https://www.regulations.gov/document/USTR-2018-0001-0037.
“PV Evolution Lab (PVEL) Webinar: What’s Next for PV Modules and Inverters: Results from PVEL’s Testing.” October 15, 2020.
Satpathy, Rabindra. “Additional Energy Yield Using Bifacial Solar PV Modules & Dependency on Albedo.” 2020. https://www.ises.org/sites/default/files/webinars/Presentation%20Rabi%20Satpathy_ISESWebinar_0.pdf.
Schäfer, Sören, and Rolf Brendel. “Accurate Calculation of the Absorptance Enhances Efficiency Limit of Crystalline Silicon Solar Cells With Lambertian Light Trapping.” IEEE Journal of Photovoltaics 8, no. 4 (July 2018): 1156–58. https://doi.org/10.1109/JPHOTOV.2018.2824024.
Shockley, William, and Hans J. Queisser. “Detailed Balance Limit of Efficiency of P‐n Junction Solar Cells.” Journal of Applied Physics 32, no. 3 (1961): 510–19. https://doi.org/10.1063/1.1736034.
Sickmoeller, M. “IBC Technology and Manufacturing.” Maxeon, 2020.
Smith, Brittany, Robert Margolis, Michael Woodhouse, and Jarett Zuboy. “Photovoltaic (PV) Module Technologies: 2020 Benchmark Costs and Technology Evolution Framework Results.” NREL/TP-7A40-78173. Golden, CO: National Renewable Energy Laboratory, 2021.
Energy.gov. “Solar Photovoltaic Cell Basics.” 2021. https://www.energy.gov/eere/solar/solar-photovoltaic-cell-basics.
52 This report is available at no cost from the National Renewable Energy Laboratory at www.nrel.gov/publications.
Thirsk, Mark. “Progress in Cost Reduction in Silver Pastes for Crystalline Silicon Cells.” Photovoltaics International 14 (2011): 41–44.
Trube, J. et al. “International Technology Roadmap for Photovoltaic,” 2021. https://itrpv.vdma.org/viewer/-/v2article/render/29775594.
———. “International Technology Roadmap for Photovoltaic (ITRPV) 2015 Results,” 2016.
SEIA. “U.S. Solar Market Insight.” 2021. https://www.seia.org/us-solar-market-insight.
VanSant, Kaitlyn T., Adele C. Tamboli, and Emily L. Warren. “III-V-on-Si Tandem Solar Cells.” Joule 5, no. 3 (2021): 514–18. https://doi.org/10.1016/j.joule.2021.01.010.
Walker, H., Eric Lockhart, Jal Desai, Kristen Ardani, Geoff Klise, Olga Lavrova, Tom Tansy, Jessie Deot, Bob Fox, and Anil Pochiraju. “Model of Operation-and-Maintenance Costs for Photovoltaic Systems.” NREL/TP-5C00-74840. Golden, CO: National Renewable Energy Laboratory, 2020. https://doi.org/10.2172/1659995.
Woodhouse, Michael, Alan Goodrich, Robert Margolis, Ted James, Ramesh Dhere, Tim Gessert, Teresa Barnes, Roderick Eggert, and David Albin. “Perspectives on the Pathways for Cadmium Telluride Photovoltaic Module Manufacturers to Address Expected Increases in the Price for Tellurium.” Solar Energy Materials and Solar Cells 115 (2013): 199–212. https://doi.org/10.1016/j.solmat.2012.03.023.
Woodhouse, Michael, Brittany Smith, Ashwin Ramdas, and Robert M. Margolis. “Crystalline Silicon Photovoltaic Module Manufacturing Costs and Sustainable Pricing: 1H 2018 Benchmark and Cost Reduction Road Map.” NREL/TP-6A20-72134. Golden, CO: National Renewable Energy Laboratory, 2019. https://doi.org/10.2172/1495719.
Woodhouse, Michael, Rebecca Jones-Albertus, David Feldman, Ran Fu, Kelsey Horowitz, Donald Chung, Dirk Jordan, and Sarah Kurtz. “On the Path to SunShot. The Role of Advancements in Solar Photovoltaic Efficiency, Reliability, and Costs.” NREL/TP-6A20-65872. Golden, CO: National Renewable Energy Laboratory, 2016. https://doi.org/10.2172/1253983.
Woodhouse, Michael, Ingrid Repins, David Miller, and Peter Hacke. “Boron-Oxygen and Ultraviolet Light Induced Degradation (BO LID and UV LID) and Light and Elevated Temperature Induced Degradation (LeTID) Impacts to Photovoltaic Module Performance and System Economics.” Presented at the DuraMAT Webinar December 2020, 2020. https://www.duramat.org/webinars.html.