research and development of nickel based catalysts …
TRANSCRIPT

RESEARCH AND DEVELOPMENT OF NICKEL
BASED CATALYSTS FOR CARBON DIOXIDE
REFORMING OF METHANE
A Thesis
Submitted to the College of Graduate Studies and Research
in Partial Fulfillment of the Requirements
for the Degree of Doctor Philosophy
in the Department of Chemical Engineering
University of Saskatchewan
Saskatoon, Saskatcheean
By
Jianguo Zhang
© Copyright Jianguo Zhang, Summer 2008. All right reserved.

i
PERMISSION TO USE
In presenting this thesis in partial fulfillment of the requirements for a Doctor of
Philosophy Degree from the University of Saskatchewan, I agree that the libraries of the
University of Saskatchewan may make this thesis freely available for inspection. I further
agree that permission for copying of this thesis in any manner, in whole or in part, for
scholarly purpose may be granted by the professors who supervised my thesis work or, in
their absence, by the Head of the Department or the Dean of the College of Graduate
Research and Studies in which the thesis work was complete. It is understood that any
copying or publication or use of this thesis or parts thereof for financial gain shall not be
allowed without my written permission. It is also understood that due recognition shall be
given to me and to the University of Saskatchewan in any scholarly use which may be
made of any material in my thesis.
Requests for permission to copy or to make other use of material in this thesis in
whole or parts shall be addressed to:
Head of the Department of Chemical Engineering
Univerisity of Saskatchewan
Saskatoon, Saskatchewan
Canada S7N 5A9
ii
ABSTRACT
Consuming two major greenhouse gases, carbon dioxide (CO2) and methane (CH4),
to produce synthesis gas, which is a mixture of carbon monoxide (CO) and hydrogen (H2),
CO2 reforming of CH4 shows significant environmental and economic benefits. However,
the process has not found wide industrial application due to severe catalyst deactivation,
basically caused by carbon formation. Therefore, it is of great interest to develop stable
catalysts without severe deactivation. This work is primarily focused on the development
of novel nickel-based catalysts to achieve stable operation for CO2 reforming of CH4.
Following Dowden’s strategy of catalyst design, a series of nickel-based catalysts
are designed with a general formula: Ni-Me/AlMgOx (Me = Co, Cu, Fe, or Mn). The
designed catalysts are prepared using co-precipitation method and tested for CO2
reforming of CH4. Catalyst screening showed that the Ni-Co/AlMgOx catalyst has
superior performance in terms of activity and stability to other Ni-Me/AlMgOx (Me = Cu,
Fe, or Mn) catalysts. A 2000 h long-term deactivation test has shown that the Ni-
Co/AlMgOx has high activity and excellent stability for CO2 reforming of CH4.
Further investigation on the Ni-Co/AlMgOx catalysts shows that adjusting Ni/Co
ratio and Ni-Co loading can significantly affect the catalyst performance. Carbon free
operation for CO2 reforming of CH4 can be achieved on the catalysts with a Ni/Co close
to 1 and Ni-Co overall loading between 4-10 %. In addition, calcination temperature

iii
shows important impacts on the performance of Ni-Co/AlMgOx catalysts. A calcination
temperature range of 700-900 oC is recommended.
The Ni-Co/AlMgOx catalysts are characterized using various techniques such as
ICP-MS, BET, CO-chemiosorption, XRD, TPR, TG/DTA, TEM, and XPS. It has been
found that the high activity and excellent stability of Ni-Co/AlMgOx catalysts can be
ascribed to its high surface area, high metal disperation, small particle size, strong metal-
support interaction, and synergy between Ni and Co.
Kinetic studies have shown that the CH4 decomposition and CO2 activation could
be the rate-determining steps. Both Power-Law and Langmuir-Hinshelwood kinetic
models can fit the experiment data with satisfactory results.

iv
ACKNOWLEDGEMENT
I would like to sincerely express my great gratitude to Dr. Hui Wang and Dr. Ajay K.
Dalai for being my supervisors and supporting this work financially. I appreciate their
patience, guidance and encouragement during the research and writing of the thesis.
I would like to extend my special appreciation to my advisory committee: Dr. R.
Evitts, Dr. M. Nemati, Dr. D.-Y. Peng, and Dr. S. Urquhart at the University of
Saskatchewan for their guidance and valuable advice throughout the research and thesis
preparation.
Furthermore, I would like to thank all the supporting staff in the Department of
Chemical Engineering: Ms. Jean Horosko, Ms. Kelly Bader, Mr. Ted Wallentiny, Mr.
Richard Blondin, and Mr. Dragan Cekic for their support during the research.
My sincere thanks also go to my friends. I would like to acknowledge Haijun Sun,
Dongmei Fang, Deming Wang, Ramin Azargohar, and Christian Botchwey for their help
and friendship during my research and studies at the University of Saskatchewan.
My gratitude goes to my parents and sister, who never stop wishing me the best of
luck. Lastly, I would like to thank my wife Ruihong Yu for her love and support, without
which the studies and research over the last five years in Saskatoon would not have been
possible.

v
TABLE OF CONTENTS
PERMISSION TO USE ..............................................................................................................................I
ABSTRACT ............................................................................................................................................... II
ACKNOWLEDGEMENT .......................................................................................................................IV
TABLE OF CONTENTS .......................................................................................................................... V
LIST OF TABLES ..................................................................................................................................... X
LIST OF FIGURES..................................................................................................................................XI
1 INTRODUCTION ............................................................................................................................... 1
1.1 GREENHOUSE GAS AND SYNTHESIS GAS................................................................................ 1
1.1.1 GREENHOUSE GAS EMISSION .............................................................................................................. 1 1.1.2 PRODUCTION OF SYNTHESIS GAS ........................................................................................................ 2
1.2 DEVELOPMENT OF CO2 REFORMING OF CH4......................................................................... 5
1.2.1 OVERVIEW.......................................................................................................................................... 5 1.2.2 DEVELOPMENT OF REFORMING CATALYSTS ........................................................................................ 5 1.2.3 CALCOR PROCESS .......................................................................................................................... 11 1.2.4 SPARG PROCESS.............................................................................................................................. 12
1.3 SUMMARY OF CO2 REFORMING OF CH4 TECHNOLOGY................................................... 13
1.4 RESEARCH OBJECTIVES AND SCOPE..................................................................................... 14
1.5 ORGANIZATION OF THE THESIS .............................................................................................. 14
2 CATALYST DESIGN AND PREPARATION ................................................................................. 17
2.1 CATALYST DESIGN........................................................................................................................ 17
2.1.1 DEFINING OBJECTIVES FOR CATALYST DESIGN.................................................................................. 17 2.1.2 TARGET REACTION ........................................................................................................................... 18 2.1.3 STOICHIOMETRIC ANALYSIS.............................................................................................................. 19
2.1.3.1 Primary reactant reaction........................................................................................................... 19 2.1.3.2 Reactant self-interaction reactions............................................................................................. 20 2.1.3.3 Reactant cross-interaction reactions .......................................................................................... 20 2.1.3.4 Reactant-product reactions ........................................................................................................ 21 2.1.3.5 Product-product reactions.......................................................................................................... 21 2.1.3.6 Network of reaction ................................................................................................................... 22
2.1.4 THERMODYNAMIC ANALYSIS............................................................................................................ 24 2.1.4.1 Equilibrium constant.................................................................................................................. 24

vi
2.1.4.2 Equilibrium composition as a function of temperature.............................................................. 26 2.1.4.3 Equilibrium composition as a function of total pressure ........................................................... 27 2.1.4.4 Equilibrium composition as a function of initial CO2/CH4 molar ratio ..................................... 29 2.1.4.5 Effects of inert N2 ...................................................................................................................... 30 2.1.4.6 Carbon formation....................................................................................................................... 31
2.1.5 PROPOSED MECHANISM.................................................................................................................... 33 2.1.6 DESIRED CATALYST PROPERTIES ....................................................................................................... 35 2.1.7 SCOPE OF CATALYTIC MATERIALS FOR CO2 REFORMING OF CH4....................................................... 37
2.1.7.1 Determination of primary active component ............................................................................. 38 2.1.7.2 Determination of targeted secondary active component............................................................ 39 2.1.7.3 Determination of catalyst support.............................................................................................. 40
2.2 CATALYST PREPARATION........................................................................................................... 41
2.2.1 PRECIPITATION METHOD................................................................................................................... 41 2.2.1.1 Precipitating process and unit operation .................................................................................... 41 2.2.1.2 Chemistry of precipitation ......................................................................................................... 42 2.2.1.3 Set-up for precipitation .............................................................................................................. 43 2.2.1.4 Advantages and disadvantages of precipitation method ............................................................ 44
2.2.2 IMPREGNATION METHOD .................................................................................................................. 44 2.2.3 CATALYST PREPARATION................................................................................................................... 46
2.2.3.1 Determination of preparation method........................................................................................ 46 2.2.3.2 Catalyst preparation procedure .................................................................................................. 48
2.3 PRELIMINARY EXPERIMENTS.................................................................................................. 49
3 DEVELOPMENT OF LONG TERM STABLE NI CATALYSTS FOR CO2 REFORMING OF CH4 ............................................................................................................................................................ 53
CONTRIBUTION OF PH.D. CANADIDATE....................................................................................... 53
CONTRIBUTION OF THIS CHAPTER TO THE OVERALL STUDY ............................................ 53
ABSTRACT .............................................................................................................................................. 54
3.1 INTRODUCTION............................................................................................................................. 54
3.2 EXPERIMENTAL............................................................................................................................. 56
3.2.1 CATALYST PREPARATION................................................................................................................... 56 3.2.2 CATALYST CHARACTERIZATION........................................................................................................ 57 3.2.3 CATALYST TESTING........................................................................................................................... 58 3.2.3 DATA PROCESSING ............................................................................................................................ 59
3.3 RESULTS AND DISCUSSION ........................................................................................................ 60
3.3.1 PHYSICAL PROPERTIES OF THE PREPARED CATALYSTS....................................................................... 60 3.3.2 CATALYST SCREENING FOR CO2 REFORMING OF CH4........................................................................ 61 3.3.3 CARBON DEPOSITION AND ACTIVITY OF DIFFERENT NI-ME CATALYSTS ............................................ 63

vii
3.3.4 LONG-TERM DEACTIVATION TEST OF NI-CO CATALYST..................................................................... 64 3.3.4.1 Stability and carbon formation .................................................................................................. 64 3.3.4.2 Stability and catalyst structure................................................................................................... 67 3.3.4.3 Stability and product distribution .............................................................................................. 71
3.3.5 COMPARISON NI AND CO MONOMETALLIC CATALYSTS WITH NI-CO CATALYST................................. 71 3.3.5.1 Element composition ................................................................................................................. 71 3.3.5.2 N2-physical absorption............................................................................................................... 72 3.3.5.3 CO-chemisorption ..................................................................................................................... 73 3.3.5.4 Reducibility ............................................................................................................................... 74 3.3.5.5 Bulk phases................................................................................................................................ 75 3.3.5.6 Oxidation states of Ni and Co.................................................................................................... 77 3.3.5.7 Comparison of activity and stability of Ni, Co monometallic catalysts with Ni-Co bimetallic
catalyst for CO2 reforming of CH4 ........................................................................................... 78 3.3.6 DISCUSSION ON CATALYST ACTIVITY, STABILITY, AND CARBON RESISTANCE..................................... 80
3.4 CONCLUSIONS................................................................................................................................ 82
4 EFFECTS OF NI AND CO CONTENTS ON THE NI-CO/ALMGOX BIMETALLIC CATALYSTS............................................................................................................................................. 84
CONTRIBUTION OF PH.D. CANADIDATE....................................................................................... 84
CONTRIBUTION OF THIS CHAPTER TO THE OVERALL STUDY ............................................ 84
ABSTRACT .............................................................................................................................................. 85
4.1 INTRODUCTION............................................................................................................................. 86
4.2 EXPERIMENTAL............................................................................................................................. 88
4.2.1 CATALYST PREPARATION................................................................................................................... 88 4.2.2 CATALYST CHARACTERIZATION........................................................................................................ 88 4.2.3 CATALYST TESTING........................................................................................................................... 88
4.3 RESULTS AND DISCUSSION ........................................................................................................ 89
4.3.1 EFFECTS OF NI/CO RATIO ................................................................................................................. 89 4.3.1.1 Elemental composition .............................................................................................................. 89 4.3.1.2 Effects of Ni/Co ratio on BET surface area ............................................................................... 89 4.3.1.3 Effects of Ni/Co ratio on pore distribution ................................................................................ 91 4.3.1.4 Effects of Ni/Co ratio on phase structure................................................................................... 93 4.3.1.5 Effects of Ni/Co ratio on catalyst activity for CO2 reforming of CH4 ....................................... 94
4.3.2 EFFECTS OF NI-CO CONTENT ON CATALYST PROPERTIES AND PERFORMANCE FOR CO2 REFORMING OF
CH4 .................................................................................................................................................. 96 4.3.2.1 Bulk properties of the samples .................................................................................................. 96 4.3.2.2 Surface area and pore size distribution of the catalysts ............................................................. 98 4.3.2.3 Metal dispersion and particle size............................................................................................ 100

viii
4.3.2.4 CO2 reforming of CH4 and carbon formation .......................................................................... 103 4.3.2.5 Effects of Ni-Co content on properties and activity of Ni-Co bimetallic catalysts for CO2
reforming of CH4.................................................................................................................... 108 4.3.2.6 Carbon formation and stability of the Ni-Co bimetallic catalysts for CO2 reforming of CH4 . 110
4.4 CONCLUSIONS...............................................................................................................................114
5 EFFECTS OF THE CATALYST CALCINATION TEMPERATURES ON NI-CO/ALMGOX115
CONTRIBUTION OF PH.D. CANADIDATE......................................................................................115
CONTRIBUTION OF THIS CHAPTER TO THE OVERALL STUDY ...........................................115
ABSTRACT .............................................................................................................................................116
5.1 INTRODUCTION............................................................................................................................117
5.2 EXPERIMENTAL............................................................................................................................118
5.2.1 CATALYST PREPARATION................................................................................................................. 118 5.2.2 CATALYST CHARACTERIZATION AND TESTING ................................................................................ 118
5.3 EFFECTS OF CALCINATION ON 0.06NI0.09CO CATALYST ................................................119
5.3.1 CATALYST CHARACTERIZATION ...................................................................................................... 119 5.3.1.1 N2-physisorption...................................................................................................................... 119 5.3.1.2 X-ray diffraction (XRD) .......................................................................................................... 121 5.3.1.3 Temperature-programmed reduction (TPR)............................................................................. 122 5.3.1.4 Transmission electron microscopy (TEM)............................................................................... 124
5.3.2 CATALYST TESTING......................................................................................................................... 126 5.3.2.1 Activity for CO2 reforming of CH4 of 0.06Ni0.09Co .............................................................. 126 5.3.2.2 Stability of 0.06Ni0.09Co calcined at different temperatures.................................................. 127 5.3.2.3 Carbon deposition over 0.06Ni0.09Co calcined at different temperatures .............................. 129
5.4 DISCUSSION BASED ON THE EFFECTS OF CALCINATION TEMPERATURES ON 0.06NI0.09CO CATALYSTS.................................................................................................................. 132
5.4.1 CATALYST ACTIVITY AND ACTIVE SITES .......................................................................................... 132 5.4.2 CARBON DEPOSITION AND ACTIVE SITES ........................................................................................ 134 5.4.3 ORIGIN OF CARBON DEPOSITION..................................................................................................... 136
5.5 EFFECTS OF CALCINATION ON 0.04NI0.05CO CATALYSTS ............................................. 138
5.5 CONCLUSIONS.............................................................................................................................. 139
6 EXPERIMENTAL AND KINETIC STUDIES................................................................................. 141
CONTRIBUTION OF PH.D. CANADIDATE..................................................................................... 141
CONTRIBUTION OF THIS PAPER TO THE OVERALL STUDY................................................. 141
ABSTRACT ............................................................................................................................................ 142

ix
6.1 INTRODUCTION........................................................................................................................... 143
6.2 EXPERIMENTAL........................................................................................................................... 145
6.2.1 CATALYST PREPARATION AND ACTIVATION...................................................................................... 145 6.2.2 EXPERIMENT PROCEDURE............................................................................................................... 145
6.3 RESULTS AND DISCUSSION ...................................................................................................... 147
6.3.1 CATALYST DEACTIVATION............................................................................................................... 147 6.3.2 EFFECTS OF MASS TRANSFER AND HEAT TRANSFER ........................................................................ 147 6.3.3 EFFECT OF PARTIAL PRESSURE ON REFORMING RATE...................................................................... 150 6.3.4 EFFECT OF REACTANT PARTIAL PRESSURE ON FORMATION RATE OF PRODUCTS............................... 152 6.3.5 SIDE REVERSE WATER GAS SHIFT (RWGS) REACTION..................................................................... 155 6.3.6 EFFECT OF TEMPERATURES AND APPARENT ACTIVATION ENERGY ................................................... 157 6.3.7 KINETIC MODELS............................................................................................................................ 159
6.3.7.1 Power law model ..................................................................................................................... 159 6.3.7.2 Consideration of reaction mechanism – Langmuir-Hinshelwood mechanism......................... 162 6.3.7.3 L-H type of model ................................................................................................................... 164
6.4 CONCLUSIONS.............................................................................................................................. 168
NOMENCLATURE ............................................................................................................................... 169
7 CONCLUSIONS AND RECOMMENDATIONS ......................................................................... 170
7.1 CONCLUSIONS.............................................................................................................................. 170
7.2 RECOMMENDATIONS ............................................................................................................... 173
REFERENCES:...................................................................................................................................... 176
APPENDIX A: CALIBRATION OF MASS FLOW CONTROLLERS ............................................ 186
APPENDIX B: CALIBRATION OF GAS CHROMATOGRAPHY ................................................. 188
APPENDIX C: TEMPERATURE PROFILE OF REACTOR........................................................... 192
APPENDIX D: CALCULATION OF GIBBS FREE ENERGY CHANGE OF REACTION USING THIRD LAW METHOD........................................................................................................................ 193
APPENDIX E: CALCULATION OF CONVERSION AND SELECTIVITY.................................. 195

x
LIST OF TABLES TABLE 1.1 PROCESSES PRODUCING SYNTHESIS GAS .......................................................................................... 3 TABLE 1.2 DEVELOPMENT OF REFORMING CATALYSTS...................................................................................... 6 TABLE 1.3 MELTING POINT OF CATALYST SUPPORT MATERIALS ......................................................................... 9 TABLE 2.1 PRIMARY REACTANT REACTION ..................................................................................................... 19 TABLE 2.2 REACTANT SELF-INTERACTION REACTIONS.................................................................................... 20 TABLE 2.3 REACTANT SELF INTERACTION REACTIONS .................................................................................... 20 TABLE 2.4 REACTANT-PRODUCT REACTIONS................................................................................................... 21 TABLE 2.5 PRODUCT-PRODUCT REACTIONS..................................................................................................... 21 TABLE 2.6 THE DECISION CHART FOR THE SELECTION OF CATALYST PREPARATION METHOD ........................... 47 TABLE 3.1 ELEMENTAL COMPOSITION, BET SURFACE AREA, AVERAGE PORE DIAMETER OF CATALYSTS FOR
SCREENING.................................................................................................................................... 61 TABLE 3.2 CARBON FORMATION AND ACTIVITY CHANGE OF NI-ME CATALYST AT 28 H ................................... 64 TABLE 3.3 PERFORMANCE COMPARISON WITH LITERATURE DATA ................................................................... 67 TABLE 3.4 COMPOSITION OF Ni AND Co MONOMETALLIC AND Ni-Co BIMETALLIC CATALYSTS ....................... 72 TABLE 3.5 BET ANALYSIS FOR Ni AND Co MONOMETALLIC AND Ni-Co BIMETALLIC CATALYSTS.................... 72 TABLE 3.6 METALLIC SURFACE AREA AND METAL DISPERSION OF Ni AND Co MONOMETALLIC AND Ni-Co
BIMETALLIC CATALYSTS ................................................................................................................ 74 TABLE 3.7 ACTIVITY AND CARBON FORMATION RATE OF Ni AND Co MONOMETALLIC AND Ni-Co BIMETALLIC
CATALYSTS .................................................................................................................................... 79 TABLE 4.1 Ni/Co RATIO AND ELEMENTAL COMPOSITION ................................................................................. 89 TABLE 4.2 COMPOSITION AND SPECIFIC SURFACE AREA OF Ni-Co BIMETALLIC CATALYSTS CALCINED............ 99 TABLE 4.3 METALLIC SURFACE AREA AND METAL DISPERSION OF Ni-Co BIMETALLIC CATALYSTS WITH
DIFFERENT Ni-Co CONTENT ........................................................................................................ 101 TABLE 4.4 CARBON FORMATION OF THE BIMETALLIC CATALYSTS WITH DIFFERENT Ni-Co CONTENTS........... 105 TABLE 5.1 SURFACE AREA, PORE VOLUME, AND AVERAGE PORE DIAMETER OF 0.06Ni0.09Co CATALYSTS
CALCINED AT VARIOUS TEMPERATURES ....................................................................................... 119 TABLE 5.2 THE CARBON DEPOSITION OVER 0.06Ni0.09Co CATALYSTS ......................................................... 129 TABLE 6.1 KINETIC EXPERIMENT DESIGN AND REACTANT CONVERSION OF THE CO2 REFORMING OF CH4 OVER
Ni-Co/AlMgOx CATALYST AT 95% CONFIDENCE INTERVAL ......................................................... 146 TABLE 6.2 APPARENT ACTIVATION ENERGY (Ea, KJ/MOL) OVER Ni BASED CATALYSTS.................................. 159 TABLE 6.3 PARAMETERS OF POWER LAW EQUATION ...................................................................................... 160 TABLE 6.4 ESTIMATED PARAMETERS OF THE POWER LAW MODEL OF Ni-Co BIMETALLIC CATALYST.............. 160 TABLE 6.5 REPORTED L-H MODELS FOR CO2 REFORMING OF CH4 OVER Ni-BASED CATALYSTS.................... 165 TABLE 6.6 PARAMETER ESTIMATES OF THE L-H MODEL................................................................................ 167

xi
LIST OF FIGURES FIG. 1.1 GREENHOUSE GAS DISTRIBUTION IN CANADA .................................................................................... 1 FIG. 1.2 THE CHEMICAL ENERGY TRANSMISSION SYSTEM (CETS)................................................................... 4 FIG. 1.3 SCHEMATIC OF THE CALCOR STANDARD PROCESS (TEUNER ET AL., 2001)..................................... 11 FIG. 1.4 SCHEMATIC OF THE SPARG PROCESS (UDENGAARD ET AL., 1992)................................................... 12 FIG. 2.1 STEPS IN THE CATALYST DESIGN (DOWDEN ET AL., 1968) ................................................................. 18 FIG. 2.2 VARIATION OF REACTION EQUILIBRIUM CONSTANTS K WITH TEMPERATURES ................................... 25 FIG. 2.3 VARIATION OF EQUILIBRIUM COMPOSITION WITH TEMPERATURES .................................................... 26 FIG. 2.4 EFFECTS OF TOTAL PRESSURE ON EQUILIBRIUM COMPOSITION AT 1023 K AND INITIAL CO2/CH4/N2
RATIO OF 1/1/0.................................................................................................................................. 27 FIG. 2.5 EFFECTS OF TEMPERATURES AND PRESSURES ON CH4 CONVERSION ................................................. 28 FIG.2.6 EFFECTS OF TEMPERATURES AND PRESSURES ON H2 SELECTIVITY .................................................... 29 FIG.2.7 EFFECTS OF INITIAL CO2/CH4 ON EQUILIBRIUM COMPOSITION AT 1023 K AND 1 ATM....................... 30 FIG.2.8 EFFECTS OF INERT N2 GAS ON CH4 CONVERSION AND H2 SELECTIVITY............................................. 30 FIG.2.9 EFFECTS OF CO2/CH4 RATIO AND INERT GAS N2 ON LIMITING TEMPERATURES BELOW WHICH CARBON
FORMATION OCCURS AT 1 ATM .......................................................................................................... 33 FIG.2.10 PROPOSED SURFACE MECHANISM FOR CO2 REFORMING OF CH4 ...................................................... 35 FIG.2.11 SCHEMATIC OF TYPICAL PREPARATION PROCESS OF PRECIPITATED CATALYSTS ................................. 42 FIG.2.12 SCHEMATIC OF LAB SCALE PRECIPITATION SET-UP............................................................................ 44 FIG.2.13 SCHEMATIC OF PREPARATION PROCESS OF IMPREGNATED CATALYSTS .............................................. 45 FIG.2.14 COMPARISON BETWEEN MEASURED (SOLID LINES) AND CALCULATED COMPOSITION (DOTTED LINES)
BASED ON THREE INDEPENDENT REACTIONS..................................................................................... 51 FIG. 2.15 COMPARISON BETWEEN MEASURED (SOLID LINES) AND CALCULATED COMPOSITION (DOTTED LINES)
BASED ON TWO INDEPENDENT REACTIONS........................................................................................ 52 FIG. 3.1 ACTIVITY AND STABILITY OF NI-ME CATALYSTS IN TERMS OF CH4 CONVERSION.............................. 62 FIG. 3.2 ACTIVITY AND STABILITY OF NI-ME CATALYSTS IN TERMS OF CO2 CONVERSION.............................. 62 FIG. 3.3 H2/CO RATIO AS A FUNCTION OF TIME-ON-STREAM OF Ni-Me CATALYSTS........................................ 63 FIG. 3.4 CARBON FORMATION AND REACTION RATE OF METHANE OVER Ni-Co CATALYST ............................. 65 FIG. 3.5 XAS SPECTRA OF REFERENCE COMPOUNDS OBTAINED FORM PGM.................................................. 68 FIG. 3.6 XAS SPECTRA OF FRESH AND SPENT Ni-Co CATALYSTS OBTAINED FROM PGM ................................ 69 FIG. 3.7 Ni 2P XAS SPECTRA OF FRESH AND SPENT Ni-Co CATALYSTS OBTAINED FROM SGM....................... 70 FIG. 3.8 Co 2P XAS SPECTRA OF FRESH AND SPENT Ni-Co CATALYSTS OBTAINED FROM SGM ...................... 70 FIG. 3.9 H2/CO AS A FUNCTION OF TIME-ON-STREAM OVER Ni-Co CATALYST................................................ 71 FIG. 3.10 PORE DISTRIBUTION OF NI AND CO MONOMETALLIC AND NI-CO BIMETALLIC CATALYSTS ............... 73 FIG. 3.11 TPR PROFILES OF NI AND CO MONOMETALLIC AND Ni-Co BIMETALLIC CATALYSTS CALCINED AT 900
OC..................................................................................................................................................... 74 FIG. 3.12 XRD ANALYSIS OF Ni AND Co MONOMETALLIC AND Ni-Co BIMETALLIC CATALYSTS CALCINED AT 900
OC..................................................................................................................................................... 76
xii
FIG. 3.13 XPS SPECTRA OF Ni 2P3/2 AND Co 2P3/2 IN Ni AND Co MONOMETALLIC AND Ni-Co BIMETALLIC
CATALYSTS CALCINED AT 900 OC....................................................................................................... 77 FIG. 3.14 COMPARISON OF STABILITY OF Ni-Co BIMETALLIC CATALYST AND Ni AND Co MONOMETALLIC
CATALYSTS (SOLID LINE: CH4 REACTION RATE; DOTTED LINE: CO2 REACTION RATE)........................ 79 FIG. 3.15 TEM IMAGES OF SPENT CATALYSTS. A: Ni CATALYST; B: Co CATALYST; C: Ni-Co CATALYST ........... 80 FIG. 4.1 EFFECTS OF NI/CO RATIO ON THE BET SURFACE AREA OF THE SAMPLES .......................................... 90 FIG. 4.2 PORE VOLUME DISTRIBUTION AS A FUNCTION OF Ni/Co WHEN Co CONTENT IS CONSTANT ............... 91 FIG. 4.3 PORE VOLUME DISTRIBUTION AS A FUNCTION OF Co/Ni WHEN Ni CONTENT IS CONSTANT................ 92 FIG. 4.4 XRD ANALYSIS FOR THE Ni-Co/AlMgOx CATALYSTS WITH VARIOUS Ni/Co OR Co/Ni RATIOS
CALCINATED AT 900 OC..................................................................................................................... 93 FIG. 4.5 ACTIVITY OF CATALYST WITH VARIOUS Ni/Co RATIOS FOR CO2 REFORMING OF CH4 ........................ 94 FIG. 4.6 ACTIVITY OF CATALYST WITH VARIOUS Co/Ni RATIOS FOR CO2 REFORMING OF CH4 ........................ 95 FIG. 4.7 XRD PATTERNS FOR SAMPLES WITH DIFFERENT Ni-Co CONTENT CALCINED AT 900 OC ○SPINEL-LIKE
STRUCTURES □ SOLID SOLUTIONS................................................................................................... 97 FIG. 4.8 TEMPERATURE-PROGRAMMED REDUCTION OF THE SAMPLES WITH DIFFERENT Ni-Co CONTENT
CALCINATED AT 900 OC..................................................................................................................... 98 FIG. 4.9 VARIATION OF BET SURFACE AREA WITH VARIOUS (Ni+Co)/(Al+Mg) RATIOS.................................. 99 FIG. 4.10 PORE SIZE DISTRIBUTION OF THE CATALYSTS WITH DIFFERENT Ni-Co CONTENT ............................ 100 FIG. 4.11 TEM IMAGE OF Ni-Co CATALYSTS WITH DIFFERENT METAL CONTENT AND PARTICLE SIZE ............. 102 FIG. 4.12 ACTIVITY AS A FUNCTION OF TOS OF CATALYSTS WITH DIFFERENT Ni-Co CONTENT...................... 104 FIG. 4.13 TG (A) AND DTG (B) PROFILES OF TPO IN AIR FOR THE CATALYSTS AFTER 250 H REACTION AT 750
OC, 1 ATM, GHSV=180,000 ML/GCAT-H, AND CH4/CO2/N2=1/1/1.................................................... 106 FIG. 4.14 TEM IMAGES OF DIFFERENT Ni-Co CONTENT CATALYSTS AFTER 250 H TOS ................................. 107 FIG. 4.15 CONCEPT MODEL OF CARBON REMOVAL AND CARBON FORMATION OVER THE Ni-Co BIMETALLIC
CATALYST FOR CO2 REFORMING OF CH4......................................................................................... 113 FIG. 5.1 PORE AREA AND PORE VOLUME DISTRIBUTION OF 0.06Ni0.09Co BIMETALLIC CATALYSTS CALCINED
AT VARIOUS TEMPERATURES ........................................................................................................... 120 FIG. 5.2 XRD DIFFRACTOGRAM OF 0.06Ni0.09Co CATALYSTS CALCINATED AT VARIOU TEMPERATURES ..... 121 FIG. 5.3 TPR PROFILE OF 0.06Ni0.09Co CATALYSTS CALCINED AT VARIOUS TEMPERATURES....................... 124 FIG. 5.4 TEM IMAGE OF 0.06Ni0.09Co CATALYST CALCINATED AT VARIOUS TEMPERATURES ...................... 125 FIG. 5.5 GHSV EFFECTS ON THE REACTION RATE OF CH4 OVER 0.06Ni0.09Co CATALYSTS CALCINED AT
VARIOUS TEMPERATURES FOR CO2 REFORMING OF CH4 ................................................................. 126 FIG. 5.6 THE STABILITY OF 0.06Ni0.09Co CATALYSTS CALCINED AT DIFFERENT TEMPERATURES FOR CO2
REFORMING OF CH4........................................................................................................................ 127 FIG. 5.7 THE STABILITY OF Ni-Co CATALYSTS CALCINED AT DIFFERENT TEMPERATURES FOR CO2 REFORMING
OF CH4 ........................................................................................................................................... 128 FIG. 5.8 CARBON DEPOSITION ANALYSIS BY TG/DTG AFTER 50 H TIME-ON-STREAM .................................. 131 FIG. 5.9 TEM IMAGES OF CARBON DEPOSIT ON DIFFERENT 0.06Ni0.09Co CATALYSTS CALCINED AT DIFFERENT
TEMPERATURES AFTER 50 H TIME-ON-STREAM ............................................................................... 132 FIG. 5.10 THE ACTIVITY AND STABILITY OF 0.04Ni0.05Co CATALYSTS CALCINED AT DIFFERENT TEMPERATURES
FOR CO2 REFORMING OF CH4 ......................................................................................................... 139

xiii
FIG. 6.1 EFFECT OF FLOW VELOCITY ON REACTION RATE OF Ni-Co/AlMgOX CATALYST .............................. 148 FIG. 6.2 EFFECT OF CATALYST PARTICLE SIZE ON REFORMING RATE OVER Ni-Co/AlMgOX CATALYST.......... 149 FIG. 6.3 EFFECT OF CO2 PARTIAL PRESSURE ON THE REFORMING RATES OF CO2 REFORMING OF CH4 OVER Ni-
Co/AlMgOX CATALYST ................................................................................................................... 151 FIG. 6.4 EFFECT OF CH4 PARTIAL PRESSURE ON THE REFORMING RATES OF CO2 REFORMING OF CH4 OVER Ni-
Co/AlMgOX CATALYST ................................................................................................................... 152 FIG. 6.5 EFFECT OF REACTANT PARTIAL PRESSURES ON THE FORMATION RATES OF CO OVER Ni-Co/AlMgOx
CATALYST ....................................................................................................................................... 153 FIG. 6.6 EFFECT OF REACTANT PARTIAL PRESSURES ON THE FORMATION RATES OF H2 OVER Ni-Co/AlMgOX
CATALYST ....................................................................................................................................... 155 FIG. 6.7 REACTION RATE OF RWGS REACTION AS A FUNCTION OF CO2 PARTIAL PRESSURES ....................... 157 FIG. 6.8 EFFECT OF TEMPERATURES ON THE REACTION RATES OF CO2 REFORMING OF CH4......................... 159 FIG.6.9 COMPARISON OF EXPERIMENTAL CH4 CONVERSION WITH CALCULATED CH4 CONVERSION USING
INTEGRAL METHOD (EQ. 6.6) AND P-L RATE LAW (EQ.6.4) ............................................................. 162 FIG. 6.10 COMPARISON OF EXPERIMENTAL CH4 CONVERSION WITH THE CALCULATED CH4 CONVERVISON
USING INTERGRAL METHOD (EQ. 6.6) AND L-H MODEL (EQ. 6.19).................................................. 168

1
1 INTRODUCTION
This chapter introduces the background and the development of carbon dioxide
(CO2) reforming of methane (CH4) technology. The significance of CO2 reforming of CH4
is discussed. The research objectives and the structure of the thesis are outlined.
1.1 GREENHOUSE GAS AND SYNTHESIS GAS
1.1.1 Greenhouse gas emission
Greenhouse gases are the components in the atmosphere proposed to cause an
increase in surface temperature of the globe, which is known as the greenhouse effect.
Greenhouse gases include carbon dioxide (CO2), methane (CH4), oxides of nitrogen (NOx),
ozone (O3), and others. Fig. 1.1 shows the distribution of major greenhouse gases in
atmosphere. Clearly, CO2 and CH4 are the two most abundant greenhouse gases.
CO2 from fossil fuel combustion
( 78.5 %)
NOx ( 5.4% )
CH4 ( 14.6% )
HFCs, PFCs, and SF6 ( 1.5% )
Source: Environment Canada (Quebec, 2004)
Fig. 1.1 Greenhouse gas distribution in Canada

2
Most of the CO2 emission is a result of fossil fuel combustion. In the United States,
for example, the combustion of fossil fuel for generating electricity contributed to
2.215×10⁹ tonnes of CO2 accounting for 40.5 % CO2 emissions in 1998 (DOE, 2000). It
was estimated that 60 % global CH4 emissions are related to human-related activities
(IPCC, 2001). In the United States, landfills are the largest human-related source of CH4
accounting for 34 % of all CH4 emissions, around 1.58×10⁸ tonnes of CO2 equivalents
(EPA, 2006). In Canada, 2.2×10⁷ tonnes of CO2 equivalent greenhouse gases from
landfills accounts for 3 % total greenhouse emissions (Environment Canada, 2004). With
increasing concerns about abrupt climate changes caused by global warming, the
reduction of greenhouse gas emission attracts great attention. As a result of increasing
interest in greenhouse gas mitigation, chemical processes to utilize greenhouse gas are
becoming important with great of interest.
Landfill is a big contributor of greenhouse emission. However, landfill gas is
composed of approximately 50 % of CH4 and 50 % of CO2, which makes it a perfect
feedstock for CO2 reforming of CH4. As indicated by Eq. 1.1, CO2 reforming of CH4
process is potentially the most effective way to utilize these two greenhouse gases
together to reduce greenhouse gas emission while to produce valuable synthesis gas. In
the following section, the technologies for synthesis gas production will be discussed.
kJ 2472H2COCOCH K0298224 =+↔+ ∆H (1.1)
1.1.2 Production of synthesis gas
Synthesis gas is a mixture of hydrogen (H2) and carbon monoxide (CO). It is one

3
of the most important industrial feedstocks from which a variety of chemicals can be
produced by varying the H2/CO ratio. The major processes of synthesis gas production are
presented in Table 1.1. Synthesis gas can be produced through four processes: 1) steam
reforming; 2) partial oxidation; 3) CO2 reforming, also called dry reforming; and 4)
autothermal reforming.
Table 1.1 Processes producing synthesis gas
Process Reaction Equation ∆Ho
298K
( kJ )
Steam reforming CH4 + H2O ↔ CO + 3H2 206
Partial oxidation CH4 + 0.5O2 ↔ CO + 2H2 -36
Dry reforming CH4 + CO2 ↔ 2CO + 2H2 247
Autothermal reforming CH4 + 2O2 ↔ CO2 + 2H2O
(Methane in excess)
CH4 + CO2 ↔ 2CO + 2H2
CH4 + H2O ↔ CO + 3H2
-802
247
206
Steam reforming is the well-developed and dominant technology for the
production of synthesis gas or hydrogen. It can be coupled with CO2 reforming of CH4 to
adjust the H2/CO ratio to meet feedstock requirement for downstream processes. As steam
reforming requires huge enegy supply, the exothermal partial oxidation appears to be a
good alternative as an exothermic process. However, the economics of partial oxidation is
restricted by the cost of pure oxygen supply. Currently, the steam reforming process is still
the least expensive process for synthesis gas and/or hydrogen production. Autothermal
reforming is a combination of non-catalytic partial oxidation and catalytic reforming. It
was developed to perform oxidation and reforming in a single reactor. However, undesired

4
reactions in the combustion zone lead to carbon deposition on the down stream tubes
causing serious problems of equipment damage, pressure drop, and poor heat transfer
(Pena et al., 1996). CO2 reforming of CH4 has attracted extensive attention since 1980s.
With a H2/CO ratio of 1, the synthesis gas produced by CO2 reforming of CH4 is a
desirable feedstock for Fischer-Tropsh synthesis (Gadalla and Bower, 1988) and the
synthesis of oxygenates (Burch and Petch, 1992; Alyea et al., 1993).
In addition, CO2 reforming of CH4 is considered to store solar energy or nuclear
energy (Chubb, 1980; Fraenkel et al., 1986; Levy et al., 1992) through a chemical energy
transmission system (CETS). The concept of CETS is shown in Fig. 1.2. The endothermic
reforming is carried out when energy such as solar energy or nuclear energy is available.
Then the products can be stored or transported to another location where energy is
required. Finally, exothermic reaction is carried out to release energy.
Fig. 1.2 The chemical energy transmission system (CETS)
Endothermic Reaction
CO2+CH4→2CO+2H2
Pipe line
Nuclear Energy
or Solar Energy Process Heat
Exothermic Reaction
2CO+2H2→CH4+CO2
or Combustion

5
From the above discussion, it can be seen that CO2 reforming of CH4 can be used
for reducing greenhouse gas emission through landfill gas conversion, providing
feedstock for F-T synthesis, or transferring energy through a CETS. It indicates that CO2
reforming of CH4 has great potential economic and environmental benefits. Following
sections will discuss the development of CO2 reforming of CH4 technology.
1.2 DEVELOPMENT OF CO2 REFORMING OF CH4
1.2.1 Overview
Fischer and Tropsch have reported on CO2 reforming of CH4 on various base
metals in 1928 (Fischer and Tropsch, 1928). Before the 1980s, research on CO2 reforming
of CH4 was focused on producing synthesis gas with suitable H2/CO ratios to synthesize
hydrocarbons and related products from materials other than petroleum (Reitmeier et al.,
1948). From the 1980s to 1990s, a significant amount of attention was paid to the CO2
reforming of CH4 - methanation cycle for the application of solar energy (Chubb 1980;
McCrary et al., 1982). However, the extensive investigation started from 1990s came up
with the increasing concerns about greenhouse effects and energy shortages. In the
following section, development of catalysts for CO2 reforming of CH4 is discussed and
the current commercial processes involving CO2 reforming of CH4 are introduced.
1.2.2 Development of reforming catalysts
It is well known that CO2 reforming of CH4 can be catalyzed by most of the
transition metals. Table 1.2 shows most of the catalyst systems that have been developed

6
since 1928. It has been shown that many metals such as Ni, Pt, Pd, Ru, Rh and Ir are
investigated extensively over different supports. However, there is a serious problem of
catalyst deactivation associated with CO2 reforming of CH4. Catalyst deactivation has
been well known since 1928 (Fischer and Tropsch, 1928) over different metals catalysts.
Carbon deposition, sintering, and/or metal oxidation could be the major causes of catalyst
deactivation (Slagtern et al., 1997). Different deactivation mechanism is associated with
different catalyst system. For example, Hu and Ruckenstein (2004) reported in a review
for CO2 reforming of CH4 that carbon formation rather than sintering is the main cause of
platinum-containing catalyst deactivation.
Table 1.2 Development of reforming catalysts Time Catalyst Reference 1928 Cu/Stuttgarter Masse,
Fe/Al2O3, Co/Al2O3, Ni/Al2O3, Ni/MgCO3
Fischer and Tropsch, 1928
Ni catalysts Clark et al., 1949; Bodrov et al., 1967 Cu/SiO2 Lewis et al., 1949
1928 to
1979 Ni/SiO2 Sodesawa et al., 1984 Ni/Al2O3 Chubb, 1980; McCrary et al., 1982; Rudnitskii et
al., 1984; Tokunaga et al., 1989 Pd/Al2O3 Sakai et al., 1984 Pd/SiO2,Pd/TiO2, Pd/Zeolites
Masai et al., 1988
Fe/Al2O3,Co/Al2O3, Ni/SiO2
Tokunaga et al., 1989
Ni/Al2O3-CaO-TiO2 Gadalla et al., 1989 Ni/Al2O3-MgO Gadalla et al., 1989
1980 to
1989
Ni/MgAl2O3 Gadalla and Bower, 1988; Gadalla et al., 1989

7
Time Catalyst Reference Ni/Al2O3 Osaki et al., 1994; 1995; Takayasu, 1993; Vernon et
al., 1992; Swaan et al., 1994, Zhang et al., 1994; 1995; 1996; Kim et al., 1994; Tang et al., 1995; Chen et al., 1994; Bhattacharyya et al., 1994; Ruckenstein et al., 1996; 1997; Hu et al., 1996; 1997; Ashcroft et al., 1991; Blom et al., 1994; Seshan et al., 1994; Takano et al., 1994; Chang et al., 1996; Horiuchi et al., 1996; Tang et al., 2000; Osaki et al., 2001; Seok et al., 2002; Tomishige et al., 2002; Hou et al., 2003; Huang et al., 2005
Ni/SiO2 Osaki et al., 1994; Takayasu, 1993; Bradford et al., 1996; 1997; 1998; Kim et al., 1994; Tang et al., 1995; Ruckenstein et al., 1996; 1997; Hu et al., 1996; 1997; Takano et al., 1996; Gronchi et al., 1996; Fei et al., 2004
Ni/Al2O3-CaO, Ni/Al2O3-CaO-MgO
Zhang et al., 1994; 1996; Horiuchi et al., 1996; Tang et al., 1995
Ni/Al2O3-CeO2 Chang et al., 1996 Ni/Al2O3-La2O3 Blom et al., 1994; Chang et al., 1996; Slagtern et al.,
1997 Ni/Al2O3-MgO Takayasu, 1993; Tang et al., 1995; Chang et al.,
1996; Tsyganok et al., 2001; Tsyganok et al., 2003; Roh et al., 2007
Ni/MgAl2O4 Rostrup-Nielsen and Hansen, 1993 Ni/Al2O3-SiO2 Swaan et al., 1994; Choudhary et al., 1995 Ni/α-Al2O3/Ce-SiO2 Roh et al., 2002 Ni/BaO Ruckenstein and Hu, 1995 Ni/CeO2-ZrO2, Ni-CeO Potdar et al., 2002; Kim et al., 2007 Ni/C Bradford and Vannice, 1996 Ni/CaO Choudhary et al., 1995; 1996; Zhang et al., 1994;
1995; 1996, Ruckenstein and Hu, 1995 Ni/MgO Osaki et al., 1994; 1996; Takayasu 1991; 1993;
Rostrup-Nielsen, 1993; Swaan et al., 1994; Bradford and Vannice,1996; Ruckenstein et al., 1995; 1996; 1997; Hu et al., 1996; 1997; Kroll et al., 1996; Chen et al., 1999
Ni/MgO-CaO Yamazaki et al., 1992 Ni/MgO-SiO2 Takayasu et al., 1993, Takano et al., 1994 Ni/MgO-SiO2-Al2O3 Choudhary et al., 1995 Ni/MgO-Re2O3-Al2O3 Wang et al., 1995 Ni/La2O3 Zhang et al., 1995; 1996; 1996; Gronchi et al., 1996;
Blom et al., 1994
1990 to
2007
Ni/TiO2 Osaki et al., 1994; 1996; 1997; Bradford and Vannice, 1996; Takanabe et al., 2005
Table 1.2 Contined

8
Time Catalyst Reference Ru/Al2O3 Vernon et al., 1992; Richardson et al., 1990,
Ashcroft et al., 1991; Solymosi et al., 1991; Claridge et al., 1994
Ru/CeO2, Ru/La2O3, Ru/TiO2, Ru/ZrO2
Basini et al., 1995; Menad et al., 2003
Ru/MgO Rostrup-Nielsen et al., 1993; Qin et al., 1994; Takayasu et al., 1991; Basini et al., 1995; Qin et al., 1996; Schuurman et al., 2000
Rh/ Al2O3 Erdohelyi et al., 1993; Vernon et al., 1992; Richardson et al., 1990; Tsipopuriari et al., 1994; Kroll et al., 1996; Bhat et al., 1997; Ashcroft et al., 1991; Solymosi et al., 1991; Basini et al., 1995; Claridge et al., 1994, Nakamura et al., 1994, Walter et al., 1994; Zhang et al., 1996; Efstathiou et al., 1996; Mark et al., 1994; Ferreira-Aparicio et al., 2000
Rh/ Al2O3-SiO2 Walter et al., 1994 Rh/MgO Basini et al., 1995; Zhang et al., 1996 Rh/TiO2 Bhat et al., 1997; Erdohelyi et al., 1993; Rasko and
Solymosi, 1997; Tsipopuriari et al., 1994; Nakamura et al., 1994; Zhang et al., 1996
Rh/TiO2-SiO2 Erdohelyi et al., 1993; Basini et al., 1995; Tsipopuriari et al., 1994; Mark et al., 1996; Nakamura et al., 1994; Zhang et al., 1996
Pd/A2O3 Erdohelyi et al., 1994; Vernon et al., 1992; Swaan et al., 1994; Ashcroft et al., 1991; Solymosi et al., 1991; Mark et al., 1996; Gustafson et al., 1991
Pd/MgO Rostrup-Nielsen et al., 1993; Erdohelyi et al., 1994; Qin et al., 1994;1996; Takayasu et al., 1991
Pd/ TiO2, Pd/SiO2 Erdohelyi et al., 1994 Ir/Al2O3 Takayasu et al., 1993; Takano et al., 1994 Ir/MgO Choudhary et al., 1995; Qin et al., 1994; 1996;
Basini et al., 1995 Ir/SiO2 Erdohelyi et al., 1997 Ir/TiO2 Erdohelyi et al., 1997; Basini et al., 1995 Pt/Al2O3 Ross et al., 1996; Vernon et al., 1992; Seshan et al.,
1994; Chang et al., 1996; Solymosi et al., 1991; Mark et al., 1996; Efstathiou et al., 1996; Gustafson et al., 1991; Bitter etal.,1996; 1997; Nagaoka et al., 2000; Zhang et al., 2003
Pt/MgO Rostrup-Nielsen et al., 1993; Qin et al., 1994;1996 Pt/SiO2 Bradford et al., 1998 Pt/TiO2 Ross et al., 1996; Bradford et al., 1998 Pt/ZrO2 Nagaoka et al., 2000; Noronha et al., 2003
Pt/ZrO2-Al2O3 Souza et al., 2001
Table 1.2 Contined

9
From Table 1.2, one also can see that a variety of supports or support combinations
have been investigated since the nature of supports has significant effects on the
performances and properties of catalysts. Supports have many functions but the most
important is to maintain a stable physical surface, especially at high reaction temperatures.
Therefore, the support itself must resist to thermal transformation at high temperatures,
which means catalyst support must have high melting points. The melting points of
catalyst supports that are most often studied in CO2 reforming of CH4 are tabulated in
Table 1.3 (Richardson, 1989).
Table 1.3 Melting point of catalyst support materials Support Melting point
( oC )
Al2O3 2318
SiO2 1973
MgO 3073
CaO 2853
TiO2 2113
ZrO2 2988
CeO2 2873
La2O3 2588
Al2O3 and SiO2 are two of the most often investigated catalyst supports with high
specific surface area. MgO and CaO are studied due to their high melting points which
favor stable catalyst surfaces at high reaction temperatures. Also, their basicity is believed
to suppress carbon formation by promoting the activation of CO2 (Zhang et al., 1994;
Horiuchi et al., 1996; Yamazaki et al., 1992). TiO2 and ZrO2 are reducible metal oxides on

10
which metals are electron-rich and always show strong metal-support interaction (SMSI).
SMSI is believed to be critical to resisting carbon formation. The oxides of rare-earth
elements such as CeO2 and La2O3 are investigated due to their ability to release and
uptake oxygen (Eq. 1.2 and Eq. 1.3). When used as supports, these kinds of oxygen-ion
conducting oxides are known to enhance catalytic performance resulting from the metal-
support interactions (Metclfe and Sundaresan, 1988; Cho, 1991).
20O2xCeOCeO 2x22 <<+↔ − x (1.2)
2x3232 O2xOLaOLa +↔ − (1.3)
Even though same active metals and supports are selected to make a catalyst, the
performances of catalysts may be very different since catalyst performances are easily
affected by a variety of other factors other than composition, such as preparation methods,
thermal treatments, activation procedures, content of active components, precursors of
active components, etc. This maybe the reason why some catalyst systems such as
Ni/Al2O3 and Ni/MgO have been studied frequently by different research groups resulting
in very different results and conclusions.
As discussed above, a lot of investigations have been conducted to develop
catalysts for CO2 reforming of CH4. However, severe deactivation is still the major barrier
preventing CO2 reforming of CH4 technology from large-scale industrial application.
Currently, CALCOR and SPARG processes are the two commercial processes involving
CO2 reforming of CH4. In the following sections, CALCOR and SPARG processes are
briefly introduced.

11
1.2.3 CALCOR process
The CALCOR process (Teuner et al., 2001) was designed to produce high purity
CO on-site to overcome problems involved in toxic CO transportation. A simplified flow
sheet for CALCOR standard process, generalized from the work of Teunner et al. (2001)
is shown in Fig. 1.3.
Fig. 1.3 Schematic of the CALCOR standard process (Teuner et al., 2001)
The CALCOR standard process is a catalytic reforming process of CH4 or liquefied
petroleum gas (LPG) at high temperature and low pressure. The feed has to be
hydrodesulphurized before it is mixed with CO2. When passing the reformer tubes, which
are charged with reforming catalysts, the feed mixture is converted into synthesis gas
consisting of CO, H2, CO2, H2O and trace CH4. Then the CO2 is removed and recovered
after the synthesis gas is cooled to ambient temperature. Finally, CO purification is
conducted to remove H2, CH4, and traces of CO2. The recovered CO2 is recycled to the
reforming process and the tail gas from the purification unit is burned as fuel.
Feed CH4 Hydrogen for feed make-up
CO product
Syngas
Purification
Catalyst
Reformer
Absorber
Stripper
CO2 Syngas
Feed make-up

12
1.2.4 SPARG process
The SPARG process, sulphur-passivated reforming (Udengaard et al., 1992), was
designed to provide a synthesis makeup gas with a relatively low H2/CO ratio for the
synthesis of acetic acid, dimethyl ether and oxo-alcohols. It was commercialized in
Sterling’s Texas City Plant in 1987. A simplified flow sheet of SPARG process
generalized from the work of Udengaard et al. (1992) is shown in Fig. 1.4.
Fig. 1.4 Schematic of the SPARG process (Udengaard et al., 1992)
In the SPARG process, the natural gas is desulphurized and then mixed with steam
to undergo pre-reforming. Until the prereformer was installed, Sterling had to interrupt
operation every 2-3 months to remove carbon. In the tubular reformer, reforming catalyst
is passivated by adding sulphur to the feed to block carbon formation sites. That is, bigger
nickel sites favouring carbon formation are poisoned by sulphur while a fraction of
smaller nickel sites sufficient for the reforming reaction remains intact. A molar ratio of
Steam
Natural Gas
Desulfurization Prereforming Reforming CO2 wash
CO2 CO2
Syngas

13
H2/CO =1.8 was achieved at Sterling by controlling the molar H2/hydrocarbon C ratio =
0.9 and the molar CO2/hydrocarbon C ratio = 0.54.
1.3 SUMMARY OF CO2 REFORMING OF CH4 TECHNOLOGY
CO2 reforming of CH4 has attracted great attention due to both environment and
energy concerns. The major problem of CO2 reforming of CH4 has been long known as
the catalyst deactivation, which could be caused by carbon formation, sintering, and/or
metal oxidation. The carbon formation problem can be reduced by adding steam as
described in the SPARG process. The commercial application of CO2 reforming of CH4 is
achieved in the CALCOR process and the SPARG process. However, a more interesting
and challenging way is to develop a catalyst to overcome deactivation. The catalysts
suffer severe deactivation as described above (section 1.2.1), primarily, as a result of
carbon formation. The sintering problem shall be able to overcome through providing
stable support surface for active components at high temperatures. Significant research
work has been focused on finding an ideal catalyst support, which is stable at high
temperature while maintaining a high surface area for catalysis. As for metal oxidation it
has been reported that the formation of alloy can retard the process of oxidation during
reaction. All of the efforts in overcoming carbon formation, sintering, and/or metal
oxidation can be deemed to solve the catalyst deactivation problem associated with CO2
reforming of CH4.

14
1.4 RESEARCH OBJECTIVES AND SCOPE
Considering the major problems associated with CO2 reforming of CH4, the
primary objective of this research is to develop a catalyst with long-term stability without
severe deactivation and with the promise of industrialization.
The nickel-based non-precious metal catalysts are determined as the research
objects with the consideration of catalyst cost and metal availability. Research and
development of the catalysts for CO2 reforming of CH4 in this research includes: 1)
catalyst design following Dowden’s procedure (Dowden et al., 1968); 2) catalyst
screening to find best catalyst composition for CO2 reforming of CH4; 3) catalyst
characterization using different techniques to understand the surface properties, bulk
properties, and electronic properties of the developed catalysts; 4) investigation on
catalyst composition and pre-treatment procedures to find the best catalyst formulation
that can meet the primary objective of the research; 5) kinetics study and mechanisms
discussion.
1.5 ORGANIZATION OF THE THESIS
1 Introduction introduces some background and the development of CO2
reforming of CH4 technology. The necessity and significance of CO2 reforming of CH4 is
discussed. The research and development status of this technology is presented.
2 Catalyst design and preparation method focuses on the catalyst design and
preparation method. The reaction network of reactions involved in CO2 reforming of CH4

15
system and the stoichiometrically independent reactions that are required to depict the
whole reaction network are analysed. Equilibrium compositions as a function of
temperature, pressure, CO2/CH4 ratio, and inert gases are discussed. Also, carbon
formation is analysed from a thermodynamic point of view. The catalyst formula is
proposed based on desirable catalytic properties for the reaction. The catalyst preparation
method is determined. Catalyst testing and products analysis are also introduced.
3 Development of long-term stable nickel catalysts for CO2 reforming of CH4
presents the catalyst development and screening which includes catalytic material
determination and catalyst preliminary screening resulting in the research object of Ni-
Co/AlMgOx system. Long-term stability testing and carbon formation behaviour are
investigated over the Ni-Co/AlMgOx. Also, catalyst characterization is conducted, which
includes elemental composition determination, carbon formation analysis, reducibility test,
and characterization of elemental oxidation states.
4 Effects of Ni and Co content on the Ni-Co/AlMgOx bimetallic catalysts for
CO2 reforming of CH4 focuses on the Ni-Co content of Ni-Co/AlMgOx catalysts. The
investigation on the effects of Ni-Co content on catalyst properties and performance are
conducted with an attempt to avoid carbon formation. Catalysts with various Ni-Co
contents are comparatively investigated. The relationship between catalyst performance
and catalyst properties is discussed. The major cause of carbon formation on Ni-Co
bimetallic catalyst is identified. Finally, carbon free operation for CO2 reforming of CH4
over a Ni-Co/AlMgOx is achieved.

16
5 Effects of calcination temperatures on the Ni-Co/AlMgOx bimetallic
catalysts for CO2 reforming of CH4 is based on the effects of calcination temperature on
the catalyst properties and performance. The evolution behavior of catalyst structure
during calcinations is presented.
6 Kinetic studies of CO2 reforming of CH4 over Ni-Co/AlMgOx Catalyst is the
systematic experimental and kinetic study of CO2 reforming of CH4 using a
0.04Ni0.05Co/AlMgOx catalyst. The kinetic behaviour of the 0.04Ni0.05Co /AlMgOx
catalyst in the reforming reaction is investigated as a function of temperature and partial
pressures of CO2 and CH4 in a temperature range 923-1023 K. The mechanism of the CO2
reforming reaction has been discussed based on experimental observation considering
literature. Rate limiting steps are identified. Both Power-Low model and Langmuir-
Hinshelwood (L-H) model are developed and discussed.
7 Conclusions and recommendations is a summary for major conclusions of the
research work. Future works are recommended.

17
2 CATALYST DESIGN AND PREPARATION
This chapter presents the catalyst design and preparation. The catalyst design
described in this chapter follows the Dowden’s strategy of catalyst design (Dowden et al.
1968), which starts from the stoichiometric analysis of the network of reaction, through
thermodynamic analysis, reaction mechanism hypothesis, desirable catalytic property
defining, and ends with catalyst composition requirement. Catalyst preparation
methodology is also discussed. Preliminary experimental results are used to validate the
calculation of equilibrium compositions.
2.1 CATALYST DESIGN
2.1.1 Defining objectives for catalyst design
In this research, new catalysts are proposed following the procedures of Dowden’s
strategy of catalyst design (Dowden et al., 1968) whose major procedures, as shown in
Fig. 2.1, include stoichiometric analysis, thermodynamic analysis, proposed mechanism,
necessary catalyst properties, catalytic material screening, and proposed catalysts and
their compositions. The major objectives of the catalyst design are 1) the identification of
desired properties of catalysts for CO2 reforming of CH4; 2) the desired catalyst
compositions; and 3) the selection of catalytic materials. The following sections start with
the stoichiometric analysis of the network of reaction involved in CO2 reforming of CH4.

18
Fig.2.1 Steps in the catalyst design (Dowden et al., 1968)
2.1.2 Target reaction
The target reaction in this research is shown by Eq. 2.1. In this reaction CH4 is
reformed with CO2 to produce CO and H2, which is called synthesis gas.
2H2COCHCO 242 +↔+ (2.1)
The reaction is highly endothermic. At a temperature lower than 916 K, the
reaction Gibbs free energy change is positive, i.e. kJ 0o916KT r, ><∆G . From the
thermodynamic perspective, CO2 reforming of CH4 is not likely to occur spontaneously at
a temperature lower than 916 K. Therefore, temperatures higher than 916 K should be
employed. However, the chance of side reactions increases at higher temperatures.
Therefore, first of all, a system of reactions was developed stoichiometrically at 1023 K.
A: 0.18Ni0.16Co
Stoichiometric analysis
Thermodynamic analysis
Proposed mechanism
Necessary catalyst properties
Catalytic materials
Proposed catalyst
Target reaction

19
1023 K is the reaction temperature commonly found for CO2 reforming of CH4 in
literature (Bradford and Vannice, 1999). Then, the reactions that are not likely to occur
spontaneously are eliminated using simple thermodynamic principle, i.e. reactions with
positive Gibbs free energy change are ruled out.
2.1.3 Stoichiometric analysis
Stoichiometrically possible reactions are listed as: 1) primary reactant reactions, 2)
reactant self-interactions, 3) reactant cross-interactions, 4) reactant-product reactions, and
5) product-product reactions (Richardson 1989). However, only the reactions involving
chemically stable compounds at 1023 K are considered to be physically realistic. The
Gibbs free energy change 01023K r,∆G of reaction can be calculated using the third law
method (Kyle, 1999). Detailed procedures are introduced in Appendix D.
2.1.3.1 Primary reactant reaction
CO2 and CH4 are the primary reactants involved in CO2 reforming of CH4. The
primary reactant reactions as shown in Table 2.1 are hereby defined as the ones involving
only one primary reactant molecule. One can see that the CH4 decomposition is the only
primary reactant reaction in CO2 reforming of CH4. CH4 decomposition is
thermodynamically favourable while a single CO2 molecule does not react at 1023 K.
Table 2.1 Primary reactant reaction
Reaction 0
1023K r,∆G ( kJ )
Single CO2 does not react at 1023 K
CH4 ↔ C + 2H2
Not appliable
-22

20
2.1.3.2 Reactant self-interaction reactions
The reactant self-interaction reactions are those involving two molecules of the
same reactant. As presented in Table 2.2, C2 hydrocarbons can be produced through the
interaction of CH4 molecules, while there is no reaction between two CO2 molecules. At
1023 K the Gibbs free energy changes of the CH4 self-interaction reactions are all greater
than zero. From the thermodynamic perspective, these reactions are not favourable at
1023 K. Therefore, at this temperature their existence in CO2 reforming of CH4 reaction
system can be neglected.
Table 2.2 Reactant self-interaction reactions
Reaction 0
1023K r,∆G ( kJ )
No reaction between two CO2 at 1023K
2CH4 ↔ C2H6 + H2
2CH4 ↔ C2H4 + 2H2
2CH4 ↔ C2H2 + 3H2
Not applicable
71
77
126
2.1.3.3 Reactant cross-interaction reactions
The reactions between different reactant molecules are defined as reactant cross-
interaction reactions which include the target reaction (Eq. 2.1) and other parallel cross-
interaction reactions as listed in Table 2.3. They are thermodynamically favourable.
Table 2.3 Reactant self interaction reactions
Reaction o
Kr, ∆G 1023 ( kJ )
CH4 + CO2 ↔ 2CO + 2H2
CH4 + 2CO2 ↔ 3CO + H2O + H2
CH4 + 3CO2 ↔ 4CO + 2H2O
-31
-31
-27

21
2.1.3.4 Reactant-product reactions
One type of side reactions are those taking place between the reactant and the
product molecules as reported in Table 2.4. Reverse water-gas shift reaction (RWSR) is
the major side reaction in CO2 reforming of CH4 (Bradford et al., 1999). This side reaction
consumes H2 and produces side product H2O. Therefore, the RWSR is kept for further
investigation even though its Gibbs free energy of reaction is positive as shown in Table
2.4. The side product of H2O can also react with CH4 leading to steam reforming. The side
reaction between CO2 and C deposit may serve as the carbon removal reaction.
Table 2.4 Reactant-product reactions
Reaction 0
1023Kr, ∆G ( kJ )
CH4 +2H2O↔ CO2 + 4H2 CH4 + H2O ↔ CO + 3H2 CO2 + C ↔ 2CO CO2 + H2 ↔ CO + H2O CO2 + 2H2 ↔ C + 2H2O CO2 + 4H2 ↔ CH4 + 2H2O
-35 -33 -9 2 13 35
2.1.3.5 Product-product reactions
Side reactions can also occur between product molecules as presented in Table 2.5.
From the thermodynamic point of view, the reaction between H2O and C deposit is likely
to occur while other reactions between CO and H2 are not favourable at 1023 K.
Table 2.5 Product-product reactions
Reactions 0
1023Kr, ∆G ( kJ )
H2O + C ↔ H2 + CO CO + H2 ↔ HCHO CO + 2H2 ↔ CH3OH nCO + mH2 ↔ CnH2(m-n) + nH2O
-11 122 150 >0

22
2.1.3.6 Network of reaction
From above discussion, in addition to the target reaction (Eq. 2.1), the possible
side reactions that are thermodynamically favourable at 1023 K are steam reforming of
CH4 and RWSR (Table 2.4), CH4 decomposition (Table 2.1), reactant cross reactions
(Table 2.3), and carbon removal reactions (Table 2.4 and 2.5). They are listed as follows:
2K
42 2H2COCHCO 1 +→←+ (2.1)
OHCOHCO 2K
222 +→←+ (2.2)
2K
42 H3COCHOH 3 +→←+ (2.3)
2K
4 2HCCH 4 +→← (2.4)
2COCOC 5K2 →←+ (2.5)
2K
2 HCOOHC 6 +→←+ (2.6)
22K
24 HOH3CO2COCH 7 ++→←+ (2.7)
OH24CO3COCH 2K
248 +→←+ (2.8)
To simplify discussion, independent reactions which are sufficient to describe the
reaction system have been determined. The number of independent reactions was
determined by obtaining the rank of the stoichiometric coefficient matrix (Fogler, 1986).
The stoichiometric coefficient matrix is expressed by Eq. 2.9 where the coefficients of
reactants are taken with a negative sign and those of products are taken with a positive
sign. Reducing the matrix, Eq. 2.10 can be derived from Eq. 2.9.
The rank of the matrix indicated by Eq. 2.10 is 3, and correspondingly any three
independent equations can be selected to describe the reaction system sufficiently. For

23
example, Eq. 2.1, Eq. 2.2, and Eq. 2.4 as one set of independent reactions can be chosen.
It is also noted that there is one reaction out of any three independent reactions involves
carbon formation or removal.
0 2 0 431Eq.2.8 0 1 1 321Eq.2.7 111 10 0 Eq.2.6 10 0 210 Eq.2.51 0 2 00 1Eq.2.40 13 10 1Eq.2.30 1 1110 Eq.2.20 0 2 211Eq.2.1C OHHCOCOCH 2224
−−−−
−−−−
−−−
−−−−
(2.9)
000 00 0 Eq.2.8 000 00 0 Eq.2.7 000 00 0 Eq.2.6 000 00 0 Eq.2.5102 00 1Eq.2.4000 00 0 Eq.2.3011110 Eq.2.2002 211Eq.2.1COHHCOCOCH 2224
−
−−−−
(2.10)

24
2.1.4 Thermodynamic analysis
2.1.4.1 Equilibrium constant
For homogeneous gas-phase reactions at low to moderate pressures, the
equilibrium constant can be written as (Kyle, 1999):
∏
= ∧
j
oj
j
v
f
PyK (2.11)
where P is overall pressure and yj is vapour molar fraction of species j. ∧
ojf is the standard
fugacity of species j, which is 1 atm at standard state (Kyle, 1999). The condition of
equilibrium for a chemical reaction at temperature T is:
∆Go = -RT ln K (2.12)
where R is the gas law constant and ∆Go is the standard Gibbs free energy change
representing the conversion of reactants in their standard states to products in their
standard states. The ∆Go is a function only of temperature and can be calculated by the
third law method (Kyle, 1999) at different temperatures (see Appendix-D for detailed
procedures). Then, reaction equilibrium constant can be calculated from Eq. 2.13:
RT-∆ o
eKG
= (2.13)
The variation of the reaction equilibrium constant for the reactions of Eq. 2.1-2.6 with
various temperatures is shown in Fig. 2.2. Eq. 2.7 and 2.8 are basically combinations of
Eq.2.1 and 2.2 so that thery not considered.

25
0
10
20
30
40
50
773 873 973 1073 1173
Temperature ( K )
KCH4 decomposition
RWGS
CO2-CH4
reforming
H2O-CH4
reforming
CO disproportionation
RCG
Fig.2.2 Variation of reaction equilibrium constants K with temperatures
CO2-CH4 reforming: CO2 reforming of CH4 (Eq. 2.1); H2O-CH4 reforming: steam reforming of CH4 (Eq. 2.2); RWSR: reverse water-gas shift reaction (Eq. 2.3); CH4 decomposition (Eq. 2.4); CO disproportionation (the reverse reaction of Eq. 2.5); RCG: reverse carbon gasification (the reverse reaction of Eq. 2.6).
Firstly, for the strong endothermic reforming reactions, Eq. 2.1 ( o298K∆H = 247 kJ),
Eq. 2.2 ( o298K∆H = 206 kJ), and CH4 decomposition (Eq. 2.4, o
298K∆H =75 kJ), the
equilibrium constant increases dramatically with the increase in temperatures and hence
higher temperatures favor higher equilibrium conversions. Secondly, RWSR reaction (Eq.
2.3, o298K∆H = 41 kJ) is a moderately endothermic reaction. Its equilibrium constant
increases slowly with the temperature increase. Lastly, CO disproportionation (the reverse
reaction of Eq. 2.5, o298K∆H = -172 kJ) and the reverse carbon gasfication reaction (RCG,

26
the reverse reaction of Eq. 2.6, o298K∆H = -131kJ) are highly exothermic reactions. Their
equilibrium constants decrease dramatically with the increase in temperatures and
conversions are suppressed at higher temperatures. Hence carbon formation from these
two reactions is unfavorable at higher reaction temperatures.
2.1.4.2 Equilibrium composition as a function of temperature
The variation of equilibrium composition with temperatures can be determined by
solving a group of nonlinear equations relating the moles of each component to the
equilibrium constant of independent reactions according to Eq. 2.11. In this thesis, the
equilibrium composition as a function of reaction temperature is calculated based on two
independent reactions without considering the third one involving carbon formation. The
reaction involving carbon formation is not considered due to the very small magnitude
(6.3×10⁻⁴ %) of carbon formation in comparison with the total carbon element involving
CO2 reforming of CH4 (Zhang et al., 2007). Fig. 2.3 shows the effects of reaction
temperature on the equilibrium composition at 1 atm and initial CH4/CO2/N2 ratio of 1/1/0.
0
10
20
30
40
50
773 873 973 1073 1173 1273Temperature ( K )
Com
posi
tion
(%)
H2CO
CO2CH4
H2O
Fig. 2.3 Variation of equilibrium composition with temperatures

27
From Fig. 2.3, it can be seen that the proportions of H2 and CO increase while the
fractions of H2O, CH4, and CO2 decrease with the increase in temperatures. The effects of
temperatures on the equilibrium composition can be ascribed to that at higher
temperatures the contribution of RWSR becomes less due to its moderately endothermic
property in comparison with the strong endothermic property of CO2 reforming of CH4
(Eq. 2.1) and CH4 decomposition (Eq. 2.4). As a result of the temperature influence on
RWSR, the molar ratio of H2 to CO becomes closer to unity at higher temperatures (Fig.
2.3) since less fraction of H2 is converted to H2O through the RWSR. Therefore, it is
preferable to apply a higher temperature, such as 1023 K, to reduce the reactant
concentration and, as a result, to increase the CO and H2 concentrations in the product
stream. As discussed above, the effect of side reaction, RWSR, is relatively insignificant
at higher reaction temperatures.
2.1.4.3 Equilibrium composition as a function of total pressure
Fig. 2.4 shows the effects of total pressure on the equilibrium composition.
0
10
20
30
40
50
0 1 2 3 4 5 6 7 8 9 10Total Pressure (atm)
Com
posi
tion
( % ) CO
H2
CO2CH4
H2O
Fig.2.4 Effects of total pressure on equilibrium composition at 1023 K and initial CO2/CH4/N2 ratio of 1/1/0

28
One can see that the reactant concentrations increase with the increase in total
pressure while the product concentrations drop. As a reaction with increase in volume, the
equilibrium of CO2 reforming of CH4 (Eq. 2.1) shifts to the left-hand side at higher total
pressures while the equilibrium of RWSR (Eq. 2.2) as a volume constant reaction is not
affected by the total pressure changes.
Using the equilibrium composition data, the CH4 conversion and H2 selectivity can
be calculated and the detailed calculation procedures are described in Appendix E. Fig. 2.5
shows the CH4 conversion as a function of reaction temperatures and pressures at initial
CH4/CO2/N2 ratio of 1/1/0. Fig. 2.6 shows the variation of H2 selectivity with reaction
temperatures and pressures at initial CH4/CO2/N2 ratio of 1/1/0. The observations from the
two figures are the same: conversion and selectivity increase with temperature increases
while droping with the increase in pressures.
0
20
40
60
80
100
700 800 900 1000 1100 1200
Temperature ( K )
CH
4 cov
ersi
on (
% ) P, atm =0.5
1
2
5
10
Fig. 2.5 Effects of temperatures and pressures on CH4 conversion

29
50
60
70
80
90
100
700 800 900 1000 1100 1200
Temperature ( K )
H2 s
elec
tivity
( %
) P, atm=0.5
1
2
5
10
Fig.2.6 Effects of temperatures and pressures on H2 selectivity
2.1.4.4 Equilibrium composition as a function of initial CO2/CH4 molar ratio
The equilibrium composition as a function of initial CO2/CH4 molar ratio is shown in
Fig. 2.7. It is seen that the composition of CH4 decreases quickly due to the increase in
CH4 reaction with CO2. At the initial CO2 to CH4 ratio of 3, most of CH4 is reacted. At
around CO2 to CH4 ratio of 1, H2 reaches its maximum. When CO2 to CH4 ratio is higher
than 1, more product H2 reacts with CO2 through RWSR, resulting in the decrease in H2
and the increase in both CO and H2O. After H2O reaches its maximum level, reactions
tend to stop due to the depletion of CH4. The product concentrations drop gradually due to
the dilution effect of CO2.

30
0
20
40
60
80
0 5 10 15 20Initial molar ratio of CO2/CH4 (mol/mol)
Com
posi
tion
(%)
H2CH4
CO2
CO
H2O
Fig.2.7 Effects of initial CO2/CH4 on equilibrium composition at 1023 K and 1 atm
2.1.4.5 Effects of inert N2
In most of the experiments of this research, inert N2 was employed as the internal
standard for GC analysis. The effects of N2 on conversion and selectivity at 1 atm, various
temeratures, and initial CH4/CO2 ratio of 1/1 were calculated and the results are shown in
Fig. 2.8. It can be seen that the existence of N2 can enhance both CH4 conversion and H2
selectivity at various temperatures, the higher the N2 concentration, the higher the degree
of enhancement on CH4 conversion and H2 selectivity.
0
20
40
60
80
100
700 800 900 1000 1100 1200
Temperature ( K )
CH
4 cov
ersi
on (
% )
N2/CH4=5
10
50
60
70
80
90
100
700 800 900 1000 1100 1200
Temperature ( K )
H2 s
elec
tivity
( %
) N2/CH4=5
10
Fig.2.8 Effects of inert N2 gas on CH4 conversion and H2 selectivity

31
2.1.4.6 Carbon formation
In this section, carbon formation is discussed using a thermodynamic analysis
method that Ginsberg et al. (2005) used. The reactions involving carbon formation are
those represented by Eq. 2.4, 2.5, and 2.6. According to Eq. 2.11, the equilibrium
constants of these three reactions can be expressed by Eq. 2.14-2.16:
2K
4 2HCCH 4 +→←
= ∧∧
oCH
eCH
2
oH
eH
4
4
4
2
2
f
p
f
pK (2.14)
2COCOC 5K2 →←+
= ∧∧
oCO
eCO
2
oCO
eCO
5
2
2
f
p
f
pK (2.15)
2K
2 HCOOHC 6 +→←+
= ∧∧∧
oOH
eOH
oH
eH
oCO
eCO
6
2
2
2
2
f
p
f
p
f
pK (2.16)
where, superscript e is used to indicate the partial pressure at equilibrium state. ∧
ojf is the
standard fugacity of species j. At any state including equilibrium state, three parameters α,
β, and γ are also defined accordingly as shown by Eq. 2.17-2.19:
= ∧∧
oCH
CH
2
oH
H
4
4
2
2
f
p
f
pα (2.17)
= ∧∧
oCO
CO
2
oCO
CO
2
2
f
p
f
pβ (2.18)

32
= ∧∧∧
oOH
OH
oH
H
oCO
CO
2
2
2
2
f
p
f
p
f
pγ (2.19)
When the system is at equilibrium conditions, we have:
654 and K γ, K, βKα === (2.20)
If α < K4, β > K5, and γ >K6, all the reactions move toward the direction of carbon
formation. Carbon formation is favourable. However, if α > K4, β < K5, and γ < K6,
carbon formation is not thermodynamically favourable. At a certain initial CO2/CH4/N2
ratio and 1 atm, trial and error method can be used to solve a group of non-linear
equations to find a certain border temperature above which carbon formation is not
thermodynamically favourable, i.e. α > K4, β < K5, and γ < K6. As shown in Fig. 2.9,
carbon formation zone and carbon free zone are obtained. The presence of inert gas, N2,
can slightly affect the border between carbon formation zone and carbon free zone.
However, at the ideal feed ratio of CO2/CH4=1/1, carbon formation is seen inevitable from
Fig. 2.9. The increase of CO2 in feed may inhibit carbon formation. However, it is not
practical to use excess CO2 to inhibit carbon formation from an industrial point of view
due to the high cost of product separation. Therefore, at the industrially practical
conditions, i.e. CO2/CH4 = 1/1 and 923 K < T < 1323 K, the only way to suppress carbon
formation is to seek carbon resistant catalysts on which the extent of carbon formation
does not cause catalyst deactivation.

33
Fig. 2.9 Effects of CO2/CH4 ratio and inert gas N2 on limiting temperatures below which carbon formation occurs at 1 atm
2.1.5 Proposed mechanism
The dissociation of CH4 is believed as one of the initial steps for the methane
reforming reaction (Hickman and Schmidt, 1993). Two H2 molecules and one CO
molecule are formed via H and CHx (x = 0-3) species originated from the dissociation of
CH4. The presence of CHx species on the surface of catalysts have been confirmed
through pulsing experiments (Osaki et al., 2001; Yan et al., 2003) and transient isotopic
studies (Bradford and Vannice, 1996; Aparicio et al., 1997). It is reported that reversible
adsorption of CH4 on the surface of catalyst leads to cracking of CH4 and the cracking is a
rate determining step (RDS) while CH4 adsorption is at equilibrium (Schuurman et al.,
1998; Tsipouriari and Verykios, 1999; 2001):
900
1000
1100
1200
1300
1400
0 10 20 30 40 CO2/CH4 ratio ( mol/mol )
Tem
pera
ture
( K
)N2/CH4=0
N2/CH4=1
N2/CH4=5
Carbon Formation Zone
Carbon Free Zone

34
MCHMCH 44 −↔+ Equilibrium (2.21)
24 2HMCMCH +−→− RDS (2.22)
where M is the active sites on metals.
The participation of CO2 molecules can be through its dissociative chemisorption.
Infrared spectroscopy has indicated that CO2 can dissociate to carbon monoxide and
adsorbed O (Bitter et al., 1997; 1998). The carbon monoxide formed is released to the gas
phase immediately (Solymosi, 1991).
SOS-CO2SCO2 −+↔+ (2.23)
where S is the active sites on support.
Rostrup-Nielsen and Hansen (1993) and Kim et al. (1994) assumed the
dissociative chemisorption of CO2 as limiting step. However, Hei et al. (1998) reported
that both dissociation of CH4 and CO2 may be rate-limiting steps based on the same
magnitude of the activation barrier of them. Kroll et al. (1996) suggested that the
oxidation step, as represented by Eq. 2.24, should be rate-limiting step due to the lack of
kinetic isotopic effect for the formation of CO during the CO2 reforming of CH4:
SMCOSOMC ++→−+− (2.24)
where, C-M originated from the dissociation of CH4 and O-S from the dissociation of CO2.
The participation of CO2 may also be through directly reacting with the C-M species in
the form of intact activated molecule (Eq. 2.25) (Erdohelyi et al., 1991; Mark et al., 1994;
1996; Schuurman et al., 1998).
M2COMCCO2 +→−+ (2.25)

35
Based on above discussion, a surface reaction mechanism is proposed for defining
the necessary properties of catalysts for CO2 reforming of CH4. As shown in Fig. 2.10, the
dissociative chemisorption of CH4 occurs on the metallic centers as the metallic state of
catalysts is believed to be responsible for the CH4 activation (Yan et al., 2003). The
absorption of CO2 is supposed to take place on the surface of support since the carbon in
CO2 molecule as a Lewis acid centre tends to react with Lewis base centre of an oxide.
The reaction between M-C species and activated S-CO2 is assumed as the rate
determining step based on the following logic and fact: 1) if the dissociation of CH4 is
RDS, carbon accumulation is unlikely to occur; and 2) carbon accumulation has been a
well-known challenge for CO2 reforming of CH4, which means carbon species formation
rate is higher than carbon species removal rate.
Fig. 2.10 Proposed surface mechanism for CO2 reforming of CH4
2.1.6 Desired catalyst properties
An ideal catalyst has high activity, good selectivity, and excellent stability.
Activity is the term used to describe qualitatively how effective a given catalyst is in
carrying out a specified reaction (Cornils et al., 2003). For CO2 reforming of CH4, based
CH4
C
H2
+ CO2
CO2
CO + CO Support
Metal particle
M M M S S

36
on the proposed mechanism, catalysts should facilitate the rate determining step (Eq. 2.24)
to improve the reaction rate. Good selectivity can be obtained if catalysts can inhibit side
reactions such as RWSR and carbon formation reactions. As forementioned, the major
causes of catalyst deactivation for CO2 reforming of CH4 are carbon formation, sintering,
and metal oxidation. Therefore, the desired properties of proposed catalysts can be
defined based on the proposed surface mechanism and previous stoichiometric and
thermodynamic analysis along with the general principles of catalyst development and the
common challenges of catalysts in CO2 reforming of CH4. The desired properties are
described as P 1-5 as given below:
P-1 Surface dehydrogenation sites that can enhance the dissociation of methane to CHx
species and remove H species from the intermediate to form hydrogen;
P-2 Surface carbon dioxide adsorption sites that promote the activation or participation
of CO2 to remove C species derived from the decomposition of CH4;
P-3 Adjacent surface sites of P-1 and P-2 that will facilitate the reaction between C
species and activated CO2 molecules so that the overall reaction rate can be
improved;
P-4 Thermal stability that can retain catalyst physical and mechanic properties thus
phase transitions and crystal transformation could be avoided at high reaction
temperatures, such as 1023 K;
P-5 Uniform and stable dispersion of active components with small particle sizes
which can promote CO2 reforming of CH4 while suppress carbon formation or

37
other undesired reactions because carbon formation active sites are believed larger
than reforming active sites (Rostrup-Nielsen, 1984).
2.1.7 Scope of catalytic materials for CO2 reforming of CH4
A catalyst is basically composed of active component, secondary active
component or promoter, catalyst support. The common metals used in catalysts are shown
in Table 2.6.
Table 2.6 Physical data of common metals used in catalysts (Anderson, 1975)
Metal Atomic weight
Crystal structure
Lattice parameter
( nm )
Neighbour atomic distance
( nm )
Melting point ( K )
Al 26.98 f.c.c. 0.404 0.286 1033 Ba 137.34 b.c.c. 0.501 0.434 998 Cr 52 b.c.c. 0.289 0.249 2163 Co 48.93 f.c.c. 0.355 0.251 1768 Cu 63.54 f.c.c. 0.361 0.255 1356 Ir 192.2 f.c.c. 0.383 0.271 2683 Fe 55.85 b.c.c. 0.286 0.248 1808 La 138.91 h.c.p. 0.372; 0.606 0.371 1193 Mg 24.31 h.c.p. 0.321; 0.521 0.32 924 Mn 54.94 Complex - - 1517 Mo 95.94 b.c.c. 0.314 0.272 2883 Ni 58.71 f.c.c. 0.352 0.249 1726 Pd 106.4 f.c.c. 0.388 0.275 1825 Pt 195.09 f.c.c. 0.392 0.277 2042 K 39.10 b.c.c. 0.531 0.462 337 Re 186.2 h.c.p. 0.276; 0.445 0.274 3453 Rh 102.91 f.c.c. 0.380 0.268 2239 Ru 101.07 h.c.p. 0.270; 0.427 0.267 2523 Ag 197.87 f.c.c. 0.408 0.288 1234 Na 22.99 b.c.c. 0.428 0.371 371 Ti 47.96 h.c.p. 0.295; 0.468 0.293 1948 W 183.85 b.c.c. 0.316 0.274 3683 V 50.94 b.c.c. 0.302 0.263 2163 Zn 65.37 h.c.p. 0.266; 0.494 0.266 692 Zr 91.22 h.c.p. 0.322; 0.512 0.319 2125

38
2.1.7.1 Determination of primary active component
It is well known that CO2 reforming reaction with CH4 can be catalyzed by most
transition metals. The activity of common catalytic metals for dehydrogenation or
hydrogenation follows the order given below (Trimm, 1980).
Ru, Rh, Pd, Ir, Pt > Fe, Co, Ni > W, Cr-Cu
Among them, the precious metals, such as ruthenium (Ru) and rhodium (Rh), and the
non-precious metal nickel (Ni) have been studied extensively (Ostrupnielsen et al., 1993,
Erdohelyi et al., 1993; Portugal et al., 2002; Richardson, 2003). It has been found that
supported precious metal such as Rh, Ru, Pd, Pt, and Ir catalysts can provide stable
operations for carbon dioxide reforming of methane and less carbon can be formed during
the reaction (Bradford and Vannice, 1999) in comparison with non-precious metal
catalysts. However, from an industrial standpoint, it is more practical to develop non-
precious metal-based catalysts to avoid high cost and restricted availability of precious
metals. Ni has drawn remarkable attention in this area due to its high activity and wide
availability (Rostrup-Nielsen, 1997). In this research, Ni is chosen as the primary active
component to meet the desired catalyst property described in P-1. However, Ni catalysts
suffer severe catalyst deactivation. To overcome the problems of catalyst deactivation, the
investigation of secondary active components (or catalyst promoters) and catalyst
supports has attracted significant attention (Osaka and Mori, 2001; Seok et al., 2002; Dias
and Assaf, 2003; Quincoces et al., 2001; 2002; Frusteri et al., 2001). Therefore, a
secondary active component and catalyst support are also determined in the catalyst

39
design in this thesis.
2.1.7.2 Determination of targeted secondary active component
It is well known that a secondary active component or promoter can increase the
performance and stability of the catalysts for CO2 reforming of CH4 in comparison with
the corresponding monometallic catalysts (Sinfelt, 1983; Ponec et al., 1995). Tomisshge et
al., (2000) investigated the additive of Sn, Ge, and Ga to a NiO-MgO solid solution and
found that the addition of Sn can effectively decrease the carbon formation which was
mainly resulted from the methane decomposition. The addition of Cr (Zhang et al., 1998;
Wang et al., 2003) and Mn (Choi et al., 1998; Seok et al., 2002) was reported to have
significant effect on the inhibition of carbide formation which was believed to be the
intermediate for carbon formation (Trimm, 1997). Catalyst performance can also be
improved when partial NiO was replaced with CoO in the NiO-MgO solid solution
(Choudhary and Mamman, 1998). It was believed that a homogeneous alloy of Co and Ni
and a small Ni substitution of Co dramatically enhance the catalyst activity and stability
by improved resistance to metal oxidation (Takanabe et al., 2005).
In this research, the investigation for a secondary active component focuses on Co
and Mn. Fe and Cu have also been investigated due to their high activity to
dehydrogenation or hydrogenation (Trimm, 1980) and their close electronic configuration
to that of Ni (Table 2.9). However, Cr was not considered due to its highly hazardous
property which can impose great risk for workplace safety when Cr-containg dust
problem arises.

40
2.1.7.3 Determination of catalyst support
From the thermodynamic point of view, as discussed, a high reaction temperature
must be chosen to achieve high reactant conversion. However, at high temperatures, the
active metal crystallites in the catalysts would contact each other through thermal motion.
Even at the Hutting temperature, which is 0.3 times of the melting point of the substance,
the surface atoms would have enough energy to overcome the weak surface crystal forces,
then diffuse and form necks to decrease the surface energy (Richardson, 1989) resulting in
sintering deactivation. Therefore, a high-melting point material should be used to increase
resistance to sintering by providing a stable surface so that the desired catalyst property of
P-4 can be met. MgO was selected because of its high melting point of 3346 K. Also the
basic MgO can function as basic centers on the support for the activation of CO2 because
basicity was believed to promot the activation of acidic CO2 and suppress carbon
formation (Yamazaki et al., 1992; Horiuchi et al., 1996). In addition, the desired property
of P-2 is also met by the existence of basic MgO as support. However, MgO has low
specific surface area. Therefore, the high surface material Al2O3 is proposed to
compensate the low surface area of MgO. Thus, a mixed framework of AlMgOx is
proposed with the consideration of making use of the high thermal stability of MgO and
the high specific surface area of Al2O3. At this stage of catalyst design, a catalyst formula,
Ni-Me/AlMgOx (Me=Co, Fe, Cu, or Mn) is proposed correspondingly. With the proposed
catalyst composition, the desired catalyst property of P-3 can be realized through the close
contact of active component with support using proper catalyst preparation method, which

41
is also supposed to facilitate another desired property of P-5, the uniform dispersion of
active component in the catalyst.
2.2 CATALYST PREPARATION
Most industrial catalysts are manufactured using either precipitation method or
impregnation method (Delmon et al., 1976; 1979). Precipitated catalysts are generally
prepared by rapid mixing of concentrated solutions of metal salts with a precipitating
reagent while impregnated catalysts are made through the impregnation of active
components onto a support material (Cornils et al., 2003). Details of a catalyst preparation
process for a given catalyst are not always patented but rather kept as a business secret.
Therefore, only some broad principles are available in the published literature. In the
following sections, the two most often used industrial catalyst preparation methods are
briefly discussed.
2.2.1 Precipitation method
2.2.1.1 Precipitating process and unit operation
Precipitation is usually defined as a process obtaining a solid from a liquid
solution (Wijngaarden et al., 1998). To produce a precipitated catalyst, an amorphous or
crystalline precipitate or gel needs to be generated first by mixing two or more solutions
or suspensions of materials. The wet precipitate is then gone through filtration, washing,
drying, calcination, and forming to become a fresh catalyst. A schematic of the typical
precipitation process and major unit operations are shown in Fig. 2.11.

42
Fig. 2.11 Schematic of typical preparation process of precipitated catalysts
As presented in Fig. 2.11, a certain type and amount of metal salts are chosen and
dissolved based on catalyst design, and then are precipitated by adding a precipitating
reagent. A precipitate is obtained and unwanted ions are removed after filtration and
washing. The precipitate is usually in the form of hydroxide, carbonate, oxalate, formate,
or citrate. Water is removed by drying the precipitate. Designed catalyst is made after
calcinating and forming by following certain procedures. The final precipitated catalyst is
in the form of oxide or intimate mixed oxides. The size of crystallites present in the
precipitated catalysts is typically in the range of 3-15 nm (Twigg, 1989).
2.2.1.2 Chemistry of precipitation
When a metal salt is dissolved in water, the metal ions are solvated by water
molecules. The coordinated water molecules can be deprotonated to produce hydroxide or
even oxide species. The deprotonation processes can be expressed by the following
equilibria which depend on the charge of the metal and the pH of the solution (Jolivet et
al., 1994).
Solution of metal salts
Precipitation & aging
Filtration & washing
Drying
Metal salts Precipitating reagent
Fresh Catalyst Calcination Forming

43
[ ] [ ] [ ] +−+−+ =→←−→←−++ 2)(nH1)(nHn
2 OMOHMOHM (2.26)
The formation of the oxides is favored for highly charged metal ions and/or high pH of the
solution. There are several possibilities to shift the equilibria from the left-hand side to the
right-hand side of Eq. 2.26, i.e., to obtain oxides from hydrated metal salts. For instance, a
compound such as potassium hydroxide (KOH) can be used to raise the pH gradually, i.e.,
to remove the protons from the equilibrium. This corresponds to moving from left-hand
side to right-hand side in Eq. 2.26 at a given charge. Alternatively, the solution can be
simply aged at elevated temperatures. A higher temperature promotes dissociation of
protons from the hydrated metal ions. The mechanism of the polycondensation of the
hydroxide compounds eventually leads to precipitates (Jolivet et al., 1994). This process
may be affected by the factors such as salt concentration, pH, nature of the counter ions,
and temperatures.
2.2.1.3 Set-up for precipitation
The industrial process for the synthesis of large quantities of precipitated catalysts
is the controlled double jet precipitation (CDJP) process (Jolivet et al., 1994). Compared
with the CDJP process, most of the lab scale set-ups are very simple. A simple schematic
of precipitation set-up is shown in Fig. 2.12. To make a precipitated catalyst in lab, simply
introduce both solutions simultaneously into a beaker while stirring. The flow rates of
both solutions are adjustable and can be fixed by control valves. The pH of the
precipitation solution is monitored through pH indicators and maintained between 7 and
10. A precipitate can be generated in the process of precipitation. Then the following

44
filtration, washing, drying, calcination, and forming can be performed to make a fresh
precipitated catalyst.
Precipitation
Control valve
Solution of metal cations Solution of precipitating reagent
Fig. 2.12 Schematic of lab scale precipitation set-up
2.2.1.4 Advantages and disadvantages of precipitation method
Major advantages of precipitated catalysts can be generalized as: 1) uniform
mixing on a molecular scale of different catalyst components; and 2) uniform distribution
of active species throughout the catalyst. However, the precipitated catalysts may be more
costly because significant portion of active components are inside the catalyst bulk in
comparison with impregnated catalysts. Also, it is a challenge to form a catalyst with very
small particle size and a surface area higher than 200 m2/g (Wijngaarden et al., 1998).
2.2.2 Impregnation method
Impregnation of support material with a solution containing metal salts is one of

45
widely used catalyst preparation methods. In comparison with other catalyst preparation
methods (Gaigneaux, 2002), impregnation method is simpler. A scheme for the production
of an impregnated catalyst is shown in Fig. 2.13.
Fig. 2.13 Schematic of preparation process of impregnated catalysts
It can be seen from Fig. 2.13 that initially a solution containing active components
is made. In the next step either the support material is dipped into the solution or the
solution is sprayed onto the support. Drying is then performed to remove water or other
solvent after the active component adsorbed into the pore system of the support. A fresh
catalyst can be produced after calcination which converts the soluble salts into the
insoluble oxides on the surface of supports.
The advantages of a impregnated catalyst are 1) well defined pore structure and
surface area which are determined by commercially available supports; 2) more economic
than precipitated catalysts, especially, in the cases of precious metal catalysts; 3) clear
separation of active phases and support phases. A disadvantage of an impregnated catalyst
is that only limited amount of active components can be incorporated in the catalyst. Also,
Solution of metal salts
Drying Metal salts
Fresh Catalyst Calcination
Support
Impregnation

46
it is a challenge to produce uniform distribution of multi active components on a support
through impregnation process. The support may adsorb certain components preferentially
on the surface due to chromatographic effects (Wijngaarden et al., 1998).
2.2.3 Catalyst preparation
2.2.3.1 Determination of preparation method
As discussed in Section 1.2.2 of Chapter 1, the development of catalysts for CO2
reforming of CH4, most of transition metals that can be used to catalyze the reaction as
well as most of readily available commercial supports have been investigated intensively
and extensively. Unfortunately, catalyst deactivation basically due to carbon formation is
still the major challenge in CO2 reforming of CH4. Therefore, repeated research on the
metals and supports that have already been extensively investigated is most unlikely to
provide satisfied solutions to the existing challenge. The development of novel catalyst
system is of great interest.
In principle, catalysts are composed of active phases and support phases.
According to the catalyst design (see Section 2.1.7), the designed catalyst includes
primary and secondary active components supported on a combined or composite support.
In order to determine the most suitable catalyst preparation method, a decision chart,
Table 2.7, is made based on the desired catalytic property of P-5 (see Section 2.1.6).

47
Table 2.6 The decision chart for the selection of catalyst preparation method Merit Description Precipitation method Impregnation method
1 Uniform distribution of multi- active components Easy Difficult
2 Molecular scale mixing of catalyst components Easy Difficult
3 Surface area up to 200 m2/g Easy Easy
4 Surface area higher than 200 m2/g Difficult Easy
5 High metal dispersion Easy Easy
6 High metal loading Easy Difficult
7 Relative low cost Difficult Easy
8 Instrument availability Easy Easy
From Table 2.6, it is clear that the precipitation method has some advantages over
the impregnation method in achieving uniform distribution of multi-active components.
High surface area is a desired property for catalysts because of the surface nature of
catalysis. However, the surface area of an impregnated catalyst actually depends on
whether a support with such high surface area is commercially available. With such kinds
of material commercially unavailable for support, the uniform composite support
(AlMgOx) can only be made through precipitation method. Also, considering that a
surface area higher than 200 m2/g may not be necessary for high temperature reforming
reactions, the advantage of producing high surface area catalyst through impregnation
method may not be necessary either. A precipitated catalyst is likely more expensive than
an impregnated catalyst. But it is not an issue in this case as the objective of the study is to

48
develop nickel-based non-precious metal catalysts. With the low cost of non-precious
metals in comparison with precious metals, precipitation method will not result in a
significant rise in catalyst cost. In this research, precipitation method is determined as the
catalyst preparation method based on above discussion. The following section is a detailed
description of catalyst preparation procedures.
2.2.3.2 Catalyst preparation procedure
Six basic catalyst preparation steps used in the synthesis of precipitated catalysts
in our laboratory are described as follows.
1) Solution preparation: The solution containing various metal salts is prepared
through dissolving metal precursors using de-ionized water. The selection of
specific metals and their precursors is dependent on proposed catalyst composition.
2) Precipitation: The precipitation of metals will be made through adjusting the pH
value of the solution to 7-10 by adding precipitating reagent solution using the set-
up shown in Fig. 2.13. Many bases and basic compounds could be the
precipitating reagents. In this research, mild basic compounds are preferred such
as potassium carbonate (K2CO3), sodium carbonate (Na2CO3), and ammonia
hydroxide (NH4OH).
3) Filtration and washing: Filtration operation is used to remove most of water and
unwanted ions. Washing is performed to remove unwanted ions from the filtration
cake. The filtration cake is washed using de-ionized water at room temperature
until the pH value of washing flow is closing to 7.

49
4) Drying: After removing most of unwanted ions by washing, the precipitate cake
contains a significant portion of water. The precipitate is then dried in an oven at
120 oC for 12 h to remove the water.
5) Calcination: The catalyst calcination is one of the most important pre-treatment
procedures. Catalyst calcination at a temperature slightly higher than catalytic
reaction temperature is a common practice in catalyst preparation. High
temperature process can generate strong interaction between metals and oxide
support, resulting in the formation of stable catalysts (Somorjai, 1994). In this
research the ramp rate of furnace is set 2 oC/min and calcination temperatures are
from 500 oC to 1100 oC. Thermally unstable compounds in the catalyst are
decomposed to oxides. Also, solid-state reactions may take place between the
decomposed products to form new phases.
6) Sieving: After calcination at a specific temperature, the catalyst is ground and
sieved to four groups with different particle sizes, i.e., 0.075-0.150 mm, 0.150-
0.180 mm, 0.180-0.250 mm, and 0.250-0.355 mm. In most of catalyst testing
experiments, the catalysts with the particle sizes between 0.150-0.180 mm are
used unless otherwise specified.
2.3 PRELIMINARY EXPERIMENTS
As mentioned in section 2.1.4.2 of this Chapter, the equilibrium composition is
calculated based on two independent reactions instead of three without considering the
50
carbon formation reaction. In this section, preliminary experiments were performed to
evaluate the validity of the calculations for equilibrium compositions in this Chapter.
Following the catalyst preparation procedure described in section 2.2.3.3 of this
Chapter, a 6wt%Ni9wt%Co/AlMgOx bimetallic catalyst was prepared by coprecipitation
from an aqueous solution of nickel nitrate (98 wt% purity, Lancaster Synthesis Inc., USA),
cobalt nitrate (99 wt% purity, Aldrich Chemical Company, USA), magnesium nitrate (97
wt% purity, EMD Chemicals Inc., Mexico), and aluminium nitrate (98 wt% purity, EMD
Chemical Inc., Germany). The catalyst was calcined at 900 oC for 6 h.
CO2 reforming of CH4 over the Ni-Co/AlMgOx catalyst was carried out in a
bench-top, micro fixed-bed quartz reactor (Autoclave, USA) with an inner diameter of 6
mm. Reactant gas consisting of an equimolar mixture of N2 (99.9 % purity, Praxair
Canada Inc.), CH4 (99.2 % purity, Praxair Canada Inc.) and CO2 (99.9 % purity, Praxair
Canada Inc.) was introduced at the atmospheric pressure. Before testing, the catalyst was
reduced by a H2 (99.9 % purity, Praxair Canada Inc.) and N2 mixture with a molar ratio of
1:4 at 800 oC for 4 h. The product gas was analysed using an on-line Agilent 6890N GC,
equipped with TCD and a GS-GASPRO capillary column (J&W Scientific) of 60 m in
length and 0.32 mm in inner diameter. Helium (Ultra high purity 5.0, PRAXAIR Canada
Inc.) was used as the carrier gas. The GC oven temperature was first set -60 oC for 3 mins
and then increased to 200 oC with a ramp rate of 25 oC/min.
The results of the preliminary experiment of CO2 reforming of CH4 are shown by
the solid lines in Fig. 2.14 and Fig. 2.15. The first comparison between the measured

51
composition (solid lines) and the calculated composition (dotted lines) based on three
independent reactions (Eq. 2.1, 2.2, and Eq. 2.4) at the existence of inert N2 is presented in
Fig. 2.14. It can be seen that the ratio of H2/CO is higher than 1 for the calculated data
while less than 1 for the measured data, i.e. (H2/CO)measured<1 while (H2/CO)calculated>1.
Correspondingly, the ratio of CH4 to CO2 is higher than 1 for the measured composition
while it is lower than 1 for the calculated composition, i.e. (CH4/CO2)measured>1 while
(CH4/CO2)calculated<1. The observation indicates that the actual composition is different
with the equilibrium composition calculated using three independent reactions. Most
likely, some reactions may be far from their equilibrium state due to kinetic restriction.
0
10
20
30
40
673 773 873 973 1073 1173
Temperature ( K )
Com
posi
tion
( % )
CH4CH4CO2CO2H2H2COCOH2OH2ON2N2
Fig. 2.14 Comparison between measured (solid lines) and calculated composition (dotted lines) based on three independent reactions of Eq. 2.1, 2.2, and 2.4 at 1 atm and initial CO2/CH4/N2=1/1/1

52
Fig.2.15 presents the comparison between the measured composition (solid lines)
and the calculated composition (dotted lines) based on two independent reactions without
considering carbon formation reaction is presented in Fig. 2.15. It is clear that there is a
better fit between the calculated composition and the measured composition in Fig. 2.15.
0
10
20
30
40
673 773 873 973 1073 1173
Temperature ( K )
Com
posi
tion
( % )
CH4CH4CO2CO2H2H2COCOH2OH2ON2N2
Fig. 2.15 Comparison between measured (solid lines) and calculated composition (dotted lines) based on two independent reactions: Eq. 2.5 and 2.6 at 1 atm and initial CO2/CH4/N2=1/1/1
The experiments indicate that the magnitude of the carbon formation reaction is
insignificant in comparison with the total reactions in CO2 reforming of CH4 on the new
developed catalyst. The comparisons also show that it is reasonable to calculate the
equilibrium compositions using two independent reactions without considering carobn
formation reaction.

53
3 DEVELOPMENT OF LONG-TERM STABLE Ni CATALYSTS FOR CO2 REFORMING OF CH4
A similar version of this chapter was copyrighted and published in Journal of
Catalysis: Zhang, J., Wang, H., Dalai, A.K., “Development of stable bimetallic catalysts
for carbon dioxide reforming of methane”, J. Catal. 249 (2) 300-310 (2007).
CONTRIBUTION OF Ph.D. CANADIDATE
Experiments were planned and performed by Jianguo Zhang. Hui Wang and Ajay
K. Dalai provided guidance in planning the experiment. The submitted manuscript was
written by Jianguo Zhang, while Hui Wang and Ajay K. Dalai provided comments and
suggestions for revison.
CONTRIBUTION OF THIS CHAPTER TO THE OVERALL STUDY
Based on the designed catalyst compositions in Chapter 2, this chapter presents
experiments on the catalyst screening among various Ni-Me bimetallic combinations for
CO2 reforming of CH4. The work involves the catalyst preparation and catalyst testing.
This work resulted in the long-term stable Ni-Co/AlMgOx bimetallic catalysts for CO2
reforming of CH4, which is determined as the primary research object in the following
research. This work also provides preliminary characterization for the catalysts.

54
ABSTRACT
The designed Ni-Me/AlMgOx (Me = Co, Fe, Cu, or Mn) bimetallic catalysts were
prepared using co-precipitation method. Catalyst screening showed that Ni-Co bimetallic
catalyst had superior performance in terms of activity and stability than other Ni-Me
bimetallic catalysts for CO2 reforming of CH4. In a 2,000 h stability test over 0.05 g
catalyst under the conditions of 750 oC, 1 atm, reactant flow rate F = 5.5 L/h (or GHSV
=110,000 mL/gcat-h), Ni-Co catalyst showed very stable performance with very low
carbon formation. Catalyst characterization was conducted using ICP-MS, BET, XRD,
H2-TPR, CO2-TPD, CO-chemisorption, TEM, and TG. It was found that the synergy
between Ni and Co can significantly improve catalyst performance and reduce carbon
formation.
3.1 INTRODUCTION
As introduced in the first chapter, Ni catalysts suffer severe catalyst deactivation
due to sintering, metal oxidation (Slagtern et al., 1997), and especially the severe carbon
formation (Ashcroft et al., 1991). Tremendous attempts have been made in suppressing
carbon formation over Ni-based catalysts when carbon dioxide reforming of methane is
studied. Ruchenstein and Hu (Ruchenstein and Hu, 1995; 1996) reported that NiO/MgO
has excellent stability and good resistance to carbon formation because of the formation of
a solid solution between NiO and MgO, which is believed to suppress CO
disproportionation. Tomisshge et al. (2000) investigated the additive effect of Sn, Ge, and

55
Ga to a NiO-MgO solid solution and found that the addition of Sn can effectively decrease
the carbon formation which was mainly resulted from the methane decomposition. The
addition of Cr (Wang et al., 2003, Zhang et al., 1998) and Mn (Choi et al., 1998) to
supported Ni catalysts was reported to have significant effect on the inhibition of carbide
formation which was believed to be the intermediate for carbon formation (Trimm, 1997).
Choudhary and Mamman (1998) reported that catalyst performance can be improved
when partial NiO is replaced with CoO in the NiO-MgO solid solution. Takanabe et al.
(2005) reported that a homogeneous alloy of Co and Ni and the small Ni substitution of
Co dramatically improved the catalyst activity and stability. They ascribed the
performance enhancement to the improvement of catalyst resistance to metal oxidation.
From above literature review, it is clear that bimetallic catalysts exhibit superior
performance for carbon dioxide reforming of methane to the corresponding monometallic
catalysts (Sinfelt, 1983; Ponec and Bond, 1995). Considerable research has also been
conducted on the modification of catalyst supports by using promoters (Dias and Assaf,
2003; Seok et al., 2002; Osaki and Mori, 2001; Quincoces et al., 2001; 2002; Frusteri et
al., 1994) in order to overcome the deactivation associated with nickel-based catalysts. It
was reported that the addition of K and Ca can significantly inhibit carbon formation due
to the favorable adsorption of acidic CO2 on the basic surface sites (Zhang and Verykios,
1994; Chang et al., 1996). Catalyst surface basicity is believed to help suppress carbon
deposition by promoting the activation of CO2 (Horiuchi et al., 1996; Yamazaki et al.,
1992) on the surface of catalysts. However, catalyst deactivation is still a severe problem

56
for carbon dioxide reforming of methane.
This work applies a new approach of incorporating different properties into the
designed Ni-Me/AlMgOx (Me = Co, Cu, Mn, or Fe) catalyst, aiming at solving the
deactivation problem of Ni-based catalyst for CO2 reforming of CH4. First, the sintering
was supposed to be reduced or eliminated through improving catalyst thermal stability by
using high melting point material, MgO. Second, the catalyst activity was supposed to be
enhanced by providing high contact area through using high surface area material, Al2O3.
Third, the synergy of metal-metal was assumed to improve performance by reducing the
possibility of metal oxidation. Fourth, a high temperature calcination pre-treatment
process was proposed to improve the metal-support interaction to reduce carbon formation.
Thus, it was assumed that high metal dispersion, high surface area and SMSI could be
incorporated into a Ni-Me/AlMgOx bimetallic catalyst. Catalyst screening showed that the
Ni-Co/AlMgOx bimetallic catalysts possessed high activity and stability for carbon
dioxide reforming of methane. Carbon free operation was achieved in a 250 h stability
experiment.
3.2 EXPERIMENTAL
3.2.1 Catalyst preparation
Co-precipitation method as described in section 2.2.3 of Chapter 2 was used to
prepared different bimetallic catalysts for screening. The prepared catalysts are
represented as Ni-Me (Me = Co, Fe, Cu, or Mn) in this chapter.

57
3.2.2 Catalyst Characterization
The composition of the catalysts was analysed at the Saskatchewan Research
Council Analytical Laboratory using Inductively Coupled Plasma Mass Spectrometry
(ICP-MS). Their surface composition was analysed using X-ray photoelectron (XPS) in
the Department of Chemical and Materials Engineering at the University of Alberta.
The BET surface area, porous volume and average pore diameter were measured
by N2 adsorption at the temperature of -196 oC using Micromeritics ASAP 2000.
Approximately 0.2 g catalyst was used for each analysis. The degassing temperature was
200 oC to remove the moisture and other adsorbed gases from the catalyst surface. The
metal dispersion and metal surface area were determined by CO-chemisorption. The
sample was first reduced using hydrogen at 850-900 oC for 4 hours. The reduced sample
was moved to a sample holder under the protection of the inert gas (He). Three steps were
carried out before CO-chemisorption using Mircromeritics ASAP 2000: (1) evacuating the
sample for 30 min at 120 oC; (2) reducing the sample again at 450 oC for 30 min using H2;
and (3) evacuating the sample for another 30 min at 120 oC. Finally, CO-chemisorption
was conducted at 35 oC.
X-ray powder diffraction (XRD) analysis was conducted using a Rigaku/Rotaflex
Cu rotating anode X-ray diffraction instrument. The catalyst was powdered and mixed
with methanol to form a mud which was loaded to the coarse side of a glass plate and
placed under the ambient drying condition. The dried sample plate was then loaded in the
analysis chamber. Each sample was scanned at a rate of 4 o/min with 2-Theta varying from

58
20 to 80o. The reducibility of catalysts was studied in a quartz tube by temperature-
programmed reduction (TPR) in CHEMBET-3000. A sample of about 0.1 g was heated
from room temperature to 1000 oC using 3 % H2/N2 at a flow rate of 30 mL/min and a
ramp rate of 5 oC/min.
The carbon deposition on spent catalysts was analysed by a Perkin Elmer Pyris
Diamond TG/DTA instrument. The spent catalyst was heated in a platinum sample holder
in the air from room temperature to 850 oC at a ramp rate of 5 oC/min. The transmission
electron microscopy (TEM) was employed to investigate the morphology of carbon
deposit on the spent catalysts.
3.2.3 Catalyst testing
The evaluation of catalysts was carried out in a bench-top, micro fixed-bed quartz
reactor (Autoclave, USA) with an i.d. of 6 mm. In screening of different bimetallic
combinations and 2,000 h stability test for Ni-Co catalyst, 0.05 g catalyst was diluted with
0.450 g quartz sand. In order to compare selected catalysts at lower conversions, less
amount of catalyst was used so as to maintain the comparison at the same mass transfer
regime. In the investigation of effects of Ni-Co content, 0.03 g catalyst was mixed with
0.470 g quartz sand. 0.025 g catalyst mixed with 0.475 g quartz sand was applied in the
comparison between bimetallic and monometallic catalysts. The average catalyst particle
size is 0.165 mm. All experiments were carried out at 750 oC and 1 atm, and reactant flow
rate F=5.5 L/h. No temperature gradient was observed in catalyst bed. Based on literature
(Richardson 1989, Thomas and Thomas 1967) mass transfer was mostly eliminated at

59
such conditions of high flow rate and small amount of catalyst with small particle size.
However, in order to make valid comparison on the same basis, exactly the same reaction
conditions were applied in each comparison. Reactant gas consisting of an equimolar
mixture of N2 (99.9 % purity, Praxair Canada Inc.), CH4 (99.2 % purity, Praxair Canada
Inc.) and CO2 (99.9 % purity, Praxair Canada Inc.) was introduced at the atmospheric
pressure. Before testing, the catalyst was reduced by a H2 (99.9 % purity, Praxair Canada
Inc.) and N2 mixture with a molar ratio of 1:4 at 850-900 oC for 4 h. The product gas was
analysed by an on-line Agilent 6890N GC, equipped with TCD and a GS-GASPRO
capillary column (J&W Scientific) of 60 m in length and 0.32 mm in inner diameter.
Helium (Ultra high purity 5.0, PRAXAIR Canada Inc.) was used as the carrier gas.
3.2.3 Data processing
The conversion and selectivity were calculated using the same equations as
introduced in section 2.1.3 calculation for conversions and selectivity in Chapter 2. The
disappearance rate of reactant was calculated using Eq. 3.1 while the formation rate of
product was calculated with Eq. 3.2.
60
s-mol/g ,cat
fi
oi
cati ×=
m - FF-r (3.1)
60
s-mol/g ,cat
fi
cati ×=
mFr (3.2)
where mcat is the weight of test catalyst measured in gram.
The carbon formation was analysed using of thermal gravimetric analysis (TGA)
for spent catalysts under the assumption that any weight loss is resulted from the

60
oxidization of carbon deposition. Therefore, the carbon formation and average formation
rate were calculated from Eq. 3.3 and 3.4 respectively.
-
/gg formation,Carbon f
fo
catc mmm
= (3.3)
TOS
- h -/gg rate,formation carbon Average f
fo
catc ×=
mmm
(3.4)
where mo and mf are the weights of spent catalysts before and after TGA analysis. TOS is
the time-on-stream of the corresponding
3.3 RESULTS AND DISCUSSION
3.3.1 Physical properties of the prepared catalysts
Based on the catalyst design, a series of Ni-based bimetallic catalysts with
different combinations of Ni-Co, Ni-Mn, Ni-Fe, and Ni-Cu in the frame of AlMgOx were
prepared by coprecipitation method. The determination of the level of metals was first
determined based on the relevant literature (Tang et al., 2000). For convenience, the
catalysts were denoted as Ni-Co, Ni-Mn, Ni-Fe, and Ni-Cu, respectively. The elemental
composition, surface area, porous volume, and average pore diameter are shown in Table
3.1. Ni-Fe, Ni-Cu, and Ni-Mn catalysts had the same level of BET surface area between
14 and 18 m2/g. Meanwhile, Ni-Co catalyst had a significantly higher surface area of 53
m2/g. The porous volume followed the order of Ni-Co >> Ni-Cu > Ni-Mn > Ni-Fe, and
the average pore diameter followed the order of Ni-Co < Ni-Fe < Ni-Mn < Ni-Cu. The
BET analysis indicated the significant difference between Ni-Co combinations and the

61
others.
Table 3.1 Elemental composition, BET surface area, average pore diameter of catalysts for screening
Elemental Composition ( mol % ) Catalyst
Ni Fe Cu Mn Co Al Mg
BET surface
( m2/g )
Pore volume
( ml/g )
Average pore
diameter ( nm )
Ni-Fe 6.5 7.9 - - - 29.0 56.6 18 0.0565 12.0
Ni-Cu 6.8 - 6.9 - - 28.6 57.7 15 0.0881 19.6
Ni-Mn 6.0 - - 9.0 - 27.8 57.1 17 0.0734 16.9
Ni-Co 6.1 - - - 9.3 28.2 56.4 54 0.160 10.4
3.3.2 Catalyst screening for CO2 reforming of CH4
The activity and stability within a 28 h period was investigated over 0.05 g catalyst
at 750 oC, 1 atm, F=5.5 L/h, and CH4/CO2/N2=1/1/1. The equilibrium conversion of CH4
is 91.5 % at the reaction conditions. The catalyst activity in terms of CH4 and CO2
conversion is shown in Fig. 3.1 and 3.2, respectively. Among the four Ni-Me
combinations, Ni-Co catalyst has the highest initial activity (91.4 % CH4 conversion) and
remains at this level throughout the 28 h of time-on-stream (TOS). Ni-Mn and Ni-Fe
catalysts also have high initial activities with CH4 conversions of 85 % and 53 %,
respectively. However, they dropped to 63 % and 18 %, respectively, at the end of the 28 h
testing. Ni-Cu shows the lowest but relative stable activity, with a CH4 conversion less
than 16 %. The initial activity followed the order of Ni-Co > Ni-Mn > Ni-Fe > Ni-Cu.
This order is in good agreement with the order of the BET surface area, porous volume, or
average pore diameter (Table 3.1).

62
0
20
40
60
80
100
0 5 10 15 20 25 30
Time-on-stream ( h )
CH
4 con
vers
ion
( %
)
1(Ni-Cu) 2(Ni-Fe) 3(Ni-Mn) 4(Ni-Co)
Fig. 3.1 Activity and stability of Ni-Me catalysts in terms of CH4 conversion at reaction condition: 750 oC, 1 atm, 5.5 L/h, and CH4/CO2/N2=1/1/1
0
20
40
60
80
100
0 5 10 15 20 25 30
Time-on-stream ( h )
CO2
conv
ersi
on (
% )
1(Ni-Cu) 2(Ni-Fe) 3(Ni-Mn) 4(Ni-Co)
Fig. 3.2 Activity and stability of Ni-Me catalysts in terms of CO2 conversion at eaction condition: 750 oC, 1 atm, 110,000 ml/gcat-h, and CH4/CO2/N2=1/1/1
The conversion of CO2, shown in Fig. 3.2 has the same trend as the CH4
conversion in Fig. 3.1 for all the Ni-Me catalysts, but the former is slightly larger than the
latter. This can be ascribed to the existence of a side reaction of reveres water-gas shift
reaction (RWGS), which is resulted from the reaction between the reactant CO2 and the

63
reforming product H2. Consequently, the apparent conversion of CO2 is higher than CH4
and also the yield of H2 is lower than CO. This can be confirmed by the observation of the
H2/CO ratio which is lower than 1 shown in Fig. 3.3. Also, it is clear that the H2/CO ratio
varying between 0.9 and 1.0 for all catalysts is very close. Compared Fig. 3.3 with Fig.
3.1 or 3.2, the H2/CO ratio can not reflect any difference about activity and stability of
different Ni-Me catalysts.
0.60
0.70
0.80
0.90
1.00
1.10
0 5 10 15 20 25 30
Time-on-stream ( h )
H 2/C
O (
mol
/mol
)
1(Ni-Cu) 2(Ni-Fe) 3(Ni-Mn) 4(Ni-Co)
Fig. 3.3 H2/CO ratio as a function of time-on-stream of Ni-Me catalysts
3.3.3 Carbon deposition and activity of different Ni-Me catalysts
Carbon deposition on spent catalyst and activity decay after 28 h TOS are shown
in Table 3.2. The amount of carbon deposition on the spent catalysts was determined using
TG/DTA. The carbon formation in terms of gc/gcat is calculated using the overall weight
loss of spent catalyst during TG/DTA analysis up to 850 oC in air divided by the finial
weight of catalyst. The carbon formation divided by time-on-stream is defined as average
carbon formation rate with the unit of gc/gcat-h. The activity decay is calculated based on

64
the difference of initial and final CH4 conversion.
Table 3.2 Carbon formation and activity change of Ni-Me catalyst at 28 h CH4 conversion
( % ) Catalyst Carbon formation (mgc/gcat )
Carbon formation rate ( mgc/gcat-h) Initial Final
Activity decay ( % )
Ni-Fe 589.1 21.0 54 18 67
Ni-Mn 152.0 5.4 85 63 26
Ni-Cu 62.1 2.2 16 12.5 22
Ni-Co 57.1 2.0 91 91 0
It can be seen that Ni-Fe catalyst has a high carbon deposition rate of 21.0
mgc/gcat-h. Correspondingly, it has 67 % activity decay. Ni-Mn catalyst also has a
relatively high carbon formation rate of 5.4 mgc/gcat-h and an activity decay of 26 %.
However, Ni-Cu catalyst has a lower carbon formation rate of 2.2 mgc/gcat-h and a
relatively stable performance. Its activity decay is 22 %. Ni-Co catalyst has a low carbon
formation rate of 2.04 mgc/gcat-h. Also, it has a very stable performance in the 28 h period
without any activity decay. The activity decay follows the same order as the carbon
formation rate: Ni-Fe >> Ni-Mn > Ni-Cu > Ni-Co (Table 3.2). It indicates that the carbon
formation is the main reason of catalyst deactivation in carbon dioxide reforming of
methane. Ni-Co and Ni-Cu catalysts both have good carbon resistance. However, the
latter has a very low activity.
3.3.4 Long-term deactivation test of Ni-Co catalyst
3.3.4.1 Stability and carbon formation
Catalyst screening shows that Ni-Co catalyst does not lose its activity during the
28 h test (Figs 3.1 and 3.2) but carbon formation is observed over spent catalyst (Table

65
3.2). Therefore, a series of deactivation test experiments are proposed to investigate the
activity and carbon formation evolution behavior of the Ni-Co catalyst at different period
of time-on-stream. At the conditions of 750 oC, 1 atm, 110,000 ml/gcat-h, and
CH4/CO2/N2=1/1/1, Ni-Co catalyst is tested for 20, 200, and 2000 h, respectively. The
results of the reaction rate of CH4 and amount of carbon formation are shown in Fig. 3.4.
The use of the common logarithm of time is to show more details for the first 200 h.
y = 0.0856Ln(x) - 0.216R2 = 1
0.00038
0.00039
0.00040
0.00041
0.00042
1 10 100 1000 10000
Time on stream ( h )
-r CH
4 ( m
ol/g
cat-s
)
0.00
0.10
0.20
0.30
0.40
0.50
Car
bon
form
atio
n ( g
c/gca
t )
20 h 200 h 2000 h Carbon Formation
Fig. 3.4 Carbon formation and reaction rate of methane over Ni-Co catalyst at reaction conditions: 750 oC, 1 atm, 110,000 ml/gcat-h, and CH4/CO2/N2 =1/1/1
From Fig 3.4, it can be seen that in the 20 h test the reaction rate of CH4 remains at
around 0.000415 mol/gcat-s but the carbon formation is as high as 0.0408 gc/gcat over the
20 h period. In the 200 h test, the CH4 reaction rate remains at 0.000416 mol/gcat-s for
100 h but drops to 0.000409 mol/gcat-s at 200th h. The carbon formation is 0.2374 gc/gcat

66
over the 200 h period. In the 2000 h test, the CH4 reaction rate also starts to drop from the
initial 0.000415 to 0.000398 mol/gcat-s at about 300th h, and fluctuates between 0.000395
and 0.000407 mol/gcat-s until 700th h and stay stable at 0.000404 mol/gcat-s for the last
1300 h period. The carbon formation is 0.435 gc/gcat over the 2000 h period. An empirical
equation can be found to describe the relationship between the carbon formation over Ni-
Co catalyst and time-on-stream under the reaction conditions (Eq. 3.1). Carbon
accumulation becomes significantly slower with the increase of time-on-stream.
Regression shows that the relationship between the amount of carbon formed and the time
on stream is as follows:
216h TOS,6.85/ggamountformation Carbon catc −= )Ln(, m (3.1)
The initial carbon formation was high but slowed down when the TOS increased.
The average carbon formation rate is 2.0, 1.2, and 0.2 mgc/gcat-h for the 20, 200, and 2000
h runs, respectively. Further data treatment shows the average carbon formation rate is 2.0
mgc/gcat-h for the first 20 period of time-on-stream, 1.1 mgc/gcat-h for the following 180 h
period and 0.1 mgc/gcat-h for the last 1800 h. It is speculated that the rapid carbon
formation during the first 100 h leads to the obvious catalytic activity drop in the
following 200 h. The slow-down of the carbon formation afterwards results in a stable
performance since then. In overall, the catalytic activity drop for the Ni-Co bimetallic
catalyst is less than 3 % in the 2000 h period. This catalyst is one of the most stable and
most active one that has ever been developed for CO2 reforming of CH4. Comparison with

67
literature data is shown in Table 3.3.
Table 3.3 Performance comparison with literature data
Catalyst ( Reference )
T ( oC )
GHSV ( ml/gcat-h )
Final CH4 conversion
( % )
TOS ( h )
Carbon deposition ( mgc/gcat)
Ni/MgO (Frusteri et al., 2002)
800 330000 66 12 1330 at 12h
Ni/MgO, K doped (Frusteri et al., 2002)
800 330000 78 12 120 at12h
Ni/ZrO2-B (Wei et al., 2000)
757 24000 84 600 -
Ni0.03Mg0.97O (Tomishige et al., 1998, Chen et al., 1997)
850 18000 82 2400 -
Ni-Co/AlMgOx
(Zhang et al., 2007) 750
750
110000
365000
89
83
2000
250
440 at2000h
9 at 250h
Wei et al. (2000) had claimed that Ni/ZrO2-B was the best catalyst ever with methane
conversion of 84 % at 756 oC and GHSV of 24,000 ml/gcat-h, as shown in Table 3.3.
However, it was found that the Ni-Co/AlMgOx possesses higher activity with an initial
CH4 conversion of 89% at a GHSV of 110,000 ml/gcat-h. When the GHSV increased to
400,000 ml/gcat-h, the conversion of CH4 decreased to 82-83 %, which is still higher than
that of the well known Ni0.03Mg0.97O solid solution (Tomishige et al., 1998; Chen et al.,
1997) for which the CH4 conversion was 82 % at 850 oC with a GHSV=18,000 ml/gcat-h.
To understand further the performances of Ni-Co catalysts, the fresh and spent
catalyst were characterized using synchrotron-based x-ray absorption spectroscopy (XAS)
3.3.4.2 Stability and catalyst structure
In the study of heterogeneous catalysis, synchrotron-based XAS has allowed
correlation of catalyst performance to its structural and electronic characteristics (Guyot-
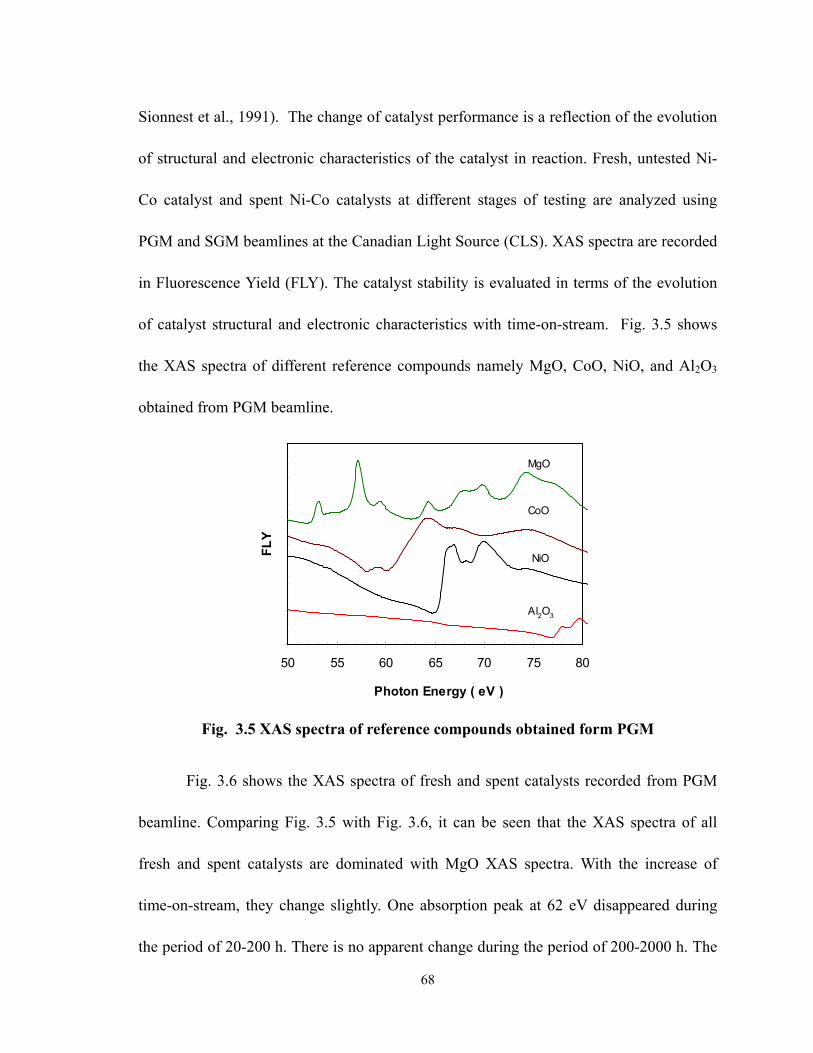
68
Sionnest et al., 1991). The change of catalyst performance is a reflection of the evolution
of structural and electronic characteristics of the catalyst in reaction. Fresh, untested Ni-
Co catalyst and spent Ni-Co catalysts at different stages of testing are analyzed using
PGM and SGM beamlines at the Canadian Light Source (CLS). XAS spectra are recorded
in Fluorescence Yield (FLY). The catalyst stability is evaluated in terms of the evolution
of catalyst structural and electronic characteristics with time-on-stream. Fig. 3.5 shows
the XAS spectra of different reference compounds namely MgO, CoO, NiO, and Al2O3
obtained from PGM beamline.
50 55 60 65 70 75 80
Photon Energy ( eV )
FLY
MgO
CoO
NiO
Al2O3
Fig. 3.5 XAS spectra of reference compounds obtained form PGM
Fig. 3.6 shows the XAS spectra of fresh and spent catalysts recorded from PGM
beamline. Comparing Fig. 3.5 with Fig. 3.6, it can be seen that the XAS spectra of all
fresh and spent catalysts are dominated with MgO XAS spectra. With the increase of
time-on-stream, they change slightly. One absorption peak at 62 eV disappeared during
the period of 20-200 h. There is no apparent change during the period of 200-2000 h. The

69
XAS spectra of spent catalysts from the PGM beamline might indicate that MgO is the
major contributor to the stability of the support.
The L edge spectra of Ni and Co are obtained from the SGM beamline and shown
in Figs 3.7 (Ni 2p) and 3.8 (Co 2p). The L edge spectra are divided in two parts LIII and LII.
They are dominated by respectively 2p3/2 and 2p1/2 character of the core hole. From Figs
3.7 and 3.8, it can be seen that the LIII, II absorption edges of both Ni and Co shift to lower
photon energy position with the increase of time-on-stream. After 200 h, no obvious
changes observed for both Ni 2p and Co 2p XAS spectra. This observation might indicate
that the catalyst structure has been stabilized.
50 55 60 65 70 75 80
Photon Energy ( eV )
FLY
Fresh
Spent 20h
Spent 200h
Spent 2000h
Fig. 3.6 XAS spectra of fresh and spent Ni-Co catalysts obtained from PGM

70
850 860 870 880 890
Photon Energy ( eV )
FLY
Ni L2,3-edge
Fresh
Spent 20 h
Spent 200 h
Spent 2000 h
Fig. 3.7 Ni 2p XAS spectra of fresh and spent Ni-Co catalysts obtained from SGM
770 780 790 800 810
Photon Energy ( eV )
FLY
Co L2,3-edge
Fresh
Spent 20 h
Spent 200 h
Spent 2000 h
Fig. 3.8 Co 2p XAS spectra of fresh and spent Ni-Co catalysts obtained from SGM
In Figs 3.7 and 3.8 the Ni 2p and Co 2p spectra show that not only Ni and Co
become stable after a period of time-on-stream but also take a higher oxidation state of
them in the catalysts for CO2 reforming of CH4.

71
3.3.4.3 Stability and product distribution
The ratio of H2/CO as a function of time-on-stream is shown in Fig. 3.9. RWSR is
the major side reaction in the methane dry reforming system (Bradford and Vannice 1999).
Its existence will reduce the H2/CO ratio. The average ratio of H2 to CO over this catalyst
was about 0.965, which may indicate the occurrence but less significant of RWSR. Also, it
is interesting to note that the molar ratio of H2 to CO oscillates between 0.9 and 1.1 during
the reaction period. Wei et al. (2000) ascribed this phenomenon to a periodic cycle of
carbon deposition and elimination. An efficient periodic cycle of carbon deposition and
elimination on the catalyst surface may be one of the contributions that lead to stable
catalytic performance (Richardson 1989).
0
0.2
0.4
0.6
0.8
1
1.2
0 500 1000 1500 2000
Time on stream ( h )
H2/C
O m
ole
ratio
Fig. 3.9 H2/CO as a function of time-on-stream over Ni-Co catalyst
3.3.5 Comparison Ni and Co monometallic catalysts with Ni-Co catalyst
3.3.5.1 Element composition
To understand the relationship between catalyst properties and performance,
comparative investigations have been carried out over Ni and Co monometallic catalysts

72
and Ni-Co bimetallic catalyst. In the following characterization, lower Ni-Co content
bimetallic catalyst was used exclusively unless otherwise specified. Ni or Co content in
the monometallic catalysts was made at the same level as the overall Ni and Co content in
Ni-Co catalyst. This was done to compare the performance of catalysts with similar total
active metal loading. Bulk elemental composition was analyzed using ICP-MS and
surface elemental composition was determined by XPS, results shown in Table 3.4.
Table 3.4 Composition of Ni and Co monometallic and Ni-Co bimetallic catalysts Bulk Composition
( mol % )
Surface Composition ( mol % ) Catalyst
Ni Co Al Mg Ni Co Al Mg Ni 6.8 - 27.8 65.4 7.1 - 28.9 64.0 Co - 9.7 27.6 62.8 - 7.8 31.2 61.0
Ni-Co 3.6 4.9 30.0 61.5 4.3 6.2 29.3 60.2
Comparison between surface composition and bulk composition indicated that
Nisurface/Nibulk was 1.10 in the Ni monometallic catalyst and became 1.19 in the bimetallic
catalyst. Cosurface/Cobulk was 0.80 and 1.27 in the Co monometallic catalyst and bimetallic
catalyst, respectively. The co-existence of Ni-Co in the bimetallic catalyst made Co an
apparent surface enrichment but without significant effect on the Nisurface/Nibulk.
3.3.5.2 N2-physical absorption
N2-physical absorption was employed to measure the specific surface area and the
pore distribution of the catalysts and results are shown in Table 3.5 and Fig. 3.10.
Table 3.5 BET analysis for Ni and Co monometallic and Ni-Co bimetallic catalysts
Catalyst BET surface ( m2/g )
Average Pore diameter ( nm )
Pore Volume ( cm3/g )
Ni 45 9.0 0.1241 Co 24 10.5 0.0630
Ni-Co 56 8.5 0.1561

73
From Table 3.5, it can be seen that the Ni-Co bimetallic catalyst has higher surface
area than Ni or Co monometallic catalyst. Correspondingly, it has smaller average pore
diameter. Fig. 3.10A shows Ni-Co has more pores with diameter around 50 Å than the
monometallic catalysts. Combined with Fig. 3.10B, it can be seen that the surface area
and pore volume follow the same order: Ni-Co catalyst > Ni catalyst > Co catalyst.
0
0.01
0.02
0.03
0 100 200 300 400Pore diameter ( Å )
Pore
vol
ume
( cm
3 /gca
t )
Ni catalyst
Co catalyst
Ni-Co catalyst
A
0
0.05
0.1
0.15
0.2
0 100 200 300 400Pore diameter ( Å )
Cum
ulat
ive
pore
vol
ume
( cm
3 /gca
t )
Ni catalyst
Co catalyst
Ni-Co catalyst
B
Fig. 3.10 Pore distribution of Ni and Co monometallic and Ni-Co bimetallic catalysts
3.3.5.3 CO-chemisorption
The metallic property of active sites has been confirmed by the experiment during
which no conversion of reactants was observed on unreduced catalysts. It indicates that
metallic surface is closely related to the catalyst activity and stability. The metallic surface
and metal dispersion are measured using CO-chemiosorption. The metallic surface area
and metal dispersion of both monometallic and bimetallic catalysts are shown in Table 3.6.
With the same level of metal content, the Ni-Co bimetallic has significant higher metallic

74
surface area (2.9 m2/g) and metal dispersion (8.8 %) than the monometallic catalysts (1.2
m2/g and 2.9 % for Ni catalyst and 1.5 m2/g and 2.1 % for Co catalyst).
Table 3.6 Metallic surface area and metal dispersion of Ni and Co monometallic and Ni-Co bimetallic catalysts
Catalyst Metallic surface ( m2/g )
Metal dispersion ( % )
Ni 1.2 2.9
Co 1.5 2.1
Ni-Co 2.9 8.8
3.3.5.4 Reducibility
Hydrogen temperature-programmed reduction (H2-TPR) experiment was
conducted to investigate the reducibility of the catalysts. The TPR profiles are shown in
Fig. 3.11.
Fig. 3.11 TPR profiles of Ni and Co monometallic and Ni-Co bimetallic catalysts calcined at 900 oC
0 200 400 600 800 1000
Temperature ( oC )
Inte
nsity
( a.
u. )
Ni-Co catalyst
Co catalyst
Ni catalyst

75
The reduction peaks in the ranges of 750 -950 oC and 700-950 oC for the Ni and
Co monometallic catalysts corresponded to the reduction of Ni in a mixed spinel phase
NixMg1-xAl2O4 (Tichit et al., 1997) and Co in a mixed spinel phase CoxMg1-xAl2O4 (Ribet
et al., 2000), respectively. The reduction peak in Ni-Co bimetallic catalyst between 700
and 940 oC probably resulted from the reduction of Ni and Co in a very complex
quaternary spinel-like phase (Coq et al., 2000). In the high-temperature calcination
process, Ni and Co can also form a continuous row of NixCo3-xO4 spinels, x>0 (Petrov and
Will 1987). The reduction peak maximum of Ni-Co bimetallic catalyst was at a lower
temperature (850 oC) in comparison to those for Ni monometallic catalyst (868 oC) and
Co monometallic catalyst (896 oC). This could be partially attributed to the surface
enrichment of Ni and Co in the Ni-Co catalyst because the Ni or Co on the catalyst
surface is easily accessible. Also, the reduction in Ni-Co bimetallic catalyst appeared as a
single reduction peak. This might indicate the formation of the Ni-Co alloy during
reduction according to Rinkowski et al. (1995). They reported that one-stage reduction of
bimetallic catalysts illustrates the alloying of metals in the reduction process.
3.3.5.5 Bulk phases
XRD analysis was used to identify the bulk phase property of the catalysts and the
XRD results are shown in Fig. 3.12.

76
20 30 40 50 60 70 802-Theta ( degree )
Inte
nsity
(a. u
.)
Spinels MgO
Ni catalyst
Co catalyst
Ni-Co(L) catalyst
Fig. 3.12 XRD analysis of Ni and Co monometallic and Ni-Co bimetallic catalysts calcined at 900 oC
As shown in Fig. 3.12, spinel phases and MgO-type phases were observed in all
the three samples. No apparent difference was revealed between the XRD patterns of Ni-
Co bimetallic catalyst and Ni or Co monometallic catalyst. According to Tichit et al.
(1997; 1999; 2000), Ni2+, Co2+, Mg2+, and Al3+ belong to the same lattice in the
Ni/Co/Al/Mg composite catalysts. A high calcination temperature favours the formation of
Ni2+-Al3+, Co2+-Al3+, and Mg2+-Al3+ solid solutions of spinel-type and of the
stoichiometric NiAl2O4, CoAl2O4, and MgAl2O4 spinel phases (Tichit et al., 1997, Ribet et
al., 1999; Coq et al., 2000). The Ni2+-Co3+ spinel-type solid solution and NiCo2O4 spinel
can also be formed at high calcination temperatures (Petrov and Will 1987). These spinel-
type solid solution phases and spinel phases in the catalysts are quite indistinguishable by
XRD (Fig. 3.12) due to their similarity. This result is understandable because the major
components of the catalysts are Al and Mg and they could form similar solid structures in

77
the identical preparation processes.
3.3.5.6 Oxidation states of Ni and Co
XPS was used to analysis the oxidation states of the catalyst, shown in Fig. 3.13.
848 852 856 860 864 868
Binding Energy (ev)
Cou
nts
(a.u
.)
Ni 2p 3/2
NiO Ni2O3 NiO(S)
Ni2O3 (S)
Ni catalyst
Ni-Co(L) catalyst
770 774 778 782 786 790
Binding Energy (ev)
Coun
ts (a
.u.)
Co 2p 3/2
Co catalyst
Ni-Co(L) catalyst
Co2O3 CoO
Fig. 3.13 XPS spectra of Ni 2p3/2 and Co 2p3/2 in Ni and Co monometallic and Ni-Co bimetallic catalysts calcined at 900 oC.
Fig. 3.13 shows that Ni2+ (854 eV and 860 eV) (Kang and Rhee 2001) was
predominant in Ni monometallic catalyst and Co3+ (777 eV) (Marco et al., 2001) was in
large amount in Co monometallic catalyst. However, other oxidation states for both metals
such as Ni3+ and Co2+ increased in Ni-Co bimetallic catalyst. It is interesting to note that
part of Ni shifted from lower oxidation state to higher oxidation state and vice versa in the
case of Co. This indicates the occurrence of electron transfer between Ni and Co in the
bimetallic catalyst, which is believed to prevent metal from oxidation during the reaction
(Frustri et al., 2001). It further confirms the near-distance interaction between the two
metal atoms, which may easily form Ni-Co alloy on the catalyst surface during reduction.

78
3.3.5.7 Comparison of activity and stability of Ni, Co monometallic catalysts with Ni-Co bimetallic catalyst for CO2 reforming of CH4
The activity and stability of Ni and Co monometallic catalysts and Ni-Co
bimetallic catalyst in a test of 28 h period at 750 oC, 1 atm, F=5.5 L/h, CH4/CO2/N2=1/1/1,
and 0.025 g catalyst are shown in Fig. 3.14. From Fig. 3.14, it is clear that Ni and Co
monometallic catalysts have similar performances. Co monometallic catalyst has slightly
higher initial activity in terms of CH4 (0.000601 mol/gcat-s) and CO2 (0.000684) reaction
rates in comparison with Ni monometallic catalyst with reaction rates of CH4 (0.000559
mol/gcat-s) and CO2 (0.000652 mol/gcat-s). With the increase in time-on-stream,
deactivation takes place. CH4 reaction rates drop to 0.000517 mol/gcat-s on both
monometallic catalysts. CO2 reaction rates drops to 0.000633 and 0.000618 mol/gcat-s
respectively on Co and Ni monometallic catalysts. Compared with monometallic catalysts,
Ni-Co shows significant high and stable activity within the 28 h time-on-stream. Initial
CH4 and CO2 reaction rates of Ni-Co bimetallic catalyst are 0.000745 and 0.000773
mol/gcat-s respectively and remain unchanged at the end of the test.

79
0.0004
0.0005
0.0006
0.0007
0.0008
0 5 10 15 20 25 30
Time-on-stream ( h )
-r ( m
ol/g
cat-s
)
Ni Co Ni-Co Ni Co Ni-Co
Fig. 3.14 Comparison of stability of Ni-Co bimetallic catalyst and Ni and Co monometallic catalysts (solid line: CH4 reaction rate; dotted line: CO2 reaction rate)
Carbon formation analysis for the spent catalysts is shown in Table 3.7. It is found
that there is no carbon formed on the Ni-Co bimetallic catalyst during the 28 h time-on-
stream while the average carbon formation rates of Ni and Co monometallic catalysts are
0.003186 and 0.003973 gc/gcat-s respectively. Correspondingly, there is no drop in reactant
conversion of Ni-Co bimetallic catalyst but significant decrease in reactant conversions of
Ni and Co monometallic catalysts.
Table 3.7 Activity and carbon formation rate of Ni and Co monometallic and Ni-Co bimetallic catalysts
Initial conversion ( % )
Final conversion ( % ) Catalyst
CH4 CO2 CH4 CO2
Average carbon formation rate
( gc/gcat-h ) Ni 62.9 73.4 58.0 69.5 0.003186
Co 67.6 77.0 58.3 71.2 0.003973
Ni-Co 83.8 87.0 83.9 87.1 0
Carbon formation over Ni, Co monometallic catalysts and Ni-Co bimetallic

80
catalyst was confirmed through TEM analysis for spent catalysts. It identified that the
carbon formed on Ni and Co monometallic catalyst is in the form of filamentous whiskers
(Fig. 3.15). It indicates that the filamentous whiskers carbon might be the major cause of
catalyst deactivation. Also, from literature it can be found that the carbon formation is
closely related to the catalyst properties during CO2 reforming of CH4. The relationship
between catalyst performance, carbon formation, and catalyst properties is discussed in
the following section.
Fig. 3.15 TEM images of spent catalysts. A: Ni catalyst; B: Co catalyst; C: Ni-Co catalyst
3.3.6 Discussion on catalyst activity, stability, and carbon resistance
Catalyst initial activity has direct correlation with active metal content. That is
why Ni-Co bimetallic catalyst with higher Ni-Co content had higher initial activity.
However, the stability of low Ni-Co content catalyst is better than that of high Ni-Co
content catalyst. TG and TEM analysis showed such filamentous whiskers were formed
A B C

81
on the higher Ni-Co content bimetallic catalyst. It demonstrated that the good stability of
Ni-Co catalyst with lower Ni-Co content can be ascribed to its higher carbon resistance.
However, when the activity was compared for monometallic and bimetallic
catalysts, it was found that the synergy between Ni and Co made significant difference. It
shows that Ni and Co monometallic catalysts have similar performances from the test
results of Ni and Co monometallic catalysts and Ni-Co bimetallic catalyst at 750 oC, 1 atm,
F=5.5 L/h, CH4/CO2/N2=1/1/1, and 0.025 g catalyst shown in Fig. 3.14 and Table 3.7. Fig.
3.14 clearly demonstrates that the activity of Ni and Co monometallic catalysts dropped in
the 28 h stability test but the activity of Ni-Co bimetallic catalyst maintained at the same
level as its initial value. TG analysis revealed that Ni and Co monometallic catalysts had
relatively the same carbon formation rate (0.003186 gc/gcat-h and 0.003973 gc/gcat-h,
respectively) but Ni-Co bimetallic catalyst did not have detectable carbon formation
(Table 3.7). Carbon formation appeared to be the major reason of catalyst deactivation for
the monometallic catalysts. Bradford and Vannice (1999) reported that inactive carbon in
the form of filamentous whiskers was primarily responsible for the catalyst deactivation.
Different authors attributed carbon resistance to different properties. Ruchenstein
and Hu (1995; 1996) attributed the stability and carbon resistance of NiO/MgO to the
formation of a solid solution between NiO and MgO. Zhang et al. (1996) and Chang et al.
(1996) believed that the promotion of the basicity of catalysts by adding K and Ca
enhanced the adsorption of CO2 and thus suppressed the carbon formation. Other papers
(Chen et al., 1999; Ji et al., 2001; Wang and Lu, 1998) have indicated that high carbon

82
resistance was due to the strong metal-support interaction (SMSI). However, in this case,
it is believed that there was formation of solid solutions not only in bimetallic catalyst but
also in the monometallic catalysts (Fig. 3.13). The TPR profiles indicate that the
bimetallic catalyst had SMSI which confirms the work of previous researchers (Ahn et al.,
2006). In case of monometallic and bimetallic catalysts, in this reasearch there was no
basicity when they were measured using CO2-TPD (TPD results are not shown because all
CO2-TPD profiles were smooth flat lines without any CO2-desorption peaks). Compared
the carbon resistance between Ni-Co bimetallic catalyst and Ni and Co monometallic
catalysts, it is believeed that the excellent carbon resistance of Ni-Co is resulted from the
synergy of Ni and Co, and better metal dispersion. In addition, the formation of various
spinel-type solid solutions, the SMSI, and the good sintering resistance of MgO phasees
also played their roles in the high catalytic activity and excellent carbon resistance.
3.4 CONCLUSIONS
Ni-Co bimetallic catalysts made by coprecipitating Ni-, Co-, Al-, and Mg-
containing precursor solutions demonstrate superior performance for carbon dioxide
reforming of methane. The synergy of Ni and Co in the bimetallic catalysts not only
provides high activity but also excellent carbon resistance and thus makes the catalysts
with outstanding stability. Comparative studies conducted with Ni and Co monometallic
catalysts and Ni-Co bimetallic catalyst show that the superior performance of Ni-Co
catalysts comes from high BET surface area, small pore diameter, relative easy

83
reducibility, good metal dispersion, high metallic surface, formation of different types of
solid solutions, and SMSI.

84
4 EFFECTS OF Ni AND Co CONTENTS ON THE Ni-Co/AlMgOx BIMETALLIC CATALYSTS
This chapter, except section 4.3.1-Effects of Ni/Co ratio, was copyrighted and
published in Applied Catalysis A: General: Zhang, J., Wang, H., Dalai, A.K., “Effects
of metal content on activity and stability of Ni-Co bimetallic catalysts for CO2 reforming
of CH4”, Appl. Catal. A 339 (2) 121-129 (2008).
CONTRIBUTION OF Ph.D. CANADIDATE
Experiments were planned and performed by Jianguo Zhang. Hui Wang and Ajay
K. Dalai provided guidance in planning the experiment. The submitted manuscript was
written by Jianguo Zhang, while Hui Wang and Ajay K. Dalai provided comments and
suggestions for revision.
CONTRIBUTION OF THIS CHAPTER TO THE OVERALL STUDY
Focusing on the Ni-Co/AlMgOx bimetallic catalysts designed and developed in
Chapter 2 and Chapter 3, this paper investigated the effects of Ni/Co ratio and Ni-Co
overall content. The work involves the catalyst preparation, catalyst testing, and catalyst
characterization. This work revealed that carbon-free operation for CO2 reforming of CH4
can be achieved over Ni-Co bimetallic catalysts through adjusting Ni-Co content.

85
ABSTRACT
Ni-Co bimetallic catalysts with a general formula of Ni-Co/AlMgOx prepared
using coprecipitation has shown excellent stability and high activity for CO2 reforming of
CH4 as discussed in Chapter 3. This chapter focuses on the effects of Ni/Co ratio and Ni-
Co content of the catalyst, attempting to eliminate carbon formation on the catalyst.
Catalyst samples with Ni and Co loadings ranging between 2.54 and 18.9 wt% and 3.87
and 16.8 wt%, respectively, were prepared and the activity and stability for CO2 reforming
of CH4 was tested at 750 oC and 1 atm using a high GHSV of 180,000 mL/gcat-h. The
results show that catalysts with lower Ni-Co content (2.57-4.99 wt% for Ni and 3.87-6.27
wt% for Co) had high and stable activity with no deactivation and no detectable carbon
formation and that those of higher Ni-Co content (7.22-18.8 wt% for Ni and 10.9-16.8
wt% for Co) experienced deactivation with significant carbon formation in a 250 h period.
The catalysts were characterized using XRD, H2-TPR, TG/DTG-TPO, N2-physisorption,
and CO-chemisorption. It was found that catalyst with lower Ni-Co content has larger
surface area and better metal dispersion and therefore gives rise to smaller metal particles
(<10 nm) which is essential to the complete suppression of the carbon formation on
catalysts.

86
4.1 INTRODUCTION
In the development of Ni-based catalysts for CO2 reforming of methane, the focus
is always directed on the effective suppression of carbon formation, or carbon deposition,
on catalyst surface during reaction (Hu and Ruchenstein, 2002; 2004; Bradford and
Vannice, 1999). Although tremendous attempts have been made and a number of papers
have been published, carbon formation is still a great challenge for Ni-based catalyst,
which prevents CO2 reforming of CH4 from being a widely commercialized technology.
In fact, there is great potential in the application of CO2 reforming of CH4 technology in
areas such as conversion of biomass and landfill gases into “Green Power” (Vasileiadis
and Ziaka-Vasileiadou, 2004). Also, the synthesis gas with a lower H2/CO ratio produced
through CO2 reforming of CH4 is the desired feedstock for Fischer-Tropsch synthesis
(Ginsburg et al., 2005).
A very stable and highly active Ni-Co bimetallic catalyst with a general formula
Ni-Co/AlMgOx has been presented in Chapter 3, which was prepared by coprecipitation
method and has undergone through 2,000 h stability test for CO2 reforming of CH4 where
no significant deactivation was observed (Zhang et al., 2006; 2007). Compared with other
reported catalysts used for CO2 reforming of CH4, this Ni-Co bimetallic catalyst is able to
remarkably suppress carbon deposition during the reaction. With a very small amount of
carbon formed during the initial period of reaction, the catalyst still maintains a high
activity for a long time. The excellent performance of this catalyst results from the

87
synergic combination of the following contributing factors. The co-precipitation
preparation method and high-temperature calcinations make the catalyst with a stable
NixMg1-xAl2O4 and CoxMg1-xAl2O4 spinel-like framework structure and strong metal-
support interaction (SMSI). This method also facilitates small metal particle size after the
precipitate is reduced. The combining use of Al and Mg oxides provides the catalyst with
not only relative high surface area but thermal stability. The formation of Ni-Co alloy
during the catalyst reduction effectively suppresses the carbon formation which is more
difficult to overcome by Ni active sites themselves. Previous research has also shown that
the variation in Ni-Co content in catalyst would affect the severity of carbon deposition,
suspecting the change of Ni-Co content may alternate the size of active sites to which
carbon formation is sensitive. Many authors have observed the sensitiveness of carbon
deposition to metal particle size on catalyst surface. Work by Rostrup-Nielsen indicates
(Rostrup-Nielsen, 1984) that large nickel clusters are susceptible to carbon formation.
When using promoters K and Ca to suppress carbon deposition, Osaki et al. (2001)
believed that K divided the Ni surface into small particles and thus inhibited carbon
formation. Various authors have observed the critical Ni particle size below which carbon
formation could be significantly reduced or eliminated. Tang et al. (2000) reported that a
10 nm metallic nickel particle was critical to inhibiting carbon formation. Kim et al.
(2000) suggested a critical particle size of suppressing carbon formation was 7 nm.
This chapter focuses on the effects of Ni-Co content on catalyst properties and
catalyst performance with an attempt to eliminate carbon formation for CO2 reforming of

88
CH4 over Ni-Co bimetallic catalysts. A series of catalysts with different Ni/Co ratio and
Ni-Co contents are comparatively investigated. The relationship between catalyst
performance and catalyst properties is discussed. The major cause of carbon formation on
Ni-Co bimetallic catalyst is identified. And finally, carbon free operation for CO2
reforming of CH4 over a Ni-Co bimetallic catalyst is achieved.
4.2 EXPERIMENTAL
4.2.1 Catalyst preparation
Ni-Co/AlMgOx catalysts with different Ni/Co ratio and Ni-Co contents were
prepared using the same method described in previous chapters. The catalyst made was
denoted as 0.16Ni0.18Co, 0.06Ni0.09Co, 0.04Ni0.05Co, and 0.02Ni0.03Co, respectively,
with the number indicating the mole fraction on the metal basis in the catalysts.
4.2.2 Catalyst Characterization
The catalysts were characterized using N2 adsorption for specific surface area and
pore distribution, TPR for reducibility, CO-chemisorption for metallic surface area and
metal disperation, XRD for crystal structures, TG/DTG for carbon formation, and TEM
for particle size. They were described in detail in the experimental section of Chapter 3.
4.2.3 Catalyst testing
In this work, the amount of catalyst used in each test was 30 mg. Reactant feed
was introduced into the reactor at a GHSV of 180,000 mL/gcat-h. Detailed catalyst testing
procedure was described in chapter 2 and chapter 3.

89
4.3 RESULTS AND DISCUSSION
4.3.1 Effects of Ni/Co ratio
4.3.1.1 Elemental composition
A series of Ni-Co bimetallic catalysts with various Ni/Co ratios were made to
investigate the effects of Ni/Co ratio. The effect of Ni content is investigated by increasing
it from zero to 24 mol% while Co content is maintained constant. The effect of Co content
is studied by varying it from zero to 24 mol% when Ni content is unchanged. The
designed elemental composition of Ni-Co bimetallic catalysts with various Ni/Co ratios
are listed in Table 4.1. It may be noticed that the content of Al and Mg is also changing
with the change of Ni/Co ratio. It happens due to the characteristic of co-precipitation
preparation of catalysts when total metal element content is normalized to unit. In this
work, the Al/Mg ratio is maintained at 0.4-0.8.
Table 4.1 Ni/Co ratio and elemental composition Designed Elemental composition
( mol% ) Ni/Co ratio Ni Co Al Mg
0/1 0 6 31 63 1/1 6 6 30 58 2/1 12 6 30 52 4/1 24 6 29 38 1/0 6 0 32 62 1/2 6 12 26 56 1/4 6 24 20 50
4.3.1.2 Effects of Ni/Co ratio on BET surface area
By keeping either Ni or Co constant and changing another, the effects of Ni/Co
ratio on the BET surface area are shown in Fig. 4.1 A and B.

90
0
10
20
30
40
50
60
0 1 2 3 4
Ni/Co ratio ( mol/mol )
BET
sur
face
are
a (
m2 /g
)Co = constant = 6 mol %
A
0
10
20
30
40
50
60
0 1 2 3 4
Co/Ni ratio ( mol/mol )
BET
sur
face
are
a (
m2 /g
)
Ni = constant = 6 mol %
B
Fig. 4.1 Effects of Ni/Co ratio on the BET surface area of the samples
When Co content is constant, the designed Ni/Co ratio of 1 gives the highest
surface area of 54 m2/g. In comparison with Ni/Co=1, other ratios show no significant
difference with a surface area between 24 and 29 m2/g when the Ni/Co ratios are 0, 2, and
4 (Fig. 4.1A). From Fig. 4.1B, it can be seen that the increase in Co/Ni ratio with the
exception of Co/Ni=1 makes the surface area decreased significantly from 45 m2/g at
Co/Ni=0 to 16 and 11 m2/g at Co/Ni=2 and 4. Therefore, from the prospective of large

91
surface area, a Ni/Co ratio between 0.6 and 1.5 is preferred.
4.3.1.3 Effects of Ni/Co ratio on pore distribution
Fig. 4.2A shows the pore volume as a function of pore diameter and Fig. 4.2B
shows the cumulative volume as a function of pore diameter.
0.00
0.01
0.02
0.03
0.04
0.05
0 100 200 300 400 500Pore diameter ( Å )
Pore
vol
ume
( cm
3 /g )
Ni/Co=0/1Ni/Co=1/1Ni/Co=2/1Ni/Co=4/1
Co = constant = 6 mol %
A
0.00
0.04
0.08
0.12
0.16
0.20
0 100 200 300 400 500Pore diameter ( Å )
Cum
ulat
ive
pore
vol
ume
( cm
3 /g )
Ni/Co=0/1Ni/Co=1/1Ni/Co=2/1Ni/Co=4/1
Co = constant = 6 mol %
B
Fig. 4.2 Pore volume distribution as a function of Ni/Co when Co content is constant
Clearly the samples with a Ni/Co ratio close to 1 have higher pore volume. All
peak maxima of the samples are at around 35 Å. Correspondingly, the catalyst with
Ni/Co=1 has the highest accumulative pore volume. With the increase in Ni/Co ratio, the
pore volume and accumulative pore volume of the samples is dropping. In the case of
maintaining Ni content constant, the pore volume distribution is shown Fig. 4.3.

92
0.00
0.01
0.02
0.03
0.04
0.05
0 100 200 300 400 500
Pore diameter ( Å )
Pore
vol
ume
( cm
3 /g )
Co/Ni=0Co/Ni=1Co/Ni=2Co/Ni=4
0.00
0.04
0.08
0.12
0.16
0.20
0 100 200 300 400 500
Pore diameter ( Å )
Pore
vol
ume
( cm
3 /g )
Co/Ni=0Co/Ni=1Co/Ni=2Co/Ni=4
Fig. 4.3 Pore volume distribution as a function of Co/Ni when Ni content is constant
From Fig. 4.3, it can be seen that similar pattern are shown, i.e. the sample with
Co/Ni=1 has the highest volume. However, the peak maximums of the samples are
moving toward to bigger pores with the increase in Co/Ni ratio (Fig. 4.3 A). For different
samples, the pore diameter where the pore volume peak maximum is follows the order:
Ni/Co=1 (35 Å) < Ni/Co=0 (43 Å) < Ni/Co=2 (45 Å) < Ni/Co=4 (60 Å). The
accumulative pore volumes are following the same order: Ni/Co=1 (0.160 cm3) <
Ni/Co=0 (0.124 cm3) < Ni/Co=2 (0.049 cm3) < Ni/Co=4 (0.033 cm3). From the pore
distribution it can be seen that a Ni/Co ratio of unity gives the highest pore volume with
smallest average pore diameter.

93
4.3.1.4 Effects of Ni/Co ratio on phase structure
The XRD spectra for the samples with various Ni/Co or Co/Ni ratios are shown in
Fig. 4.4. Spinel phases and MgO-type phases were observed in all the three samples. No
clear difference was revealed among the samples except the intensity is slightly different
with different Ni/Co or Co/Ni ratios.
0 20 40 60 80 100
2θ
Cou
nts
Ni/Co=0
Ni/Co=2
Ni/Co=4
Ni/Co=1
Co/Ni=0
Co/Ni=2
Co/Ni=4
Fig. 4.4 XRD analysis for the Ni-Co/AlMgOx catalysts with various Ni/Co or Co/Ni ratios calcinated at 900 oC
Ni2+, Co2+, Mg2+, and Al3+ are in the same lattice in the Ni/Co/Al/Mg composite
catalysts (Tichit et al., 1997; Ribet et al., 1999; Coq et al., 2000). A high calcination
temperature favours the formation of Ni2+-Al3+, Co2+-Al3+, and Mg2+-Al3+ solid solutions
of spinel-type and of the stoichiometric NiAl2O4, CoAl2O4, and MgAl2O4 spinel phases
(Tichit et al., 1997; Ribet et al., 1999; Coq et al., 2000). The Ni2+-Co3+ spinel-type solid
solution and NiCo2O4 spinel can also be formed at high calcination temperatures (Petrov

94
and Will 1987). These spinel-type solid solution phases and spinel phases in the catalysts
are quite indistinguishable by XRD (Fig. 4.4) due to their similarity. From the XRD
analysis, it shows that XRD analysis does not provide enough information for the
investigation of Ni/Co or Co/Ni ratios in the samples.
4.3.1.5 Effects of Ni/Co ratio on catalyst activity for CO2 reforming of CH4
The activity of the samples was tested using 0.03g catalyst at various GHSV for
CO2 reforming of CH4 at 750 oC, 1 atm, and CH4/CO2/N2=1/1/1. Fig. 4.5 shows the
activity of catalysts with various Ni/Co ratios in terms of reactant conversion.
0.00
0.50
1.00
1.50
2.00
2.50
0 200000 400000 600000 800000 1000000GHSV ( ml/gcat-h )
-r CO
2 ( m
mol
/gca
t-s )
Ni/Co=1Ni/Co=0Ni/Co=2Ni/Co=4
0.00
0.50
1.00
1.50
2.00
2.50
0 200000 400000 600000 800000 1000000GHSV ( ml/gcat-h )
-r CH
4 ( m
mol
/gca
t-s )
Ni/Co=1Ni/Co=0Ni/Co=2Ni/Co=4
Fig. 4.5 Activity of catalyst with various Ni/Co ratios for CO2 reforming of CH4

95
From Fig. 4.5, it is clearly that at lower GHSVs all sample showed close activity.
However, with the increase in GHSV, it is clear that the catalyst with Ni/Co=1 had the
highest activity. The activity of the samples followed the order: Ni/Co=1 > Ni/Co=0
>Ni/Co=2 >Ni/Co=4. Also, it can be noticed that there was no results for Ni/Co=4 when
GHSVs were higher than 200,000 mL/gcat-h and no results for Ni/Co=2 when GHSVs
higher than 450,000 mL/gcat-h. That was because the experiments were terminated due to
pressure build up in the reactor, which caused by the carbon formation on these two
catalysts. The activity of samples with various Co/Ni ratios is shown in Fig. 4.6.
0.00
0.50
1.00
1.50
2.00
2.50
0 200000 400000 600000 800000 1000000GHSV ( ml/gcat-h )
-r CH
4 ( m
ol/g
cat-s
)
Co/Ni=1Co/Ni=0Co/Ni=2Co/Ni=4
0.00
0.50
1.00
1.50
2.00
2.50
0 200000 400000 600000 800000 1000000GHSV ( ml/gcat-h )
-r CO
2 ( m
ol/g
cat-s
)
Co/Ni=1Co/Ni=0Co/Ni=2Co/Ni=4
Fig. 4.6 Activity of catalyst with various Co/Ni ratios for CO2 reforming of CH4

96
Fig. 4.6 shows the similar results as Fig. 4.5, i.e. the sample with Co/Ni=1 had the
highest activity. Activity followed the order of: Co/Ni=1 > Co/Ni=0 >Co/Ni=2 >Co/Ni=4.
The effects of Ni/Co ratios and Co/Ni ratios on the properties and performances of
the samples clearly indicated that the catalyst with Ni/Co=1 had the highest BET surface
area and the highest activity for CO2 reforming of CH4. It is recommended that a Ni/Co
ratio between 0.6 and 1.5 should be applied. In the following section, the effects of Ni-Co
content on catalyst properties and performance is discussed.
4.3.2 Effects of Ni-Co content on catalyst properties and performance for CO2 reforming of CH4
4.3.2.1 Bulk properties of the samples
The phase structure of the unreduced catalysts (calcined precipitates) was analyzed
using X-ray diffraction (XRD). The XRD patterns of the calcined precipitates are shown
in Fig. 4.7. A phase assigned to spinel-like structures with the characteristic diffraction
peaks at 2θ of 30.7o, 36.8o, 44.4o, 59.8o, and 65.2o (Tsyganok et al., 2003) was observed in
all samples with different Ni-Co content. The spinel-like phases could be NixMg1-xAl2O4,
CoxMg1-xAl2O4, or their composites, which are indistinguishable by XRD due to their
similar morphology (Tichit et al., 1997; Coq et al., 2000). As the Ni-Co content increases,
obvious increase in peak intensity was observed for the peaks at 2θ = 41.5o and 61.2o,
indicating the increase in the amount of Ni-Mg-O solid solution and Co-Mg-O solid
solution (Ruckenstein and Yu, 1997; Chen et al., 1997). The XRD analysis shows that all
the samples under calcination at 900 oC have been well-crystallized. It can also be seen

97
from the XRD patterns that the bulk phases of the samples were not alternated
significantly with the change of Ni-Co content.
20 30 40 50 60 70 80
2-Theta ( degree )
Inte
nsity
( a.
u. )
0.02Ni0.03Co
0.06Ni0.09Co
0.04Ni0.05Co
0.18Ni0.16Co
Fig. 4.7 XRD patterns for samples with different Ni-Co content calcined at 900 oC ○Spinel-like structures □ Solid solutions
The reducibility of the catalyst samples was measured using hydrogen temperature-
programmed reduction (TPR). From the TPR profiles, shown in Fig. 4.8, following
observations can be made: (1) For the bimetallic catalysts with different Ni-Co content,
only one domain exists for the H2 consumption which is featured by a single broad peak
instead of two separate peaks for Ni and Co reduction, respectively. This may indicate the
formation of Ni-Co alloy to some extent. Rinkowski et al. (1995) also reported the one-
stage reduction of bimetallic Ni-Pt catalysts which they believe to illustrate the alloying of
metals in the reduction process. (2) The H2 consumption domain appears at broader
temperature range of 650-900 oC for 0.18Ni0.16Co but at higher temperatures (700-950
oC) for other samples with lower Ni-Co content. The reduction of the bimetallic catalysts

98
between 650 oC and 950 oC is probably resulted from the reduction of Ni and Co in a very
complex quaternary spinel-like phase (Coq et al., 2000). The shift of peak maximum to
higher temperatures with the decrease of Ni-Co can be ascribed to the increase of metal-
support interaction (Ann et al., 2006).
0 200 400 600 800 1000
Temperature ( oC )
Inte
nsity
( a.
u. )
0.06Ni0.09Co
0.18Ni0.16Co
0.04Ni0.05Co
0.02Ni0.03Co
Fig. 4.8 Temperature-programmed reduction of the samples with different Ni-Co content calcinated at 900 oC
4.3.2.2 Surface area and pore size distribution of the catalysts
N2-physisorption was employed to measure the surface area and pore size
distribution. The BET specific surface area of the precipitates after calcination at 900 oC,
ranging between 27 and 70 m2/g, is given in Table 4.2. The surface area follows the order
of 0.02Ni0.03Co > 0.04Ni0.05Cu > 0.06Ni0.09Co > 0.18Ni0.16Co, with a decrease at a
higher (Ni+Co)/(Al+Mg) ratio (Fig. 4.9). On the other hand, the decrease of surface area
with the decrease of Al-Mg content provides evidence for the stabilizing role of Al and
Mg in the catalysts (Ribet et al., 1999).

99
Table 4.2 Composition and specific surface area of Ni-Co bimetallic catalysts calcined at 900 oC Sample Ni:Co:Al:Mg*
( atomic ratio )
Ni
( wt% )
Co
( wt% )
BET surface area
( m2/g )
0.02Ni0.03Co 2:3:32:63 2.57 3.87 70
0.04Ni0.05Co 4:5:30:61 4.99 6.27 56
0.06Ni0.09Co 6:9:28:56 7.22 10.9 45
0.18Ni0.16Co 18:16:26:40 18.8 16.8 27
*Oxygen content was calculated stoichiometrically based on the oxidizing valence of metals: Ni2+, Co3+, Al3+ and Mg2+.
0
20
40
60
80
0 0.1 0.2 0.3 0.4 0.5 0.6
(Ni+Co)/(Al+Mg)
BET
surf
ace
area
( m
2 /g )
Fig. 4.9 Variation of BET surface area with various (Ni+Co)/(Al+Mg) ratios
The pore size distribution is shown in Fig. 4.10 which was obtained from the
adsorption branch of the N2 isotherm by the Barret-Joyner-Halenda (BJH) method
(Rostrup-Neilsen and Hansen, 1993; Barret et al., 1951). It indicates that the pores
culminate at around 30 Å (Fig. 10A). With the increase of Ni-Co content, the small pores,
typically less than 100 Å, drops significantly from around 0.045 cm3/gcat of 0.02Ni0.03Co
to 0.0075 cm3/gcat of 0.18Ni0.16Co (Fig. 10B). The N2-physisorption reveals that the Ni-

100
Co content has significant effects on the specific surface areas and pore size distribution of
the catalysts.
0
0.01
0.02
0.03
0.04
0.05
0 100 200 300 400Pore diameter ( Å )
Por
e vo
lum
e ( c
m3 /g
cat )
0.02Ni0.03Co
0.04Ni0.05Co
0.06Ni0.09Co
0.18Ni0.16Co
A
0
0.05
0.1
0.15
0.2
0 100 200 300 400
Pore diameter ( Å )
Cum
ulat
ive
pore
vol
ume
( cm
3 /gca
t ) 0.02Ni0.03Co
0.04Ni0.05Co
0.06Ni0.09Co
0.18Ni0.16Co
B
Fig. 4.10 Pore size distribution of the catalysts with different Ni-Co content
4.3.2.3 Metal dispersion and particle size
The metallic surface area and metal dispersion of the samples obtained through
CO-chemisorption are tabulated in Table 4.3. The metal dispersion was calculated based
on total Ni-Co content in the catalysts. Table 4.3 clearly shows that the metal dispersion
increases with the decrease of Ni-Co content following the order: 0.03Ni0.02Co >
0.04Ni0.05Co > 0.06Ni0.09Co > 0.18Ni0.16Co. The metallic surface area increases with
Ni-Co content, but it abruptly drops for 0.18Ni0.16Co.

101
Table 4.3 Metallic surface area and metal dispersion of Ni-Co bimetallic catalysts with different Ni-Co content
Sample Metallic Area
( m2/g )
Metal Dispersion
( % )
0.02Ni0.03Co 1.7 9.5
0.04Ni0.05Co 2.9 8.8
0.06Ni0.09Co 4.1 7.5
0.18Ni0.16Co 1.7 1.3
The metal particle morphology and size distribution are investigated using TEM
and are shown in Fig. 4.11. The TEM pictures show that 0.18Ni0.16Co has the most
contrasted metal particles with around 20 % particles larger than 10 nm (Fig. 4.11A). As
the metal content was reduced, the amount of the large metal particles decreased
significantly. When the Ni-Co content was reduced further to 0.04Ni0.05Co and
0.02Ni0.03Co, all particle sizes were smaller than 10 nm. Also, the portion of the smaller
particle was increased with the decrease in the Ni-Co content. From 0.18Ni0.16Co to
0.02Ni0.03Co, the portion of particle between 1 and 5 nm was increased from 52 % to 76
%. Another observation was that the boundary between metals and support in cases of
0.04Ni0.05Co and 0.02Ni0.03Co became indistinct in comparison with the higher Ni-Co
content catalysts as one can see from Fig. 4.11

102
0
10
20
30
40
50
60
1-5 5-10 10-15 15-20 20-25d ( nm )
Fenq
uenc
y ( %
)
0
10
20
30
40
50
60
1-5 5-10 10-15 15-20 20-25d ( nm )
Fenq
uenc
y ( %
)
010203040506070
1-5 5-10 10-15 15-20 20-25d ( nm )
Fenq
uenc
y ( %
)
01020304050607080
1-5 5-10 10-15 15-20 20-25d ( nm )
Fenq
uenc
y ( %
)
Fig. 4.11 TEM image of Ni-Co catalysts with different metal content and particle size
B
50 nm
50 nm
A: 0.18Ni0.16Co
B: 0.06Ni0.09Co
C: 0.04Ni0.05Co
D: 0.02Ni0.03Co

103
4.3.2.4 CO2 reforming of CH4 and carbon formation
The catalysts were tested at 750 oC, 1 atm, and 180,000 mL/gcat-h. Fig. 12A shows
the CH4 disappearance rate versus time-on-stream over the bimetallic catalysts with
different Ni-Co content. Fig. 12B presents the same results in terms of CH4 conversion. At
the reaction conditions, the equilibrium CH4 conversion is 94.5 %. Both the activity and
stability followed the order: 0.02Ni0.03Co > 0.04Ni0.05Co > 0.06Ni0.09Co >
0.18Ni0.16Co. The apparent deactivation was not observed for 0.02Ni0.03Co during the
period of 250 h. The catalyst maintained a stable CH4 reaction rate at 0.666 mmol/gcat-s.
For catalyst 0.04Ni0.05Co, the activity increased gradually with time in the first 50 h and
then remained with a stable CH4 reaction rate which was 0.621 mmol/gcat-s. The higher
reaction rate at the initial period was reported and was ascribed to the formation of new
active sites when the catalyst was exposed to the reaction mixture (Ruckenstein and Hu
1996, Zhang et al., 1996; Tsopiroaro and Verykios, 2001). However, apparent deactivation
was observed over catalysts 0.06Ni0.09Co and 0.18Ni0.16Co. During the 250 h time-on-
stream, the reaction rates of CH4 over 0.06Ni0.09Co and 0.18Ni0.16Co has dropped from
0.629 mmol/gcat-s to 0.481 mmol/gcat-s and from 0.516 mmol/gcat-s to 0.376 mmol/gcat-s,
respectively.
Table 4.4 gives the amount of carbon deposit on the spent catalysts which have
undergone 250 h time-on-stream. The results were obtained using thermal gravimetric
analysis (TG/TGA). Combined with Fig. 4.12, it is clear that 0.02Ni0.03Co and
0.04Ni0.05Co, which showed higher activity and stability, had no detectable carbon

104
formation and no deactivation. However, 0.06Ni0.09Co and 0.18Ni0.16Co which showed
relatively low activity and significant deactivation had carbon formation up to 0.30 and
0.46 gc/gcat, respectively.
0.0
0.2
0.4
0.6
0.8
0 50 100 150 200 250Time-on-stream ( h )
-rC
H4 (
mm
ol/g
cat-s
)
0.02Ni0.03Co 0.04Ni0.05Co 0.06Ni0.09Co 0.18Ni0.16Co
A
0
20
40
60
80
100
0 50 100 150 200 250Time-on-stream ( h )
CH 4
con
vers
ion
( % )
0.02Ni0.03Co 0.04Ni0.05Co 0.06Ni0.09Co 0.18Ni0.16Co
B
Fig. 4.12 Activity as a function of TOS of catalysts with different Ni-Co content

105
Table 4.4 Carbon formation of the bimetallic catalysts with different Ni-Co contents Sample Carbon deposit at 250 h ( gc/gcat )
0.02Ni0.03Co 0
0.04Ni0.05Co 0
0.06Ni0.09Co 0.300
0.18Ni0.16Co 0.446
The thermo-gravimetric (TG) and differential thermo-gravimetric (DTG) profiles
of the temperature programmed oxidation (TPO) in air of the spent catalysts are shown in
Fig. 4.13 The slight weight loss over 0.02Ni0.03Co and 0.04Ni0.05Co occurring at around
100 oC (Fig. 4.13A) was probably resulted from the evaporation of moisture. However, the
carbon deposits over 0.06Ni0.09Co and 0.18Ni0.16Co were oxidized at around 420-650
oC (Fig. 4.13A and 4.13B). Further TEM analysis revealed no detectable carbon deposits
over 0.02Ni0.03Co and 0.04Ni0.05Co (Fig. 4.14C and 4.14D), but clear filamentous
carbon in the form of carbon nanotubes was found over spent 0.06Ni0.09Co and
0.18Ni0.16Co catalysts (Fig. 4.14A and 4.14B). The catalyst testing and carbon analysis
indicated that catalyst with high Ni-Co content is more susceptible to carbon formation
and deactivation.

106
0 100 200 300 400 500 600 700 800 900
Temperature ( oC )
TG (
a. u
. )0.04Ni0.05Co
0.02Ni0.03Co
0.06Ni0.09Co
0.16Ni0.18Co
A
0 100 200 300 400 500 600 700 800 900
Temperature ( oC )
DTG
( u.
a. )
0.02Ni0.03Co
0.16Ni0.18Co
0.06Ni0.09Co
0.04Ni0.05Co
B
Fig. 4.13 TG (A) and DTG (B) profiles of TPO in air for the catalysts after 250 h reaction at 750 oC, 1 atm, GHSV=180,000 mL/gcat-h, and CH4/CO2/N2=1/1/1

107
Fig. 4.14 TEM images of different Ni-Co content catalysts after 250 h TOS
A: 0.18Ni0.16Co
100 nm
30 nm
100 nm
B: 0.06Ni0.09Co
30 nm
C: 0.04Ni0.05Co
D: 0.02Ni0.03Co

108
4.3.2.5 Effects of Ni-Co content on properties and activity of Ni-Co bimetallic catalysts for CO2 reforming of CH4
N2-physisorption has revealed that 0.18Ni0.16Co has lower surface area and fewer
small pores than other catalysts with lower Ni-Co content (Table 4.2 and Fig. 4.9). This
probably can be attributed to the relative less Al element in the sample, which is supposed
to facilitate high surface area. On the other hand, less Mg ratio in this catalyst can also
result in a lower surface area due to the weakening in its stabilizing role in the high-
temperature calcination process. Contrarily, 0.02Ni0.03Co with higher Al-Mg content has
a higher surface area and more small pores (Table 4.2 and Fig.4.9). The activity of the
catalysts in terms of CH4 reaction rate follows the same order as their surface area and the
amount of small pores: 0.02Ni0.03Co > 0.04Ni0.05Co > 0.06Ni0.09Co > 0.18Ni0.16Co.
It is indicated that the catalysts with high BET surface area can provide large contact area
for the reactants, thus resulting in high reaction activity. However, the active site on the
catalysts must be metals not metal oxides, which has been proved by the observation that
the precipitates won’t have any activity until they are reduced in H2-contaning gas.
Therefore, catalyst activity may depend even more on the metallic surface area rather than
the BET surface. Nonetheless, comparing data in Table 4.3 and Fig. 4.12, the initial
activity of the catalysts doesn’t seem to have clear connections with metallic area. It
appears that the number of active sites which determines the catalyst activity is not
proportional to the metallic surface area.
0.18Ni0.16Co, the highest Ni-Co content catalyst, has the lowest initial activity.

109
The lower-temperature peak in the TPR profiles (Fig. 4.8) indicates that this sample
possessed weaker support metal interaction (Wang et al., 2003). The estimation of H2
consumption from the peak area for this catalyst (Fig. 4.8) suggests that the extent of
reduction of Ni and Co was high. But 0.18Ni0.16Co had the lowest metallic surface area.
Sintering most likely happened to this high metal content, weak metal-support interaction
sample during the high-temperature reduction process (Bond 2004). The sintering led to
the loss of both surface area and metallic area, and hence the number of active sites
became less. Wang et al. (2003) attributed the low metal dispersion to the formation of the
free bulk-like metal oxide phase in the high metal content catalyst. The mobility of such a
phase during reduction facilitates sintering (Xu et al., 2001). On the other hand, according
to Norval et al. (1980), the number of active centres is usually less than the total number
of surface metallic atoms. A good metal dispersion will help generate more active sites on
the catalyst surface, even though sometimes the metal loading and metallic surface is
lower. Table 4.3 clearly shows that the metal dispersion was better when the Ni-Co
content was lower and correspondingly, Fig. 4.12 shows the catalyst activity followed the
same trend. With lower metal content, the spinel-like phases and solid solutions can
produce a highly dispersed active phase and a large active surface area when the catalyst is
prepared at high calcined temperature (Wang et al., 2003). Also, the particle size
distribution indicates that the portion of smaller particle increases with decrease in Ni-Co
content. It has been reported that sulfur blockage can dramatically reduce the
concentration of large ensembles resulting in carbon-free steam reforming of methane

110
without sacrifice catalyst activity (Rostrup-Nielsen, 1984; Andersen et al., 1987; Bengaard
et al., 2002). This provide another evidence that small particle size facilitates reforming
reaction but suppressing carbon formation. One can see that the surface area, metal
dispersion, the percentage of smaller-than-5 nm particles, and the activity of the catalysts
follow the same order: 0.02Ni0.03Co > 0.04Ni0.05Co > 0.06Ni0.09Co > 0.18Ni0.16Co.
Therefore, the high activity of Ni-Co bimetallic catalysts can be attributed to their high
surface area, high metal dispersion, and small particle size, which might result from low
Ni-Co content and the high-temperature calcination process.
4.3.2.6 Carbon formation and stability of the Ni-Co bimetallic catalysts for CO2 reforming of CH4
The 250 h time-on-stream evaluation also clearly showed that the catalysts with
lower Ni-Co content had better stability (Fig. 4.12). 0.18Ni0.16Co and 0.06Ni0.09Co
suffered obvious activity loss of 27 % and 24 % respectively (calculation was based on the
difference between initial and final reaction rate of methane during the 250 h period).
However, 0.04Ni0.05Ni and 0.02Ni0.03Co did not experience deactivation (the decrease
in CH4 reaction rate was less than 1 % within 250 h). TG/DTG analysis for spent catalysts
indicated that the occurrence of carbon formation was only observed for 0.18Ni0.16Co
and 0.06Ni0.09Co catalysts. This suggests that carbon formation is most likely the major
reason for catalyst deactivation. Theoretically, carbon deposition may result from the
following reactions:
24 2HCCH +↔ ∆H = 74.87 kJ (4.1)
111
CCO2CO 2 +↔ ∆H = -172.46 kJ (4.2)
OHCHCO 22 +↔+ ∆H = -131.30 kJ (4.3)
At high reaction temperatures, reaction (4.1) is thermodynamically favored, but
reaction (4.2) and (4.3) are not. In contrast, the reversibility of reactions (4.2) and (4.3)
may facilitate carbon removal processes through gasification of coke at high temperatures.
Two kinds of carbons are most often observed in CO2 reforming of CH4 (Goula et al.,
1996; Quincoces et al., 2001; Ito et al., 1999; Montoya et al., 2000; Frusteri et al., 2002):
filamentous (whisker-like) carbon produced by adsorbed carbon atoms derived mainly
from methane decomposition; and encapsulating hydrocarbon films (shell-like) formed by
polymerization. TEM (Fig. 4.14) analysis showed that filamentous carbon was formed on
0.18Ni0.16Co and 0.06Ni0.09Co, but no encapsulating carbon was observed, indicating
that the CH4 decomposition might provide the major carbon species for carbon formation
on 0.18Ni0.16Co and 0.06Ni0.09Co catalysts. It is believed that the CH4 decomposition is
the initial step of reforming reaction, resulting from the dissociative adsorption of CH4 on
the surface of metal (Eq. 4.4) (Hickman and Schmidt, 1993).
CH4 + M → M-C + 2H2 (4.4)
where M represents the metal particle of catalysts. The carbon species is present as M-C
or carbide-like species which contains no C-H bond (Chang et al., 2000; Verykios, 2003).
Carbon formation occurs when the formation rate of carbon species is higher than its
removal rate by reacting with oxygen species. The efficiency of removal of carbon species
may depend on the activation of CO2 (Bitter et al., 1999; Nagaoka et al., 2001). Based on

112
Tsipouriari and Verykios et al. (2001), the activation of CO2 occurs on the support (Eq. 4.5)
and a primary step of carbon species removal can be expressed by Eq. 4.6.
CO2 + S → S-CO2 (4.5)
S-CO2 + M-C → 2CO + M + S (4.6)
where S represents the surface of the support.
Higher CH4 conversion on 0.04Ni0.05Co and 0.02Ni0.03Co catalysts than on
0.18Ni0.16Co and 0.06Ni0.09Co should suggest higher CH4 dissociation rate and thus
higher carbon formation rate on the catalyst of lower Ni-Co contents. However, TG/DTG
and TEM analysis did not detect carbon formation on 0.04Ni0.05Co and 0.02Ni0.03Co
catalysts. This implies that the removal rate of carbon species by reaction (4.6) is efficient
enough on 0.04Ni0.05Co and 0.02Ni0.03Co. Segner et al. (1984) reported that the
activation of CO2 is structure sensitive, small particle size prompting its activation. Also,
Rostrup-Nielsen (1991) reported that large Ni particle favors carbon formation. Catalyst
testing (Fig. 4.12) and particle size distribution (Fig. 4.11) showed that the catalysts with
large portion of particles greater than 10 nm lost significant activity but no deactivation
and carbon formation occurred over catalysts without particles larger than 10 nm. It
indicates that an particle size of 10 nm is critical to inhibiting carbon formation over Ni-
Co bimetallic catalysts for CO2 reforming of CH4. Therefore, the efficient removal of
carbon species or carbon resistance of 0.04Ni0.05Co and 0.02Ni0.03Co might be ascribed
to its higher metal dispersion and smaller particle size (Figs. 4.11C and 4.11D).
A conceptual model, shown in Fig. 4.15, is used to explain why the catalyst with

113
lower Ni-Co content has better resistance to carbon formation during the CO2 reforming
of CH4 reaction.
Fig. 4.15 Concept model of carbon removal and carbon formation over the Ni-Co bimetallic catalyst for CO2 reforming of CH4 A: Catalyst with metal particles larger than 20 nm; B: Catalyst with metal particles between 10 and 20 nm; C: Catalyst with metal particles smaller than 10 nm - Carbon species derived from the dissociative adsorption of CH4 on the surface of metal particle (M) - Activated CO2 on the surface of support (S) - Removal reaction of carbon species: S-CO2 + M-C → 2CO + S + M
On a large metal particle, for example > 20 nm, the carbon species formed near the
periphery of the metal particle is easy to react with activated CO2 to form CO (Fig. 4.16A).
The carbon species far away from the periphery of the metal particle tend to form carbon
since they cannot reach the activated CO2. With the increase in time-on-stream, carbon
deposition will accumulate on the large particles which results in activity loss. However,
catalyst activity will tend to be stable and carbon formation rate will significantly decrease
when the larger particles have been covered with carbon. The activity and carbon
formation evolution behavior as a function of time-on-stream during the 2000 h testing
using 0.06Ni0.09Co catalyst supports this explanation (Zhang et al., 2007). With the
Metal Support
BA C

114
decrease in metal particle size by lowering the Ni-Co content, the portion of carbon
species closer to particle periphery (edge active sites) increases, resulting in carbon being
reacted and forming CO, and hence less carbon deposition on the catalysts surface (Fig.
4.15B). When the metal particle is smaller than the critical size of 10 nm, which is
obtained from the particle size distribution (Figs. 4.11B and 4.11C) and carbon analysis of
spent catalysts (Table 4.4, Fig.4.13, and Fig. 4.14), almost all the carbon species are
formed in the vicinity of the activated CO2; the former is easily reacted with the latter,
allowing all the carbon to form CO. Therefore, the carbon formation on the catalyst
surface is eliminated (Fig. 4.15C).
4.4 CONCLUSIONS
Ni/Co and Co/Ni ratios investigation showed that high surface area and high
activity for CO2 reforming of CH4 are those Ni-Co/AlMgOx catalysts with a Ni/Co or
Co/Ni ratio between 0.6 and 1.5. Adjusting the Ni-Co content of the bimetallic catalysts,
whose Ni/Co or Co/Ni ratio is between 0.6 and 1.5, is able to change the metal dispersion
and metal particle size. The better metal dispersion and smaller metal particle are obtained
at lower Ni-Co content. Small metal particles are crucial to the suppression of carbon
deposition. Therefore, the Ni-Co bimetallic catalyst with close unity Ni/Co ratio and lower
total metal content shows higher activity and greater stability. The metal particle size on
0.04Ni0.05Co and 0.02Ni0.03Co are all smaller than 10 nm, and thus the carbon
formation over the two is undectable for the reaction of CO2 reforming of CH4.
115
5 EFFECTS OF THE CATALYST CALCINATION TEMPERATURES ON Ni-Co/AlMgOx
A paper based on this chapter was prepared for submission to Applied Catalysis A:
General: Zhang, J., Wang, H., Dalai, A.K., “Effects of calcinations temperature on the
properties and performances of Ni-Co bimetallic catalysts for CO2 reforming of CH4”,
submitted to Appl. Catal. A.
CONTRIBUTION OF Ph.D. CANADIDATE
Experiments were planned and performed by Jianguo Zhang. Hui Wang and Ajay
K. Dalai provided guidance in planning the experiment. The submitted manuscript was
written by Jianguo Zhang, while Hui Wang and Ajay K. Dalai provided comments and
suggestions for revision.
CONTRIBUTION OF THIS CHAPTER TO THE OVERALL STUDY
This paper investigated the effects of calcination temperatures on the Ni-
Co/AlMgOx bimetallic catalyt for CO2 reforming of CH4. The work involves the catalyst
preparation, catalyst testing, and catalyst characterization. It was found that the calcination
temperatures can significantly affect catalyst phase sturtures and surface properties, thus
can have significant effects on catalyst activity, stability, and carbon formation for CO2
reforming of CH4.

116
ABSTRACT
In the previous study, it has been found that Ni/Co ratio and Ni-Co content have
significant effects on catalyst properties and performance. Carbon free operation was
achieved for CO2 reforming of CH4 using Ni-Co/AlMgOx catalyst through optimizing Ni
and Co loading. This Chapter focuses on the effects of calcination temperatures on the
0.06Ni0.09Co catalysts as one critical procedure to optimize the catalyst preparation. The
specific surface area, pore distribution, particle size, phase structure, metal-support
interaction, and reducibility of the 0.06Ni0.09Co catalyst were characterized using BET,
TEM, XRD, and TPR equipment. Calcination effects on the performance of catalysts were
tested for CO2 reforming of CH4 at 750 oC, 1 atm, and CH4/CO2/N2=1/1/1. Carbon
deposition over the spent catalyst was analyzed using TG/DTG and TEM. It was found
that with the increase in calcination temperature from 400 oC to 1100 oC, the interaction
between metals and catalyst support became stronger which resulted in the difficulty of
reduction and growth of particle size. At lower temperatures such as 400 oC, the metal
component was dominated by mixed Ni and Co oxides like NiO, CoO, and Co3O4, etc.,
which possess weak metal-support interaction. At high temperatures such as 900 oC, the
active component existed in the form of solid solution and spinels, which are difficult to
reduce and have strong metal-support interaction (SMSI). At a calcination temperature of
1100oC, the catalyst lost its surface area and pores but particle size increased significantly.
Larger particle favored carbon formation and compromised it stability for CO2 reforming

117
CH4. Further testing was conducted on 0.04Ni0.05Co at 750 oC, 1 atm, CH4/CO2/N2
=1/1/0, and GHSV 750,000 mL/gcat-h. A calcination temperature between 700-900 oC was
recommended for the Ni-Co/AlMgOx bimetallic catalysts.
5.1 INTRODUCTION
The thermal treatment of calcination has major effects on the nature of active sites.
For example, high-temperature calcination enhances the metal-support interaction (Chen
and Ren, 1994, Bhattacharyya and Chang, 1994) but it also favors the growth of particle
size (Praserthdam et al., 2004) and makes the reduction of catalyst difficult (Bradford and
Vannice, 1999). Wang et al. (1998) observed that the phase transformation of Ni catalysts
supported on γ-Al2O3 and the formation of spinel nickel aluminate (NiAl2O4) during
calcination, which makes the reduction of catalyst difficult. Wang et al. (1998) also
reported that the low activity of Ni/MgO for CO2 reforming of CH4 can be ascribed to its
low reducibility due to the formation of solid solution during the calcination process. Thus,
when a catalyst is being developed, proper selection of calcination parameters – especially
calcination temperature – is crucial to the achievement of desired catalyst properties and
performance. This work investigates the effects of calcination conditions on catalyst
properties and catalytic performance of Ni-Co/AlMgOx bimetallic catalysts for CO2
reforming of CH4.

118
5.2 EXPERIMENTAL
5.2.1 Catalyst preparation
As described in Chapter 4, 0.06Ni0.09Co and 0.04Ni0.05Co catalysts were
prepared. They were calcinated at various temperatures in this chapter and the resulting
catalyst subtypes were designated 0.06Ni0.09Co-400, 0.06N0.09iCo-600, 0.06Ni0.09Co-
900, 0.06Ni0.09Co-1100, and 0.04Ni0.05Co-500, 0.04Ni0.05Co-600, 0.04Ni0.05Co-700,
0.04Ni0.05Co-800, 0.04Ni0.05Co-900, and 0.04Ni0.05Co-1000, in accordance with Ni-
Co content and calcination temperatures.
5.2.2 Catalyst Characterization and testing
BET, CO-Chemisportion, TPR, TG/DTA, TEM, XRD technologies were used to
characterizated the catalysts. And the bench-top quartz reactor was used to test the
catalysts. Detailed description for catalyst testing and characterization can be found in
previous chapters.

119
5.3 EFFECTS OF CALCINATION ON 0.06Ni0.09Co CATALYST
5.3.1 Catalyst characterization
5.3.1.1 N2-physisorption
N2-physisorption was employed to characterize the surface area, pore volume, and
average pore diameter of catalysts calcined at various temperatures. The results are
presented in Table 5.1. The increase in calcination temperature from 400 to 1100 oC
clearly indicated a dramatic decrease of BET surface area from 198 to 9 m2/g. The pore
volume decreased from 0.278 to 0.029 cm3/g and the average pore size increased from 5.5
nm to 13.5 nm. Fig.5.1 depicts the pore area and pore volume distribution of the catalysts
calcined at various temperatures. As temperature increased, the surface area and pore
volume corresponding to the pores with diameter between 2 nm and 4 nm decreased. It
indicated that a significant portion of pores with the diameter of 2-4 nm collapsed at
higher temperatures. In the case of 0.06Ni0.09Co-1100, the pore area and pore volume
from pores with diameter of 2-4 nm were hardly measurable.
Table 5.1 Surface area, pore volume, and average pore diameter of 0.06Ni0.09Co catalysts calcined at various temperatures
Catalysts Calcination Temperature
( oC )
BET surface area
( m2/g )
Pore Volume ( cm3/g )
Average pore diameter
( nm )
0.06Ni0.09Co-400 400 198 0.278 5.5
0.06Ni0.09Co-600 600 174 0.309 6.5
0.06Ni0.09Co-900 900 54 0.158 10.5
0.06Ni0.09Co-1100 1100 9 0.029 13.5

120
0
20
40
60
80
100
120
140
0 100 200 300 400 500
Pore Diameter ( Ǻ )
Pore
Are
a ( m
2 /g ) 0.06Ni0.09Co-400
0.06Ni0.09Co-6000.06Ni0.09Co-9000.06Ni0.09Co-1100
0
0.02
0.04
0.06
0.08
0.1
0.12
0.14
0 100 200 300 400 500
Pore Diameter ( Ǻ )
Pore
Vol
ume
( m3 /g
) 0.06Ni0.09Co-4000.06Ni0.09Co-6000.06Ni0.09Co-9000.06Ni0.09Co-1100
Fig. 5.1 Pore area and pore volume distribution of 0.06Ni0.09Co bimetallic catalysts calcined at various temperatures

121
5.3.1.2 X-ray diffraction (XRD)
Fig. 5.2 shows XRD diffractogram of 0.06Ni0.09Co catalysts calcinated at various
temperatures.
20 30 40 50 60 70 80
2-Theta
Inte
nsity
( a.
u. )
MgAl2O4 Spinel MgO Periclase Al2O3
0.06Ni0.09Co-1100
0.06Ni0.09Co-900
0.06Ni0.09Co-600
0.06Ni0.09Co-400
Fig. 5.2 XRD diffractogram of 0.06Ni0.09Co catalysts calcinated at variou temperatures
When calcination temperature was below 600 oC, small diffraction peaks of γ-
Al2O3 were observed. With the increase in calcinations temperature, γ-Al2O3 disappeared
as shown by the catalyst 0.06Ni0.09Co-900 and 0.06Ni0.09Co-1100, while diffraction
peaks of MgAl2O4 spinel and MgO periclase appeared. The appearance of MgAl2O4 spinel
indicated that the phase transformation took place at high-temperatures through solid-state
reaction between MgO and Al2O3. The presence of MgO periclase can be attributed to the

122
transformation from the remaining extra MgO in the catalysts at higher temperature. The
increase in calcination temperature from 900 to 1100 oC also resulted in larger crystals as
shown by the changes of peak sharpness. However, it is of interest to note that there was
no Ni or Co diffraction peak observed. One possibility is that the relative low amount of
metals were well dispersed throughout the catalyst, which may be below the detection
limit of the technique. Another possibility is that Ni2+, Co2+, Mg2+, and Al3+ belong to the
same lattice according to Tichit et al. (1997; 1999; 2000). The formation of Ni2+-Al3+,
Co2+-Al3+, and Mg2+-Al3+ solid solutions of spinel-type and of the stoichiometric NiAl2O4,
CoAl2O4, and MgAl2O4 spinel phases (Tichit et al., 1997; 1999; 2000) at high calcinations
temperatures. The Ni2+-Co3+ spinel-type solid solution and NiCo2O4 spinel can also be
formed at high calcination temperatures (Petrov and Will 1987). These spinel-type solid
solution phases and spinel phases in the catalysts are indistinguishable by XRD (Fig. 5.2)
due to their similarity.
5.3.1.3 Temperature-programmed reduction (TPR)
The XRD analysis revealed the formation of MgAl2O4 spinel and MgO periclase,
but did not provide information on active components such as Ni and Co. The active
components (Ni and Co) were analysed by TPR for catalysts calcined at various
temperatures, as shown in Fig. 5.3. From the TPR profile of 0.06Ni0.09Co-400, it can be
seen that there were two broad reduction peaks ranging from 280-400 oC and 650-900 oC,
respectively. The broad unresolved peaks with shoulders indicated the existence of several
different species. The low temperature reduction peak can be ascribed to the mixed

123
reducible Ni and Co oxides, which may contain NiO, CoO, and Co3O4 (Perez-Lopez et al.,
2006; Ribet et al., 1999). The high temperature reduction peak showed the evidence of Ni-
and Co-containing spinel phases such as NiAl2O4 and CoAl2O4 in the catalysts (Perez-
Lopez et al., 2006; Ribet et al., 1999), which were formed through the solid-state reaction
between active metal species and support phases. The Ni and Co species in different
reduction temperature ranges clearly demonstrated their different degree of interaction
with the support (Lemonidou and Vasalos 2002). The shifting of reduction toward higher
temperatures, as shown by the TPR profile of 0.06Ni0.09Co-600, -900, and -1100, was
due to the increase in metal support interactions (Richardson et al., 1996). Also
interestingly, with the increase in calcination temperature, the low-temperature reduction
phases disappeared (see the profile of 0.06Ni0.09Co-900 and 0.06Ni0.09Co-1100 in Fig.
5.3). It can be attributed to the phase transformation of mixed Ni and Co oxides to Ni and
Co-containing solid solutions of spinel type and stoichometric NiAl2O4 and CoAl2O4
spinels (Ribet et al 1999, Perez-Lopez et al 2006).

124
200 400 600 800 1000 1200
Temperature ( oC )
Inte
nsity
( a.
u. )
0.06Ni0.09Co-1100
0.06Ni0.09Co-900
0.06Ni0.09Co-6000.06Ni0.09Co-400
Fig. 5.3 TPR profile of 0.06Ni0.09Co catalysts calcined at various temperatures
5.3.1.4 Transmission electron microscopy (TEM)
The morphology of catalysts was analyzed using TEM technique. As shown in Fig.
5.4, it is clear that the particle size was growing with the increase in calcination
temperatures. The support phase and metals were dispersed evenly in the sample when
calcinated at 400 oC (Fig.5.4 A). From the TEM images of catalyst 0.06Ni0.09Co-600 and
0.06Ni0.09Co-900, it can be seen that the metal particles aggregated to larger ones in
comparison with those in 0.06Ni0.09Co-400. Also, the support showed to melt together
decorated with the aggregated metals, which is very clear in the TEM image of
0.06Ni0.09Co-1100 (Fig. 5.4D). This may be attributed to the solid-state reaction between
different species at higher temperatures.

125
Fig. 5.4 TEM image of 0.06Ni0.09Co catalyst calcinated at various temperatures
A: 0.06Ni0.09Co-400
C: 0.06Ni0.09Co-900 D: 0.06Ni0.09Co-1100
B: 0.06Ni0.09Co-600

126
5.3.2 Catalyst testing
5.3.2.1 Activity for CO2 reforming of CH4 of 0.06Ni0.09Co
The catalytic activity of 0.06Ni0.09Co samples was tested at 750 oC, 1 atm, and
various gas hourly space velocity (GHSV) in terms of CH4 reaction rate. Fig. 5.5 depicts
the CH4 reaction rate as a function of GHSV over the four catalysts calcined at four
different temperatures.
0.00
0.50
1.00
1.50
2.00
0 100000 200000 300000 400000 500000 600000GHSV ( ml/gcat-h )
-r ( m
mol
/gca
t-h)
0.06Ni0.09Co-4000.06Ni0.09Co-6000.06Ni0.09Co-9000.06Ni0.09Co-1100
Fig. 5.5 GHSV effects on the reaction rate of CH4 over 0.06Ni0.09Co catalysts calcined at various temperatures for CO2 reforming of CH4 at 750oC, 1atm, and N2/CH4/CO2=1/1/1
At a GHSV less than 200,000 mL/gcat-h, no clear differences were observed in the
CH4 reaction rate among the four catalysts. As the GHSV increased to the range between
200,000 and 360,000 mL/gcat-h, the CH4 reaction rate over 0.06Ni0.09Co-600 and
0.06Ni0.09Co-900 increased rapidly. The CH4 reaction rate over different catalysts in this

127
GHSV range followed the order: 0.06Ni0.09Co-900~0.06Ni0.09Co-600>0.06Ni0.09Co-
1100~0.06Ni0.09Co-400. With the further increase in GHSV, the CH4 reaction rates were
increasing. From the test shown in Fig. 5.5, it can be seen that the activity of the catalysts
followed the order: 0.06Ni0.09Co-900~0.06Ni0.09Co-600>0.06Ni0.09Co-1100>
0.06Ni0.09Co-400. The 0.06Ni0.09Co-900 and 0.06Ni0.09Co-600 showed comparable
activity for CO2 reforming of CH4. The 0.06Ni0.09Co-400 had the lowest activity for CO2
reforming of CH4 in comparison with 0.06Ni0.09Co-600, -900, and -1100.
5.3.2.2 Stability of 0.06Ni0.09Co calcined at different temperatures
The effect of calcination temperature on catalyst stability for CO2 reforming of
CH4 was investigated through testing the catalytic activity as a function of time-on-stream.
The results are shown in Fig. 5.6.
0.35
0.37
0.39
0.41
0.43
0.45
0 10 20 30 40 50Time-on-stream ( h )
-r ( m
mol
/gca
t-h)
0.06Ni0.09Co-4000.06Ni0.09Co-6000.06Ni0.09Co-9000.06Ni0.09Co-1100
Fig. 5.6 The stability of 0.06Ni0.09Co catalysts calcined at different temperatures for CO2 reforming of CH4 at 750 oC, 1 atm, 110,000 mL/gcat-h, and CH4/CO2/N2=1/1/1

128
From Fig. 5.6, it can be seen that at the GHSV of 110,000 ml/gcat-h,
0.06Ni0.09Co-400, -600, and -900 exhibited very similar activity and stability for the 50 h
when the reforming reactions were conducted at 750 oC and 1 atm, while 0.06Ni0.09Co-
1100 showed slightly lower activity but still good stability with a activity decay less than
1% (calculation is based on the difference between initial and final reaction rate of CH4).
The results in Fig. 5.6 indicate that the stability differences of the catalysts for CO2
reforming of CH4 reforming can not be evaluated clearly at the reaction conditions. The
stability was further tested at the GHSV of 365,000 mL/gcat-h at 750 oC and 1 atm in order
to get a clear picture about the calcination temperature effects on catalyst stability. Also,
the time-on-stream was extended to 100 h as shown in Fig. 5.7.
0.00
0.20
0.40
0.60
0.80
1.00
1.20
1.40
0 10 20 30 40 50 60 70 80 90 100Time-on-stream ( h )
-r ( m
mol
/gca
t-h)
0.06Ni0.09Co-4000.06Ni0.09Co-6000.06Ni0.09Co-9000.06Ni0.09Co-1100
Fig. 5.7 The stability of Ni-Co catalysts calcined at different temperatures for CO2 reforming of CH4 at 750oC, 1 atm, 365,000 mL/gcat-h, and CH4/CO2/N2=1/1/1

129
From the figure it is clear that 0.06Ni0.09Co-900 showed the highest activity and
stability in the 100 h time-on-stream, with no significant drop in CH4 reaction rate (5 %
activity decay). 0.06Ni0.09Co-600 had the same initial activity as did 0.06Ni0.09Co-900,
but at the end of 100 h, the reaction rate of CH4 dropped from 1.193 mmol/gcat-s to 0.903
mmol/gcat-s (24 % activity deacay). The reaction rate of CH4 over catalyst 0.06Ni0.09Co-
1100 decreased from1.081 mmol/gcat-s to 0.728 mmol/gcat-s (33 % activity decay).
Interestingly, 0.06Ni0.09Co-400 showed a relatively low but stable activity during the 100
h time-on-stream with the initial and final CH4 rate of 1.020 and 0.950 mmol/gcat-s (7 %
activity decay).
5.3.2.3 Carbon deposition over 0.06Ni0.09Co calcined at different temperatures
TG/DTG was used to measure the average carbon deposition rate and to identify
the carbon species for the catalysts after the reaction. The average carbon deposition rate
was calculated by the amount of carbon measured using TG divided by the weight of
catalyst and the reaction time, while the different carbon species was identified through
DTG profiles. The results are listed in Table 5.2.
Table 5.2 The carbon deposition over 0.06Ni0.09Co catalysts
Catalyst Calcination Temperature
( oC)
Reaction Temperature
( oC )
GHSV
(ml/gcat-h)
TOS
( h )
Average Carbon Deposition Rate ( mgcarbon/gcat-h )
0.06Ni0.09Co -400
400 750 110,000 365,000
50 100
2.460 9.616
0.06Ni0.09Co -600
600 750 110,000 365,000
50 100
6.335 9.929
0.06Ni0.09Co -900
900 750 110,000 365,000
50 100
1.649 2.305
0.06Ni0.09Co -1100
1,100 750 110,000 365,000
50 100
9.238 12.908

130
From the table, it is clear that the average carbon deposition rate follows the order:
0.06Ni0.09Co-1100>0.06Ni0.09Co-600>0.06Ni0.09Co-400>0.06Ni0.09Co-900 at
identical GHSV and time-on-stream conditions. It is noteworthy that when calination
temperature increased from 600 to 900 oC, the average carbon deposition rate decreased
dramatically from 6.335 mgcarbon/gcat-h to 1.649 gcarbon/gcat-h at 110,000 mL/gcat-h, and
from 9.929 mgcarbon/gcat-h to 2.305 mgcarbon/gcat-h at a 365,000 mL/gcat-h. However, when
calcination increased continuously from 900 oC to 1100 oC, the average carbon deposition
rate increased nearly 5 times more rapidly, to 9.238 mgcarbon/gcat-h and 12.908 mgcarbon/gcat-
h respectively. It was found that the average carbon deposition rate followed the same
order as the extent of catalytic activity decay (described in previous section).
The DTG profiles of temperature programmed oxidation in air for the spent
catalysts were used to identify different carbon deposits as shown in Fig.5.8. For all
samples two domains exist for the oxidation of carbon deposits, in the low-temperature
(<550 oC, LT) and high temperature (>550 oC, HT) ranges. Also, they are featured by
broad peaks, which provide evidence of the oxidation of various carbon species in each
domain. It can be seen that most of carbon deposits were in LT range and only small
portion was in the HT range.

131
-100
0
100
200
300
400
500
600
700
0 100 200 300 400 500 600 700 800 900
Temperature ( oC )
DTG
( ug
/min
)0.06Ni0.09Co-1100
0.06Ni0.09Co-600
0.06Ni0.09Co-400
0.06Ni0.09Co-900
Fig. 5.8 Carbon deposition analysis by TG/DTG after 50 h time-on-stream at 110,000 mL/gcat-h, 750 oC, and CH4/CO2/N2=1/1/1
The TEM micrographs of the spent catalysts were also used to characterize the
features of the carbon deposits as shown in Fig. 5.9. Filamentous whisher-like carbon
were identified over all the catalysts. Clear nanotubes with diameters larger than 25 nm
were found over catalysts 0.06Ni0.09Co-400, 0.06Ni0.09Co-600 and 0.06Ni0.09Co-1100.
Very fine wisher-like carbon was found over the 0.06Ni0.09Co-900 catalyst. It was
reported that the size of nanotubes are dependent on the size of metallic particles over the
catalysts (Ji et al., 2001) according to its growth mechanism. However, in this work it
appears that the size of nanotubes was independent of size of metal particles, considering
Fig. 5.4.

132
Fig. 5.9TEM images of carbon deposit on different 0.06Ni0.09Co catalysts calcined at different temperatures after 50 h time-on-stream at 110,000 mL/gcat-h, 750oC, and CH4/CO2/N2=1/1/1
5.4 DISCUSSION BASED ON THE EFFECTS OF CALCINATION
TEMPERATURES ON 0.06Ni0.09Co CATALYSTS
5.4.1 Catalyst activity and active sites
The results of the CO2 reforming of CH4 experiments revealed the significant
effects of catcination temperatures on the catalyst performance. This occurs because the
A : 0.06Ni0.09Co -400 B: 0.06Ni0.09Co -600
100 nm
100 nm
C: 0.06Ni0.09Co -900
100 nm 100 nm
D: 0.06Ni0.09Co -1100

133
catalyst performance is dependent on active sites of the catalyst, which are strongly
affected by catalyst calcination pre-treatment and are finally formed during the catalyst
activation process. It has been proved the metallic property of active sites (Zhang et al.,
2007). 0.06Ni0.09Co-600 and 0.06Ni0.09Co-900 displayed the highest initial activity. It
can be deduced that 0.06Ni0.09Co-600 and 0.06Ni0.09Co-900 had the highest number of
active sites for CO2 reforming of CH4 under the assumption of activity proportional to
number of active sites. Close activity in terms of CH4 reaction rate (Fig. 5.5) showed that
the number of active sites for CO2 reforming of CH4 in 0.06Ni0.09Co-600 and
0.06Ni0.09Co-900 were close. Lower initial activity of 0.06Ni0.09Co-400 and
0.06Ni0.09Co-1100 showed the lower number of active sites for CO2 reforming of CH4.
Therefore, the initial number of active sites for CO2 reforming of CH4 on the different
catalysts followed the same order as the initial activity of the catalysts: 0.06Ni0.09Co-
900~0.06Ni0.09Co-600>0.06Ni0.09Co-400~0.06Ni0.09Co-1100. However, also from Fig.
5.5, the finial activity of catalysts at the end of 50 h showed that the final number of active
sites for CO2 reforming of CH4 at the same reaction conditions were changed and
followed the order: 0.06Ni0.09Co-900>0.06Ni0.09Co-400>0.06Ni0.09Co-600>
0.06Ni0.09Co-1100. The difference between the initial and final activity after same period
of reaction at the same conditions might indicate the existence of different active sites
over the catalysts. At this point of time, it can be said that the different reduction domains
of the TPR profiles of catalysts (Fig. 5.3) might be attributed to the formation of different
active sites during activation (reduction) considering the metallic property of active sites.
134
For the convenience of discussion, it is assumed that there are two types of active
sites on the catalysts: low temperature (LT) activated active sites and high temperature
(HT) activated active sites, which are corresponding to the LT reduction domain and HT
reduction domain, respectively. The LT activated active sites could be reduced from the
mixed reducible metal oxides such as NiO, CoO, and Co3O4, which are featured with
weak metal-support interaction. The HT activated active sites are formed through the
reduction of Ni and Co containing solid solutions and spinels such as NiAl2O4 and
CoAl2O4 with strong metal-support interaction.
The initial activity results of catalyst testing showed that both types of active sites
were active for CO2 reforming of CH4. However, the activity decay of different samples
(Fig. 5.7) showed that deactivation can not occur on both types of active sites. In the
following section, the activity decay (deactivation) is discussed considering carbon
deposition and active sites.
5.4.2 Carbon deposition and active sites
From Fig.5.7, it can be seen that 0.06Ni0.09Co-600 had the same initial activity as
0.06Ni0.09Co-900 but had higher degree activity decay. Considering Table 5.2 and Figs.
5.8 and 5.9, the higher degree of activity decay of 0.06Ni0.09Co-600 can be ascribed to
its higher carbon deposition. Carbon deposition on catalysts has been well discussed in
literature as the major cause of catalyst deactivation for CO2 reforming of CH4. If the
same initial activity indicated the same number of active sites, the higher carbon on
0.06Ni0.09Co-600 than on 0.06Ni0.09Co-900 provided evidence of more carbon-

135
deposition prone active sites on 0.06Ni0.09Co-600 than on 0.06Ni0.09Co-900. Two
factors which have significant effects on carbon deposition and well discussed in literature
are particle size and metal-support interaction. Generally, it is believed that particle sizes
necessary for carbon deposition are larger than those for CO2 reforming of CH4, and CO2
reforming of CH4 is not structure sensitive, i.e. it can occur on both small and large
particles (Rostrup-Nielsen, 1991; Tang et al., 2000; Osaki et al., 2001). Also, strong metal-
support interaction can enhance the resistance to carbon deposition but may reduce the
activity due to its effect on catalyst reduction (Bhattacharyya et al., 1994; Wang et al.,
1998; Tomishige et al., 1998; Xu et al., 2001). From the TEM micrograms (Fig. 5.4B and
C), similar particle size can be observed on both 0.06Ni0.09Co-600 and 0.06Ni0.09Co-
900. However, 0.06Ni0.09Co-600 had significant portion of LT activated active sites,
which had weak support-metal interaction. At this point of moment, the higher carbon
deposition of 0.06Ni0.09Co-600 might be attributed to the LT activated active sites with
weak support-metal interaction. Questions with 0.06Ni0.09Co-400 might come up
considering its LT activated active sites (Fig. 5.3) and its relatively low carbon deposition
(Table 5.2) and stable performance (Fig. 5.7). But when referring to the TEM microgram,
one can find that the 0.06Ni0.09Co-400 had much smaller particle sizes than
0.06Ni0.09Co-600 (Fig. 5.4A and B). Therefore, it can be deduced that the LT activated
active sites had better carbon resistance when its particle sizes were smaller, although it
did have strong metal-support interaction. Thus, the low carbon deposition rate and stable
performance of 0.06Ni0.09Co-400 can be attributed to its small particle sizes.
136
0.06Ni0.09Co-1100 had very strong metal-support interaction (Fig. 5.3) but much larger
particle size (Fig. 5.4D). The low initial activity of 0.06Ni0.09Co-1100 can be attributed
to the strong metal-support interaction, which reduced its degree of reduction and thus
activity (Wang et al., 1998). The high carbon deposition on 0.06Ni0.09Co-1100 can
explain its high degree of deactivation, which can be ascribed to its large particle size
(Rostrup-Nielsen, 1991). From the discussion it can be seen that the carbon deposition is a
complicated process that can be affected by different factors such as particle size and
metal-support interaction, etc.
5.4.3 Origin of carbon deposition
Theoretically, carbon deposition is resulted from the following reactions:
24 2HCCH +↔ ∆H = 74.87 kJ (5.1)
CCO2CO 2 +↔ ∆H = -172.46 kJ (5.2)
As revealed by the TG/DTG and TEM analyses, the temperature of calcination
affects not only the activity and carbon deposition rate, but also the form of carbon
deposition. Filamentous whisker-like carbon and encapsulating shell-like carbon are the
two most commonly observed carbons in CO2 reforming of CH4 (Kroll et al., 1996; Ito et
al., 1999; Quincoces et al., 2001). Frusteri et al. (2002) reported that the lower amount of
carbon deposits with a shell-like morphology generated by the Bouduard reaction or
carbon monoxide disproportionation (Eq. 5.2) was observed over Ni-based catalyst during
CO2 reforming of CH4 at 800 oC, while a large amount of filamentous whisker-like carbon
originated from CH4 decomposition (Eq. 5.1) was formed at 650 oC. Considering the
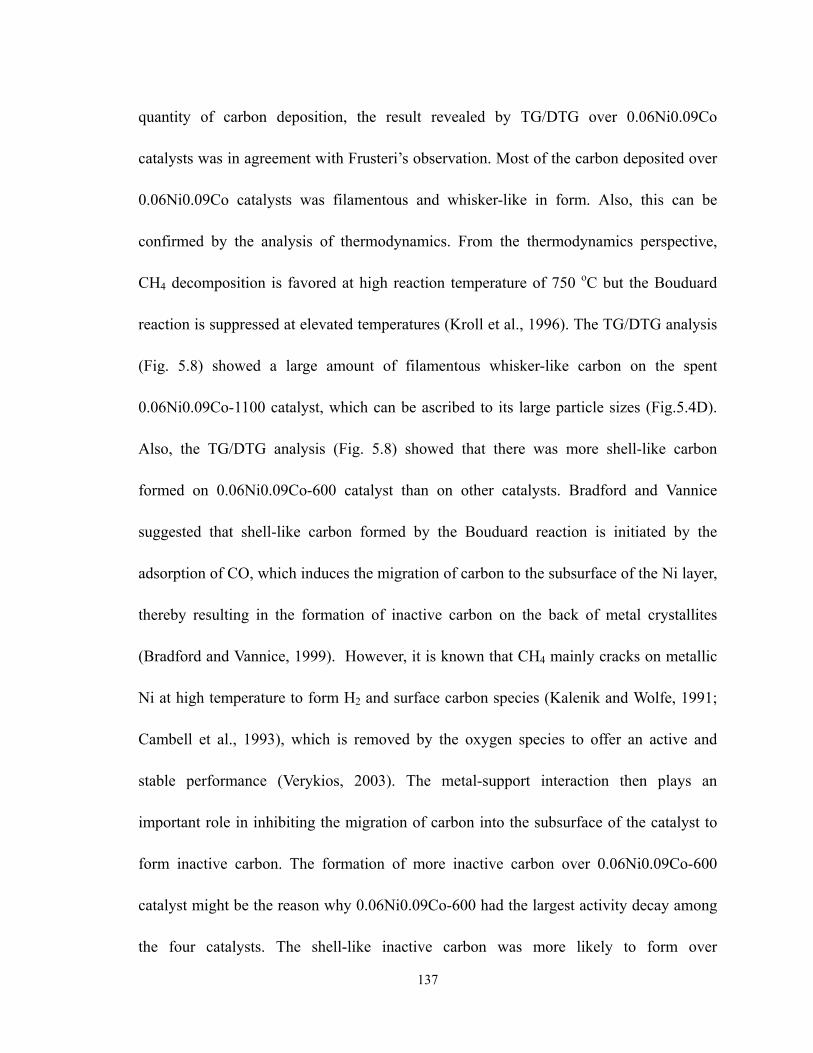
137
quantity of carbon deposition, the result revealed by TG/DTG over 0.06Ni0.09Co
catalysts was in agreement with Frusteri’s observation. Most of the carbon deposited over
0.06Ni0.09Co catalysts was filamentous and whisker-like in form. Also, this can be
confirmed by the analysis of thermodynamics. From the thermodynamics perspective,
CH4 decomposition is favored at high reaction temperature of 750 oC but the Bouduard
reaction is suppressed at elevated temperatures (Kroll et al., 1996). The TG/DTG analysis
(Fig. 5.8) showed a large amount of filamentous whisker-like carbon on the spent
0.06Ni0.09Co-1100 catalyst, which can be ascribed to its large particle sizes (Fig.5.4D).
Also, the TG/DTG analysis (Fig. 5.8) showed that there was more shell-like carbon
formed on 0.06Ni0.09Co-600 catalyst than on other catalysts. Bradford and Vannice
suggested that shell-like carbon formed by the Bouduard reaction is initiated by the
adsorption of CO, which induces the migration of carbon to the subsurface of the Ni layer,
thereby resulting in the formation of inactive carbon on the back of metal crystallites
(Bradford and Vannice, 1999). However, it is known that CH4 mainly cracks on metallic
Ni at high temperature to form H2 and surface carbon species (Kalenik and Wolfe, 1991;
Cambell et al., 1993), which is removed by the oxygen species to offer an active and
stable performance (Verykios, 2003). The metal-support interaction then plays an
important role in inhibiting the migration of carbon into the subsurface of the catalyst to
form inactive carbon. The formation of more inactive carbon over 0.06Ni0.09Co-600
catalyst might be the reason why 0.06Ni0.09Co-600 had the largest activity decay among
the four catalysts. The shell-like inactive carbon was more likely to form over

138
0.06Ni0.09Co-600, which has the LT activated active sites with weak metal-support
interaction (Fig. 5.3) and in the form of relative large particles (Fig. 5.4 B). However, it
was not likely to occur on 0.06Ni0.09Co-400 due to its small particle sizes (Fig. 5.4A). As
for 0.06Ni0.09Co-900, it can be seen that it had strong metal-support interaction (Fig. 5.3)
but also relatively good particle size distribution (Fig. 5.4C), which might be the reason
why it showed relatively high and stable performance (Fig. 5.7) with very low carbon
deposition (Table 5.2, Fig. 5.8 and 5.9).
5.5 EFFECTS OF CALCINATION ON 0.04Ni0.05Co CATALYSTS
The effects of calcinations temperatures on catalyst with different Ni-Co content
were also investigated. The activity and stability of 0.04Ni0.05Co catalysts calcinated at
various temperatures are reported in Fig. 5.10, at 750 oC, 1 atm, 720,000 mL/gcat-h, and
CH4/CO2/N2=1/1/0. It is clear that at such a high gas hourly space velocity (GHSV), the
conversion of CH4 over all the catalysts dropped. Catalyst 0.04Ni0.05Co-800 showed the
best stability with the initial and final CH4 conversion of 69 % and 61 %, respectively.
Catalyst 0.04Ni0.05Co-500, 600, 700, and 900 illustrated very similar performance with a
slightly lower CH4 conversion over the catalyst calcinated at 500 oC (Fig. 5.10). However,
catalyst 0.04Ni0.05Co-1000 had significantly lower activity and stability in comparison
with other catalysts (Fig. 5.10). The testing for catalysts with different Ni-Co content
calcinated at various temperatures demonstrated that a calcination temperature range of
700-900 oC could be recommended for the Ni-Co/AlMgOx bimetallic catalysts for CO2

139
reforming of CH4.
0
20
40
60
80
100
0 20 40 60 80 100
TOS ( h )
CH 4
Con
vers
ion
( % )
0
20
40
60
80
100
500 600 700 800 1100 900
Fig. 5.10 The activity and stability of 0.04Ni0.05Co catalysts calcined at different temperatures for CO2 reforming of CH4 at 750oC, 1 atm, 720,000 mL/gcat-h, and CH4/CO2/N2=1/1/0
5.5 CONCLUSIONS
Experiments have shown that the calcinations temperature has a significant effect
on the catalyst properties and catalytic performance of Ni-Co/AlMgOx catalysts for CO2
reforming of CH4. Calcination temperature can affect both catalyst particle sizes and
metal-support interaction which are two most important factors for carbon resistance. At a
low calcination temperature of 400 oC, small particle sizes (5.5 nm) can be formed on
0.06Ni0.09Co catalyst with no strong metal support interaction. When calcinated at 600
oC, larger particle sizes can be developed but the metal-support interaction can not change
significantly, which results in higher carbon deposition rate and activity decay. A
calcination temperature of 900 oC has been shown to be suitable for the development of

140
strong metal-support interaction without resulting in oversizing of particles, thus good
activity and stability can be achieved on 0.06Ni0.09Co/AlMgOx bimetallic catalysts for
CO2 reforming of CH4. When the calcination temperature reachs 1100 oC, strong metal-
support interaction is developed but also oversize particles are produced. The too strong
metal-support interaction of 0.06Ni0.09Co-1100 compromised its initial activity due to
the difficulty of reduction and the oversize particles enhanced the carbon deposition rate,
thus high carbon deposition and high degree activity decay. Combined with the testing on
0.04Ni0.05Co catalysts, a calcination temperature range of 700-900 oC is recommended
for the Ni-Co/AlMgOx bimetallic catalysts for CO2 reforming of CH4.

141
6 EXPERIMENTAL AND KINETIC STUDIES
A similar version of this paper has been copyrighted and publised in Industrial and
Engineering Chemistry Research: Zhang, J., Wang, H., Dalai, A.K., “Kinetic studies of
CO2 reforming of CH4 over Ni-Co/AlMgOx bimetallic Catalyst”, Ind. Eng. Chem. Res.,
48 (2), 677-684 (2009).
CONTRIBUTION OF Ph.D. CANADIDATE
Experiments were planned and performed by Jianguo Zhang. Hui Wang and Ajay
K. Dalai provided guidance in planning the experiment. The submitted manuscript was
written by Jianguo Zhang, while Hui Wang and Ajay K. Dalai provided comments and
suggestions for revision.
CONTRIBUTION OF THIS PAPER TO THE OVERALL STUDY
This paper investigated the effects of experimental conditions at a constant overall
pressure on the Ni-Co/AlMgOx bimetallic catalyt for CO2 reforming of CH4. The work
involves the catalyst preparation, catalyst pre-treament, catalyst testing, and kinetic model
development. Power Law model was used to fit the data. Also, a Langmuir-Hinshelwood
model was developed assuming that the dissociation of CH4 and the reaction between C
species and activated CO2 are the rate-determining steps over the Ni-Co/AlMgOx catalyst.

142
ABSTRACT
The kinetics of CO2 reforming with CH4 over a Ni-Co/AlMgOx bimetallic catalyst
was investigated as a function of temperature and partial pressures of CO2 and CH4. In the
temperature range of 650-750 oC, the apparent activation energies were estimated to be
69.4 and 25.9 kJ/mol for CH4 and CO2 consumption and 85.1 and 61.8 kJ/mol for H2 and
CO formation, respectively. It was found that the reforming rate in terms of CH4
consumption was less sensitive to CO2 partial pressures than to CH4 partial pressures. At a
constant CH4 partial pressure, the increase in CO2 partial pressure did not cause
significant change in the reforming rate, whereas at a constant CO2 partial pressure the
reforming rate increased with the increase in CH4 partial pressure. The increase in extra
CO2 at a constant CH4 pressure led to decreases in hydrogen (H2) formation but increase
in carbon monoxide (CO) formation due to the simultaneous occurrence of the reverse
water-gas shift reaction (RWGS). The Power-Law (P-L) model was used to fit the data
and also a Langmuir-Hinshelwood (L-H) type of kinetic model was developed assuming
that the dissociation of CH4 and the reaction between C species and activated CO2 are the
rate-determining steps over the Ni-Co/AlMgOx bimetallic catalyst. The experimental data
have a good fit with both the P-L model and the L-H model.

143
6.1 INTRODUCTION
Experimental and kinetic studies have been performed over different Ni-based
catalysts. As early as 1960s, Bodrov and Apel’baum (1967) have reported that the rate of
CO2 reforming of CH4 over nickel surface in the temperature range of 800-900 oC can be
described by the same kinetic equation as that for steam (H2O) reforming of CH4.
Bodrov’s model is based on the assumption that CH4 does not react with CO2 but with
steam; the H2 formed reacts rapidly with CO2 by the reverse water-gas shift reaction and
the steam is thus regained. Assuming that CH4 dissociation is the rate determining step,
Zhang and Verykios (1994) developed a Langmuir-Hinshelwood model for CO2 reforming
of CH4 over Ni/CaO-Al2O3. Also isotopic effects of CH4/CD4 in CO2 reforming of CH4
over Ni/SiO2 catalyst indicated the dissociation of CH4 to be the rate-determining step
(Wang and Au, 1996). However, Slagtern et al. (1997) reported that the surface reaction
between C species from CH4 cracking and oxygen-adsorbed species derived from CO2
dissociation is rate-determining step. Hu and Ruckenstein (1997) also concluded that the
surface reaction between C and O species is the rate-determining step over Ni catalysts
through transient response analysis. The above review for literature suggests that the CH4
cracking and the surface reaction between C species and O species are generally accepted
by different research groups as rate-determining steps over various Ni based catalysts.
Bradfrod and Vannice (1996) investigated kinetics of CO2 reforming of CH4 over various
Ni catalysts and developed a kinetic model based on CH4 dissociative adsorption to form
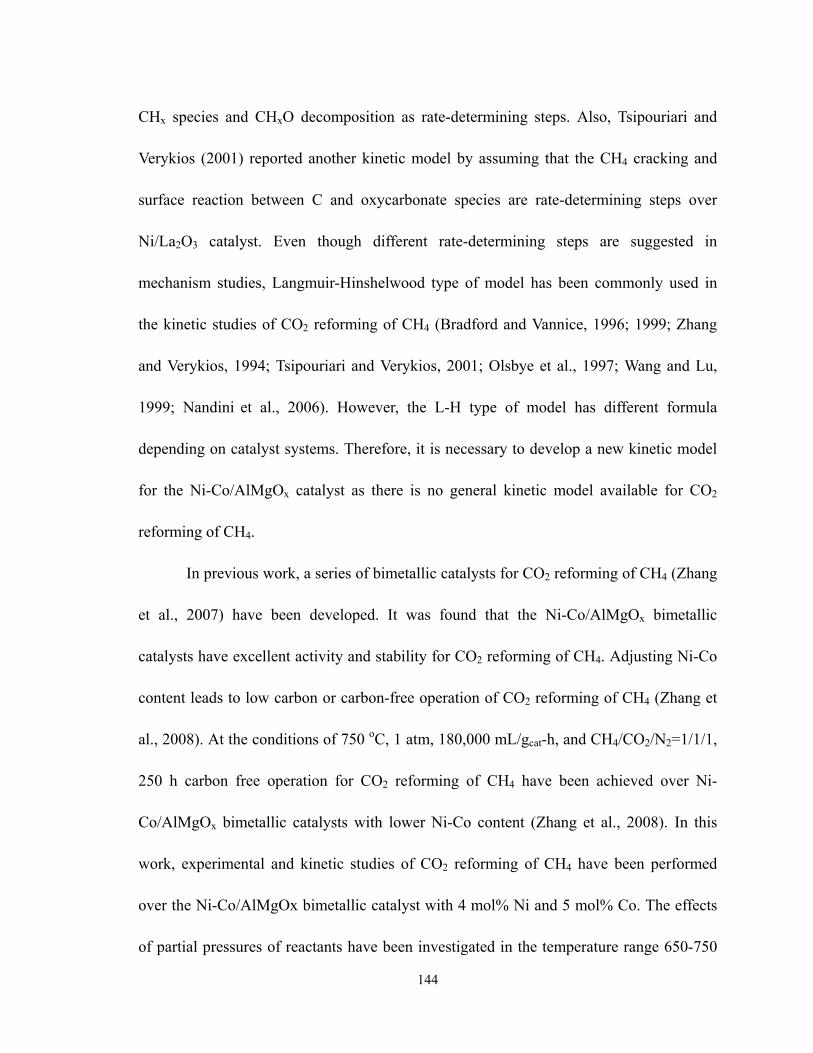
144
CHx species and CHxO decomposition as rate-determining steps. Also, Tsipouriari and
Verykios (2001) reported another kinetic model by assuming that the CH4 cracking and
surface reaction between C and oxycarbonate species are rate-determining steps over
Ni/La2O3 catalyst. Even though different rate-determining steps are suggested in
mechanism studies, Langmuir-Hinshelwood type of model has been commonly used in
the kinetic studies of CO2 reforming of CH4 (Bradford and Vannice, 1996; 1999; Zhang
and Verykios, 1994; Tsipouriari and Verykios, 2001; Olsbye et al., 1997; Wang and Lu,
1999; Nandini et al., 2006). However, the L-H type of model has different formula
depending on catalyst systems. Therefore, it is necessary to develop a new kinetic model
for the Ni-Co/AlMgOx catalyst as there is no general kinetic model available for CO2
reforming of CH4.
In previous work, a series of bimetallic catalysts for CO2 reforming of CH4 (Zhang
et al., 2007) have been developed. It was found that the Ni-Co/AlMgOx bimetallic
catalysts have excellent activity and stability for CO2 reforming of CH4. Adjusting Ni-Co
content leads to low carbon or carbon-free operation of CO2 reforming of CH4 (Zhang et
al., 2008). At the conditions of 750 oC, 1 atm, 180,000 mL/gcat-h, and CH4/CO2/N2=1/1/1,
250 h carbon free operation for CO2 reforming of CH4 have been achieved over Ni-
Co/AlMgOx bimetallic catalysts with lower Ni-Co content (Zhang et al., 2008). In this
work, experimental and kinetic studies of CO2 reforming of CH4 have been performed
over the Ni-Co/AlMgOx bimetallic catalyst with 4 mol% Ni and 5 mol% Co. The effects
of partial pressures of reactants have been investigated in the temperature range 650-750

145
oC at 310 kPa. Apparent activation energies for reactant consumption and product
formation were estimated. Both power-law model and L-H model were developed to fit
the kinetic data for CO2 reforming of CH4 using Ni-Co/AlMgOx catalyst.
6.2 EXPERIMENTAL
6.2.1 Catalyst preparation and activation
Ni-Co/AlMgOx bimetallic catalyst was prepared by coprecipitation method as
described in previous chapters. The Ni-Co/AlMgOx bimetallic catalyst was activated by
heating at 800 oC for 4 h in the flow of 30 mL/min H2-N2 mixture with 20 % H2. The
activated catalyst was then stabilized for 24 h at 750 oC, 1 atm, CH4/CO2/N2=1/1/1, and a
low GHSV of 180,000 mL/gcat-h.
6.2.2 Experiment procedure
The experimental design and reactant conversions are shown in Table 6.1.
Experiments were performed in the temperature range of 650-750 oC, with a feed of
CH4/CO2/N2 in total flow rate of 300 mL/min and total pressure of 310 kPa (Table 6.1).
Due to the high activity of the Ni-Co/AlMgOx bimetallic catalyst, the amount of catalyst
used for this study was as low as 0.01 g, to maintain low conversions. The catalyst had an
average particle size of 0.165 mm diluted with quartz sands. N2 was the balance inert gas
to maintain the overall pressure constant when CH4 or CO2 partial pressure varied. The N2
was also functioned as an internal reference for GC analysis.

146
Table 6.1 Kinetic experiment design and reactant conversion of the CO2 reforming of CH4 over Ni-Co/AlMgOx catalyst at 95% confidence interval
Inlet partial pressure
( kPa )
Conversion
( %) Run Temperature
( oC ) CH4 CO2 N2 CH4 CO2
1-1 750 62 31 217 18.2±2.6 47.2±3.2
1-2 750 62 62 186 26.2±2.4 41.2±1.9
1-3 750 62 124 124 32.2±1.2 27.2±1.9
1-4 750 62 186 62 32.8±1.7 22.3±3.3
1-5 750 31 62 217 35.4±2.0 29.7±2.3
1-6 750 124 62 124 17.2±1.1 35.1±2.4
1-7 750 186 62 62 16.8±1.8 48.8±2.5
1-8 750 62 62 186 24.6±1.2 39.8±2.0
2-1 700 62 31 217 15.8±1.4 33.7±4.1
2-2 700 62 62 186 19.4±1.3 36.6±2.1
2-3 700 62 124 124 23.0±1.4 20.9±2.0
2-4 700 62 186 62 23.8±2.0 16.6±3.6
2-5 700 31 62 217 30.3±2.1 25.6±2.4
2-6 700 124 62 124 13.7±1.1 28.2±2.6
2-7 700 186 62 62 11.6±1.9 28.6±3.3
2-8 700 62 62 186 19.0±1.3 37.1±2.1
3-1 650 62 31 217 8.2±1.5 20.6±4.9
3-2 650 62 62 186 10.9±1.5 29.7±2.3
3-3 650 62 124 124 13.2±1.6 14.2±2.2
3-4 650 62 186 62 14.1±2.2 11.5±3.8
3-5 650 31 62 217 19.8±2.5 18.3±2.6
3-6 650 124 62 124 8.6±1.2 19.2±3.0
3-7 650 186 62 62 6.8±2.0 18.7±4.1
3-8 650 62 62 186 11.3±1.5 29.5±2.3

147
6.3 RESULTS AND DISCUSSION
6.3.1 Catalyst deactivation
Although previous study (see chapter 3-5) showed that carbon deposition on the
catalyst used for the kinetic measurement was not detectable, repeated runs (run 1-8, 2-8,
and 3-8 in Table 1) were conducted after the kinetic data were collected at every
temperature level, to ensure that the catalyst deactivation could be ruled out. From Table
6.1, it is clear that the catalyst was very stable during the kinetic measurement as shown
by the reactant conversions of the repeated runs.
6.3.2 Effects of mass transfer and heat transfer
The effects of internal and external mass transfer were evaluated experimentally
with a feed mixture composed of CH4/CO2/N2=1/1/3 at 750 oC and 310 kPa. In a fixed
bed reactor, the limitation of external mass transfer is typically tested through the
variation of feed flow rate (Tsipouriari and Verykios, 2001; Nandini et al., 2006). At a
fixed residence time obtained through maintaining a constant W/F ratio, higher flow rate
leads to higher mass transfer rate. When the reforming rate does not change with the
change of flow rate, limitation of external mass transfer is negligible. In this work, the
reforming rate of CO2 reforming of CH4 was expressed in terms of CH4 consumption rate.
Fig. 6.1 shows the reforming rate as a function of feed flow rate at a constant W/F of
0.002 gcat-s/mL. It is clear that the reforming rate increased with the increase in feed flow.
However, the reforming rate barely changed when the feed flow rate was increased from
200 to 400 mL/min. It indicated that the external mass transfer effect can be neglected

148
when the feed flow rate was higher than 200 mL/min. In this work, the kinetic studies
were conducted at a feed flow rate of 300 mL/min.
0.0000
0.0005
0.0010
0.0015
0.0020
0 100 200 300 400 500
F ( mL/min )
-r CH
4 ( m
ol/g
-s )
Fig. 6.1 Effect of flow rate on reaction rate of Ni-Co/AlMgOx catalyst at 750 oC, 310 kPa, and W/F = 0.002 gcat-s/mL. Error shows the 95 % confidence interval.
In heterogeneous catalysis, the variation of catalyst particle size is usually used to
check the limitation of internal mass transfer (Tsipouriari and Verykios, 2001; Nandini et
al., 2006). Internal mass transfer is dependent on particle radius but kinetics is
independent on radius (Forni, 1999). A clear change in reaction rate with the change in
particle size under certain reaction conditions indicates the internal mass transfer
controlling regime. As shown in Fig. 6.2, the effect of internal mass transfer was tested
using four different catalyst particle sizes to carry out CO2 reforming of CH4 at 750 oC,
310 kPa, and W/F of 0.002 gcat-s/mL. It can be seen that the reforming rate was increased
when the catalyst particle size was reduced from 0.300 to 0.200 mm. However, only slight
change in reforming rate was observed when the particle size was further reduced from
0.200 to 0.085 mm. The results shown in Fig. 6.3 suggest that the internal mass transfer

149
can be neglected when catalyst particle size was less than 0.200 mm. Therefore, a catalyst
particle size of 0.165 mm was selected for the kinetics study in this work.
0.0010
0.0011
0.0012
0.0013
0 100 200 300 400
D ×103 ( mm )
-r CH
4 ( m
ol/g
-s )
Fig. 6.2 Effect of catalyst particle size on reforming rate over Ni-Co/AlMgOx catalyst at 750 oC, 310 kPa, and W/F = 0.002 gcat-s/mL. Error bas shows the 95 % confidence interval of reaction rate.
The effects of heat transfer limitations were also ruled out using Anderson
criterion which is shown by Eq. 6.2.
a
S
sp
pr
ERT
TdRH
75.04
)( 2
<∆−
λ (6.2)
where, rH∆ is reaction enthalpy (275.6 kJ/mol at 750 oC), R average reaction rate per
unit catalyst particle volume (0.6 mol/m3-s), dp the average catalyst particle diameter
(0.000165 m), pλ the thermal conductivity of catalyst particle (7.45 W/m/K at 750 oC,
which was estimated using the thermal conductivity of Al2O3 and MgO considering that
they are the main compositions of the catalyst), Ts surface temperature of catalyst particle
(1023 K), R gas constant (8.314 Pa-m3/mol-K), and Ea apparent activation energy (69.4

150
kJ/mol). When substituting the numbers into Eq. (2), the value of the left-hand side is 1.5
×10-7, which is far less than the value of the right-hand side, 9.2×10⁻². It was clearly
estimated that the catalyst particle was at isothermal condition under the reaction
conditions using Anderson criterion.
6.3.3 Effect of partial pressure on reforming rate
The influence of partial pressures of CH4 and CO2 on the rate of CO2 reforming of
CH4 reaction rate was carried out over the Ni-Co/AlMgOx bimetallic catalyst at 310 kPa
and W/F 0.002 gcat-s/mL, and 650-750 oC. The effect of CO2 partial pressure at different
temperatures were investigated by applying a constant CH4 partial pressure of 62 kPa
while the CO2 partial pressure was varied between 31 kPa and 186 kPa as shown in Fig.
6.4. It can be seen that the reforming rate was increased with the increase in CO2 partial
pressure in the range 31-124 kPa. However, the increase of reforming rate became slower
at higher CO2 partial pressures in the range 124-186 kPa. The relatively constant reaction
rate in the range 124-186 kPa can be ascribed to the restriction of thermodynamic
equilibrium at limited availability of CH4 (62 kPa). Also, it can be seen that at a lower
temperature, the effect of CO2 partial pressure was less significant in comparison with
those at higher temperatures.

151
0.0000
0.0005
0.0010
0.0015
0.0020
0.0025
0 50 100 150 200PCO2 ( kPa )
-r CH
4 ( m
ol/g
-s )
0.0000
0.0005
0.0010
0.0015
0.0020
0.0025
750oC
700oC
650oC
PCH4=62 kPa
Fig. 6.3 Effect of CO2 partial pressure on the reforming rates of CO2 reforming of CH4 over Ni-Co/AlMgOx catalyst at 310 kPa and W/F = 0.002 gcat-s/mL. Error bar shows the 95 % confidence interval of reaction rate.
The effects of CH4 partial pressures on the reaction rate of CH4 were studied at a
constant CO2 partial pressure of 62 kPa. Results at different temperatures are shown in Fig.
6.5. It is clear that the reforming rate was affected by the partial pressure of CH4 in the
whole experimental range 31-186 kPa. The acceleration of reforming rate slowly
decreased with the increase in CH4 partial pressure at a constant CO2 partial pressure.
Comparison of data in between Fig. 6.4 and Fig. 6.5 indicates that the reforming rate was
more sensitive to CH4 partial pressure than to CO2 partial pressure. It probably can be
attributed to that the adsorption of CH4 to the surface of catalyst was stronger than that of
CO2 at higher partial pressures.

152
0.0000
0.0005
0.0010
0.0015
0.0020
0.0025
0 50 100 150 200
PCH4 ( kPa )
-r CH
4( m
ol/g
-s )
0.0000
0.0005
0.0010
0.0015
0.0020
0.0025
750oC
700oC
650oC
PCO2=62 kPa
Fig. 6.4 Effect of CH4 partial pressure on the reforming rates of CO2 reforming of CH4 over Ni-Co/AlMgOx catalyst at 310 kPa and W/F=0.002 gcat-s/mL. Error bar shows the 95 % confidence interval of reaction rate.
6.3.4 Effect of reactant partial pressure on formation rate of products
Fig. 6.6 shows the effect of reactant partial pressures on the formation rate of CO
at 750, 700, and 650 oC, respectively. From Fig. 6.6A, it can be seen that the formation
rate of CO increased with the increase in CO2 partial pressure while it did not change
significantly with the increase in CH4 partial pressure (Fig. 6.6B). This observation can be
ascribed to the influence of reverse water gas shift reaction (RWGS).
CO2 + H2 → CO + H2O (6.3)
At constant CH4 partial pressure, the reaction rate of CO2 reforming of CH4 was restricted
due to limited availability of CH4. However, the formation of CO still can be enhanced
significantly through the RWGS reaction between H2 and excess CO2 when CO2 partial
pressure was increased continuously as shown in Fig. 6.6A. At constant CO2 partial

153
pressure, the formation rate of CO only increased slightly with the increase in CH4 partial
pressure (Fig. 6.6B).
0.0000
0.0010
0.0020
0.0030
0.0040
0.0050
0 50 100 150 200
PCO2 ( kPa )
rCO (
mol
/g-s
)
0.0000
0.0010
0.0020
0.0030
0.0040
0.0050PCH4 = 62 kPaA 750 oC
700 oC
650 oC
0.0000
0.0010
0.0020
0.0030
0.0040
0 50 100 150 200
PCH4 ( kPa )
rCO (
mol
/g-s
)
0.0000
0.0010
0.0020
0.0030
0.0040PCO2 = 62 kPaB
750 oC
700 oC
650 oC
Fig. 6.5 Effect of reactant partial pressures on the formation rates of CO over Ni-Co/AlMgOx catalyst at 310 kPa and 0.002 gcat-s/mL. Error bar shows the 95 % confidence interval of reaction rate.
The effects of reactant partial pressures on the formation rate of H2 at 750, 700,
and 650 oC are shown in Fig. 6.7. It is clear that at constant CH4 partial pressure the H2

154
formation rate increased in the low CO2 partial pressure range 31-62 kPa (Fig.6.7A). The
increase in H2 formation was due to the increase in reaction rate of CO2 reforming of CH4
when more CO2 was available. The formation rate of H2 was relatively stable in the CO2
partial pressure range 62-124 kPa (Fig.6.7A). In this CO2 partial pressure range, the
reaction rate of CO2 reforming of CH4 should be increasing slightly but limited by the
availability of CH4. At the same time, the RWGS reaction could be also increasing with
the availability of excess CO2. When the increase of CO2 reforming of CH4 is equivalent
to the increase of RWGS, the formation of H2 will remain constant. However, the
formation rate of CO will continue to increase. This can be confirmed by the increasing
formation rate of CO in the CO2 partial pressure range of 62-124 kPa (Fig. 6.6A). With
the further increase in CO2 partial pressure from 124 kPa to 186 kPa, the formation rate of
H2 dropped (Fig. 6.7A). It was because the increase of the H2 formation rate from CO2
reforming of CH4 reaction was less than the consumption rate of H2 from RWGS reaction
when CH4 was limited but CO2 was in excess. At constant CO2 partial pressure, the
formation rate of H2 first slightly increased and then was kept constant with the increase
of CH4 partial pressure (Fig. 6.7B). It indicated that both CO2 reforming of CH4 reaction
and RWGS were restricted when limited CO2 was available.

155
0.0000
0.0010
0.0020
0.0030
0 50 100 150 200
pCO2 ( kPa )
rH2 (
mol
/g-s
)
0.0000
0.0010
0.0020
0.0030
PCH4 = 62 kPaA
750 oC
700 oC
650 oC
0.0000
0.0010
0.0020
0.0030
0 50 100 150 200
PCH4 ( kPa )
rH2 (
mol
/g-s
)
0.0000
0.0010
0.0020
0.0030PCO2 = 62 kPaB
750 oC
700 oC
650 oC
Fig. 6.6 Effect of reactant partial pressures on the formation rates of H2 over Ni-Co/AlMgOx catalyst at 310 kPa and W/F=0.002 gcat-s/mL. Error bar shows the 95 % confidence interval of reaction rate.
6.3.5 Side reverse water gas shift (RWGS) reaction
As discussed in above section, the effects of RWGS were clearly indicated by the
difference between CO and H2 formation rate. Referring to Eq. 6.1 and Eq. 6.3, it is clear
that the production of every one CO molecule through RWGS reaction results in the

156
consumption of one H2 molecule, i.e. every one RWGS reaction produces one CO but
consumes one H2. The same formation rates of CO and H2 should have been expected if
CO2 reforming with CH4 were the only reaction (Eq. 6.1). However, the occurrence of
RWGS reaction (Eq. 6.3), actually, increased the CO formation rate and reduced the H2
formation rate. RWGS reaction rate can be calculated using the 0.5 times difference
between CO and H2 formation rates if assuming RWGS is the only side reaction in CO2
reforming with CH4 reaction system. It has been reported that carbon formation on the Ni-
Co/AlMgOx bimetallic catalysts is very low (Zhang et al., 2007; 2008) so that it is
negligible in comparison with the formation of CO and H2. Therefore, it is reasonable to
assume the RWGS is the only side reaction when the product formation is considered. In
this work, the reaction rate of RWGS was estimated based on above assumption in order
to have quantitative understanding about its effects on the CO2 reforming with CH4
reaction system. Fig. 6.8 A shows the RWGS reaction rate as a function of CO2 partial
pressure. At constant CH4 partial pressure, the RWGS reaction rate increased almost
linearly with the increase in CO2 partial pressure. At higher temperatures, the reaction rate
increased faster as more H2 was available at higher conversion of CH4 at higher
temperature. However, as shown in Fig. 6.8B, at constant CO2 partial pressure the
reaction rate of RWGS was suppressed as the CH4 concentration increased. It indicated
that CH4 reforming reaction was competing for CO2 with RWGS reaction. The
suppression of RWGS reaction at availability of additional CH4 can be expected since the
equilibrium constant K of CO2 reforming with CH4 is much higher than that of RWGS

157
reaction at the reaction temperatures studied.
0.0000
0.0005
0.0010
0.0015
0 50 100 150 200PCO2 ( kPa )
rRW
GS (
mol
/g-s
)
0.0000
0.0005
0.0010
0.0015PCH4=62 kPa
750oC
650oC
700oC
A
0.0002
0.0003
0.0004
0.0005
0 50 100 150 200
PCH4 ( kPa )
rRW
GS ( m
ol/g
-s )
0.0002
0.0003
0.0004
0.0005PCO2=62 kPa
750oC
650oC
700oC
B
Fig. 6.7 Reaction rate of RWGS reaction as a function of CO2 partial pressures. Error bar shows the 95 % confidence interval.
6.3.6 Effect of temperatures and apparent activation energy
The effect of temperatures on the reaction rate of CO2 reforming of CH4 over Ni-
Co/AlMgOx bimetallic catalyst was investigated in temperature range 650-750 oC at 310

158
kPa, CH4/CO2/N2=1/1/3, and W/F=0.002 gcat-s/mL. Results in the form of Arrhenius plots
are shown in Fig. 6.9. The apparent activation energies were then estimated for CH4, CO2
consumption, H2, and CO formation. Comparison of apparent activation energies of Ni-
Co/AlMgOx bimetallic catalyst with reported Ni-based catalysts are listed in Table 6.2
(Bradford and Vannice 1996, Wang and Lu 1999, Lemonidon and Vasalos 2002). From
Table 6.2, it is clear that the apparent energy is very different over different catalysts. The
disagreement in apparent activation energy is probably due to the difference of catalyst
systems applied in the relevant studies. Tsipouriari and Verykios (2002) reported that the
catalyst supports of Ni may influence significantly the activation energy by altering the
rate-controlling step in the reaction sequence. The proximity of apparent activation energy
values for CH4, CO2, and CO suggests that the rate-controlling step for CO formation is
the same as that for CH4 and CO2 consumption (Lemonidon and Vasalos 2002). In a
review by Bradford and Vannice (1999), it was reported that the activation energies of
CO2 reforming of CH4 are typically between 33 and 100 kJ/mol while high values up to
160 kJ/mol are obtained for some catalysts. However, for the case of Ni-Co/AlMgOx
bimetallic catalyst in this work, the apparent activation energy of CO2 consumption was
much lower than that of CH4 consumption (Table 6.2). Also, it was lower than the
reported activation energies for CO2 consumption (Table 6.2). Possibly this difference was
due to the presence of strong Lewis base of MgO (Li et al., 1994) in the support of Ni-
Co/AlMgOx bimetallic catalyst, which can facilitate the activation of CO2. Also, the
existence of RWGS reaction might be an important factor influencing the activation of

159
CO2. Concerning the activation energies for CO and H2, the apparent energy of H2
formation is always higher than that for CO formation (Table 6.2). It has been ascribed to
be the result of the RWGS influence on the reaction mechanism (Bradford 1996).
Table 6.2 Apparent activation energy (Ea, kJ/mol) over Ni based catalysts Catalyst Ea(CH4) Ea(CO2) Ea(H2) Ea(CO) Reference Ni-Co/AlMgOx (650-750 oC)
69.4 25.9 85.1 61.8 This work
Ni/Al2O3 (500-700 oC)
50.9 56.1 - 80.5 Wang and Lu 1999
Ni/TiO2 (400-550 oC)
108.9 87.9 146.5 87.9 Bradford and Vannice 1996
Ni/CaO-Al2O3 (620-690 oC)
106.8 98.8 147.4 103 Lemonidou and Vasalos 2002
-8.00
-7.50
-7.00
-6.50
-6.00
-5.50
0.0008 0.0009 0.001 0.0011 0.0012
1/T ( K-1 )
ln (r
/mol
-g-1
cat-S
-1)
CH4CO2H2CO
Fig. 6.8 Effect of temperatures on the reaction rates of CO2 reforming of CH4 at 310 kPa, CH4/CO2/N2=1/1/3, and W/F=0.002 gcat-s/mL
6.3.7 Kinetic models
6.3.7.1 Power law model
A general power law model can be expressed by Eq. 6.4.

160
nCO
mCHCH PkPr
244=− (6.4)
The values of the power law rate coefficient k and the indices m and n are different
for different catalysts. The values of the parameters of Ni based catalysts are summarized
in Table 6.3
Table 6.3 Parameters of power law equation Catalyst m n Reference
Ni/SiO2 -0.3-0.8 0-0.6 Takanabe et al., 2005; Osaki et al., 1997
Ni/Al2O3 0.6-1.0 0-0.3 Takanabe et al., 2005
Ni/MgO 1.0 0 Rostrup-Nielsen and Hanse, 1993
The power low model (Eq.6.4) was used to describe the reforming rate of CO2
reforming of CH4 over Ni-Co/AlMgOx bimetallic catalyst. Also, The reaction rate constant,
k, was further expressed in an Arrhenius equation (Eq. 6.5). The values of the parameters
and the R squared value for the power-law model are estimated and listed in Table 6.4.
RTEekk /0
−= (6.5)
Table 6.4 Estimated parameters of the power law model of Ni-Co bimetallic catalyst at 95 % confidence interval
k0
( mol/gcat-s-kPa(m+n) )
E
( kJ/mol ) m N R2
0.089 ± 0.027 63.8 ± 0.4 0.483 ± 0.037 0.291 ± 0.040 0.951
As shown in Table 6.1, the conversions are in a range of 4.8-51.3 %. Some of
which may be too high for the differential reaction rate analysis. Therefore, the P-L rate

161
equation was used for the intergral equation (Eq. 6.6) to assess the validity of the rate law.
∫ −=
X
CHi
CH rdX
FW
044
(6.6)
where W is the catalyst mass, iCHF
4is the initial inlet CH4 mole flow rate, and X is CH4
conversion.
Using Eq. 6.6, the CH4 conversion X can be calculated at each reaction condition. The
comparison of experimental CH4 conversion and calculated CH4 conversion using integral
equation and P-L rate equation is shown in Fig. 6.10, where solid points are calculated
CH4 conversions using integral method and P-L rate law and solid line is made through
experimental CH4 conversions. Dotted lines in Fig. 6.10 defined the 95 % confidence
interval of the experimental CH4 conversion. It can be seen that most of the calculated
CH4 conversions using integral method fall into the 95 % confidence interval of
experimental CH4 conversions. Also, it is evident that most of the calculated conversions
are distributed around the lower 95 % confidence level of experimental CH4 conversion.
The comprison showed that the P-L model and differential method can describe the can
the reaction with satisfactory results. Simplicity is the major advantage of power law
model. However, power law model might be not very accurate. Therefore, other type
models may be preferred to the power law form because it is more likely to be amenable
to extrapolation. In the following section, a Langmuir-Hinshelwood (LH) mechanism
model was developed.

162
.
0
5
10
15
20
25
30
35
40
0 10 20 30 40
Experimental CH4 conversion ( % )
Cal
cula
ted
CH
4 con
vers
ion
( % )
Lower 95% confidence limit of coversion
Upper 95% confidence limit of coversion
Fig.6.9 Comparison of experimental CH4 conversion with calculated CH4 conversion using integral method (Eq. 6.6) and P-L rate law (Eq.6.4)
6.3.7.2 Consideration of reaction mechanism – Langmuir-Hinshelwood mechanism
Steps plausible to describe the reaction mechanism of CO2 reforming of CH4 over
the Ni-Co/AlMgOx bimetallic catalyst was proposed in this work based experimental
observation and literature.
1) The reversible adsorption and dissociation of CH4 can be assumed as the initial steps
for the reforming reaction (Hickman and Schmidt 1993). Due to the metallic

163
properties of active sites on Ni-Co/AlMgOx bimetallic catalysts Zhang et al. (2007),
the methane was supposed to adsorb and dissociate on metal particles (Eq. 6.7 and
6.8), leading to the formation of H2 and C species.
. 44 CHMMCH 1 −→←+ K , Equilibrium (6.7)
. 24 2HCMCHM 2 +−→− k , Slow (6.8)
where M represents the metal particle of the reduced Ni-Co/AlMgOx catalyst. It was
supposed that the CH4 adsorption was at equilibrium while the dissociation of CH4
was a slow step. The carbon species was present as M-C or carbide-like species
which contains no C-H bond (Chang et al., 2000).
2) In CO2 reforming of CH4, the activation of CO2 can be assumed to be another
important step. CO2 is a linear triatomic molecule and has two sets of π molecular
orbital which is orthogonal. The carbon is a Lewis acid centre and the oxygen is
weak Lewis base. The formation of an active site-CO2 complex via direct
coordination is one of the most powerful and universal ways to activate the inert
CO2 molecule to undergo chemical reactions (Gibson, 1996). The support of Ni-
Co/AlMgOx bimetallic catalyst is mainly composed of MgO which is a strong Lewis
base (Li et al., 1994). Therefore, the activation of CO2 was supposed to occur on the
Lewis base centre of the support (S) and was at equilibrium.
22 COSSCO 3 −→←+ K , Equilibrium (6.9)

164
3) The CO2 reforming of CH4 reaction was assumed to terminate through the reaction
between carbon species (M-C) derived from CH4 decomposition and activated CO2
(S-CO2) and it also considered to be a slow step (Tsipouriari and Verykios, 2001).
SM2COC-MCO-S 42 ++→+ k , Slow (6.10)
4) RWGS is the most common side reaction in CO2 reforming of CH4. It is important to
take its occurrence into account. Besides step (6.10), activated CO2 can also react
with surface hydrogen species which originated from the decomposition of CH4 and
was assumed at equilibrium with the gaseous H2 (Bradfrod and Vannice, 1996). The
occurrence of RWGS results in the consumption of H2 and the formation of CO
which can be confirmed by the observation of CO/H2 is higher than unity (Zhang et
al., 2007).
H2 + M ↔ 2M-H, Equilibrium (6.11)
S-CO2 + M-H → CO + M-OH + S, Slow (6.12)
M-OH + M-H ↔ H2O + 2M, Fast (6.13)
6.3.7.3 L-H type of model
Literature survey shows that L-H type of kinetic model is widely used to describe
CO2 reforming of CH4 system (Bradford and Vannice, 1999; Wang and Au, 1996). A
summary of rate expressions derived for Ni-based catalysts is tabulated in Table 6.5.

165
Table 6.5 Reported L-H models for CO2 reforming of CH4 over Ni-based catalysts Model Catalyst Reference
COH
OH
CHCH
bPPP
a
kPr
++=−
2
2
4
4
1
Ni foil Bodrov and
Apel’baum, 1967
22
2
)(42
24
4CHCO
COCHCH cPbPa
PaPr
++=−
Ni/Al2O3,
Ni/CaO-Al2O3
Zhang and Verykios,
1994
242
24
4
7
12/)4(
7
1
1
1 COCHx
HCO
COCHCH
PPk
kPPk
Kk
PPkr
++
=−
∧
∧
−∧
−
∧
∧
Ni/TiO2
Ni/C
Ni/SiO2
Ni/MgO
Bradford and
Vannice, 1996
)1)((24
24
4321 COCOCH
COCHCH PKPKPKa
PkPr
+++=− Ni/La/Al2O3 Olsbye et al., 1997
2221
2213
)(2242
224
4HCOCOCHHCO
HCOCOCHCH PPKPPKPP
PPPPKKkr
++=− Ni/SiO2 Kroll et al., 1998
)1)(1(24
24
421
3
COCH
COCHCH PKPK
PPkr
++=−
Ni/Al2O3
Ni/CeO2-Al2O3 Wang and Lu, 2000
(424
24
44321321
4221
CCHCOCH
COCHCH PkKPkKPPKkK
PPkKkKr
++=−
Ni/La2O3 Tsipouriari and
Verykios, 2001
17
12/1
7
1
1
422
2
4
4
4
+++
=−
L
CHLHCOb
COaL
COCHL
CHLCH
kPk
PcoPPK
PKkPPk
Pkr
Ni-K/CeO2-
Al2O3 Nandini et al., 2006

166
From above proposed mechanism, a L-H model (Eq. 6.14) for CO2 reforming of
CH4 over the Ni-Co/AlMgOx bimetallic catalyst was developed based on the following
assumptions: 1) step (6.10) is rate-limiting step; 2) the concentration of total metallic
active sites for reforming reaction is constant CMT; 3) the coverage of metallic active sites
for reforming reaction by species of H and OH is negligible; 3) the coverage of active
sites for CO2 activation is negligible in comparison with its total concentration CST, which
is also supposed to be constant.
2424
24
4COCHCOCH
COCHCH PdPcPbP
PaPr
++=− (6.14)
4321kKkKCCa STMT= (6.15)
21kKb = (6.16)
43kKCc ST= (6.17)
431 kKKCd ST= (6.18)
Preliminary estimation for the parameters of the L-H model (Eq. 6.14) was
performed using least-squares analysis and the Marquardt-Levenberg algorithm.
Estimation of the parameters was based on the minimization of the sum of residual
squares of the observed and the predicated reforming rates. It showed that d(~10-13)<<b
(~10-8) and d (~10-13)<<c(~10-8). Therefore, the L-H model (Eq. 6.14) was simplified to
Eq. 6.19.
24
24
4COCH
COCHCH cPbP
PaPr
+=− (6.19)
After the values of all of the parameters were estimated at 750, 700, and 650 oC,
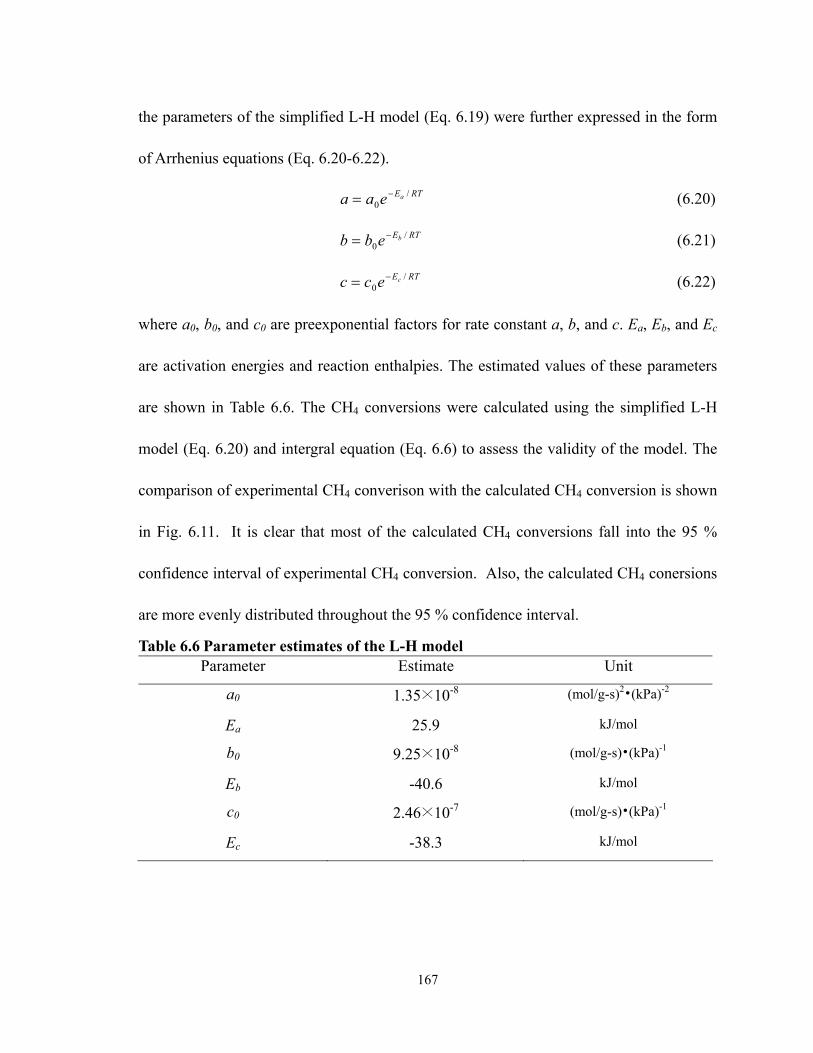
167
the parameters of the simplified L-H model (Eq. 6.19) were further expressed in the form
of Arrhenius equations (Eq. 6.20-6.22).
RTEaeaa /0
−= (6.20)
RTEbebb /0
−= (6.21)
RTEcecc /0
−= (6.22)
where a0, b0, and c0 are preexponential factors for rate constant a, b, and c. Ea, Eb, and Ec
are activation energies and reaction enthalpies. The estimated values of these parameters
are shown in Table 6.6. The CH4 conversions were calculated using the simplified L-H
model (Eq. 6.20) and intergral equation (Eq. 6.6) to assess the validity of the model. The
comparison of experimental CH4 converison with the calculated CH4 conversion is shown
in Fig. 6.11. It is clear that most of the calculated CH4 conversions fall into the 95 %
confidence interval of experimental CH4 conversion. Also, the calculated CH4 conersions
are more evenly distributed throughout the 95 % confidence interval.
Table 6.6 Parameter estimates of the L-H model Parameter Estimate Unit
a0 1.35×10⁻⁸ (mol/g-s)2•(kPa)-2
Ea 25.9 kJ/mol
b0 9.25×10⁻⁸ (mol/g-s)•(kPa)-1
Eb -40.6 kJ/mol
c0 2.46×10⁻⁷ (mol/g-s)•(kPa)-1
Ec -38.3 kJ/mol

168
0
5
10
15
20
25
30
35
40
0 5 10 15 20 25 30 35 40
Experimental CH4 conversion ( % )
Cal
cula
ted
CH
4 con
vers
ion
( % )
Lower 95% confidence limit of conversion
Upper 95 % confidence limit of conversion
Fig. 6.10 Comparison of experimental CH4 conversion with the calculated CH4 convervison using intergral method (Eq. 6.6) and L-H model (Eq. 6.19)
6.4 CONCLUSIONS
The kinetics of the reaction of CO2 reforming of CH4 was investigated over Ni-
Co/AlMgOx bimetallic catalyst in the temperature range 650-750 oC through variation of
CO2 and CH4 partial pressures, respectively. The reaction mechanism was proposed based
on literature and experimental observation. The dissociation of CH4 and the reaction
between C species and activated CO2 were suggested as rate-determining steps. Both the
P-L model and the L-H kinetic model were used to fit the kinetic measurement data with
satisfactory results.

169
NOMENCLATURE
a, a0, b, b0, c, c0 Constant
CMT Concentration of total metallic active sites, mol/m3
CST Concentration of total active sites for CO2 activation, mol/m3
dp, D Average catalyst particle diameter, m
Ea, Eb, Ec Apparent activation energy, kJ/mol
rH∆ Reaction enthalpy, kJ
k, k0, k1, k2,k3, k4,k1L,k7L, 1
∧
k 1−
∧
k , 7
∧
k , 7−
∧
k Specific rate of reaction
Ka, Kb, K1, K2, K3, K4, K Chemical equilibrium constant
m, n Reaction order
P Pressure, kPa
-r, r Reaction rate per unit catalyst weight, mol/g-s
R Average reaction rate per unit catalyst particle
volume, mol/m3-s
R Ideal gas constant
R2 Square of correlation coefficient
Ts Surface temperature of catalyst particle, K
T Temperature, K
pλ Thermal conductivity of catalyst particle, W/m/K

170
7 CONCLUSIONS AND RECOMMENDATIONS
7.1 CONCLUSIONS
In the development of CO2 reforming of CH4 process, long-term stable operation
with high reactant conversion and product yield at low temperature and pressure is
desirable. Higher reactant conversion and high product yield can be achieved at higher
reaction temperatures. Also, high reaction temperature can alleviate the carbon formation
problem, which is believed to be the major cause of catalyst deactivation in CO2
reforming of CH4. However, special material is needed to make the reactor being operated
at high reaction temperature. Extremely high temperature will result in dramatic increase
of capital investment and reduction of the life of reactor tubes. Therefore, the operation
conditions are proposed based above stoichometric and thermodynamic discussion: 1) a
temperature range between 1000-1300 K; 2) a pressure range between 1-3 atm; and 3) a
CO2/CH4 ratio range between 1-1.3. However, under above conditions carbon formation is
thermodynamically feasible. Therefore, developing a catalyst over which carbon
formation can be kinetically suppressed is the only possible way to achieve carbon-free
operation of CO2 reforming of CH4 at the proposed reaction conditions (Wang et al.,
1996). The catalyst with desired catalytic properties for CO2 reforming of CH4 is designed
following Dowden’s strategy. A catalyst composition with a general formula Ni-

171
Me/AlMgOx (Me = Co, Fe, Mn, or Cu) is proposed based on stoichiometric analysis,
thermodynamic analysis, and proposed surface mechanism considering literature and
experience.
Catalyst screening showed that Ni-Co bimetallic catalysts made by coprecipitating
Ni-, Co-, Al-, and Mg-containing precursor solutions demonstrate superior performance
for carbon dioxide reforming of methane in comparison with Ni-Me (Me = Fe, Cu, or Mn)
combinations. The synergy of Ni and Co in the bimetallic catalysts not only provides high
activity but also excellent carbon resistance and thus makes the catalysts with outstanding
stability. Comparative studies conducted with Ni and Co monometallic catalysts and Ni-
Co bimetallic catalyst show that the superior performance of Ni-Co catalysts comes from
high BET surface area, small pore diameter, relatively easy reducibility, good metal
dispersion, high metallic surface, formation of different types of solid solutions, and SMSI.
Optimization for Ni and Co loading showed that high surface area and high
activity for CO2 reforming of CH4 are those Ni-Co/AlMgOx catalysts with a Ni/Co or
Co/Ni ratio between 0.6 and 1.5. Adjusting the Ni-Co content of the bimetallic catalysts,
whose Ni/Co or Co/Ni ratio is between 0.6 and 1.5, is able to change the metal dispersion
and metal particle size. The better metal dispersion and smaller metal particle are obtained
at lower Ni-Co content. Small metal particles are crucial to the suppression of carbon
deposition. Therefore, the Ni-Co bimetallic catalyst with the Ni/Co ratio close to unity and
lower total metal content shows higher activity and greater stability. The metal particle
size on 0.04Ni0.05Co and 0.02Ni0.03Co is smaller than 10 nm, and thus no detectable

172
carbon deposition on the two catalysts for CO2 reforming of CH4.
Optimization for the catalyst pre-treatment indicated that calcination temperatures
have significant effects on the catalyst properties and catalytic performance of Ni-
Co/AlMgOx catalysts for CO2 reforming of CH4. Calcination temperature can affect both
catalyst particle sizes and metal-support interaction which are two most important factors
of carbon resistance. At a low calcination temperature of 400 oC, small particle sizes can
be formed with no strong metal support interaction. When calcinated at 600 oC, larger
particle sizes can be developed but the metal-support interaction can not change
significantly, which results in higher carbon deposition rate and activity decay. A
calcination temperature 900 oC has shown to be good for the development of strong
metal-support interaction without resulting in oversizing of metal particles, thus good
activity and stability can be achieved on Ni-Co/AlMgOx bimetallic catalysts for CO2
reforming of CH4. When the calcination temperature reachs 1100 oC, strong metal-support
interaction is developed but also oversize particles are produced. The too strong metal-
support interaction of NiCo-1100 compromised its initial activity due to the difficulty of
reduction and the oversize particles which enhanced the carbon deposition rate, resulting
in high carbon deposition and high degree activity decay. Therefore, a calcination
temperature range between 700 and 900 oC is recommended for the Ni-Co/AlMgOx
bimetallic catalysts for CO2 reforming of CH4.
The experimental and kinetic investigation was conducted over Ni-Co/AlMgOx
bimetallic catalyst in the temperature range 650-750 oC through variation of CO2 and CH4

173
partial pressures, respectively. The reaction mechanism was proposed based on literature
and experimental observation. The dissociation of CH4 and the reaction between C species
and activated CO2 were suggested as rate-determining steps. The L-H kinetic model
which was derived from the proposed mechanism was used to fit the kinetic measurement.
It was found that the L-H type model was better than power-law model in fitting the
kinetic data with more satisfactory results.
7.2 RECOMMENDATIONS
The Ni-Co/AlMgOx bimetallic catalyst has been newly developed for CO2
reforming of CH4 in the Applied Catalysis Lab at the University of Saskatchewan since
2004. As a new catalyst system with complicated composition, sufficient characterization
for the catalyst is necessary for an accurate understanding of the relationship between its
property and performance. More accurate characterization is desirable for its phase
structure, surface structure, and electrical structure, as well as their relationship with
catalyst activity, deactivation, and carbon formation. Also, the specific role of each
component in the Ni-Co/AlMgOx bimetallic catalyst needs to be clarified. The reaction
mechanism and carbon formation mechanism on the Ni-Co/AlMgOx bimetallic catalysts
should be investigated in the future work. In summary, the following aspects of work are
of interest in the future works.
1) Catalyst preparation conditions:
The major variables which may have potential significant effects during the Ni-

174
Co/AlMgOx preparation using co-precipitation method include pH control and
temperature control. The final titration pH can significantly affects catalyst composition
and catalyst structure. The particle size might be affected by the preparation temperature
since the crystal growth is temperature sensitive. Also, other factors such as concentration
of metal salt and precipitation speed may worth further study.
2) Catalyst pre-treatment process
In previous research, it has been shown that the calcinations temperatures have
significant effects on the catalyst properties and performances. Another two important
variables during the pre-treatment which are not investigated due to time limit include
calcination time at final calcination temperatures and temperature ramp rates.
3) Catalyst activation process
In previous research, the catalyst activation program was set based on experience
without specific investigation. But it is sure that catalyst activation process has significant
effects on the catalyst performances. Four parameters, including reduction temperature,
reduction time, reduction temperaurte ramp rate, and reduction atmosphere or reduction
gas composition during the activation process, are important.
4) Precise catalyst characterization
The previous study focused on catalyst development. Basic characterization and
testing were performed. However, the previous catalyst characterization is far from
enough to gain a good understanding for the catalyst properties which include the phase
structure, surface property, metal particles or particles, and local chemistry environment.

175
Therefore, comprehsive precise characterization plan in the further should be made and
budgeted to gain a clear understanding of the Ni-Co/AlMgOx catalysts for CO2 reforming
of CH4.
5) Kinetics and Mechanism
Due to the instrument limit, there was no experiment performed to investigate the
reaction mechanism. However, the reaction mechanism is critical to understanding the
surface properties and performances of the catalysts. Kinetic study for the Ni-Co/AlMgOx
catalyst was conducted at an overall pressure of 310 kPa, which was relatively narrow due
to the limit of quartz reactor. A wider pressure range is desired to peformed experimental
and kinetic studies. It is recommended to conduct further kinetic study at a higher overall
pressure using stainless steel reactor in the future.

176
REFERENCES: 1. Ahn, I.Y., Kim, W.J., and Moon, S.H., “Performance of La2O3- or Nb2O5-added Pd/SiO2 catalysts
in acetylene hydrogenation,” Appl. Catal. A 308, 75-84 (2006). 2. Alyea, E.C., He, D., and Wang, J., “Alcohol synthesis from syngas. I: Performance of alkali-
promoted Ni-Mo (MOVS) catalysts”, Appl. Catal. A 104, 77-85 (1993). 3. Anderson, J.B., “A criterion for isothermal behavior of a catalyst pellet,” Chem. Eng. Sci. 18,147
(1963). 4. Aparicio, L.M., “Transient Isotopic Studies and Microkinetic Modeling of Methane Reforming
over Nickel Catalysts,” J. Catal. 165, 262-274 (1997). 5. Ashcroft, A.T., Cheetham, A.K., Green, M.L.H., and Vernon, P.D.F., “Partial oxidation of methane
to synthesis gas using carbon dioxide.” Nature 352, 225-226 (1991). 6. B.K. Cho, “Chemical modification of catalyst support for enhancement of transient catalytic
activity: nitric oxide reduction by carbon monoxide over rhodium,” J. Catal. 131 74-87 (1991). 7. Basini, L., and Sanfilippo, D., “Molecular aspects in syn-gas production: the CO2-reforming
reaction case,” J. Catal. 157, 162-178 (1995). 8. Becerra, A., Iriarte, M.E., Dimitrijewit, M., and Castro-Luna, A., “Promoting effects of rhodium
on supported nickel catalysts in the dry reforming of methane,” Bol. Soc. Chil. Quím. 47, 385-91 (2002).
9. Bhat, R.N., and Sachtler, W.M.H., “Potential of zeolite supported rhodium catalysts for the CO2 reforming of CH4,” Appl. Catal. A 150, 279-296 (1997).
10. Bhattacharyya, A., and Chang, V.W., “Rapid catalytic reforming of methane with CO2 and its application to other reactions,” Stud. Surf. Sci. Catal. 88, 207-213 (1994).
11. Bitter, J., Seshan, K., and Lercher, A., “Mono and bifunctional pathways of CO2/CH4 reforming over Pt and Rh based catalysts,” J. Catal. 176, 93-101 (1998).
12. Bitter, J., Seshan, K., and Lercher, A., “The state of zirconia supported platinum catalysts for CO2/CH4 reforming,” J. Catal. 171, 279-286 (1997).
13. Blom, R., Dahl, I.M., Slagtern, A., Sortland, B., Spjelkavik, A., and Tangstad, E., “Carbon dioxide reforming of methane over lanthanum-modified catalysts in a fluidized-bed reactor,” Catal. Today 21, 535-543 (1994).
14. Bodrov, I.M., and Apel’baum, L.O., “Reaction kinetics of methane and carbon dioxide on a nickel surface”, Kinet. Catal. 8, 326 (1967).
15. Bradford, and M.C.J., Vannice, M.A., “CO2 reforming of CH4,” Catal. Rev. Sci. Eng. 41, 1 (1999). 16. Bradford, M.C.J., and Vannice, M.A., “Catalytic reforming of methane with carbon dioxide over
nickel catalysts II. Reaction kinetics,” Appl. Catal. A 142, 97-122 (1996). 17. Bradford, M.C.J., and Vannice, M.A., “CO2 reforming of CH4 over supported Pt catalysts,” J. Catal.
173, 151-157 (1997). 18. Bradford, M.C.J., and Vannice, M.A., “Metal-support interactions during the CO2 reforming of
CH4 over model TiOx/Pt catalysts,” Catal. Lett. 48, 31-38 (1997). 19. Burch, R. and Petch, M.I., “Investigation of the synthesis of oxygenates from carbon
monoxide/hydrogen mixtures on supported rhodium catalysts,” Appl. Catal. A 88, 39-60 (1992). 20. Chang, J., Park, S., Yoo, J., and Park, J.-M., “Catalytic behaviour of supported KNiCa catalyst and
mechanistic consideration for carbon dioxide reforming of methane”, J. Catal. 195, 1 (2000).

177
21. Chang, J.-S., Park, S.-E., and Chon, H., “Catalytic activity and coke resistance in the carbon dioxide reforming of methane to synthesis gas over zeolite-supported Ni catalysts,” Appl. Catal. A.145, 111-124 (1996).
22. Chang, Z., Wu, Q., Li, J., and Zhu, Q., “Effects of promoters and preparation procedures on reforming of methane with carbon dioxide over Ni/Al2O3 catalyst,” 30, 147-155 (1996).
23. Chen, Y.G., and Ren, J., “Conversion of methane and carbon dioxide into synthesis gas over alumina-supported nickel catalysts-effect of Ni-Al2O3 interactions,” Catal. Lett., 29, 39-48 (1994).
24. Chen, Y.G., Tomishige, K., Yokoyama, K., and Fujimoto, K., “Catalytic performance and catalyst structure of nickel–magnesia catalysts for CO2 reforming of methane,” J. Catal. 184, 479-490 (1999).
25. Choi, J.-S., Moon, K.-I., Kim, Y.G., Lee, J.S., Kim, C.-H., and Trimm, D.L., “Stable carbon dioxide reforming of methane over modified Ni/Al2O3 catalysts,” Catal. Lett. 52, 43-47 (1998).
26. Choudhary, V.R., and Mamman, A.S., “Simultaneous oxidative conversion and CO2 or steam reforming of methane to syngas over CoO-NiO-MgO catalyst,” J. Chem. Technol. Biotechnol. 73, 345-350 (1998).
27. Choudhary, V.R., Updade, B.S., and Mamman, A.S., “Large enhancement in methane-to-syngas conversion activity of supported Ni catalysts due to precoating of catalyst supports with MgO, CaO or rare-earth oxide” Catal. Lett. 32, 387-390 (1995).
28. Chubb, T.A., “Characteristics of CO2-CH4 reforming-methanation cycle relevant to the solchem thermochemical power system,” Solar Energy 24, 341-345 (1980).
29. Claridge, J.B., Green, M.L.H., and Tsang, S.C., “Methane conversion to synthesis gas by partial oxidation and dry reforming over rhenium catalysts,” Catal. Today 21, 455-460 (1994).
30. Clark, E.L., Kallenberger, R.H., Browne, R.Y., and Phillips, J.R., “Synthesis gas production reaction of light hydrocarbons, steam, and carbon dioxide in commercial equipment”, Chem. Eng. Progr. 45, 651-654 (1949).
31. Coq, B., Tichit, D., and Rihet, S., “Co/Ni/Mg/Al layered double hydroxides as precursors of catalysts for the hydrogenation of nitriles: hydrogenation of acetonitrile,” J. Catal. 189,117-128 (2000).
32. Cornils, B., Herrmann, W.A., Schlogl, R., and Wong, C.H., “Catalysis from A to Z, second, completely revised and enlarged edition,” WILEY-VCH Verlag GmbH & Co. KGaA, Weinheim (2003).
33. Delmon, B., Grange, P., Jacobs, A., and Poucelet, G., “Preparation of catalysts II,” Studies in Surface and Catalysis, Volume II, Elsevier, Amsterdam (1979).
34. Delmon, B., Jacobs, A., and Poucelet, G., “Preparation of catalysts I,” Studies in Surface and Catalysis, Volume I, Elsevier, Amsterdam (1976).
35. DIAS, J.A.C., and Assaf, J.M., “Influence of calcium content in Ni/CaO/γ-Al2O3 catalysts for CO2-reforming of methane,” Catal. Today 85, 59-68 (2003).
36. DOE, “Carbon dioxide emissions from the electric power in the United States”, Washington, DC, (2000).
37. Dowden, D.A., Schnell, C.R., and Walker, G.T., “The design of complex catalysts,” Fourth International Congress on Catalysis, Rice University, Houston, p. 1120-1131 (1968).
38. Efstathiou, A.M., Kladi, A., Tsipouriari, V.A., and Verykios, X.E., “Reforming of methane with carbon dioxide to synthesis gas over supported rhodium catalysts: II. A steady-state tracing analysis: mechanistic aspects of the carbon and oxygen reaction pathways to form CO,” J. Catal.
178
158, 64-75 (1996). 39. Environment Canada, “Canada’s GHG Inventory”, Quebec (2004). 40. EPA, “Global Warming – Methane”, http://www.epa.gov/methane/sources.html, (2006). 41. Erdohelyi, A., Cserenyi, J., and Solymosi, F., “Activation of CH4 and Its Reaction with CO2 over
Supported Rh Catalysts,” J. Catal. 141, 287-299 (1993). 42. Erdohelyi, A., Cserenyi, J., Papp, E., and Solymosi, F., “Catalytic reaction of methane with carbon
dioxide over supported palladium,” Appl. Catal. A 108, 205-219 (1994). 43. Erdohelyi, A., Fodor K., and Solymosi, F., “Decomposition of methane and its reaction with CO2
over Rh/ZSM-5 catalyst,” Stud. Surf. Sci. Catal. 107, 525-536 (1997). 44. Fei, J. Hou, Z., Zheng, X., and Yashima, T., “Doped Ni catalysts for methane reforming with CO2,”
Catal. Lett. 98, 241-246 (2004). 45. Ferreira-Aparicio, P., Fernandez-Garcia, M., Guerrero-Ruiz, A., and Rodríguez-Ramos, I.,
“Evaluation of the role of the metal–support interfacial centers in the dry reforming of methane on alumina-supported rhodium catalysts,” 190, 296-308 (2000).
46. Fischer, V.F., and Tropsch, H., “Die umwandlung von methan in wasserstoff und kohlenoxyd,” Brennst.-Chem. 25, 39-46 (1928).
47. Fogler, H. Scott., “Elements of chemical reaction engineering,” PRENTICE-HALL, Englewood Cliffs, New Jersey, p452-491 (1986).
48. Forni, L., “Mass transfer and heat transfer in catalytic reactions”, Catal. Today 52, 147 (1999). 49. Fraenkel, D., Levitan, R., and Levy, M., “A solar thermochemical pipe based on the CO2-CH4 (1:1)
system,” Int. J. Hydrogen Energy 11, 267-277 (1986). 50. Gadalla, A.M. and Bower, B., “The role of catalyst support on the activity of nickel for reforming
methane with CO2,” Chem. Eng. Sci. 43, 3049-3062 (1988). 51. Gadalla, A.M., and Sommer, M.E., “Synthesis and characterization of catalysts in the system
Al2O3-MgO-NiO-Ni for methane reforming with CO2,” J. Am. Ceram. Soc. 72, 683-687 (1989). 52. Gaigneaux, E., De Vos, D.E., Grange P., Jacobs, P.A., Martens, J.A., Ruiz, P., and Poncelet, G.,
“Scientific bases for the preparation of heterogeneous catalysts,” Processing of the 8th International Symposium, Louvain-la-Neuve, Belgium, September 9-12 (2002).
53. Gibson, D.H., “η2-coordination of CO2 was found both experimentally and theoretically,” Chem. Rev. 96, 2063 (1996).
54. Ginsburg, Jason M., Pina, J., El Solh, T., Lasa, Hugo, I. de, “Coke formation over nickel catalyst under methane dry reforming conditions: thermodynamic and kinetic models,” Ind. Eng. Chem. Res., 44, 4846-4854 (2005).
55. Gronchi, P., Fumagalli, D., Rosso, R.D., Centola, P., “Carbon deposition in methane reforming with carbon dioxide,” J. Thermal Anal. Cal. 47, 227-234 (1996).
56. Gustafso, B.L., and Walden, J.V., “Conversion of carbon dioxide to carbon monoxide,” US Patent 5068057 (1991).
57. Guyot-Sionnest, N.S., Villain, F., Bazin, D., Dexpert, H., Le Peltier, F., Lynch, J., and Bournonville, J.P., “In situ high temperature and high pressure exafs studie of Pt/Al2O3 catalysts. Part I: Reduction and deactivation,” Catalysis Letters 8, 283-295 (1991).
58. Hei, M., Chen, H., Yi, J., Lin, Y., Wei, G., and Liao, D., “CO2-reforming of methane on transition metal surfaces,” Surface Science 417, 82-96 (1998).
59. Hickman, D.A., and Schmidt, L.D., “Production of syngas by direct catalytic oxidation of methane,” Science 259, 343-345 (1993).

179
60. Horiuchi, T., Sakuma, K., Fukui, T., Kubo, Y., Osaki, T., and Mori T., “Suppression of carbon deposition in the CO2-reforming of CH4 by adding basic metal oxides to a Ni/Al2O3 catalyst,” Appl. Catal. A 144, 111-120 (1996).
61. Hou, Z., Yokota, O., Tanaka, T., and Yashima, T., “Investigation of CH4 reforming with CO2 on meso-porous Al2O3-supported Ni catalyst,” Catal. Lett. 89, 121-127 (2003).
62. Hougen, K., Watson, R.A. Ragatz, Chemical Process Principles, Part 1, John Wiley&Sons, New York, 1954
63. Hu, Y. H., and Ruckenstein, E., “Catalytic conversion of methane to synthesis gas by partial oxidation and CO2 reforming,” Adv. Catal. 48, 297-345 (2004).
64. Hu, Y., and Ruckenstein, E., “Binary MgO-based solid solution catalysts for methane conversion t syngas”, Catal. Rev. 44, 423 (2002).
65. Hu, Y.H., and Ruckenstein, E., “Transient response analysis via a broadened pulse combined with a step change or an isotopic pulse: application to CO2 reforming of methane over NiO/SiO2”, J. Phys. Chem. B 101, 7563 (1997).
66. Hu. Y.H., and Ruckenstein E., “An optimum NiO content in the CO2 reforming of CH4 with NiO/MgO solid solution catalysts,” Catal. Lett., 36, 145-149 (1996).
67. Hu. Y.H., and Ruckenstein E., “CH4 TPR-MS of NiO/MgO solid solution catalysts,” 13, 2055-58 (1997).
68. Hu. Y.H., and Ruckenstein E., “Temperature-programmed desorption of CO adsorbed on NiO/MgO,” J. Catal. 163, 306-311 (1996).
69. Hu. Y.H., and Ruckenstein E., “The characterization of a highly effective NiO/MgO solid solution catalyst in the CO2 reforming of CH4,” 43, 71-77 (1997).
70. Huang, T.J., Li, H.J, and Yu, T.C., “A comparison of oxygen-vacancy effect on activity behaviors of carbon dioxide and steam reforming of methane over supported nickel catalysts,” Catal. Lett. 105, 239-247 (2005).
71. I.S. Metclfe, S. Sundaresan, AIChE J. 34, 195 (1988). 72. IUPAC Compendium of Chemical Terminology, 2nd Edition (1997). 73. Ji, L., Tang, S., Zeng, H.C., Lin, J., and Tan, K.L., “CO2 reforming of methane to synthesis gas
over sol–gel-made Co/γ-Al2O3 catalysts from organometallic precursors,” Appl. Catal. A 207, 247-255 (2001).
74. Jolivet, J.-P., Henry, M. and Livage, Jacques, “Metal oxide chemistry and synthesis,” JOHN WILEY & SONS, LTD, Toronto (1994) p.3-52.
75. Kang, J.K., and Rhee, S., “Chemical vapor deposition of nickel oxide films from Ni(C5H5)2/O2,” Thin Solid Films 391, 57-61 (2001).
76. Kim, D.K., Stöwe, K., Müller F., and Maier, W.F., “Mechanistic study of the unusual catalytic properties of a new Ni-Ce mixed oxide for the CO2 reforming of methane,” J. Catal. 247, 101-111 (2007).
77. Kim, G.J., Cho, D.S., Kim, K.H., and Kim, J.H., “The reaction of CO2 with CH4 to synthesize H2 and CO over nickel-loaded Y-zeolites,” Catal. Lett., 28, 41-52 (1994).
78. Kroll, V.C.H., Swaan, H.M., and Mirodatos, C., “Methane reforming reaction with carbon dioxide over Ni/SiO2 catalyst: II. A nechanistic study,” J. Catal. 164, 387-398 (1996).
79. Kroll, V.C.H., Swaan, H.M., and Mirodatos, C., “Methane reforming reaction with carbon dioxide over Ni/SiO2 catalyst: I. deactivation studies,” J. Catal. 161, 409-422 (1996).
80. Kroll, V.C.H., Tjatjopoulos, G.J., Mirodatos, C., “Kinetics of methane reforming over Ni/SiO2
180
catalysts based on a stepwise mechanistic model”, Stud. Surf. Sci. Catal. 119, 753 (1998). 81. Kyle, B.G., “Chemical and process thermodynamics, third edition”, Prentice Hall PTR, New Jersey,
1999, p433-511. 82. Lemonidou, A.A., and Vasalos, I., “Carbon dioxide reforming of methane over 5 wt.% Ni/CaO-
Al2O3 catalyst”, Appl. Catal. A 228, 227 (2002). 83. Levy, M., Levitan, R., Meirovitvh, E., Segal, A., Rosin, H., and Rubin, R., “Chemical reactions in
a solar furnace 2: Direct heating of a vertical reactor in an insulated receiver. Experiments and computer simulations,” Sol. Energy 48, 395-402 (1992).
84. Lewis, W.K., Gilliland, E.R., and Reed, W.A., “Reaction of methane with copper oxide in a fluidized bed,” Ind. Eng. Chem., 41, 1227-37 (1949).
85. Li, C., Fu, S., Zhang, H., and Xin, Q., “An infrared spectroscopic study on the lewis base properties of metal oxides by using a novel probe molecule: boric acid trimethyl ester”, J. Chem. Soc. Chem. Commun. 17, 18 (1994).
86. Liu, B.S., and Au, C.T., “Carbon deposition and catalyst stability over La2NiO4/γ-Al2O3 during CO2 reforming of methane to syngas,” Appl. Catal. A. 244, 181-195 (2003).
87. Marco, J.F., Gancedo, J.Ramon, Gracia, M., and Gantier, J.L., “Cation distribution and magnetic structure of the ferromagnetic spinel NiCo2O4,” J. Mater. Chem. 11 3087-3093 (2001)
88. Mark, M.F., and Maier W.F., “Active surface carbon – a reactive intermediate in the production of synthesis gas from methane and carbon dioxide,” Angew. Chem. Inst. Ed. Engl. 33, 1657-1660 (1994).
89. Mark, M.F., and Maier W.F., “CO2-reforming of methane on supported Rh and Ir catalysts,” J. Catal. 164, 122-130 (1996).
90. Masai, M., Kado, H., Miyake, A., Nishiyama, S., and Tsuruya, S., “Methane conversion” Elsevier, Amsterdam (1988) p.76.
91. McCrary, J.H., and McCrary, G.E., “An experimental study of the CO2-CH4 reforming-methanation cycle as a mechanism for converting and transporting solar energy,” Solar Energy 29, 141-151 (1982).
92. Menad, S., Ferreira-Aparicio, P., Cherifi, O., Guerrero-Ruiz, A., and Rodríguez-Ramos, I., “Designing new high oxygen mobility supports to improve the stability of Ru catalysts under dry reforming of methane,” Catal. Lett. 89, 63-67 (2003).
93. Metclfe, I.S., Sundaresan, S., “ AIChE J. 34 (1988) 195 94. Nagaoka, K., Seshan, K., Lercher, J., and Aika, K., “Activation mechanism of methane-derived
coke (CHx) by CO2 during dry reforming of methane – comparison for Pt/Al2O3 and Pt/ZrO2,” Catal. Lett. 70,109-116 (2000).
95. Nakamura, J., Aikawa, K., Sato, K., and Uchijima, T., “Role of support in reforming of CH4 with CO2 over Rh catalysts,” Catal. Lett. 25, 265-270 (1994).
96. Nandini, A., Pant, K.K., and Dhingra, S.C., “Kinetic study of the catalytic carbon dioxide reforming of methane to synthesis gas over Ni-K/CeO2-Al2O3”, Appl. Catal. A 308, 119 (2006).
97. Noronha, F.B., Shamsi, A., Taylor, C., Fendley, E.C., Stagg-Williams, S., and Resasco, D.E., “Catalytic performance of Pt/ZrO2 and Pt/Ce-ZrO2 catalysts on CO2 reforming of CH4 coupled with steam reforming or under high pressure,” Catal. Lett. 90, 13-21 (2003).
98. Olsbye, U., Wurzel, T., and Mleczko, L., “Kinetic and reaction engineering studies of dry reforming of methane over a Ni/La/Al2O3 catalyst”, Ind. Eng. Chem. Res. 36, 5180 (1997).
99. Osaki T., and Mori, T., “Role of potassium in carbon-free CO2 reforming of methane on K-

181
promoted Ni/Al2O3 catalysts,” J. Catal. 204, 89-97 (2001). 100. Osaki, T., “Effect of reduction temperature on the CO2-reforming of methane over TiO2-supported
Ni catalyst,” 93, 643-647 (1997). 101. Osaki, T., Horiuchi, T., Suzuki, K., and Mori T., “Kinetics, intermediates and mechanism for the
CO2-reforming of methane on supported nickel catalysts,” J. Chem. Soc., Faraday Trans. 92, 1627-31 (1996).
102. Osaki, T., Horiuchi, T., Suzuki, K., and Mori, T., “Catalyst performance of MoS2 and WS2 for the CO2-reforming of CH4 -suppression of carbon deposition,” Appl. Catal. 155, 229 (1997).
103. Osaki, T., Masuda, H., and Mori, T., “Intermediate hydrocarbon species for the CO2-CH4 reaction on supported Ni catalysts,” Catal. Lett. 29, 33-37 (1994).
104. Osaki, T., Masuda, H., Horiuchi, T., and Mori, T., “Highly hydrogen-deficient hydrocarbon species for the CO2-reforming of CH4 on Co/Al2O3 catalyst,” Catal. Lett. 34, 59-63 (1995).
105. Ostrupnielsen, J.R., and Hansen, J.H.B., “CO2-Reforming of Methane over Transition Metals,” J. Catal. 144, 38-49 (1993).
106. Pena, M.A., Gomez, J.P., and Fierro, J.L.G., “New catalytic routes for syngas and hydrogen production”, Appl. Catal. A 144, 7-57 (1996).
107. Perry, R.H., and Green, R.W., “Physical and chemical data,” Perry’s Chemical Engineers’ Handbook, 7th edition, Section 2 (1997).
108. Petrov, K., and Will, G., “A new cobalt-nickel oxide spinel prepared under high pressure in an oxygen atmosphere,” J. Materials Sci. Lett. 6, 1153-1155 (1987).
109. Ponec,V., and Bond, G.C., “Catalysis by metals and alloys,” Elsevier, Amsterdam, 1995. 110. Portugal, U. L., Santos, A., Damyanova, S., Marques,C., and Bueno, J., “CO2 reforming of CH4
over Rh-containing catalysts, ” J. Mol. Catal. 184, 311 (2002). 111. Potdar, P.S., Roh, H.S., Jun, K.W., Ji, M., and Liu, Z.W., “Carbon dioxide reforming of methane
over Co-precipitated Ni-Ce-ZrO2 catalysts,” Catal. Lett. 84, 95-100 (2002). 112. Qin, D., and Lapszewicz, J., “Study of mixed steam and CO2 reforming of CH4 to syngas on MgO-
supported metals,” Catal. Today 21, 551-560 (1994). 113. Qin, D., Lapszewicz, J., and Jiang, X., “Comparison of partial oxidation and steam-CO2 mixed
reforming of CH4 to syngas on MgO-supported metals,” J. Catal. 159, 140-149 (1996). 114. Quincoces, C.E., Dicundo, S., Alvarez, A.M., and Gonzalez, M.G., “Effect of addition of CaO on
Ni/Al2O3 catalysts over CO2 reforming of methane,” Mater. Lett. 50, 21-27 (2001). 115. Quincoces, C.E., Vargas, S.P.D., Grange, P., and Gonzales, M.G., “Role of Mo in CO2 reforming of
CH4 over Mo promoted Ni/Al2O3 catalysts,” Mater. Lett. 56 698-704 (2002). 116. Rasko, J., and Solymosi, F., “Reactions of adsorbed CH3 species with CO2 on Rh/SiO2 catalyst,”
Catal. Lett. 46, 153-7 (1997). 117. Reitmeier, R., Atwood, K., Bennet, H., and Baugh, H., “Production of synthesis gas by reacting
light hydrocarbons with steam and carbon dioxide,” Ind. And Eng. Chem.40, 620-626 (1948). 118. Ribet, S., Tichit, D., Coq, B., Ducourant, B., and Morato, F., “Synthesis and activation of Co–Mg–
Al layered double hydroxides,” J. Solid. State Chem. 142, 382-392 (1999). 119. Richardson, B., Turk, B., and Twigg, M.V., Appl. Catal. A 148, 97 (1996).Aparicio, L.M.,
“Transient Isotopic Studies and Microkinetic Modeling of Methane Reforming over Nickel Catalysts,” J. Catal. 165, 262-274 (1997).
120. Richardson, J.T. and Paripatyadar, S.A., “CO2 reforming of CH4 with supported Rh”, Appl. Catal. 61, 293-309 (1990).

182
121. Richardson, J.T., “Principles of catalyst development,” Plenum Press, New York (1989) p.28-31 122. Richardson, J.T., “Principles of catalyst development.” Plenum Press, New York and London
(1982) p. 135-183. 123. Richardson, J.T., Garrait, M., and Hung, J. –K., “Carbon dioxide reforming with Rh and Pt–Re
catalysts dispersed on ceramic foam supports,” Appl. Catal. A 255, 69-82 (2003). 124. Rihkowski, J.M., Paryjczak, T., Lenik, M., Farbotko, M., and Goralski, J., “Temperature-
programmed reduction of alumina-supported Ni–Pt systems,” J. Chem. Soc., Faraday Trans. 91, 3481-3484 (1995).
125. Roh, H.S., Jun, K.W., Baek, S.C., and Park, S.E., “A highly active and stable catalyst for carbon dioxide reforming of methane: Ni/Ce–ZrO2/θ-Al2O3,” Catal. Lett. 81, 147-151 (2002).
126. Roh, H.S., Koo, K.Y., Jeong, J.H., Seo, Y.T., Seo, D.J., Seo, Y.S., Yoon, W.L., and Park, S.B., “Combined reforming of methane over supported Ni catalysts,” Catal. Lett. April (2007).
127. Rostrup-Nielsen, J.R. “Industrial relevance of coking,”Catal. Today 37, 225 (1997). 128. Rostrup-Nielsen, J.R., and Hansen, J.H., “CO2-reforming of methane over transition metals,” J.
Catal. 144, 38-49 (1993). 129. Ruckenstein E., and Hu. Y.H., “Carbon dioxide reforming of methane over nickel/alkaline earth
metal oxide catalysts,” Appl. Catal. 133, 149-161 (1995). 130. Ruckenstein E., and Hu. Y.H., “Role of Support in CO2 reforming of CH4 to syngas over Ni
catalysts,” J. Catal. 162, 230-238 (1996). 131. Ruckenstein E., and Hu. Y.H., “The effect of precursor and preparation conditions of MgO on the
CO2 reforming of CH4 over NiO/MgO catalysts,” 154, 185-205 (1997). 132. Rudnitskii, L.A., Solboleva, T.N., and Alekseev, A.M., “Hysteresis of thermogravimetric curves of
nickel catalysts for methane conversion in CH4+CO2 mixture,” React. Kinet. Catal. Lett. 26, 149-151 (1984).
133. Sakai, Y., Saito, H., Sodesawa, T., and Nozaki, F, “Catalytic reactions of hydrocarbon with carbon dioxide over metallic catalysts,” React. Kinet. Catal. Lett. 24, 253-257 (1984).
134. Schuurman, Y., Marquez-Alvarez. C., Kroll, V.C.H., and Mirodatos, C., “Unraveling mechanistic features for the methane reforming by carbon dioxide over different metals and supports by TAP experiments,” Catal. Today 46, 185-192 (1998).
135. Schuurman, Y., Mirodatos, C., Ferreira-Aparicio, P., Rodríguez-Ramos, I., and Guerrero-Ruiz, A., “Bifunctional pathways in the carbon dioxide reforming of methane over MgO-promoted Ru/C catalysts,” Catal. Lett. 66, 33-37 (2000).
136. Seok, S., Han, S., and Lee, J., “The role of MnO in Ni/MnO-Al2O3 catalysts for carbon dioxide reforming of methane,” Appl. Catal. A 215, 31-38 (2001).
137. Seok, S.H., Choi, S.H., Park, E.D., Han, S.H., and Lee, J.S., “Mn-Promoted Ni/Al2O3 Catalysts for Stable Carbon Dioxide Reforming of Methane,” J. Catal. 209, 6-15 (2002).
138. Seok, S.H., Choi, S.H., Park, E.D., Han, S.H., and Lee, J.S., “Mn-promoted Ni/Al2O3 catalysts for stable carbon dioxide reforming of methane,” J. Catal. 209, 6-15 (2002).
139. Seshan, K., Barge, H.W., Hally, W., Keulen, A.N.J., Ross, J.R.H., “Natural gas conversion” Elsevier, Amsterdam (1994) p.285
140. Sinfelt, J.H. “Bimetallic catalysts: discovery, concepts and applications,” Wily, New York, 1983. 141. Slagtern, A., Olsbye, U., Blom, R., and Dahl, I.M., “Characterization of Ni on La modified Al2O3
catalysts during CO2 reforming of methane,” Appl. Catal. 165, 379-390 (1997). 142. Slagtern, A., Olsbye, U., Blom, R., and Dahl, I.M., Stud. Surf. Sci. Catal. 107, 497 (1997).

183
143. Solymosi, F., “The bonding, structure and reactions of CO2 adsorbed on clean and promoted metal surfaces,” J. Mol. Catl., 65, 337-358 (1991).
144. Solymosi, F., Kustan, G., and Erdohelyi, A., “Catalytic reaction of CH4 with CO2 over alumina-supported Pt metals,” Catal. Lett. 11, 149-156 (1991).
145. Somorjai, G.A., “Introduction to surface chemistry and catalysis,” Wiley-Interscience, New York (1994).
146. Souza, M.M.V.M., Aranda, D.A.G., and Schmal, M., “Reforming of methane with carbon dioxide over Pt/ZrO2/Al2O3 catalysts,” J. Catal. 204, 498-511 (2001).
147. Swaan, H.M., Kroll, V.C.H., Martin, G.A., and Mirodatos, C., “Deactivation of supported nickel catalysts during the reforming of methane by carbon dioxide,” Catal. Today 21, 571-578 (1994).
148. Takanabe, K., Nagaoka, K., Nariai, K., and Aika, K.I, “Titania-supported cobalt and nickel bimetallic catalysts for carbon dioxide reforming of methane,” J. Catal. 232, 268-275 (2005).
149. Takano, A., Tagawa, T., and Goto, S., “Carbon dioxide reforming of methane on supported nickel catalysts,” J. Chem. Eng. Japan 27, 727-731 (1994).
150. Takayasu, O., Hirose, E., Matsuda, N., and Matsuua, I., Chemistry Express 6, 447-450 (1991). 151. Takayasu, O., Hongo, N., and Masuura, “Noble metal promoted Ni0.03Mg0.97O solid solution
catalysts for the reforming of CH4 with CO2,” Stud. Surf. Sci. Catal. 77, 305-309 (1993). 152. Tang, S., Ji, L., Lin, J., Zeng, H.C., Tan, K.L., and Li, K., “CO2 reforming of methane to synthesis
gas over sol–gel-made Ni/γ-Al2O3 catalysts from organometallic precursors,” J. Catal. 194, 424-430 (2000).
153. Tang, S.B., Qiu, F.L., and Lu, S.J., “Effect of supports on the carbon deposition of nickel catalysts for methane reforming with CO2,” Catal. Today 24, 253-255 (1995).
154. Teuner, S.C.; Neumann, P.; Linde, F.V., “The CALCOR standard and CALCOR economy processes”, Oil Gas European Magazine 3, 44 (2001).
155. Thomas, J.M., and Thomas, W.J., “Introduction to the principles of heterogeneous catalysis,” Academic Press, London and New York (1967) p.14-66.
156. Tichit, D., Medina, F., Coq, B., and Dutartre, R., “Activation under oxidizing and reducing atmospheres of Ni-containing layered double hydroxides,” Appl. Catal. A 159, 241-258 (1997).
157. Tokunaga, O., and Ogasawara, S., “Reduction of carbon dioxide with methane over Ni-catalyst” React. Kinet. Catal. Lett. 39, 69-74 (1989).
158. Tokunaga, O.; Osada, Y.; Ogasawara, S., “Reaction of CO2/CH4 as a high-level heat transport system”, Fuel 68, 990-994 (1989).
159. Tomishige, K., Himeno,Y., Matsuo, Y., Yoshinaga, Y., and Fujimoto, K., “Catalytic performance and carbon deposition behavior of a NiO-MgO solid solution in methane reforming with carbon dioxide under pressurized conditions,” Ind. Eng. Chem. Res. 39,1891-1897 (2000).
160. Tomishige, K., Kanazawa, S., Sato, M., Ikushima, K., and Kunimori, K., “Catalyst design of Pt-Modified Ni/Al2O3 catalyst with flat temperature profile in methane reforming with CO2 and O2,” Catal. Lett. 84, 69-74 (2002).
161. Trimm, D., “Design of industrial catalysts,” Elsevier, New York, 1980 162. Trimm, D.L., “Coke formation and minimisation during steam reforming reactions,” Catal. Today
37, 233-238 (1997). 163. Tsipopuriari, V.A., Efstathiou, A.M., Zhang, Z., and Verykios, X.E., “Reforming of methane with
carbon dioxide to synthesis gas over supported Rh catalysts,” Catal. Today 21, 579-587 (1994).

184
164. Tsipouriari, V.A., and Verykios, X.E., “Carbon and oxygen reaction pathways of CO2 reforming of methane over Ni/La2O3 and Ni/Al2O3 catalysts studied by isotopic tracing techniques,” J. Catal. 187, 85-94 (1999).
165. Tsipouriari, V.A., and Verykios, X.E., “Kinetic study of the catalytic reforming of methane with carbon dioxide to synthesis gas over Ni/La2O3 catalyst,” Catal. Today 64, 83-90 (2001).
166. Tsipouriari, V.A., and Verykios, X.E., “Kinetic study of the catalytic reforming of methane with carbon dioxide to synthesis gas over Ni/La2O3 catalyst,” Catal. Today 64, 83-90 (2001).
167. Tsyganok, A., Suzuki, K., Hamakawa, S., Takehira, K., and Hayakawa, T., “Mg–Al layered double hydroxide intercalated with [Ni(edta)]2− chelate as a precursor for an efficient catalyst of methane reforming with carbon dioxide,” Catal. Lett. 77, 75-86 (2001).
168. Tsyganok, A.I., Tsunoda, T., Hamakawa, S., Suzuki, K., Takehira, K., and Hayakawa, T., “Dry reforming of methane over catalysts derived from nickel-containing Mg–Al layered double hydroxides,” J. Catal. 213, 191-203 (2003).
169. Twigg, M.V., “Catalyst handbook, second edition,” Wolfe Publishing Ltd, London (1989), p34-48. 170. Udengaard, N.R.; Hansen, J.-H. B.; Hanson, D. C.; Stal, J. A., “Sulfur passivated reforming
process lowers syngas H2/CO ratio”, Oil & Gas Journal, 90, 62 (1992). 171. Vernon, P.D.F., Green, M.L.H., Cheetham, A.K., and Ashcroft A.T., “Partial oxidation of methane
to synthesis gas, and carbon dioxide as an oxidising agent for methane conversion,” Catal. Today 13, 417-426 (1992).
172. Wachtman, John B., and Kalman, Zwi H., “Characterization of materials,” Butterworth-Heinemann, Manning (1992) p.145-461.
173. Walter, K., Buyevskaya, O., Wolf, D., and Baerns, M., “Rhodium-catalyzed partial oxidation of methane to CO and H2. In situ DRIFTS studies on surface intermediates,” Catal. Lett. 29, 261-270 (1994).
174. Wang, H.Y., and Au, C.T., “CH4/CD4 isotope effects in the carbon dioxide reforming of methane to syngas over SiO2 spported nickel catalysts”, Catal. Lett. 38, 77 (1996).
175. Wang, J.B., Kuo, L.-E., and Huang, T.-J., “Study of carbon dioxide reforming of methane over bimetallic Ni-Cr/yttria-doped ceria catalysts,” Appl. Catal. A 249, 93-105 (2003).
176. Wang, S., and Lu, G.Q., “A comprehensive study on carbon dioxide reforming of methane over Ni/γ-Al2O3”, Ind. Eng. Chem. Res. 38, 2615 (1999).
177. Wang, S., and Lu, G.Q., “Reaction kinetics and deactivation of Ni-based catalysts in CO2 reforming of methane”, React. Eng. Pollut. Prev 75 (2000).
178. Wang, S., and Lu, G.Q., Carbon dioxide reforming of methane to produce synthesis gas over metal-supported catalysts: state of the art,” Energy & Fuel, 10, 896-904 (1996).
179. Wang, S., and Lu, G.Q.M., “CO2 reforming of methane on Ni catalysts: Effects of the support phase and preparation technique,” Appl. Catal. B 16, 269-277 (1998).
180. Webb. Paul A., Orr, C., Camp, Ronnie, W., Olivier James P., and Yunes, Y. Simon, “Analytical methods in fine particles technology,” Micromeritics Instrument Corporation, Norcross, GA, USA (1997) p.219-268.
181. Wei, J.-M., Xu, B.-Q., Li, J.-L., Cheng, Z.-X., and Zhu, Q.-M., “Ultra stable Ni/ZrO2 catalyst for carbon dioxide reforming of methane,” Appl. Catal. A 196 L167-169 (2000).
182. Wijngaarden R.J., Kronberg, A., and Westerterp, K.R., “Industrial catalysis – optimizing catalysts and processes,” WILEY-VCH Verlag GmbH, D-69496 Weinheim, (1998), p.25-59.
183. Worley, J., and Kvech, S., “ICP-MS,” Web Source:

185
http://www.cee.vt.edu/ewr/environmental/teach/smprimer/icpms/icpms.htm 184. Worner, A., and Tamme, R., “CO2 reforming of methane in a solar driven volumetric receiver–
reactor”, Catal. Today 46, 165 (1998). 185. Yamazaki, O., Nozaki, T., Omata, K., and Fujimoto, K., “Reduction of carbon dioxide by methane
with Ni-on-MgO-CaO containing catalysts,” 21, 1953-1954 (1992). 186. Yan, Q.G., Weng, W.Z., Wan, H.L., Toghiani, H., Toghiani, R.K., and Pittman, C.U., “Activation of
methane to syngas over a Ni/TiO2 catalyst,” Appl. Catal. A 239, 43-58 (2003). 187. Zachariasen, William H., “Theory of X-ray diffraction in crystals,” Chapman & Hall, New York; J.
Wiley; London (1945) p. 1-69. 188. Zhang , X., Lee, C., D. Mingos, M.P., and Hayward, D.O., “Carbon dioxide reforming of methane
with Pt catalysts using microwave dielectric heating,” Catal. Lett. 88, 129-139 (2003). 189. Zhang, H. B., Chen, P., Lin, G.-D., and Tsai,K.-R., “Development of coking-resistant Ni-based
catalyst for partial oxidation and CO2-reforming of methane to syngas,” Appl. Catal. A 166, 343-350 (1998).
190. Zhang, J., Wang, H., and Dalai, A.K., “Effects of metal content on activity and stability of Ni-Co bimetallic catalysts for CO2 reforming of CH4”, Appl. Catal. A. in press (2008).
191. Zhang, J., Wang, H., and Dalai, A.K., “The development of Ni-Co bimetallic catalyst for CO2 reforming of CH4”, J. Catal. 249, 300 (2007).
192. Zhang, Z.; and Verkios, X.E., “Mechanistic aspects of carbon dioxide reforming of methane to synthesis gas over Ni catalysts”, Catal. Today 21, 589 (1994).
193. Zhang, Z.L., and Verykios, X.E., “A stable and active nickel-based catalyst for carbon dioxide reforming of methane to synthesis gas,” J. Chem. Soc. Chem. Commun. 71-72 (1994).
194. Zhang, Z.L., and Verykios, X.E., “Comparative study of carbon dioxide reforming of methane to synthesis gas over Ni/La2O3 and conventional nickel-based catalysts,” J. Phys. Chem. 100, 744-754 (1996).

186
APPENDIX A: CALIBRATION OF MASS FLOW CONTROLLERS A: N2 mass flow controller (setpoint vs measurement at STP )
y = 1.0471x - 1.3205R2 = 1
0
50
100
150
200
250
0 50 100 150 200 250
Setpoint ( ml/min )
Mea
sure
men
t ( m
l /m
in )
B: CH4 mass flow controller (setpoint vs measurement at STP )
y = 1.0965x + 2.1794R2 = 1
0
50
100
150
200
250
0 50 100 150 200 250
Setpoint ( ml/min )
Mea
sure
men
t ( m
l/min
)

187
C: CO2 mass flow controller (setpoint vs measurement at STP )
y = 1.0535x + 0.2535R2 = 1
0
50
100
150
200
250
0 50 100 150 200 250
Setpoint ( ml/min )
Mea
sure
men
t ( m
l/min
)

188
APPENDIX B: CALIBRATION OF GAS CHROMATOGRAPHY

189

190

191

192
APPENDIX C: TEMPERATURE PROFILE OF REACTOR 1) Reactor temperature measurement
2) Reactor temperature profile with furnace length
0
200
400
600
800
1000
0 3 6 9 12 15
Length of Furnace ( cm )
Tem
pera
ture
( o C
)
Setpoint of Furnace:750 oC
Catalyst Charge Zone
Furnace
Reactor
Thermal couple well
Thermal couple
Furnace length 0 cm
Furnace length 15 cm

193
APPENDIX D: CALCULATION OF GIBBS FREE ENERGY
CHANGE OF REACTION USING THIRD LAW METHOD
The Gibbs free energy change of a reaction (∆Go) is a function only of
temperature and can be calculated by third law method (Kyle, 1999):
∆Go = ∆Ho - T∆So
where ∆Ho is standard enthalpy change and ∆So is standard entropy change of the
reaction. The standard enthalpy change ∆Ho of a reaction at temperature T can be
calculated according to the following equation:
∫ ∑+=T
K 298
oip,i
o298K
o d)( Tcv∆H∆H
where cpo is the mole constant-pressure heat capacity of species i and ∑ signifies
the sum over all species. The standard entropy change ∆So at temperature T can be
calculated as follows:
∫ ∑+=T
K 298
oip,io
298.Ko d
)(T
Tcv
∆S∆S
The thermal property data used for the calculation are listed as follows:
Table D-1 Enthalpy of formation, Gibbs function of formation, and absolute entroy at 25 oC, 1 atm (Çengel and Boles, 2006; *Perry and Green, 1997)
Substance ofh
( kJ/kmol )
ofg
( kJ/kmol )
os ( kJ/kmol·K)
Carbon (solid) 0 0 5.74 Hydrogen 0 0 130.68 Carbon monoxide -110,530 -137,150 197.65 Carbon dioxide -393,520 -394,360 213.80 Water vapor -241,820 -228,590 188.83 Methane -74,850 -50,790 186.16 Acetylene 226,730 209,170 200.85 Ethylene 52,280 68,120 219.83 Ethane -84,680 -32,890 229.49 Methanol -200,670 -162,000 239.70 Formaldehyde* -108,600 -102,600 218.66
Data are from Çengel’s textbook unless otherwise specified by the sign of star of “*”.

194
Table D-1 Ideal gas specific heats of various common gases (Çengel and Boles, 2006) cP = a + bT+ cT2 + dT3
( T in K, cP in kJ/kmol·K ) % error Substance a b×102 c×105 d×109 Temp.
range, K Max. Avg.Hydrogen 29.11 -0.1916 0.4003 -0.8704 273-1800 1.01 0.26 Carbon monoxide 28.16 0.1675 0.5372 -2.222 273-1800 0.89 0.37 Carbon dioxide 22.26 5.891 -3.501 7.469 273-1800 0.67 0.22 Water vapor 32.24 0.1923 1.055 -3.595 273-1800 0.53 0.24 Methane 19.89 5.024 1.269 -11.01 273-1500 1.33 0.57 Acetylene 21.80 9.2143 -6.527 18.21 273-1500 1.46 0.59 Ethylene 3.95 15.64 -8.344 17.67 273-1500 0.51 0.13 Ethane 6.90 17.27 -6.406 7.285 273-1500 0.83 0.28 Methanol 19.0 9.152 -1.22 -8.039 273-1500 0.18 0.08 Formaldehyde 22.81 4.078 0.713 -8.701 273-1500 1.41 0.62
in the thesis are taken from the fifth edition of Thermodynamics edited by
Çengel and Boles (2006) and the seventh edition of Perry’s Chemical Engineers’
Handbook edited by Perry and Green (1997). They are listed from the following
tables:
The physical and chemical data used for the calculation in the thesis are taken
from the fifth edition of Thermodynamics edited by Çengel and Boles (2006) and the
seventh edition of Perry’s Chemical Engineers’ Handbook edited by Perry and Green
(1997).
References: Çengel, Yunus A., and Boles, Michael A., “Thermodynamics-An Engineering Approach,” McGraw Hill Higher Education, 5th edition, Appendix 1, p883-993 (2006). Kyle, B.G., “Chemical and process thermodynamics, third edition”, Prentice Hall PTR, New Jersey, p433-511 (1999) Perry, R.H., and Green, R.W., “Physical and chemical data,” Perry’s Chemical Engineers’ Handbook, 7th edition, Section 2 (1997).

195
APPENDIX E: CALCULATION OF CONVERSION AND
SELECTIVITY
When experiments are carried out with N2 as the internal reference, the
calculations are performed assuming that N2 is an inert. The molar flow rate of N2 is
the same before and after reaction, i.e., 222 N
fN
iN FFF == (mol/min), where
superscripts i and f are used to indicate initial and final flow rate, respectively. Hence,
the flow rate of every species in product stream can be calculated using the following
equation based on the results of the gas chromatography (GC) analysis.
2NfN
fjf
j2
mol/min Ff
f , F ×=
where fjf is the fraction of species j in the product obtained from the GC analysis.
The conversion (Xj) and selectivity (Sj) can be calculated as follows:
% 100
ij
fj
ij
j ×=F - FF
X
% 100 2 f
CHi
CH
fH
H44
2
2×
×=
) - F(FF
S
% 100 fCO
iCO
fCH
iCH
fCO
CO2244
×+
=) - F(F) - F(F
F S