required excel training it is mandatory for every … · graphic presentations ... calculate the...
TRANSCRIPT

1
Eco 302-02E: Business and Eco Statistics [CRN # 21235]
Syllabus (Spring 2018): 1/16/2018 – 5/11/2018
Professor: Dr. Kishor Kumar Guru-Gharana
Office: BA 208
Office Hours: MWF 9:40 A.M. -11:00 A.M.; and TR 8:30-9:30 A.M. at BA 208
Class Hours: TR 9:30- 10:45 A.M 1/16/2017 – 5/11/2017 at BA 257
Phone: 903.886.5687 (off); 903.886.5601) (fax)
Email: [email protected]
Required Text: D. A. Lind/W. G. Marchal/S. A. Wathen, Statistical Techniques in Business &
Economics – McGraw Hill Irwin, 17e Year: 2018, ISBN: 9781259666360 (978-1-259-66636-0).
Required Excel Training: It is mandatory for every student of this course to take the Excel training.
You must complete this training to get your Final grade. Here is the link:
https://www.udemy.com/microsoft-excel-2013-from-beginner-to-advanced-and-beyond/
Course Description: A course dealing with statistical concepts including measures of central tendency
and dispersion, probability distributions, the Central Limit Theorem, sampling, estimation, hypothesis
testing, correlation and regression analysis.
Course Prerequisites: Lvl U MATH 176 Min Grade C or Lvl U MATH 1325 Min Grade C
Course Objectives: Student Learning Outcomes: The objective of this course is to provide an
understanding for the undergraduate business student on statistical concepts to include measurements of
location and dispersion, probability, probability distributions, sampling, estimation, hypothesis testing,
regression, and correlation analysis, multiple regression and business/economic forecasting. By
completing this course, the student will learn to perform the following:
1) Calculate and apply measures of location and measures of dispersion.
2) Apply discrete and continuous probability distributions to various business problems.
3) Understand the concepts of null and alternative hypotheses as well as the meaning of type I and type II
errors; perform test of hypothesis as well as calculate confidence intervals.
4) Compute and interpret the results of Bivariate and Multivariate Regression and Correlation Analysis.
5) Use Excel for various Descriptive and Inferential Statistical tools.
Students with Disabilities: The Americans with Disabilities Act (ADA) is a federal anti-discrimination
statute that provides comprehensive civil rights protection for persons with disabilities. Among other
things, this legislation requires that all students with disabilities be guaranteed a learning environment that
provides for reasonable accommodation of their disabilities. If you have a disability requiring an
accommodation, please contact:
Office of Student Disability Resources and Services
Texas A&M University-Commerce, Gee Library, Room 132
Phone (903) 886-5150 or (903) 886-5835
Fax (903) 468-8148

2
Statement of Ethical and Professional Conduct: The College of Business and technology at Texas
A&M University –Commerce faculty, staff and students will follow the highest level of ethical and
professional behavior. We will strive to be recognized as a community with legal, ethical and moral
principles and to teach and practice professionalism in all that we do. In an academic environment we will
endeavor to not only teach these values but also to live them in our lives and daily work. Faculty and staff
will be held to the same standards and expectations as our students. Failure to abide by these principles
will result in sanctions up to and including dismissal.
Actionable Conduct: These are five different types of actions that will bring sanction. They are:
1. Illegal activity: Violation of any local, state or federal laws that prohibit the offender from
performance of his or her duty.
2. Dishonest conduct: Seeking or obtaining unfair advantage by stealing or receiving copies of tests or
intentionally preventing others from completing their work. In addition, falsifying of records to enter or
complete a program will also be considered dishonest conduct.
3. Cheating: The unauthorized use of another’s work and reporting it as your own.
4. Plagiarism: Using someone else’s ideas and not giving proper credit.
5. Conclusion: Acting with others to perpetrate any of the above actions regardless of personal gain.
Sanctions: In the case of staff or faculty the immediate supervisor will be the arbiter of actionable
behavior and will use Texas A&M University Commerce and/or Texas A&M University System Policy
and Procedures as appropriate to guide sanctions. Faculty, guided by clearly delineated policy in the
course syllabus, will be arbiter for in-class violations. All violations will be reported to the dean of the
college of Business and technology to assure equity and to provide appropriate counsel. In addition, the
Dean will maintain the records of violations by students. Second violations will be reviewed by the Dean
and sanctions beyond those of the faculty up to and including suspension and permanent expulsion from
Texas A&M University –Commerce will be considered. Faculty and students are guided by the current
undergraduate and graduate catalogs of the university as well as The Students Guidebook. Faculty, Staff
and Students will always be afforded due process and review as appropriate.
Campus Concealed Carry
Texas Senate Bill - 11 (Government Code 411.2031, et al.) authorizes the carrying of a concealed
handgun in Texas A&M University-Commerce buildings only by persons who have been issued and are
in possession of a Texas License to Carry a Handgun. Qualified law enforcement officers or those who
are otherwise authorized to carry a concealed handgun in the State of Texas are also permitted to do so.
Pursuant to Penal Code (PC) 46.035 and A&M-Commerce Rule 34.06.02.R1, license holders may not
carry a concealed handgun in restricted locations. For a list of locations, please refer to
((http://www.tamuc.edu/aboutUs/policiesProceduresStandardsStatements/rulesProcedures/34SafetyOfEm
ployeesAndStudents/34.06.02.R1.pdf) and/or consult your event organizer). Pursuant to PC 46.035, the
open carrying of handguns is prohibited on all A&M-Commerce campuses. Report violations to the
University Police Department at 903-886-5868 or 9-1-1.
Grading Policy:
Grade Component Points
Two Home ASSIGNMENTS (2*250 = 500) 500
Comprehensive Exam (Chaps: 3, 5. 7, 8, 9, 10, and 13) 500
Final grade in the course is the average from the student’s total score from the sum of Assignments +
Final Exam.

3
Average Range Grade
90%-100% A
80%-89% B
70%-79% C
60%-69% D
Below 60% F
EXAMS SCHEDULE
Exams Window period
starts
Window period ends Chapters Covered
Comprehensive
Exam (7 hrs. time
limit)
8 a.m. Saturday, May
5th
, 2017
11:59 p. m. Tuesday, May 8th
,
2017
3, 5,7, 8, 9, 10, and 13
NOTE THE FOLLOWING:
1. Feel free to ask questions through email or Virtual Office Forum in e-college. I am accessible 24/7
even during weekends or holidays. You can ask any question related to the course topics and I try to
answer them within few hours (maximum 24 hours).
2. This syllabus is tentative for the semester. It is meant to be a guide. Certain topics may be stressed
more or less than indicated in the text books and, depending on class progress, certain topics may be
omitted.
3. Homework problems are assigned and graded every 6-7 weeks. Solution to Assignment problems will
be provided after the deadline for submission.
4. Missed examination: Missing Homework Assignment will result in zero score while missing the Final
will result in grade “F”. There will be no make-up Exams or make-up Assignments.
5. I provide detailed Instructions with examples for each Chapter in class. I also provide power point
slides for the chapters covered in the course.
6. Students are expected to:
a. Read text assignments as scheduled.
b. Read the chapter Instructions and the power point slides provided by the Professor.
c. Work the assigned homework problems independently. Submit the homework problems through
the respective drop-box in e-college by the due date/time.
7. Demeanor: “All students enrolled at the university shall follow tenets of common decency and
acceptable behavior conducive to a positive learning environment”. See Students Guide Book.
8. Attendance Policy: In the online course there is no class attendance. But assignments and tests have
corresponding due dates.
10. Excel will be used to solve numerical problems along with calculator and formulas.
Topical Outline and Schedule of Assignments: The schedule will depend on class progress. Chapter assignments and
tests may be altered as the class progresses. Students should read chapters and power point slides, and chapter Instructions
provided by the Professor.
Chapter Modes of
Instruction
Date/Due
date
Chapter Goals

4
Chapter 1
What is Statistics
Class lectures/PPT
slides/Handouts/email
Jan 16-21 1. Understand why we study Statistics
2. Explain what is meant by descriptive statistics
and inferential statistics
3. Distinguish between qualitative and quantitative
variables
4. Describe how a discrete variable is different from
a continuous variable
5. Distinguish among the nominal, ordinal, interval,
and ratio levels of measurement.
Chapter 2
Describing Data:
Frequency tables,
Frequency
Distributions, and
Graphic
Presentations
Class lectures/PPT
slides/Handouts/email
Jan 22-28 1. Organize qualitative data into a frequency table.
2. Present a frequency table as a Bar Chart or a Pie
Chart.
3. Organize quantitative data into a frequency
distribution.
4. Present a frequency distribution for quantitative
data using histograms, frequency polygons, and
cumulative frequency polygons.
Chapter 3
Describing Data: Numerical measures
Class lectures/PPT
slides/Handouts/email
Jan 29- Feb 4 1. Calculate the arithmetic mean, weighted mean,
median, mode, and geometric mean.
2. Explain the characteristics uses, advantages, and
disadvantages of each measure of location.
3. Identify the position of the mean, median, and
mode for both symmetric and skewed distributions.
4. Compute and interpret the range, mean deviation,
variance, and standard deviation.
5. Understand the characteristics, uses, advantages,
and disadvantages of each measure of dispersion.
6. Understand Chebyshev’s theorem and the
Empirical rule as they relate to a set of observations.
Chapter 5
A Survey of
Probability
Concepts
Class lectures/PPT
slides/Handouts/email
Feb 5-11 1. Define probability.
2Describe the Classical, Empirical, and Subjective
approaches to probability.
3. Explain the terms experiment, event, outcome,
permutations, and combinations
4. Define the terms conditional probability and joint
probability.
5. Calculate probabilities using the Rules of Addition
and the Rules of Multiplication.
6. Calculate the probability using Bayes’ Theorem

5
Chapter 6
Discrete
Probability
Distributions
Class lectures/PPT
slides/Handouts/email Feb 12-18 1. Define probability distribution and random
variable.
2. Differentiate between discrete and
continuous probability distributions.
3 Calculate the mean, variance, and standard
deviation of a discrete distribution.
4. Describe the characteristics and compute
probabilities using the binomial probability
distribution – use of tables and computer.
5. Describe the characteristics and compute
probabilities using the Poisson distribution –
use of tables.
Chapter 7
Continuous
Probability
Distributions
Class lectures/PPT
slides/Handouts/email
Feb 19-25 1. Understand the difference between discrete and
continuous probability distributions.
2. Understand the characteristics of the normal
probability distribution.
3. Define and calculate Z values.
4. Determine the probability is between two points on
a normal probability distribution.
5. Determine the probability an observation is above
or below a point on a normal probability distribution..
Assignment 1
(Chapters 1, 2, 3, 5,
6 and 7)
Uploaded in e-
college Doc Sharing
Sunday,
March 4th
by 11:59 pm
Chapter 8
Sampling Methods
and the Central
Limit Theorem
Class lectures/PPT
slides/Handouts/email
Feb 26-
March 4
1. Explain why a sample is often the only feasible
way to learn something about population.
2. Describe methods to select a sample.
3. Define and construct a sampling distribution of
the sample mean.
4. Understand and explain the central limit theorem.
5. Use the central limit theorem to find probabilities
of selecting possible sample means from a specified
population.
Chapter 9
Estimation and
Confidence
Intervals
Class lectures/PPT
slides/Handouts/email
March 5-
March 11
1. 1. Define a point estimate.
2. Define level of confidence.
3. Construct a confidence interval for a population
mean when the population standard deviation is
unknown: learn about t-distribution.
4. Construct a confidence interval for a population
proportion.
5. Calculate the required sample size for either an
attribute or a variable.
Spring Break March 12 to
March 16
Chapter 10
One Sample Test of
Hypothesis
Class lectures/PPT
slides/Handouts/email
March 19-
April 1
1. Define Hypothesis and Hypothesis testing.
2. Describe the five-step hypothesis-testing
procedure.
3. Distinguish between a one-tailed and a two-tailed

6
test of hypothesis.
4. Conduct a hypothesis test regarding a population
mean.
5. Conduct a test of hypothesis about a population
proportion.
6. Define Type I and Type II errors.
Chapter 13
Linear Regression
and Correlation
Class lectures/PPT
slides/Handouts/email
April 2-
April 15
1. Understand and interpret the terms independent
and dependent variables.
2. Calculate and interpret coefficient of correlation,
the coefficient of determination and the standard
error of the estimate.
3. Calculate the least squares regression line and
interpret the slope and intercept values.
4. Conduct tests of significance on the regression
coefficients.
5. Learn about prediction of dependent variable
using regression.
Assignment 2 Uploaded in e-
college Doc Sharing
Sunday
April 22nd
by
11:59 pm
Chapters 8, 9, 10, and 13
Final Exam: Time
limit 7 hours once
you start the test
(single take and
one stretch)
e-college Window
period starts
at 8 a.m.
Saturday,
May 5th
and
ends at 11:59
p.m. on
Tuesday,
May 8th
Chapters 3, 5, 7, 8, 9, 10, and 13
HOME WORK PROBLEMS TO BE TURNED IN- Dropbox by the Midnight of the due date on
top of each posted Assignment. NO LATE SUBMISSION WILL BE ACCEPTED
Chapters Problem(s) Due Date
Chapters 1-7 Assignment 1 (Uploaded in e-college Doc Sharing) Sunday, March 4th by 11:59 pm
Chapters 8-13 Assignment 2 (Uploaded in e-college Doc Sharing) Sunday, April 22nd by 11:59 pm
Required Text: D. A. Lind/W. G. Marchal/S. A. Wathen, Statistical Techniques in Business &
Economics – McGraw Hill Irwin, 17e Year: 2018, ISBN: 9781259666360 (978-1-259-66636-0).

7
Course Description: A course dealing with statistical concepts including measures of central tendency
and dispersion, probability distributions, the Central Limit Theorem, sampling, estimation, hypothesis
testing, correlation and regression analysis.
Course Prerequisites: Prerequisites: (Lvl U MATH 141 Min Grade C or Lvl U MATH 111 Min Grade C
or Lvl U MATH 1314 Min Grade C) or (Lvl U MATH 176 Min Grade C or Lvl U MATH 1324 Min
Grade C)
Course Objectives: Student Learning Outcomes: The objective of this course is to provide an
understanding for the undergraduate business student on statistical concepts to include measurements of
location and dispersion, probability, probability distributions, sampling, estimation, hypothesis testing,
regression, and correlation analysis, multiple regression and business/economic forecasting. By
completing this course the student will learn to perform the following:
1) How to calculate and apply measures of location and measures of dispersion.
2) How to apply discrete and continuous probability distributions to various business problems.
3) To understand the meaning of a null and an alternative hypothesis as well as the meaning of type I and
type II error. Further, to perform test of hypothesis as well as calculate confidence interval for a
population parameter for a single mean, including use of the “t” and the “Z” tests.
4) Compute and interpret the results of Bivariate and Multivariate Regression and Correlation Analysis.
5) Be able to do basic time series forecasting.
Students with Disabilities: The Americans with Disabilities Act (ADA) is a federal anti-discrimination
statute that provides comprehensive civil rights protection for persons with disabilities. Among other
things, this legislation requires that all students with disabilities be guaranteed a learning environment that
provides for reasonable accommodation of their disabilities. If you have a disability requiring an
accommodation, please contact:
Office of Student Disability Resources and Services
Texas A&M University-Commerce, Gee Library, Room 132
Phone (903) 886-5150 or (903) 886-5835
Fax (903) 468-8148
Statement of Ethical and Professional Conduct: The College of Business and technology at Texas
A&M University –Commerce faculty, staff and students will follow the highest level of ethical and
professional behavior. We will strive to be recognized as a community with legal, ethical and moral
principles and to teach and practice professionalism in all that we do. In an academic environment we will
endeavor to not only teach these values but also to live them in our lives and daily work. Faculty and staff
will be held to the same standards and expectations as our students. Failure to abide by these principles
will result in sanctions up to and including dismissal.
Actionable Conduct: These are five different types of actions that will bring sanction. They are:
1. Illegal activity: Violation of any local, state or federal laws that prohibit the offender from
performance of his or her duty.
2. Dishonest conduct: Seeking or obtaining unfair advantage by stealing or receiving copies of tests or
intentionally preventing others from completing their work. In addition falsifying of records to enter or
complete a program will also be considered dishonest conduct.
3. Cheating: The unauthorized use of another’s work and reporting it as your own.

8
4. Plagiarism: Using someone else’s ideas and not giving proper credit.
5. Conclusion: Acting with others to perpetrate any of the above actions regardless of personal gain.
Sanctions: In the case of staff or faculty the immediate supervisor will be the arbiter of actionable
behavior and will use Texas A&M University Commerce and/or Texas A&M University System Policy
and Procedures as appropriate to guide sanctions. Faculty, guided by clearly delineated policy in the
course syllabus, will be arbiter for in-class violations. All violations will be reported to the dean of the
college of Business and technology to assure equity and to provide appropriate counsel. In addition, the
Dean will maintain the records of violations by students. Second violations will be reviewed by the Dean
and sanctions beyond those of the faculty up to and including suspension and permanent expulsion from
Texas A&M University –Commerce will be considered. Faculty and students are guided by the current
undergraduate and graduate catalogs of the university as well as The Students Guidebook. Faculty, Staff
and Students will always be afforded due process and review as appropriate.
Campus Concealed Carry
Texas Senate Bill - 11 (Government Code 411.2031, et al.) authorizes the carrying of a concealed
handgun in Texas A&M University-Commerce buildings only by persons who have been issued and are
in possession of a Texas License to Carry a Handgun. Qualified law enforcement officers or those who
are otherwise authorized to carry a concealed handgun in the State of Texas are also permitted to do so.
Pursuant to Penal Code (PC) 46.035 and A&M-Commerce Rule 34.06.02.R1, license holders may not
carry a concealed handgun in restricted locations. For a list of locations, please refer to
((http://www.tamuc.edu/aboutUs/policiesProceduresStandardsStatements/rulesProcedures/34SafetyOfEm
ployeesAndStudents/34.06.02.R1.pdf) and/or consult your event organizer). Pursuant to PC 46.035, the
open carrying of handguns is prohibited on all A&M-Commerce campuses. Report violations to the
University Police Department at 903-886-5868 or 9-1-1.
Grading Policy:
Grade Component Points
Two Home ASSIGNMENTS (2*250 = 500) 500
Comprehensive Exam (Chaps: 3, 5. 7, 8, 9, 10, 13 and Forecasting) 500
Final grade in the course is the average from the student’s total score from the sum of Assignments +
Final Exam.
Average Range Grade
90%-100% A
80%-89% B
70%-79% C
60%-69% D
Below 60% F
EXAMS SCHEDULE
Exams Window period
starts
Window period ends Chapters Covered
Comprehensive
Exam
(Seven hrs. time
8 a.m. Saturday,
May 5th
, 2018
11:59 p. m. Tuesday,
May 8th
, 2018
3, 5,7, 8, 9, 10, 13 and Forecasting

9
limit)
NOTE THE FOLLOWING:
1. Feel free to ask questions through email or Virtual Office Forum in e-college. I am accessible 24/7
even during weekends or holidays. You can ask any question related to the course topics and I try to
answer them within few hours (maximum 24 hours).
2. This syllabus is tentative for the semester. It is meant to be a guide. Certain topics may be stressed
more or less than indicated in the text books and, depending on class progress, certain topics may be
omitted.
3. Homework problems are assigned and graded every 6-7 weeks. Solution to Assignment problems will
be provided after the deadline for submission.
4. Missed examination: Missing Homework Assignment will result in zero score while missing the Final
will result in grade “F”. There will be no make-up Exams or make-up Assignments.
5. I provide detailed Instructions with examples for each Chapter in class. I also provide power point
slides for the chapters covered in the course.
6. Students are expected to:
a. Read text assignments as scheduled.
b. Read the chapter Instructions and the power point slides provided by the Professor.
c. Work the assigned homework problems independently. Submit the homework problems through
the respective drop-box in e-college by the due date/time.
7. Demeanor: “All students enrolled at the university shall follow tenets of common decency and
acceptable behavior conducive to a positive learning environment”. See Students Guide Book.
8. Attendance Policy: In the online course there is no class attendance. But assignments and tests have
corresponding due dates.
10. Excel will be used to solve numerical problems along with calculator and formulas.
Topical Outline and Schedule of Assignments:
The schedule will depend on class progress. Chapter assignments and tests may be altered as the class progresses. Students
should read chapters and power point slides, and chapter Instructions provided by the Professor.
Chapter Modes of Instruction Date/Due
date
Chapter Goals
Chapter 1
What is Statistics
Class lectures/PPT
slides/Handouts/email
Jan 16-21 1. Understand why we study Statistics
2. Explain what is meant by descriptive statistics
and inferential statistics
3. Distinguish between qualitative and quantitative
variables
4. Describe how a discrete variable is different from
a continuous variable
5. Distinguish among the nominal, ordinal, interval,
and ratio levels of measurement.

10
Chapter
2 Describing Data:
Frequency tables,
Frequency
Distributions, and
Graphic
Presentations
Class lectures/PPT
slides/Handouts/email
Jan 16-21 1. Organize qualitative data into a frequency table.
2. Present a frequency table as a Bar Chart or a Pie
Chart.
3. Organize quantitative data into a frequency
distribution.
4. Present a frequency distribution for quantitative
data using histograms, frequency polygons, and
cumulative frequency polygons.
Chapter 3
Describing Data: Numerical measures
Class lectures/PPT
slides/Handouts/email
Jan 22-28 1. Calculate the arithmetic mean, weighted mean,
median, mode, and geometric mean.
2. Explain the characteristics uses, advantages, and
disadvantages of each measure of location.
3. Identify the position of the mean, median, and
mode for both symmetric and skewed distributions.
4. Compute and interpret the range, mean deviation,
variance, and standard deviation.
5. Understand the characteristics, uses, advantages,
and disadvantages of each measure of dispersion.
6. Understand Chebyshev’s theorem and the
Empirical rule as they relate to a set of observations.
Chapter 5
A Survey of
Probability
Concepts
Class lectures/PPT
slides/Handouts/email
Jan 29-
Feb 4
1. Define probability.
2Describe the Classical, Empirical, and Subjective
approaches to probability.
3. Explain the terms experiment, event, outcome,
permutations, and combinations
4. Define the terms conditional probability and joint
probability.
5. Calculate probabilities using the Rules of Addition
and the Rules of Multiplication.
6. Calculate the probability using Bayes’ Theorem
Chapter 7
Continuous
Probability
Distributions
Chapter notes/PPT
slides uploaded in e-
college Doc Sharing
Feb 5-19 1. Understand the difference between discrete and
continuous probability distributions.
2. Understand the characteristics of the normal
probability distribution.
3. Define and calculate Z values.
4. Determine the probability is between two points on
a normal probability distribution.
5. Determine the probability an observation is above
or below a point on a normal probability distribution..
Chapter 8
Sampling Methods
and the Central
Limit Theorem
Class lectures/PPT
slides/Handouts/email
Feb 20- 26 1. Explain why a sample is often the only feasible
way to learn something about population.
2. Describe methods to select a sample.
3. Define and construct a sampling distribution of
the sample mean.
4. Understand and explain the central limit theorem.
5. Use the central limit theorem to find probabilities
of selecting possible sample means from a specified
population.

11
Assignment 1
(Chapters 1, 2, 3,
5, 7 and 8)
Uploaded in e-college
Doc Sharing
Sunday,
March 12
by 11:59
pm
Chapter 9
Estimation and
Confidence
Intervals
Class lectures/PPT
slides/Handouts/email
Feb 27-
March 12
1. 1. Define a point estimate.
2. Define level of confidence.
3. Construct a confidence interval for a population
mean when the population standard deviation is
unknown: learn about t-distribution.
4. Construct a confidence interval for a population
proportion.
5. Calculate the required sample size for either an
attribute or a variable.
Spring Break March 13
to
March 17
Chapter 10
One Sample Test of
Hypothesis
Class lectures/PPT
slides/Handouts/email
March 20-
April 2
1. Define Hypothesis and Hypothesis testing.
2. Describe the five step hypothesis-testing
procedure.
3. Distinguish between a one-tailed and a two-tailed
test of hypothesis.
4. Conduct a hypothesis test regarding a population
mean.
5. Conduct a test of hypothesis about a population
proportion.
6. Define Type I and Type II errors.
Chapter 13
Linear Regression
and Correlation
Class lectures/PPT
slides/Handouts/email
April 3-
April 16
1. Understand and interpret the terms independent
and dependent variables.
2. Calculate and interpret coefficient of correlation,
the coefficient of determination and the standard
error of the estimate.
3. Calculate the least squares regression line and
interpret the slope and intercept values.
4. Conduct tests of significance on the regression
coefficients.
5. Learn about prediction of dependent variable
using regression.
Forecasting Class lectures/PPT
slides/Handouts/email
April 17-
April 30
Components of Time Series; Moving Average and
Exponential smoothing methods including Holt’s
double smoothing.
Assignment 2 Uploaded in e-college
Doc Sharing
Sunday
April 30th
by 11:59
pm
Chapters 9, 10, 13 and Forecasting
Final Exam :Time
limit 7 hours once
you start the test
e-college Window
period
starts at 8
Chapters 3, 5, 7, 8, 9, 10, 13 and Forecasting
12
(single take and
one stretch)
a.m.
Saturday,
May 6th
and ends at
11:59 p.m.
on
Tuesday,
May 9th
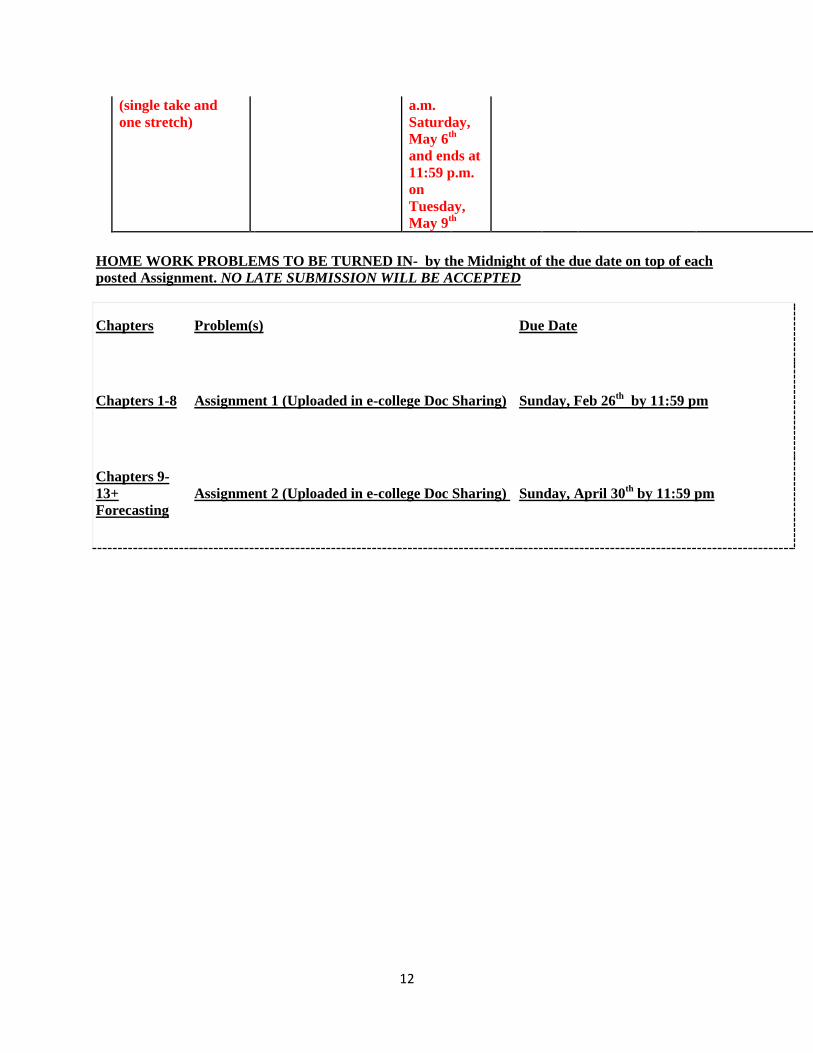
HOME WORK PROBLEMS TO BE TURNED IN- by the Midnight of the due date on top of each
posted Assignment. NO LATE SUBMISSION WILL BE ACCEPTED
Chapters Problem(s) Due Date
Chapters 1-8 Assignment 1 (Uploaded in e-college Doc Sharing) Sunday, Feb 26th
by 11:59 pm
Chapters 9-
13+
Forecasting
Assignment 2 (Uploaded in e-college Doc Sharing) Sunday, April 30th
by 11:59 pm