república del perú - rev 01 - aug 30th 2010
TRANSCRIPT
8/7/2019 República del Perú - Rev 01 - Aug 30th 2010
http://slidepdf.com/reader/full/republica-del-peru-rev-01-aug-30th-2010 1/21
República del Perú

8/7/2019 República del Perú - Rev 01 - Aug 30th 2010
http://slidepdf.com/reader/full/republica-del-peru-rev-01-aug-30th-2010 2/21
Agenda
Ø Micro Vs Macro
Ø
Ø Why Peru
Ø
Ø Peru – Over viewØBrief summary
ØEconomy
ØSalient features
Ø
Ø GDP data analysis
Ø Components of expenditure and analysis
Ø
Ø
8/7/2019 República del Perú - Rev 01 - Aug 30th 2010
http://slidepdf.com/reader/full/republica-del-peru-rev-01-aug-30th-2010 3/21
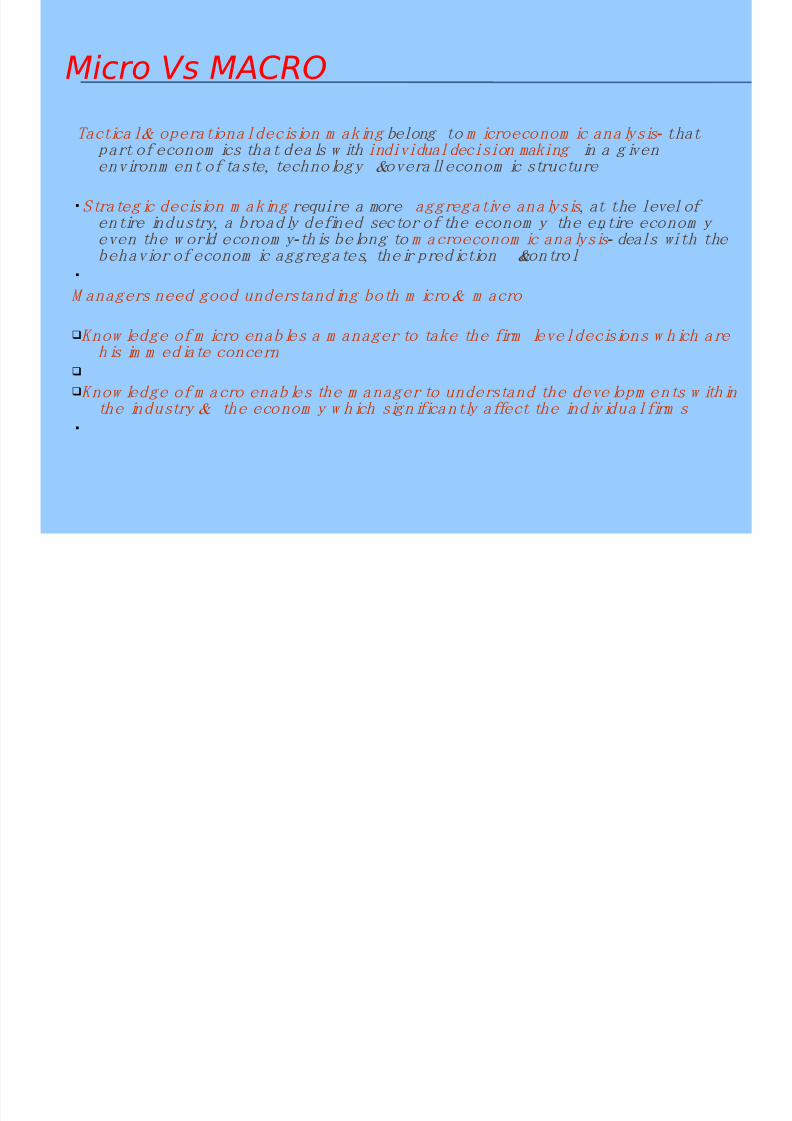
Micro Vs MACRO
& Tactical operationaldecision m aking belong to - m icroeconom ic analysis that part of econom ics that deals w ith individualdecision making in a given
, & environm ent of taste technology overalleconom ic structure
Strategic decision m aking require a more aggregative analysis , at the level of , , entire industry a broadly defined sector of the econom y the entire econom y
- even the w orld econom y this belong to m acroeconom ic analysis - deals with the , & behavior of econom ic aggregates their prediction control
& M anagers need good understanding both m icro m acro
q Know ledge of m icro enables a m anager to take the firm leveldecisions w hich are his im m ediate concern
q
q Know ledge of m acro enables the m anager to understand the deve lopm ents w ithin & the industry the econom y w hich significa ntly affect the individualfirm s

8/7/2019 República del Perú - Rev 01 - Aug 30th 2010
http://slidepdf.com/reader/full/republica-del-peru-rev-01-aug-30th-2010 4/21
Why PERU
ü
ü , %, In2007thePeruvianeconomyexperiencedagrowthrateof9thelargestin
, .% ; , LatinAmericaandthisrepeatedin2008witha98ratein2006and2007ü
ü, , Howeverwiththecurrentglobalcrisisgrowthfor2009isestimatedtocloseat
.% 08fortheyear
ü % Services accountfor53ofPeruvian grossdomesticproductfollowedby
. % manufacturing223ü
ü , Recenteconomicgrowthhasbeenfuelledbymacroeconomicstabilityimproved
, termsoftradeandrisinginvestmentandconsumption
ü ,, In1990the neoliberal governmentended pricecontrols protectionism
, . restrictionson foreigndirectinvestmentandmoststateownershipofcompanies
ü .% ; Theunemploymentratehadincreasedto88byJanuary2009thecurrent , . averagewageinthecountryis1047nuevossoles
ü .% % . Whiletheunemploymentrateis65butonly54areemployedformallyü

8/7/2019 República del Perú - Rev 01 - Aug 30th 2010
http://slidepdf.com/reader/full/republica-del-peru-rev-01-aug-30th-2010 5/21
brief summary Ø A country in western
South America. It is borderedon the north by Ecuador andColombia, on the east by Brazil, on the southeast by Bolivia, on the south by Chile,and on the west by thePacific Ocean.
Ø
Ø A presidential representative democratic republic with amulti-party system.
Ø Is thefourth most populous country in South America. its population is expected toreach approximately 42million in 2050.
I n d e p e n d e n c e :
(
) 28 July 1821 from Spain
P o p u l a t i o n :
, , ( .) ( 29 546 963 July 2010 est 40 )
L a n g u a g e s :
( ), ( ) ,Spanish official Quechua official,Aymara and a large number of minor
Amazonian languages

8/7/2019 República del Perú - Rev 01 - Aug 30th 2010
http://slidepdf.com/reader/full/republica-del-peru-rev-01-aug-30th-2010 6/21
SALIENT FEATURESØ Peru has a - m arke t oriented econom y which is
.the 42nd largest in the w orld C urrency is ( ) ( N uevo Sol PE N internation alstandard 100
= pen 36 U S$ Ø
Ø Trade and industries are centralized in Lim a but
agriculturalexports have created deve lopm ent
. ,in allthe regions A s of2010 G D P per capita in ppp values ,isalmost US$10 000
Ø
Ø ,N ot untilthe 19 90s w hen the liberalizing governm ent ende d price controls ,
protectionism , restrictionson foreign direct investm ent , and most state
.ow nership of com panies Ø
Ø R ecent econom ic grow th has been fuelled by ,m acroeco nom ic stability im proved
term s of trade , and risinginvestment and .consum ption Trade is expected to increase
due to im plem entation ofa free trade
.agreem ent w ith the U S signed in 2006

8/7/2019 República del Perú - Rev 01 - Aug 30th 2010
http://slidepdf.com/reader/full/republica-del-peru-rev-01-aug-30th-2010 7/21
R U A N D G LO B A L C O N N EC TIO N
8/7/2019 República del Perú - Rev 01 - Aug 30th 2010
http://slidepdf.com/reader/full/republica-del-peru-rev-01-aug-30th-2010 8/21
PER U FA C T SH EET

8/7/2019 República del Perú - Rev 01 - Aug 30th 2010
http://slidepdf.com/reader/full/republica-del-peru-rev-01-aug-30th-2010 9/21

8/7/2019 República del Perú - Rev 01 - Aug 30th 2010
http://slidepdf.com/reader/full/republica-del-peru-rev-01-aug-30th-2010 10/21

8/7/2019 República del Perú - Rev 01 - Aug 30th 2010
http://slidepdf.com/reader/full/republica-del-peru-rev-01-aug-30th-2010 11/21
Years GDP deflator
2000 .153 763
2001 .155 965
2002 .156 713
2003 .
161 021
2004 .170 979
2005 .176 032
2006 .188 738
2007 .192 177
2008 .194 578
2009 .197 598
2010 .202 295
GDP deflator vs. inflation
. %O ve r the last 10 years the G D P D eflator has gone up by 4 9 annua
Inflation curve Inflation curve

8/7/2019 República del Perú - Rev 01 - Aug 30th 2010
http://slidepdf.com/reader/full/republica-del-peru-rev-01-aug-30th-2010 12/21
Components of GDP Expenditure
Method Nuevo Sol
Years 2005 2006 2007 2008 2009 2010
GDP .261 7 .302 3 .335 2 .372 6 .381 7 .417 6
Privateconsumption
.173 1 .186 6 .206 3 .237 3 250 266
Government consumption
.26 3 .28 8 .30 1 .33 3 .39 5 .43 3
Gross fixedinvestment
.47 4 .58 1 .71 3 .95 8 .78 7 .100 3
Net exports .15 4 .26 2 .21 7 .2 5 .13 6 7
Domesticdemand
.246 2 276 .313 5 .370 2 .365 8 .410 6
------Private consumption

8/7/2019 República del Perú - Rev 01 - Aug 30th 2010
http://slidepdf.com/reader/full/republica-del-peru-rev-01-aug-30th-2010 13/21
rivate and Public investment growth
A
ll
indicatedf
ig
in
Billi on
Nue vo
Sol

8/7/2019 República del Perú - Rev 01 - Aug 30th 2010
http://slidepdf.com/reader/full/republica-del-peru-rev-01-aug-30th-2010 14/21
components of GDP
All indicated fig in Billion Nuevo Sol

8/7/2019 República del Perú - Rev 01 - Aug 30th 2010
http://slidepdf.com/reader/full/republica-del-peru-rev-01-aug-30th-2010 15/21
Components of GDPOrigin of GDP (Ns bn at constant 1994 prices)
2005 2006 2007 2008 2009 2010
GDP at factor cost 148.6 160.1 174.3 191.5 193.1 206
Agriculture 12.3 13.3 13.7 14.6 15 15.6
Industry 40.8 43.7 48.1 52.8 50.5 55.2
Services 92.5 99.8 108.9 120.1 123.7 131
8/7/2019 República del Perú - Rev 01 - Aug 30th 2010
http://slidepdf.com/reader/full/republica-del-peru-rev-01-aug-30th-2010 16/21
Sectoral Contribution to GDP2005 2006 2007 2008 2009 2010
Agriculture .6 6 .6 4 .6 1 .5 9 6 .5 8
Industry .31 3 .33 8 .33 8 .33 9 .32 1 33
Services .53 3 .51 2 .51 6 .51 7 .53 2 .52 6
----- Agriculture

8/7/2019 República del Perú - Rev 01 - Aug 30th 2010
http://slidepdf.com/reader/full/republica-del-peru-rev-01-aug-30th-2010 17/21
Parameter 2005 2006 2007 2008 2009 2010
Private consumption in constant prices in
bn NS
.102 9 .109 5 .118 6 129 132 .138 4
Population in Million .27 9 .28 3 .28 8 .29 2 .29 6 30
Per capita private consumption in Nuevo
sol
.3688 172 .3869 258 .4118 056 .4417 808 .4459 .4613 333
Personal disposable income in Billion NS
.157 3 .164 9 .177 2 .198 7 .190 9 .193 7
Per capita Personal Disposable income in
NS
.5637 993 .5826 855 .6152 778 .6804 795 6449 .6456 667
MPC .0 868421 .0 739837 .0 483721 - .0 384615385 .2 285714
MPC calculation from PDI
= /MPC Change in consumption Change in personal disposable Income

8/7/2019 República del Perú - Rev 01 - Aug 30th 2010
http://slidepdf.com/reader/full/republica-del-peru-rev-01-aug-30th-2010 18/21
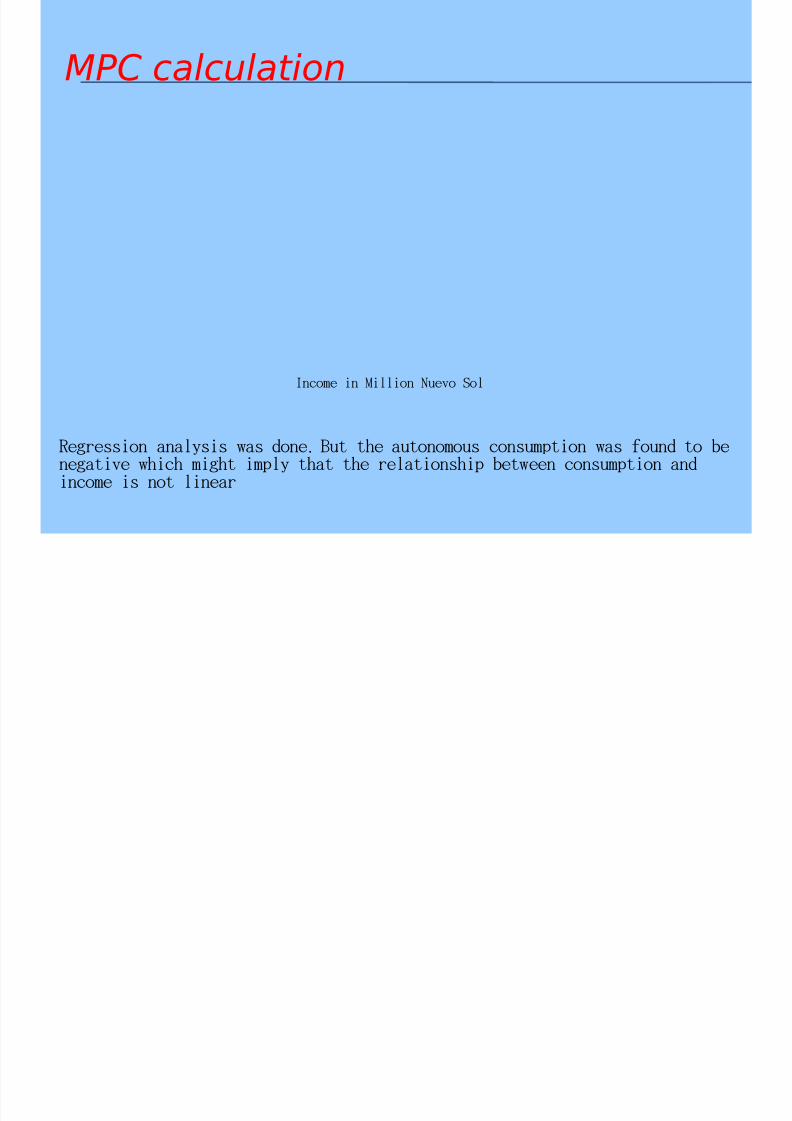
MPC calculation
.Regression analysis was done But the autonomous consumption was found to be negative which might imply that the relationship between consumption and
income is not linear
Income in Million Nuevo Sol

8/7/2019 República del Perú - Rev 01 - Aug 30th 2010
http://slidepdf.com/reader/full/republica-del-peru-rev-01-aug-30th-2010 19/21
Path ahead
v Analysis of the critical components of the GDP and theindustry and sectoral interplay therein
v Peruvian Central Bank and related policy and regulatory
decisions
v Key Government policies and impact on economicdevelopment
v The Peruvian banking industry and its money market
v Employment in Peru (and related labour policy and impact)
v Organized and unorganized sector and the shadoweconom

8/7/2019 República del Perú - Rev 01 - Aug 30th 2010
http://slidepdf.com/reader/full/republica-del-peru-rev-01-aug-30th-2010 20/21

8/7/2019 República del Perú - Rev 01 - Aug 30th 2010
http://slidepdf.com/reader/full/republica-del-peru-rev-01-aug-30th-2010 21/21