republic of serbia - the world bank · ict information and communication technology ... republic of...
TRANSCRIPT

Republic of Serbia
Modernization and Optimization of Public Administration Program
Technical Assessment
April 20, 2016
Global Governance Practice
Europe and Central Asia Region
Document of the World Bank
Pub
lic D
iscl
osur
e A
utho
rized
Pub
lic D
iscl
osur
e A
utho
rized
Pub
lic D
iscl
osur
e A
utho
rized
Pub
lic D
iscl
osur
e A
utho
rized

CURRENCY EQUIVALENTS
(Exchange Rate Effective as of February 29, 2016)
RSD 113.44=US$ 1
FISCAL YEAR
January 1 – December 31
ABBREVIATIONS AND ACRONYMS
Regional Vice President:
Global Practice Vice President:
Senior Global Practice Director:
Cyril E. Muller
Jan Walliser
Deborah L. Wetzel
Country Director: Ellen A.Goldstein
Practice Manager: Adrian Fozzard
Task Team Leader(s): Raymond Muhula/Srdjan Svircev
BSL Budget System Law
DBB Direct Budget Beneficiary
DP Development Partner
DLI Disbursement Linked Indicator
EU European Union
FMIS Financial Management Information System
FTE Full-time Equivalent
GDP Gross Domestic Product
GoS Government of Serbia
HRM Human Resources Management
IBB Indirect Budget Beneficiary
ICT Information and Communication Technology
IMF International Monetary Fund
M&E Monitoring and Evaluation
MoF Ministry of Finance
MPALSG Ministry of Public Administration and Local Self-Government
MTEF Medium-term Expenditure Framework
NES National Employment Service
NPV Net Present Value
OECD Organisation for Economic Cooperation and Development
PAR Public Administration Reform
PDO Project Development Objective
PEFA Public Expenditure and Financial Accountability
PFM Public Financial Management
PforR Program-for-Results
PPL Public Procurement Law
PPO Public Procurement Office
RC Republic Commission for the Protection of Rights in Public Procurement
Procedures
RINO Registry of Settlements of Pecuniary Commitments
SIGMA Support for Improvement in Governance and Management
SOE State-owned Enterprise
USAID United States Agency for International Development

REPUBLIC OF SERBIA
Modernization and Optimization of Public Administration Program
Table of Contents
I. PROGRAM DESCRIPTION ................................................................................................................... 1
A. The Action Plan for Implementation of Public Administration Reform ............................. 1
B. The Program on Modernization and Optimization of Public Administration ..................... 3
C. Program Result Areas (Boundaries) .................................................................................... 4
D. Choice of Instrument............................................................................................................ 5
II. PROGRAM STRATEGIC RELEVANCE......................................................................................... 6
A. Country Context ................................................................................................................... 6
B. Government Support for Public Sector Reform................................................................... 7
C. Human Resource Management ............................................................................................ 8
D. Public Financial Management............................................................................................ 13
E. Public Procurement ............................................................................................................ 16
III. TECHNICAL SOUNDNESS ................................................................................................................. 18
A. Strengthening Public Sector Efficiency ............................................................................. 18
B. Key Result Areas Supported by the ‘Program’ .................................................................. 18
C. Lessons from Experience ................................................................................................... 29
IV. INSTITUTIONAL ARRANGEMENTS ........................................................................................... 30
V. PROGRAM EXPENDITURE FRAMEWORK ............................................................................. 33
VI. PROGRAM MONITORING AND EVALUATION .................................................................... 37
A. PAR Strategy and Action Plan M&E Framework ............................................................. 37
B. Program M&E Arrangements ............................................................................................ 37
C. Disbursement Linked Indicators ........................................................................................ 38
VII. PROGRAM ECONOMIC VALUATION ........................................................................................ 51
VIII. EVALUATION OF TECHNICAL RISKS ..................................................................................................... 56
List of Tables
Table 1: Public Sector Wages as Percentage of Private Sector Wages by Occupation .............................. 12
Table 2: Mapping of Reform Path 1 - Strategic and Technical Soundness of DLIs ................................... 22
Table 3: Mapping of Reform Path 2 - Strategic and Technical Soundness of DLIs ................................... 25

Table 4: Mapping of Reform Path 3 - Strategic and Technical Soundness of DLIs ................................... 29
Table 5: Lessons Applied During Program Design .................................................................................... 30
Table 6: Program Expenditure Framework (US$) ...................................................................................... 34
Table 7: Structure of Program Expenditure (Percent)................................................................................. 34
Table 8: Structure of Program Financing .................................................................................................... 34
Table 9: Program Expenditure Framework by Institution (USD) ............................................................... 35
Table 10: Summary of Disbursement Linked Indicators and verification protocol .................................... 39
Table 11: DLI Verification Protocols ......................................................................................................... 41
Table 12: Program Results Framework ...................................................................................................... 46
Table 13: Summary Economic Analysis (USD) ......................................................................................... 51
Table 14: Result Area 1, Scenario 1(USD) Wage bill reduces by 1% ........................................................ 52
Table 15: Result Area 1, Scenario 2 (USD) Wage Bill Reduced By 3 % ................................................... 52
Table 16: Economic Analysis Result Area 2 (USD) ................................................................................... 53
Table 17: Economic Analysis Result Area 3 (USD) ................................................................................... 55
Table 18:Program Action Plan .................................................................................................................... 59
List of Boxes
Box 1: Principles of the European Administrative Space ............................................................................. 8
List of Figures
Figure 1. Objectives of the Public Administration Strategy ......................................................................... 2
Figure 2: Government Wage Bill (Percentage of GDP) ............................................................................... 9
Figure 3. Serbia: Trends in Wage Bill ........................................................................................................ 10
Figure 4: Public Expenditures and Financial Accountability Assessment, 2015 ........................................ 14
Figure 5. Result Chain for Result Area 1: Improved Human Resource Management ................................ 21
Figure 6. Result Chain for Result Area 2: Improved Financial Management ............................................. 25
Figure 7. Result Chain for Result Area 3: Improved Public Procurement .................................................. 28
1
I. PROGRAM DESCRIPTION
1. The proposed Modernization and Optimization of Public Administration (the
‘Program’) will support the efforts of the Government of Serbia (GoS) to improve
efficiency in the public administration system. The Program will do this by focusing on key
areas of the administrative system, with particular implications for public spending in personnel
costs, financial commitments (including the management of arrears), and the purchase of goods
and services. While the Program is strategically based on the Public Administration Reform
(PAR) Strategy and the Action Plan for the Implementation of the PAR Strategy, it is also
influenced by the Procurement Strategy (2014) and the Public Financial Management (PFM)
Reform Strategy (2015). The main of objective of the Program is thus to improve efficiency in
the management of employment and finances in the public sector as set out in the Action Plan for
the Implementation of the PAR Strategy (the Government’s program).
A. The Action Plan for Implementation of Public Administration Reform
2. The PAR Strategy was launched in 2014 as the overarching road map for
supporting public sector reform. It was designed to succeed the PAR Strategy of 2004 whose
Action Plans covered the periods 2004–2008 and 2009–2012. The overall objective of the PAR
Strategy is to improve the ability of the public sector to deliver high quality services to citizens
and business entities, as well as significantly contribute to the economic stability, and increase of
the living standard (GoS 2014). While the 2004 strategy focused on the legal framework of the
public administration, the 2014 PAR Strategy is more broad-designed to expand reform of the
public administration system covering broader functional objectives.
3. The Public Administration Strategy is supported by the Action Plan for the
Implementation of the PAR Strategy (Action Plan) launched in 2015. The custodian of the
Action Plan in the Ministry of Public Administration and Local Self-Government (MPALSG).
However, specific areas of competence are implemented by relevant ministries. The Action Plan
operationalizes the PAR Strategy and provides specific result areas and a framework for
measuring and monitoring the results. Its five main objectives (result areas) are aligned with the
key areas of the PAR Strategy, namely (a) Improvement of organizational and functional Public
Administration subsystems; (b) Introduction of a harmonized public service system relying on
merits and improvement of Human Resources Management (HRM); (c) Enhancement of public
finance and public procurement management; (d) Increase of legal security and improvement of
the business environment and the quality of public services provision; and (e) Increase of citizen
participation, transparency, improvement of ethical standards, and responsibilities in
performance of public administration activities. The Action Plan is supported by other
documents, notably the Procurement Strategy adopted in 2014 and the PFM Reform Program
adopted in 2015. To improve citizen participation and transparency, the Government adopted the
Action Plan for Open Government Partnership on December 25, 2014.
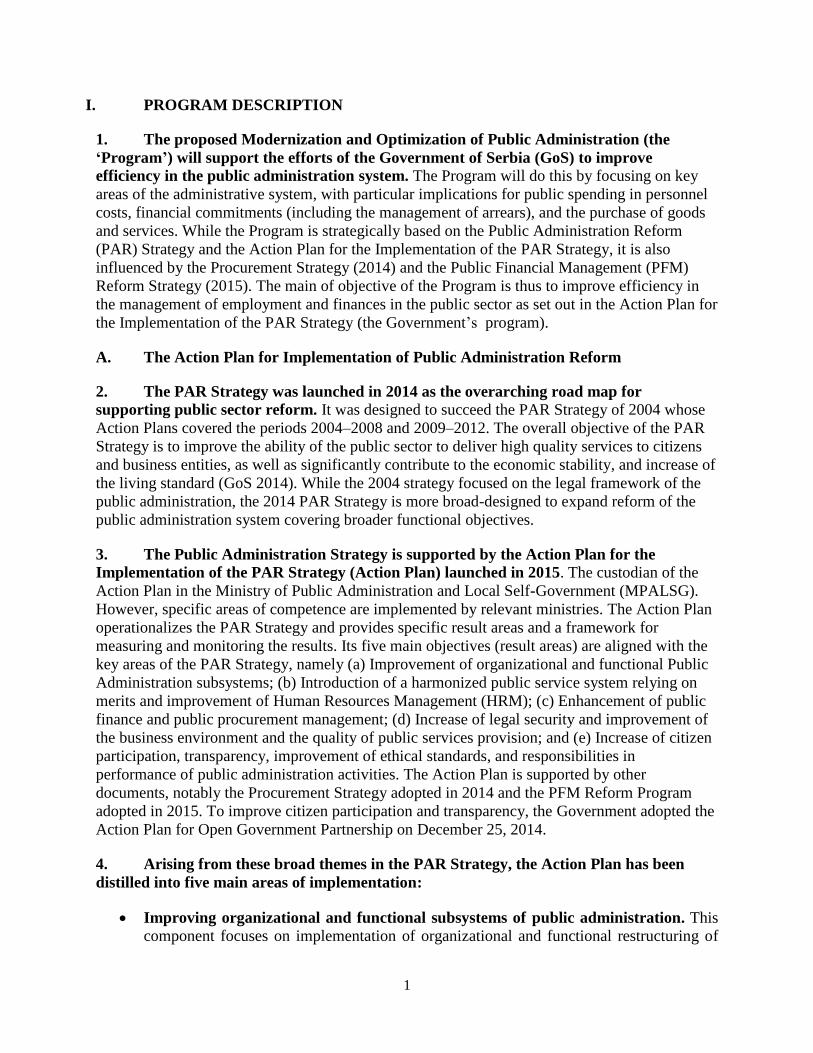
4. Arising from these broad themes in the PAR Strategy, the Action Plan has been
distilled into five main areas of implementation:
Improving organizational and functional subsystems of public administration. This
component focuses on implementation of organizational and functional restructuring of

2
Organizatioal and
functional subsystem
Effectiveness Public Finance
and Procurement
PAR Efficiency Transparency
Merit-based HRM system
Legal Security
public administration to improve efficiency. It also addresses improvement of
decentralization of public administration; improvement in the management public
policies, and the establishment of the legal and institutional framework for integrated
strategic management. Finally, the component covers development of the institutional
and legal framework for e-Government.
Establishing a harmonized public service system on merits and improvement of HR
management. This component addresses the development of a fair and transparent
system for compensation in the public sector; improvement of HRM in the state
administration; improvement of HRM in the broader public administration system; and
professional development of employees.
Figure 1. Objectives of the Public Administration Strategy
Improving PFM and public procurement. This component supports preparation of the
Public Finance Reform Program and improvements in the budget planning and
preparation process. It also covers improvements in financial management systems and
controls as well as internal audit. Additional areas include functional improvement of
budget inspection and public procurement. Among the key areas of focus in public
procurement is the improvement of centralized public procurement systems and the law
on public procurement.
Increasing of legal security and improving business environment and the quality of
public services. This component seeks to improve the Government legislative processes
as a part of a wider system of managing Government policy. It will also support:
improvement of administrative procedures in decisions regarding the rights, obligations,
and interest of citizens and other entities; and the reform of inspection supervision to
ensure protection of the public interest, reduce administration cost of inspection, and

3
increase the legal security of subjects of inspection supervision. Finally, it will introduce
and promote mechanisms to ensure the quality of service delivery through the
establishment of quality management systems in the public administration.
Increasing of citizen participation, transparency, promotion of ethical standards,
and responsibility in the performance of public administration. This component will
improve exchange of Government information, strengthen the integrity of employees in
public administration and reduce corruption by strengthening of prevention mechanisms.
The component will also support measures to strengthen external oversight of public
bodies and the delivery of public services through the Ombudsman and State Audit
Institution.
5. Implementation of PAR Strategy began in 2014. The Government has made some
progress in various areas of the Reform Strategy, signaling a strong intention to continue on the
reform path. The activities initiated and conducted in 2014 have been largely foundational—to
provide the basis for the implementation of the major reform activities in the Action Plan during
2015–2017. As such, they have revolved around legal and policy development. For instance, to
strengthen the integrity of public institutions, the National Assembly adopted the Law on Civil
Servants in September 2014 and the Law on Protection of Whistle-Blowers was adopted in
November 2014. Important steps have also been taken to strengthen HRM and public
administration at the local level.
6. A number of development partners are actively supporting the Government’s
program. The European Union (EU) is preparing a Sector Budget Support operation that will
cover some elements of the Government’s program and is designed to be complimentary to this
Program. The EU has worked with the Bank both in the timing of both operations and in aligning
coverage of specific result areas. EU financing also includes a Technical Assistance (TA)
component to support the implementation of activities. Other DPs are providing direct support to
individual ministries, covering some elements of the Program. For instance, the Government of
Norway is working closely with the Ministry of Interior to support internal reorganization and
additional reforms. The United Nations Development Programme (UNDP) is also implementing
a Technical Assistance Program in the MPALSG with financing from the Government of
Norway. The United States Agency for International Development (USAID) has supported the
Public Investment Management and Program Budgeting, and the German Agency for
International Cooperation is developing a new program that would include a governance
component. Finally, the International Monetary Fund (IMF) has an active 36-month Stand-By
Arrangement with the GoS, covering the several aspects supported by the Program.
B. The Program on Modernization and Optimization of Public Administration
7. The Program will support the key results in the three-year duration of the Action
Plan (2016–2018). The Program budget envelope is US$75 million. This constitutes about one-
fourth of the overall budget, estimated at US$242 million, needed to implement the
Government’s program. The Program will support discrete elements of the expenditure
framework for the Action Plan, implemented by threeinstitutions the Ministry of Public
Administration and Local Self Government (MPALSG), Treasury Administration, and the
Public Procurement Office (PPO). The Program boundaries are defined around two out of the
five objectives of the Government’s program. Focus is on objectives 2 and 3: establishing a

4
harmonized public service system on merits and improvement of HRM and improving public
financial and public procurement management. Objectives 1, 4, and 5 are not included in the
Program because the majority of these activities are covered in the ongoing work on functional
review also undertaken by the Bank.The EU Sector Budget Support, currently under preparation,
is also heavily invested in objectives 4 and 5.
8. This selective approach is deliberate. It is aimed at focusing on the specific areas of
efficiency, linked to the immediate concerns of the Government’s fiscal consolidation program.
It is also designed to enhance synergy between this operation and others envisaged by other DPs,
notably the EU. Finally, it also reflects the key areas where there has been sustained engagement
by the Bank through operational and knowledge products.
9. The Program Development Objective (PDO) is to improve efficiency in public sector
employment and finances. Progress toward the achievement of the objective will be measured
using the following outcome indicators:
PDO Indicator 1. Share of public administration employees assigned to new pay grades
according to the Law on Public Sector Employees Salary System (percentage);
PDO Indicator 2. Total number of public administration employees at or under the
annual ceiling prescribed by the Law on Ceilings on the Number of Employees(Yes/No);
PDO Indicator 3. Share of redundant public administration employees receiving
redundancy payments pursuant to provisions of Law on Ceilings on the Number of
Employees, Civil Servants Law and Labor Law (percentage);
PDO Indicator 4. Share of public procurement contracts, within the category of Public
Authorities, over RSD 5 million in value, signed in a fiscal year of the Borrower, in 90
days or less, between the date of issuance of bidding documents and signing of the public
procurement contract (percentage);
PDO Indicator 5. Value of public procurement contracts awarded through Framework
Agreements (RSD); and
PDO Indicator 6. Percentage of commitments in budget execution system entered within
the required deadline per the Law on Deadlines for Payments in Commercial Transactions
(percentage).
C. Program Result Areas (Boundaries)
10. The Program boundaries are defined along these three key result areas.
11. Result Area 1: Improved Human Resource Management. Key outcomes under this
result area are strengthened efficiency in management of pay and grading of public sector
employees and strengthened efficiency in management of numbers of public sector employees.
The Program will support the Government’s program to develop a system for managing its staff
and monitoring the wage bill. Key activities include development and management of a registry

5
of all employees in the public sector; implementation of ceilings on the maximum number of
staff, selective downsizing, and preparation; and implementation of an affordable, market-based
pay and grading system in the public administration.
12. Result Area 2: Improved Financial Management. Key outcomes under this result area
are enhanced institutional coverage of the Financial Management Information System (FMIS)
and improved management of Government expenditure arrears. The Program will support the
expenditure framework linked to the planning, management, and supervision of the financial and
fiscal system of the Government. This will include the strengthening of budget execution and
monitoring to ensure improved coverage of budget beneficiaries in the FMIS. It will support the
Government’s plans to improve financial and budget information, commitment control and
arrears, and the overall monitoring and control of budget execution of Indirect Budget
Beneficiaries (IBBs). The Program will support Treasury operations; expansion and
technological upgrading of capacity for more efficient business; establishment of a centralized
payroll system; and improvements in business process automation.
13. Result Area 3: Improved Procurement Management. Key outcomes under this result
area are strengthened efficiency in procurement processes and strengthened economy in bulk
procurement (Framework Agreement). The Program will support training of officers involved in
the public procurement process; preparation of procurement tools and manuals; development of a
systematic approach to measure the performance of the public procurement system; preparation
and determination of the Bill on Amendments to the Law on Public Procurement; publication of
juridical review against the Republic Commission for the Protection of Rights in Public
Procurement Procedures (RC) decisions made by the Administrative Court (second instance in
the review system); improvement of the training level of certified public procurement officials
and adoption of the value-for-money methodology and guidelines for implementation of the
‘Life cycle product cost’ concept; and further developing the use of information and
communication technology (ICT) (e-Government) to enhance efficiency in procurement.
D. Choice of Instrument
14. The Program-for-Results (PforR) instrument reinforces the focus on results that is
central to the Government’s program. All Program funds will be disbursed against the
achievement of disbursement linked indicators (DLIs). This supports the Government’s efforts to
tackle difficult, yet feasible, areas of reform, with results orientation creating the enabling
environment for sustaining the reform momentum currently under way. This is designed to
enable the strengthening of country systems and to build a strong Government ownership for the
reform agenda. Specifically, the PforR will facilitate a strategic focus on the specific results that
the Government aims to achieve; strengthen the Government’s implementation systems without
creating parallel systems and additional requirements; sharply focus on efficiency and directly
supporting the Government’s own reform program; and finally, provide a direct focus on results
that are measurable over a specific duration. While the PforR operation is expected to support
only a select set of issues in the Government’s program, strengthening these selected areas will
have a multiplier effect on the implementation of the rest of the reform program by supporting
upstream reforms that are critical for the realization of the development goals of the other
segments of the program. This Program also complements the Sector Budget Support operation

6
currently under preparation by the EU and which is also expected to support a significant portion
of the Government’s program.
II. PROGRAM STRATEGIC RELEVANCE
A. Country Context
15. The Republic of Serbia is an upper middle income country with a Gross National
Income per capita of US$ 5,820 and a population of approximately seven million. Serbia
emerged from political realignments that followed the breakup of the former Yugoslavia in 1991.
A political union with Montenegro lasted until 2006 when each country became a sovereign
state, following a referendum in favor of Montenegro’s independence. During the final years of
the union and the first few years of the new Serbian state (2001-2008), real Gross Domestic
Product (GDP) averaged 5 percent annually and poverty headcount declined from 14 percent in
2002 to 7 percent in 2007. However, the establishment of an independent Serbian state marked
the beginning of a period of political uncertainty characterized by weak and fragmented political
coalitions. Lack of political consensus hindered efforts to focus on critical economic and public
sector reforms.
16. In recent years, Serbia has faced significant economic challenges. Since 2008,
economic growth has stalled, reversing the progress made in earlier years. Average real growth
dropped to zero and fiscal deficits averaged 6 percent of GDP between 2009 and 2014. As a
result, Serbia’s public debt more than doubled from 34 percent of GDP in 2008 to 71 percent at
the end of 2014. Subsidies and guarantees to public utilities, high levels of public sector
employment, inefficient human resource management and weaknesses in financial management
have all contributed to Serbia’s fiscal challenges. With the economy in recession, the vulnerable
poverty rate increased from 6 percent in 2008 to 9 percent in 2010, the latest year for which
comparable data are available. Unemployment increased and by 2012 had reached a high of 24
percent.
17. In 2014 the Government of Serbia adopted an ambitious fiscal consolidation and
structural reform program. The program is supported by a 36-month Standby Arrangement
with the International Monetary Fund (IMF), approved in 2014. In the short term, the program
focuses on the control of aggregate wage and pension expenditures, improvements in tax
administration, and reductions in subsidies to state owned enterprises. The Government has also
begun to address longer term structural problems in the administration of the public sector,
focusing on public sector employment and restructuring to create opportunities for efficiency.
As a result of these measures, total nominal government expenditures declined by 1.7percent as a
result of major savings from wage and pension reforms (down by 11.4 and 3.5percent,
respectively) in 2014. The general government deficit over the first nine months of 2015 was 1.3
percent of full-year GDP, down from 3.9 percent in the same period of 2014. At the same time,
the economy is starting to recover. Serbia moved out of recession in Q2 2015 with growth at 1
percent and is expected to grow by 2 percent in Q3.
18. Although the Government remains committed to implementation of initiated
reforms, there are significant risks to the macroeconomic framework. These risks include:
slower-than-expected economic recovery in the European Union (EU); adverse shocks to capital

7
inflows, relating to the normalization of US interest rates or negative spillovers from other
emerging economies; a deterioration of the financial situation of foreign parent banks, and
implementation of the fiscal consolidation program. To mitigate these risks, the Government is
working closely with the IMF and Bank to ensure that key fiscal reforms in public
administration, SOEs and public utilities stay on track and generate the required fiscal savings.
B. Government Support for Public Sector Reform
19. Serbia initiated the first round of public sector reform in 2004. The strategy was
designed to cover the period 2004–2008. These reforms were anchored in the PAR Strategy and
accompanying Action Plan for the period 2009–2019. Nevertheless, the reform process in 2004–
2013 focused on creating the legal basis for the public administration system and resulted in an
emphasis on ‘form’ rather than ‘function’. A number of laws and regulations were developed,
but the implementation of these laws to generate a value-driven, citizen-oriented service delivery
organization never fully materialized. These foundational elements, however, provided the basis
for a more function-oriented public sector. Thus, the PforR has been strategically designed to
support a new orientation across Government for the emergence of an affordable and effective
public service.
20. Previous Serbian Governments have attempted to reform organization performance
and efficiency gains by focusing on financial allocations. In the process, the organizational
patterns within the public sector have tended to determine the level and nature of financing for
the public sector, leaving the inefficiencies largely intact. The Government recognizes this
challenge and is now launching a new approach to reform aimed at changing the organizational
structure as the basis for sustainable and efficient allocation of human resources. An important
problem with the implementation of public sector reform has been the weak coordination across
key implementing entities as well as capacity shortages.
21. The objective of the PAR is to “ensure further enhancement of the public
administration operations in line with the principles of European Administrative Space,
that is, to create the high quality services for citizens and businesses, and the public
administration in Serbia that will significantly contribute to economic stability and
improved living standard of citizens.”1 While there are no public sector requirements for
accession, several chapters—such as chapter 16 and 29; (taxation and customs); chapter 17
(budgetary framework); chapter 5 (public procurement); and chapter 23 (external audit)—have
recently been the focus of the Government’s attention as part of the wider public sector reform
agenda. The Program is designed to facilitate the Government’s progress toward the achievement
of these capacities, in line with the principles of the European Administrative Space. The
European Commission Progress Report 2014 also emphasized that “strict implementation of the
envisaged PAR is needed to streamline the bloated public sector and to tackle the unfounded
salary differentials in the public administration.”2 PAR is seen as an essential foundation for its
agenda for integration into the EU in line with the National Program for Adoption of EU Acquis
(2013–2016).
1 Government of Serbia. 2014. Public Administration Reform Strategy. Belgrade: MPALSG, p.10. 2 European Commission. 2014. Serbia Progress Report. http://ec.europa.eu/enlargement/pdf/key_documents/2014/20140108-
serbia-progress-report_en.pdf.

8
Box 1: Principles of the European Administrative Space
Reliability and predictability and/or legal dependency
Openness and transparency of the administrative system and promotion of the participation of citizens
and social entities in the decision-making processes
Accountability
Efficiency and effectiveness
Source: Republic of Serbia. 2014. “Public Administration Reform Strategy.” Belgrade: MPALSG.
C. Human Resource Management
22. By European standards, the Serbian public sector wage bill is only slightly larger
than average. Figure 34 compares the aggregate general Government wage bill in Serbia with
the figures for other European countries. As shown, the figure for Serbia (at 12.6 percent of
GDP, before a wage cut in 2014) was about 2 percentage points higher than the average of EU-
28 (10.7 percent) and the new EU member states (10.3 percent). However, it is considerably
higher than in some of the immediate neighbors such as Bulgaria (8.5 percent) and Romania (7.8
percent). The 2014 wage cut reduced Serbia’s wage bill by about 1 percent of GDP, still leaving
it above the regional averages.3
23. This is largely due to relatively high levels of compensation rather than overstaffing.
While there is evidence of overstaffing in the health, judiciary, and police and to some extent,
education sectors, the public service as a whole is not overstaffed when compared with other
European countries. As of December 2014, the Serbian public sector employed 500,538 staff
under permanent and fixed-term contracts. This was equivalent to about seven staff per thousand
population; roughly, the same as the average of the immediate neighbors (Bulgaria, Romania,
and Croatia) and slightly below the average of EU- 28 (7.2) and the new member states (7.3).
The average salary in the Serbian public sector is about 1.83 times Serbia’s per capita GDP. The
equivalent figure for EU-28 is 1.49; for the new member states, 1.37; and for the immediate
neighbors, 1.51.
3 Sources: Serbia: MoF, Financial Plans of Social Security Organizations, MPALSG staff estimates and projections; other
countries: Eurostat. Cited in: MPALSG. 2015. A Modern State - A Rational State: How Many, How and What For. Belgrade:
MPALSG.

9
Figure 2: Government Wage Bill (Percentage of GDP)
Source: MPALSG. 2015. A Modern State – A Rational State: How Many, How and What For. MPALSG, Belgrade.
24. Serbia faces significant challenges in human resource management and related
expenditure in the context of shrinking fiscal space. Serbia’s public sector wage bill
increased from 9 percent of GDP in 2002 peaking at approximately 11 percent in 2008. Across-
the-board staffing reductions and hiring freezes have helped contain the wage bill at an average
of 11 percent of GDP from 2009 to 2014. In recent years, the Government has scaled down the
formula tying wage adjustments to inflation; imposed a solidarity tax (in effect, a wage cut) on
public employees earning more than 60,000 dinars and imposed a ceiling on individual public
salaries. More recently, the Government imposed an additional across the board 10 percent pay
cut (as of November 2014) and modified the budget law to suspend wage indexation altogether
in years in which the share of general Government salaries (excluding severance pay) is expected
to exceed 7 percent of GDP. The Government has also taken measures to reduce the number of
staff, imposing a hiring freeze and a cap on replacements (for each 5 employees who leave, only
1 may be replaced) and sought to reduce overall Government operational costs by 5 percent each
year for three successive years. This approach has succeeded in constraining the overall growth
in wage bill. As shown in Figure 3, spending on wages has declined slightly as a percentage of
consolidated Government expenditure—from 27 percent in 2008 to 24 percent in 2014. Wage
spending has remained roughly constant as a percentage of GDP as Serbia’s GDP declined over
this period.

10
Figure 3. Serbia: Trends in Wage Bill
Source: World Bank. 2015. Public Finance Review. Washington DC: World Bank.
25. In principle, Serbia has a well-developed system for controlling staffing level: in
practice, these controls are ineffective. Every central Government budget organization, at the
time of its creation, is required to have an act of systematization setting out the number of
positions the entity is permitted. However, acts of systematization are revised when new
ministries are created or when the functions of existing ministries are expanded. A 2008
Governmental reorganization, for example, created many such opportunities, by expanding the
number of ministries to 24 and reassigning the functions of 5 ministries which had been
abolished. Acts of systematization are also revised following annual budget negotiations. As
result, it is the budget negotiations, rather than the acts of systematization, that act as the primary
instrument of establishment control.
26. Each year, as part of the annual budget process, each central Government budget
organization is required to fill out a personnel plan. The personnel plan sets out the number
of positions the organization would like to have funded (both existing and new) along with the
title, grade, and estimated salary for each position. In principle, the MoF evaluates each plan to
see if it is justified, given overall budget constraints and Government priorities. In practice, this
does not occur. It is reported that powerful ministries and powerful unions largely dictate any
changes in the authorized staffing levels. The BSL requires that a consolidated personnel plan be
enacted within thirty days of the adoption of the annual budget and that its salary estimates
correspond to the amount allocated in the budget. The personnel plan, however, does not in fact
dictate the number of staff on the Government’s payroll. The figures used in budget negotiations
are strictly notional; they are used only to calculate the wage bill of each budget user and do not
reflect the actual numbers of staff receiving salaries. Instead, the MoF controls the execution of
the wage bill by imposing aggregate ceilings on wages for each budget organization and sticking
to them during budget execution. Most salary payments are paid directly to individual
employees from the central Government treasury. Individual ministries provide the treasury’s
payroll department with the information required to determine the salary of each staff and the
payroll department makes the corresponding transfer to the individual staff. Under this system,
each ministry is free to instruct the payroll department to add staff to the payroll, whether the
position is included in the personnel plan or not.
27. Deficiencies in the human resource information systems have undermined the
ability of the Government to control employment numbers. Recent efforts by the
Government have led to the establishment of the first comprehensive registry of public
employees since 2003. The current registry however, has several shortcomings. Data on the total
0%
5%
10%
15%
20%
25%
30%
2008 2009 2010 2011 2012 2013 2014
% govt exp
% GDP

11
number of employees is inaccurate because participation by individual ministries is voluntary.
The lack of strong information systems at the sector level to monitor staffing and employment
data has undermined the ability of the Government to control the wage-bill in various sectors: the
Ministry of Education, for instance, does not have accurate data on the number of teachers. There
is no mechanism to link the various systems operating at the sector level ministries with the large
public administration payroll systems to monitor staff numbers, increase in staff compliment
over time, and total employment cost. This makes it difficult for the Government to control
staffing and wage bill management across the public sector. While the new Law on Registry is
helpful, effective implementation requires a comprehensive HRMIS both at the sector level and
at the central level.
28. Preliminary data suggest that there are opportunities for substantial staff
reductions in certain sectors and occupations. A recent Government report4 found 7,040
excess nonmedical staff working in Government-financed health care institutions. It also cited
evidence of overstaffing in the ranks of the police, where the ratio of policemen per thousand
population is one the highest in Europe. Similar evidence exists in the education sector, where
the ratio of teaching staff per thousand population is 10 percent higher than the average for the
other European countries for which data are available. In principle, there is potential for even
further staff reductions in the education sector due to the sharp decline in the school-age
population that Serbia has experienced over the last two decades. This has resulted in classes
with extremely low pupil-teacher ratio, particularly in rural areas. A 2009 study by the Bank5
found that consolidating under-enrolled classes by shifting students to other classes in the same
school (and grade) could reduce staffing needs by 10 percent. Consolidating under-enrolled
classes by shifting students to other schools within the same municipality could reduce the cost
of staffing needs by another 25 percent.
29. There are significant problems with the structure of compensation. At present, Serbia
has two employment regimes. This includes one for civil servants (covering most administrative,
financial, and managerial positions) and one for public service employees, covering most
frontline service providers (including teachers and health workers). Both civil servants and
public service employees are paid on the basis of fixed wage scales. The regulations governing
each group (and various subgroups within them) lay out coefficients for each position. These are
then multiplied by a base salary figure, expressed in dinars, and periodically adjusted by the
Government, to determine the wage of each individual.
30. As part of a civil service reform in 2005, a major effort was made to rationalize civil
service salaries. This was intended to eliminate salary anomalies within the civil service so that
similar positions in different ministries would have similar levels of compensation and to adjust
overall salaries to better reflect private sector comparators. The reform required the
reclassification of all civil service positions into what are now 13 grades (5 managerial grades
and 8 executive grades) each defined by a specific scope of responsibilities. The resulting pay
law for civil servants (enacted in May 2006) increased civil service pay by an average of 41.2
percent, with increases in all but the lowest grades.
4 MPALSG. 2015. A Modern State - A Rational State: How Many, How and What For. Belgrade: MPALSG. 5 World Bank. 2009. Serbia: Doing More with Less. Washington, DC: World Bank.

12
31. Wages for public service employees are also determined on the basis of coefficients,
but less systematically. At present, the pay and grading system includes 2,200 job titles, 71
different elements of remuneration, 5 different base salaries, 900 different job coefficients, 19
laws, and a plethora of bylaws that regulate salary levels.
Table 1: Public Sector Wages as Percentage of Private Sector Wages by Occupation
Occupation Percent
Protective services workers 141
Health professionals 114
Chief executives, senior officials, and legislators 109
Drivers and mobile plant operators 102
Numerical and material recording clerks 101
Teaching professionals 99
Business and administration associate professionals 99
Customer services clerks 99
Other clerical support workers 98
Business and administration professionals 95
Legal, social, and cultural professionals 94
Health associate professionals 94
Legal, social, cultural, and related associate professionals 94
General and keyboard clerks 92
Personal service workers 91
Cleaners and helpers 91
Refuse workers and other elementary workers 89
Science and engineering professionals 85
Administrative and commercial managers 82
Information and communications technology professionals 74
Information and communications technicians 71
Source: IPSOS. Note that public sector wages reflect an impact of 10 percent cut in November 2014.
32. There is also evidence of systematic overcompensation in some occupations and
under-compensation in others. A recent Bank-supported study provides an opportunity to
compare public and private sector wages in Serbia. The study, drawing on the 2014 Labor Force
Survey, found that 75 percent of employees in the state sector earn more than the median of all
employed persons in Serbia, compared to only 46 percent of private sector employees.6
However, public sector positions tend to be dominated by white collar occupations requiring
more education and technical skills—and therefore commanding higher salaries—than those in
the private sector. To control for this, the study compares public and private sector wages in
specific occupations. The survey demonstrates that some job categories - security guards, health
care professionals, and chief executives in the public sectors - appear to be overcompensated.
This is even after the 10 percent cut in wages that went into effect in November 2014. Teachers
are paid roughly the same in the private and public sectors. However, other occupations—
6 The state sector includes all public sector employees except those in SOEs. The study also examines wages in a subset of public
employees—those in the ‘administration’ sector—and found a similar result. Note that the relevant chart in the report appears to
be mislabeled, as it reports that 46 percent of private sector employees earn more than the median wage of private sector
employees. By definition, the figure should be 50 percent.

13
including science and engineering professionals, and administrative managers—are underpaid in
the public sector. ICT professionals are particularly underpaid, earning 25 percent less than their
counterparts in the private sector. Overall, this suggests that the Government is paying more than
it needs to some groups of workers while failing to pay enough to attract and retain qualified
staff in others.
33. Finally there serious shortcomings in human resource management practices.
Ineffective formal protection from politically motivated transfers or dismissals, frequent political
appointments, and nontransparent recruitment procedures for middle management positions or
local level recruitment make for a civil service that is still far from a merit-based professional
public administration.7 Uneven application of the current legal frameworks leaves room for
undue influence in the recruitment process. Staffing norms and rules are often inadequate or
violated. According to the provisions of the Civil Servants Act, any new recruitment for an
ordinary civil servant post has to be justified with regard to the Rulebook on Internal
Organization and Systematization and the Annual Staffing Plan and be advertised, whether it is
to be filled by internal or public competition.8 However, selection procedures are not applied
uniformly and managers still have great discretion when choosing candidates from lists drawn up
by selection panels following competitions. For temporary contracts, positions can be allocated
without internal or public competition; therefore, some positions are filled without competitive
criteria.9
D. Public Financial Management
34. While the Government has made progress in strengthening public financial
management, the 2015 Public Expenditure and Financial Accountability (PEFA)
assessment identified important weaknesses in the control framework and its coverage. The PEFA assessment period 2011-2013 was dominated by the aftermath of the global economic
recession which affected macro-fiscal performances and posed particular challenges for public
financial management. Notwithstanding these challenges, the PEFA assessment observed
improvements in relation to the previous assessment in 2010 in the legislative framework for the
budget process, budget classification, multi-year fiscal planning, procurement and external audit.
The assessment also noted significant weaknesses in the composition of expenditure out-turn
compared with originally approved budget, expenditure arrears, oversight of fiscal risk,
predictability in the availability of funds, application of public sector accounting standards and
legislative scrutiny of annual budget law and final accounts. Building on the PEFA Assessment,
the Ministry of Finance has prepared a Public Financial Management Reform Program, aligned
with the broader Public Administration Reforms, which sets priority actions in the short, medium
and long term.
35. Serbia’s current BSL provides a well-defined statutory basis for managing public
expenditures. The BSL provides for a budget that is transparent, comprehensive in scope, and
formulated within a timetable that allows the key actors to carry out their roles. The law
7 European Commission. 2014. Instrument for Pre-Accession Assistance (IPA II) Indicative Strategy Paper for Serbia (2014–
2020). Brussels: European Commission. 8 For more details on how internal and external recruitment opportunities are advertised, see the Civil Service Act, Articles 49-61. 9 OECD. 2013. “Serbia Priorities Report 2013.” SIGMA Country Assessment Reports, 2013/03, OECD Publishing.
http://dx.doi.org/10.1787/5jz2rql40pbs-en.

14
regulates the entire budgetary process, including the planning, preparation, and approval stages
of budget preparation as well as execution and reporting. In institutional terms, it applies to local
Governments as well as public enterprises and some autonomous agencies. Budget preparation
and monitoring is the responsibility of the Budget Department in the MoF. Global budgetary
ceilings and their distribution to budget beneficiaries are made by the Budget Department of the
MoF. Treasury is responsible for the execution of the budget. The disbursement of funds is
centrally controlled through a treasury single account, in accordance with the BSL. At the start of
each quarter, each budget beneficiary provides the Treasury with an estimate of the amount of
cash it will need to execute its budget in the upcoming period. The Treasury then compares the
sum of the estimates from all the budget beneficiaries against the amount of cash it expects to
have on hand and establishes quotas for each budget beneficiary for the period. (Estimates are
due by the 5th of each month. Quotas are determined by the 15th.) These quotas are revised
every month on rolling basis.
Figure 4: Public Expenditures and Financial Accountability Assessment, 2015
A B and B+ C and C+ D and D+
Budget credibility
Comprehensivene
ss and
transparency
Policy based
budgeting
Predictability in
control in budget
execution
Accounting
reporting and
review
External scrutiny
and audit Donor Practices
Aggregate
expenditures out-turn compared to
original approved
budget
Classification of
the Budget
Orderliness and
participation in the annual budget
process
Transparency of
taxpayers obligations and
liabilities
Timeliness and
regularity of accounts
reconciliation
Scope, nature, and
follow-up of external audit
Predictability of
direct budget support
Composition of expenditure out-
turn compared to
original approved budget
Comprehensiveness of information
included in budget
documentation
Multi-year perspective in
fiscal planning,
expenditure policy and budgeting
Effectiveness of measures for
taxpayers
registration and tax assessment
Availability of information on
resources received
by service delivery units
Legislative scrutiny of the
annual budget law
Financial information
provided by donors
Aggregate revenue
out-turn compared to original
approved budget
Extent of
unreported Government
operations
Effectiveness in
collection of tax payments
Quality and
timeliness of in-year budget
controls
Legislative
scrutiny of external audit reports
Proportion of aid
that is managed by use of national
procedures
Stock and
monitoring of
expenditure payment arrears
Transparency of
inter-Governmental
fiscal relations
Predictability in the
availability of
funds for commitment of
expenditures
Quality and
timeliness of
annual financial statements
Oversight of aggregated fiscal
risks from other
public sector entities
Recording and management of
cash balances,
debt, and guarantees
Public access to
key fiscal
information
Effectiveness of
payroll controls
Competition, value
for money and
controls in procurement
Effectiveness of
internal controls
for non-salary expenditures
Effectiveness of
internal audit

15
36. The BSL requires the preparation of a three-year medium-term expenditure
framework (MTEF). The MTEF is revised every year and included in a Fiscal Strategy Report.
However, the forecasts of macroeconomic parameters that are the basis for preparing the MTEF
are often inaccurate, overestimating GDP growth and therefore overestimating resource
availability. Moreover, MTEF projections for the outer years are not taken seriously by
individual budget users. According to the Government’s PFM Strategy, the MTEF and
projections for the two years following the budget year are not ‘considered and observed.’
Estimates and ceilings are not taken as the starting point in preparation of the subsequent years’
budget
37. The budget is not always based on realistic assumptions, with revenues falling well
below targets. In 2014, for example, budget revenues were 6.3 percent below the amount
budgeted for that year. When budget is based on unrealistic revenue projections, the amount of
cash on hand in any given month often falls short of the amount needed to fully fund the initial
budget requests of all budget beneficiaries. Treasury is forced to ration the available funding. It
typically does so by cutting each budget beneficiary’s request by an equal proportion. Unless a
budget beneficiary is able to reduce its immediate expenditure obligations by an equal
proportion, it is forced to run up arrears.
38. Arrears also arise from multiyear commitments that are not adequately covered in
forward estimates. The BSL permits budget beneficiaries to enter into multiannual
commitments or contracts but only up to the level of the medium-term ceilings specified in the
Fiscal Strategy. This constraint is ineffective. This is partly because information on such
commitments is not available. The Treasury does not keep records of such commitments but only
of the portion to be paid in the current year. At the same time, multiyear contractual
commitments are not registered in the FMIS or other systems at the time of their occurrence.
However, it also reflects a willful disregard of the ceilings themselves. Because the ceilings are
only provisional and are largely ignored in the course of preparing the annual budget, budget
beneficiaries do not take them seriously. As a result, budget beneficiaries enter into multiyear
commitments that cannot ultimately be paid.
39. Accumulation of expenditure arrears emerged as a significant problem during the
economic crisis. In June 2013, the FMIS system reported arrears amounting to RSD 84,942
million (US$ 1,003 million) equivalent to six percent of total expenditures in that year. During
2013 the Government negotiated payment plans and conversion to public debt, reducing
outstanding payment arrears to RSD 8.26 billion (about US$ 74 million). Action was also taken
to curb accumulation of arrears, including a Law on Deadlines for Payments in Commercial
Transactions which mandates a timetable for the payment of arrears and fines for Government
officials who fail to pay on time. An electronic Registry of Settlements of Pecuniary
Commitments (RINO) was established to monitor arrears. The RINO data indicates that payment
arrears amounted to RSD 9 billion (US$79 million) at the year-end 2015. However, RINO data
should be interpreted with caution because the data submitted by budget beneficiaries is still not
verified.
40. The Government’s difficulty in controlling spending is exacerbated by the limited
coverage of the electronic budget execution system (FMIS). All budget beneficiaries enter
their payments requests by accessing the FMIS. In the case of DBBs, the Treasury then executes

16
the payment within the budget beneficiaries’ payment quota. However, IBBs, such as such as
courts, prisons, and schools, are not covered by the FMIS. Although the Treasury does process
their payment requests, it is not able to check their requests against their annual budget
appropriations or monthly quotas. Data on spending by IBBs becomes available only at the end
of each year, when each IBB is required to submit the information to its respective DBB.
E. Public Procurement
41. Public procurement in the Republic of Serbia is governed by the PPL of 2013. The
PPL provides for the decentralization of procurement activity to budget entities whilst
streamlining procedures, creating a single register of bidders and reducing the scope for
arbitrarily rejection of bids. It ensures transparency in the public procurement processes and
requires the publication of a wide range of procurement related information through a Public
Procurement Portal. Entities that have total estimated annual procurements of over RSD 1
billion must publish, on their websites, an internal plan for preventing corruption in public
procurement, as well as information about their internal procurement procedures, their annual
procurement plans, and all decisions on contract awards and cancelation of procurement
procedures.
42. The PPL regulates the procedures for awarding public contracts for the
procurement of goods, works, and consultant services. Compared to its predecessor, the 2013
PPL provides for increased transparency in public procurement processes, lays down
comprehensive rules for procurement planning, simplifies the procedures for demonstrating
compliance with mandatory bidding requirements, provides for the creation of a single register of
bidders, reduces the scope for arbitrarily rejecting bids, imposes a duty to record and monitor the
implementation of public procurement contracts, regulates centralized public procurement, and
provides for the possibility of entering into framework agreements.
43. Under the PPL, all announcements of public procurements, by all contracting
authorities, must be published on the Public Procurement Portal, including small-value
public procurements. The PPL requires the publication of other relevant information, including
information on contract amendments; requests for the protection of bidders’ rights; quarterly
reports by contracting authorities on contracts signed and procedures conducted, and the
opinions of the PPO on the use of the negotiated procedure. Access to the content posted on the
portal and its downloading by bidders and other interested parties is provided free of charge. Use
of the portal has increased dramatically since the 2013 PPL went into effect. In the first year of
implementation, the number of daily visits to the portal grew by 5,000, a 600 percent increase.
The number of public procurement procedures announced daily averaged 130—representing a
200 percent increase.
44. Recent (August 2015) amendments to the PPL have further improved the legislative
framework for procurement in Serbia. Entities that have total estimated annual procurements
of over RSD 1 billion must publish, on their websites, an internal plan for preventing corruption
in public procurement, as well as information about their internal procurement procedures, their
annual procurement plans, and all decisions on contract awards and cancelation of procurement
procedures. To improve the efficiency of public procurement, the amendments raise the
threshold for application of the law, impose shorter deadlines for submission of bids, and allow

17
for self-certification by bidders. Additionally, the amendments introduce the use of social criteria
and consideration of life cycle costs as elements in evaluating bids, as well as an option of using
‘technical’ product markings to define technical specifications and as selection criteria. Finally,
the amendments implement a number of changes to streamline the appeals process and the
operation of the Commission for the Protection of Rights.
45. The 2013 PPL also sets out the competences of the two core agencies responsible for
public procurement systems: the PPO and the Republic Commission for the Protection of
Rights in Public Procurement Procedures (RC). The PPO has a broad mandate. It oversees the
implementation of the PPL, participates in the drafting of procurement regulations, manages the
Public Procurement Portal, prepares reports on public procurements, and provides technical
assistance to contracting authorities and bidders. The Republic Commission for the Protection of
Rights in Public Procurement Procedures is an autonomous and independent body of the
Republic of Serbia which ensures the protection of rights in public procurement procedures. It
reports directly to the parliament. As part of its statutory powers, it decides on requests for the
protection of rights in all public procurement procedures, oversees compliance with its decisions,
annuls public procurement contracts, imposes fines on contracting authorities and responsible
persons of contracting authorities, fines applicants in case of abuse of requests for the protection
of rights, conducts infringement proceedings in the first instance, initiates procedures for
annulment of public procurement contracts, and performs other duties provided by the PPL.
46. While a robust legal framework for public procurement is in place, capacity
constraints have undermined implementation. The PPO currently lacks the capacity to fully
discharge its functions and RC lacks the capacity to handle appeals in a timely manner.
Individual contracting authorities, for their part, are insufficiently familiar with procurement
procedures. Procurement is largely decentralized with about 4,900 registered contracting
authorities, of which about 166 are central government entities. Contracting authorities are often
unfamiliar with procurement procedures. This has caused delays – it now takes about 120 days to
complete a procurement procedure – and has also led to the purchase of inferior goods and
services, as tenders are inadequately specified and contracts are awarded solely on the basis of
price. It has also led to the purchase of inferior goods and services as tenders are inadequately
specified and contracts are awarded solely on the basis of price.
47. Procurement training also faces capacity constraints. The Regulation on the Method
and Program of Vocational Training and Procedure for Taking the Professional Examination for
Public Procurement Officers, which should have been adopted in accordance with the Public
Procurement Law (PPL), has not yet been prepared. The process for certification of public
procurement officers was suspended in March 2013.10
Public procurement training, mainly for
contracting authorities, is provided by the private sector and other organizations, such as the
chambers of commerce, often with speakers from the PPO. Due to lack of capacity and
understaffing, the PPO has also not been able to deliver professional training and certification
programs, which means that public procurement officers are not certified, as the law requires.
Also from the perspectives of contracting authorities and bidders, lack of professional skills may
become an issue, in particular with regard to the proposed introduction of new working methods,
10 OECD. 2014. Public Administration Reform Assessment of Serbia. Paris: OECD SIGMA.

18
such as greater centralized procurement, framework agreements, dynamic purchasing systems,
and e-auctions.
III. TECHNICAL SOUNDNESS
A. Strengthening Public Sector Efficiency
48. The activities covered by the Program are technically sound and relevant. They have
been selected to target specific areas of public management with potential for multiplier effects.
More importantly, the activities selected reflect the key areas that that have been highlighted by
recent analytical work by the Bank, USAID, and the EU, among others, as important areas for
reform of the public sector. For instance, the Bank’s Strategic Country Diagnostic (SCD) pointed
out that institutional weaknesses, inefficient human resources, and political interference were
among the most important constraints to reform in Serbia. The Action Plan was prepared by civil
servants supported by a team of experts from Support for Improvement in Governance and
Management (SIGMA) at the OECD. The program has specific objectives and indicators for
measuring the achievement of results in each of the five areas. Each result area has specific
activities sequenced toward the key results. The Government acknowledges that some of the
proposals in the Action Plan are forward looking and, as such, the Action Plan is expected to be
revised in 2016 to accommodate emerging needs and take into account any lessons learned from
implementation during the first year. Further, the Action Plan has also built-in subsectoral
strategies.
49. The technical design of the Program has been influenced by the key binding
constraints to efficiency in the public sector. At the individual result area level, Program
activities also address the specific challenges in HRM, financial management, and management
of procurement. The Program does this by investing in supporting the Government’s program for
improving staffing and wage-bill management; improving greater control over the management
of expenditure and budget execution; and finally, by streamlining procurement processes through
the introduction of framework agreements, not only to ensure economies of scale but also to
improve delivery of goods and services to public sector users, as discussed below.
B. Key Result Areas Supported by the ‘Program’
Result Area 1: Improved Human Resource Management
50. Recent Government efforts to control the aggregate wage bill, have not addressed
the more fundamental problems in the HRM system. The hiring freeze and attrition
replacement rules are not targeted and so do not focus on the remaining pockets of over
employment. The wage freeze, similarly, fails to deal with underlying problems in the structure
of compensation. To address these problems, the Government is pursuing a two-pronged
strategy: first rationalizing staffing numbers and second restructuring the compensation regime.
51. Parliament has enacted a law limiting the maximum number of public employees in
August 2015. This law applies to all organizations paid from public funds, including ministries
and agencies of the central Government (excluding the Ministries of Defense and Interior and the
Judiciary) and is to remain in effect through 2018. For 2015, the ceilings for central Government
ministries and agencies are to go into effect by December 2015. Thereafter, the ceilings are to be

19
adjusted annually based on the recommendations of the MoF. The law also applies to local
Governments. In this case, the law sets out permanent ceilings based on the population of each
jurisdiction. Thereafter, staff reductions must be made by June of the current year (except in the
case of education, where the reductions must be made by September.)
52. The Government is making a systematic effort to bring staffing levels under control.
It has already established a registry of public employees. The current registry, however, relies on
individual ministries to report their staffing levels. It is therefore inaccurate. It is also ineffective
as an enforcement mechanism. Because it is not linked to the payroll system, the treasury
continues to make payments to individual employees, whether they are registered or not. To
address this problem, the Government intends to link the employee registry to the payroll system.
Once the link is in place, employees will not be paid unless they are registered. The Government
hopes that, through this mechanism, it will not only obtain more accurate information on staffing
levels but will also be able to ferret out ghost employees.
53. The Government is undertaking functional reviews in specific sectors to support the
rightsizing of public employment over the longer term. These are aimed at simplifying
administrative procedures, eliminating redundant tasks, and eliminating or restructuring
departments with duplicate functions, thereby reducing the need for staff
54. Staffing reductions will be implemented through a combination of attrition,
reassignments, and redundancy. Redundancy will be subject to compensation. As described in
the Environmental and Social Systems Assessment, Serbian legislation sets the terms and
procedures for such dismissals. These provide, among others, that staff who are dismissed due to
retrenchment will be eligible for severance payments equal to one-third of their monthly salary
for each year of service. As in any such program, there is some risk of adverse selection: that
staff in key positions will be the first to take advantage of the severance offer. To avoid this
situation, the program will be offered only to staff in positions that are determined to be
redundant. There is also some risk that positions that are vacated under the Program will be filled
again at some future date. To avoid this, the positions that are vacated will be abolished.
55. The second focus of reform is the pay and grading system. The current structure of
wages is the product of ad hoc wage adjustments granted to particular sectors over the last 15
years. As a result, equal work is not equally rewarded. Compensation in some sectors may be too
high; in other sectors, too low. The system of ad hoc wage adjustment in wage coefficients also
renders the Government vulnerable to wage pressures from powerful unions.
56. To address this problem the Government is undertaking a comprehensive job
evaluation and pay grading exercise. This will cover all civil servants and public service
employees, including those in education, health, social protection, culture, tourism, and sports.
(Local Governments, police, defense, and members of parliament, judiciary, and state agencies
will have their own pay scheme.) Under the proposal, jobs will be evaluated and assigned points-
based factors such as (a) scope of responsibility for resources, work organization, and staff
management; (b) extent of decision-making authority; (c) complexity of duties and requirements
for creative thinking; (d) requirements for knowledge, skills, and experience; and (e) extent,
level, and purpose of contacts with people inside and outside the organization (ranging from
minor and infrequent contacts with the public to representation of ministerial views at

20
international conferences). These jobs will then be grouped, according to their total points, into
60 grades representing all the job levels from senior management to basic support functions. A
set of wage coefficients for each grade will then be devised, with appropriate differences
between grades, to provide an incentive for staff to seek jobs at high-grade levels as and when
vacancies arise. As a final step before implementation, each ministry will amend its
systematization act to reflect the new grades.
57. The new grading system is expected to result in wage reductions for some positions
and wage increases for others. Achieving parity with private sector is not affordable in the
current fiscal environment. Under the provisions of the draft law, coefficients will be set such
that the aggregate wage bill does not increase. In implementing the new system, existing staff
will be partially ‘grandfathered’. Under the new pay and grading system, staff who are currently
receiving a salary that is higher than for their position will continue to receive their current
salaries but will not receive any of the normal semiannual increases. Staff who are currently
receiving a salary that is lower than their position would have to be ‘grandfathered’ for a period
until reaching the new levels.
58. To initiate the reform, the MPALSG drafted the Law on Public Sector Employees
Salary System. The law was approved by the parliament by in early2016.The law sets out the
principle of the grading system and the timetable for implementation of pay reform.
59. DLI #1 and DLI #2 support the Government’s efforts to restructure the
remuneration system through the classification of employee positions under the new job
catalogue and according to new pay grades. In the first year of the program, funds would be
disbursed against the substantial completion of the re-grading exercise. To allow for the
possibility that grading may take longer than anticipated, DLI 1 provides for disbursement once
70 percent of public administration employee positions have been assigned to grades using the
new pay and grading structure. Disbursements against DLI 2 are scalable relative to the
proportion of public sector employees under the new job catalogue and grading system.
Activities and outputs leading to the achievement of the DLIs and supported by the Program
include: evaluation of positions and publication of the position catalog; matching of the positions
to the grading structure; and revision of the payroll records so that staff can be paid according to
the new grading structure.
60. DLI# 3 and DLI# 4 support the Government’s efforts to contain public sector
employment and align staffing levels with the needs of service delivery. DLI 3 will disburse
if the total number of public administration employees is at or under annual ceiling prescribed by
the Law on Ceilings on the Number of Employees. DLI 4 is scalable relative to the number of
redundant public administration employees receiving redundancy payments in a given year. The
use of redundancy as the relevant indicator seeks to support efforts to ensure that those
retrenched receive the benefit packages provided under the law. Activities and outputs leading to
the achievement of the DLIs and supported by the Program include: finalization and approval of
the bylaws implementing the Law on the Ceiling for Public Sector Employees; completion of the
registration of public employees in the Registry; and preparation and implementation of
retrenchment plans by the responsible Ministries.

21
61. The proposed measures are sufficient to support the establishment of a sound
system of establishment control and staff remuneration. Under the proposed system,
managers will no longer have unfettered discretion to hire above the established maximum
number of employees. The problem of inequity in pay will be solved by classifying all positions
into a limited number of grades, each of which will be linked to a wage coefficient.
Figure 5. Result Chain for Result Area 1: Improved Human Resource Management
Activities Outputs Short-term outcome
indicators
Medium-term outcomes and
indicators
Prepare the bylaws for the
enforcement of the Law
on the Ceiling on the
Public Sector Employees
Revise systematization
acts to reflect new grades
Match positions to new
grades
Approved bylaws
Catalog of all job positions
prepared
Share of Public
Administration Employees
paid according to new grades
Share of Public
Administration
Employees assigned to
new pay grades
according to the Law
on Public Sector
Employees Salary
System (DLI2)
Employee Registry functional
according to defined criteria in
the Law on Registry of all
Employees, Elected,
Nominated and Appointed
and Engaged Persons within
Public Funds Beneficiaries
Total number of Public
Administration
Employees at or under
annual ceiling
prescribed by the Law
on Ceilings on the
Number of Employees
(DLI3)
Share of Public Administration
Employees assigned to new
grades
At least 70% of Public
Administration Employee
positions assigned to pay grades
according to the Law on Public
Sector Employees Salary System
(DLI1)
Determine current number
of employees subject to
the Law on the Ceilings
on the Number of
Employees
Revised payroll records
reflecting new wage structure
Registration of all public
employees in the Registry
completed by all relevant
agencies
DLI RF POA
Evaluate positions
Ministries prepare
retrenchment plans,
identifying redundant
positions
Eligible staff declared
redundant
Retrenchment plans prepared
Ministries with retrenchment
plans, identifying redundant
positions
Administration
Employees receiving
redundancy payments
in line with Labor
Law, Law on Ceilings
on Number of
Employees, and
Civil Servants Law
(DLI4)

22
Table 2: Mapping of Reform Path 1 - Strategic and Technical Soundness of DLIs
DLI Description Strategic Relevance
Percentage of Public
Administration Employee
positions assigned to pay
grades as per the Law on Public
Sector Employees Salary
System (DLI1)
Public administration employee positions are
positions in all ministries, public services,
public agencies and local self-Government
(Art. 1 paragraph 3 of Law on Public Sector
Employees Salary System) excluding police
officers, the military, and state owned
enterprises.
‘Share’ is defined as the percent of those
positions that have been assigned to grades
as per the new pay and grading structure’
A chaotic system of wage
coefficients, bonuses, and
allowances has resulted in
inequitable and arbitrary levels of
compensation in the public sector.
The Government is developing a
new grading system based on job
evaluations. It is also drafting a new
law governing public sector wages
and a set of coefficients that will
determine the salaries of each of the
new grades. This pair of DLIs is
meant to ensure that the
Government completes the grading
process and moves to the next
critical steps of actually placing
Government employees in the
relevant grades and paying them
according to those grades.
Percentage of Public
Administration Employees
assigned to new pay grades as
per the Law on Public Sector
Employees Salary
System(DLI#2)
Public administration employees are staff
with open-ended contracts in all ministries,
public services, public agencies and local
self-Government (Art. 1 paragraph 3 of Law
on Public Sector Employees Salary System)
excluding police officers, the military, and
state owned enterprises.
‘Paid according to new pay and grading
structure’: Public Administration Employees
monthly pay slip reflects assignment of their
positions to the new pay and grading
structure.
Total number of Public
Administration Employees at or
under annual ceiling prescribed
by the Law on Ceilings on the
Number of Employees(DLI3)
‘‘Total number of employees’ are defined as
number of open ended employees in
ministries, public agencies and local-self-
Governments subject to the Law on Ceilings
on the Number of Employees that receive
remuneration as of June 30th
of current year.
Annual ceiling means prescribed number of
Government employees as defined in the
Law on the Ceilings on the Number of
Employees.
‘Annual ceiling’: Prescribed number of
public sector employees as defined in the
Law on Ceilings on the Number of
Employees in the Public Sector.
The Government has recently
passed the Law on Ceilings on the
Number of Employees in the Public
Sector. The law requires the setting
of a maximum number allowed for
each entity. This DLI will
incentivize adherence to the
established maximum.
Percentage of Redundant
Public Administration
Employees receiving
Redundancy Payments pursuant
to provisions of Labor Law,
Law on Ceilings on the
Number of Employees, and
Civil Servants Law
A redundant public administration employee
is defined as those occupying redundant
positions; targeted downsizing is defined as
dismissal (other than for cause) according to
the provisions of the Civil Service Law and
the Labor Code. Staff will be considered
dismissed if he/she has accepted the
severance package (rather than seeking
employment elsewhere in the public sector)
and the position has been abolished.
Excessive staffing in certain sectors
and occupations inflate wage bill.

23
Result Area 2: Improved Financial Management
62. Improving PFM is a Government priority and is one of five main objectives of the
broader PAR Strategy. A more specific PFM Reform Program has been drafted and is expected
to be finalized in early 2016. The program sets out a reform path and priority actions in the short,
medium, and long term. It is largely consistent with the recent Bank diagnostic, namely the
Public Expenditure and Financial Accountability (PEFA) and PFM Reform Program.
63. The immediate priority of the Government’s PFM reforms is strengthen
expenditure control and prevent the accumulation of expenditure arrears through
improvements in expenditure planning and expenditure control. The Government intends to
strengthen the MoF budget department, increasing its staff’s ability to prepare realistic forward
estimates of revenues and expenditures, monitor budget execution and improve cash planning.
Budget entities will be required to submit quarterly reports on arrears and strengthen internal
controls over contractual commitments to ensure comprehensive reporting.
64. The Government will improve the quality of information on commitments. In 2012,
it established an electronic Registry of Settlements of Pecuniary Commitments (RINO). The
purpose of the application was to improve the availability of information on assumed
commitments and compliance with statutory deadlines for payments. The initial version of RINO
covered only transactions between the public sector and the commercial sector. In 2015, the
system was expanded to cover transactions between one public sector entity and another,
complementing the changes in coverage mandated by amendments to the law on Deadlines for
Payments in Commercial Transactions.
65. The Government will tighten supervision of arrears. The Law on Deadlines for
Payments in Commercial Transactions (2013) mandated a timetable for the payment of arrears.
Under the law, debtors (including Government officials) can be fined for failing to pay arrears on
time. In its initial form, the law applied only to arrears owed to commercial entities. Even so, it
produced a dramatic reduction in arrears owed by public sector entities. More recently, the law
has been amended to apply to debts owed by public entities to other public entities The
Department of Budget Inspection of the MoF is now responsible for monitoring transactions
between public entities and private entities as well as transactions among different entities of the
public sector. The law stipulates that further regulatory acts will be passed to precisely define
supervision over implementation and communication of information between the Treasury,
which collects information on payments, and entities in charge of supervision.
66. The MoF will systematically roll out the Financial Management Information System
(FMIS) to Indirect Budget Beneficiaries who are responsible for the bulk of the stock of
expenditure arrears. Courts will be integrated into the FMIS by January 1, 2016; prisons and
cultural institutions by January 2017, and social welfare centers by January 2018. This will
leave only education institutions outside the FMIS in the beginning of 2018. Integrating these
institutions into the FMIS will take more time, due to their large number.
67. The Government also intends to strengthen the MoF’s ability to assess the reliability
of reported cash needs by users of public funds, with the view to ensuring adequacy of
budget allotments and aggregate cash requirements. It will also require all budget users to

24
submit quarterly reports on arrears and strengthen its system of controls over contractual
commitments.
68. The proposed Program intends to support these reforms through two DLIs. The first
is intended to support overall efforts to reduce arrears. This would capture efforts by the MoF
Budget Department to produce more realistic annual budgets and efforts by the Treasury to better
assess the reliability of estimated cash needs by individual budget beneficiaries and to better
allocate monthly quotas among them, as well as efforts to improve the quality of data on
commitments and enforce legislation governing the payment of arrears. A single DLI is
proposed: Percentage of commitments in the Budget Execution System entered within the
required deadline, per the legislation on Deadlines for Payments in Commercial Transactions.
Funds would be disbursed against the achievement of specified targets over the three
disbursement periods. The second DLI would support the inclusion of IBBs in the FMIS. Funds
would be disbursed against the achievement of specific targets, measured in terms of the
percentage of all IBBs included in the FMIS in each of the three disbursement periods.
69. The proposed measures are adequate to address the problem. In addition to creating
the foundation for effective management of budget preparation and execution, they are also
expected to improve ex ante controls of commitments by budget users. A combination of this and
other measures on monitoring expenditures of budget beneficiaries will ensure that IBBs do not
exceed annual appropriations. In the absence of controls, budget users tend to make
commitments based on their annual budgetary allocations, running up arrears. The proposed
Program also supports the inclusion of IBBs into the FMIS, thus strengthening the ability of the
Treasury to monitor commitment and cash management. It will also indirectly strengthen the
budget process, especially in terms of revenue forecasting and overall outturn.

25
Figure 6. Result Chain for Result Area 2: Improved Financial Management
Table 3: Mapping of Reform Path 2 - Strategic and Technical Soundness of DLIs
DLI Description Strategic Relevance
IBBs included in the FMIS (DLI7) The DLI measures the number of
legislative bodies and public
institutions founded by the Republic
and/or local Governments and which
obtain financing through the national
budget that are connected to the FMIS
and use the system entry and retrieval
of financial data.
The Government is unable to control
spending largely due to the limited
coverage of IBBs by the FMIS. The
Government intends to bring in
approximately 1,078 IBBs by 2018.
Including these budget beneficiaries
would be an important first step
toward addressing the problem of
arrears that arise from inadequate
commitment controls. |Percentage of commitments in the
BES entered within the required
deadline according to the legislation
on Deadlines for Payments in
Commercial Transactions (DLI8)
The DLI measures the share of
executed payments in the FMIS
(BES) for which commitments were
entered into the system by respective
beneficiaries in line with the RINO
law and bylaws, no more than three
days after the commitment has been
assumed (contract signed, invoice
received).
Activities Outputs Short-term
outcome indicators
Medium-term outcomes and
indicators
Establishing a system to
approve, record, and
monitor multiannual
contractual commitments
Establish a system for
reporting and monitoring
arrears
Produce comprehensive
data on arrears
IBB in FMIS (number)
(DLI7)
Share of payments for
commercial transactions
in Budget Execution
System (BES) which are
based on previously
reported commitments
in line with the
legislation on Deadlines
for Payments in
Commercial
Transactions (DLI#8)
Budget Beneficiaries
submitting quarterly data
on arrears
System to approve
records and monitor
multi annual contractual
commitment established
Controls over annual and
multiannual contractual
commitments improved
Extend coverage of FMIS
system to IBB
Provide sufficient ICT
equipment, training, and
oversight to IBB to
operate in the FMIS
Inclusion of IBB into the
FMIS system completed
Improved coverage of
IBB in FMIS
RF DLI POA

26
Result Area 3: Improved Procurement Management
70. The Government’s Procurement Reform Strategy of 2013 identifies priority reforms
in three areas: capacity building; process improvements; and performance measurement.
The procurement capacity building program has sought to ensure that individual contracting
authorities have adequately qualified procurement staff by implementing a large scale training
and certification process for public procurement officers. The Government will extend its
capacity building to encompass potential bidders in public procurement. Improvements in
procurement processes seek to gradually expand the use of centralized public procurement at the
central and local levels through framework contracts. This will lower costs through bulk
purchasing. Special attention will be paid to minimizing the adverse impact of centralized
procurement on small and medium-sized enterprises. PPO will prepare models tender dossiers
and reach out to Contracting Authorities to bring more awareness. Finally, the Government
intends to develop a systematic approach for measuring procurement performance to inform
ongoing policy reforms and its operational support.
71. Process improvements will focus on centralization of public procurement at the
central and local levels where this can generate efficiency savings. This reform is intended to
lower costs through bulk purchasing and maximize the use of scarce professional talent and
experience, particularly in more complex procurement. The organization in charge of centralized
public procurement for the purposes of national authorities and organizations is the
Administration for Joint Services Office of the Republic Bodies. In addition, centralized
procurements of certain medicines and medical supplies are conducted by the Republic Health
Insurance Fund. The selection of items that will be subject to centralized procurement will be
preceded by market research, to minimize the risk that centralized procurement will favor large-
scale suppliers, thus restricting competition. Special attention will be paid to minimize the
adverse impact of centralized procurement on small and medium enterprises. Centralization will
be applied in those cases where analysis proves its clear advantages over multiple individual
public procurement. The centralized procurement bodies will be provided with adequate human
resources, technical, and IT capacities, and office space to enable them to successfully conduct
procurements on behalf of other contracting authorities.
72. In the course of strengthening centralized procurement, the Government intends to
expand the use of framework agreements. These are agreements with suppliers that set out the
terms and conditions under which specific purchases can be made throughout the term of the
agreement. In principle, they can increase the efficiency of public procurement by reducing the
time and effort required to undertake repeated procurements every year. Although framework
agreements are permitted by the 2013 PPL (the 2015 amendments make specific provisions for
them) they are less used. According to the quarterly reports on contracts signed by contracting
authorities, only 142 framework agreements were signed in the first year of the new procurement
law. To promote use of framework agreements in the coming years, the PPO will prepare models
of tender dossiers with models of framework agreements for the supplies for which the use of
these instruments is most appropriate. The PPO will also reach out to the contracting authorities
to bring more awareness/benefits of the use of Framework Agreements.
73. The Government will also expand training, including a large-scale training and
certification process for public procurement officers in individual contracting authorities.

27
The PPL requires every contracting authority, whose estimated planned public procurement in a
given year exceeds the limit set by the PPL (currently RSD 25 million/US$225,000), to provide
for the post of a public procurement officer in its job classification act. Some progress has
already been made on this front. Between 2010 and 2013, a total of 1,810 public procurement
officers were certified at the central and local levels. However, further training and certification
is required. To this end, the Government intends to expand the basic training and certification
process. It also intends to introduce a higher level of certification for public procurement officers
who would acquire more complex and broader knowledge, including EU procurement practices.
Specialized training will also be provided, targeting specific areas such as energy, health, or
specific issues that are of common interest such as procurement of insurance services, medicines,
and so on. Complementing these efforts, the Government also intends to (a) establish a public
procurement website for public procurement officers, which will disseminate information on the
practical application of the PPL and other regulations in the field of public procurement; (b)
issue a code of ethics in public procurement; and (c) support professional associations in public
procurement in their efforts to increase professionalism and ethical standards in the field.
74. Training and workshops will be provided to potential bidders to encourage their
participation in public procurement procedures and enable them to protect their rights. The need for such training is greatest in small and medium enterprises, which often lack
sufficient knowledge and information, thus effectively missing on the opportunities for
participation in public procurement procedures. This training will be provided in cooperation
with the Serbian Chamber of Commerce and regional chambers of commerce.
75. Finally, the Government intends to develop a systematic approach for measuring
procurement performance. This is critical to identify problems in the procurement process and
correcting them. The approach is expected to be based on a performance indicators manual that
will be developed and electronic data furnished by the e-procurement portal. The results will be
published in quarterly performance reports by the PPO. In addition, the PPO will also analyze
technical solutions and options implemented or developed in EU member states in the area of e-
procurement (e-tender, e-auction, e-dynamic procurement system, e-catalogues, and so on.) with
an eye to introducing such reforms in Serbia in the future.
76. The Program supports progress in procurement reform through two DLIs. DLI 5
supports improvements in the operational efficiency of procurement by providing for scalable
disbursements in proportion to the share of public procurement over RSD five million in value
awarded in the preceding financial year with duration of 90 days or less between issuance of
bidding documents and award of contracts. DLI 6 supports improvements in operational
efficiency and economy through the centralization of public procurement, providing for scalable
disbursements in proportion to the value of procurement contracts awarded through framework
agreements. This is intended to capture the combined impact of increasing staff capacity and
streamlining procurement processes. Activities and outputs leading to the achievement of the
DLIs and supported by the Program include: training and certification of procurement officials;
development and application of a methodology for measuring procurement performance;
preparation and publication of Model Framework Agreements and their application in
procurement across Government.

28
Figure 7. Result Chain for Result Area 3: Improved Public Procurement
Activities Outputs Short-term
outcome indicators
Medium-term outcomes and
indicators
Prepare models of
Framework Agreement
for appropriate types of
supplies
Model Framework
Agreements prepared
Framework Agreement
available on the public
procurement portal
Public procurement
specialists certified in
public procurement
procedures
Procurement contracts
awarded through
Framework Agreements
for all contracting
authorities
Value of procurement
contracts awarded
through Framework
Agreements (DLI6)
Share of public
procurement contracts
within the category of
Public Authorities over
RSD 5M in value,
signed in the
borrower’s fiscal year
in 90 days or less
between date of
issuance of bidding
documents and signing
of public procurement
contracts (DLI5)
Training of public
procurement officers in
procurement practices
Training of public
procurement specialist
completed Public officials trained in
public procurement
procedures
Training of public
officials completed
Training of public
officials in public
procurement procedure
Develop a systematic
method for measuring
procurement
performance Methodology for
measuring procurement
performance DLI POA RF

29
Table 4: Mapping of Reform Path 3 - Strategic and Technical Soundness of DLIs
DLI Description Strategic Relevance
Percentage of Public Procurement Contracts
within the category of Public Authorities over
5,000,000 RSD in value, signed in a fiscal year of
the Borrower, in 90 days or less between the date
of Issuance of Bidding Documents and the date of
signing of the Public Procurement Contracts.
(DLI#5)
This DLI measures the value of
procurement above RSD 5 million
(approximately US$45,000) that
take more than 90 days to complete
from the time bidding documents
are issued to the time the contract is
awarded and signed.
The DLI measures
efficiency and economy in
public sector finance, with
regard to time needed to
complete procurement
(time efficiency) and the
increased use of framework
agreements (economy). Value of public procurement contracts awarded
through Framework Agreements (RSD) (DLI#6)
This DLI measures the prevalence
of usage of framework agreements
which allow for prior determination
of pricing structures to be followed
during the agreed period and thus
reducing the opportunities for
individual bids on the same item by
different contracting authorities.
C. Lessons from Experience
77. Program design has been informed by the Bank’s experience in public sector
reforms both in Serbia and elsewhere. Experience has shown consistently that client
leadership and broad participation in Program design is critical for ownership and commitment
and builds capacity to support implementation.11
MPALSG has taken a leadership role in the
preparation of the Program, working closely with the implementing agencies for each of the
Results Areas to define the Results Framework and supporting Action Plan. Experience has
shown that public sector reforms tend to deliver results over the medium to long-term.
Consequently, Bank support should be anchored in a long-term reform agenda and “problem
solving engagement”12
that offers some assurance of continuity in implementation. Previous
rounds of public sector reform in Serbia have not been followed-up systematically after changes
in Government. In this case, the prospects for continuity have been strengthened by embedding
the Program in the Government’s PAR Strategy which supports the Government’s longer-term
goal of EU accession. Experience has shown that public sector reform operations should be
ambitious but realistic: fundamental changes in organizational culture cannot be delivered in the
short term but incremental progress can be made by creating appropriate incentives and building
institutional capacity to deliver, thus matching the design with the capacity of the borrower and
implementing agency without “outpacing the client”13
. The Program is focused on incremental
improvements in key human resource, financial and procurement management systems that can
be delivered within the Program period. The Program builds on on-going series Government
program rather launching new directions in reform. Additional lessons from the design of this
Program area outlined in Table 5 below.
11 Independent Evaluation Group (2008). Public Sector Reform: What Works and Why? Washington, DC. The World Bank. 12 World Bank (2013), Program for Results Two Year Review: Concept Note, p.1. World Bank. 13 World Bank (2013). Implementation Completion Report. Performance Results and Accountability Project (P092898).
Washington DC: The World Bank, p. 36.

30
Table 5: Lessons Applied During Program Design
Issue Lesson Learned Application in Program Design
Supporting
design with
rigorous
analytics
Program areas to be supported should
be driven by rigorous analysis to
ensure proper basis for inclusion
Program design has been informed by diagnostic and
analytical work developed by both the Government, the
Bank, academics and other development partners. These
include: Country Strategic Diagnostic; Country
Partnership Strategy; Public Finance Review; OECD-
SIGMA assessments, among others. The issues
addressed have been prominently discussed in these
analytical review, and raised as the most strategic areas
of engagement in the short to medium term.
Establishing
a selection
criterion for
inclusion
Design and Program Boundaries
should be driven by specific criteria.
In order to sharpen the focus of the Program and
appropriate target the incentive structures to the relevant
program areas, the design developed a core set of
checklist that covered the following elements:
demonstration of Government commitment to reform in
that areas; coverage of the same area by other
development partners and opportunities for
collaboration; availability of a strong analytical basis for
inclusion; relevance to Government’s reform program.
Ensuring
Program
ownership
The motivation for reform is always
difficult to determine, especially in
context with multiple stakeholders.
It is important to understand the
driving force behind the reform
agenda and link it to a wider
Government strategy beyond the key
“champions”. Consultation with key
stakeholders at all levels is critical
for building broad ownership.
The Program emerged from a continuing relationship
the senior management of MPASLG and MoF in the
context of ongoing technical assistance and policy
dialogue. Discussions have focused on the
Government’s assessment of the critical areas for reform
and those areas where there the Government believed it
would be able to make progress in implementation.
Discussions have encompassed a wide group of
stakeholders including Public Administration Reform
Council, the Collegium of State Secretaries and senior
officials from Ministries across government.
Focus on a
few areas of
impact and
‘go big’
Selecting a few areas of emphasis
allows for better targeting of results.
The instrument allows for the design
of a Program around an entire
Government program. Yet, in public
sector reform programs, the
challenge often lies in the inbuilt
resistance and inertia to change.
Institutional transformation takes
time, because it depends on changing
the behavior of a large number of
actors.
The Program on is designed to reflect this lesson.
Rather than support an elaborate reform agenda
described in the Action Plan, the Program is selective:
focusing on a limited number of reforms that lie at the
heart of state capacity: human resource management,
financial management and procurement.
IV. INSTITUTIONAL ARRANGEMENTS
78. The Program is based on an Action Plan that has broad political support at the
highest level of Government. It is a product of a reform momentum that emerged out of the
Prime Minister’s efforts to reform the functioning of the Government. It also coincides with the
implementation of an IMF Stand-By Arrangement, which obliges the Government to undertake

31
key fiscal consolidation measures covered by this Program. The Government’s program was
designed through a consultative and collaborative process reflecting the views of the technical
staff in various ministries and the validation of several important stakeholders. In the past,
important policy documents and programs have been designed but not implemented largely due
to weak coordination and inertia. Through the PforR operation, the Bank—through the Global
Governance Practice—will leverage its global knowledge in public sector reform to support the
Government’s reform agenda.
79. The Program will use the institutional and coordination arrangements established
to support implementation of the PAR Strategy. Box 2 provides an overview of these
arrangements, comprising: the Public Administration Reform Council chaired by the Prime-
Minister responsible for overall strategic direction and coordination of public administration
reforms; the Collegium of State Secretaries which brings together the leading civil servants of all
Ministries and supports the PAR Council; and the Ministry of Public Administration and Local
Self Government (MPALSG) oversees and supports implementation of the PAR at an
operational level.
80. Arrangements for cross-government coordination are robust. The Collegium of State
Secretaries has proved to be a very effective mechanism for coordination of PAR activities in the
line ministries, especially in the first phase of the optimization program when the Government
identified units had to undertake rightsizing and the retrenchment of personnel in 2015. By its
nature, the PAR Council has met less frequently: most of the critical implementation issues have
been addressed by the State Secretaries. However, the PAR Council is expected to take a more
active role in the reforms as the pace of implementation picks up in 2016. The Council has
Rules of Procedure and draws membership from all strategic ministries involved in the PAR
program, including the MPALSG. The most recent meeting of the PAR Council in December
2015 discussed several ongoing reforms in the public sector, including this PforR Program.
81. The Ministry of Public Administration and Local Self Government is the key
implementing agency for the Program. The Public Policy Secretariat will be responsible for
coordinating other implementing agencies, including the collection and reporting of data, and
their verification. The existing capacities in the MPALSG are sufficient for implementation of
the Program. Further capacity development activities will be undertaken in monitoring and
evaluation and in the management of the reform process. With support from the Serbia
Rightsizing and Restructuring Project, managed by the World Bank and funded by the EU, the
MPALSG will create a Change Management Support Unit which will work with the line
ministries to facilitate implementation of the PAR Strategy and Action Plan and the Government
Program for Optimization.
82. Each of the Program Result Areas is implemented by a lead institution: the
MPASLG, Treasury Administration and the Public Procurement Office. In order to ensure
sufficient stakeholder support for the Program across these institutions, consultations have been
held to discuss the broader framing of the Program, the Results Framework and Disbursement
Linked Indicators. The Program will use of country systems and so no Program-specific
implementation arrangements are required at the level of the implementing agencies. While there
are capacity challenges in the institutions responsible for implementation, it is expected that
ongoing Technical Assistance provided by partners will strengthen the ability of the various

32
institutions to deliver their mandate, including on activities covered by this Program. The EU,
for instance, has allocated EUR 10 million for targeted technical assistance to strengthen
implementation of the PAR. The EU Program is expected to be effective in second half of 2016
(See Annex 10 for ongoing donor support).
83. The Program is harmonized with a Sector Budget Support operation supported by
the European Commission. It will use the same monitoring structures, thereby reducing the
opportunities for duplication of resources and multiple reporting on different indicators. The
Program uses indicators that have already been defined by the Action Plan for the
Implementation of PAR Strategy, providing the opportunity for greater synergy with the ongoing
Government program. There will be no need to establish a parallel monitoring mechanism
separate from the already established PAR reporting system. The financial incentives associated
with the PforR instrument and with the Program are robust enough to support a greater focus on
achieving the results. Finally, this Program is designed to coincide with the Government’s
ongoing program with the Fund. Key areas of this Program reflect the main thrust of the
Government’s arrangement with the Fund. As such, it is expected that the political support
necessary for the support of the Fund program will accelerate the implementation of the activities
covered under this Program.
Box 2: Implementation Arrangements for the Action Plan
Level One: The ministry responsible for public administration affairs will continue to perform operational
duties and tasks and the coordination of the PAR process. For successful accomplishment of these tasks and
sustainability of this process, it is necessary to ensure appropriate capacities, primarily by building capacities of the
internal organizational unit (department) of the Ministry of Justice and State Administration under whose auspices are
the public administration activities involving the public administration system, organization and work of the ministry,
special organizations, public agencies, and public services, by including under the job classification, the organizational
units that would be responsible for the coordination of activities related to the PAR Strategy. In addition to this, the
public administration bodies must appoint a person who will be tasked with monitoring, reporting, and evaluating the
implementation of the PAR Strategy.
Level Two: The Inter-ministerial Project Group is tasked with performing the expert coordination and
monitoring of the PAR Strategy implementation. The duties of this Project Group primarily involve the professional
coordination and drafting of reports on the implementation of the PAR Strategy. This mechanism will ensure active
involvement of all the relevant state authorities in the process of the PAR. Specific tasks of the Inter-ministerial Project
Group are participation in creating the strategies and Action Plans in the PAR process; including of all projects and
normative activities into the PAR Strategy (as part of the regular audits of this Strategy, that is, during the process of
drafting the new PAR Strategy); recommendation for including certain activities in the Annual Plan of the Government
(in cooperation with the ministry responsible for the public administration affairs); aligning of other national strategic
documents with the PAR Strategy (in cooperation with the general secretariat of the Government); discussing of
starting points and draft regulations whereby bodies and organizations and other authorities are incorporated within the
public administration system (before they are presented to public administration bodies for providing their opinion);
defining competencies in discharging of public administration duties, defining the status of employees, including the
internal relations and coordination of public administration bodies and organizations; adopting of reports on the
implementation and evaluation of results achieved by the PAR Strategy (that is, by the appropriate Action Plan based
on the findings of the organizational unit within the ministry responsible for the public administration affairs);
presenting of decisions that could not be agreed upon by the Inter-ministerial Project Group to the Collegium of State
Secretaries for discussion and adoption; participation in the evaluation of the PAR Strategy implementation results
(each member representing the scope of activities of their body). The members of the Inter-ministerial Project Group
will be the secretaries of the ministries. The Inter-ministerial Project Group will meet regularly, once a month and/or
more frequently, when required (at the proposal of the ministry responsible for the public administration affairs).
Level Three: Represents the Collegium of State Secretaries as the first level of political coordination of the PAR

33
process. The Board discusses the issues relevant to the PAR. This particularly refers to the issues about which no
agreement is reached at the level of experts. Regular sessions of this body are predominantly convened to review the
reports about the PAR Strategy implementation and/or the Action Plan. The Collegium of State Secretaries proposes
issues to be discussed at the sessions of the PAR Council. The members of the Collegium of State Secretaries will be
the state secretaries of all ministries, the Deputy General Secretary of the Government, the Deputy Director of the
Serbian European Integration Office, and the Deputy Director of the Legislation Secretariat. The Board will meet
quarterly and/or more often, where necessary (at the proposal of the ministry responsible for the public administration
affairs and/or at the proposal of the Inter-ministerial Project Group). The chair of the Board will be the State Secretary
of the ministry responsible for the public administration affairs. The Vice-Chair will be the State Secretary of the
ministry responsible for financial affairs (or alternatively, the Deputy General Secretary of the Government).
Level Four: The PAR Council has been established by the decision on forming the Council for the PAR as the
central strategic body of the Government, responsible for the PAR, tasked with defining the proposals for the
strategic development of public administration in the Republic of Serbia; initiating and proposing the measures and
actions related to the PAR to the Government; discussing and adopting reports on achieved objectives in connection
with the PAR; promoting and monitoring the progress of the PAR Strategy implementation, particularly from the
perspective of the incorporation of the principles and objectives of the PAR into the sectoral development strategies
and measures form the plans; and discussing and providing preliminary opinion to the Government about development
strategies, draft laws, and other legal documents related to the organization and work of the Government, public
administration bodies, and in particular those proposing the incorporation of new state authorities, organizations,
services, or bodies of the Government. In the former period, this Council discussed the issues as provided by its
delegated tasks while in the future, from the date of the adoption of the PAR Strategy, it is expected to take over the
strategic role of coordinating and managing the reform processes within the public administration.
Source: Republic of Serbia. 2014. Action Plan for the Implementation of Public Administration Reform Strategy.
Belgrade: MPALSG, p.65
.
V. PROGRAM EXPENDITURE FRAMEWORK
84. The Government has developed an Action Plan for the Implementation of the PAR
Strategy with a strong commitment to fund it from its own resources. It recognizes that
financing the activities in the PAR will require significant funding. As such it has provided that
funding for the PAR will be included in the budget of each financial year and reflected in the
activities of each of the ministries as well as in the budget of the coordination ministry—the
MPALSG. Nevertheless, in addition to the Bank funding, the Government has other sources of
funding, notably the EU which is committing up to €80 million. There are other DPs who are
financing stand-alone activities but which are nonetheless linked to the PAR broadly defined.
85. Program expenditures have been estimated on the basis of the expenditure plans of
the implementing institutions as presented in the Government of Serbia’s three-year Fiscal
Strategy. The key implementing institutions are: Ministry of Public Administration and Local
Self-Government, Treasury Administration and Public Procurement Office. The expenditure
framework considers the relevant expenditures of other institutions relevant for Program
implementation: National Employment Service; State Audit Institution; Secretariat for Public
Policy; and Human Resources Management Service. Program expenditures include only the
budget programs as reflected in the State Budget and those functions and activities that are
directly related to the achievement of the Program for Results PDOs and implementation of the
Program activities. Program Expenditures include capital, operational and salary costs under
these budget programs and severance costs related to the layoff of the public employees across
the public sector. The Program Expenditure Framework by Result Area is presented in Table 6.

34
86. Approximately 75 percent of Program expenditure is allocated to the severance
costs of public sector employees. Expenditures related to Result Area 1 implemented by the
MPALSG amount to 79.5 percent of the total Program expenditures, with Result Area 2
implemented by the Treasury Administration amounting to 19.9 percent and Result Area 3
implementation by the Public Procurement Office just 0.6 percent of total Program expenditure.
The structure of expenditure by type of expenditure is presented in Table 7. Operational cost
estimated at the level of 10 percent of the total Program expenditure, comprise maintenance,
material, travel expenses, contractual services. Capital costs amounting to 3 percent of total
expenditures are mostly IT related. Salaries constitute approximately 12 percent of total
Program expenditure.
Table 6: Program Expenditure Framework (US$)
2016 2017 2018 Total
1: Human Resource Management 64,280,603 63,955,473 63,955,473 192,191,549
Capital cost 126,447 126,447 126,447 379,341
Operational cost 2,213,380 1,954,531 1,954,531 6,122,443
Salaries 1,458,750 1,392,468 1,392,468 4,243,686
Severance 60,482,026 60,482,026 60,482,026 181,446,079
2: Public Financial Management 16,061,081 16,071,608 16,071,608 48,204,297
Capital cost 2,203,029 2,203,029 2,203,029 6,609,087
Operational cost 6,010,430 6,015,485 6,015,485 18,041,400
Salaries 7,847,622 7,853,094 7,853,094 23,553,811
Severance 0 0 0 0
3: Public Procurement Management 413,423 407,418 407,418 1,228,259
Capital cost 33,841 33,841 33,841 101,523
Operational cost 122,303 118,055 118,055 358,414
Salaries 257,279 255,522 255,522 768,323
Severance 0 0 0 0
TOTAL 80,755,107 80,434,499 80,434,499 241,624,105
TOTAL without severance 26,314,125 25,897,981 25,897,981 78,110,087
Table 7: Structure of Program Expenditure (Percent)
Expenditure 2016 2017 2018 TOTAL
Capital cost 2.93 2.94 2.94 2.93
Operational cost 10.34 10.06 10.06 10.15
Salaries 11.84 11.81 11.81 11.82
Severance 74.90 75.19 75.19 75.09
Table 8: Structure of Program Financing
Source US$ %
Government 166,624,106 69
IBRD 75,000,000 31
TOTAL 241,624,106 100

35
87. IBRD financing covers approximately one third of the Program costs. The
remainder of the Program financing will be provided by the Government. The Government will
receive parallel financing in support of its broader PAR Strategy which encompasses the reforms
and actions supported by the Program. Parallel financing includes a European Union €80 million
Sector Budget Support currently under preparation and scheduled for approval in early 2016.
Additional support may also be provided by other development partners including SIDA,
Norway and GIZ. The structure of financing is presented in Table 8 above.
Table 9: Program Expenditure Framework by Institution (USD)
Result Area / Expenditure 2016 2017 2018 Total
1: Human Resource Management 64,280,603 63,955,473 63,955,473 192,191,549
MPALSG 62,945,711 62,662,418 62,662,418 188,270,546
Secretariat for Public Policy 20,364 19,406 19,406 59,176
Human Resources Management Service 47,812 46,653 46,653 141,119
National Employment Service 850,820 829,255 829,255 2,509,330
2: Public Financial Management 16,061,081 16,071,608 16,071,608 48,204,297
Treasury Administration 16,061,081 16,071,608 16,071,608 48,204,297
3: Public Procurement Management 413,423 407,418 407,418 1,228,2659
Public Procurement Office 413,423 407,418 407,418 1,228,260
TOTAL 80,755,107 80,434,499 80,434,499 241,624,105
88. Result Area 1 is allocated 79.5 percent of the total Program financing or
US$192,191,548. The result area is entirely related to the activities of the MPALSG. The set of
relevant activities will include the following: organizational and functional restructuring of the
public administration; development and management of a registry of all employees in the public
sector; training of civil servants in state administration on new policies for HRM; preparation
and establishment of merit-based pay and grading system in the public administration;
implementation of the legal regulations on the maximum number of employees; and
development of the HRM system. A large portion of the funds allocated to this set of activities
includes severance costs, which represent 94.4 percent of the total allocation. If the severance
costs are excluded the allocation to Result Area 1 is US$10,745,469.
89. Result Area 2 is allocated US$48,204,297 or 19.9 percent of the total Program
financing. The activities implemented by the Treasury Administration aimed at achieving the
relevant DLIs and PDOs for Result Area 2 are the following: strengthening of budget execution
and monitoring to ensure improved coverage of budget beneficiaries in the FMIS, improvement
of financial and budget information, commitment control and arrears, and the overall monitoring
and control of budget execution of IBBs; expansion and technological upgrading of capacity for
more efficient business; and establishment of a centralized payroll system and improvements in
business process automation.
90. Result Area 3 is allocated US$1,228,260 or 0.5 percent of the total Program
financing. The activities implemented by the PPO aimed at achieving the relevant DLIs and
PDOs for Result Area 3 are the following: training of officers involved in the procurement

36
process both at the PPO, Appeals Board, and procuring entities; preparation of procurement tools
and manuals; development of a systematic approach to measure the performance of the public
procurement system; preparation and determination of the Bill on Amendments to the Law on
Public Procurement; publication of juridical review against common property resources
decisions made by the Administrative Court (second instance in the review system);
improvement of the training level of officials and decision makers in public procurement
procedures; adoption of the value-for-money methodology and guidelines for implementation of
the ‘Life cycle product cost’ concept; and further development of the use of ICT (e-Government)
to enhance efficiency in procurement.
91. Program expenditures will be executed and accounted for using the GoS PFM
system. The amount of financing determined from the financial plans of the relevant institutions
includes only the financing that is within the limits defined in accordance with the valid three-
year Fiscal Framework. The Fiscal Framework is a part of the Fiscal Strategy of the Republic of
Serbia for 2015. Expenditures will be appropriated through the Government’s budget process
and reflected in the state budget. All payments from the Program will be executed through the
Treasury Administration’s FMIS. Expenditures will be tracked through the budget programs and
budget line items for each of the four institutions. There is a robust framework of automated
controls over transactions in both the registration of the expenditure payment stages enabling
efficient expenditure tracking. Coverage of the controls in the FMIS application includes
revenues and expenditures, own source revenues/expenditures, and received grants/expenditures
of DBBs as well as transfers from the Republican budget. Commitment controls that are in place
on the level of the Treasury Administration effectively limit commitments to available budget
appropriation and to actual cash availability. Program implementing agencies (the MPALSG,
PPO, and Treasury Administration) do not have autonomy in budget execution regarding
resource allocation within the budget year. Approved appropriations can be altered, but the rules
are clear and limit individual changes of appropriations to 5 percent according to the BSL.
92. The Budget Classification and Accounting Framework provides an adequate basis
for programming and reporting on Program expenditures. Serbia adopted the Rulebook on
Standard Classification Framework and Chart of Accounts for the Budgetary System in 2009.
This classification includes administrative, functional, and economical categories as well as
definitions for each category that are consistent with Government Financial Statistics manual
(GFS) 2001 and with the main functional classification of the Classifications of the Functions of
Government (CoFoG). Government accounts, budget execution reports, and other budget
execution data have a breakdown that corresponds to the documentation for the proposed and
approved budget. Such a framework will enable effective monitoring of the expenditures under
the Program. Expenditures will be monitored at least at the 3rd level of economic classification
and the process will encompass expenditures realized from other codes constituting the budgets
of relevant institutions. The following budget codes will be monitored: 411 thru 416, 421 thru
426, 451, 462, 463, 482, 483, 485, 511, 512 and 515.
93. The fiduciary assessment presented in Annex 5 concludes that these systems are
adequate to ensure appropriate use of Program funds and safeguard Program assets. Fiduciary risk after mitigation measures is rated as substantial. The fiduciary assessment
identifies the mitigation measures that will be undertaken under the Program.

37
94. Risks to the Program Expenditure Framework are considered modest, even if the
macro-economic situation deteriorates. The reforms supported by the Program feature
prominently on the Government of Serbia’s policy agenda. The Program is aligned with the key
fiscal consolidation measures that the Government of Serbia has committed to undertake under
the Stand-by Arrangement with the IMF and supports the longer-term agenda of EU accession.
After an extended period of stagnation, the Serbian economy seems to be recovering. After
recording a decline in GDP of 1.8 percent in 2014, real GDP projections for the current year
remain between 0 and 0.5 percent increasing to 1.5 percent in 2016 and continuing modest
growth thereafter. Fiscal performance has also improved over this period, with the fiscal deficit
shrinking to 4.1 percent of GDP in 2015 – largely due improvements in revenues – down from
6.7 percent of GDP in 2014. Further improvements in macro-economic and fiscal performance
depend, in part, on the successful implementation of the Program. Should economic
performance deteriorate, the reforms supported by the Program will continue to be relevant to
stabilization efforts.
VI. PROGRAM MONITORING AND EVALUATION
A. PAR Strategy and Action Plan M&E Framework
95. The PAR Strategy is supported by a results matrix including output and outcome
indicators. The strategy uses OECD SIGMA and the European Commission indicators of public
administration principles. This aligns the PAR with the process of Serbia's accession to the EU.
Progress will be assessed by OECD SIGMA analysis based on the data provided by the
Government of Serbia. The indicators include an ‘Effectiveness of Government Ranking’ which
is a composite indicator consisting of several indicators produced by various institutions (for
example, Gallup, Economist Intelligence Unit). ‘Passports’ have been produced for all of
indicators used in the monitoring framework. These are similar in format and content to the
commonly used indicator reference sheets.
96. Monitoring will be managed and coordinated by the MPALSG with other ministries
and state administration bodies providing information within their jurisdiction and
responsibilities. The PAR defines the responsible institutions (and individuals on behalf of those
institutions) for monitoring and reporting according to results. The PAR Strategy states that
following the collection and processing of data from the regular reports on performed activities
and/or the continuing monitoring process, it would be necessary to prepare occasional
assessments of the reforms. The first evaluation is scheduled to begin in mid-2017.
B. Program M&E Arrangements
97. For the purposes of Program monitoring, the Government and World Bank have
agreed on a Results Framework that comprises six Program Development Objectives and
nine Intermediate Results Indicators. The Results Framework defines the indicators and the
institutional arrangements for data collection. The Results Framework is aligned with the
monitoring framework for PAR.
98. The Program M&E function will be assumed by the MPALSG, which has the
overall responsibility and coordinating role in M&E for the PAR and the Program. Third-
party verification and validations will be undertaken in cases where verification involves

38
handling excessive data loads and/or handling sensitive data, for example, data from personnel
files, and also to build necessary capacity in, for instance, quality of IT-operated data handling.
MPALSG has the overall responsibility and coordinating role in M&E for the PAR and the
Program. MPALSG and Bank implementation support missions will undertake periodic tests of
implementing Ministries’ M&E arrangements to verify that adequate systems are in place to
generate the information needed for Program reporting.
99. The results framework lays out results chains, baselines and Program targets. Each
result area defines the problem and provides a result chain—steps necessary to get to the desired
outcomes. Each result chain in turn, has specific elements—mainly inputs and outputs and
intermediate indicators, some of which are DLIs or actions outlined in the Action Plan.
Baselines have been established based on available information from a variety of sources for
example, Public Procurement Portal and the IMF article 4 assessment. The annual and end-of-
program targets are set on the basis of: the political aspirations set out in the PAR; evaluation of
past performance of the Bank’s projects and those of other DPs; international comparisons of
public sector modernization projects in other comparable settings; scope and funding of the
project, that is, necessary price tagging of the DLIs institutional capacity for implementation of
the PAR; and specific interventions needed under the PforR financing.
100. All indicators will be measured and reported annually. This is also the case for
indicators that have achieved their targets as well as for indicators for which the target only has
to be achieved at the end of the Program. Indicators are interlinked and continued measurement
contributes to ensuring that the first year’s indicators indeed contribute to achieve end-of-
Program indicators. Furthermore, the end-of-Program indicator needs to be measured from the
first year to ensure both the validity of the data source(s) and methodology, especially for
verification protocols, and as a test of attribution.
C. Disbursement Linked Indicators
101. The Program includes eight DLIs, representing key milestones achieved in the
implementation of the Program activities. The choice of a few DLIs is strategic and is based
on lessons from other operations, including other non-PforR results-based lending operations.
Rather than dealing with several DLIs with smaller amounts, the use of a limited number of DLIs
helps focus attention on key objectives of the Program and provides strong incentives for the
achievement of results. The use of a limited number of DLIs also improves efficiency in
monitoring and reporting by reducing the data collection burden on Government officials.
102. The DLI verification protocol lays out the data and methods that will be used to
determine the achievement of Program results and serve as a basis for disbursement.
Error! Reference source not found. Table 10 shows the DLIs and the verification protocol.
hese have been drawn up to ensure precision and accuracy in the verification and to avoid any
room for interpretation. They are based on methods that have been shown to be valid and reliable
and that make use of existing capacity in the Government sector and IT systems.
103. Consideration has also been given to achieving a reasonable level of budget
predictability through sequencing of the DLIs. The more significant a DLI is for the
achievement of the expected Program results over the implementation period of the operation,

39
the higher the portion of the loan amount allocated to the DLI. Similarly, for a specific DLI
requiring different results to be achieved over several periods, the more significant the result to
be achieved during a given period, the higher the portion of the DLI allocation during that
period. The DLIs are embedded in the project results framework (see annex 1) along the with
results indicators that are not DLIs. M&E arrangements for the Government’s reform program,
the PAR as well as the Program are described and assessed below.
Table 10: Summary of Disbursement Linked Indicators and verification protocol
DLI Verification Protocol Procedure
DLI #1: Percentage of Public
Administration Employee Positions
assigned to pay grades as per the
Law on Public Sector Employees
Salary System.
Review by the Public Policy Secretariat with third party on assignment
of public administration employees’ positions to new job grades using a
consolidated list of public administration employees’ positions to pay
grades as per the Law on Public Sector Employees Salary System.
Calculation: number of public administration employee positions
assigned to job grades as per the new pay and grading structure/ number
of new and consolidated public administration employee positions x100
DLI #2: Percentage of Public
Administration Employees assigned
to new pay grades as per the Law on
Public Sector Employees Salary
System.
Sample-based survey (exact survey design to be determined) by the
Public Policy Secretariat with third party, of public administration
employees’ personal action notices ( or relevant employment records)
against the new pay grades
DLI#3: Total number of Public
Administration Employees at or
under annual ceiling prescribed by
the Law on Ceilings on the Number
of Employees
Public Policy Secretariat with third party
Calculation: comparison of the total number of employees as per
payroll against number of staff as determined by the annual ceiling.
DLI#4: Percentage of Redundant
Public Administration Employees
receiving Redundancy Payments
pursuant to provisions of Labor
Law, Law on Ceiling on the
Number of Employees, and Civil
Servants Law.
Public Policy Secretariat with third party review of relevant documents
of severance packages, list of eligible public administration employees
per the Law on Ceiling on Number of Employees and count of public
administration employees receiving redundancy payments
Calculation: Number of Redundant Public Administration Employees
receiving Redundancy Payments/Number of eligible Redundant Public
Administration Employees receiving Redundancy Payments *100
DLI#5: Percentage of Public
Procurement Contracts within the
category of Public Authorities over
RSD 5M in value, signed in a fiscal
year of the Borrower, in 90 days or
less between the date of Issuance of
Bidding Documents and the date of
signing of the Public Procurement
Contracts.
Public Policy Secretariat with third party on a sample-basis to verify
functionality of the procurement tracking system Public Procurement
Portal in respect of capturing duration of procurement
Calculation: Number of Public Procurement Contracts within the
category of Public Authorities over RSD 5M in value, signed in a fiscal
year of the Borrower, in 90 days or less between the date of Issuance of
Bidding Documents and the date of signing of the Public Procurement
Contracts/ total number of public procurement contracts over 5M RSD
in value signed in the fiscal year*100
DLI#6: Value of Public Contracts
awarded through Framework
Agreements (in RSD)
Public Policy Secretariat with third party to estimate the total value of
public procurement framework agreements in a given year
DLI#7: Number of Indirect Budget
Beneficiaries included in the FMIS.
Review by the Public Policy Secretariat, with third party, of FMIS
standard and customized reports and audit trails to verify the number of
Indirect Budget Beneficiaries integrated into the FMIS

40
DLI Verification Protocol Procedure
DLI#8: Percentage of commitments
in budget execution system entered
within the required deadline per the
legislation on Deadlines for
Payments in Commercial
Transactions (%)
Review by the Public Policy Secretariat, with third party, of reported
data from FMIS on payments and reporting of commitments.
Calculation: commitments in budget execution system entered within
the required deadline/ all commitments in budget execution system *100

41
Table 11: DLI Verification Protocols
DLI Definition Scalable
(Yes/No)
Draft Protocol to Evaluate Compliance of the DLI and
Data/Result Verification Remarks
Data source Procedure
DLI1:
Percentage of
public
administration
employee
positions
assigned to pay
grades as per
the Law on
Public Sector
Employees
Salary
System(%)
Public administration employees
positions are positions in all
ministries, public services, agencies,
and local Government (Art. 1
paragraph 3 of the Public Sector
Wage Bill LAw) excluding police
officers, the military, and SOEs
‘Assigned to job grades according to
the new pay and grading structure’:
Assigned to the appropriate grade as
determined by the job evaluation and
re-grading process by the MPALSG
No Consolidated list of
public
administration
employee positions
New pay and
grading structure
Report with
assignment of
public
administration
employee positions
to new pay grades
Review by the Public Policy
Secretariat on assignment of public
administration employee positions to
new job grades using a consolidated
list of public administration employee
positions to pay grades according to
the Law on Public Sector Employees
Salary System.
Calculation: Number of public
administration employee positions
assigned to job grades according to the
new pay and grading structure/
Number of new and consolidated
public administration employee
positions x 100
DLI for year 1 (70%)
Assessment date: June
30, 2017
Intermediate Results
Indicator 1.1
DLI2: Percentage of
public
administration
employees
assigned to
new pay grades
according to
the Law on
Public Sector
Employees
Salary
System(%)
Public administration employees—
staff on open-ended contracts in in all
ministries, public services, public
agencies and local self-Government
(Art. 1 paragraph 3 of Law on Public
Sector Employees Salary System)
excluding police officers, the
military, and state owned enterprises.
Yes Sample of public
administration
employees’
personal action
notice or other
relevant
employment record
( per Law on
Protection of
Personal Data)
New pay grades (
from the Law on
Public Sector
Wages)
Employee Registry
Sample-based survey (exact survey
design to be determined) by the Public
Policy Secretariat of public
administration employees’ personal
action notices against the new pay
grades
Calculation: number public
administration employees assigned to
new pay grades according to the Law
on Public Sector Employees Salary
System/number of all public
administration employees in the
registry of public employees *100
DLI for year 2 (80%),
2 (90%), and 3 (90%).
Assessment dates:
December 31, 2017,
and 2018
PDO Indicator 1

42
DLI Definition Scalable
(Yes/No)
Draft Protocol to Evaluate Compliance of the DLI and
Data/Result Verification Remarks
Data source Procedure
DLI3: Total
number of
public
administration
employees at
or under
annual ceiling
prescribed by
the Law on
Ceilings on the
Number of
Employees
(Yes/No)
Total number of employees—
number of open ended employees in
ministries or agencies and local
Government subject to the Law on
Ceilings on the Number of
Employees receiving remuneration as
of June 30 of current year. Part-time
employment will be converted to
full-time equivalents.
Annual ceiling—prescribed number
of public administration employees
as defined by the Law on Ceilings on
the Number of Employees.
No Annual ceiling
prescribing the
total number of
public
administration
employees
consistent with the
Law on Ceilings
on the Number of
Employees
Total number of
employees as on
the payroll
Review by the Public Policy
Secretariat
Calculation: Total number of
employees according to payroll and
/registry of employees compared to
authorized number of staff as
determined by the annual ceiling
DLI for year 1 (Per
2016 ceiling), 2 (Per
2017 ceiling), and 3
(Per 2018 ceiling).
Assessment dates:
December 31, 2016,
2017, and 2018
PDO Indicator 2
DLI4 Percentage of
redundant
public
administration
employees
receiving
redundancy
payments
pursuant to the
provisions of
Labor Law and
Law on
Ceilings on the
Number of
Employees and
Civil Servants
Law (%)
Redundant—employee will be
considered redundant if s/he has
accepted the severance package
(rather than seeking employment
elsewhere in public sector).
Not
scalable
for the
first 99%;
thereafter
scalable.
The Decree on the
Ceiling on
Maximum Number
of Employees
List of eligible
employees
List of employees
receiving
redundancy
payment
Public Policy Secretariat review of
relevant documents of severance
packages and count of public
administration employees receiving
redundancy payments
Calculation: Number of redundant
public administration employees
receiving redundancy
payments/Number of employees
eligible for redundancy payments per
the provisions of the Labor Law and
Law on Ceilings on the Number of
Employees *100
DLI for year 2 (100%)
and year 3 (100%)
Assessment dates:
December 31, 2017
and 2018
PDO Indicator 3
DLI5: Percentage of
public
procurement
contracts
Public procurement contracts—
written agreements in which
contracting authorities as purchaser
agree to acquire goods, works, or
services from a seller in exchange for
Yes PPO Portal on
number of contracts
over RSD 5 million
in value awarded in a
fiscal year and time
Public Policy Secretariat review on a
sample basis to verify functionality of
the procurement tracking system
public procurement portal in respect of
capturing duration of procurement
DLI for year 1 (65%),
2 (68 %), and 3 (71 %)
Assessment dates:
December 31, 2016;

43
DLI Definition Scalable
(Yes/No)
Draft Protocol to Evaluate Compliance of the DLI and
Data/Result Verification Remarks
Data source Procedure
within the
category of
Public
Authorities
over RSD 5
million in
value, signed
in a fiscal year
of the
Borrower, in
90 days or less
between the
date of
issuance of
Bidding
Documents
and signing of
the Public
Procurement
Contract (%)
payment and that specifies each
party’s obligations in relation to the
transaction, for example, business
provisions, price, payment
information, and other legal terms
and conditions applicable to the
transaction.
Issuance of bidding documents— the
bidding documents are posted on the
public procurement portal. Tender or
bidding documents are defined under
article 61 of the PPL according to
type of procedure and the subject of
public procurement. Date of
announcement of tender
documentation on the public
procurement portal will be the
starting date for calculation of the
duration of procedure.
Award of contracts—the contracts
are signed between the contracting
authority and the selected economic
operator. Notice on concluded public
contract is announced on the public
procurement portal, and it will be
calculated as the ending date of
duration of procedure.
between issuance of
bidding documents
and award of contract
Calculation: Number of public
procurement contracts within the
category of Public Authorities over
RSD 5 million in value, awarded in the
fiscal year within a duration of 90 days
or less between the date of issuance of
bidding documents and the date of
signing of the public procurement
contracts / Total number of public
procurements contracts within the
category of Public Authorities in the
fiscal year * 100
2017, and 2018
PDO Indicator 4
DLI6: Value
of public
procurement
contracts
awarded
through
Framework
Agreements
Framework Agreements—contractual
arrangements with a supplier
establishing pricing structures
without necessarily fixing an actual
price but rather a mechanism that
will be applied for pricing particular
requirements during the period of the
Framework Agreement
Yes PPO database (in
portal) of quarterly
reports submitted by
contracting
authorities on
procurement
contracts.
Public Policy Secretariat to estimate
the total value of public procurement
Framework Agreements in a given
year
Calculation: PPO to provide data from
its Annual Report.
DLI for year 1 (RSD
29.3 billion); 2 (RSD
32.2 billion); and 3
(RSD 35.4 billion)
Assessment dates:
December 31, 2016,
2017, and 2018

44
DLI Definition Scalable
(Yes/No)
Draft Protocol to Evaluate Compliance of the DLI and
Data/Result Verification Remarks
Data source Procedure
(RSD)
PDO Indicator 5
DLI7: IBBs
included in the
FMIS
(number)
IBBs—defined in the Republic of
Serbia Law on Budget Systems as
legislative bodies, public institutions
founded by the Republic, and/or local
Governments and subordinate to their
respective bodies and organizations
of the republic and/or local
Governments in administrative and
budgetary sense.
Included in FMIS—integrated in
BES operated through the FMIS via a
module and direct access to the
system by staff of the respective
institutions to enter commitment,
request for payments, and so on, to
enable improved monitoring and
control over budget execution by
IBBs
Yes FMIS standard
and customized
reports
Audit trail of the
FMIS
Register of
beneficiaries of
public funds
Policy Secretariat review of the list of
IBBs
Review by the Policy Secretariat of
FMIS standard and customized reports
and audit trails to verify the number of
IBBs integrated in the FMIS
DLI for year 1 (247), 2
(309), and 3 (526)
Assessment dates:
December 31, 2016,
2017, and 2018
Intermediate Results
Indicator 2.1
DLI8: Percentage of
commitments
in BES entered
within the
required
deadline, per
the legislation
on Deadlines
for Payments
in Commercial
Transactions
(%)
Commitments—assumed liabilities
by budget beneficiaries for which the
funds are committed in the FMIS
against respective beneficiary’s
budget appropriation.
BES—as defined in rulebook on the
system of budget execution, that is, a
system operated by the TA through
the FMIS application, which covers
all budget expenditures incurred by
entities included in the system.
RINO by-law (to Law on Deadlines
of Payments in Commercial
Yes FMIS standard and
tailored reports
Audit trail of the
FMIS
Review by the Public Policy
Secretariat of reported data from the
FMIS on payments and reporting of
commitments
Calculation: Amount (in RSD) of
commitments in BES entered within
the required deadline per the
legislation on Deadlines for Payments
in Commercial Transactions/ Total
amount of commitments (in RSD)
entered in BES during the review
period *100
DLI for year 1 (70%);
DLI for year 2 (80%);
DLI for year 3 (90%)
Assessment dates:
December 31, 2016,
2017, and 2018
PDO Indicator 6

45
DLI Definition Scalable
(Yes/No)
Draft Protocol to Evaluate Compliance of the DLI and
Data/Result Verification Remarks
Data source Procedure
Transactions)—Rulebook on
supervision of implementation of the
RINO Law (October 2015)
prescribes that budget beneficiaries
are obliged to report commitments
within three days after those have
been assumed.

46
Table 12: Program Results Framework
Program Development Objective (PDO): To improve efficiency in public sector employment and finances.
PDO Level Results
Indicators DL
I
Unit Baseline
Target Values
Frequency Data Source/
Methodology
Responsibility
for Data
Collection
Remarks14
YR1 YR2 YR3
PDO Indicator 1: Share of public
administration
employees assigned
to new pay grades as
per the Public Sector
Law
% 0 0 70 70 Annual Sample-based survey
(exact survey design
to be determined) of
public administration
employee pay slips
against the new pay
grades
Public Policy
Secretariat
DLI2
PDO Indicator 2:
Total number of
public administration
employees at or under
the annual ceiling
prescribed by the Law
on Ceilings on the
Number of
Employees in the
public sector
(Yes/No)
Yes No Yes Yes Yes Annual Calculation: Total
number of employees
according to payroll
compared to Total
number of staff as
determined by the
annual ceiling
Public Policy
Secretariat
DLI3
PDO Indicator 3:
Share of redundant
public administration
employees receiving
redundancy payments
in line with the
provisions of the
Labor Law, Law on
Ceilings on the
Number of
Employees, and Civil
Servants Law
% 100 100 100 100 Annual Review and count of
relevant documents of
severance packages
for eligible public
administration
employees
Calculation: public
administration
employees receiving
redundancy
payments/eligible
public administration
Public Policy
Secretariat
DLI4
14 If not stated otherwise, the DLIs are for all three years of implementation.

47
Program Development Objective (PDO): To improve efficiency in public sector employment and finances.
PDO Level Results
Indicators DL
I
Unit Baseline
Target Values
Frequency Data Source/
Methodology
Responsibility
for Data
Collection
Remarks14
YR1 YR2 YR3
employees per Labor
Law, Law on Ceilings
on the Number of
Employees, and Civil
Servants Law
PDO Indicator 4:
Share of public
procurement contracts
within the category of
Public Authorities
over RSD 5 million in
value, signed in a
fiscal year, in 90 days
or less between the
date of issuance of
bidding documents
and signing of the
public procurement
contracts
% 62 65 68 71 Annual Public procurement
portal
.
Calculation: public
procurement contracts
within the category of
Public Authorities
over RSD 5 million in
value, signed in the
fiscal year in a
duration of 90 days or
less between date of
issuance of bidding
documents and
signing of the public
procurement
contracts/ All
procurement contracts
over RSD 5 million in
value signed in the
fiscal year.
Public Policy
Secretariat
DLI5
PDO Indicator 5: Value of public
procurement contracts
awarded through
Framework
Agreements
RSD 26.6
billion
29.3
billion
32.2
billion
35.4
billion
Annual Estimate of total
value of public
procurement
framework
agreements in a given
year based on public
procurement database
Public Policy
Secretariat
DLI6

48
Program Development Objective (PDO): To improve efficiency in public sector employment and finances.
PDO Level Results
Indicators DL
I
Unit Baseline
Target Values
Frequency Data Source/
Methodology
Responsibility
for Data
Collection
Remarks14
YR1 YR2 YR3
PDO Indicator 6: commercial
transactions in
Budget Execution
System (BES) which
are based on
previously reported
commitments in line
with the legislation on
Deadlines for
Payments in
Commercial
Transactions
RSD 60 70 80 90 Annual Calculation: Value of
commitments entered
in FMIS within
deadline prescribed
by legislation/ Value
of total commitments
entered in FMIS x
100
Public Policy
Secretariat
DLI8
Result Area 1: Improved Human Resource Management
Intermediate Results
Indicator 1.1: At
least 70% of public
administration
employee positions
assigned to pay
grades according to
the Law on Public
Sector Employees
Salary
System(Yes/No)
Yes/No No Yes Yes Yes – Annual Calculation: Number
of public
administration
employee positions
assigned to job grades
/ Total number of
public administration
employee positions x
100
Public Policy
Secretariat
DLI1 for
year 1 only
Intermediate Results
Indicator 1.2: Share
of public
administration
employees assigned
to new grades
% 0 0 60 70 Annual Calculation: Division
of assigned public
administration
employees by total
number of public
administration
employees x 100.
MPALSG DLI for
Year 2
Intermediate Results
Indicator 1.3:
Employee Registry
Yes/No No No No Yes Annual Sample review of
personal data,
interview of
MPALSG –

49
Program Development Objective (PDO): To improve efficiency in public sector employment and finances.
PDO Level Results
Indicators DL
I
Unit Baseline
Target Values
Frequency Data Source/
Methodology
Responsibility
for Data
Collection
Remarks14
YR1 YR2 YR3
functional according
to defined criteria in
the Law on Employee
Registry
individuals, and
review of customized
and routine reports
and HR transaction
documentation and
audit trail
Intermediate Results
Indicator 1.4: Share
of public
administration
employee positions
for which job re-
grading completed
% NA 0 30 60 Biannual Calculation: Number
of re-graded public
administration
employees paid
according to new
grades / All public
administration
employees in payroll
x 100
MPALSG –
Intermediate Results
Indicator 1.5:
Ministries with
retrenchment plans,
identifying redundant
positions
Number 0 5 10 17 Biannual Review and count of
retrenchment plans
MPALSG –
Result Area 2: Improved Financial Management
Intermediate Results
Indicator 2.1: IBBs
included in the FMIS
Number 0 247 317 526 Annual Review of FMIS
reports
Public Policy
Secretariat
DLI7
Intermediate Results
Indicator 2.2:
Budget inspections
conducted
Number 25 35 45 50 Annual Review of budget
inspection reports
Public Policy
Secretariat –
Result Area 3: Improved Procurement Management
Intermediate Results
Indicator 3.1: Public
procurement contracts
Number 3,300 3,600 4,000 4,400 Annual PPO’s Annual
Report/Collection
through PPO database
PPO
–

50
Program Development Objective (PDO): To improve efficiency in public sector employment and finances.
PDO Level Results
Indicators DL
I
Unit Baseline
Target Values
Frequency Data Source/
Methodology
Responsibility
for Data
Collection
Remarks14
YR1 YR2 YR3
awarded through
Framework
Agreements for all
contracting
authorities
of concluded
contracts
Intermediate Results
Indicator 3.2: Public
procurement officers
certified
Number 1,810 2,000 2,200 2,400 Annual PPO’s Annual
Report/Database of
procurement officers
certified
PPO
–

51
VII. PROGRAM ECONOMIC VALUATION
138. The role of institutional quality for growth and development is now well established.
Countries with weak institutions tend to perform poorly compared to those with better
institutions. This is because growth and sustainable development are only assured where credible
institutions exist and where the state functions to support and not undermine competitiveness.
Strong institutions provide the necessary foundational basis for increasing growth opportunities
in developing countries. Institutions create structures which organizations need to generate
returns. Such institutions then steer enterprises toward creating more wealth—hence,
development —and create a climate favorable to private investment.
139. The PforR will generate economic benefits from efficiency savings through
improvements in the management of human resources, public finances, and public
procurement. Improvements in these core management systems at the upstream level are
expected to be reflected in the efficiency gains downstream in sector agencies. The Program
complements ongoing lending operations in health, education, competitiveness, and
infrastructure, addressing systemic operational deficiencies and thereby, improving efficiency
and effectiveness of investments in these sectors.
140. The expected net impact realized through expected efficiency gains from the process
of modernizing Serbia’s public administration is valued at a range between US$8 million
and US$15 million. This represents the sum of estimated net benefits arising from program
implementation. The summary of the cost and benefits associated with each of the result areas of
the Program are presented in table 14 below, while the corresponding subsections contain details
on the methodology applied to generate these estimates. The analysis assumes an exchange rate
of 107 RSD per USD and a 12 percent discount rate. It also assumes a time horizon of three
years, from 2016-2018, consistent with the Program’s time frame.
Table 13: Summary Economic Analysis (USD)
2016 2017 2018 Total
Result area 1: Improved
Human Resource
Management
Costs 61,213,026 79,203,026 79,203,026 219,619,078
benefits (low) 42,349,286 84,275,078 125,781,613 252,405,977
Benefits (high) 124,481,233 245,228,029 362,352,422 732,061,684
Result area 2: Improved
Financial Management
Costs 1,039,423 433,418 433,418 1,906,259
Benefits 58,572,285 58,572,285 58,572,285 194,158,788
Result area 3: Improved
Procurement Management
Costs 16,233,081 16,123,608 16,123,608 48,480,297
Benefits 68,523,332 54,018,659 45,315,855 167,857,846
Total Costs 78,485,530 95,760,052 95,760,052 270,005,634
Total Benefits (low) 200,613,482 230,317,389 260,987,185 691,918,056
Total Benefits (high) 282,745,429 391,270,340 497,557,994 1,171,573,763
NET BENEFITS (low) 90,959,373 101,105,970 133,909,701 325,975,043
NET BENEFITS (high) 173,091,320 262,058,921 370,480,510 805,630,750
Net Present Value (NPV) at 12% (low) 7,656,086
Net Present Value (NPV) at 12% (high) 15,033,992

52
Result Area 1: Improved Human Resource Management
Table 14: Result Area 1, Scenario 1(USD) Wage bill reduces by 1%
Costs 2016 2017 2018 Total
Severance payments of redundant staff (5,000
people per year) 60,482,026 60,482,026 60,482,026 181,446,078
IBRD interest @ 0.65% 110,500 110,500 110,500 331,500
Front-end and commitment fee @ 0.5% 255,000
255,000
Financing costs (0.65% interest + 0.5% fee) 365,500 110,500 110,500 586,500
Unemployment benefits ($300 x 12 months x
5,000 people)
18,000,000 18,000,000 36,000,000
Job training and job search ($100 x 5,000 people) 500,000 500,000 1,000,000
Costs Subtotal 61,213,026 79,203,026 79,203,026 219,619,078
Benefits 2016 2017 2018 Total
Wage bill reduction savings 42,349,286 84,275,078 125,781,613 252,405,977
General Government total wage bill (BAU) 4,234,928,551 4,234,928,551 4,234,928,551
Annual wage bill reduction 1% 1% 1%
General Government total wage bill (after
reduction) 4,192,579,266 4,150,653,473 4,109,146,938 3,940,173,289
Benefits Subtotal 42,349,286 84,275,078 125,781,613 252,405,977
Net Benefits -18,863,740 5,072,052 46,578,587 32,786,899
Contingency (10%) -1,886,374 507,205 4,657,859 3,278,690
Inflation (2%) -377,275 101,441 931,572 655,738
Net Benefits -16,600,092 4,463,406 40,989,156 28,852,471
Net Present Value (NPV) at 12% -1,231,863
Table 15: Result Area 1, Scenario 2 (USD) Wage Bill Reduced By 3 %
Costs 2016 2017 2018 Total
Severance payments of redundant staff (5,000
people per year) 60,482,026 60,482,026 60,482,026 181,446,078
IBRD interest @ 0.65% 110,500 110,500 110,500 331,500
Front-end and commitment fee @ 0.5% 255,000
255,000
Financing costs (0.65% interest + 0.5% fee) 365,500 110,500 110,500 586,500
Unemployment benefits ($300 x 12 months x
5,000 people) 18,000,000 18,000,000 36,000,000
Job training and job search ($100 x 5,000
people) 500,000 500,000 1,000,000
Costs Subtotal 61,213,026 79,203,026 79,203,026 219,619,078
Benefits 2016 2017 2018 Total
Wage bill reduction savings 124,481,233 245,228,029 362,352,422 732,061,684
General Government total wage bill (BAU) 4,149,374,439 4,149,374,439 4,149,374,439
Annual wage bill reduction 3% 3% 3%
General Government total wage bill (after
reduction) 4,024,893,206 3,904,146,410 3,787,022,018 3,292,831,522
Benefits Subtotal 124,481,233 245,228,029 362,352,422 732,061,684
Net Benefits 63,268,207 166,025,003 283,149,396 512,442,606
Contingency (10%) 6,326,821 16,602,500 28,314,940 51,244,261
Inflation (2%) 1,265,364 3,320,500 5,662,988 10,248,852
Net Benefits 55,676,022 146,102,003 249,171,468 450,949,493
Net Present Value (NPV) at 12% 5,260,694

53
141. The net present value under this results area is estimated to range between a net
cost of US$1 million and a net benefit of US$5 million as a result of controlling staffing and
reducing the wage bill. The analysis assumes two policy scenarios: one where the wage bill is
reduced by 1% and another where the wage bill is reduced by 3%. The net costs under this
results area are expected to be US$220 million, whether the wage bill is reduced by 1% or 3%.
This includes financial costs (interest payments, fees) as well as socio-economic costs
(unemployment benefits and assistance in job training and job searching for retrenched staff).
The opportunity cost of staff time spent on reforms was not counted separately because they
program financing covers salaries of staff who will be working on these reforms full-time. As
such, we assume that staff are not making a trade-off between their regular tasks and these
reforms. The net benefits under this results area are expected to be US$252 million if the wage
bill is reduced by 1% and US$732 million if the wage bill is reduced by 3%. This includes
savings in the general Government wage bill. To estimate the size of the agreed reductions, we
assume that the wage bill from 2016 to 2018 would remain at the 2015 end-of-year level. The
2015 wage bill is assumed to be 1% (or 3%) lower than the reported general Government wage
bill from 2014 which is US$4.1 billion. Assuming that the wage bill decreases by 1% (or 3%)
year-to-year in 2016-2018, the cumulative value of the reductions for the entire period will then
range between US$252 million and US$732 million.
Result Area 2: Improved Financial Management
Table 16: Economic Analysis Result Area 2 (USD)
Costs 2016 2017 2018 Total
Staff time spent on FMIS training 7,847,622 7,853,094 7,853,094 23,553,810
Current repair and maintenance of FMIS equipment 8,213,459 8,218,514 8,218,514 24,650,487
Financing costs (0.65% interest + 0.5% fee) 86,000 26,000 26,000 138,000
Costs Subtotal 16,233,081 16,123,608 16,123,608 48,480,297
Benefits
Arrears (total value of unsettled commitments) 90,654,206 54,392,523 32,635,514
Annual arrears reduction (40% per year) 40% 40% 40%
Expenditure arrears after reduction 54,392,523 32,635,514 19,581,308
Savings from arrears reduction 36,261,682 21,757,009 13,054,206 71,072,897
Time savings of Financial Management Staff (25%
reduction) 32,261,650 32,261,650 32,261,650 96,784,949
No. of employees in financial departments (FTE) 19,400 19,400 19,400
average gross annual wage of FD employees 6,652 6,652 6,652
% reduction in time spent 25% 25% 25%
Benefits Subtotal 68,523,332 54,018,659 45,315,855 167,857,846
Net Benefits 52,290,251 37,895,051 29,192,247 119,377,549
Contingency (10%) 5,229,025 3,789,505 2,919,225 11,937,755
Inflation (2%) 1,045,805 757,901 583,845 2,387,551
Net Benefits 46,015,421 33,347,645 25,689,178 105,052,243
Net Present Value (NPV) at 12% 3,748,664
142. The net present value under this results area is estimated to be US$4 million as a
result of efficiency gains from the increased use of FMIS and savings from reducing
Government expenditure arrears. The net costs under this results area are estimated at US$48
million. This includes financial costs such as interests, fees, as well as foreign exchange
premium for FMIS hardware and software to be purchased. The opportunity cost of staff time

54
spent under the implementation of these reforms was not counted separately because they
program financing covers salaries of staff who will be working on these reforms full-time. As
such, we assume that staff are not making a trade-off between their regular tasks and these
reforms. The net benefits under this result area are estimated to be US$168 million. This includes
savings from higher operational efficiency. As more users enrol in FMIS, financial department
staff (direct budget beneficiaries) are expected to spend less time liaising and coordinating with
those currently not using FMIS in schools and prisons (indirect budget beneficiaries). Most of
the gains under this result area – such as those coming from a reduction in arrears and increased
efficiency in cash management through improved commitment controls – are not measurable in
monetary terms since they do not bring any tangible benefit, but instead enhance reputation and
financial credibility of the Government. Therefore, we quantify the benefits from extending
FMIS to indirect budget beneficiaries as a proxy.
143. To estimate the magnitude of potential efficiency gains from extending FMIS to
indirect budget beneficiaries, we estimate the number of staff working in financial
departments. Since the number of staff working in financial departments of indirect budget
beneficiaries is not readily available, we estimate it by multiplying the total of 484,98915
employees working in public sector institutions not covered by the FMIS by the 4 percent
estimated share of employees working in financial departments taken from the database
compiled through functional review of public administration institutions currently prepared by
the WB. The estimate of average annual salary is performed using the data from the registry of
public sector employees. The average annual gross salary of financial department staff is
US$6,652. The assumed total reduction in working hours spent by financial department
employees is 3 percent which results in annual savings of approximately US$3.9 million.
144. The benefits also include savings from reducing the Government expenditure
arrears. Arrears, as defined by the total value of unsettled commitments, are expected to be
reduced by 40 percent each year. If these reductions are achieved, then the potential savings fare
estimated at US$71 million.
Result Area 3: Improved Procurement Management
145. The net present value under this results area is estimated to be US$4 million as a
result of reduced prices of commonly procured goods using Framework Agreements and
time savings for procurement staff, vendors and bidders. The Program will support training
of officers involved in the procurement process in order to increase the share of public
administration procurement over RSD 5 million completed from 120 days to 90 days, which is
equivalent to a 25 percent decrease. The net costs under this results area are estimated to be
US$2 million. These include financial costs such as interests and fees. The opportunity cost of
staff time spent under the implementation of these reforms was not counted separately because
program financing covers salaries of staff who will be working on these reforms full-time. As
such, we assume that staff are not making a trade-off between their regular tasks and these
reforms. The benefits under this results area are estimated to be US$194 million. This is
15 This number represents the difference between the total of 500,538 employees working in the public sector and an estimate of
15,549 employees working in institutions covered by the FMIS (based on the dataset from the horizontal functional analysis of
the central Government compiled by the WB)

55
estimated through savings on reduced prices as a result of commonly procured goods through
Framework Agreements, public sector procurement staff salaries, and vendor salaries.
Table 17: Economic Analysis Result Area 3 (USD)
Cost 2016 2017 2018 Total
Procurement staff time 413,423 407,418 407,418 1,228,259
IBRD interest @ 0.65% 26,000 26,000 26,000 78,000
Front-end and commitment fee @ 0.5% 600,000
600,000
Costs Subtotal 1,039,423 433,418 433,418 1,906,259
Benefits 2016 2017 2018 Total
Savings reduced price procurements of
pharmaceuticals using Framework Agreements
(2014 actuals)
27,000,000 27,000,000 27,000,000 81,000,000
Time savings for vendors and bidders (15%
reduction using minimum wage estimates) 27,572,285 27,572,285 27,572,285 82,716,854
Time savings for PP staff (15% reduction) 6,147,311 6,147,311 6,147,311 18,441,934
volume of large PP transactions 2,780,490,691 2,891,710,319 3,007,378,732
assumed annual increase in volume 4% 4% 4%
number of large PP transactions 28,472 28,472 28,472
number of PP employees (FTE, estimate) 6,500 6,500 6,500
average gross annual wage of PP employees 6,305 6,305 6,305
% reduction in large procurement processing 15% 15% 15%
Benefits Subtotal 58,572,285 58,572,285 58,572,285 194,158,788
Net Benefits 57,532,862 58,138,867 58,138,867 192,252,529
Contingency (10%) 5,753,286 5,813,887 5,813,887 17,381,060
Inflation (2%) 1,150,657 1,162,777 1,162,777 3,476,212
Net Benefits 50,628,918 51,162,203 51,162,203 171,395,258
Net Present Value (NPV) at 12% 4,220,554
146. Using Framework Agreements to purchase common goods in bulk can lead to
savings of at least US$28 million. To estimate the savings from price reductions as a result of
framework agreements, we looked at bulk order of drugs. Until recently Serbia had a system in
which each hospital, primary health centre and pharmacy procured drugs individually. Rather
than competing on price, suppliers competed on the amount of “rebates” they offered to the
hospital or pharmacy, which were often a third of the purchase price. Once Framework
Agreements were used to procure a third of the drugs used in the Serbian health care system, the
prices achieved through this process were on average 27 percent lower than before.
147. The analysis calculates the amount of salaries saved as a result of a 25% decrease in
processing time of procurement that is categorized as large. According to the Public
Procurement Office annual report in 2014 there was comparable number of large and small
procurement transactions in public sector. There were 30,897 large procurement procedures and
another 28,624 small ones initiated, out which 26,046 and 25,328 were successful within the
large and small category, respectively. Assuming that procurement staff dedicates 80% of their
time to procurement tasks, and that it takes three times as many working hours to process a large
versus small procurement, it follows that procurement employees are spending 60% of their time
processing large procurement. This translates into 15% working hours saved under this result
area.

56
148. The analysis uses proxies to estimate the number of public procurement staff and
their salaries. To determine the number of public procurement staff, the percentage of full time
equivalent (FTE) staff working on procurement are calculated form a functional review of public
administration institutions currently underway. Part of this review assesses the allocation of
employees to different functions identified within the portfolio of institutions, which enables us
to determine the share of employees working on public procurement related tasks (1.3 percent).
The 1.3% coefficient was taken from the sample and multiplied by the total number of staff in
the Serbian public sector (500,538), to get the total of 6,500 as a proxy. To determine the average
annual salary, the analysis used the average of the salaries from the staff working in procurement
($6,305). This generates a result of approximately $24.6 million in savings from efficient
procurements.
149. The estimated benefits can also be expressed in terms of the number of employees
that could potentially be reduced as a result of achieving higher efficiency of public
procurement processing under the program. For example, a reduction in the total working
hours by 15%, the estimated annual savings is US$6.1 million, which can pay the salaries of 975
staff per year. The benefits could also be expressed in terms of the number of additional
procurement transactions that could be handled. For example, a reduction in large procurement
processing time by 25%, this translates to 6,500 full time procurement staff handling 4,271 more
transactions per year.
150. Savings on vendor staff salaries represent a potential benefit estimated at US$206
million. If processing time is reduced by 25percent, this would also save salaries of vendors who
would now be spending less time and labor preparing and submitting bids. To estimate this, the
analysis assumes that there will be a minimum of 2 bidders per transaction and multiply this by
the number of transactions (28,472). For vendor staff salaries, the analysis annualizes the
minimum wage. All of these components are multiplied by 15 percent in order to quantify the
value of the time saved on the vendor side as a result of more efficient procurement processes.
VIII. EVALUATION OF TECHNICAL RISKS
151. The technical risks to Program implementation are Substantial. Three risks and
their mitigation measures are highlighted here: coordination across Government; institutional
capacity; and policy continuity. This section also addresses the risk of backtracking on the
retrenchment of public employees after the Program period. The Program risk matrix is
presented in Annex 7. The Action Plan outlined in Table 18 outlines measures taken to mitigate
some of these risks.
152. The principal risk arises from the need for close coordination and collaboration
across the whole of Government for effective implementation of the Program. All of the
reforms under the Program tighten central controls over human resources, public finances and
public procurement at the expense of budget entities. While these reforms will generate
efficiency gains, the gains will come at the expense of agency level management discretion.
Consequently, some management resistance to reforms should be anticipated. The large number
of institutions involved in the implementation of these reforms is likely to pose a challenge
whether or not there is management resistance. At the very least, there is a risk that the central
agencies managing reforms – MPASLG, MoF Treasury and PDO – will not be able to follow-up

57
on implementation and tackle implementation problems in a timely manner. The Government
has put in place a structure for coordination of the PAR Strategy that allows issues to be
addressed at a technical level in an Inter-Ministerial Working Group and then escalated to senior
civil servants and ultimately to the political leadership. These arrangements should provide an
adequate basis for coordination. Technical assistance provided by the EU in support of a parallel
Sector Budget Support operation will provide help strengthen MPASLG capacity to manage its
coordination function. Technical assistance provided under an EU-financed RETF under the
Bank’s Rightsizing and Restructuring Project will support the implementation of a
communication strategy aimed at mobilizing support for the reforms both within and outside of
Government.
153. Limited capacity in the key implementing institutions also poses a substantial risk to
Program implementation. MPASLG is a new institution. Senior management has considerable
experience in the implementation of complex public administration reforms but middle
management and technical grades do not. Staff are already stretched managing routine functions
and have limited time to dedicate to the monitoring and analytical demands of the Program, let
alone the massive tasks of job evaluation and grading. The Ministry of Finance and Public
Procurement Office are also stretched their existing managing routine functions. Implementation
of the Program will not significantly change the workload for the Ministry of Finance, though the
Action Plan does require improvements in budget preparation and monitoring. The Fiduciary
Assessment has recommended increases in the staffing of the Budget Department, which is
particularly stretched during peak times of the budget calendar. The proposed centralization of
procurement under the Program through the use of Framework Contracts will significantly
increase the PPO’s work load. The Program also entails significant increases in workload for the
policy units and administrative departments of Ministries across Government for the preparation
of functional reviews, retrenchment plans, implementing of job evaluation and grading as well as
improvements in budget preparation, budget monitoring and in procurement management. The
Program will provide support to these functions across Government through training. Additional
support will be provided through parallel technical assistance operations, which includes funding
for advisory services across the reform agenda, contractual services to support labor intensive job
classification and regarding and training programs. Technical assistance provided by the EU in
support of a parallel Sector Budget Support operation will provide support for human resource
management and financial management reforms across Government. The EU-financed RETF
under the Bank’s Rightsizing and Restructuring Project will support the implementation of
functional reviews and rightsizing in key sectors. A DfID-financed technical assistance project
will provide support to Public Procurement reforms.
154. Changes in Government may lead to changes in policy priorities and commitment to
the Program. Elections will take place during Program implementation, possibly as early as
2016. Any change in Government poses the risk of changes in priorities. This is particularly true
of politically challenging reforms such as those involving large scale retrenchment of public
sector employees. The sequencing of important measures might be influenced by political
calculation or activities simply dropped. This risk is mitigated by the commitments made to
international institutions regarding the implementation of the Program as part of the broader
PAR Strategy, notably commitments to the IMF under the Stand-by Arrangement through to
2018, and in the context of the longer-term process of accession to the EU.

58
155. There is a risk that the Government may backtrack on efforts to right size the
administration by rehiring large numbers of staff after the Program period. This risk has
materialized in other countries, undermining the rationale for the Bank intervention in civil
service reform. Serbia’s own experience over the last fifteen years demonstrates how
Governments can lose control of staffing numbers and public employment can increase to
unsustainable levels very quickly. It is not possible to entirely eliminate this risk. However, the
Program has learned from the Bank’s experience and includes a number of features that are
intended to strengthen controls and hinder excessive growth of public employment in the future:
first, the Law on the Ceilings on Number of Employees effectively caps the number of positions
for each institution; second, staffing information will be consolidated in a single registry which is
directly linked to payroll so as to facilitate monitoring and control; and third, the implementation
of retrenchment plans will reflected in the registry through the closure of positions where staff
are transferred or made redundant.

59
Table 18:Program Action Plan
Action Description DLI* Covenant* Due Date Responsible Party Completion Measurement**
Fiduciary Assessment
Increased involvement of the budget
beneficiaries establishing the
budgetary allocations and multiyear
budget requirements
December
31, 2016
MoF Adherence to budget calendar and evidence of
effective two-way process in budget preparation
Regular periodic reporting on
comprehensive data on arrears
December 31,
2016 Beneficiaries of public
funds
Evidence of regular reports on arrears
Improved medium-term planning and
consideration of medium-term targets
in preparation of respective annual
budgets
December 31,
2016 Beneficiaries of public
funds;
MoF
Assessment of annual budgets and medium-
term plans
Instituting ex ante controls for
contractual commitments
December 31,
2016 MoF;
Beneficiaries of Public
Funds;
Instituted mechanism of controls over
contractual commitments before assuming them
Improved control over multiannual
contractual commitments
December 31,
2016 MoF;
Beneficiaries of Public
Funds
Implementing a systematic approach to
approve, record, and monitor multiannual
contractual commitments
The Government to strengthen the
complaint handling mechanism to
improve its effectiveness efficiency in
handling complaints
December 31,
2016 PPO/RC Reports of activities in the first six months of
Program effectiveness
Social and Environmental Assessment
The MPALSG has staff assigned to
coordinate, monitor, and report on the
rightsizing process and its effects.
June 30, 2016 MPALSG Two staff assigned with relevant competences
and experience (knowledge of human resources
and labor relations procedures)
Improve consultations with workers’
unions
June 30, 2016;
June 30, 2017;
June 30, 2018
Responsible public
sector employer
Each public entity submitting the request for
redundancy payment to the MPALSG to attach
minutes from the consultations or written
opinions by the unions (workers’
representatives) on the retrenchment plan. If
requested, a sample of these reports will be
submitted to the Bank for review.
Prepare selection criteria. The
criteria for selection of employees who
January 30,
2016;
Responsible public
sector employer
Every employer who will reduce their
workforce will make the criteria for

60
will be made redundant will be based
on principles of transparency,
nondiscrimination, and will be applied
consistently and will contain appeal
procedures. Where applicable, the
criteria will be based on relevant
provision from collective agreements.
January 30,
2017;
January 30,
2018
retrenchment publically available. The
retrenchment criteria and the rationale will be
included in the retrenchment plans and acts on
termination of employment.
Retrenchment plans prepared (in cases
required by the law).
June 30, 2016;
January 30,
2017;
January 30,
2018
Responsible public
sector employer
The retrenchment plan will include the
following:
(a) Rationale for determining the redundancy of
employees
(b) Total number of employees with the
respective employer
(c) Number of redundant employees, their
qualifications and job positions, age, and length
of employment (years) covered by the
employment insurance benefits; gender
segregated information, and number of persons
with disabilities
(d) Selection criteria for determining redundant
employees
(e) Measures for alternative employment such
as transfer to other jobs; transfer to other
employers; training; part-time work, but not
less than 50% of full time and other measures
(f) Resources to address the socioeconomic
status of the redundant employees
(g) Employment termination deadline
The proposed draft retrenchment plan will be
submitted to the relevant workers’
representatives or union and the NES for
consultation (opinion). The period of advance
notice and the length of consultation must
follow the provisions from the Labor Law. The
consultations will be documented in writing.
Transition assistance to retrenched
employees
June 30, 2016;
January 1,
2017;
January 1,
2017
Ministry of
Employment, Veterans,
and Social Affairs and
the NES
The Ministry of Employment, Veterans, and
Social Affairs to include in the 2016, 2017,
2018 performance agreement with the NES the
following requirements:
(a) The NES representative visits every entity

61
that will retrench more than 10 workers and
inform workers about available NES services,
programs, and benefits; register them with the
NES; and develop an individual action plan for
each registered redundant worker. In instances
where less than 10 workers will be retrenched,
in collaboration with employers, the NES will
inform affected workers about available
assistance programs, based on the model that
has been applied for redundant workers.
(b) The NES will contact at least 20 employers
in the same and neighboring municipalities
where the public entity resides to offer them
NES services and inquire about job vacancies.
(c) The NES will consult with the local
employment council about support for
redundant workers.
Gender and social inclusion June 30, 2016;
June 30, 2017;
June 30, 2018
MPALSG;
Ministry of Health,
Statutory Health,
Insurance Fund;
Ministry of Labour,
Employment, Veteran
and Social Affairs; and
the NES
Submitted retrenchment plans and requests for
redundancy (severance payment), including
segregated information according to gender
(number of males/females), age (categories to
be defined), education (categories to be
defined), persons with disabilities (number),
and ethnic minority (number). The Ministry of
Labour and the NES will prepare special active
employment measures for retrenched women,
with emphasis on women over the age of 50.
Monitor severance payment
disbursement and status of retrenched
workers
December 31,
2016;
December 31,
2017;
December 31,
2018
MPALSG;
Ministry of Health,
Statutory Health,
Insurance Fund;
Ministry of Labour,
Employment, Veteran
and Social Affairs; and
the NES
The MPALSG and the Ministry of Health will
monitor and report annually on the number of
workers who received the severance payment,
as prescribed in the Law on Ceilings on the
Number of Employees in the Public Sector. The
Ministry of Labour, with support from NES
will monitor and report annually on the status
of retrenched workers in terms of (a) number of
retrenched workers (number of
male/female/persons with disabilities) who
received active employment services from the
NES and (b) number of retrenched workers
(number of male/female/persons with

62
disabilities) who found new employment.