republic of kazakhstan: selected issues · 2007-02-16 · republic of kazakhstan selected issues...
TRANSCRIPT

© 2004 International Monetary Fund November 2004
IMF Country Report No. 04/362
Republic of Kazakhstan: Selected Issues
This Selected Issues paper for the Republic of Kazakhstan was prepared by a staff team of the International Monetary Fund as background documentation for the periodic consultation with the member country. It is based on the information available at the time it was completed on July 6, 2004. The views expressed in this document are those of the staff team and do not necessarily reflect the views of the government of the Republic of Kazakhstan or the Executive Board of the IMF. The policy of publication of staff reports and other documents by the IMF allows for the deletion of market-sensitive information.
To assist the IMF in evaluating the publication policy, reader comments are invited and may be sent by e-mail to [email protected].
Copies of this report are available to the public from
International Monetary Fund ● Publication Services 700 19th Street, N.W. ● Washington, D.C. 20431
Telephone: (202) 623 7430 ● Telefax: (202) 623 7201 E-mail: [email protected] ● Internet: http://www.imf.org
Price: $15.00 a copy
International Monetary Fund
Washington, D.C.


INTERNATIONAL MONETARY FUND
REPUBLIC OF KAZAKHSTAN
Selected Issues
Prepared by staff team consisting of Julian Berengaut (head), Peter M. Keller, Katrin Elborgh-Woytek, Turgut Kisinbay, Peter Lohmus, Paul Mathieu (all MCD),
Theo Thomas (FAD), and Yongzheng Yang (PDR)
Approved by Middle East and Central Asia Department
July 6, 2004
Contents Page
I. Introduction ............................................................................................................................4
II. The Natural Resource Curse: Literature Overview and Country Examples .........................7 A. Dutch Disease ..........................................................................................................8 B. Volatility ..................................................................................................................9 C. Inefficient Specialization .......................................................................................11 D. Rent-Seeking..........................................................................................................11
Text Boxes 1. The High Cost of Government Consumption in the Persian Gulf..................................10 2. Earmarking in Ecuador ...................................................................................................12
Figures 1. Public Expenditure and the Oil Price in Selected Oil-Producing Countries.....................9
References................................................................................................................................14
III. An Analysis of Kazakhstan’s Petroleum Potential ............................................................17 A. Introduction............................................................................................................17 B. Recent Developments ............................................................................................19 C. Long-Term Potential and Risks .............................................................................23 D. Caveats and Risks ..................................................................................................24 E. Sensitivity Analysis ...............................................................................................27
Text Boxes 1. The National Fund of the Republic of Kazakhstan (NFRK) ..........................................19
Figures 1. Medium-Term Petroleum Outlook .................................................................................18

- 2 -
2. Flows to the NFRK.........................................................................................................18 3. Present Value of Fiscal Receipts from Petroleum, 2004–49 ..........................................28 4. Annual Fiscal Receipts from Petroleum, 2004–49 .........................................................29 5. Pipeline Network ............................................................................................................30
Tables 1. Petroleum Production, Exports, and Fiscal Revenue, 1998–2003..................................20 2. Summary of Principal Oil and Gas Fields ......................................................................22 3. Proven and Potential Resources of Oil and Gas .............................................................23 4. Petroleum Production, Exports, and Fiscal Revenue, 2004–20......................................24 5. Crude Exports and Potential Pipeline Capacity Profile, 2003–20..................................25
References................................................................................................................................31
IV. The Impact of The Oil Boom on the Non-Oil Sector ........................................................32 A. Introduction............................................................................................................32 B. Simulating the Effects of the Oil Boom.................................................................33 C. Accelerating Productivity Improvement................................................................41 D. Policy Implications ................................................................................................46
Figures 1. Benchmark Projection and Comparative Static Simulations..........................................34 2. Sectoral Effects of the Oil Boom Under Fixed Current Account, 2006 .........................43 3. Sectoral Effects of the Oil Boom with Tariff Increase: Fixed versus Endogenous
Current Account, 2006.................................................................................................44 4. Effects of the Oil Boom: Productivity Improvement versus Tariff Increase, 2006....................................................................................................45
Tables 1. The Impact of the Oil Boom Under Alternative Macro Assumptions, 2006..................38 2. Sectoral Effects of the Oil Boom Under Alternative Macro Assumptions, 2006...........39
Appendix 1. A General Equilibrium Model of the Kazakhstani Economy.........................................47
Appendix Tables 1. Industries Identified in the Model...................................................................................47
References................................................................................................................................49
V. Fiscal Rules and Fiscal Sustainability Analysis..................................................................50 A. Long-Term Consumption Under the Permanent Income Hypothesis....................51 B. Long-Term Consumption Under the Bird-in-Hand Rule.......................................53 C. Medium-Term Expenditure Framework and Resource Funds...............................56 D. Strategies to Strengthen Fiscal Institutions to Ensure Proper Design and Control
of Spending ............................................................................................................59

- 3 -
Text Boxes 1. Fiscal Policy Rules in Botswana and Indonesia .............................................................55 2. Using a Medium-Term Expenditure Framework............................................................58 3. Giving Resources Directly to the People? ......................................................................58
Figures 1. Non-oil Deficit-to-GDP Ratio Implied by the PIH, 2004–49.........................................52 2. Non-oil Deficit-to-GDP Ratio Implied by the
Bird-in-Hand Rule, 2004–49 .......................................................................................54
Tables 1. Fiscal Indicators Under the Permanent Income Hypothesis, 2004–49...........................53 2. Fiscal Indicators Under the Bird-in-Hand Rule, 2004–49..............................................54 3. Selected Expenditure Items by General Government.....................................................61
References................................................................................................................................62
VI. The Role of Development Institutions in Diversifying the Economy ...............................64
Text Boxes 1. The Development Bank of Kazakhstan ..........................................................................65 2. Development Institutions in Other Countries .................................................................67
References................................................................................................................................68
VII. Transparency, Governance, and Institutions ....................................................................69
Text Boxes 1. Transparency and Corruption .........................................................................................72
Tables 1. Governance Indicators and Corruption Perceptions Index, 1996–2003.........................71
References................................................................................................................................74

- 4 -
I. INTRODUCTION: THE POLICY CHALLENGE1
1. Following a substantial decline during the early transition phase, Kazakhstan’s economy has achieved real growth of more than 10 percent on average during 2000–03. Economic growth has been broad-based, comprising both the oil and the non-oil sectors. While growth had been mainly productivity driven in the mid-1990s, since the end of the decade, large scale capital investment has become the dominant factor. Investment grew sharply during 2000–03, mainly on account of the petroleum sector, which recorded a substantial increase in production during this period. Based on conservative estimates, the share of the oil economy, including associated services, has now reached about 25 percent of GDP and 50 percent of exports. Growth in the non-oil economy has also been significant since 2000, despite continued low productivity in agriculture and some sub-sectors of manufacturing. Real wages increased along with real GDP and unemployment declined to about 9 percent in 2003, compared with 13 percent in 2000.2
2. Economic development has benefited from prudent macroeconomic management. Inflation has been brought down to the single digits despite renewed growth in monetary aggregates, as continued remonetization has facilitated the conduct of monetary policy. Since the beginning of the decade, Kazakhstan has maintained a tight fiscal stance. Over the period 2001–03, an average surplus of 2½ percent of GDP was recorded with an underlying average non-oil deficit of 3½ percent of GDP. In recent years, the revenue-to-GDP ratio has largely reflected fluctuations in oil prices and large bonus receipts.
3. Also as a result of increasing oil production and, more recently, high oil prices, external sector developments have turned very favorable. The external current account, which had been substantially negative in 2001–02, was largely balanced in 2003. Gross official reserves reached the equivalent of $6.5 billion in May 2004, equivalent to 4½ months of merchandise imports, with an additional $3.7 billion accumulated in the NFRK. Since 2000, FDI has picked up from a low level, reaching 9 percent of GDP on average, concentrated in the resource extracting industries. Public external debt has declined and Standard and Poor’s Kazakhstan Foreign Currency Sovereign Credit Rating was upgraded to investment grade/BBB- in May 2004. Since early 2002, the tenge has effectively been pegged to a basket of 24 currencies of key trade partners.
4. Kazakhstan has benefited substantially from rising oil production. The oil sector has attracted large scale FDI (about $3–4 billion per annum), stimulated construction, transportation, and other services sectors, and generated large budget revenues. However, at the same time, the challenge of how to cope with the rapidly rising oil wealth is mounting as a two- to three-fold increase in oil production over the next 10–15 years is projected. Already as of now, oil revenues are accumulating in the NFRK in substantial amounts, for basically 1 Prepared by Katrin Elborgh-Woytek and Peter M. Keller.
2 ILO definition.

- 5 -
two reasons: (i) governmental institutions can not yet assure the appropriate and efficient use of the very large income flows, and it will take time and institutional development to change this; and (ii), with the economy already growing very rapidly and massive foreign exchange purchases taking place in order to prevent the exchange rate from appreciating, it has fallen to the budget to contain aggregate demand. With the 2004 budget, the fiscal position has eased somewhat and this puts price stability at risk in the absence of a more flexible exchange rate policy or stepped up sterilization. Since a real appreciation will be unavoidable over the medium term, non-oil export sectors and import competing industries will be exposed to increased competitive pressures and will need to become more productive.
5. In many natural resource based economies, economic growth has been less rapid than in other economies, as a result of the “natural resource curse,” which goes well beyond what is commonly labeled as Dutch disease. While exchange rate appreciation and its impact on the non-oil sectors is an important aspect, the natural resource curse has more important features. The flow of income to the government from oil and other natural resources has often allowed the government rather than the private sector to take a central role in the economy. Weak institutions, corruption, lack of transparency, and political pressures have often led to serious misuse and misallocation of resources, misguided investment strategies, and spending on prestige objects. Moreover, as governments have become less dependent on collecting taxes from the population, they have often become less transparent and democratic as they have had no need to seek consent for their policies from the population.
6. Some governments responded with procyclical spending policies to changes in natural resource earnings. Others even anticipated future earnings increases, which led to severe crises when these earnings failed to materialize. Only a few countries have so far succeeded in steadying budgetary expenditures through the use of oil funds.
7. This study seeks to contribute to the debate on the optimal policy response on the part of the Kazakhstani authorities to the prospective oil inflows. It will argue that:
• An abundance of natural resources, if not managed carefully, can lead to disappointing outcomes.
• Kazakhstan has large hydrocarbon resources that will result in substantially increased fiscal resources over the next two to three decades.
• Oil output and foreign investment in the oil sector have increased rapidly in recent years. Additional investment is expected over the longer term, although there are downside risks.
• Real appreciation is an equilibrating phenomenon under Kazakhstan’s circumstances, and resisting it will put the economy on a lower growth path. Trade liberalization will enhance growth prospects and facilitate adjustment of the Kazakhstani economy and structural reforms.

- 6 -
• Permanent Income Hypothesis and Bird-in-Hand rules suggest very different fiscal paths, but can be seen as implying a broad range for the appropriate budget balance.
• Government intervention in the economy may lead to suboptimal outcomes. In particular, the case for development institutions in Kazakhstan to address market failures is weak; the experience elsewhere has not been favorable.
• Good governance and transparency are associated with better economic performance; Kazakhstan has made some progress but still lags behind on many fronts.
8. The paper is organized as follows: Chapter II surveys the literature on the so-called natural resource curse (possible adverse effects of natural resource prevalence and economic growth); Chapter III offers an analysis of Kazakhstan's petroleum potential; Chapter IV analyzes the impact of the oil boom on the non-oil sector, based on a general equilibrium model; Chapter V provides an analysis of fiscal rules and fiscal sustainability and assesses the possible role of fiscal policies in addressing the "natural resource curse"; Chapter VI reviews the debate about the potential contribution of state-owned development institutions in diversifying the economy; and Chapter VII evaluates the status of transparency and governance in Kazakhstan.

- 7 -
II. THE NATURAL RESOURCE CURSE: LITERATURE OVERVIEW AND COUNTRY EXAMPLES1
1. The expectation that favorable natural resource endowments would lead to rapid economic growth and higher living standards has generally been disappointed. Empirical research suggests that countries with large natural resource wealth tend to lag behind comparable countries in terms of real GDP growth.2 The findings related to the so-called “curse of natural resources” (Sachs and Warner 2001) or, in slightly different terms, the “paradox of plenty” (Karl 1999) seem to be remarkably robust and can not be explained easily by trends in commodity prices, geographical or climatic variables, or other unobserved growth impediments. This observation applies to oil producing states in the Persian Gulf, Nigeria, Mexico, and Venezuela as well as to primary commodity producers like Côte D’Ivoire (cocoa), and mineral producers such as Zambia (copper) and Ghana (gold).
2. Many economies have become progressively more reliant on natural resources over time. Oil and gas production in Nigeria and Venezuela has risen to account for 95 percent and 75 percent of export earnings, respectively, and 75 percent and 46 percent of government revenue. In the case of Nigeria, this is partially explained by the significant deterioration of export-oriented agriculture since oil became an important economic factor in the early 1970s (Bevan et al. 1999).
3. Nonetheless, a few countries have managed to avoid the ‘resource curse.’ In Indonesia, oil and gas exports rose quickly in the 1970s, and reached 50 percent of exports in the early 1980s. The economy grew by an average of 4 percent per year during 1965–90, undergoing significant diversification (Bevan et al.1999). In Botswana, the diamond sector has grown rapidly since the 1970s with diamond exports now accounting for around 40 percent of GDP. The country achieved double-digit growth in the 1970s and 1980s, a development not exclusively explained by a “mineral enclave” (Acemoglu et al. 2003). Malaysia, which is rich in a number of primary commodities, also grew by 4 percent per year on average during 1965–90. Australia has also succeeded in becoming one of the wealthiest countries in the world, based on the exploitation of its natural resources. The country has experienced a series of resource booms, which have changed its productive base radically.3
1 Prepared by Theo Thomas and Katrin Elborgh-Woytek.
2 Empirical studies reinforcing the notion of a “resource curse” include Sachs and Warner (1995), Gelb and Associates (1988), Karl (1999), Doppelhofer et al. (2000), and IMF (2003b).
3 In 1951, wool constituted 64.5 percent of goods exported from Australia, compared to 1.3 percent for minerals, while in 1991 the ratios were 4.3 percent and 41.1 percent, respectively. See McLean and Taylor (2003) for a review of Australia’s long-run growth performance and a description of the policies used to counter resource shocks.

- 8 -
4. Explanations of the ‘resource curse’ have focused on a combination of four different factors: (i) the loss of competitiveness in the non-resource traded sector (“Dutch Disease”); (ii) the relatively high volatility of world commodity prices, with particularly damaging effects on fiscal revenues; (iii) the interaction between specialization in non-tradables and financial market imperfections; and (iv) the negative effect of ‘rent-seeking’ behavior on institutions, governance, and political processes, which may be exacerbated by the dominance of extractive industries.4
A. Dutch Disease
5. The flow of additional foreign exchange arising from the exploitation of natural resources may cause an appreciation of the real exchange rate. The subsequent loss of competitiveness in the non-resource tradable goods sector may be a problem if it inhibits growth of other key sectors such as the manufacturing sector, which is widely believed to be an engine of early development and a potential source of mass employment and growth. Based on empirical analysis, Sachs and Warner (2001) suggest that “one explanation of the resource curse is that resource abundance tended to render the export sectors uncompetitive and that as a consequence resource-abundant countries never successfully pursued export-led growth.”
6. However, movements in relative prices following the discovery of natural resources do not inevitably lead to adverse consequences for the economy. If the resource flow generated by exploiting the natural resource is relatively small and/or there are underemployed factors of production that can be utilized with little cost, an expansion in aggregate demand will not necessarily lead to an exchange rate appreciation. Several empirical studies have questioned the links between resource exploitation, relative prices, and non-resource sector exports.5 A rise in the relative price of non-resource tradables may be mitigated by an accumulation of foreign reserves or through outward foreign investment (i.e. increased savings). In the presence of excess capacity, the domestic economy can also expand, using foreign exchange inflows to stimulate domestic production. Expansion from internal sources may be consumption-led—i.e. resulting in an immediate increase in real living standards—or investment-led and, thereby, designed to raise future productive capacity. A consumption-led approach poses risks to a slow-growing country with structural weaknesses in its balance of payments in the case of temporary foreign exchange inflows (Thirlwall and Gibson 1992). In contrast, an investment-led approach could counter any loss in competitiveness in the non-resource tradable goods sector if productivity would rise sufficiently to offset the appreciation of the real exchange rate. However, the latter approach depends crucially on the effective utilization of capital investment.6 4 A brief overview of the literature and empirical evidence relating to each of these factors, in particular (iii), is given in Hausmann and Rigobon (2002).
5 Hausmann and Rigobon (2002); and Sala-i-Martin and Subramanian (2003).
6 See below; and Easterly (2001).

- 9 -
B. Volatility
7. Revenue from natural resources may be more volatile than revenue from a broad base of export goods. International oil prices have shown an even higher degree of volatility than the prices of other commodities, and this may be because of the specific structure of the market, important geo-political influences, and the high fixed costs involved in exploration and production (Engel and Valdés 2000).
Figure 1: Public Expenditure and the Oil Price in Selected Oil-Producing Countries (in percent of GDP and U.S. dollars per barrel)
Source: Bartsch et al. (2004).
8. Volatile swings in resource revenues often lead to procyclical expenditure that may increase uncertainty and reduce investment and growth (Barnett and Ossowski 2002). Frequent unpredictable adjustments to fiscal expenditure are costly and undermine the ability of policymakers to implement multi-year spending programs. Figure 1 highlights the mixed response of public expenditure to oil price fluctuations in selected countries. Indonesia has been notably more successful in smoothing public expenditure relative to GDP and oil price fluctuations than either Venezuela or Nigeria (Bartsch et al. 2004). Nonetheless, occasionally, significant cuts of absolute spending levels had to be made in Indonesia when oil revenue and GDP declined, for example in the early 1980s.
9. Governments sometimes also fail to appropriately modify their spending patterns to compensate for fluctuations in resource revenues, increasing the likelihood of large, costly adjustments. Spending programs are often launched during periods of high resource prices or on the basis of expected future earnings, without due regard for the risks or costs associated with having to reverse them. If these spending programs become entrenched and prices fall unexpectedly, or if future revenues do not materialize, governments may
Nigeria Indonesia
VenezuelaOil price (rhs)
0
10
20
30
40
50
60
70
1978 1979 1980 1981 1982 1983 1984 1985 1986 1987 1988 1989 1990 1991 1992 1993 1994 1995 1996 1997 1998 1999 2000 2001 0
5
10
15
20
25
30
35
40
Oil price, in U
S$/bblIn p
erce
nt o
f GD
P

- 10 -
borrow to maintain investments or social subsidies, often at a high cost and without prudent regard for sustainability.7 In Mexico, following the post-1979 oil-price hike, the government used oil revenue to finance a spending spree and as collateral for rising foreign debt (Easterly 2001). Mexico’s budget deficit reached 15 percent of GDP in 1982 as oil prices began to decline. The subsequent loss of confidence precipitated a sharp devaluation of the local currency, fiscal retrenchment, and the debt crisis of the mid-1980s. Nigeria has also been prone to costly periods of both extreme procyclical spending and unsustainable debt accumulation as it tried to maintain spending patterns fed by oil price booms (Bartsch et al. 2004).
10. Resource windfalls may undermine the political forces that could promote fiscal restraint and balanced growth-oriented policies. For example, in many developing countries the agricultural sector is the dominant employer; a government that identifies its political interest in maintaining or promoting the competitiveness of the agricultural sector may implement policies aimed at offsetting any negative impact from the flow of resources to the natural resource sector. Eifert et al. (2003) contrast Nigeria, which has a weak set of agricultural elites and a dismal growth record, with Indonesia, where the political strength of rural agricultural elites, particularly post-1966, may have acted as “effective agent of restraint through the first oil windfall.” This helped to guide Indonesian policy towards the promotion of macroeconomic stability, agricultural competitiveness, and investment, rather than the procyclical policies of many natural resource producers. In countries where the political system is not aligned around any productive sector, windfall gains may be used to support consumption, often through the public sector, rather than investment in support of long-term growth. A recent survey of the Cooperation Council of the Arab States of the Gulf (GCC)8 concluded that “high oil revenues financed excessive government expenditures [that] lowered growth” (IMF 2003b). Part of the explanation for the low level of returns from government expenditure in the GCC could be the high level of public consumption (Box 1).
Box 1. The High Cost of Government Consumption in the Persian Gulf
The oil-producing countries of the Persian Gulf amassed substantial financial reserves in the 1970s. However, the prolonged downturn in oil prices in the 1980s led to a rapid accumulation of public debt, in many countries at unsustainable rates. For example, Saudi Arabia’s domestic national debt increased from zero in 1987 to $62.4 billion in 1992, equivalent to about 70 percent of GDP and 200 percent of exports. The deficits were largely the result of the fuel, water, and electricity subsidies that had become entrenched and had grown to a total of $14 billion in fiscal year 1992 (Askari et al. 1997).
7 See Bartsch et al. (2004) for examples from Sub-Saharan oil producers; and Eifert et al. (2003) for a range of countries, including the Gulf states and Latin America.
8 The members of the GCC are Bahrain, Kuwait, Oman, Qatar, Saudi Arabia, and the United Arab Emirates.

- 11 -
C. Inefficient Specialization
11. Inefficient specialization of production in combination with weak financial markets may lead to higher volatility in relative prices (Hausmann and Rigobon 2002).9 As suggested above, countries that are highly specialized and heavily reliant on volatile resource revenues will tend to experience larger relative price fluctuations, particularly with regard to the exchange rate, than more diversified and therefore balanced economies. This is particularly true in economies dominated by a capital intensive industry, such as oil, where capital investment is substantial and largely irreversible. Where the increase in the level of volatility interacts with imperfect financial markets—which may be relatively sticky and risk averse with high bankruptcy costs—risk premiums and thus interest rates will also tend to rise. Higher domestic interest rates will tend to undermine the non-resource tradable sector and lead to further specialization. Some countries, such as the members of the GCC, may be naturally specialized as a result of relatively large resource endowments, while others, such as Venezuela and Nigeria, may become overly specialized through their inability to develop a diversified tradable sector, which will be hampered by both the volatility stemming from fluctuations in international oil prices and higher domestic interest rates. According to Hausmann and Rigobon (2002) “inefficient specialization is the product of a combination of factors: the level of government spending, the volatility of the spending, the commercial-risk-free interest rate, and the magnitude of financial inefficiencies.”
D. Rent-Seeking
12. Competition for resource rents may undermine governance and institutions, and crowd out innovation. Recent research has stressed the causal link between the quality of institutions—such as the rule of law, property rights, lack of corruption, and an appropriately sized government—and economic growth.10 However, the windfall revenues accruing from natural resources, particularly those arising from capital intensive industries, have often been associated with higher levels of corruption, weak institutions, and poor policies (Easterly 2001; and Leite and Weidman 1999). The vast common pool of resources accruing directly to the state may encourage misappropriation by interest groups and may undermine governments’ commitment to transparency or accountability. Rent-seeking behavior has also been found to distort the allocation of resources (Karl 1999; Box 2).
9 See also Rodrik (2003); and Davis et al. (2003).
10 See IMF (2003a) and Sala-i-Martin and Subramanian (2003) for a detailed case study of Nigeria; and Sachs (2003) for a critique of this approach.

- 12 -
Box 2. Earmarking in Ecuador
Earmarking of revenue for expenditure items in the budget reduces the flexibility of the budget to respond to changes in the macroeconomic environment and may skew allocations towards lower priority areas. The struggle by entrenched interest groups to capture the resource rent in Ecuador has been associated with the rise in earmarking within the budget. In 1989, a high proportion of oil revenues was earmarked for the military (14.5 percent), the public wage bill (67.9 percent), and rural roads (a notable source of political patronage). In 1999, 65 percent of total tax revenues (including all oil revenues) were earmarked for specific programs or for subnational transfers (Eifert et al. 2003).
13. A large number of studies suggest a potentially negative impact of resource wealth on democracy, institution building, and transparency.11 Natural resource wealth, and in particular oil wealth, has been found to affect negatively the establishment of democratic institutions through a number of different channels (Ross 2001):
• A “rentier effect,” implying that governments use oil revenue to reduce social pressures that would otherwise result in demands for greater accountability. This effect is found to be composed of: (i) a “taxation effect,” according to which governments, which derive a large share of their revenue from resource extraction, are likely to maintain low taxation of the non-oil economy, reducing demand from the general public for accountability or representation in government (Isham et al. 2003);12 (ii) an “expenditure effect,” as large public expenditure programs may increase government spending on patronage, reducing the latent demand for participation in democratic processes by “fiscal pacification”;13 and (iii) a “group-formation effect,” implying that governments may use revenue from resource extraction to prevent the establishment of independent social groups, which demand political presentation and rights.14
11 Ross (2001); Isham et al. (2003); Bevan et al. (1999); Robinson et al. (2003); and Katz et al. (2004), among others. Some authors have underlined the difficulties in testing political economy-explanations of the oil curse.
12 This argument is based on studies of the evolution of democratic institutions in England and France, where demand for representation in government was found to have arisen in response to the state’s attempts to raise taxes. Empirically, this effect has been demonstrated for Kuwait and Qatar (Crystal 1990), and Jordan (Brand 1992). Evidence to the contrary has been presented by Waterbury (1994).
13 This effect has been posited for Saudi Arabia (Entelis 1976), Libya (Vandewalle 1998), and Mexico (Bazresch and Levy 1991).
14 Oil windfalls would provide governments with increased opportunities to use resources in order to influence the outcome of political processes, further increasing the value of being in power for the elite (Bevan et al. 1999; Robinson et al. 2003).

- 13 -
• A “modernization effect,” as the concentration of a small workforce with sophisticated technical skills in an offshore-type sector of the economy could delay occupational specialization and urbanization, thereby reducing pressures for the development of democratic institutions.15
• A “repression effect,” since governments that fund themselves through oil revenues have the capacity to build up excessive internal security, which allows them to block, at least temporarily, the population’s democratic aspirations.
14. The quality of institutions was found to determine the extent to which natural resources can be misappropriated, implying that countries with weak institutions are more prone to suffer a resource curse (Ross 2001). The importance of strong institutions for preventing corruption and its negative effects on growth has been emphasized by Leite and Weidmann (1999). The authors find this to be particularly important in developing countries with a potentially larger relative macroeconomic impact of resource discoveries and weak institutions. Institutional weakness was also found to pose risks to oil funds. The weaker the institutions of the state, the more likely it becomes that the public sector will be ‘captured’ by powerful interest groups (Easterly 2001). This in turn may distort the allocation of resources and encourage entrepreneurs to switch from productive activities in order to engage in unproductive rent seeking. The public sector may try to expand to meet the demands of interest groups and use earmarking or other devices to entrench benefits to particular groups. In extreme cases, resource rich countries have experienced prolonged periods of conflict, which have been exacerbated by issues surrounding the control and exploitation of the resources; these include: Angola, Liberia, and Sierra Leone.
15 Inglehart (1997) argues that occupational specialization contributes to the formation of an autonomous workforce with specialized skills and increased bargaining power against the elites.

- 14 -
REFERENCES
Acemoglu, D., S. Johnson, and J. Robinson, 2003, “Botswana, An African Success Story,” in Rodrik, D., ed., “In Search of Prosperity: Analytic Narratives on Economic Growth” (Princeton).
Askari, H., V. Nowshirivani, and M. Jaber, 1997, “Economic Development in the GCC: The Blessing and the Curse of Oil” Contemporary Studies in Economic and Financial Analysis (Greenwich, CN).
Barnett, S., and R. Ossowski, 2002, “Operational Aspects of Fiscal Policy in Oil-Producing Countries,” IMF Working Paper 02/177 (Washington: International Monetary Fund).
Bartsch, U., M. Katz, H. Malothra, and M. Cuc, 2004, “Lifting the Oil Curse, Improving Petroleum Revenue Management in Sub-Saharan Africa” (Washington: International Monetary Fund).
Bazresch, C., and S. Levy, “Populism and Economic Policy in Mexico, 1970–82,” in: Dornbusch, R., and S. Edwards, eds., The Macroeconomics of Populism in Latin America (Chicago).
Bevan, D., P.Collier, and J. Gunning, “The Political Economy of Poverty, Equity, and Growth: Nigeria and Indonesia,” A World Bank Comparative Study, Oxford University Press.
Brand, L.A., 1992, “Economic and Political Liberalization in a Rentier Economy: The Case of the Hashemite Kingdom of Jordan,” in: Harik, I., and D. J. Sullivan, eds., Privatization and Liberalization in the Middle East (Bloomington: Indiana University Press).
Crystal, J., 1990, Oil and Politics in the Gulf: Rulers and Merchants in Kuwait and Qatar (New York: Cambridge University Press).
Davis, J. M., R. Ossowski, and A. Fedelino, eds., 2003, “Fiscal Policy Formulation and Implementation in Oil-Producing Countries” (Washington: International Monetary Fund).
Doppelhofer, G., R. Miller, and X. Sala-i-Martin, 2000, “Determinants of Long-Term Growth: A Bayesian Averaging of Classical Estimates (BACE) Approach,” NBER Working Paper No. 7750.
Easterly, W., 2001, The Elusive Quest for Growth. Economists’ Adventures and Misadventures in the Tropics (Cambridge: MIT Press).

- 15 -
Eifert, E., A. Gelb, and N. Tallroth, 2003, “The Political Economy of Fiscal Policy and Economic Management in Oil-Exporting Countries,” in Davis et al., eds., “Fiscal Policy Formulation and Implementation in Oil Producing Countries” (Washington: International Monetary Fund).
Engel, E., and R. Valdés, 2000, “ Optimal Fiscal Strategy for Oil-Exporting Countries,” IMF Working Paper 00/118 (Washington: International Monetary Fund).
Entelis, J. P., 1976, “Oil and Wealth and the Prospects for Democratization in the Arabian Peninsula: The Case of Saudi Arabia,” in: Sherbiny, N. A., and M. A. Tessler, eds., Arab Oil: Impact on the Arab Countries and Global Implications (New York).
Gelb, A., 1988, Oil Windfalls: Blessing or Curse? (New York: Oxford University Press for the World Bank).
Hausmann, R., and R. Rigobon, 2002, “An Alternative Interpretation of the ‘Resource Curse’: Theory and Policy Implications,” NBER Working Paper No. 9424.
IMF, 2002, Republic of Kazakhstan—Selected Issues and Statistical Appendix, IMF Country Report No. 02/64 (Washington: International Monetary Fund).
——2003a, World Economic Outlook, April (Washington: International Monetary Fund).
——2003b, World Economic Outlook, September (Washington: International Monetary Fund).
Isham, J., M. Woolcock, L. Pritchett, and G. Busby, 2003, “The Varieties of Resource Experience: How Natural Resource Export Structures Affect the Political Economy of Economic Growth," mimeo (Harvard University, Middlebury College, and World Bank).
Inglehart, R., 1997, Modernization and Postmodernization: Cultural, Economic, and Political Change in 43 Societies (Princeton).
Karl, T., 1999, “The Perils of the Petro-State: Reflections on the Paradox of Plenty,” Journal of International Affairs, Vol. 53, pp. 31-48.
Katz, M., U. Bartsch, H. Malothra, and M. Cuc, 2004, Lifting the Oil Curse. Improving Petroleum Revenue Management in Sub-Saharan Africa (Washington: International Monetary Fund).
Leite, C., and J. Weidmann, 1999, “Does Mother Nature Corrupt?” IMF Working Paper 99/85 (Washington: International Monetary Fund).

- 16 -
Mclean, I. and A. Taylor, 2003, “Australian Growth: A Californian Perspective” in: Rodrik, D., ed., “In Search of Prosperity: Analytic Narratives on Economic Growth,” Princeton.
Robinson, J. A., R. Torvik, and T. Verdier, 2003, “Political Foundations of the Resource Curse,” DELTA Working Paper No. 2003-33
Rodrik, D., ed., 2003, “In Search of Prosperity: Analytic Narratives on Economic Growth,” Princeton.
Ross, M. L., 2001, “Does Oil Hinder Democracy?,” World Politics, Vol. 53, pp. 325–361.
Sachs, J., and A. Warner, 1995, “Natural Resources Abundance and Economic Growth, Harvard Institute of Economic Research Discussion Paper No. 517.
––––––, 2001, “The Curse of Natural Resources,” European Economic Review, 45.
Sachs, J., 2003, “Institutions Don’t Rule: Direct Effects of Geography on Per Capita Income,” NBER Working Paper No. 9490.
Sala-i-Martin, X., and A. Subramanian, 2003, “Addressing the Natural Resource Curse: An Illustration from Nigeria,” IMF Working Paper 03/139 (Washington: International Monetary Fund).
Thirlwall, A., and Heather D. Gibson, 1992, Balance-of-Payments Theory and the United Kingdom Experience (Basingstoke).
Vandewalle, D., 1998, Libya Since Independence: Oil and State-Building (Ithaca, NY).
Waterbury, J., 1994, “Democracy Without Democrats? The Potential for Political Liberalization in the Middle East,” in: Salamé, G., ed., Democracy Without Democrats? The Renewal of Politics in the Muslim World (New York).

- 17 -
III. AN ANALYSIS OF KAZAKHSTAN’S PETROLEUM POTENTIAL1
A. Introduction
1. Kazakhstan’s petroleum sector continues to develop rapidly with highly favorable prospects for the medium to long term. Large and rising investment, almost entirely financed from abroad, continues to flow to the still relatively underdeveloped sector. In addition to the rapid development of existing onshore petroleum fields, the development of potentially much larger reserves in the technically difficult offshore North Caspian region is under way. Kazakhstan’s proven and probable crude oil reserves are estimated at around 30 billion barrels. The petroleum sector accounts for almost one quarter of GDP and about one-half of export earnings.
2. Over the next 15 years, Kazakhstan can reasonably expect crude oil and gas production to increase substantially. A more than three-fold increase in petroleum production to around 3½ million barrels per day (bpd) would place Kazakhstan among the world’s top ten crude oil exporters, on a level comparable to Iran, Mexico, Norway, and Venezuela. Fiscal revenues from the sector could rise more than commensurately (to as much as $12 billion per year) but with a lag of several years (Figure 1).2 Most of this output increase would come from offshore fields in the North Caspian region, notably from the Kashagan field—the largest field outside the Middle East and the fifth largest field in the world. However, the lack of infrastructure, difficult climatic conditions, and environmental constraints pose significant challenges to the realization of the region’s potential. Production of natural gas, until now largely underdeveloped, is emerging rapidly, and over the past 2 years output has averaged 14 billion cubic meters (bcm). The authorities’ medium-term development plan projects a quadrupling of gas production by 2010.
3. Given the strategic nature and size of Kazakhstan’s petroleum reserves,3 and the relatively early stage of development, investment in the sector and production are relatively isolated from short-term price fluctuations. Only in the event of investor perceptions of a significant long-term oil price decline (to well below $15/bbl) or a sharp deterioration in the business climate would there be cause for serious concern. Nevertheless, issues relating to the stability and quality of the investment environment and the long-term pipeline access to world markets need to be resolved on a permanent basis.
1 Prepared by Paul Mathieu. See IMF (2003) (Chapter 1) for a more detailed background discussion. 2 This projection is based on the winter 2004 World Economic Outlook price forecast for petroleum through 2008 with a 2 percent nominal increase thereafter to reflect world inflation. See Table 4 for details.
3 Observers have put the Caspian basin reserves (including those belonging to Azerbaijan, Iran, Russia, and Turkmenistan) on a par with those of the North Sea. The authorities believe that hydrocarbon deposits on the Kazakhstani territory of the Caspian Sea Basin total some 15 billion metric tons or about 110 billion barrels.

- 18 -
4. The petroleum sector has already produced sizeable tax and royalty flows to the budget (some $5 billion since 2000), of which a significant portion has been saved in the National Fund of the Republic of Kazakhstan (NFRK) (Figure 2 and Box 1). Current fiscal receipts from the sector, excluding one-time payments, have accounted for almost 20 percent of general government revenue since 2000.
Figure 2. Flows to the NFRK(In millions of U.S. dollars)
0 200 400 600 800
1,000 1,200 1,400 1,600 1,800
2001 2002 2003 Prelim.0
500
1,000
1,500
2,000
2,500
3,000
3,500
4,000
Flows: NFRK balance (RHS)
Net earnings
Other
Stabilization flows (net)
Savings
Figure 1. Medium-Term Petroleum Outlook 1/
0
100
200
300
400
500
600
700
800
1998 2002 2006 2010 2014 2018 2022 2026 2030 2034 2038 2042 2046 0
2
4
6
8
10
12
14
16
18
Productionwith North Caspian
Production(1998=100;
LHS)
Fiscal receipts with North Caspian
(billions of US$; RHS)
Fiscal receipts(billions of US$; RHS)
Source: Fund staff projections. 1/ Solid lines are based on proven crude oil reserves. Production and revenues are likely to be much higher because of expected additional North Caspian fields other than Kashagan (broken line). Enhanced recovery and field development are likely to extend the curves outward from their peaks.

- 19 -
Box 1. The National Fund of the Republic of Kazakhstan (NFRK)
Faced with a surge in foreign exchange earnings from higher oil production and prices, the authorities established the National Fund of the Republic of Kazakhstan (NFRK) in 2001. The NFRK was created to reduce the impact of volatile market prices of natural resources on the economy and to smooth the distribution of oil-wealth over generations. The NFRK is an off-budget fund and domiciled in the NBK, which has the responsibility of managing its assets on behalf of the government. All NFRK assets are invested exclusively abroad. As of end-May 2004, $3.7 billion (equivalent to 10 percent of GDP) were accumulated in the fund. Initially, the authorities identified 12 major companies in the natural resources sector, revenues from which were subject to transfer to the NFRK. The number of entities was reduced to 6 in early 2004 and the list was limited to petroleum companies. The complexity of the funding rules has been simplified progressively. Flows to the NFRK consist of a “savings” component equal to 10 percent of the budgeted baseline revenue from the listed natural resource companies ($100 million in 2003), invariant to price changes. The “stabilization” component includes all revenues from listed companies above the baseline price, which has remained fixed at $19/bbl. In addition, the authorities allocate privatization receipts, special bonus payments, and the royalties of 4 companies to the fund. In 2003, privatization revenues of $380 million were channeled to the fund. The use of NFRK resources (for specific projects), in the event of petroleum revenue shortfalls from the budgeted levels established at an assumed $19/bbl, is to be channeled through the budget.
B. Recent Developments
5. In 2003, crude oil output rose by 8.5 percent to reach almost 51.3 million metric tons (MT), or just over 1 million barrels per day (bpd).4 Export volumes increased by 12.5 percent to 44.3 million MT, and petroleum export earnings reached $7 billion. Fiscal receipts from the sector rose sharply to T275 billion (about $2 billion) (Table 1). Some 14 billion cubic meters (bcm) of natural gas were produced in 2003, net of around 3 bcm, which were reinjected.5
4 On average, a metric ton (MT) of Kazakhstani crude oil was equivalent to around 7.6 barrels in volume terms in 2003. Kazakhstani crude varies considerably in quality—the older fields are close to the heavy Russian Urals blend (7.3 bbls/MT), while newer fields are much lighter: Tengiz (7.9 bbls/MT); Karachaganak condensate (8.1 bbls/MT); and Kashagan (about 7.8 bbls/MT). As a result, the average number of barrels per MT is expected to continue to rise over the medium term.
5 Natural gas in Kazakhstan is almost entirely associated gas (a by-product of oil extraction) and several fields reinject significant quantities of gas into the ground to maintain crude wellhead pressure for liquids extraction. In the long term, when the liquids are exhausted, this gas can be recovered. Flaring has declined steadily, although it remains significant owing to the stranding of associated gas. In addition to efforts to build pipeline links to the existing system for domestic and foreign sale, gas has been used increasingly for electricity generation.

- 20 -
Table 1. Petroleum Production, Exports, and Fiscal Revenue, 1998–2003 (in millions of metric tons, unless otherwise indicated)
1998 1999 2000 2001 2002 2003
Estimates
Crude oil production 25.6 29.4 35.4 39.3 47.3 51.3
Domestic consumption 5.2 5.7 6.0 7.6 7.9 7.1
Exports 20.4 23.7 29.4 31.7 39.3 44.3
of which: through CPC … … … 1.0 12.5 17.0
In millions of U.S. dollars 1,650 2,164 4,429 4,463 5,157 7,300
(in millions of U.S. dollars, unless otherwise indicated)
Budget revenue from oil 1/ … 158 604 1,430 1,075 1,900
NFRK assets (eop) 1,240 1,917 3,603
Natural gas production (BCM) 15.0 14.2
Memorandum items:
World oil price (WEO basket; $/bbl) 13.1 18.0 28.2 24.3 25.0 28.9
Oil revenue/general government revenue (in percent)
… 5.5 15.3 25.8 19.5 …
Source: Fund staff projections.
1/ Does not include bonuses, privatization receipts or other exceptional payments.
6. Investment flows into the sector reached around $4 billion in 2003, almost entirely consisting of foreign direct investment. Three large projects—Karachaganak, Tengiz, and the new offshore field of Kashagan, which is just beginning development—account for the bulk of investment (Table 2). Investment has also been directed at establishing linkages to the Caspian Pipeline Consortium (CPC) pipeline.6
7. The Tengiz field, operated by ChevronTexaco, is by far the largest operating field in the country and one of the largest in the world. A dispute over a switch to an accelerated depreciation schedule and the financing of the investment program was settled in
6 The CPC pipeline is a privately operated consortium with official Kazakhstani and Russian state participation. It runs 1,500 kms from the Tengiz area to the Russian Black Sea port of Novorossiysk. In 2003, two large fields (Aktobe and Karachaganak) were linked to the CPC, significantly cutting transport costs for both fields, and substantially raising export prices for Karachaganak. Initial capacity is rated at 28 million MT per annum (0.6 million bbls/day). Planned second and third phase expansions over the next few years will raise capacity to 67 million MT per year (1.4 million bbls/day).

- 21 -
mid-2003. As a result, a 3-year investment program (primarily for gas re-injection and a second generation plan) totaling $4 billion was launched recently; it will likely almost double production to around 22 million MT per year by 2006.
8. The second phase of development of the Karachaganak gas and gas condensate field in the northwest of the country was completed in 2003. Condensate output will more than double (to around 12 million MT) and exports will be reoriented to reach world markets. A link to the CPC was completed in 2003, as a result of which the condensate sales price will approximately triple. However, quality problems have pushed back condensate exports through the CPC to mid-2004.
9. An international consortium is developing the “super-giant” offshore Caspian Sea concession of Kashagan. The find is reported to be the largest discovery worldwide in the past 30 years. The first phase of development through 2008 will involve investment of around $9 billion, of which $3–4 billion has already been made. The technically challenging environment and investment disputes with the government have contributed to a delay in the start of production from 2005 to 2008. The consortium is reported to have agreed to pay the government $150 million in compensation for the delay.
10. In 2002-03, Kazakhstan signed or ratified several important strategic agreements to secure property or transportation rights. In particular, a tripartite treaty, with Azerbaijan and Russia, delimiting the Caspian Sea bed was ratified. This removes a potential roadblock to the development of the rich North Caspian area.7 Agreement has also been reached with the Russian authorities on access to the state-owned Transneft pipeline system and the creation of a joint venture on gas, KAZROSGAZ, with the state monopoly Gazprom. The equal share joint venture will reportedly have access to Western European gas markets through Gazprom’s pipeline system at Russian domestic tariffs. The initial source of supply will be from the Karachaganak field. KAZROSGAZ projects a sales volume of about 5 bcm in 2004.
7 Lukoil and KMG signed an equal-share joint venture agreement to develop the Tyub-Karagan field in December 2003. Recoverable reserves of 100 million MT (about 750 million barrels) and an exploration program totaling $150–170 million were announced. KMG and Rosneft are also jointly developing the Kurmangazy field, which is reported to have reserves in the range of 0.75–1 billion MT (5.5–7.7 billion barrels).

- 22 -
Lega
lT
rans
port
Prov
en/
Tot
alD
ensit
yFi
eld
Ow
ners
hip
Stru
ctur
e 1/
Loc
atio
nE
xpor
t Rou
tes
Cos
ts ($
/bbl
)Pr
obab
le
Res
ervo
ir(b
bls/
MT
)C
urre
ntPo
tent
ial
To
Dat
eT
otal
Not
es
Akt
obe
70 p
erce
nt C
hina
Nat
iona
l; 30
pe
rcen
t KM
G
Roy
alty
-tax
Nor
th o
f Cas
pian
Sea
ne
ar R
ussi
an B
orde
rC
PC to
Nov
oros
siys
k4.
51.
0...
7.2
3443
Hea
vy c
rude
; old
fiel
d
Em
ba85
per
cent
KM
GR
oyal
ty-ta
xSh
ip a
cros
s Cas
pian
to
Aze
rbai
jan
and
Russ
ia;
Ship
(sw
ap) t
o Ir
an;
KTO
/Tra
nsne
ft pi
pelin
e th
roug
h Ru
ssia
4.0
0.7
...7.
219
20H
eavy
cru
de; o
ld fi
eld
Kar
acha
gana
kC
onso
rtium
: 32.
5 pe
rcen
t-EN
I/Agi
p, B
ritis
h G
as;
2
0 pe
rcen
t Che
vron
Texa
co; 1
5 pe
rcen
t Luk
oil
PSA
Wes
t Kaz
akhs
tan
Obl
ast;
near
bor
der
with
Rus
sia
(Ore
mbu
rg)
CPC
to N
ovor
ossi
ysk;
pi
pelin
e to
Ore
mbu
rg,
Russ
ia
5.0
2.6
9.7
8.1
4910
55.
08.
0Pr
imar
ily a
gas
fiel
d w
ith
sign
ifica
nt g
as c
onde
nsat
e; u
ntil
mid
-200
3 ca
ptiv
e of
Ore
mbu
rg
refin
ery.
Hea
vy in
vest
men
t in
infr
astr
uctu
re a
nd li
nk to
CPC
Kas
haga
nC
onso
rtium
: 20
perc
ent
ENI/A
gip,
Exx
onM
obil,
She
ll,
Tota
l; 10
per
cent
Inpe
x,
Con
ocoP
hilip
s
PSA
Offs
hore
, nor
th
Cas
pian
Sea
Not
yet
det
erm
ined
; lik
ely
CPC
to st
art,
and
CPC
/BTC
in th
e lo
ng
term
...15
.045
.07.
80
468
3.5
30.0
Meg
a-gi
ant f
ield
, lar
gest
out
side
M
iddl
e Ea
st a
nd fi
fth la
rges
t in
wor
ld; l
ight
cru
de, s
omew
hat
swee
ter t
han
Teng
iz; s
igni
fican
t as
soci
ated
gas
; diff
icul
t en
viro
nmen
t (ic
e an
d hi
ghly
va
riabl
e sh
allo
ws w
ater
dep
th).
Prod
uctio
n ex
pect
ed to
sta
rt in
20
07.
Kum
kol
Petro
Kaz
akst
an; m
inor
ity
Luko
il R
oyal
ty-T
axC
ente
r, so
uth
east
of
Ara
l Sea
Trai
n to
Chi
na a
nd Ir
an;
pipe
line/
train
to R
ussi
a12
.00.
6...
7.7
5469
Ligh
t sw
eet c
rude
; not
dee
p;
limite
d tra
nspo
rt in
fras
truct
ure;
fa
r fro
m m
arke
ts
Man
gist
aum
unai
gas
60 p
erce
nt C
APC
; 30
per
cent
[
]
10 p
erce
nt e
mpl
oyee
sEa
st c
oast
of C
aspi
an
Sea
Ship
acr
oss C
aspi
an to
A
zerb
aija
n, R
ussi
a;
KTO
/Tra
nsne
ft pi
pelin
e th
roug
h Ru
ssia
4.0
1.0
...7.
337
37H
eavy
cru
de
Ten
giz
50 p
erce
nt C
hevr
onTe
xaco
; 25
per
cent
Exx
onM
obil;
2
0 pe
rcen
t KM
G; 5
per
cent
Lu
kArc
o (L
ukoi
l/BP
JV)
Roy
alty
-tax
Nor
th-e
ast C
aspi
an
Bas
inC
PC to
Nov
oros
siys
k3.
59.
0...
7.9
101
317
7.5
20.0
"Sup
er-g
iant
" fie
ld; w
orld
's de
epes
t gia
nt; l
ight
cru
de w
ith
high
sulfu
r con
tent
; sig
nific
ant
asso
ciat
ed g
as. S
igni
fican
t fin
d at
ne
arby
Kor
olev
fiel
d.
Uze
n90
per
cent
KM
GR
oyal
ty-ta
xEa
st c
oast
of C
aspa
in
Sea
Ship
acr
oss C
aspi
an to
A
zerb
aija
n, R
ussi
a; S
hip
(sw
ap) t
o Ir
an;
KTO
/Tra
nsne
ft pi
pelin
e th
roug
h Ru
ssia
4.0
1.0
...7.
236
43H
eavy
cru
de. I
FC h
as in
vest
men
t po
sitio
n.
Oth
er O
ffsh
ore
Nor
th
Cas
pian
A to
tal o
f 12
site
s (2
of w
hich
ar
e in
the
Rus
sian
sect
or) a
re
bein
g ex
plor
ed b
y a
subs
idia
ry
of K
MG
(8
join
tly w
ith
Russ
ian
firm
s).
The
com
bine
d fo
reca
st o
f ge
olog
ical
(res
ervo
ir) re
serv
es
tota
ls so
me
80 b
illio
n ba
rrel
s.
Kur
man
gazy
25 p
erce
nt K
MG
, Tot
al,
Rosn
eft,
Zarb
ezhn
eft
PSA
Offs
hore
, sou
th w
est o
f K
asha
gan
...5.
5-7.
747
.77.
7...
10.0
Und
er e
xplo
ratio
n; p
rodu
ctio
n by
20
10?
Tub
-Kar
agan
50 p
erce
nt K
MG
, Luk
oil
PSA
Offs
hore
, sou
th w
est o
f K
asha
gan
...2.
23.
47.
7...
3.0
Und
er e
xplo
ratio
n, p
rodu
ctio
n by
20
10 ?
Sour
ces:
Kaz
akhs
tani
aut
horit
ies;
and
Fun
d st
aff e
stim
ates
bas
ed o
n in
dust
ry so
urce
s.K
eyBG
= B
ritis
h G
as1/
Pro
duct
ion
shar
ing
agre
emen
t (PS
A) o
r roy
alty
-tax
regi
me.
BTC
= B
aku-
Tblis
i-Cey
han
2/ B
illio
ns o
f bar
rels
.C
APC
= C
entra
l Asi
a Pe
trol
eum
Cor
pora
tion
3/ M
illio
ns o
f bar
rels
per
yea
r.C
PC =
Cas
pian
Pip
elin
e C
orpo
ratio
n4/
Bill
ions
of U
.S. d
olla
rs.
KM
G =
Kaz
mun
aiga
sK
TO =
Kaz
trans
oil
PSA
= P
rodu
ctio
n Sh
arin
g A
gree
men
t
Prod
uctio
n 3/
Res
erve
s 2/
Inve
stm
ent 4
/
Tabl
e 2.
Sum
mar
y of
Pri
ncip
al O
il an
d G
as F
ield
s

- 23 -
C. Long-Term Potential and Risks
Long-term potential
11. Kazakhstan is endowed with very substantial potential oil and gas reserves. Industry and official agency analyses of Kazakhstan’s hydrocarbon potential vary considerably, although there appears to be broad consensus that proven and probable reserves reach 30 billion barrels (Table 3). While a major output increase is still to come from the existing onshore fields, especially from Tengiz and Karachaganak, the most promising area is the offshore North Caspian region, including, but not limited to, the Kashagan field. Together with other fields in the area, the new offshore fields (Tyub-Karagan and Kurmangazy), being developed jointly by KazMunaiGaz (KMG) and Russian firms, could hold as much petroleum as Kashagan. This could result in crude output levels reaching 3½ million barrels per day and gas output rising to 40–60 bcm per year for an extended period of time (20–30 years) from about 2020 (Table 4).1 Investment is expected to remain at around $4–5 billion per annum during this decade.
12. Production from the offshore North Caspian field of Kashagan is expected to rise sharply from 2008 through about 2018 before reaching a plateau at around 55–60 million MT around 2030. The field could be exploitable for 70–80 years. Financial flows to the government, as is typical for production sharing agreements (PSAs), are strongly backloaded in light of the enormous investment involved in developing the field ($25–30 billion).
Table 3. Proven and Potential Reserves of Oil and Gas (Oil in billions of barrels; gas in trillions of cubic meters)
Oil Gas
Proven and probable reserves 1/ 30 3 New fields 2/ 10–15 2–3 Enhanced recovery 10–15 ... Total 50–60 5–6
Sources: Kazakhstani and industry sources; and Fund staff estimates.
1/ Assuming existing recovery technology and development plans. 2/ Essentially the offshore North Caspian shelf, aside from Kashagan.
1 The outlook for natural gas is largely drawn from Republic of Kazakhstan (2002). See also Republic of Kazakhstan (2003a and 2003b).

- 24 -
Table 4. Petroleum Production, Exports, and Fiscal Revenue, 2004–20
2004 2005 2006 2007 2008 2009 2010 2015 2020
Crude oil production (in millions of metric tons) 1/ 56 62 75 77 80 88 94 120 123 Exports (in millions of U.S. dollars) 48 52 65 67 70 77 82 104 102 Budget revenue from oil and gas (in billions of U.S. dollars)
2.5 2.4 2.9 3.0 2.9 3.0 3.2 4.2 7.9
Natural gas production (bcm) 18 23 34 48 55 60 60 65 65 Memorandum items: World oil price (WEO basket; $/bbl) 2/ 30.0 27.0 26.0 25.5 25.0 25.0 25.5 28.2 31.1 Potential offshore North Caspian production 3/ 20 52 (in millions of metric tons) Sources: Kazakhstani authorities; and Fund staff estimates and projections.
1/ Output from existing fields and Kashagan; new fields under development, such as the offshore North Caspian fields, have not been included.
2/ WEO price projections (January 2004) through 2009; thereafter assuming a 2 percent nominal increase. 3/ In addition to Kashagan.
D. Caveats and Risks
Access to world markets—diversification of risk and the transit issue
13. Kazakhstan has suffered from its landlocked position and dependence on the dual Russian state-run oil and gas pipeline monopolies (Transneft and Gazprom, respectively).2 While export capacity constraints are not presently binding overall, some large fields remain to be connected to major pipeline routes. Kazakhstan’s main fields are at least 1,500 km from access to world markets through the Black Sea. While transit volumes through the Russian pipeline system (aside from the CPC) have risen in recent years, and a medium-term agreement with higher volume quotas was secured in 2002,3 Transneft has steadfastly resisted the introduction of an international standard quality-bank mechanism and
2 See IMF (2003) for a more comprehensive discussion. See also Dodsworth et al. (2002); and Mathieu and Shiells (2002) for a more detailed discussion of the trade-distorting effects of the state-owned energy monopolies in oil and gas in the countries of the Former Soviet Union.
3 Essentially, the full capacity of the Atyrau-Samara pipeline (15–16 million MT) has been allocated to Kazakhstan (up from 10 million MT in 2001). Moreover, a quota of 2.5 million MT was agreed for shipments through the pipeline from the Russian Caspian port of Makhachkala to Novorossiysk. The crude oil reaches Makhachkala by ship across the Caspian Sea from the Kazakhstani port of Aktau.

- 25 -
national treatment on tariffs.4 There have also been unsuccessful attempts to bring the CPC pipeline, which represents an important threat to Transneft‘s monopoly, under the control of the Russian monopoly regulation agency. The CPC pipeline represented a major breakthrough for the marketing of Kazakhstan’s crude oil, and the link with other major fields has produced major economic gains.
14. Over the long-term, Kazakhstan will need to secure considerable new export pipeline capacity (2–2½ million bbls/day). A significant part would come through the planned expansion of the CPC to around 1.4 million bbl/day (from actual shipments of 0.4 bbl/day in 2003). Additional capacity could be provided by the BTC (Baku-Tbilisi-Ceyhan) pipeline from Baku, Azerbaijan, via Tbilisi, Georgia, to the Turkish Mediterranean port of Ceyhan from 2006 (Table 5). Output from the Azeri AOIC field is projected to begin declining by around 2012, at just about the time Kashagan output is projected to reach 30–40 million MT. However, transport costs are expected to be relatively high because of the considerable distance (1,800 km) and the BTC’s indirect routing to the Mediterranean.5 Further, an undersea pipeline link from Kashagan to Baku would likely need to be built over the longer term at considerable cost. Other export alternatives include expanding the existing swap arrangements with Iran (paragraph 16).
Table 5. Crude Exports and Potential Pipeline Capacity Profile, 2003–20 (In millions of barrels per day)
Source: Fund staff estimates and projections.
1/ Capacity available to Kazakhstan (for the BTC 1 million bpd capacity is assumed, deducting Azeri uptake).
4 A quality bank is an equalization scheme to compensate shippers for quality differentials between the types of crude oil mixed in a pipeline. The absence of such a mechanism penalizes lighter and sweeter crudes such as those from the newer Kazakhstani fields. National treatment (implying non-discriminatory pricing) for transportation services for oil and gas as well as rail and other infrastructure is one of the objectives driving the economic integration initiatives of Kazakhstan with Russia and other major CIS countries.
5 The BTC pipeline is presently under construction and is expected to begin operations by early 2005 with a capacity of 50 million MT per annum (1 million bbl/day). Capacity could be increased to 1.4 million bbl/day using flow enhancers and to 1.7 million bbl/day with additional pumping stations. By-passing Armenia and the Black Sea, the line follows a very indirect route to the Mediterranean.
Exports 0.9 1.1 1.7 2.6 3.3 Of which: Other North
Caspian 0.4 1.1
Pipeline Capacity 1/ 0.7 0.9 1.9 2.9 3.3 CPC 0.4 0.6 0.9 1.4 1.4 Transneft (Russia) 1/ 0.3 0.3 0.3 0.3 0.3 BTC 1/ -- -- 0.2 0.2 0.6 To China -- -- 0.5 1 1
2015 2020 2003 2005 2010

- 26 -
15. Prospects for a long-discussed crude oil pipeline to China appear to be materializing. The recent construction of an internal pipeline in China, linking the west to the south of the country, has improved the economics of a pipeline from western Kazakhstan to the Chinese border. Feasibility studies have been completed and agreement to begin construction on the first phase in mid-2004 was announced on May 17, 2004.6 Chinese national firms have also shown increasing interest in acquiring shares in Kazakhstani oil fields, notably, but unsuccessfully, in Kashagan.
16. Efforts to further diversify export routes and develop markets for Kazakhstani crude and gas involve rail and Caspian Sea links with northern Iran. Two million MT of crude per year are delivered (by KMG and Petrokazakhstan) against an equivalent value of Iranian crude on the Persian gulf. The Ukrainian authorities have publicly indicated their interest in attracting Kazakhstani crude for shipment through the Odessa-Brody line from the Black Sea to the border with Poland (to access western European markets, and as an alternative to transit through Russia or through the congested Bosporus straits). For gas, there are plans to double (to 90 bcm per year) the capacity of the Central Asia gas pipeline from Turkmenistan through Kazakhstan, and onwards to Russia and Ukraine.
The business climate and investor relations
17. Kazakhstan’s investor relations have been somewhat difficult since 2002. Foreign investors’ concerns about high profile official calls for a “rebalancing of oil contracts” appear to have abated with official assurances given in 2003 that existing contracts would not be reopened. In late 2003, a new crude oil export tax regime for all new projects was introduced with tax rates varying from 1 percent at a world price of $19/bbl to 33 percent at $40/bbl. Investors have reacted unfavorably and the ultimate impact of the tax remains unclear. Unresolved divergences in perceptions of contract fairness, risk sharing, and the relative attractiveness of Kazakhstan’s oil reserves may prove to be a source of continued friction. Additional areas of grievance cited by foreign investors include a restrictive alien work permit regime, requirements regarding local content rules and investments in local communities, and environmental rules and enforcement mechanisms that require further development. There is also a lack of framework for the financing of infrastructure (access roads, increased electricity generation, ports, etc.).
6 The line from western Kazakhstan, which would total some 3,000 km, could be built in sections, connecting and reversing the flow of current lines from Kenkiyak to the CPC, through the landlocked Kumkol fields, and onwards to western China. The first section of about 1,000 km would run from the rail oil terminal facility at the Atasu station in the central Karaganda region to the Druzhba-Alashankou station on the Kazakhstani-Chinese border. The complete line could potentially be operational by 2007. Capital costs would be quite high (around $2–3.5 billion), as would the minimum through-put for the line to be economic (20–50 million MT/year; 0.4-1.0 million bbls/day).
- 27 -
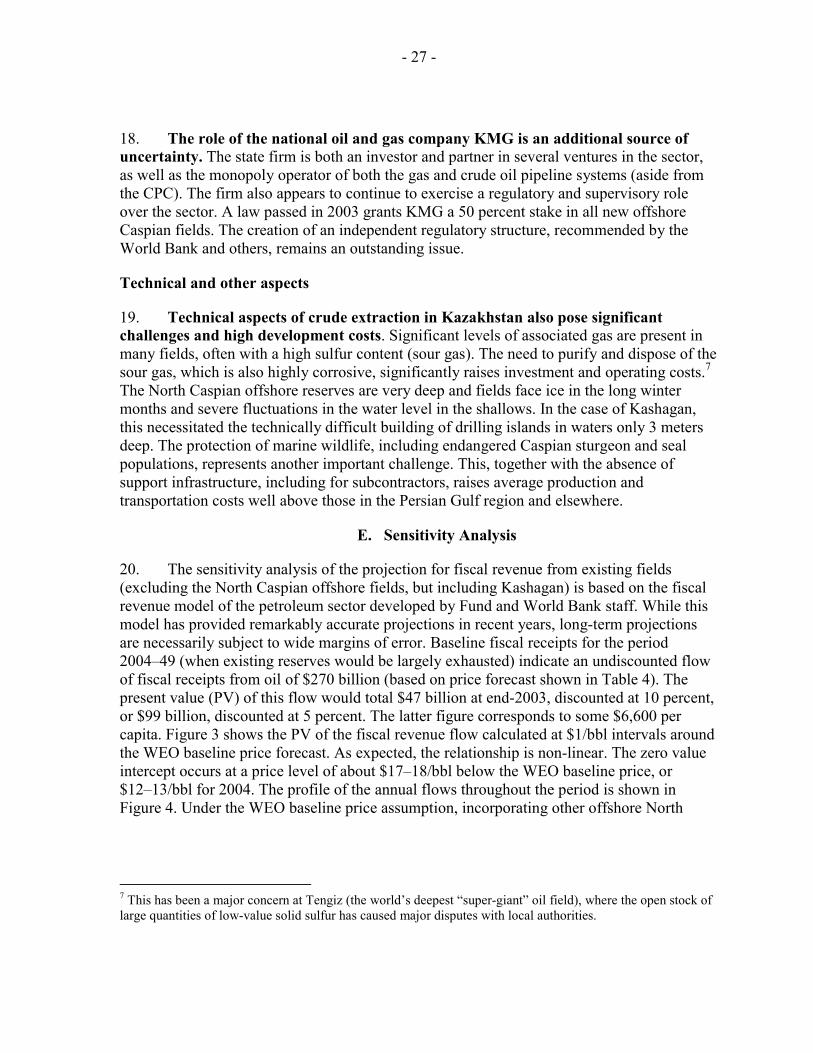
18. The role of the national oil and gas company KMG is an additional source of uncertainty. The state firm is both an investor and partner in several ventures in the sector, as well as the monopoly operator of both the gas and crude oil pipeline systems (aside from the CPC). The firm also appears to continue to exercise a regulatory and supervisory role over the sector. A law passed in 2003 grants KMG a 50 percent stake in all new offshore Caspian fields. The creation of an independent regulatory structure, recommended by the World Bank and others, remains an outstanding issue.
Technical and other aspects
19. Technical aspects of crude extraction in Kazakhstan also pose significant challenges and high development costs. Significant levels of associated gas are present in many fields, often with a high sulfur content (sour gas). The need to purify and dispose of the sour gas, which is also highly corrosive, significantly raises investment and operating costs.7 The North Caspian offshore reserves are very deep and fields face ice in the long winter months and severe fluctuations in the water level in the shallows. In the case of Kashagan, this necessitated the technically difficult building of drilling islands in waters only 3 meters deep. The protection of marine wildlife, including endangered Caspian sturgeon and seal populations, represents another important challenge. This, together with the absence of support infrastructure, including for subcontractors, raises average production and transportation costs well above those in the Persian Gulf region and elsewhere.
E. Sensitivity Analysis
20. The sensitivity analysis of the projection for fiscal revenue from existing fields (excluding the North Caspian offshore fields, but including Kashagan) is based on the fiscal revenue model of the petroleum sector developed by Fund and World Bank staff. While this model has provided remarkably accurate projections in recent years, long-term projections are necessarily subject to wide margins of error. Baseline fiscal receipts for the period 2004–49 (when existing reserves would be largely exhausted) indicate an undiscounted flow of fiscal receipts from oil of $270 billion (based on price forecast shown in Table 4). The present value (PV) of this flow would total $47 billion at end-2003, discounted at 10 percent, or $99 billion, discounted at 5 percent. The latter figure corresponds to some $6,600 per capita. Figure 3 shows the PV of the fiscal revenue flow calculated at $1/bbl intervals around the WEO baseline price forecast. As expected, the relationship is non-linear. The zero value intercept occurs at a price level of about $17–18/bbl below the WEO baseline price, or $12–13/bbl for 2004. The profile of the annual flows throughout the period is shown in Figure 4. Under the WEO baseline price assumption, incorporating other offshore North
7 This has been a major concern at Tengiz (the world’s deepest “super-giant” oil field), where the open stock of large quantities of low-value solid sulfur has caused major disputes with local authorities.

- 28 -
Caspian fields, would add $170 billion (undiscounted) for the period 2011–49, equivalent to a PV in 2003 of $23 billion, discounted at 10 percent, or $58 billion at 5 percent.8
8 The other North Caspian fields are assumed to be equivalent in size to Kashagan, with production beginning in 2011. This could be a significant underestimate.
Figure 3. Present Value of Fiscal Receipts from Petroleum, 2004–49 1/
0
50
100
150
200
250
+5+4 +3 +2 +1 WEO baseline
projection
-1-2-3-4-5-6-7-8-9-10-11-12-13-14-15 -16 -17 -18 -19 -20
Differential from WEO baseline price forecast for petroleum ($/bbl)
Source: Fund staff projections.1/ Does not include production from offshore North Caspian fields, other than Kashagan.
Bill
ions
of U
.S. d
olla
rs
10% 1/5% 1/5% w other north Caspian
`

- 29 -
Figure 4. Annual Fiscal Receipts from Petroleum, 2003–49 1/
0 2 4 6 8
10 12 14 16
2003 2007 2011 2015 2019 2023 2027 2031 2035 2039 2043 2047
Bill
ions
of U
.S. d
olla
rs
Source: Fund staff projections.
1/ At different prices for petroleum in U.S. dollars per barrel. Does not include production from the offshore North Caspian fields, other than Kashagan. Enhanced recovery and field developments are likely to extend the curves outward from their peaks.
WEO- $5
WEO+ $2
WEO- $2
WEO+ $5
WEO+ $10
WEO baseline

- 30 -
Figu
re 5
. Pip
elin
e N
etw
ork
Sour
ce: h
ttp://
ww
w.p
etro
kaza
khst
an.c
om/im
ages
/map
1.jp
g

- 31 -
REFERENCES
Dodsworth, J. R., P. H. Mathieu, and C. Shiells, 2002, “Cross-Border Issues in Energy Trade in the CIS Countries,” IMF Policy Discussion Paper 02/13 (Washington: International Monetary Fund).
IMF, 2003, Republic of Kazakhstan—Selected Issues and Statistical Appendix, IMF Country Report No. 03/211 (Washington: International Monetary Fund).
Mathieu, P., and C. Shiells, 2002, “The Commonwealth of Independent States’ Troubled Energy Sectors,” Finance & Development, Vol. 39 (September), pp. 34–38.
Republic of Kazakhstan, 2002, “The Concept of the Development of the Gas Sector of the Republic of Kazakhstan Until the Year 2015,” Government Resolution No. 25, January 11.
———2003a, “Development Plan for the National Company KazMunaiGaz, JSC for 2004-06,” Draft Government Resolution, September.
———2003b, “On the State Program for Development of the Kazakhstani Sector of the Caspian Sea,” Presidential Decree No. 1095, May 16.

- 32 -
IV. THE IMPACT OF THE OIL BOOM ON THE NON-OIL SECTOR1
A. Introduction
1. Rising oil production and exports have been a key driving force for Kazakhstan’s rapid GDP growth over the past few years. At the same time, the oil boom has generated upward pressure on the real exchange rate. While an appreciating tenge is a sign of higher purchasing power and economic strength, it also poses challenges for structural adjustment and macroeconomic management. This chapter examines the impact of the oil boom on Kazakhstan’s real economy. More specifically, it seeks to answer the following questions:
• How will the projected oil-driven economic growth affect the structure of the Kazakhstani economy over the medium term?
• How will a real appreciation of the tenge affect the Kazakhstan economy, and what will be the macroeconomic impact of policies to resist real appreciation?
• What would be the consequences of a policy to increase import barriers in response to real exchange rate appreciation?
• What are the alternative policies for supporting the non-oil tradables sectors?
2. The most direct impact of the oil boom on the rest of the economy works through inter-sectoral linkages. A booming oil sector will necessarily require more material inputs and services from other sectors. It will also divert labor and capital from other sectors when relevant labor segments are in full or near-full employment and no idle productive capacity is available.2 How the oil sector’s increased demand for intermediate inputs and primary factors of production is distributed across various sectors of the economy is largely an empirical question. The answer will depend on particular patterns of intersectoral linkages and factor market conditions, such as labor mobility.
3. The oil boom also affects the rest of the economy through its impact on macroeconomic aggregates. Income increases as a result of rising oil revenue will likely lead to higher consumption and investment. How the higher aggregate demand is allocated among sectors has important implications for relative prices. A booming investment sector, for example, will provide a boost to machinery and construction industries, which provide most of domestically supplied capital goods. A large increase in government consumption, as 1 Prepared by Yongzheng Yang.
2 The construction of oil fields can be labor-intensive, but oil production itself is capital-intensive. Since new oil fields have to be constructed continuously to expand production capacity over time, labor input in the oil industry is not negligible. At present, there does not seem to be any shortage of unskilled labor, but some categories of skilled labor may be in short supply as oil companies have been trying to hire from overseas in the past. However, as the oil sector expands further, an overall labor shortage may emerge (see next section).

- 33 -
opposed to private consumption, is more likely to boost the services sector, as the government spends more on education, health, and public administration. This would raise the prices of services relative to those of manufactures and agricultural commodities.
4. How policymakers respond to structural changes in the economy will have important implications for economic stability and long-term growth. One available option is to attempt to slow the real appreciation of the exchange rate through (sterilized) purchases of foreign exchange by the central bank in conjunction with a tight fiscal stance, as has been the policy of the Kazakhstani authorities in recent years. However, the resulting increase in savings limits the rise of private and public consumption and investment, which could affect negatively current living standards and the country’s long-term growth potential. The alternative is to accept the real appreciation of the exchange rate while seeking to mitigate its negative consequences for the non-oil tradables sectors. There many policy options are available. Two of them are briefly analyzed in this chapter: trade protection and a broad-based strategy aimed at improving productivity.
B. Simulating the Effects of the Oil Boom
5. To capture the inter-sectoral linkages and macroeconomic interactions discussed above, we employ a computable general equilibrium (CGE) model of the Kazakhstani economy for our analysis.3 The model identifies eight sectors (see Appendix Table 1) and two factors of production, labor and capital (the latter also includes natural resources, i.e., oil reserves). An input-output table of the Kazakhstani economy for 2000 captures inter-sectoral linkages. All macroeconomic aggregates are linked through national accounts identities. Government policies can be reflected in expenditure and taxation policies with respect to domestic economic activities and external trade. These policies in turn affect the real exchange rate, which is here defined as the price of non-tradables (domestic goods) relative to tradables (exports and imports). The model, which is grounded in trade theory (de Melo and Robinson 1989), does not comprise an explicit financial sector and hence no monetary variables or nominal exchange rates. The effect of monetary policy can be modeled implicitly through assumptions about changes in real domestic absorption and the current account balance. Since the model is static, expectations play no role and it can not shed light on short-run macroeconomic dynamics. The model is best suited for a medium-term analysis of structural change in the real economy. Nevertheless, as will become clear later on, medium-term results from the model (such as those on investment levels) do have significant long-term implications.
3 See Appendix for technical details of the model. The model is an upgraded version of the one used in IMF (2003), which examines the impact of an oil price rise on the Kazakhstani economy. The corresponding database has also been refined. The model is solved using GEMPACK (Harrison and Pearson 1996).

- 34 -
6. To simulate the impact of the oil boom, we first undertake a benchmark projection of the Kazakhstani economy for 2006 starting from 2000, based on unchanged levels of oil production.4 The projection assumes that GDP grows at an annual average rate of 8 percent during 2000–06. Comparative static experiments are then carried out against the benchmark projection for 2006 to gauge the impact of the oil boom. Once the actual and projected growth of oil output over the period 2000–06 (based on the Model of the Kazakhstani Oil Sector) is taken into account (assuming no other changes), the 2006 level of GDP implies an annual average GDP growth rate of 9.3 percent during the period 2000–06, which is broadly in line with the current WEO projection.
7. A graphic illustration of the benchmark projection and comparative static experiments is provided in Figure 1. Starting from point A in 2000, GDP reaches its 2006 level at point B under the benchmark projection. The exogenous shock (in this case, the projected increase in oil output) takes 2006 GDP to point C. BC thus represents the comparative static effect of the oil shock on GDP. The simulation results (below) are reported as percentage deviations from the benchmark (defined as CB/BD*100), rather than absolute changes (CB), unless otherwise indicated.
Figure 1. Kazakhstan: Benchmark Projection and Comparative Static Simulations
4 Note that this is a cumulative projection from 2000 to 2006, not an annual projection with a time path, as the model is a static one. The year 2006 was chosen for a snapshot examination of the medium-term outlook.
Benchmark projection
20062000
GDP
Comparative static effects
C
A
B
D
Source: Fund staff projections.

- 35 -
8. Other inputs to the benchmark projection include assumptions about the growth of factors of production over the period 2000–06.5 The growth of the labor force of 0.5 percent per year is based on the projections of the United Nations Population Division, while the rate of capital accumulation is derived from staff projections, which assume a capital-output ratio of 3 and an annual deprecation rate of 5 percent. This results in an annual average growth rate of 5 percent for the capital stock over the period. In addition to the full absorption of the projected labor force growth, it is assumed that two percentage points of those currently unemployed (estimated at about 10 percent of the labor force in 2000) would join the workforce. The projection of the world oil price for 2006 is based on the January 2004 version of WEO assumptions. The current account is assumed to be in balance in 2006 to facilitate the analysis.6
Effects of the Oil Boom Under Accommodating Macroeconomic Policies
9. The first simulation of the oil boom is a 113 percent increase in the level of oil output by 2006.7 This is based on staff projections for oil production for 2006 as compared with 2000. The main objective of this simulation (and indeed of all subsequent simulations) is not to obtain precise estimates of quantitative effects of the oil boom, but rather to illustrate the mechanism that underlies the economic outcomes under different macroeconomic policy options. The increase in oil output is modeled as a windfall gain, stemming from an expansion of oil resources that suddenly become exploitable.8 As the model does not distinguish oil resources from capital stock, the windfall is represented as an increase in the stock of capital.9 It is also assumed that capital efficiency in the oil sector increases by 20 percent between 2000 and 2006 to reflect gains attainable from ongoing structural reforms and the maturing of the oil industry over time.
10. Policymakers are assumed to respond to the oil boom by allowing the real exchange rate to appreciate. More specifically, macroeconomic policies are such that real domestic absorption (investment, household consumption, and government expenditure) adjusts upward in line with GDP growth to prevent a widening of the current account surplus from its benchmark level. This outcome does not suggest that policymakers can control the
5 Once assumptions are made about the growth of GDP and the factors of production, technological change is endogenous to the production function Y = f(A, L, K), where Y stands for GDP, A for technology, L for labor, and K for capital.
6 Since the input-output table we used does not include the income account, the current account represented in the model essentially consists of the trade account only (including trade in services).
7 As explained above, the baseline oil production in 2006 is the same as the output level in 2000. The world oil price is assumed to remain unchanged at its projected 2006 level.
8 Devarajan et al. (1997) provide a neat exposition of how a resource boom can be modeled in this manner.
9 However, capital stocks in non-oil industries remain unaffected.

- 36 -
real exchange rate directly, at least not in the long run. However, it assumes that they can use a combination of fiscal, monetary, and (nominal) exchange rate policies to achieve a certain real exchange rate target over the medium term, which will raise domestic absorption. Given the still substantial existing unemployment (8 percent in the 2006 benchmark), it is assumed that any rise in demand for labor would result in higher employment rather than real wage increases until the unemployment rate reaches 4 percent, which is assumed to be the natural rate of unemployment (NARU).10
11. Given the importance of the oil sector, the 113 percent increase in oil output results in large income gains (Table 1, Scenario I). Compared with the baseline projection, real GDP is 7.8 percent higher in 2006, while real household consumption is 7.4 percent higher, boosted by the absorption of part of the unemployed into the workforce and a real wage increase of 4 percent, in addition to rising returns from resource rents, of which a fixed proportion goes to the government as tax revenues.11 As a result, both household and government savings rise, to be absorbed by expanding investment.
12. A substantial appreciation of the real exchange rate, here defined as increase in the relative price of non-tradables to tradables, is required for the increase of domestic absorption. Industries producing tradable goods (except the oil industry, of course) contract significantly as productive resources move to the less traded services sectors (Table 2, Scenario I).12 Despite the 4 percent increase in overall employment, employment in agriculture, machinery, and the rest of industry falls. In contrast, output and employment in largely non-traded services industries expand. The construction industry, in particular, experiences a boom as investment rises.
Effects of the Oil Boom Under Tight Macroeconomic Policies
13. In the second simulation, policymakers choose to constrain the real exchange rate appreciation by limiting the rise of domestic absorption (Table 1, Scenario II). It is assumed that government policies are such that investment (including by the public sector) rises by only 3 percent above its 2006 baseline level and government consumption by 2 percent. Household consumption, which is endogenous and adjusts to government policies and the oil boom, is also increasing more slowly as real wages and rental prices of capital rise less. A current account surplus emerges as imports grow much less than under the first 10 In the end, the level of labor supply implied by the 4 percent NARU begins to bind and real wages increase. There is great uncertainty over the efficiency of the labor market in Kazakhstan. The simulation results reported below are not particularly sensitive to the assumption about the level of NARU. Nevertheless, the assumed NARU of 4 percent may be on the low side, which would reduce the symptoms of the Dutch disease, should it occur. On the other hand, the potential for immigration (legal and illegal) would mitigate the risk.
11 In the end, labor supply implied by the 4 percent NARU begins to bind and real wages increase.
12 The tradables sectors include agriculture, oil, machinery, and the rest of industry. The less traded services sectors include construction, transport, retail and wholesale trade, and other services.

- 37 -
scenario and exports do somewhat better. Real GDP increases somewhat less than under the first scenario, but the composition of final demand differs significantly. The leading force for GDP expansion is now net exports (up by 2.8 percent of GDP), rather than domestic absorption.13
14. The smaller real appreciation of the exchange rate (i.e., increase in the relative price of non-tradables) reduces the “Dutch Disease” symptoms that characterized the first scenario, but at the expense of lower overall output and absorption. Non-oil tradable goods sectors still contract, but to a lesser degree, especially agriculture and the non-oil industry (Table 2, Scenario II). As investment is subdued, the construction industry expands only moderately; its growth is now largely driven by increased demand for intermediate inputs into other services industries.
15. To further dampen real appreciation and hence reduce the decline in the employment in the non-oil tradables sectors, domestic absorption needs to be restrained even further. For example, if the government were to aim to reduce real appreciation by half of the magnitude in the first scenario, it would have to force real domestic absorption to decline by 2.3 percent, and most of this fall would have to come from a sharp contraction in investment if the government maintained its baseline propensity to consume. Even if the government were to cap its consumption at the baseline level, investment would still decline considerably. To maintain the baseline level of investment, real government consumption has to fall by as much as 17 percent (Table 1, Scenario III). If the objective of government policies were to prevent any real appreciation at all, real domestic consumption would have to fall substantially. Again, depending on how this reduction is achieved, real investment would fall by nearly two-thirds if the government’s propensity to save would not change. If investment were to be maintained at the baseline level, government consumption would have to fall to a similar extent (Table 1, Scenario IV).
16. With further reduced real appreciation or no appreciation at all, non-oil tradables sectors fare better, but overall absorption (and welfare) is substantially lower. As shown in Table 2, Scenario II, if the real appreciation is reduced by half of the magnitude in the first scenario through a reduction in government consumption while holding investment at the baseline level, contractions in the output and employment in tradables sectors would be reduced by a third to a half. Not surprisingly, a further tightening of government consumption to eliminate real appreciation would enable Kazakhstan to maintain its baseline levels of output and employment in the tradables sectors as a whole (Table 2, Scenario IV).
13 Since the model has only one period, income generated from investment abroad, as implied by increased net exports, does not accrue in the current period.

- 38 -
Tab
le 1
. The
Impa
ct o
f the
Oil
Boo
m U
nder
Alte
rnat
ive
Mac
ro A
ssum
ptio
ns, 2
006
(Per
cent
age
devi
atio
n fr
om 2
006
base
line)
O
il bo
om
O
il bo
om w
ith p
rote
ctio
n
Exog
enou
s em
ploy
men
t
Exog
enou
s em
ploy
men
t
Fixe
d re
al w
ages
Fixe
d cu
rren
t ac
coun
t
Endo
geno
us
curr
ent
acco
unt
Red
ucin
g re
al
appr
ecia
tion
by h
alf
No
real
ap
prec
iatio
n
Fixe
d cu
rren
t ac
coun
t ba
lanc
e
Endo
geno
us
curr
ent
acco
unt
Fixe
d cu
rren
t ac
coun
t ba
lanc
e
Endo
geno
us
curr
ent
acco
unt
Sce
nario
(I
) (I
I)
(III
) (I
V)
(V
) (V
I)
(V
II)
(VII
I)
R
eal G
DP
7.8
7.5
6.7
5.3
6.
8 6.
7
1.1
0.9
Empl
oym
ent
4.0
4.0
4.0
4.0
4.
0 4.
0
-7.8
-7
.7
Rea
l wag
es
4.0
2.6
1.0
-0.8
-3.1
-5
.3
4.
0 2.
6 R
eal a
bsor
ptio
n 7.
8 4.
5 0.
1 -7
.1
6.
8 1.
2
1.1
-1.9
H
ouse
hold
exp
endi
ture
7.
4 5.
9 4.
5 3.
2
-1.5
-3
.3
-6
.7
-7.8
G
over
nmen
t exp
endi
ture
3.
2 2.
0 -1
7.3
-66.
3
32.1
16
.0
24
.5
12.0
In
vest
men
t 10
.8
3.0
0.0
0.0
10
.8
3.0
5.
1 3.
0 C
urre
nt a
ccou
nt b
alan
ce
(in
per
cent
of G
DP)
0.
0 2.
8 6.
4 12
.2
0.
0 5.
3
0.0
2.8
Rea
l exc
hang
e ra
te
20.5
16
.7
10.3
0.
0
29.2
21
.2
29
.7
24.5
Ex
port
volu
mes
19
.3
21.2
24
.6
30.7
9.7
16.1
4.3
7.8
Impo
rt vo
lum
es
19.3
15
.1
11.0
6.
0
9.7
4.3
4.
3 1.
7
So
urce
: Sim
ulat
ions
as d
escr
ibed
in th
e te
xt.

- 39 -
Tab
le 2
. Sec
tora
l Eff
ects
of t
he O
il B
oom
, 200
6 (P
erce
ntag
e de
viat
ion
from
200
6 ba
selin
e)
Sc
enar
io I
Scen
ario
II
Sc
enar
io II
I
Scen
ario
IV
Fi
xed
curr
ent a
ccou
nt
En
doge
nous
cur
rent
ac
coun
t
Red
ucin
g re
al
appr
ecia
tion
by h
alf
N
o re
al a
ppre
ciat
ion
O
utpu
t Em
ploy
men
t
Out
put
Empl
oym
ent
O
utpu
t Em
ploy
men
t
Out
put
Empl
oym
ent
(1
) (2
)
(3)
(4)
(5
) (6
)
(7)
(8)
Agr
icul
ture
-1
1.7
-18.
8-9
.6-1
5.6
-6.4
-1
0.5
-0.5
-0.9
Mac
hine
ry
-16.
1 -2
3.5
-15.
0-2
2.0
-10.
3 -1
5.3
0.2
0.4
Petro
leum
11
3.0
108.
811
3.0
109.
611
3.0
110.
911
3.0
113.
3In
dust
ry
-9.9
-2
1.8
-7.9
-17.
8-4
.2
-9.7
2.7
6.5
Con
stru
ctio
n 9.
4 23
.23.
58.
31.
6 3.
72.
45.
6Tr
ansp
ort
4.7
13.1
5.3
14.7
5.7
15.7
6.0
16.8
Trad
e 3.
8 10
.63.
49.
62.
3 6.
3-0
.2-0
.6Se
rvic
es
5.6
11.2
5.6
11.4
2.0
4.0
-7.6
-14.
3
So
urce
: Sim
ulat
ions
as d
escr
ibed
in th
e te
xt.
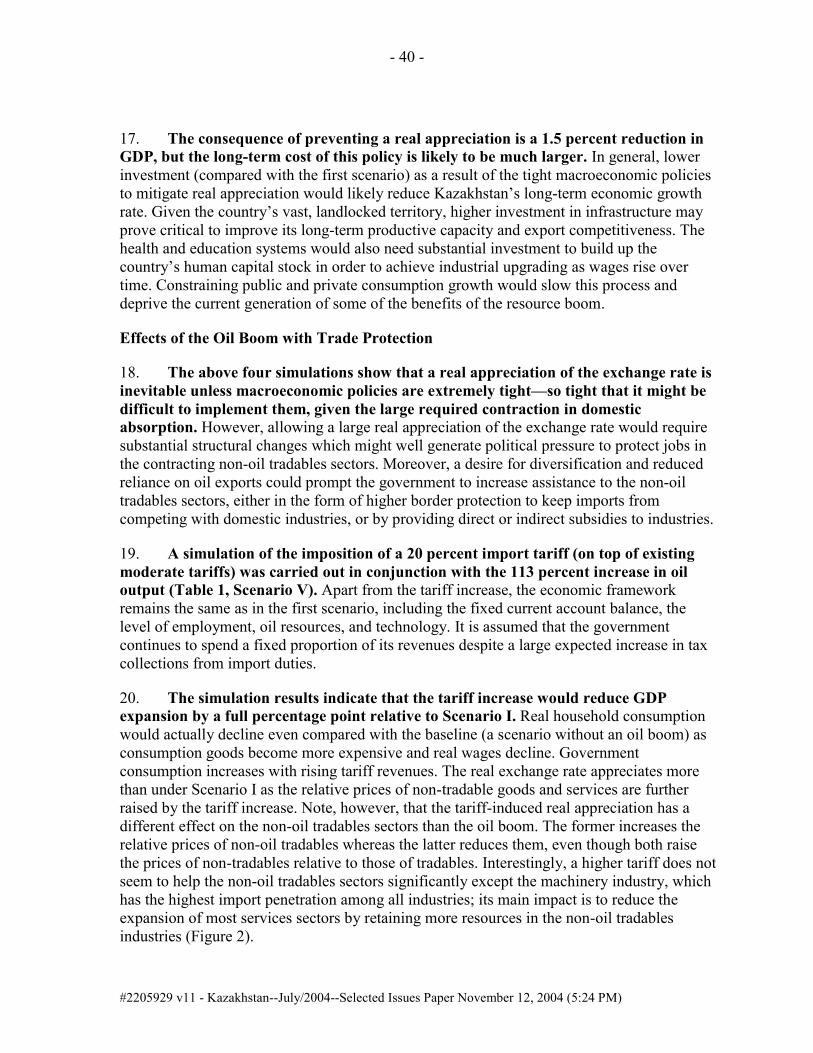
- 40 -
#2205929 v11 - Kazakhstan--July/2004--Selected Issues Paper November 12, 2004 (5:24 PM)
17. The consequence of preventing a real appreciation is a 1.5 percent reduction in GDP, but the long-term cost of this policy is likely to be much larger. In general, lower investment (compared with the first scenario) as a result of the tight macroeconomic policies to mitigate real appreciation would likely reduce Kazakhstan’s long-term economic growth rate. Given the country’s vast, landlocked territory, higher investment in infrastructure may prove critical to improve its long-term productive capacity and export competitiveness. The health and education systems would also need substantial investment to build up the country’s human capital stock in order to achieve industrial upgrading as wages rise over time. Constraining public and private consumption growth would slow this process and deprive the current generation of some of the benefits of the resource boom.
Effects of the Oil Boom with Trade Protection
18. The above four simulations show that a real appreciation of the exchange rate is inevitable unless macroeconomic policies are extremely tight—so tight that it might be difficult to implement them, given the large required contraction in domestic absorption. However, allowing a large real appreciation of the exchange rate would require substantial structural changes which might well generate political pressure to protect jobs in the contracting non-oil tradables sectors. Moreover, a desire for diversification and reduced reliance on oil exports could prompt the government to increase assistance to the non-oil tradables sectors, either in the form of higher border protection to keep imports from competing with domestic industries, or by providing direct or indirect subsidies to industries.
19. A simulation of the imposition of a 20 percent import tariff (on top of existing moderate tariffs) was carried out in conjunction with the 113 percent increase in oil output (Table 1, Scenario V). Apart from the tariff increase, the economic framework remains the same as in the first scenario, including the fixed current account balance, the level of employment, oil resources, and technology. It is assumed that the government continues to spend a fixed proportion of its revenues despite a large expected increase in tax collections from import duties.
20. The simulation results indicate that the tariff increase would reduce GDP expansion by a full percentage point relative to Scenario I. Real household consumption would actually decline even compared with the baseline (a scenario without an oil boom) as consumption goods become more expensive and real wages decline. Government consumption increases with rising tariff revenues. The real exchange rate appreciates more than under Scenario I as the relative prices of non-tradable goods and services are further raised by the tariff increase. Note, however, that the tariff-induced real appreciation has a different effect on the non-oil tradables sectors than the oil boom. The former increases the relative prices of non-oil tradables whereas the latter reduces them, even though both raise the prices of non-tradables relative to those of tradables. Interestingly, a higher tariff does not seem to help the non-oil tradables sectors significantly except the machinery industry, which has the highest import penetration among all industries; its main impact is to reduce the expansion of most services sectors by retaining more resources in the non-oil tradables industries (Figure 2).

- 41 -
21. A further simulation was carried out to estimate the effect of the tariff increase under the assumption of a moderated real exchange rate appreciation through restraint on domestic absorption (Table 1, Scenario VI).14 Such a policy would result in even larger reductions in real wages and household consumption. However, the reduced real appreciation of the exchange rate (relative to Scenario V) leads to greater reductions in imports and smaller contractions in non-oil exports. As a result, all non-oil tradables sectors fare better than under Scenario V. As more resources are retained in the non-oil tradables sectors, the services sectors expand less, particularly the construction industry, owing to constant investment (by assumption) (Figure 3).
22. An interesting question is what would happen if real wages were downward rigid. Additional simulations indicate that employment would fall by nearly 8 percent from its 2006 baseline (Table 1, Scenarios VII and VIII). This would more than offset the employment gains of six years (2000–06) of economic growth and the oil boom. As a result, household consumption would fall significantly below the base line projection.
C. Accelerating Productivity Improvement
23. There are options for enhancing international competitiveness of the non-oil tradables industries. A clear alternative is a broad-based strategy of improving the productivity of the economy. Such a strategy should focus on reducing the cost of doing business in Kazakhstan by reducing bureaucratic obstacles and corruption. Moreover, restrictive policies on employment of foreign experts, procurement, and transfer pricing regulations should be relaxed. The authorities should take the opportunity of their WTO accession process to lock in existing reforms, increase competition in the domestic goods and services markets, and build institutions for sustained growth. More investment is needed, in the context of a high-quality public investment program, to improve the country’s physical and social infrastructure. Continued structural and institutional reforms that create a favorable investment climate for foreign and domestic firms alike, and a more liberal trade regime that ensures competition in the domestic market, are essential for improved performance.
14 As in the second oil boom simulation, investment is assumed to increase by 3 percent, but government consumption by 16 percent (about half of the increase in the fixed current account scenario) while household consumption and the current account are endogenous. The results of the two simulations thus can be compared.
15 The simulation continues to include the shock resulting from the oil boom.

- 42 -
24. To underscore the above point, we simulated the impact of a 10 percent rise in total factor productivity on the non-oil tradables sectors and the economy as whole.15 Figure 4 (upper panel) shows that such a rise, in combination with the oil boom, would increase GDP by nearly 20 percent. It would also be far more effective than a 20 percent tariff in arresting the decline in the non-oil tradables industries (Figure 4, lower panel). Of course, achieving a 10 percent productivity increase is a challenging task. But Kazakhstan’s past experience proves that this is attainable over the medium term. Between 1996 and 2001, Kazakhstan’s total factor productivity increased by 24 percent (4.4 percent per year) (IMF 2003). If the expanding oil wealth can be invested efficiently, such additional productivity gains can be within reach.

- 43 -
Figure 2. Sectoral Effects of Oil Boom under Fixed Current Account, 2006(Percentage deviation from 2006 baseline)
Source: Simulations as described in the text.
Output
-20
0
20
40
60
80
100
120
Agriculture Machinery Petroleum Rest ofindustry
Construction Transport Trade Otherservices
Oil boomOil boom with tariff increase
Employment
-30
-10
10
30
50
70
90
110
130
Agriculture Machinery Petroleum Rest ofindustry
Construction Transport Trade Otherservices
Oil boomOil boom with tariff increase

- 44 -
Figure 3. Sectoral Effects of Oil Boom with Tariff Increase: Fixed versus Endogenous Current Account, 2006
(Percentage deviation from the 2006 baseline)
Source: Simulations as described in the text.
Output
-20
0
20
40
60
80
100
120
Agriculture Machinery Petroleum Rest ofindustry
Construction Transport Trade Otherservices
Fixed current account Endogenous current account
Employment
-40
-20
0
20
40
60
80
100
120
Agriculture Machinery Petroleum Rest ofindustry
Construction Transport Trade Otherservices
Fixed current account Endogenous current account

- 45 -
Figure 4. Effects of the Oil Boom:Productivity Improvement versus Tariff Increase, 2006
(Percentage deviation from 2006 baseline)
Source: Simulations as described in the text.
Macroeconomic effects
-10 -5
0 5
10 15 20
25 30 35 40
GDP Real wages Householdexpenditure
Governmentexpenditure
Investment Realexchange
rate
Export volumes
Importvolumes
Tariff increase
Productivity increase
Output effects
-20
0
20
40
60
80
100
120
140
160
Agriculture Machinery Petroleum Rest ofindustry
Construction Transport Trade Otherservices
Tariff increase
Productivity increase

- 46 -
D. Policy Implications
25. With an oil boom of the projected magnitude, a real appreciation of the tenge is almost inevitable. While policies designed to limit absorption through tight fiscal and monetary policies would reduce the pressure on the exchange rate over the short to medium term, they are unlikely to be sufficient to eliminate it. For now, a rapid build-up of foreign exchange reserves (which has been partially sterilized) and the accumulation of government assets in the NFRK have mitigated the pressure, but at the expense of domestic investment, the fiscal position, and private consumption. The projected increase in oil production over the medium term would require substantial further tightening of fiscal and monetary policies if the real exchange rate were to remain unchanged. To maintain a reasonable level of investment despite the substantial contraction required in domestic absorption, government consumption would have to contract so much that it could severely undermine the provision of public services and social benefits. An alternative would be lower private consumption and investment (by increasing taxes on households and pushing up real interest rates through government spending), which would reduce Kazakhstan’s long-term growth potential, as well as prevent the current generation from fully benefiting from the oil boom.
26. The real appreciation of the tenge will require considerable structural adjustment. Booming non-tradables sectors as a result of the oil output increase would attract considerable resources away from agriculture and other tradables sectors. Political pressure may develop to protect employment opportunities in these sectors through border measures and/or domestic subsidies. How this pressure is handled will have profound implications for the long-term growth of the Kazakhstani economy. For example, as illustrated above, a tariff increase may help the non-oil tradables sectors to some extent, but it could lead to losses in overall employment, especially if the labor market becomes downwardly-rigid in expectation of ever higher real wages resulting from increasing oil wealth. More importantly, in view of Kazakhstan’s relatively small domestic market, a protectionist policy runs the risk of creating inefficient industries and a distorted economy in the long run. An alternative approach to supporting the non-oil tradables sectors is to accelerate structural and institutional reforms, and to use the windfall oil wealth to build up the country’s physical infrastructure and human capital base. Over the long term, this would lay the ground for industrial diversification and upgrading, and productivity improvement.

- 47 - APPENDIX
A General Equilibrium Model of the Kazakhstani Economy
The model is based on neo-classical trade theory and has a structure similar to the Dervis-Robinson model of Korea (Dervis and Robinson 1982). Each of the eight industries (Table 1) identified in the model exhibits constant returns to scale. Firms are assumed to maximize their profits in perfectly competitive goods and factor (labor and capital) markets. Each industry produces one single commodity, which can either be sold at home or overseas, depending on relative prices. However, domestic sales and exports are no perfect substitutes. The degree to which domestic sales can be transformed into exports (and vice versa) is governed by a constant elasticity of transformation (CET) function. For the oil sector, we set the elasticity at 100, to reflect the fact that oil is a very homogenous product and that Kazakhstan has an established and improving oil transport system. For all other industries, we set the elasticity at one.1
Firms’ demand for intermediate inputs is proportional to output levels. These inputs are characterized by constant elasticity of substitution (CES) combinations of home products and imports. In setting the elasticities, we are guided by those available in the GTAP model (Hertel 1997) and the Korean model (Dervis and Robinson 1982). On the other hand, firms’ demand for primary factors is assumed to be governed by Cobb-Douglas production technology (with the implied elasticity of substitution being one) except for the oil sector, for which the elasticity of substitution is set at 0.2, making capital and labor gross complements. The very capital-intensive nature of oil production makes it difficult to substitute capital for labor.
1 Changes in the real exchange rate are sensitive to this elasticity and the elasticity of substitution between domestic goods and imports. However, the qualitative conclusions of the simulations hold within a reasonable range of values for these elasticities. The elasticities used in this model are broadly in line with those used in other models, such as the Dervis-Robinson (1982) model and the GTAP model (Dimaranan and McDougall 2002).
Table 1. Industries Identified in the Model
1 Agriculture2 Machinery3 Petroleum4 Rest of industry5 Construction6 Transport7 Trade8 Other services
Source: Model database.

- 48 - APPENDIX
Households are assumed to maximize a Cobb-Douglas utility function and their consumption bundle consists of eight goods and services, which are CES blends of home products and imports. Household incomes are derived from employment of labor and ownership of capital. Households pay income tax and their disposable income is used for either consumption or savings. Government revenue results from taxes on firm output and international trade, in addition to income taxes. The government contributes to national savings when its tax revenue exceeds consumption. The propensity to consume (for both households and the government) is assumed to be constant, unless exogenously specified. Labor is assumed to be perfectly mobile between industries, while capital is sector-specific. The labor market is cleared by equating demand with a specified level of supply. Alternatively, wage rigidities can be introduced to render aggregate employment endogenous. Goods markets are assumed to be cleared without any price controls. Kazakhstan is assumed to be a small country in the sense that it can not influence world prices. However, the law of one price does not hold in the model as a result of product differentiation between home goods and imports, and between domestic sales and exports.

- 49 -
REFERENCES
de Melo, J., and S. Robinson, 1989, “Product Differentiation and the Treatment of Foreign Trade in Computable General Equilibrium Models of Small Economies,” Journal of International Economies, Vol. 27, pp. 47–67.
Dervis, K. J., and S. Robinson, 1982, General Equilibrium Models for Development Policy, (Cambridge: Cambridge University Press).
Devarajan, S, D. Go, J. D. Lewis, S. Robinson, and P. Sinko, 1997, “Simple General Equilibrium Modeling,” in J. Francois and K.A. Reinert, eds., Applied Methods for Trade Policy Analysis (Cambridge: Cambridge University Press).
Dimaranan, B. V. and R. A. McDougall, 2002, Global Trade, Assistance, and Production: The GTAP 5 Database, Center for Global Trade Analysis (West Lafayette: Purdue University).
Harrison, W. J., and K. R. Pearson, 1996, “Computing Solutions for Large General Equilibrium Models using GEMPACK,” Computational Economics, Vol. 9, pp. 83–27.
Hertel, T. W., ed., 1997, Global Trade Analysis: Modeling and Applications (New York: Cambridge University Press).
IMF, 2003, Republic of Kazakhstan—Selected Issues and Statistical Appendix, IMF Country Report No. 03/211 (Washington: International Monetary Fund).

- 50 -
V. FISCAL RULES AND FISCAL SUSTAINABILITY ANALYSIS1
1. Fiscal policy design in oil-producing economies poses a challenge for two main reasons: the exhaustibility of the oil underground and uncertainties surrounding oil prices and revenues. Exhaustibility of oil resources raises the issue of intergenerational equity and sustainability, requiring a long term perspective in policy making to ensure that all generations benefit from the oil riches to a similar extent. The volatility of oil prices and revenues renders fiscal policy very complicated. It is critical to insulate fiscal expenditures from the volatility of oil revenues, as frequent swings in expenditures are costly. Moreover, it is important to avoid procyclical fiscal policy, and instead pursue policies to minimize fluctuations in domestic demand in the face of volatile oil revenues.2
2. Recent work on fiscal policy suggests the use of simple rules to guide policy in oil-producing countries. A fiscal rule is typically defined as a permanent constraint on fiscal policy, specified in terms of an indicator of overall fiscal performance.3 Examples of fiscal rules include a balanced budget rule, a ceiling on borrowing, or a limit on stock of government liabilities as a percentage of GDP. In the context of oil producing economies, fiscal rules are typically defined as a function of oil prices and/or the non-oil fiscal balance.
3. The concept of non-oil fiscal balance can be useful in designing fiscal policy rules. Unlike the overall fiscal balance, the non-oil budget balance is not directly affected by temporary fluctuations in oil revenues, and therefore is a good gauge of the stance of fiscal policy. It also reflects, to a large extent, the current and future economic developments in the domestic economy. Focusing on the developments in the non-oil economy can help the government to pursue the objective of diversifying the economy, and create a tax base that does not solely rely on oil revenues.
4. A range of fiscal rules has been discussed in the literature.4 At the one extreme stands the “balanced budget rule.” Under this rule, the overall budget is kept in balance, and all oil revenues are spent. Thus, the non-oil deficit is equal to oil revenues and no part of oil revenues is saved. This rule does not insulate fiscal expenditures from oil price volatility and, since there are no financial savings, it does not target intergenerational equity, unless government spending is focused on investment in education, healthcare, and infrastructure. At the other extreme is a cautionary rule called the Bird-in-Hand (BH) rule, where all oil revenues are saved in the form of income generating assets, and only the income from the
1 Prepared by Theo Thomas and Turgut Kisinbay.
2 The experience of oil-producing countries show a high correlation between fiscal expenditures and oil prices (Katz et al. 2004).
3 Kopits and Symansky (1998).
4 See Wakeman-Linn et al. for a discussion of fiscal policy rules for Azerbaijan.

- 51 -
available stock of assets is used for consumption.5 The ceiling on consumption expenditures based on oil wealth therefore would be equal to the projected return on the available stock of assets. The non-oil budget would be in balance, and the overall balance would be in surplus by an amount equal to the difference between oil revenues and the income from available assets.
5. A third fiscal rule is based on Friedman’s (1957) Permanent Income Hypothesis (PIH) of consumption. According to the PIH, which lies between the two extreme rules outlined above, the government has a forward looking perspective, and bases its decisions on consumption and saving on total wealth rather than current income. Total wealth is defined as the sum of current financial assets and oil wealth, where the latter is defined as the present discounted value of future oil revenues. The welfare maximizing behavior under the PIH requires that the government should not consume more than its permanent income, which is equal to the real interest on total wealth. This strategy keeps total wealth of the society constant across generations. The following sections of this chapter apply the PIH and the BH rules to Kazakhstan, using the projections of the oil sector model developed by the Fund and the World Bank. The aim is to illustrate how these two fiscal rules would address the problems of intergenerational equity and oil revenue volatility.
A. Long-Term Consumption Under the Permanent Income Hypothesis
6. This section applies the PIH rule to Kazakhstan.6 The calculations are based on revenue projections of the oil sector model developed by the Fund and the World Bank staff. The macroeconomic scenario through 2009 is based on staff projections. The long term assumptions for the analysis include: a nominal interest rate of 7 percent, a discount rate of 5 percent, a 2 percent inflation rate, and 3.5 percent real growth in the non-oil sector. Under these assumptions, the total wealth in the economy is equivalent to $101 billion, and the level of wealth per capita that would be kept constant stands at $6,805.
7. Figure 1 shows the path of the non-oil deficit-to-GDP ratio under different price assumptions. The trend of non-oil deficits implied by the PIH is downward sloping, and converges to about 2 percent of GDP towards the end of the period for the WEO baseline case. Table 1 provides a summary of the results. Under the baseline case, the results of the PIH analysis suggest a 3.3 percent non-oil deficit-to-GDP ratio for the period 2004–2049. Over the short term, non-oil fiscal deficits declining from over 10 percent of GDP in 2004 to just above 5 percent by 2010 would be consistent with a sustainable expenditure path. In U.S. dollar terms, the sustainable non-oil deficit would be about $3 billion for the rest of the decade. This figure is substantially higher than the current non-oil deficit of about $1 billion in 2003. 5 This is the approach pursued by Norway.
6 The mechanics of the model are outlined in Davoodi (2002).

- 52 -
Figure 1. Non-Oil Deficit-to-GDP Ratio Implied by the PIH, 2004–49
0.0
2.0
4.0
6.0
8.0
10.0
12.0
14.0
16.0
2004 2008 2012 2016 2020 2024 2028 2032 2036 2040 2044 2048
WEO-5 WEO WEO+5 US$19 Source: Fund staff projections.
8. The optimum non-oil deficit implied by the PIH is sensitive to oil price assumptions. Table 1 presents three alternative scenarios: two scenarios where the paths of oil prices are 5 percent higher and lower than the WEO baseline oil price path, respectively, and a scenario with a constant oil price of $19 per barrel. The results suggest that the long term average non-oil deficit ratio can reach 4.4 percent of GDP under the price assumption of $5 over the baseline scenario. This amounts to a non-oil fiscal deficit of about $4 billion for the rest of the decade and a $6.4 billion long-term average. If oil prices were $5 below the WEO baseline, the sustainable non-oil fiscal deficit would be 2.2 percent of GDP over the period 2004–2049, or $3.2 billion in nominal terms. The short run optimum level of consumption would be around $2 billion for this decade. Assuming an oil price of $19 per barrel would imply a 1 percent non-oil deficit-to-GDP ratio in the long run. The average non-oil fiscal deficit for the 2004–2049 period would amount to about $1.5 billion, and about $1 billion for the remainder of this decade.
9. Results for the sub-samples are shown in Table 1. Irrespective of the assumption about oil prices, the non-oil deficit as a percentage of nominal GDP is lower during the period 2031–2049 than the previous periods for two reasons. First, a substantial share of revenues from oil will arise in the second half of the period under analysis, after 2030. Consumption smoothing under the PIH requires that savings will be higher during periods with relatively high revenues. Second, because of economic growth, GDP will be higher towards the end of the period, and the non-oil fiscal deficit would constitute a smaller share of GDP. In U.S. dollar terms, the average non-oil fiscal deficit during the period 2031–2049 is higher than during 2020–2030.

- 53 -
B. Long-Term Consumption Under the Bird-in-Hand Rule
10. A second fiscal policy rule, adopted by Norway, is the BH rule according to which all the revenues from oil are saved and only the interest income of the accumulated assets is spent. This is a cautious rule and based on a single assumption about the future: return on financial assets during the following years. Figure 2 illustrates the path of the non-oil deficit-to-GDP ratio through 2049 under the BH rule. The BH rule, in contrast with the PIH rule, dictates a very cautious expenditure path over the short term, whereas it allows for large non-oil deficits in the future. Towards the end of the period, increases in the stock of financial assets slow down because of declining oil revenues. The non-oil deficit continues to increase in U.S. dollar terms, but declines relative to GDP.
11. Table 2 shows that the long run average non-oil deficit-to-GDP ratio for the period 2004–2049 under the two fiscal rules is quite similar. For the baseline case, this ratio equals 3.3 percent under the PIH rule, and 3.4 percent under the Bird-in-Hand rule. However, in U.S. dollar terms, the long-term average under the BH rule is higher than the PIH rule, as the former allows for a larger non-oil deficit in the future when GDP is high.
12. Average consumption in U.S. dollar terms is lower under the PIH rule because of intertemporal smoothing. The PIH rule dictates a higher saving rate towards the end of the period in order to keep consumption per capita constant for each generation including those who live after 2049, when oil reserves are depleted. Contrary to this, under the BH rule, the interest income generated from the stock of financial assets is always spent without any concern for consumption smoothing. As a result, the stock of financial assets at the end of 2049 is higher under the PIH rule than under the BH rule, suggesting a higher income stream for future generations who will live beyond 2049.
Table 1. Fiscal Indicators Under the Permanent Income Hypothesis, 2004–49
2004 2005 2006 2007 2008 2009 2010–30 2031–49 2004–49
WEO baseline Non-oil deficit/GDP (in percent) 10.8 8.9 6.6 6.0 5.5 5.0 3.1 2.4 3.3 Non-oil deficit (in millions of current U.S. dollars) 3,758 3,499 2,900 2,964 3,030 3,098 3,868 6,226 4,756
WEO+5 Non-oil deficit/GDP (in percent) 14.5 12.1 8.9 8.2 7.5 6.8 4.2 3.3 4.5 Non-oil deficit (in millions of current U.S. dollars) 5,068 4,718 3,911 3,998 4,087 4,178 5,216 8,400 6,415
WEO-5 Non-oil deficit/GDP (in percent) 7.2 5.9 4.4 4.0 3.7 3.4 2.1 1.6 2.2 Non-oil deficit (in millions of current U.S. dollars) 2,498 2,326 1,928 1,970 2,014 2,059 2,571 4,136 3,160
U.S. dollars 19 Non-oil deficit/GDP (in percent) 3.3 2.8 2.0 1.9 1.7 1.6 1.0 0.8 1.0 Non-oil deficit (in millions of current U.S. dollars) 1,160 1,080 895 915 936 956 1,194 1,925 1,469
Source: Fund staff projections.

- 54 -
Figure 2. Non-oil Deficit-to-GDP Ratio Implied by the Bird-in-Hand Rule, 2004–49
0.0
1.0
2.0
3.0
4.0
5.0
6.0
7.0
8.0
2004 2008 2012 2016 2020 2024 2028 2032 2036 2040 2044 2048
WEO-5 WEO WEO+5 US$19 Source: Fund staff projections.
13. The results presented in this study seem to suggest that the BH rule favors future generations over the current generation. However, these findings are based on assumptions that advocates of the BH rule would object to. The most important is that the results are based on production and revenue projections extending four decades ahead. One of the rationales for using the BH rule is that such projections are subject to a substantial amount of uncertainty and should not be relied upon. A comparison of the two rules using projections for such a long time horizon is in contradiction with the spirit of the BH rule.
Table 2. Fiscal Indicators Under the Bird-in-Hand Rule, 2004–49
2004 2005 2006 2007 2008 2009 2010–30 2031–49 2004–49
WEO baseline Non-oil deficit/GDP (in percent) 0.5 0.8 1.0 1.2 1.3 1.4 2.8 4.8 3.4 Non-oil deficit (in millions of current U.S. dollars) 180 305 427 572 728 876 4,089 12,157 6,955
WEO+5 Non-oil deficit/GDP (in percent) 0.5 0.9 1.1 1.4 1.7 1.8 3.9 6.4 4.6 Non-oil deficit (in millions of current U.S. dollars) 180 336 502 698 909 1,111 5,692 16,424 9,463
WEO-5 Non-oil deficit/GDP (in percent) 0.5 0.7 0.8 0.9 1.0 1.0 1.8 3.1 2.2 Non-oil deficit (in millions of current U.S. dollars) 180 273 352 446 547 640 2,598 7,981 4,535
U.S. dollars 19 Non-oil deficit/GDP (in percent) 0.5 0.6 0.6 0.6 0.6 0.6 0.8 1.4 1.0 Non-oil deficit (in millions of current U.S. dollars) 180 236 263 298 335 367 1,110 3,523 1,999
Source: Fund staff projections.

- 55 -
Box 1. Fiscal Policy Rules in Botswana and Indonesia
In Botswana, a sustainable fiscal position is defined as a fiscal outcome, in which the non-mining revenue of government equals at least the “noninvestment recurrent expenditure” of the government. For the purpose of this fiscal rule, current expenditures on education and health are excluded from the definition of “noninvestment recurrent expenditure” and can therefore be funded from mineral sources (IMF 2002). The government has devoted the revenue from mining to public investment, aimed at expanding and diversifying the economy’s productive base in an intertemporally efficient manner. Based on this rule, in the early 1980s, when the sale of diamonds was discontinued for 6 months, the government was able to maintain its expenditure programs by drawing down its reserves rather than through disruptive changes to taxation (Acemoglu et al. 2003). This rule facilitated large investments in human capital and infrastructure, which had raised life expectancy to almost 70 years prior to the AIDS pandemic, while simultaneously generating budget surpluses in every year since fiscal year 1983/84. In Indonesia, according to Bevan et al (1999), in “response to the excesses of the guided economy period during the 1950s and early 1960s, the New Order elevated the concept of a balanced budget to become a major symbol of good government.”2 Although the budget was balanced in the technical sense of no domestic borrowing, the authorities sometimes covertly ran surpluses, particularly during periods of high oil prices. Spending restrictions were often imposed on government agencies despite funds being distributed, increasing the build-up of deposits by subsidized institutions. This reduced the volatility of actual expenditure, and in effect the non-oil primary balance, but at the cost of fiscal transparency (Eifertet al. 2003). Temple (2003) argues that while the authoritarian control over the budget exercised during the Suharto period may have enabled the government to bend its own fiscal ‘rules’ it might also have been a factor that undermined its long-term sustainability and contributed to the economic crisis in the 1990s as the credibility of economic policy was diminished.
1 This reflects the belief that education and health build human capital and should thus be treated as investment. A significant feature of resource allocation in the budget has been the relatively large share of social spending, especially on education, which averaged 24 percent of total spending in the 5-year period ending 2001/02 (IMF 2002). Malaysia spent a similar share of its public expenditure on education during the 1970s and 1980s. 2 The balanced budget concept was in fact based on a non-standard definition of the fiscal accounts, which included official foreign capital flows and aid loans as revenue rather than financing. Using a more conventional GFS measure, the deficit was relatively stable at around 3 percent of GDP for most of the following decade.
14. Although there is considerable uncertainty about the amount of oil revenues, a substantial expansion of the oil sector in Kazakhstan is not disputed. Moreover, risks are not limited to the downside: future oil production, prices, and revenues may be much higher than currently projected. Taking a very cautious approach may result in lower benefits from oil revenues for the current generation.

- 56 -
15. Of the two rules analyzed in this study, the BH rule is the more cautious one, and the expenditures suggested by this rule can be considered as a safe lower bound for the non-oil fiscal deficit. While the PIH rule provides a better framework for intergenerational equity, it is based on complex assumptions about the future, and hence subject to major uncertainties. A more conservative and gradual spending path than the one suggested by the PIH rule could therefore be warranted. The projections derived from these two rules may act as lower and upper bounds on expenditures. An ideal expenditure path would likely lie between these two bounds and depend on the trade-off between policy makers’ attitude towards risk and their concerns about intergenerational equity.
C. Medium-Term Expenditure Framework and Resource Funds
16. Whether an explicit rule is in place or not, budgets should ideally be formulated within a sustainable medium-term economic framework (MTEF) (Box 2). Typically, an MTEF is intended to (i) promote predictability within a sustainable fiscal framework; (ii) improve inter- and intra-sectoral resource allocation by linking stated policy goals to spending plans; (iii) improve the effectiveness of public expenditure; and (iv) promote transparency and accountability (Houerou and Taliercio 2002).
17. Resource funds have been set up with both macro economic stabilization and savings or financing objectives. Resource funds have been established in Alaska, Azerbaijan, Chile, Kazakhstan, Kuwait, Norway, Papua New Guinea (now abolished), and Venezuela with a significant variety in design and purpose. Kazakhstan’s National Fund was established in 2001 (Chapter III, Box 1). Stabilization funds emphasize the need to insulate the domestic economy from volatile revenue swings, while savings funds focus on the need to fund future commitments (sometimes pensions or simply consumption). In Norway the petroleum fund is essentially a government account where net-oil revenue is deposited and the fund is used to finance the non-oil deficit through revenue transfers. Overall, the experience of oil funds has been mixed as they have often contributed only marginally to improved conduct of fiscal policy or higher savings.7 Such funds have also been found to entail certain risks, including the fragmentation of fiscal policy and asset management, resulting in a dual budget, and reduced transparency and accountability.
18. Resource funds may provide a mechanism for countries with pressing social and infrastructure needs to justify the build-up of financial savings (Bartsch et al. 2004). The inflow of resource-related rents can raise issues of how to utilize the revenue flow in an efficient intergenerational manner without distorting the macroeconomic balance. In many countries, structural reforms, and improvements to human capital, infrastructure, and the management of public utilities are prerequisites to enhancing the competitiveness and viability of the non-resource tradable sector. However, building the institutional capacity of a government to utilize its resources efficiently is likely to be a costly long-term process. In
7 See Davis et al. (2001) for a review of experiences and fiscal policy implications of resource funds.

- 57 -
this context, a resource fund with clear and transparent objectives may provide a conduit for financial savings. While resource funds may not, in themselves, improve fiscal discipline, they can help governments to build support and consensus around a particular fiscal policy. In Norway, the oil fund constituted a means of saving budget surpluses that had risen to around 15 percent of GDP per year. The fund was often associated with future pension liabilities, although there was no explicit link. Skancke (2003) argues that this helped to build a political consensus in support of saving more than 100 percent of GDP in financial assets despite social needs.
19. Resource funds that are well integrated into the budget may also help to foster transparency and accountability. In Kazakhstan the NFRK has helped to facilitate the pursuit of prudent fiscal and monetary policies that have stabilized the economy and to build up a large volume of savings. However, moving to a funding rule similar to the Norwegian model, perhaps based on a non-oil deficit target rule, would be simpler and could be used to enhance the transparency of both the fund and the budget more generally. In accordance with the Code of Good Practices on Fiscal Transparency, the consolidation of the fiscal accounts, including the NFRK, would allow the government to assess the management of its assets and liabilities within a unified framework that recognizes all the risks and returns of financing (or saving) the overall fiscal balance.8
20. Distributing resource revenues directly to the population has also been suggested to improve fiscal management and governance. In the absence of strong institutions that are able to manage efficiently public sector resources, some authors have proposed that resource revenues be distributed directly to all or parts of the population who may be better able to allocate their country’s resources (Box 3). For example, in Alaska a share of royalties from oil production (25 percent) is deposited in the Permanent Fund (a savings fund) that pays an annual dividend to the general population.9 The assets of the fund can only be used following a vote to change the Alaskan constitution. Nonetheless, Alaska has not been immune to fiscal problems. In the early 1990s voters created a $7.9 billion Consolidated Budget Reserve (CBR) with a one-off transfer of certain oil-related payments. The CBR was designed to provide a stabilization mechanism for government expenditure but it was largely run down to fund the general government’s fiscal deficit through the 1990s. In 2003 new proposals were made to the legislature to bridge the fiscal gap using a combination of fiscal tightening and resources from the Permanent Fund. In view of the mixed result for the overall fiscal stance, this approach requires a sufficiently robust disbursement mechanism, which may not be easily achieved in many developing countries with weak institutional capacity.
8 See IMF (2001).
9 Part of the aim of this transfer is the support of traditional lifestyles.

- 58 -
Box 2. Using a Medium-Term Expenditure Framework
Several countries, including resource-rich countries, have employed multi-year planning. Experience has shown that successful multi-year plans tend to be comprehensive, properly costed, and fully integrated into the annual budget (Houerou and Taliercio 2002). Since its independence in 1966, Botswana has used a series of multi-year National Development Plans (NDPs) to outline its policy priorities and intended expenditure patterns for the following 6–8 years; the macroeconomic framework is updated annually in the budget, and the programs are costed in order to form a genuine guide for fiscal policy (IMF 2002). Indonesia and Malaysia have both utilized multi-year development plans to help establish programs for diversifying their economies. Australia successfully introduced a Medium-Term Expenditure Framework (MTEF) in the early 1980s to improve its fiscal adjustment process, and South Africa followed suit in 1998 (World Bank 1998).
Box 3. Giving Resources Directly to the People? Recent recommendations for improving fiscal management have included the proposal that governments distribute some oil revenue direct to citizens, for example by providing bursaries for school children and other transfers, or by reducing taxes10 A direct distribution approach could be used to underpin the principle that oil revenues belong to the population or to fulfill particular policy aims, and could enhance transparency and accountability. Sala-i-Martin and Subramanian (2003) argue that the private sector may be better suited than the government to manage resource volatility by identifying shocks and hence smoothing intertemporal consumption, and spending the windfall more efficiently than the public sector.
As mentioned in Chapter II, an additional argument for this approach is that redistributing revenue to the population and subsequently raising funds through general taxation would improve governance, as a tax-paying population may generally demand higher standards of accountability and representation from its government. This may contrast with the less transparent management of the resource windfall if it accrues directly to the state. The link between taxation and governance also suggests that giving tax cuts to offset windfall gains may not always be the best option (see below, and Rakner and Moore 2002).
10 See Sala-i-Martin and Subramanian (2003) for a detailed discussion of this proposal in the context of Nigeria and Collier and Gunning (1996) for a broader discussion.

- 59 -
D. Strategies to Strengthen Fiscal Institutions to Ensure Proper Design and Control of Spending
21. Kazakhstan would benefit from continued efforts to improve its aggregate fiscal discipline and the credibility of public financial management. According to the World Bank (2003), three key measures can underpin effective public spending: (i) aggregate fiscal discipline; (ii) allocative efficiency and equity; and (iii) regular monitoring of operational impact. These measures define the budget and public expenditure management as critical components of the accountability that the general public expects from policy makers. In particular, fiscal discipline requires a structured mechanism for resolving competing claims on the budget from politicians, administrators, subnational levels of government, and other interest groups, while remaining within an appropriate overall expenditure envelope to prevent uncontrolled spending. While Kazakhstan has a good record with regard to overall public expenditure management, the government could improve allocative efficiency and equity by:
• Reforming expenditure policies and budget institutions. The objectives of Kazakhstan’s ambitious 10–15 year development plan were summarized in the Indicative Plan of Social and Economic Development for 2004–2006. They include (i) increasing the competitiveness of the country’s non-oil sector; (ii) creating employment opportunities; and (iii) improving living conditions for the majority of the population. However, as Table 3 suggests, the exploitation of oil has not resulted in an increasing share of resources being directed towards education or health spending.11 Accordingly, there is a need for a strategic re-assessment of government spending on human capital and infrastructure to meet both current pressing social needs and to provide for a skilled, flexible labor force in the future. However, as the productivity of public spending varies enormously, simply increasing government spending is not sufficient to improve public sector performance (Easterly 2001).
• Following the strategic re-assessment of spending priorities, it will take time for Kazakhstan to develop its policies and shift resource allocations and handle the administration of substantially larger expenditure volumes. As argued by Gelb and Associates (1988) in their study of oil windfalls, the non-oil fiscal balance should be adjusted gradually in the face of changes to oil revenues. In view of the projected doubling and even tripling of oil production, this would imply targeting a gradual widening of the non-oil deficit. In addition to a strong policy framework, sound institutions will be required to ensure that the additional revenue is spent efficiently. This includes institutions responsible for the delivery of public services (e.g., central and local governments, and the civil service), and those institutions that contribute to the overall efficiency of public spending (e.g., procurement and financial control).
11 Investment in human capital, in particular education has played a major role in the rapid development of Singapore and other Asian economies over the past decades. Kazakhstan’s investment in education, in particular primary and secondary education, is below the average for countries at a comparable income level.

- 60 -
Institution building will require time and, over the short-term, this may imply that Kazakhstan will continue to build up its financial reserves in the NFRK.
• Improving policy formulation and strengthening institutions through arrangements that foster responsiveness, accountability, and the rule of law (World Bank 1997). The institutional arrangements most likely to influence public sector performance are budgets, decentralization, and public administration. To emphasize the variety of approaches, the World Bank (2003) suggests an ‘eight sizes fit all’-strategy to describe the characteristics of effective service delivery arrangements. The proposed measures range from central and/or local government provision of services to contracting out or private sector provision of services.
• Defining adequate incentives for improving the management of public finances. Without appropriate incentives, correct policies for growth and development are unlikely to be adopted, and well-functioning systems are unlikely to be established (Easterly 2001). In democratic societies, where institutions exist that protect minority interest groups, private property rights, and individual economic freedoms, governments may define the right set of incentives to promote growth in the private sector. In this regard, Kazakhstan may be well placed to take advantage of its burgeoning oil resources.
• Developing mechanisms for regular monitoring and evaluation of the impact of government operations. As well as establishing policy priorities, the Kazakhstani government should measure and report on progress towards meeting the stated targets. As the World Bank concluded in its World Development Report 2004, “unless public expenditures are results-oriented, they will be ineffective.” During the 1990s, new initiatives in favor of performance budgeting—a method for linking policies and results—emerged, initially in developed countries and later in developing and transition economies. Performance budgeting has been closely linked to other reforms in public sector budgeting and financial management, which have aimed not only at improving public sector performance, but also at ensuring fiscal sustainability (Robinson 2004).
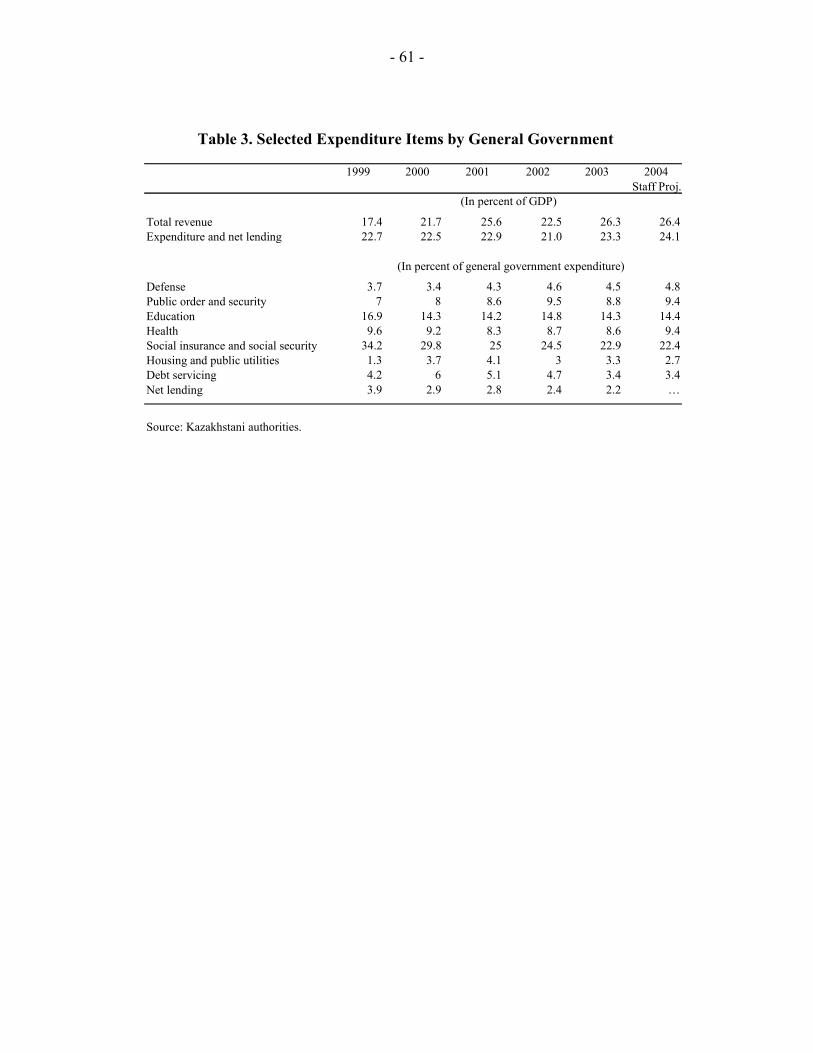
- 61 -
1999 2000 2001 2002 2003 2004Staff Proj.
Total revenue 17.4 21.7 25.6 22.5 26.3 26.4Expenditure and net lending 22.7 22.5 22.9 21.0 23.3 24.1
Defense 3.7 3.4 4.3 4.6 4.5 4.8Public order and security 7 8 8.6 9.5 8.8 9.4Education 16.9 14.3 14.2 14.8 14.3 14.4Health 9.6 9.2 8.3 8.7 8.6 9.4Social insurance and social security 34.2 29.8 25 24.5 22.9 22.4Housing and public utilities 1.3 3.7 4.1 3 3.3 2.7Debt servicing 4.2 6 5.1 4.7 3.4 3.4Net lending 3.9 2.9 2.8 2.4 2.2 …
Source: Kazakhstani authorities.
(In percent of GDP)
(In percent of general government expenditure)
Table 3. Selected Expenditure Items by General Government

- 62 -
REFERENCES
Acemoglu, D., S. Johnson, and J. Robinson, 2003 “Botswana, An African Success Story,” in Rodrik, D., ed., “In Search of Prosperity: Analytic Narratives on Economic Growth,” Princeton.
Bartsch, U., M. Katz, H. Malothra, and M. Cuc, 2004, Lifting the Oil Curse, Improving Petroleum Revenue Management in Sub-Saharan Africa (Washington: International Monetary Fund).
Bevan, D., P. Collier,, and J. Gunning, 1999, “The Political Economy of Poverty, Equity, and Growth: Nigeria and Indonesia,” A World Bank Comparative Study, Oxford University Press.
Collier, D., and J. Gunning, 1996, “Policy Towards Commodity Shocks in Developing Countries,” IMF Working Paper 96/84 (Washington: International Monetary Fund).
Davis, J., R. Ossowski, J. Daniel,and S. Barnett, 2001, “Stabilization and Savings Funds for Nonrenewable Resources–Experience and Fiscal Policy Implications,” IMF Occasional Paper No. 205 (Washington: International Monetary Fund).
Davoodi, H. R., 2002, “Assessing Fiscal Vulnerability, Fiscal Sustainability and Fiscal Stance in a Natural Resource Rich-Country,” in Republic of Kazakhstan—Selected Issues and Statistical Appendix, IMF Country Report No. 02/64, pp. 7–31 (Washington: International Monetary Fund).
Easterly, W., 2001, The Elusive Quest for Growth: Economists’ Adventures and Misadventures in the Tropics (Cambridge: MIT Press).
Eifert, E., A. Gelb, and N. Tallroth, 2003, “The Political Economy of Fiscal Policy and Economic Management in Oil-Exporting Countries” in: Davis et al., eds., “Fiscal Policy Formulation and Implementation in Oil Producing Countries,” (Washington: International Monetary Fund).
Friedman, M., 1957, A Theory of the Consumption Function (Princeton: Princeton University Press).
Gelb, A., et al., 1988, Oil Windfalls: Blessing or Curse? (New York: Oxford University Press for the World Bank).
Houerou, P., and R. Taliercio, 2002, “Medium-Term Expenditure Frameworks: From Concept to Practice. Preliminary Lessons from Africa,” World Bank, Africa Region Working Paper No. 28 (Washington: International Monetary Fund).

- 63 -
IMF, 2002, Botswana—Selected Issues and Statistical Appendix, IMF Country Report No. 02/243 (Washington: International Monetary Fund).
——2001, “Manual on Fiscal Transparency” (Washington: International Monetary Fund).
Kopits, G., and S. Symansky, 1998, Fiscal Policy Rules, IMF Occasional Paper No. 162 (Washington: International Monetary Fund).
Kuznets, P., 1988, “Why Does Overcrowded, Resource-Poor East Asia Succeed – Lessons For the Less Developed Countries,” Journal of Economic Development and Cultural Change, Vol. 36, No. 3, Supplement (April).
Rakner, L., and M. Moore, 2002, “The New Politics of Taxation and Accountability in Developing Countries,” Institute of Development Studies (IDS) Bulletin, University of Sussex, Vol. 33, No. 3, pp. 1–9, July.
Robinson, M., 2004, “Does Performance Budgeting Work? An Analytic Review of the Empirical Literature,” Forthcoming IMF Working Paper (Washington: International Monetary Fund).
Sala-i-Martin, X., and A. Subramanian, 2003, “Addressing the Natural Resource Curse: An Illustration from Nigeria,” IMF Working Paper 03/139 (Washington: International Monetary Fund).
Skancke, M., 2003, “Fiscal Policy and Petroleum Fund Management in Norway,” in: Davis, J., R. Ossowski, and A. Fedelino, eds., “Fiscal Policy Formulation and Implementation in Oil Producing Countries” (Washington: International Monetary Fund).
Wakeman-Linn, John, Chonira Aturupane, Stephan Danninger, Koba Gvenetadze, Niko Hobdari, and Eric Le Borgne, 2004, Managing Oil Wealth: The Case of Azerbaijan (Washington: International Monetary Fund)
World Bank, 1997, The State in a Changing World, World Development Report (Washington: World Bank).
——1998, “Public Expenditure Management Handbook” (Washington: World Bank).
——2003, Making Services Work for the Poor, World Development Report 2004 (Washington: World Bank).

- 64 -
VI. THE ROLE OF DEVELOPMENT INSTITUTIONS IN DIVERSIFYING THE ECONOMY1
1. In recent years, government-owned development institutions have mushroomed in Kazakhstan. The Development Bank (Box 1), Innovation Fund, Investment Fund, Marketing and Research Centers, and Export Credits and Investments Insurance Corporation were established in 2000−2003 with the aim to promote higher productivity, innovation, and implementation of new technologies. These tasks are to be accomplished by financing a wide range of projects at different stages of maturity––from supporting basic research projects to granting loans and guarantees for already established enterprises. In addition, the government intends to establish technology parks to foster high-tech industries. In 2003, T46 billion (1 percent of GDP) were allocated from the central government budget for establishing and developing these institutions and T22 billion are budgeted for this purpose in 2004.
2. The existence of state-owned financial institutions has been justified, both in the literature and in policy discussions, by possible failures in financial markets and explicit income distribution objectives. It has been argued that development institutions can alleviate market failures, thereby improving the general welfare.2 In some cases, the reason why the private market does not provide a particular category of financial service seems obvious. In the banking sector, when default rates are significant and interest rates are too low to cover failures, the market will fade away. The same applies when the expected private returns to the financial institution are significantly less than the social returns. In practice, commercial banks are often believed to be reluctant to fund long-term projects, preferring short-term projects with lower risk, and funding for the primary sector and for new technologies is scarce in many countries.
3. However, these arguments need to be balanced against potential distortions resulting from government interventions—including the misuse of resources and corruption—which are often overlooked when designing interventionist policies. The assumption that the public sector is free of favoritism and efficient to carry out the perfect intervention is very much debatable, and Kazakhstan’s experience as a part of the Soviet Union provides a striking example of an inefficient government.
4. The history of development institutions in a cross-section of countries has been mixed. While there are cases where development institutions have served their purpose well, more often than not they have failed (Box 2). Experience has shown that government-owned development institutions have frequently been subject to repressive financial measures, such as controlled interest rates, as well as to political pressures and influence from vested interests. These institutions have also remained largely unsupervised, and their (de facto or de jure) exemption from monitoring and supervision has brought many of them close to
1 Prepared by Peter Lohmus.
2 Stiglitz (1993).

- 65 -
insolvency. Furthermore, the actual operational practices and infrastructure of development banks often fail to correspond to the complexities of financial markets.
5. While acknowledging the limitations of policies to “pick winners,” the government asserts that there is a role for direct government support to enhance the competitiveness of the economy. The oil sector constitutes about 25 percent of the Kazakhstani economy, and with the rapid increase in oil production its share will grow further. Officials argue that the market may not be able to address the problems associated with the rapidly growing oil sector over the short- to medium-term. They are also worried that the country will remain a producer and exporter of raw materials, without being able to develop processing industries.
6. The concern that relying excessively on the petroleum sector may make the economy vulnerable not only to oil price fluctuations, but also expose the economy to macroeconomic imbalances, seems legitimate. However, the rationale for creating new lending institutions to support the development of the non-oil sector is weak as credit has increased rapidly: in 2003, bank credit to the private sector grew by 41 percent, after having risen by 69 percent on average during 2000−02. Banks’ lending rates have dropped significantly over the last few years. Capital markets have become more liquid, partly because of rapid development of pension funds. While some shortcomings remain, continuing financial sector reforms as well as improvements in the real sector (better corporate governance and increased transparency) and judiciary could lead to a more efficient resource allocation without direct government intervention.
Box 1. The Development Bank of Kazakhstan
The Development Bank, the largest among the development institutions, was established in 2001 with equity of $200 million for long-term financing of large projects in priority sectors of the economy, as defined by the government. The regional administration bodies and the central government are the only shareholders of the bank. The primary objective of the bank is to enhance the efficiency of investment policy, develop industrial infrastructure and processing industry, and help attract foreign and domestic investments. Standard and Poor’s has assigned a long-term issuer credit and senior unsecured debt rating of BBB- to the Development Bank, largely in expectation that full government ownership would result in strong budget support. The Development Bank’s assets amounted to $629 million as of March 2004. The bank has extended credits in the amount of $195 million, almost 30 percent of which have been allocated to the development of transport and communication infrastructure, with another 20 percent being used to finance the food industry.
7. From the outset, the Kazakhstani government has been aware of some of the risks inherent in relying on government-owned development institutions. The statutes of these institutions aim at ensuring their financial sustainability: they must be able to cover all their costs, mobilize their own resources, protect their funds against erosion from non-repayment of loans, and make a profit to finance their expansion. The institutions are not allowed to accept deposits from the public, and some of them are encouraged to obtain

- 66 -
funding from the open market. This will limit direct transfers from the public sector and raise their operational costs.3
8. However, the political will to close loss-making institutions or to implement effective reforms will be critical. This can be tested only over time, and the experiences of other countries suggest that this may prove difficult. Whether government intervention in credit markets can achieve the objectives depends on the methods chosen to implement directed credit. In some cases, political interference and soft repayment constraints lead to inefficiencies.4 The Kazakhstani authorities have acknowledged that any government intervention would be doomed to fail without the appropriate fundamental policies: encouraging macroeconomic stability, good basic education, sound and solvent financial institutions, secure property rights, and complementary public investments in infrastructure. While macroeconomic stability has been broadly achieved in recent years, significant gaps in second-generation structural reforms remain.
9. An alternative path to achieving the diversification objective would be to focus on increasing the willingness of creditors to provide long-term financing and equity capital. This could be achieved by modernizing the legal system and making contracts more readily enforceable, and by clarifying property rights and improving title transfer and loan security.5 For instance, the interest rate spread in Kazakhstan’s banking sector, which has remained above 10 percent for several years, is a significant variable reflecting the shortcomings in financial intermediation, as well as poor corporate governance and lack of information. By laying the foundations for a sound financial sector it may no longer be necessary for the government to channel its resources to private activities.
10. By creating new financial institutions not fully subject to market discipline, the authorities are exposing the public sector and the economy to a new pool of risks. One way of minimizing them would be to limit the number and growth of development institutions in Kazakhstan and create a transparent framework for selecting favored industries or enterprises to be supported and supervised under a well thought-out monitoring system. This would reduce the potential damage of political meddling and “intervention failures.” For instance, in a departure from its initial objectives, the Development Bank is already engaging in lending to the oil sector6 and has announced its plans to expand its operations to neighboring countries.
3 The Development Bank has issued Eurobonds in the total amount of $200 million.
4 Calomiris and Himmelberg (1994).
5 World Bank (1989).
6 $10 million were lent to the Atyrau oil-processing center.

- 67 -
Box 2. Development Institutions in Other Countries Policymakers in Kazakhstan have often referred to the achievements of East Asian countries, where policies to bolster industry included targeting and subsidizing credit to selected industries, protecting domestic import substitutes, and supporting failing industries. However, in the economies of Southeast Asia—Indonesia, Malaysia, and Thailand—government interventions played a much less prominent and frequently less constructive role in economic success. The capacity of these economies to administer and implement specific interventions may have been less than in Northeast Asia, where governments developed institutional mechanisms that allowed them to establish transparent performance criteria for selective interventions and for monitoring operations. In this way, the intervention occurred in a rather disciplined and performance-based manner.1 The performance of the Japanese Development Bank (JDB) has been applauded by many observes. The JDB’s sectoral credit projects were worked out through an elaborate and transparent consultation process involving councils and other advisory bodies composed of representatives from different layers of society (including workers, academics, industrialists, etc). In JDB programs it was necessary to demonstrate close connections between the stated rationales of interventionist policies and the theoretical justification. Yet, studies show mixed results regarding the successes of the JDB. 2 For example, it has been argued that directed credit failed to provide sufficient information for the private sector to start extending credit to selected industries. In at least two regions—Africa and Latin America—a number of development institutions have been closed down. Among those remaining, many are technically bankrupt and unable to attract substantial new funding.
1 World Bank (1993). The other success stories cited in the literature are two agricultural development banks: Bank for Agriculture and Agricultural Cooperatives in Thailand and Bank Rakyat Indonesia. Both banks have shown positive results after having been reformed successfully. 2 Horiuchi and Ohtaki (1987).

- 68 -
REFERENCES
Calomiris, C.W., and C. P. Himmelberg, 1994, “Directed Credit Programs for Agriculture and Industry,” Proceedings of the World Bank Annual Conference on Developmental Economics (Washington: World Bank).
Horiuchi A., and M. Ohtaki, 1987, “The Importance of Government Interventions and the Role of Bank Lending,” in Hamada, K., M. Kuroda, and A. Horiuchi, “Macroeconomic Analysis of the Japanese Economy” (Tokyo: University of Tokyo Press).
Stiglitz, J. E., 1993, “The Role of the State in the Financial Markets,” proceedings of the World Bank Annual Conference on Developmental Economics (Washington: World Bank).
World Bank, 1993, The East Asian Miracle: Economic Growth and Public Policy (New York: Oxford University Press).
——1989, World Development Report (Washington: World Bank).

- 69 -
VII. TRANSPARENCY, GOVERNANCE, AND INSTITUTIONS1
1. A possible direct link between oil wealth and corruption has been explored by several authors. Mauro (1995) finds that resource abundance leads to higher corruption.2 Aggressive rent-seeking as a result of natural resources wealth is described by Lane and Tornell (1997). Leite and Weidmann (1999) explain the high incidence of corruption in resource rich economies with the corruption-fostering effects of capital-intensive natural resource exploration. In empirical studies, Khan (1994), and Sala-i-Martin and Subramanian (2003) attribute the pervasiveness of corruption in Nigeria to the oil boom. Ross (1999) underlines that enterprises in resource extracting sectors can be expected to fare better in an environment of weak property rights than other companies, as firms earning resource rents can afford expenses for private enforcement of their property rights while still earning a normal profit. The formation of such extralegal formations, which rely on opportunities for extortion and protection rents, might thus benefit from the resource extracting sectors.
2. Transparency and accountability in the management of oil revenues are considered essential to prevent elites from appropriating oil resources (Sala-i-Martin and Subramanian 2003). In a recent analysis of African oil-producers, Katz et al. (2004) emphasize the importance of transparency in oil sector operations for: (i) allowing democratic debate on fiscal policy and spending priorities;3 (ii) avoiding corruption and the waste of public resources; and (iii) allowing forward planning. In this context, the relationship between transparency and civil society is a reciprocal one. On the one hand, a strong civil society is in the position to bring about well-functioning domestic institutions, and a more accountable and effective fiscal management. On the other hand, greater fiscal transparency by government would enhance the monitoring capacity by civil society and the general public of fiscal management. Although it does not cover all transparency issues at the sub-national level, the Fund’s Fiscal Transparency Code is a helpful tool for enhancing the transparency of national governments (Petrie 2003), also regarding the management of oil resources.
1 Prepared by Katrin Elborgh-Woytek.
2 Secondary negative effects of corruption on growth are discussed by Isham et al. (2003) who find that the negative impact on institutional quality results in a systematic and robust negative impact on growth. Leite and Weidmann (1999) also emphasize the importance of the corruption channel as an explanation for the slow growth of resource-rich economies. The negative effect of corruption on growth was found to be more pronounced in less developed economies, where institution building, i.e. improvements in monitoring capacity, was crucial but lacking.
3 The authors are critical of the argument for withholding information about resource availability on the presumption that inappropriate spending pressures would build up in case parliament and the general public had access to full information.

- 70 -
3. With respect to Fund initiatives on data dissemination and publication of reports, Kazakhstan has achieved a rather high degree of transparency, higher than several other countries in the region. Kazakhstan was quick to volunteer for ROSCs and agreed to the publication of reports when this became common practice. The 2003 fiscal ROSC concluded that the government’s credibility has been enhanced with improvements in fiscal legislation, the simplification of intergovernmental relations, and the move towards a medium-term budget framework. It recommended several measures for increasing transparency and integrating all fiscal costs and risks associated with extrabudgetary and quasi-fiscal operations into the budget (see also Chapter V).4 While Kazakhstan does not face the problem of budget deficits at present, transparency and control must be maintained over the entire public sector balance sheet.5 Priority should also be given to consolidating treasury reporting, in particular to ensure comprehensive coverage of the general government.
4. With regard to transparency in the oil sector, the U.K. Government’s Extractive Industries Transparency Initiative (EITI), implemented by the U.K. Department for Finance and International Development (DFID) is of particular importance. The EITI was endorsed internationally at the London Conference on June 17, 2003 by representatives from extracting industries and companies, and a wide range of countries, including by the Kazakhstani ambassador to Britain.6 The Kazakhstani authorities have so far not followed up on their support for the EITI at the London Conference. On October 27, 2003, an EITI conference was held in Almaty with about 100 participants, representing government, the Majlis (lower house of parliament), local NGOs, local branches of oil companies, and some international organizations. Overall, representatives of Kazakhstani NGOs have shown a thorough interest in issues related to transparency in the oil sector, as demonstrated by their participation in the EITI conference.7 The EITI supports the reconciliation of government and company reporting on revenues from resource extracting activities in order to ensure that all revenues contractually due are actually received.8 The initiative aims to enhance
4 Kazakhstan subscribes to the SDDS and publishes its Staff Reports and PINs, and there are no constraints on discussing data or specific issues in Board reports. Unlike in neighboring Azerbaijan, contracts related to oil production in Kazakhstan are neither published nor approved by parliament.
5 A soft budget constraint may weaken accountability, create moral hazard, and eventually threaten macroeconomic stability by creating contingent liabilities for the central government, which it may find hard not to pay.
6 Since this conference, Azerbaijan, Ghana, and Nigeria have volunteered to become pilot cases for the initiative, while some other countries had indicated strong interest.
7 While the number of NGOs in Kazakhstan is sizable, also comprising organizations and research institutes with a focus on economic developments, NGO activities remain constrained by bureaucratic regulations and direct government control (Ruffin and Waugh 1999).
8 As was revealed by the then Prime Minister of Kazakhstan in March 2002, about $1 billion in receipts from the sale of shares in the Tengiz oil field bypassed the budget in the second half of the 1990s and were hidden from parliament in an offshore account. A group of Kazakhstani parliamentary deputies recently authored a
(continued)

- 71 -
transparency of revenues derived from natural resources in order to address the governance problems often associated with such revenues, establish credibility, and ensure accountability. Fund Management has welcomed EITI as a valuable contribution to economic development and conflict prevention, and as consistent with the Fund’s emphasis on transparency.9 The Fund’s fiscal transparency ROSCs constitute an obvious vehicle for promoting the EITI in Fund work.
Table 1. Governance Indicators and Corruption Perceptions Index, 1996–2003 1996 1998 2000 2001 2002 2003 Average Dimension of Governance (range -2.5 to +2.5) Voice and accountability -0.94 -0.73 -0.91 ... -1.05 ... -0.91 Political stability -0.03 0.26 0.32 ... 0.52 ... 0.27 Government effectiveness -0.78 -0.69 -0.53 ... -0.80 ... -0.70 Regulatory quality -0.29 -0.35 -0.47 ... -0.74 ... -0.46 Rule of law -0.69 -0.80 -0.76 ... -0.90 ... -0.79 Control of corruption -0.79 -0.86 -0.87 ... -1.05 ... -0.89 Corruption perceptions index Score 3.0 2.7 2.3 2.4 2.6 Ranking 65/90 71/91 88/102 100/133 ... Source: Kaufman et al. 2003 and Transparency International, Annual Reports
draft law, still to be considered, aiming at requiring the government to reveal the details of subsurface use contracts signed between the government and oil companies. 9 In his speech in Almaty in November 2003, the then Managing Director of the IMF encouraged all resource-rich countries in the region to become active participants.

- 72 -
Box 1. Transparency and Corruption
The quality of governance in Kazakhstan has recently been assessed by the World Bank (Kaufman et al. 2003). Based on several hundred individual variables measuring perceptions of governance, Kaufmann et al. (2003) construct composite indices for six dimensions of governance: voice and accountability (measuring civil liberties and political rights), political stability, government effectiveness, regulatory quality, rule of law, and control of corruption. The index assesses (i) the process by which governments are selected, (ii) the capacity of the government to effectively formulate and implement sound policies, and (iii) the respect of citizens and the state for the institutions that govern economic and social interactions among them. The analysis uses 25 separate data sources established by 18 organizations for a total of 199 countries in 1996, 1998, 2000, and 2002. As estimates are normally distributed with a mean of zero and a standard deviation of one in each period, virtually all scores range from -2.5 to 2.5, with higher numbers corresponding to better results. For the four years assessed, most governance indicators for Kazakhstan were substantially negative (Table 1). Only the political stability index shows positive values and an improvement between 1996 and 2002. The remaining five indicators deteriorated during this period, with voice and accountability, and control of corruption receiving the lowest scores. According to another World Bank study (World Bank 2002a), corruption is wide-spread in Kazakhstan. Respondents to surveys reported that corruption was prevalent in law enforcement, courts, and customs and tax authorities. Over the previous twelve months, 51 percent of enterprises and 31 percent of households had encountered bribery. While households with higher incomes tend to bribe to obtain speed of services, poorer households where found to pay bribes for access to public services. Close to 10 percent of the population had faced a situation where medical care had been necessary, but unavailable due to their inability to pay bribes. University education was stated to be available only to those who can afford unofficial payments. Higher-level corruption in the corporate sector also appears to be pervasive in Kazakhstan. With regard to the corporate environment, the World Business Environment Survey (World Bank 2002b) found that companies operating in Kazakhstan pay on average 2 percent of their sales income in unofficial payments. Kazakhstan’s oil sector has in the past been affected by non-transparent transactions. For example, unofficial payments related to the acquisition of a share in the Tengiz oil field are under investigation by the U.S. judiciary. In this connection, the Swiss authorities, have frozen a number of bank accounts, allegedly owned by former and current Kazakhstani officials. Since the year 2000, Kazakhstan has been included in the Corruption Perceptions Index published by Transparency International.1 This composite index ranks countries by the degree to which corruption among public officials and politicians is perceived to exist, on a scale ranging from 0 (highly corrupt) to 10 (highly clean); it is based on multi-year surveys among the business community, country analysts, and the general public. Kazakhstan’s score fell from 3.0 in 2000 to 2.4 in 2003, indicating a perception of increased prevalence of corruption.2 While Kazakhstan had achieved the highest rating of the seven Former Soviet Union countries (except the Baltic countries) assessed in 2000, it fell behind Belarus, Armenia, and Russia in 2003, when all CIS countries except Turkmenistan were ranked. Transparency International, together with other private/non-government organizations, has recently started an initiative to promote the publication of financial indicators for oil companies.
1 Transparency International launched its Corruption Perception Index in 1995; the reliability of data sources varies widely between countries. 2 While the country’s ranking deteriorated through 2002, it improved somewhat in 2003. The number of underlying surveys for Kazakhstan increased from 3 in 2000 and 2001 to 4 in 2002, and further to 7 in the year 2003. Compared to other countries, the standard deviation for Kazakhstan was rather high, indicating high variation between the outcomes of the different surveys.

- 73 -
5. In September 2003, the Kazakhstani government strengthened its anti-corruption legislation, which had originally been passed in 1998. This law provides for criminal, administrative, and disciplinary sanctions. Amendments to the Criminal Code, Criminal Procedures Code, and Administrative Code, and the laws on Civil Service, Labor, and anti-corruption measures were made with the aim to enhance the efficiency of anti-corruption measures in the Civil Service, budgetary organizations, and state-owned enterprises. The amendments widen the definition of corruption and the circle of public officials covered by anti-corruption laws and regulations, at the same time increasing the penalties.
6. The Agency for the Fight Against Economic and Corruption Crimes was established in December 2003, as successor agency to the Financial Police, which did not have a clear anti-corruption mandate. It enjoys a semi-autonomous status under the Ministry of the Interior. The institutional modalities of the Agency, which is based in Astana with local offices, are still in the process of being specified.10 The Agency operates on the basis of the Anti-Corruption Law and investigates economic crimes, tax crimes, and corruption related crimes. Once an investigation has been completed and the allegation of corruption substantiated, the case is handed over to other public bodies, such as criminal investigators or the prosecutor’s office. The Agency aims to reduce government interference in the activities of small- and medium-scale enterprises and, to this end, initiated a moratorium on all inspections of enterprises, which was upheld for several months in 2003. The Agency is currently assessing anti-corruption legislation and measures in a large number of countries, in order to develop best practices for Kazakhstan. Through the Ministry of Foreign Affairs it has launched an initiative for Kazakhstan to join international agreements on the fight against corruption.11 The Constitutional Council, which previously focused on economically relevant legislation, now intends to examine the reasons for corruption.
7. To date, Kazakhstan’s management of its petroleum resources has been prudent and there have been few, if any, indications of the resource curse. However, as income from oil is expected to multiply over the coming decades, it will become crucial to build institutions that are sufficiently independent to withstand likely pressures for spending, some of which could be wasteful. As part of the institutional development, accountability of all resource related transactions will need to be enhanced considerably in order to reduce the risks. In this area, Kazakhstan could benefit (as it has done in other areas such as the financial system) from following best established world practices.
10 On April 20, 2004, Sarybay Kalmurzaev, former chief of the presidential administration, was named Chairman of the Agency.
11 See Box 1 for views on the present state of transparency and governance in Kazakhstan.

- 74 -
REFERENCES
Isham, J., M. Woolcock, L. Pritchett, and G. Busby, 2003, “The Varieties of Resource Experience: How Natural Resource Export Structures Affect the Political Economy of Economic Growth," mimeo (Harvard University, Middlebury College, and World Bank).
Katz, M., U. Bartsch, H. Malothra, and M. Cuc, 2004, “Lifting the Oil Curse. Improving Petroleum Revenue Management in Sub-Saharan Africa” (Washington: International Monetary Fund)
Kaufmann, D., A. Kraay, and M. Mastruzzi, 2003, “Governance Matters III: Governance Indicators for 1996–2002” (Washington: World Bank).
Khan, A., 1994, The Political Economy of Oil (Oxford: Oxford University Press).
Kuralbayeva, K. and Michael L. Wyzan, 2001, "Is Kazakhstan Vulnerable to the Dutch Disease?" Center for European Integration Studies, Working Paper B01-29.
Lane, P., and A. Tornell, 1997, “Voracity and Growth,” Harvard Institute for Economic Research Discussion Paper No. 1807.
Mauro, P., 1995, “Corruption and Growth,” The Quarterly Journal of Economics, Vol. 90, pp. 681–712.
Petrie, M., 2003, “Promoting Fiscal Transparency: The Complementary Roles of the IMF, Financial Markets, and Civil Society, IMF Working Paper 03/199 (Washington: International Monetary Fund).
Ross, M. L., 1999, “The Political Economy of the Resource Curse,” World Politics, Vol. 51, pp. 297–322.
Ruffin, M. Holt and Daniel C. Waugh, 1999, Civil Society in Central Asia (Seattle) Sala-i-Martin, X., and A. Subramanian, 2003, “Addressing the Natural Resource Curse: An
Illustration from Nigeria,” IMF Working Paper 03/139 (Washington: International Monetary Fund).
Transparency International: Annual Reports, Berlin
World Bank, 2002a, “Kazakhstan Governance and Service Delivery: A Diagnostic Report” (Washington: World Bank).
_________, 2002b: World Business Environment Survey (WBES), http://www.worldbank.org/wbi/governance/data.html