republic of ghana 2019 - energy commission electricity supply plan.pdfii 2019 electricity supply...
TRANSCRIPT
2019 Electricity Supply Plan for the Ghana Power System
2019 Power Supply Outlook with Medium Term projections
REPUBLIC OF GHANA

i 2019 Electricity Supply Plan
2019 ELECTRICITY SUPPLY PLAN FOR
GHANA
An Outlook of the
Power Supply Situation
for 2019 and
Highlights of Medium
Term Power
Requirements

ii 2019 Electricity Supply Plan
ACKNOWLEDGEMENT
We hereby wish to express our deepest appreciation to the Supply Plan Committee which is made up
of experts from Energy Commission, GRIDCo, VRA, BPA, ECG and NEDCo as follows:
Frederick A. Okang – Ghana Grid Company Limited
Frank Otchere – Ghana Grid Company Limited
Kassim Abubakar – Ghana Grid Company Limited
Monica Debrah (Mrs.) – Ghana Grid Company Limited
Abdul N. Wahab – Volta River Authority
Afua A. Thompson (Mrs.) – Volta River Authority
Dr. Joseph Essandoh-Yeddu – Energy Commission
Godfred Mensah – Electricity Company of Ghana
Ebenezer Baiden – Electricity Company of Ghana
Mohammed Aminu – Electricity Company of Ghana
Elvis Demuyakor – Northern Electricity Company Limited
Mohammed T. Tampuri – Northern Electricity Company Limited
Anthony Osafo - Kissi – Bui Power Authority
Justice Okyere – Bui Power Authority
Hamis Ussiff – Ghana National Petroleum Commission
Acknowledgements also go to all Wholesale Suppliers, Power Distribution Companies, Bulk
Customers and other key stakeholders who provided relevant information to firm up maintenance
programmes, potential new projects and other information required for developing the Supply Plan.

iii 2019 Electricity Supply Plan
EXECUTIVE SUMMARY
The Electricity Supply Plan (ESP) for 2019 is being submitted by the Electricity Supply Plan
Committee as per the requirement of the Ghana Electricity Grid Code.
The 2019 ESP presents an outlook of power demand and supply for 2019 taking into consideration all
the committed projects and existing generation sources. It assesses the available hydro generation
taking into consideration low reservoir elevations at Akosombo and Bui. Additionally, it presents fuel
requirements and associated cost to meet electricity demand in 2019 and evaluates the associated power
evacuation requirements to ensure reliable power supply. The 2019 ESP, further highlights the
anticipated challenges in meeting the 2019 electricity demand and makes recommendations on the best
course of action to be taken to ensure reliable power supply in 2019. Finally, it further provides an
outlook of electricity demand and supply for the next five years.
Review of 2018 Performance
Peak and Energy Demand
The projected Ghana peak demand for 2018 was 2,523.49 MW. However, by the end of the year, the
power system had recorded a maximum coincident peak demand of 2,525.0 MW. This occurred on
December 17, 2018. The 2018 peak represents an increase of 367.0 MW or growth of 17.01% over the
2017 peak of 2,158.0 MW.
The total energy consumption including losses was 15,960.36 GWh as against the projected of
16,302.09 GWh. A total of 14,308.08 GWh was consumed during the same period in 2017, thus, the
consumption in 2018 represented a growth of 11.55% or 1, 652.28 GWh increase over that of 2017.
Energy Supply
The total energy supplied (including imports from Côte d’Ivoire) over the period was 15,960.36 GWh.
It comprised 6,017.36 GWh from hydro, 9,803.15 GWh from thermal and 139.70 GWh of Imports.
The generation mix at the end of the period was therefore 39.60% hydro, 58.14% thermal and 2.26%
import.
Transmission Losses
The total system transmission losses recorded during the period was 707.33 GWh which is 4.43% of
total transmitted energy of 15,960.36 GWh, representing 19.01% increase over the projected
transmission losses of 594.30 GWh.
In 2017 on the other hand, the network recorded total transmission losses of 587.11 GWh. The 2018
figure thus represents 1.2 % increase over the 2017 figure.

iv 2019 Electricity Supply Plan
Transmission Lines and Feeder Availability
The Average Feeder Availability (AFA) in 2018 was 99.84 % and the System Average Availability
(SAA) for the transmission grid was 99.58%. The System Average Availability (SAA) for the
transmission grid was 99.48 % in 2018
2019 Demand Outlook
The projected system peak demand for 2019 is 2,665.68 MW. The Committee also considered a high
case scenario and projected 2,796.92 MW for the high case scenarios. The projected 2019 reference
peak of 2,665.68 represents an increase of 140.68 MW or in percentage terms, a growth of 5.54 % over
the 2018 peak demand of 2,525 MW which occurred on December 17, 2018.
The projected energy consumption including transmission system losses for 2019 is 17,237.79 GWh
and 18,013.96 GWh for base and high case respectively. The base case consumption for 2019
compared to the 2018 actual consumption of 15,960.36 GWh represents a growth of 8% (1,277.43
GWh).
2019 Supply Outlook
Hydro Power Generation for 2019
The total projected hydro generation for 2019 is 5,670 GWh. This would be made up of 4,258.44 GWh,
811.50 GWh and 650 GWh for Akosombo, Kpong and Bui Generating Stations respectively.
Akosombo Hydro Elevation
The recorded maximum lake elevation at the end of 2018 inflow season was 263.67 feet, a rise of 23.67
feet above the minimum operating level of 240 feet. The total net inflow recorded in 2018 was 40.01
MAF, which implies that an above average inflow was obtained in 2018.
NB: the average inflow is 25 MAF.
Bui Hydro Elevation
With a year-start elevation of 176.97 MASL in 2019, and the total estimated total energy production
of 600 GWh for 2019, the year-end elevation is projected at 175.21 MASL.
Thermal Power Generation for 2019
The Projected Dependable Thermal Capacity for 2019 is 3,456 MW. This is made up of 2,906 MW
from existing and 550 MW of committed Thermal Plants. The projected total thermal energy
generation for 2019 is 11,460.11 GWh from VRA Plants and IPPs.
Renewable Energy (RE) Generation for 2019
The total RE (currently only Solar PV) generation for 2019 is projected at 42.64 GWh. This is made
up of VRA (Navrongo), BXC (Winneba) and Meinergy (Saltpond) as shown in the Table below.

v 2019 Electricity Supply Plan
All of these utility-scale Solar PV Plants are connected on the Medium Voltage Distribution System.
Imports
In 2019, no programmed import is expected apart from the usual inadvertent exchanges between the
two utilities, CIE and GRIDCo.
Existing and Committed generation capacity for 2019
Plants
Installed
Capacity Dependable Capacity
Fuel Type
(MW) (MW)
Akosombo GS 1020 900 Hydro
Kpong GS 160 105 Hydro
TAPCO (T1) 330 300 LCO/Gas
TICO (T2) 340 320 LCO/Gas
TT1PP 110 100 LCO/Gas
TT2PP 80 70 Gas
KTPP 220 200 Gas/ Diesel
VRA Solar Plant 2.5 0 Solar
TOTAL VRA 2,263 1,995
Bui GS 404 360 Hydro
CENIT 110 100 LCO/Gas
AMERI 250 230 Gas
SAPP 161 200 180 Gas
SAPP 330 360 340 LCO/Gas
KAR Power 470 450 HFO
AKSA 370 350 HFO
BXC Solar 20 0 Solar
Meinergy Solar 20 0 Solar
Trojan 44 39.6 Diesel/Gas
Genser 22 18 Gas
CEN Power 360 340 LCO/Gas
Amandi 190 190 LCO/Gas
TOTAL IPP 2,820 2,598
TOTAL (VRA, Bui & IPPs) 5,083 4,593
Natural Gas Quantities and Availabilities
Two main supplies of natural gas were considered as follows:
Nigeria Gas – Average supply of 60 mmscf/day is assumed from January to December 2019
Ghana Gas
Jubilee Fields- a maximum of 73 mmscf/day in 2019.
TEN Fields –a maximum of 24 mmscf/day in 2019.
Sankofa Fields –a maximum of 180 mmscf/day in 2019.

vi 2019 Electricity Supply Plan
Distribution Outlook in 2019
ECG Network
Based on sub-transmission reliability studies undertaken by ECG, a number of interventions and
projects were initiated in 2018 and are expected to be completed in 2019 to resolve various constraints
of low voltages, feeder and transformer overloads during firm and non – firm conditions. Some of the
key projects under construction are the following:
Installation Voltage of Regulators at Nsawam, Mampong and Aburi to improve voltages
Construction of the Pokuase BSP, this project is under construction- Upon completion it will
boost voltage support to Dodowa, Mampong, Aburi and Ofankor. it will also improve reliability
by serving as an alternative BSP to Achimota and Afienya BSPs.
Construction of Afienya BSP- this will boost voltage at Dodowa, Mampong and Aburi
The completion of these Projects is expected to improve supply reliability to the various ECG
customers.
NEDCo Network
Power supply reliability in NEDCo Areas is generally good. However, reliability in some areas of the
network has been lower than expected due to over extension of these lines and over-ageing resulting
in high technical losses. Some of these lines have been extended, as part of Self Help Electrification
Program (SHEP) implementation, beyond technically allowable distances. Some interventions,
however, have been made on some of these lines resulting in improved supply reliability on them.
Medium-Term (2020 – 2024) Demand and Supply Outlook
The Medium-Term (2020-2023) Demand and Supply Outlook as shown in the Figure below suggests
that there will be adequate generation to meet demand for the period 2020-2023 for the high case
growth scenario. However, an additional generation capacity of about 130 MW is required to be
procured, installed and commissioned into service by January, 2024 to meet the demand and the
18%.reserve margin requirement.

vii 2019 Electricity Supply Plan
Gas Supply Outlook
By the end of 2019, the infrastructure bottlenecks in the gas supply are expected to be resolved. Gas
supply is therefore expected to revert to committed levels as shown in Table 36. In addition to the
existing supply sources, two LNG projects are expected to add additional 430 MMscfd by 2022.
Medium Term (2020 - 2024) Gas Delivery Profile (MMscfd)
2020 2021 2022 2023 2024
Jubilee FV 83 80 83 83 -
Greater Jubilee - - - - 80
TEN AG 26 26 26 26 26
Sankofa NAG 180 180 180 180 180
Aker - - - - -
Takoradi LNG - - 180 180 180
Tema LNG 100 250 250 250 250
N-Gas 70 70 70 70 70
Total Gas Supply 459 606 789 789 789
Strategic Medium Term Transmission Infrastructure Requirements
The results of the extensive system network analyses carried out using the projected demand and supply
scenario indicates that there would be the need for the following transmission line and equipment
additions in the medium term to meet the required supply reliability indices, and this is in addition to
the investment identified under Section 5. The following are the critical transmissions additions
required:

viii 2019 Electricity Supply Plan
Upgrade of 161kV Aboadze-Takoradi-Tarkwa-Prestea
Construction of a second 330 kV Prestea - Dunkwa – Kumasi line
Upgrade of 161kV Aboadze-Mallam
Construction of a second 330 kV Aboadze – A4 BSP circuit
Construction of a double circuit 330 kV line from A4BSP to Kumasi
Eastern Transmission Corridor Projects:
161kV Kpando – Juale Line
161kV Juale – Yendi Line
Construction of a 330 kV substation at Dunkwa with a link to the existing 161 kV substation
Construction of a third Bulk Supply Point in Kumasi

ix 2019 Electricity Supply Plan
CONCLUSION
Demand and Supply Outlook
a) The 2019 total system demand is projected to be 2,665.68 MW (base case), representing a 5 %
growth over the 2018 peak demand of 2,525 MW. The corresponding projected energy
consumption for 2019 is 17,237.79 GWh of which:
b) Hydro supply will be 5,669.95 GWh representing 33% of the total energy supply;
Thermal supply will be 11,460.11 GWh representing 66.9% of total energy supply; and
Renewables supply will be 57.7 GWh representing 0.1% of total energy supply
c) Total projected energy exports are 915.81GWh for 2019.
d) VALCO is expected to operate on two pot lines with projected total consumption of 1,283.8
GWh.
e) There is the need to dispatch Akosombo and Bui Hydro Plants conservatively throughout 2019
to ensure that the two reservoirs are not drawn down below their minimum operating levels to
guarantee sustainable operations in the coming years
f) In terms of fuel, the following quantities of the various fuel types are required;
Natural Gas - 80,241,689 MMbtu
HFO - 5,308,727 barrels
g) In terms of fuel cost, an annual total of approximately 1.04 billion USD is required, averaging
a monthly total of some US$ 86.64 Million.
h) In 2019, Aboadze will be the largest generation enclave in Ghana with an installed capacity of
1,540MW
i) Under maximum west generation scenario with KarPower in the West, the autotransformers at
Volta will become overloaded leading with low voltages in the East (Accra/Tema Area).
Requirements for Grid Reinforcement
a) The transmission system has inadequate available transfer capacity to meet the demand
requirements of the major load centres (of Accra, Kumasi, Tarkwa, etc.) particularly at peak.
This situation would result in low voltages, overloading of lines and increased overall
transmission system losses.
b) For radial lines and single transformer stations, significant percentage of network loads could
be islanded in the event of outage of such lines and transformers.
c) In normal operation, there would be congestion on the Volta –Accra East – Achimota - Mallam
transmission corridor especially when there is high generation in the east.
d) Low voltages would be experienced at Kumasi, Accra and surrounding areas due to poor
customer-end power factors.
e) A fair East-West balance in generation provide better system stability and minimal overall
transmission system losses.

x 2019 Electricity Supply Plan
Distribution Systems
a) The commissioning of the Accra Central BSP has increased the level of reliability and
distribution capacity to meet the growing demand within the ECG network in Accra. This has
resolved the loading constraints on selected 33 kV feeders and reduce technical losses within
the ECG Accra network.
b) In a bid to improve voltages in Nsawan and Aburi, ECG has installed a number of Voltage
Regulators to improve on reliability and quality of supply. Furthermore, a number upgrade
projects have either been commissioned into service or under construction. This is to increase
distribution capacity and reliability of supply customers.
c) Power supply reliability in NEDCo Areas is generally good. However, reliability in some areas
of the network has been lower than expected due to over extension and over-ageing resulting
in high technical losses. Some interventions, however, have been made on some of these lines
resulting in improved supply reliability on them.
Medium Term Supply
a) For the high case growth scenario, it is expected that with the deployment of the committed
generation capacity, there would be adequate dependable generation capacity to meet projected
demand for the period 2020 - 2023 with a maximum reserve margin of 39%.
b) The system peak demand for high case growth scenario is projected to be 4,394 MW by 2024
and a corresponding dependable generation capacity of 5,058 MW. Hence, to meet the
reliability requirement of the Ghana power system, an additional reserve margin of 18%
representing 791 MW is required. This adds up to a total required supply capacity of 5,185
MW. This compared to the projected supply capacity implies a deficit of about 130 MW. Thus,
there is the need to procure an additional generation capacity of 127 MW in time for
commissioning by January, 2024.

xi 2019 Electricity Supply Plan
RECOMMENDATIONS
Based on the above conclusions, the following recommendations are made:
a) The ongoing transmission expansion projects should be expedited and completed in 2019 to
ensure that the peak demand can be supplied. These are
Volta – Achimota – Mallam Transmission Line Upgrade Project
Aboadze – Prestea - Kumasi 330 kV Transmission Line Project
Kumasi – Bolgatanga 330 kV transmission line Project
b) GRIDCo should explore the possibility of installing the 3rd autotransformer at Volta Substation
c) A well-coordinated maintenance programme should be pursued by both GRIDCo and the
Generating Companies (GENCOs).
d) Fuel supply security and adequacy remains the single most important risk to power supply
reliability in Ghana. In this vein, it is strongly recommended that all the relevant sector agencies
stakeholders work conscientiously together to ensure that fuel supply is adequate and secure at
all times.
e) For the medium term, the reserve margin for the 2024 falls short of the required reserve margin
of 18% (for reliability of supply). Therefore, additional generation capacity would need to be
procured in time for commissioning by the beginning of 2024.
f) In order to meet the transmission reliability indices, the following are the critical transmissions
additions and upgrades are required:
Upgrade of 161kV Aboadze-Takoradi-Tarkwa-Prestea
Construction of a second 330 kV Prestea - Dunkwa – Kumasi line
Upgrade of 161kV Aboadze-Mallam transmission lines
Construction of a second 330 kV Aboadze – A4 BSP circuit
Construction of a double circuit 330 kV line from A4BSP to Kumasi
Construction of a 330 kV substation at Dunkwa with a link to the existing 161 kV
substation

xii 2019 Electricity Supply Plan
TABLE OF CONTENTS
EXECUTIVE SUMMARY ............................................................................................................................................... III
TABLE OF CONTENTS ................................................................................................................................................ XII
1. INTRODUCTION ..................................................................................................................................................... 1
2. SYSTEM PERFORMANCE REVIEW FOR 2018 ................................................................................................ 2
2.1 PEAK DEMAND ........................................................................................................................................................ 2 2.2 ENERGY CONSUMPTION .......................................................................................................................................... 3 2.3 LOSSES .................................................................................................................................................................... 3 2.4 ENERGY EXCHANGES (EXPORT AND IMPORT) ......................................................................................................... 3 2.5 ENERGY GENERATION ............................................................................................................................................. 3 2.6 HYDRO RESERVOIR OPERATION .............................................................................................................................. 7
2.6.1 Akosombo Reservoir ...................................................................................................................................... 7 2.6.2 Inflows in 2018 .............................................................................................................................................. 7
2.7 BUI RESERVOIR ....................................................................................................................................................... 8 2.8 GENERATING PLANTS AVAILABILITIES IN 2018....................................................................................................... 9 2.9 QUALITY OF SUPPLY................................................................................................................................................ 9
2.9.1 System Frequency .......................................................................................................................................... 9 2.9.2 System Voltages ........................................................................................................................................... 10
2.10 TRANSMISSION NETWORK PERFORMANCE ....................................................................................................... 10 2.10.1 Feeder Availability ................................................................................................................................. 10 2.10.2 Transmission Lines ................................................................................................................................. 10
2.11 TRANSFORMER CAPACITY ................................................................................................................................ 11 2.12 NEW INSTALLATIONS IN 2018 ........................................................................................................................... 12
3. DEMAND OUTLOOK FOR 2019 ......................................................................................................................... 13
3.1 PEAK DEMAND ...................................................................................................................................................... 13 3.2 SUMMARY OF 2019 PEAK AND ENERGY DEMAND FORECAST................................................................................ 14 3.3 OUTLOOK OF ENERGY CONSUMPTION ................................................................................................................... 15 3.4 ECG ENERGY AND DEMAND FORECAST METHODOLOGY AND ASSUMPTIONS ...................................................... 17 3.5 NEDCO ENERGY AND DEMAND FORECAST METHODOLOGY AND ASSUMPTIONS ................................................. 19
3.5.1 Residential Energy Sales Forecast .............................................................................................................. 19 3.5.2 Non-Residential Energy Sales Forecast ...................................................................................................... 19 3.5.3 Special Load Tariff (SLT) Energy Sales Forecast ....................................................................................... 20
3.6 PROJECTED MONTHLY PEAK AND ENERGY DEMAND FOR 2019 ............................................................................ 21
4. SUPPLY OUTLOOK .............................................................................................................................................. 24
4.1 GENERATION SOURCES.......................................................................................................................................... 24 4.2 SUMMARY OF GENERATION SOURCES ................................................................................................................... 24 4.3 HYDRO POWER GENERATION FOR 2019 ................................................................................................................ 25
4.3.1 Akosombo & Kpong Hydro ......................................................................................................................... 25 4.3.2 Bui Hydro .................................................................................................................................................... 25
4.4 THERMAL POWER GENERATION FOR 2019 ............................................................................................................ 26 4.5 NEW GENERATION SOURCES ................................................................................................................................. 27 4.6 KEY ASSUMPTIONS UNDERPINNING THE SUPPLY PLAN ......................................................................................... 28
4.6.1 Planned Maintenance .................................................................................................................................. 28 4.6.2 Natural Gas Quantities and Availabilities .................................................................................................. 30 4.6.3 West to East Reverse Flow .......................................................................................................................... 30 4.6.4 Fuel Allocation ............................................................................................................................................ 30 4.6.5 Fuel Price .................................................................................................................................................... 31
4.7 DEMAND - SUPPLY ANALYSIS ............................................................................................................................... 32 4.8 PROJECTED CAPACITY SITUATION ......................................................................................................................... 35 4.9 FUEL REQUIREMENT .............................................................................................................................................. 35
4.9.1 Monthly Fuel Requirement .......................................................................................................................... 37 4.10 ESTIMATES OF FUEL COST ................................................................................................................................ 38
5. TRANSMISSION SYSTEM PERFORMANCE ................................................................................................... 39
4.11 ................................................................................................................................................................................. 39 5.1 STATUS OF GHANA TRANSMISSION GRID .............................................................................................................. 39 5.2 TRANSMISSION LINE, FEEDER AND SUBSTATION AVAILABILITY ........................................................................... 39 5.3 STEADY STATE NETWORK ANALYSIS .................................................................................................................... 40
5.3.1 Technical Adequacy Criteria....................................................................................................................... 40 5.3.2 Summary of Results for the Steady State Network Analysis ........................................................................ 41

xiii 2019 Electricity Supply Plan
5.3.3 Radial Lines and Single Transformer Stations ............................................................................................ 45
6. POTENTIAL SUPPLY CHALLENGES IN 2019 ................................................................................................ 46
6.1 MANAGING THE HYDRO RISK ................................................................................................................................ 46 6.2 THERMAL FUEL SUPPLY RISK ............................................................................................................................... 46
6.2.1 Gas Supply Disruptions ............................................................................................................................... 46 6.3 SUPPLY RELIABILITY OF CUSTOMERS SERVED BY RADIAL LINES AND SINGLE TRANSFORMER STATIONS ............ 46
6.3.1 Radial lines.................................................................................................................................................. 46 6.3.2 Single Transformer Stations ........................................................................................................................ 47 6.3.3 Power Evacuation ....................................................................................................................................... 47
7. DISTRIBUTION OUTLOOK ................................................................................................................................ 48
7.1 ECG NETWORK ..................................................................................................................................................... 48 7.2 NEDCO DISTRIBUTION NETWORK ........................................................................................................................ 48
7.2.1 Sunyani-Berekum-Dorma/Sampa 34.5 kV Line ........................................................................................... 48 7.2.2 Network Reinforcement and Technical Loss Reduction Strategy to Resolve Challenges ............................ 48 7.2.3 Yendi-Bimbilla-Kete Krachi 34.5kV Line .................................................................................................... 49 7.2.4 Network reinforcement and technical loss reduction strategy to resolve challenges .................................. 49 7.2.5 Yendi-Gushegu-Gambaga-Bunkprugu 34.5kV Line .................................................................................... 49 7.2.6 Network Reinforcement and Technical Loss Reduction Strategy to Resolve Challenges ............................ 49 7.2.7 Tamale-Dalun-Nasia 34.5kv Line ............................................................................................................... 50 7.2.8 Network Reinforcement and Technical Loss Reduction Strategy to Resolve Challenges ............................ 50 7.2.9 Wa-Jirapa-Nandom-Hamile 34.5kV Line .................................................................................................... 50 7.2.10 Network Reinforcement and Technical Loss Reduction Strategy to Resolve Challenges ....................... 50 7.2.11 Obsolete Switchgears at Navrongo and Bawku Substations .................................................................. 50 7.2.12 Network Reinforcement and Technical Loss Reduction Strategy to Resolve Challenges ....................... 51 7.2.13 Rampant Power Theft Militating Against Reliable Supply ..................................................................... 51 7.2.14 Commercial Loss Reduction Strategy ..................................................................................................... 51
8. OVERVIEW OF MEDIUM-TERM SUPPLY: 2020 - 2024 ................................................................................ 52
8.1 DEMAND OUTLOOK ............................................................................................................................................... 52 8.2 PROJECTED SUPPLY OUTLOOK .............................................................................................................................. 53
8.2.1 Existing Generation .................................................................................................................................... 53 8.2.2 Committed Generation Projects .................................................................................................................. 53 8.2.4 Additional Generation Requirement ........................................................................................................... 55
8.3 MEDIUM TERM TRANSMISSION NETWORK EXPANSION/UPGRADE REQUIREMENTS .............................................. 55
9. CONCLUSION ........................................................................................................................................................ 57
9.1 DEMAND AND SUPPLY OUTLOOK .......................................................................................................................... 57 9.2 REQUIREMENTS FOR GRID REINFORCEMENT ......................................................................................................... 57 9.3 DISTRIBUTION SYSTEMS ........................................................................................................................................ 58 9.4 MEDIUM TERM SUPPLY ......................................................................................................................................... 58
10. RECOMMENDATIONS ........................................................................................................................................ 59
11. APPENDICES ......................................................................................................................................................... 60

xiv 2019 Electricity Supply Plan
Table of Tables Table 1: System Projected and Actual Peak Demand for 2018 ............................................................................................ 2
Table 2: Summary of Energy Consumption for 2018, actual vs. projected.......................................................................... 3
Table 3: Projected versus Actual Energy Generation in 2018 .............................................................................................. 4
Table 4: Plants projected and actual energy generated ......................................................................................................... 5
Table 5: Generating Plants’ actual and estimated availability for the year 2018 ................................................................. 9
Table 6: Bus Voltages at Bulk Supply Points in 2018 ........................................................................................................ 10
Table 7: The percentage transmission line availability in 2018 ......................................................................................... 11
Table 8: Transformer additions for year 2018..................................................................................................................... 11
Table 9: Transformer peak loadings for year 2018 ............................................................................................................. 12
Table 10: Commissioned Projects in 2018 .............................................................................................................................. 12
Table 11: Summary of 2019 Projected Peak Demand ........................................................................................................ 14
Table 12: Summary of 2019 Energy Consumption by Customer ....................................................................................... 16
Table 13: Coefficients for Natural Log of Non SLT model ............................................................................................... 17
Table 14: Coefficients for SLT model ................................................................................................................................ 18
Table 15: Summary of Projected 2019 Monthly Energy (GWh) Consumption –base case scenario .................................. 21
Table 16: Summary of Projected 2019 Monthly Peak (MW) demand – Base Case Scenario ............................................. 22
Table 17: Summary of Projected 2019 Monthly Peak (MW) demand – High Case Scenario ............................................ 22
Table 18: Summary of Projected 2019 Monthly Peak (MW) demand – High Case Scenario ............................................ 23
Table 19: Existing Generation Sources for 2019 ................................................................................................................ 24
Table 20: Existing Generation Sources ............................................................................................................................... 26
Table 21: Existing Generation Sources ............................................................................................................................... 27
Table 22: Committed Generation Plants for 2019 ............................................................................................................... 27
Table 23: 2019 Planned Maintenance ................................................................................................................................. 28
Table 24: 2019 Monthly Gas Delivery Profile (MMscfd) – due to infrastructure constraints ........................................... 30
Table 25: Projected Monthly Generation in GWh .............................................................................................................. 32
Table 26: 2019 Projected energy and Supply Balance in GWh .......................................................................................... 33
Table 27: Projected Monthly Capacity Situation for 2019 .................................................................................................. 35
Table 28: Summary of Annual Fuel Requirements ............................................................................................................. 36
Table 29: Monthly fuel requirements and associated costs ................................................................................................. 37
Table 30: Breakdown of Estimated Fuel Cost for 2019 ...................................................................................................... 38
Table 31: Criteria, normal condition ................................................................................................................................... 40
Table 32: Criteria, contingency condition ........................................................................................................................... 40
Table 33: Projected High Case Energy Demand (GWh) (2020- 2024) ............................................................................... 52
Table 34: Projected High Case Peak Demand (MW) (2020- 2024) .................................................................................... 53
Table 35: Projected High Case Demand and Supply balance (2020- 2024) ...................................................................... 54
Table 36: Medium Term (2020 - 2024) Gas Delivery Profile (MMscfd) .......................................................................... 55

1 2019 Electricity Supply Plan
1. INTRODUCTION
The 2019 ESP presents an outlook of power demand and supply for 2019 taking into consideration all
the committed and existing generation sources. It assesses available hydro generation sources taking
into consideration reservoir elevations at Akosombo and Bui. It also looks at thermal generation and
its fuel requirements and associated costs. The anticipated challenges to meeting the 2019 demand is
presented and appropriate recommendations made to ensure reliable power supply situation in 2019.

2 2019 Electricity Supply Plan
2. SYSTEM PERFORMANCE REVIEW FOR 2018
The review of the 2018 Ghana Power System performance includes amongst others, the comparison
of the actual peak demand, consumption and energy generation against the projection made for the
period. It also assesses the performance of the power system with respect to voltages, system frequency
and transmission losses.
2.1 Peak Demand
In 2018, it was projected that the maximum coincident peak demand would be 2,523.49 MW.
However, by the end of the year, the power system had recorded a maximum coincident peak demand
of 2,525.0 MW. This occurred on December 17, 2018. This value represents an increase of 1.51 MW
or 0.0598 % over the projected for the year. Compared to the 2017 coincident peak, the 2018 peak of
2,525 MW represents an increase of 367.0 MW or 17.01% over the 2017 peak of 2,158.0 MW.
The summary of projected and actual monthly peak demands for 2018 is presented in Table 1.
Table 1: System Projected and Actual Peak Demand for 2018
Month Projected
Demand(MW)
Actual Demand (MW) Difference
System Domestic ( Projected-System)
Jan-18 2,305.77 2,198.17 2,067.00 107.6
Feb-18 2,337.62 2,269.00 2,137.00 68.62
Mar-18 2,401.94 2,278.00 2,153.00 123.94
Apr-18 2,509.01 2,433.00 2,248.00 76.01
May-18 2,496.88 2,406.00 2,270.00 90.88
Jun-18 2,415.89 2,290.00 2,127.00 125.89
Jul-18 2,338.78 2,349.00 2,125.00 -10.22
Aug-18 2,341.97 2,296.00 2,094.00 45.97
Sep-18 2,414.76 2,402.00 2,184.00 12.76
Oct-18 2,487.23 2,471.00 2,231.00 16.23
Nov-18 2,512.83 2,496.10 2,201.00 16.73
Dec-18 2,523.49 2,525.00 2,371.00 1.51
As shown in Table 1, there were wide deviations between the Projected and the Actual Peak Demands
for the first half of the year. These were due to delays by VALCO in operationalizing the second Pot
line of 75 MW and the late energization of the 225 kV Bolgatanga – Ouagadougou line to export about
50 MW to SONABEL (Burkina).
VALCO started operating the second Pot line on June 1, 2018 and its demand by the end of 2018 had
reached 120.5 MW. The Ghana – Burkina Interconnection was also commissioned on June 27, 2018
and SONABEL has since imported an average of 46.46 MW and a maximum of 101.38 MW from
Ghana.
The highest domestic peak demand recorded during the period was 2,270.0 MW and this occurred on
May 24, 2018. This value represents an increase of 193.0 MW or 9.3% over that of 2017 of 2,077.0
MW which occurred on April 19, 2017.

3 2019 Electricity Supply Plan
2.2 Energy Consumption
The period under review registered a total energy consumption including losses of 15,960.36 GWh as
against the projected total energy consumption of 16,302.09 GWh. The actual energy consumed was
lower than projected by 2.10% or 341.73 GWh compared to the projected. A total of 14, 308.08 GWh
was consumed during the same period in 2017, thus, the 2018 figure represents an 11.55% or 1, 652.28
GWh increase over that of 2017.
The summary of 2018 and 2017 projected and actual energy consumptions for the second quarter is
presented in Table 2.
Table 2: Summary of Energy Consumption for 2018, actual vs. projected
Customer Projection
(GWh) 2018
Actual (GWh) Actual (GWh) % Growth
2018 2017 (2018-2017)
ECG 10,588.86 10,869.87 9,922.61 9.55%
NEDCo 1,373.10 1,326.93 1,236.44 7.32%
Mines 1,495.41 1,090.78 1,150.65 -5.20%
VALCO 1,154.19 815.19 631.24 29.14%
Export 669.27 739.50 376.74 96.29%
Direct Cust. 426.96 401.95 395.53 1.62%
Network Usage/Losses 594.30 716.14 594.88 20.38%
Total Energy
Transmitted 16,302.09 15,960.36 14,308.09 11.55%
The details of the peak demand and energy consumption per Bulk Supply Points are in Appendix A.
2.3 Losses
The total transmission losses recorded during the period was 707.33 GWh which is 4.43% of the total
energy transmitted of 15,960.36 GWh, representing 19.01% increase over the projected transmission
loss of 594.30 GWh
2.4 Energy Exchanges (Export and Import)
A maximum of 45 MW and an average of 15 MW of power was exported to CIE (la Côte d’Ivoire)
whilst import from CIE reached a peak of 135 MW during the same period. On the other hand, a
maximum of 141 MW and 101.38 MW were exported to CEB (Togo/Benin) and SONABEL (Burkina)
respectively.
In energy terms, a total of 384.95 GWh and 277.07 GWh were exported respectively to CEB and
SONABEL. A net of 217.17 GWh was also exchanged between Ghana and Côte d’Ivoire. This was
made up of 139.69 GWh imports and 77.48 GWh exports.
2.5 Energy Generation
Summary of actual monthly energy generation against the projected in 2018 is shown in Table and
Figure below.

4 2019 Electricity Supply Plan
Table 3: Projected versus Actual Energy Generation in 2018
Month Hydro (GWh) Thermal (GWh) Import (GWh) System Total (GWh)
Actual Projected Actual Projected Actual Projected Actual Projected
Jan 420.81 434.63 850.19 889.59 2.02 0.00 1273.02 1284.00
Feb 492.68 390.07 673.52 825.35 41.27 0.00 1207.47 1149.00
Mar 397.41 420.16 943.46 914.52 12.62 0.00 1353.49 1294.00
Apr 486.81 407.02 878.59 986.79 10.54 0.00 1375.94 1338.00
May 499.52 420.16 842.87 989.82 7.09 0.00 1349.48 1346.00
Jun 501.40 410.05 760.85 915.04 8.24 0.00 1270.49 1261.00
Jul 393.47 391.32 911.54 939.53 10.36 0.00 1315.37 1262.00
Aug 367.96 383.47 939.02 968.15 6.19 0.00 1313.17 1256.00
Sep 391.93 403.37 877.45 926.34 9.20 0.00 1278.58 1255.00
Oct 646.14 436.93 702.13 965.59 14.55 0.00 1362.82 1363.00
Nov 691.01 423.25 701.21 969.91 12.63 0.00 1404.85 1344.00
Dec 728.22 435.94 722.32 1015.80 4.99 0.00 1455.53 1407.00
Total 6017.36 4956.37 9803.15 11306.43 139.70 0.00 15960.36 16262.80
Figure 1: Projected versus Actual Energy Generation in 2018
4956.37
11306.43
0
6017.36
9803.15
139.7
Hydro Thermal Import
Projected Vrs Actual Generation
Projected Actual
The total energy generated including imports from Côte d’Ivoire over the period was 15,960.36 GWh;
made up of 6,017.36 GWh from hydro generation, 9,803.15 GWh from thermal and 139.70 GWh
Imports. The corresponding percentage share of each generation type for the period was 37.70%,
61.42% and 0.88% for hydro, thermal and imports respectively.
The generation mix at the end of the period was therefore 38% hydro, 61% thermal and 1% import.
Figure 2 gives a graphical representation of the generation mix.

5 2019 Electricity Supply Plan
Figure 2: Generation Mix for 2018
Table 4 and Figure 3 show the actual energy generated against the projected for 2018.
Table 4: Plants projected and actual energy generated
Plants Projection 2018 ( GWh) Actuals 2018 (GWh) variation (GWh) % variation
Akosombo 3600 4272.71 -672.71 -19%
Kpong 600.14 771.12 -170.98 -28%
BUI 756.21 973.54 -217.33 -29%
TAPCo 1457.28 730.05 727.23 50%
TICo 2155.06 2210.95 -55.89 -3%
SAPP I & II 1466.14 1969.88 -503.74 -34%
TT2PP - - - -
TT1PP 353.28 314.34 38.94 11%
CENIT 380.93 2.22 378.71 99%
KTPP 369.24 317.44 51.8 14%
KarPower 2708.25 2556.24 152.01 6%
Ameri 796.55 872.61 -76.06 -10%
AKSA 558.49 747.56 -189.07 -34%
CenPower 1061.21 79.2 982.01 93%

6 2019 Electricity Supply Plan
Figure 3: Generating Plant projected & actual energy production for the year 2018
0
500
1000
1500
2000
2500
3000
3500
4000
4500
4272.71
771.12 973.54730.05
2210.951969.88
314.342.22
317.44
2556.24
872.61 747.56
79.2
2018 Energy Generation
7 2019 Electricity Supply Plan
2.6 Hydro Reservoir Operation
1.6.1 Akosombo Reservoir
The elevation of the Volta Lake for the start of 2018 was 76.61 m (251.34 feet). Based on this low
reservoir elevation, it was recommended to operate three (3) and five (5) units at off-peak and peak
respectively.
Following the implementation of the above recommendation, the reservoir elevation dropped to a
minimum of 74.03 m (242.96 feet) during the dry season in 2018. This elevation was 0.03 m (0.96
feet) higher than the projected for the year.
1.6.2 Inflows in 2018
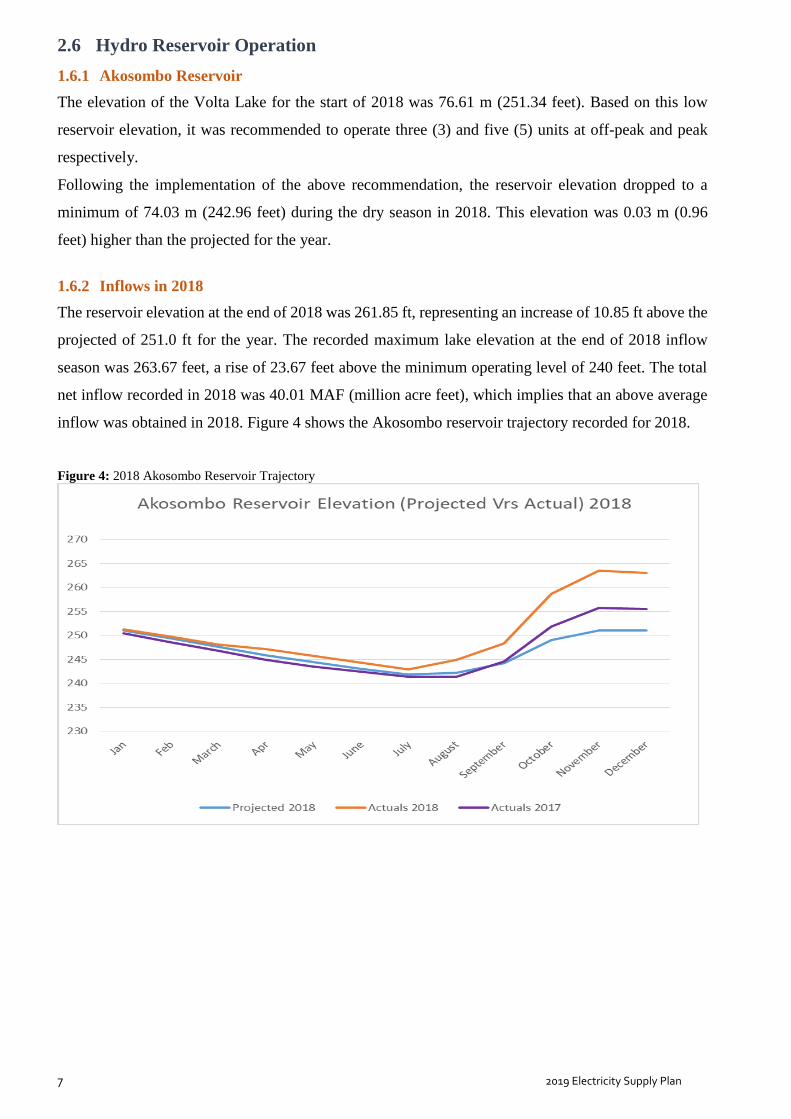
The reservoir elevation at the end of 2018 was 261.85 ft, representing an increase of 10.85 ft above the
projected of 251.0 ft for the year. The recorded maximum lake elevation at the end of 2018 inflow
season was 263.67 feet, a rise of 23.67 feet above the minimum operating level of 240 feet. The total
net inflow recorded in 2018 was 40.01 MAF (million acre feet), which implies that an above average
inflow was obtained in 2018. Figure 4 shows the Akosombo reservoir trajectory recorded for 2018.
Figure 4: 2018 Akosombo Reservoir Trajectory

8 2019 Electricity Supply Plan
2.7 Bui Reservoir
The Bui Reservoir level at the beginning of 2018 was 175.01 MASL, dropping to a minimum of 169.10
MASL at the end of the dry season. The minimum level attained was thus 1.56 MASL lower than the
projected minimum of 170.66 MASL for the year. This drop in elevation below the projected was due
to over-drafting of the Lake to make up for the power deficit arising from the shortfall in gas supply
from Ghana Gas in the first quarter of 2018.
The total energy generated in 2018 was 968.14 GWh compared to the projected of 754 GWh. The
higher than projected generation was due to higher than average inflows into the reservoir in the flood
season of 2018, forcing a revised strategy to avoid the spillage of the Bui reservoir leading to a much
higher than anticipated generation.
At the end of the inflow season the reservoir level rose to a maximum of 181.10 MASL on October
28, 2018. The year-end elevation on December 31, 2018 was 177.01 MASL.The recorded reservoir
trajectory in 2018 is as shown in Figure 5.
Figure 5: Projected and Actual Bui Reservoir Trajectory

9 2019 Electricity Supply Plan
2.8 Generating Plants Availabilities in 2018
Table 5 presents the actual availabilities of the generating plant recorded as against the forecast for
2018.
Table 5: Generating Plants’ actual and estimated availability for the year 2018
Plant Forecast (%) Availability Actual (%) Availability
Akosombo Hydroelectric Plant 90 97.49
Kpong Hydroelectric Plant 72 67.65
Bui Generation Station 85 97.8
Takoradi Thermal Power Plant (TAPCo) 65 48.77
Takoradi Thermal Power Plant (TICo) 85 86.62
Tema Thermal Power Plant (TT1PP) 85 67.4
CENIT 90 25.78
Karpower 90 93.15
Tema Thermal Power Plant (TT2PP) 85 34.66
Sunon Asogli Power Plant 90 70.52
Ameri 90 81.76
Kpone Thermal Power Plant (KTPP) 85 42.11
AKSA 90 86.51
Table 5 shows that the Takoradi Thermal Plant (TAPCo), Tema Thermal Power Plant – T2, CENIT
and the Kpone Thermal Power Plant (KTPP) plants recorded a lower than fifty (50) percent availability
during the period. It should be noted however that the plants availability factors were calculated based
on the total plant dependable capacity and fuel availability.
2.9 Quality of Supply
1.9.1 System Frequency
Figure 6 shows system frequency performance during 2018. It is seen from the graph that system
frequency was within the normal range (49.8Hz – 50.2Hz) - 78.69% of the time which is lower than
the 79.68% recorded in 2017. It was in the alert state 21.16% of the time in the entire year as follows:
49.5 – 49.8Hz - 1.78% of the time.
50.2 – 50.5 Hz - 19.38% of the time.
It was in emergency state 0.28% of the time in the entire year as follows:
49.0 – 49.5Hz - 0.08% of the time.
50.5 – 51.0Hz - 0.17% of the time.
below 49.0Hz, 0.03% of the time.
above 51.0Hz, 0.00% of the time.

10 2019 Electricity Supply Plan
Figure 6: System Frequency for year 2018
1.9.2 System Voltages
An analysis of voltages at selected Bulk Supply Points (BSP) at peak time indicates that voltages across
the NITS were largely within normal limits, except Kumasi as shown in the Table below.
Table 6: Bus Voltages at Bulk Supply Points in 2018
Station
Number of Days of the Year % of the Year
Normal Below
Normal
Above
Normal Normal
Below
Normal
Above
Normal
Achimota 353 11 1 96.71 3.01 0.27
Mallam 344 21 0 94.25 5.75 0
New Tema 365 0 0 100 0 0
Kumasi 174 191 0 47.67 52.33 0
Takoradi 365 0 0 100 0 0
Tamale 363 1 1 99.45 0.27 0.27
Kumasi voltages were below limits for 158 days in 2018. The low voltages were largely due to poor
customer (ECG) load power factors and the relatively long circuit distance from generating plants.
2.10 Transmission Network Performance
1.10.1 Feeder Availability
The average feeder availability on the NITS in 2018 was 99.85 % as compared to 99.84% in 2017.
1.10.2 Transmission Lines
The System Average Availability (SAA) for the transmission grid was 99.48 % in 2018(see Table 7).

11 2019 Electricity Supply Plan
Table 7: The percentage transmission line availability in 2018
Voltage Class Availability (%)
69kV 99.26%
161kV 99.57%
225kV 99.31%
330kV 99.20%
System Average Availability (%) 99.48%
2.11 Transformer Capacity
Over the period under review, transformer capacity on the NITS increased from 5,609.9 MVA to
8,064.2 MVA, an increase of 2,454.3 MVA.
Table 8 shows the breakdown of transformer additions.
Table 8: Transformer additions for year 2018
Substation Transformer Code Voltage level Rating (MVA)
Dunkwa 11T2 161/34 33
Afienya 71T2 161/34 66
Tafo 15T2 161/34 33
Juaboso 64T2 161/34 33
Nayagnia
82T1 330/330 200
82T2 330/330 200
82T3 330/330 200
82T4 330/330 200
Accra Central
83T1 161/34 125
83T2 161/34 125
83T3 161/35 125
Table 9 shows typical transformer peak loadings in some major substations in 2018.

12 2019 Electricity Supply Plan
Table 9: Transformer peak loadings for year 2018
Substation Transformer Code Rating
(MVA)
Peak Loading
(MVA) % of Rating
Achimota
5T1 66 67.04 102%
5T2 66 70.94 107%
5T3 66 70.95 108%
5T4 66 71.94 109%
5T5 66 70.34 107%
5T6 66 71.9 109%
Mallam
37T1 66 55.73 84%
37T2 66 65.16 99%
37T3 66 59.25 90%
37T4 66 55.98 85%
New Tema
4T1 66 45.24 69%
4T2 66 50.74 77%
4T3 66 28.3 43%
4T5 66 55.61 84%
4T5 20 0.03 0%
4T6 20 3.2 16%
Kumasi
13T1 66 69 105%
13T2 66 61.3 93%
13T3 66 53.8 82%
13T4 66 62.4 95%
Takoradi
8T1 33 47 142%
8T2 33 19.28 58%
8T3 33 21.75 66%
2.12 New installations in 2018
Table 10 shows the projects that were commissioned during the year under review.
Table 10: Commissioned Projects in 2018
Equipment Projects
Transmission Line
1. 161 kV Kpone Collector - Smelter II line 1
2. 161 kV Kpone Collector - Smelter II line 2
3. 161 kV Akosombo - Afienya
4. 161 kV Bolgatanga - Nayagnia
5. 161 kV Cenpower - Kpone Collector line 2
6. 330 kV Sunon Asogli - Dawa
7. 161 kV AKSA - Smelter II
8. 330 kV Dawa - Davie
9.161 kV Achimota - Accra Central
10. 161 kV Accra Central - Mallam
Substation/Transformers 1. Afienya Substation
2. Accra Central GIS Substation

13 2019 Electricity Supply Plan
3. DEMAND OUTLOOK FOR 2019
2.1 Peak Demand
It is projected that in 2019, the Ghana Power System will register a coincident peak demand of 2,665.68
MW and 2,796.92 MW for base and high case growth scenarios respectively. The projected 2019
reference peak of 2,665.68 represents an increase of 140.68 MW or in percentage terms, a growth of
5.54 % over that of 2018 peak demand of 2,525 MW which occurred on December 17, 2018.
The following spots loads are expected to contribute to the 2019 peak demand growth:
Full operation of the Second Cell – line by VALCO, increasing the Company’s peak demand
to about 147 MW
Increase in export to SONABEL (Burkina Faso)- from an average of 57.5 MW in 2018 to 100
MW
Demand increases attributable to ongoing distribution network expansion works intended to
extend coverage and improve service quality to ECG and NEDCo customers.
Expected completion and commissioning of various ongoing rural electrification projects
within the ECG and NEDCo distribution zones in 2019.

14 2019 Electricity Supply Plan
2.2 Summary of 2019 Peak and Energy Demand Forecast
Table 11 shows a summary of 2019 Projected Peak Demand for the base case.
Table 11: Summary of 2019 Projected Peak Demand
Demand Customer 2019 – Projected
Coincident Peak (MW)
Domestic
Peak
Demand
ECG 1,657.44
NEDCo 241.43
EPC 44.29
Mines
New Obuasi
201.74
Obuasi
New Tarkwa
Prestea
Ahafo/Kenyase
(Newmont)
New Abirim (Newmont)
Akyempem (Wexford)
Perseus (Ayanfuri)
Bogosu
Akwatia
Konongo
Adamus Gold
Resources
Asanko Gold
Drill Works
Other Bulk
Customers
Akosombo Textiles
50.79
Aluworks
Ghana Water Company
Ltd
Diamond Cement
Generation Plants
Station Service
Volta Hotel
Savana Cement (Buipe)
VRA Townships
Losses +Network Usage 162.57
Total Domestic Peak Demand 2,358.26
Exports
CEB 60
CIE 0
SONABEL 100
Total Exports 160.00
VALCO 147.42
Coincident Peak Demand MW 2,665.68
The Pie-Chart below describes the constituents of the 2019 Peak Demand, and it shows the percentage
share of each customer class. As shown in the Chart, ECG’s demand constitutes 62% of the total system
peak followed by NEDCo and the Mines at 9%. VALCO at two Cell-lines constitutes 6%. Other Bulk

15 2019 Electricity Supply Plan
Consumers constitute 2 % whilst Exports to CEB and SONABEL together account for 5% of total peak
demand
Figure 7: 2019 projected peak demand
2.3 Outlook of Energy Consumption
In 2019, the projected base case energy consumption is 17,237.79 GWh, this includes transmission
network losses of 898.03 GWh. The estimated transmission losses, represents a 5.21 % of total
projected energy supply. The projected 2019 energy consumption represents an increase of 1,277.43
GWh or in percentage terms, a growth of approximately 8.00 %, over the 2018 consumption of
15,960.36 GWh. The energy demand estimate for the high growth scenario is 18,013.96 GWh.
The summary of 2019 consumption by customer class is presented in Table 13.
16 2019 Electricity Supply Plan
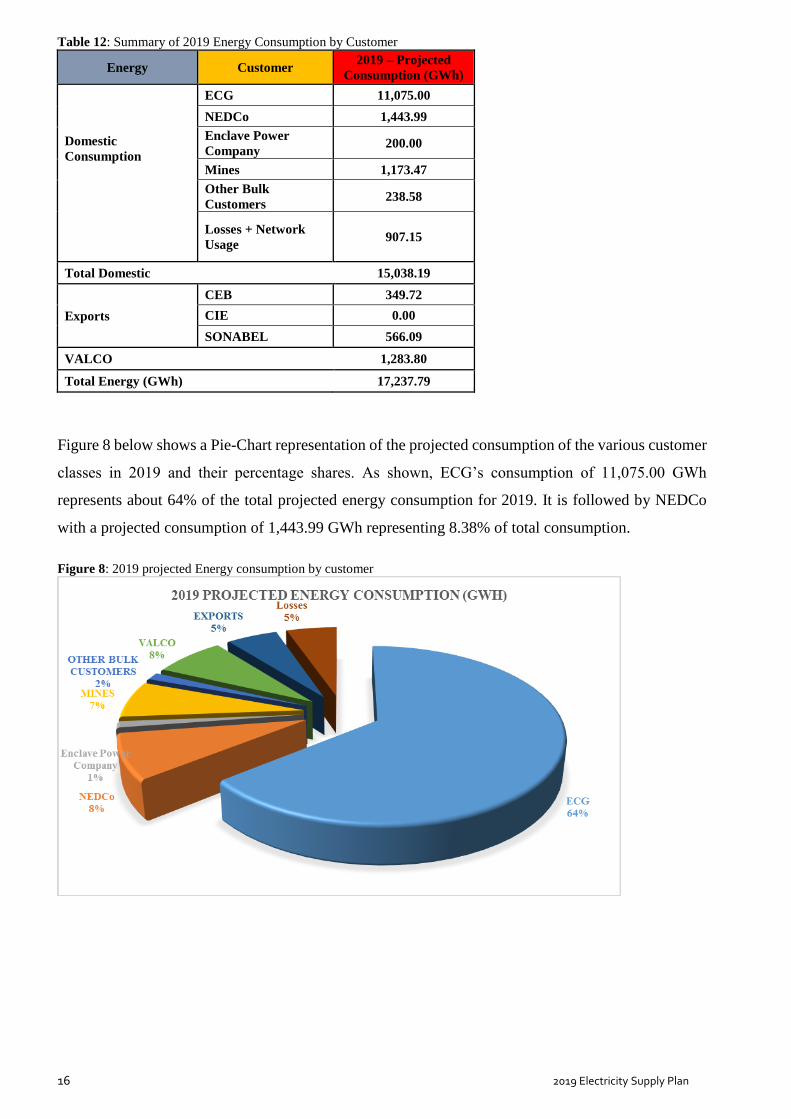
Table 12: Summary of 2019 Energy Consumption by Customer
Energy Customer 2019 – Projected
Consumption (GWh)
Domestic
Consumption
ECG 11,075.00
NEDCo 1,443.99
Enclave Power
Company 200.00
Mines 1,173.47
Other Bulk
Customers 238.58
Losses + Network
Usage 907.15
Total Domestic 15,038.19
Exports
CEB 349.72
CIE 0.00
SONABEL 566.09
VALCO 1,283.80
Total Energy (GWh) 17,237.79
Figure 8 below shows a Pie-Chart representation of the projected consumption of the various customer
classes in 2019 and their percentage shares. As shown, ECG’s consumption of 11,075.00 GWh
represents about 64% of the total projected energy consumption for 2019. It is followed by NEDCo
with a projected consumption of 1,443.99 GWh representing 8.38% of total consumption.
Figure 8: 2019 projected Energy consumption by customer

17 2019 Electricity Supply Plan
2.4 ECG Energy and Demand Forecast Methodology and Assumptions
The ECG Energy and Demand Forecast is annually reviewed to take into consideration changing trends
in external factors likely to impact energy consumption. The ECG Energy and Demand Forecast review
is expected as external factors affecting the demand for energy consumption by consumers have varied
considerably due to the following:
Higher GDP growth projection for Ghana1
Increase in generation capacity2
In addition, energy losses (i.e. percentage system losses) are projected for the same period in line with
the ongoing system losses reduction plan by the ECG Management.
ECG customers are categorized into Special Load Tariff (SLT) customers and Non – Special Load
Tariff (NSLT) customers. The SLT customers include industrial customers who consume a demand of
100 kVA and above whilst the Non SLT customers include both residential and commercial customers
who consume a demand less than 100 kVA.
Two (2) energy sales forecast models were then developed for each category (SLT and Non – SLT) to
forecast the Energy Sales (MWh) from 2018 to 2027. Non-SLT model utilized the Ordinary Least
Squares (OLS) – Multiple Linear Regression Model (Log – Log) which examines the historical
behaviour of various key variables to build a model for predicting future demand. SLT model utilized
the Auto - Regressive Model which includes the lagged values of the dependent variable as
independent variables. The forecast values were projected based on assumptions for Low, Base and
High case scenarios. The scaling / disaggregation methodology3 was employed to carry out the short-
term monthly forecast for the year 2019 only.
The Tables 13 and 14 show the elasticities of price, GDP and Customer Population for both the SLT
and Non - SLT energy models.
Table 13: Coefficients for Natural Log of Non SLT model
LN_NSLT
Coefficient of Population LNPOP_NSLT 0.227022481
Coefficient of GDP LN_GDP 0.752405419
Coefficient of Price LNP_NSLT -0.109534244
Dummy Variables 1 (2000,2007,2011 and 2014) DMN -0.041879495
Dummy Variables 2 (1998 and 2015) DMN-2 -0.154824082
Constant C -5.692035469
1 Projected GDP for 2019 of 6.8%: Source: https://www.pwc.com/gh/en/assets/pdf/2018-budget-highlights.v2.pdf 2 Excess generation supply: Source: 2017 Energy Supply Plan for the Ghana Power System

18 2019 Electricity Supply Plan
Table 14: Coefficients for SLT model
LN_SLT
Coefficient of Non-Agriculture GDP LN_GDPi 0.391503539
Dummy Variables 1 (2007 and 2015) DMS -0.068481664
Constant C 0.108650921
Coefficient of lag of SLT sales LN_S_SLT (-1) 0.350402285
ECG Energy purchases (MWh) are also projected for the ten-year period 2018 – 2029 using the
relation below;
Where Energy sales (S) is the forecast energy sales from the sum of the SLT and NSLT energy forecast
results.
% System Losses is the projected system loss in line with ECG Management loss reduction program.
The Annual Total Non – Coincident Peak Demand (MW) are projected for the ten year period 2018
– 2027 using the relation below;
Based on the relation above, the Maximum Demand is forecasted for the period 2018 to 2027. The
Annual Load Factor for the forecast period is projected based on historical load factors and expected
changes in consumption patterns. The full details of the report can be obtained directly from the
Engineering Directorate of the Electricity Company of Ghana.

19 2019 Electricity Supply Plan
2.5 NEDCo Energy and Demand Forecast Methodology and Assumptions
It has been established through correlation studies that population, economic growth and the price of
electricity has direct relationship with energy growth in NEDCo. The model for the energy demand in
NEDCo takes into account the following variables:
Population
GDP per Capita
Tariff
NEDCo uses the Ordinary Least Square (OLS) and Auto-Regression (AR) methods for performing a
multivariate regression analysis. Energy Sales forecasting is undertaken for all three (3) customer
categories (Residential, Non-Residential and SLT).
The forecasting model is derived using excel for each customer category and the following statistical
test are used to validate the accuracy of the model at a confidence level of 95% for each hypothesis:
Multi-collinearity
Serial correlation
Stationarity test
Normality test
Homoscedastic test
2.5.1 Residential Energy Sales Forecast
NEDCo uses the Ordinary Least Square (OLS) regression methodology to determine the energy sales
forecast for the residential customer category. The regression model used is as below:
ENERGYR = 0.0173990458735*NGDP_R_NR - 41.0098705779
Where: ENERGYR= Energy sales for residential customers
NGDP_R_NR = NEDCo Region GDP for residential/non-residential category.
2.5.2 Non-Residential Energy Sales Forecast
NEDCo performs forecast for non-residential customers using the Ordinary Least Square (OLS)
regression methodology. The equation for forecasting non-residential energy sales is as below:
ENERGYNR = 0.00997595487073*NGDP_R_NR - 50.7441667843
Where: ENERGYNR= Energy sales for residential customers
NGDP_R_NR = NEDCo Region GDP for residential/non-residential category.

20 2019 Electricity Supply Plan
2.5.3 Special Load Tariff (SLT) Energy Sales Forecast
NEDCo used a first order Auto-Regression (log-log) to perform a forecast for its SLT (industrial)
customers. The mathematical expression used for SLT energy sales forecasting is as below:
Ln (ENERGYSLT = 0.862840699484 + 0.775968841734*Ln (ENERGYSLT (-1))
Where: ENERGYSLT= Energy sales for residential customers
ENERGYSLT (-1) = first order lag term of energy sales for SLT customers.

21 2019 Electricity Supply Plan
2.6 Projected Monthly Peak and Energy Demand for 2019
A summary of monthly energy consumption and the corresponding peak demand for the various customer classes is shown in Tables 15-18.
Table 15: Summary of Projected 2019 Monthly Energy (GWh) Consumption –base case scenario
Energy Forecast (GWh) Jan Feb Mar Apr May Jun Jul Aug Sep Oct Nov Dec Total
GWh
ECG 972.83 860.09 941.61 954.30 958.08 883.96 876.98 889.32 878.83 935.61 937.67 985.73 11075.00
NEDCo 116.59 116.14 123.58 117.85 119.55 117.66 120.16 119.37 121.10 124.80 123.46 123.74 1,443.99
Enclave Power Company 14.54 13.13 14.54 16.44 16.99 16.44 16.99 16.99 16.44 19.43 18.65 19.43 200.00
MINES 105.45 95.07 98.42 95.68 97.31 92.50 98.55 101.71 95.42 99.20 95.75 98.42 1,173.47
Other Bulk Customers 21.07 20.97 21.04 20.15 19.96 18.44 19.47 18.64 18.36 19.85 19.17 21.46 238.58
VALCO 108.90 98.30 108.90 105.60 109.70 104.60 108.60 109.20 106.10 108.60 106.10 109.20 1,283.80
CEB(Togo/Benin) 29.70 26.83 29.70 28.74 29.70 28.74 29.70 29.70 28.74 29.70 28.74 29.70 349.72
SONABEL(Burkina) 37.91 34.44 37.88 51.34 53.00 50.83 50.35 50.49 49.43 50.49 49.43 50.49 566.09
CIE(Ivory Coast) 0.00 0.00 0.00 0.00 0.00 0.00 0.00 0.00 0.00 0.00 0.00 0.00 0.00
EDM(Mali) 0 0 0 0 0 0 0 0 0 0 0 0 0.00
Network Usage 0.79 0.71 0.77 0.78 0.78 0.73 0.74 0.75 0.73 0.77 0.77 0.80 9.12
LOSSES 77.37 69.56 75.65 76.44 77.22 72.21 72.63 73.44 72.28 76.31 75.83 79.09 898.03
Total 1,485.13 1,335.25 1,452.08 1,467.31 1,482.31 1,386.12 1,394.17 1,409.60 1,387.43 1,464.76 1,455.58 1,518.06 17,237.79
Total Energy to be
Transmitted less losses 1407.76 1265.69 1376.43 1390.87 1405.09 1313.91 1321.53 1336.16 1315.15 1388.45 1379.74 1438.98 16,339.76

22 2019 Electricity Supply Plan
Table 16: Summary of Projected 2019 Monthly Peak (MW) demand – Base Case Scenario
Coincident Peak Demand (MW) Jan Feb Mar Apr May Jun Jul Aug Sep Oct Nov Dec
ECG 1623.29 1630.18 1671.89 1676.83 1660.28 1582.75 1503.46 1502.26 1570.66 1632.98 1657.44 1592.97
NEDCo 228.69 233.29 242.05 229.26 233.17 233.68 233.39 236.58 238.62 238.09 241.43 240.94
Enclave Power Company 31.67 31.67 31.67 36.17 36.17 36.17 36.17 36.17 36.17 44.29 44.29 44.29
MINES 200.27 199.01 201.20 200.92 199.09 200.19 200.14 198.65 199.98 202.18 201.74 200.87
Other Bulk Customers 50.20 49.33 50.28 50.88 53.56 50.29 50.30 51.74 51.97 52.48 50.79 50.94
VALCO 146.31 146.31 146.31 146.71 147.42 145.32 146.01 146.71 147.42 146.01 147.42 146.71
CEB(Togo/Benin) 50.00 50.00 50.00 50.00 50.00 50.00 50.00 50.00 50.00 60.00 60.00 60.00
SONABEL(Burkina) 67.90 67.90 67.90 100.00 100.00 100.00 100.00 100.00 100.00 100.00 100.00 100.00
CIE(Ivory Coast) EDM(Mali)
Network Usage 1.42 1.42 1.45 1.47 1.47 1.42 1.37 1.37 1.42 1.46 1.48 1.44
LOSSES 154.35 154.95 158.40 160.30 159.59 154.36 149.28 149.45 154.13 159.35 161.09 156.82
System Peak(Coincident) 2,554.09 2,564.06 2,621.15 2,652.54 2,640.75 2,554.17 2,470.12 2,472.94 2,550.35 2,636.85 2,665.68 2,594.97
Table 17: Summary of Projected 2019 Monthly Peak (MW) demand – High Case Scenario
Energy Forecast (GWh) Jan Feb Mar Apr May Jun Jul Aug Sep Oct Nov Dec Total GWh
ECG 1039.44 918.99 1006.10 1019.64 1023.68 944.50 937.04 950.22 939.01 999.68 1001.88 1053.23 11833.41
NEDCo 118.95 118.50 126.09 120.24 121.98 120.04 122.60 121.79 123.55 127.33 125.96 126.25 1,473.29
Enclave Power Company 14.54 13.13 14.54 16.44 16.99 16.44 16.99 16.99 16.44 19.43 18.65 19.43 200.00
MINES 105.45 95.07 98.42 95.68 97.31 92.50 98.55 101.71 95.42 99.20 95.75 98.42 1,173.47
Other Bulk Customers 21.07 20.97 21.04 20.15 19.96 18.44 19.47 18.64 18.36 19.85 19.17 21.46 238.58
VALCO 108.90 98.30 108.90 105.60 109.70 104.60 108.60 109.20 106.10 108.60 106.10 109.20 1,283.80
CEB(Togo/Benin) 34.60 51.06 56.46 54.64 37.39 23.39 24.07 24.07 23.39 32.49 37.39 51.06 450.00
SONABEL(Burkina) 44.00 37.30 41.30 39.97 57.29 55.44 57.29 57.29 55.44 57.29 55.44 57.29 615.33
CIE(Ivory Coast) 0.00 0.00 0.00 0.00 0.00 0.00 0.00 0.00 0.00 0.00 0.00 0.00 0.00
EDM(Mali) 0.00 0.00 0.00 0.00 0.00 0.00 0.00 0.00 0.00 0.00 0.00 0.00 0.00
Network Usage 0.83 0.76 0.82 0.82 0.83 0.77 0.77 0.78 0.77 0.82 0.81 0.86 9.65
LOSSES 75.75 68.95 75.03 75.01 57.01 52.82 53.18 53.77 52.91 56.45 56.31 59.24 736.44
Total 1,563.53 1,423.04 1,548.70 1,548.19 1,542.13 1,428.94 1,438.56 1,454.45 1,431.39 1,521.13 1,517.47 1,596.44 18,013.96

23 2019 Electricity Supply Plan
Table 18: Summary of Projected 2019 Monthly Peak (MW) demand – High Case Scenario
Coincident Peak Demand (MW) Jan Feb Mar Apr May Jun Jul Aug Sep Oct Nov Dec
ECG 1673.96 1707.54 1726.99 1754.14 1732.58 1661.33 1535.06 1589.18 1638.78 1692.90 1801.13 1759.64
NEDCo 228.51 233.09 235.75 239.45 236.51 226.79 209.55 216.94 223.71 231.09 245.87 240.21
Enclave Power Company 43.00 46.00 46.00 46.00 46.00 44.00 44.00 44.00 44.00 46.00 46.00 46.00
MINES 200.27 199.01 201.20 200.92 199.09 200.19 200.14 198.65 199.98 202.18 201.74 200.87
Other Bulk Customers 50.20 49.33 50.28 50.88 53.56 50.29 50.30 51.74 51.97 52.48 50.79 50.94
VALCO 146.31 146.31 146.31 146.71 147.42 145.32 146.01 146.71 147.42 146.01 147.42 146.71
CEB(Togo/Benin) 100.00 100.00 100.00 100.00 100.00 70.00 70.00 70.00 70.00 70.00 80.00 100.00
SONABEL(Burkina) 67.90 67.90 67.90 67.90 100.00 100.00 100.00 100.00 100.00 100.00 100.00 100.00
CIE(Ivory Coast) 0.00 0.00 0.00 0.00 0.00 0.00 0.00 0.00 0.00 0.00 0.00 0.00
EDM(Mali) 0.00 0.00 0.00 0.00 0.00 0.00 0.00 0.00 0.00 0.00 0.00 0.00
Network Usage 1.48 1.51 1.52 1.54 1.55 1.48 1.39 1.43 1.46 1.50 1.58 1.56
LOSSES 162.62 165.15 166.78 168.83 117.51 112.24 105.82 108.61 111.25 116.34 122.40 121.09
System Peak(Coincident) 2,674.24 2,715.83 2,742.73 2,776.37 2,734.21 2,611.64 2,462.27 2,527.25 2,588.57 2,658.51 2,796.92 2,767.01

24 2019 Electricity Supply Plan
4. SUPPLY OUTLOOK
2.1 Generation Sources
The sources of generation considered for 2019 are mainly the existing Hydro, Thermal and Renewable
Energy Plants, and committed power plants expected to come on line during the year.
2.2 Summary of Generation Sources
Table 19 presents a summary of the existing and committed generation sources considered for 2019.
Table 19: Existing Generation Sources for 2019
Plants Installed Capacity Dependable Capacity
Fuel Type
(MW) (MW)
Akosombo GS 1020 900 Hydro
Kpong GS 160 105 Hydro
TAPCO (T1) 330 300 LCO/Gas
TICO (T2) 340 320 LCO/Gas
TT1PP 110 100 LCO/Gas
TT2PP 80 70 Gas
KTPP 220 200 Gas/ Diesel
VRA Solar Plant 2.5 0 Solar
TOTAL VRA 2,263 1,995
Bui GS 404 360 Hydro
CENIT 110 100 LCO/Gas
AMERI 250 230 Gas
SAPP 161 200 180 Gas
SAPP 330 360 340 LCO/Gas
KAR Power 470 450 HFO
AKSA 370 350 HFO
BXC Solar 20 0 Solar
Meinergy Solar 20 0 Solar
Trojan 44 39.6 Diesel/Gas
Genser 22 18 Gas
CEN Power 360 340 LCO/Gas
Amandi 190 190 LCO/Gas
TOTAL IPP 2,820 2,598
TOTAL (VRA, Bui
& IPPs) 5,083 4,593
25 2019 Electricity Supply Plan
2.3 Hydro Power Generation for 2019
The total projected hydro generation for 2019 is 5,670 GWh. This is made up of 4,258.44 GWh, 811.50
GWh and 600 GWh respectively expected from Akosombo, Kpong and Bui Generating Stations.
3.3.1 Akosombo & Kpong Hydro
It is planned to operate Three/Four (3/4) units during the off-peak period and up to five (5) units during
the peak period in the year 2019. This mode of operation will result in operating capacity of up to 750
MW at Akosombo GS in 2019, which will ensure that the reservoir level is kept above the minimum
operating level of 240 ft. This mode of operation will result in a projected minimum elevation of 253
feet at the end of the dry season in 2019.
Kpong Generation Station (Kpong GS), which is currently undergoing retrofit, will have three (3) out
of the four (4) units available. The total average capacity that would be available at Kpong GS is 105
MW. As a result of the above mode of operation, the projected total annual hydro generation from
Kpong and Akosombo generating stations is 5,070 GWh.
3.3.2 Bui Hydro
In 2019, Bui Hydro Plant is projected to operate an average of two (2) units throughout the year. This
mode of operation will lead to a projected annual production of 660 GWh. The plant is assumed to
provide an average generation capacity of 220 MW to support demand.
It is estimated that, for continuous and sustainable operation of the Bui GS for 2019 and for the
subsequent years (in the likely event of low inflows), the reservoir level at the end of the dry season of
2019 should not drop below elevation 170 MASL. With a year-start elevation of 176.97 MASL in 2019,
and the total estimated total energy production of 660 GWh for year 2019, the year-end elevation is
projected at 175.21 MASL.
Assumptions for projected 2019 generation from the Bui Hydro Plant:
60% Long Term Average Inflow of 6,167 Mm3.
2019 Year start elevation of Bui Reservoir – 176.97 MASL
Operation of two units in normal mode at 110 MW in 2019.
Operation of third unit in Synchronous Condenser Mode (SCM) when required by NTIS from
January 1 to December 31, 2019.
Operate Turbinette at 3.75 MW from January 1 to December 31, 2019.

26 2019 Electricity Supply Plan
Figure 9: 2018 Projected Bui Reservoir Trajectory
2.4 Thermal Power Generation for 2019
The Projected Dependable Thermal Capacity for 2019 is 3,456 MW. This is made up of 2,906 MW from
existing Units and 550 MW of committed Thermal Projects as shown in Tables 20 and 21. The projected
total thermal energy generation for 2019 is 11,460.11 GWh, made up of generation outputs from VRA
and IPPs Plants as shown in Tables 20 and 21.
Table 20: Existing Generation Sources
Plants Installed Capacity (MW) Dependable Capacity (MW) Fuel Type
TAPCO (T1) 330 300 LCO/Gas
TICO (T2) 340 320 LCO/Gas
TT1PP 110 100 LCO/Gas
TT2PP 80 70 Gas
KTPP 220 200 Gas/ Diesel
TOTAL VRA 1,080 990
CENIT 110 100 LCO/Gas
AMERI 250 230 Gas
SAPP 161 200 180 Gas
SAPP 330 360 340 LCO/Gas
KAR Power 470 450 HFO
AKSA 370 350 HFO
Trojan 44 39.6 Diesel/Gas
Genser 22 18 Gas
TOTAL IPP 1,826 1,708
TOTAL (VRA, Bui & IPPs) 2,906 2,698

27 2019 Electricity Supply Plan
Table 21: Existing Generation Sources
Generation Sources 2019 Projected Supply (GWh)
TAPCO 1491.78
TICO 1933.55
TT1PP 211.43
KTPP 158.19
TT2PP 0
Imports From Côte d’Ivoire 0
Total VRA Available
Generation 3,794.95
SAPP 161 715.43
SAPP 330 1940.42
CENIT 0
AMERI Power Plant 1007.15
Karpower Barge 2775.15
AKSA 1227
CEN Power 0
Amandi 0
Total IPP (Thermal) 7,665.16
Total Supply (GWh) 11,460.11
2.5 New Generation Sources
In 2019, two new thermal power plants are expected to be commissioned into service as follows (Table
21):
340 MW Cen Power Thermal Power Plant located in Tema. The Plant would run on LCO or
Gas and would be evacuated through the 161kV Collector Substation.
192 MW Amandi Thermal Power Plant located within the Aboadze Thermal Enclave. This
plant is also dual-fired on either LCO or Natural Gas and will be evacuated through the
expanded 330 kV Switchyard at Aboadze.
Table 22: Committed Generation Plants for 2019
Plants Installed Capacity (MW) Dependable Capacity (MW) Fuel Type
CEN Power 360 340 LCO/Gas
Amandi 190 190 LCO/Gas
TOTAL
Committed IPP 550 530

28 2019 Electricity Supply Plan
2.6 Key Assumptions Underpinning the Supply Plan
In developing the 2019 Supply Outlook, the following key assumptions were made:
3.6.1 Planned Maintenance
The schedule of key maintenance activities expected to be undertaken in 2019 on generating units at
the various power plants is shown in Table 24.
Table 23: 2019 Planned Maintenance
Plants Planned Maintenance
Akosombo
GS
Unit 1 is scheduled to undergo annual maintenance from May 20 - May 31, 2019
Unit 2 is scheduled to undergo annual maintenance from July 29 - August 09, 2019
Unit 3 is scheduled to undergo annual maintenance from June 24 - July 06, 2019
Unit 4 is scheduled to undergo annual maintenance from July 15 - 26, 2019
Unit 5 is scheduled to undergo annual maintenance from May 06 -17, 2019
Unit 6 is scheduled to undergo annual maintenance from June 10 - 21, 2019 and 1T6-
Transformer Replacement from December 2 – 8, 2019
Maintenance at Akosombo GS will be scheduled in a manner that it will not affect overall
power supply
Kpong GS
Unit 1: Quarterly maintenance for a period of 1 week in Jul 15 – 21 and November 04 -
10, 2019
Unit 2: Quarterly maintenance for a period of 1 week in April, August and December
Unit 3: Post retrofit inspection for 30 days from March 1 – 30, 2019
Unit 3: Major Retrofit from January 1 to March, 2019
Unit 4: Major retrofit from April to December 2019
TAPCO
Unit 1: Fuel Nozzle Inspection January 01 to 30, 2019.
Unit 3: Steam Turbine Generator repair works from January – March 2019.
Unit 1: Offline Compressor Water Wash Repair & Maintenance July 21- 23, 2019
Unit 2: Offline Compressor Water Wash Repair & Maintenance July 28- 30, 2019
TICO
STG: Mandatory Inspection from January 7 to 11, 2019
Unit 1: Offline compressor water wash for performance test February 9 and May 9,
December 10, 2019
Unit 2: Offline compressor water wash for performance test February 10 and May 10, 2019
Hot Gas Path Inspection and Casing Replacement August 1 to September 30, 2019
KTPP Unit 1: Major Plant Inspection (Type A Maintenance) June 14 to 21, 2019
TT1PP 47G1 (TT1PS Gas Turbine) Offline Compressor Water Wash May 31 to June 01, 2019
TT2PP
Unit 1: Core Engine Swap and main gearbox overhaul July 17 to August 10, 2019
Unit 3: Generator Stator Repair Works January 07 to September 30, 2019
Unit 3: Core Engine Swap and main gearbox overhaul June 24 to July 18, 2019
Unit 5: Type A Maintenance September 03 – 08, 2019
Unit 6: Type A Maintenance September 10 – 15, 2019
Unit 1: Major Plant Inspection (Type A Maintenance) June 14 to 21, 2019

29 2019 Electricity Supply Plan
Bui GS
Unit 4 is scheduled for January 7 to January 8, 2019.(Quarterly maintenance)
Unit 1 is scheduled for January 21 to January 25, 2019. (Quarterly maintenance)
Unit 2 is scheduled for February 11 to February 15, 2019. (Quarterly maintenance)
Unit 3 is scheduled for April 1 to June 30, 2019. (Annual maintenance)
Unit 2 is scheduled for May 27 to May 31, 2019. (Quarterly maintenance)
Unit 4 is scheduled for June 4 to June 5, 2019.(Quarterly maintenance)
Unit 1 is scheduled for June 10 to June 14, 2019.(Quarterly maintenance)
Unit 2 is scheduled for July 1 to September 30, 2019.(Annual maintenance)
Unit 3 is scheduled for August 5 to August 9, 2019.(Quarterly maintenance)
Unit 4 is scheduled for September 2 to September 8, 2019. (Annual maintenance)
Unit 1 is scheduled for October 1 to December 30, 2019. (Annual maintenance)
Unit 2 is scheduled for November 11 to November 15, 2019. (Quarterly maintenance)
Unit 4 is scheduled for November 25 to November 26, 2019. (Quarterly maintenance)
ASOGLI
Unit 2 is scheduled for February 2 to February 23, 2019. (Type C maintenance)
Unit 1 is scheduled for March 5 to March 18, 2019. (Type C maintenance)
Unit 5 is scheduled for May 8 to May 21, 2019. (Type C maintenance)
Unit 7 is scheduled for July 10 to July 27, 2019. (Type C maintenance)
Unit 9 is scheduled for August 1 to August 18, 2019. (Type C maintenance)
Unit 1 is scheduled for December 22 to January 1, 2020. (Type B maintenance)
AKSA
Unit 2 is scheduled for January 7 to January 28, 2019. (ABB generator L4 maintenance)
Unit 3 is scheduled for February 7 to March 1, 2019. (ABB generator L4 maintenance)
Unit 20 is scheduled for March 7 to March 29, 2019. (ABB generator L4 maintenance)
Unit 21 is scheduled for April 7 to April 29, 2019. (ABB generator L4 maintenance)
Unit 8 is scheduled for October 1 to October 31, 2019. (WARTSILA engine 36K mechanical
maintenance)
Unit 9 is scheduled for November 1 to November 30, 2019. (WARTSILA engine 36K
mechanical maintenance)

30 2019 Electricity Supply Plan
3.6.2 Natural Gas Quantities and Availabilities
The infrastructure bottlenecks that significantly constrained gas offtake in 2018 is expected to be resolved
in 2019. The Takoradi – Tema Interconnection Project (TTIP), which will tie-in the Ghana Gas pipeline
system to the West African Gas Pipeline (WAGP) system in Takoradi would allow reverse flow of
surplus gas from Western offshore Ghana to Tema, through the WAGP. Commissioning of the Tema
scope of the work is currently ongoing.
The tie-in would provide firm capacity to flow 20 MMscfd immediately (and additional 40 MMscfd on
interruptible basis). The flow capacity will increase to 60 MMscfd firm and additional 55 MMscfd of
interruptible once the Tema scope of the TTIP is completed in August 2019.
Another key piece of infrastructure that will increase gas utilization is the relocation of the 470 MW
Karpowership barge from Tema to the Sekondi Naval Base. Both the gas pipeline to feed the power
plant, and the power transmission line to evacuate the power generated by the plant, are currently being
constructed. The Karpowership is expected to begin using circa 90 MMscfd of gas by end of August
2019.
Two additional powerplants – Cenpower and Amandi – are expected to be operational in Q2, 2019 in
Tema and Q3 2019 in Takoradi respectively. These would increase gas offtake capacity by circa 90
MMscfd. The Jubilee, TEN and Sankofa fields have the capacity to supply the committed volumes of
circa 90 MMscfd, 30 MMscfd and 180 MMscfd respectively. However, the lingering infrastructure
bottlenecks will limit gas supply in 2019 as shown in table 24 below:
Table 24: 2019 Monthly Gas Delivery Profile (MMscfd) – due to infrastructure constraints
Gas Supply Analysis - 2019 Monthly (in MMscfd)
Jan.
19
Feb.
19
Mar.
19
Apr.
19
May.
19
Jun.
19
Jul.
19
Aug.
19
Sep.
19
Oct.
19
Nov.
19
Dec.
19
Jubilee FV 48 13 34 60 73 73 73 73 73 73 73 73
TEN AG 19 - - - - - - 24 24 24 24 24
Sankofa NAG 61 117 49 60 90 90 90 90 180 180 180 180
N-Gas
56
45
44
60
60
60 60 60 60 60 60 60
Total Gas Supply 184 175 127 180 223 223 223 247 337 337 337 337
3.6.3 West to East Reverse Flow
Ongoing works to facilitate West to East Reverse Flow of gas using the WAPCo Gas Pipeline is expected
to be completed by April 2019. This will pave the way for Ghana Gas to supply natural gas to power
plants in the Tema Generation Enclave.
3.6.4 Fuel Allocation
Due to the limited quantities of natural gas supply in 2018 as projected above, fuel usage at the Tema
and Takoradi Power Enclaves shall be strategically managed as follows:

31 2019 Electricity Supply Plan
Tema
30 mmscf/day allocated to Sunon-Asogli power plants.
30 mmscf/day for VRA plants (TT1PP & KTPP) at Tema
TT2PP/TT2PP-X operate on natural gas (on standby).
Karpower to operate on HFO from January to September 2019 and then be relocated to Takoradi
to run on natural gas from Sankofa Fields in the last quarter of the year.
AKSA to operate on HFO
Takoradi
T1 to operate mainly of Gas
T2 to operate mainly on Gas
AMERI to operate mainly on Gas
Karpower to operate on Gas from Sakofa fields from September to December 2019.
3.6.5 Fuel Price
The following assumptions on price of fuel delivered made:
Nigeria Gas – US$ 7.4/mmbtu
Ghana Gas – US$ 7.4/mmbtu
Delivered LCO – US$ 70/barrel
Delivered HFO – US$ 84/bbl

32 2019 Electricity Supply Plan
2.7 Demand - Supply Analysis
This sub-section analyzes the demand – supply balance for 2019. The assumptions underpinning the
demand - supply projections for the year are as described above. The analysis begins with the projected
monthly energy generation from all the Generating Plants and is presented in the Table below. The
analysis of the monthly energy balance shows supply surplus in 2019. Therefore, the following criteria
are used to determine which Plants are dispatched on monthly basis:
a) Merit order dispatch including lower overall system losses.
b) Availability of fuel per Plant
c) Must-run Plants (e.g. Solar)
d) System stability Requirements
Table 25: Projected Monthly Generation in GWh
Table 26 on the other hand shows the annual energy and supply balance for 2019. It is seen from the
Table that the total generation from the VRA Plants is 8,867.94 GWh, representing 51.44% of the
projected total energy generation in 2019. Total generation from Bui Hydro and the other Independent
Power Producers (IPPs) totals 8,369.86 GWh, accounting for 48.56% of the projected total generation in
2019.
Customer Category2019 Proj. Consumption
(GWh)Jan Feb Mar Apr May Jun Jul Aug Sep Oct Nov Dec
Domestic 15,038.2 1,308.6 1,175.7 1,275.6 1,281.6 1,289.9 1,201.9 1,205.5 1,220.2 1,203.2 1,276.0 1,271.3 1,328.7
VALCO 1,283.8 108.9 98.3 108.9 105.6 109.7 104.6 108.6 109.2 106.1 108.6 106.1 109.2
Export (CEB+SONABEL+CIE) 915.8 67.6 61.3 67.6 80.1 82.7 79.6 80.1 80.2 78.2 80.2 78.2 80.2
Projected Energy Consumption 17,237.79 1,485.1 1,335.2 1,452.1 1,467.3 1,482.3 1,386.1 1,394.2 1,409.6 1,387.4 1,464.8 1,455.6 1,518.1
Generation Sources 2019 Projected Supply
(GWh)
Akosombo 4,258.5 377.1 340.6 341.4 364.9 377.1 364.9 297.3 377.1 299.2 377.1 364.9 377.1
Kpong GS 811.5 67.6 61.0 83.7 65.4 67.6 65.4 67.6 67.6 65.4 67.6 65.4 67.6
TAPCO 1,491.8 86.0 79.4 161.5 93.5 100.1 102.0 109.4 165.4 155.1 144.2 144.9 150.4
TICO 1,933.6 173.8 182.8 67.7 195.8 202.4 129.8 159.0 202.4 195.8 101.2 120.5 202.4
TT1PP 211.4 - 36.7 - - - - - 65.0 - 54.7 - 55.0
KTPP 158.2 43.6 - - - - - - 57.3 - 57.3 -
TT2PP -
VRA Solar 3.0 0.3 0.2 0.3 0.2 0.3 0.2 0.3 0.3 0.2 0.3 0.2 0.3
Imports From Cote d'Ivoire
Total VRA Generation 8,867.94 748 701 655 720 747 662 634 878 773 745 753 853
Bui GS 650.0 55.2 49.9 55.2 53.4 55.2 53.4 55.2 55.2 53.4 55.2 53.4 55.2
SAPP 161 715.4 62.4 50.7 56.9 60.4 57.0 60.4 62.4 62.4 60.4 62.4 60.4 59.3
SAPP 330 1,940.4 113.8 102.8 215.0 208.1 215.0 208.1 215.0 215.0 110.0 113.8 110.0 113.8
CENIT -
AMERI Power Plant 1,007.2 154.0 139.1 154.0 83.6 86.4 77.0 51.6 51.6 59.6 57.0 59.6 33.7
Karpower Barge 2,775.1 256.7 231.9 256.7 248.5 256.7 248.5 256.7 - 248.5 265.7 248.5 256.7
AKSA 1,227.0 90.0 56.0 55.0 89.0 60.0 72.0 115.0 143.0 78.0 161.0 166.0 142.0
CEN Power -
Amandi - 0
BxC Solar 27.0 2.3 2.1 2.3 2.2 2.3 2.2 2.3 2.3 2.2 2.3 2.2 2.3
Meinergy 27.0 2.3 2.1 2.3 2.2 2.3 2.2 2.3 2.3 2.2 2.3 2.2 2.3
Safisana 0.7 0.1 0.1 0.1 0.1 0.1 0.1 0.1 0.1 0.1 0.1 0.1 0.1
Total Supply (GWh) 17,237.79 1,485.1 1,335.2 1,452.1 1,467.3 1,482.3 1,386.1 1,394.2 1,409.6 1,387.4 1,464.8 1,455.6 1,518.1
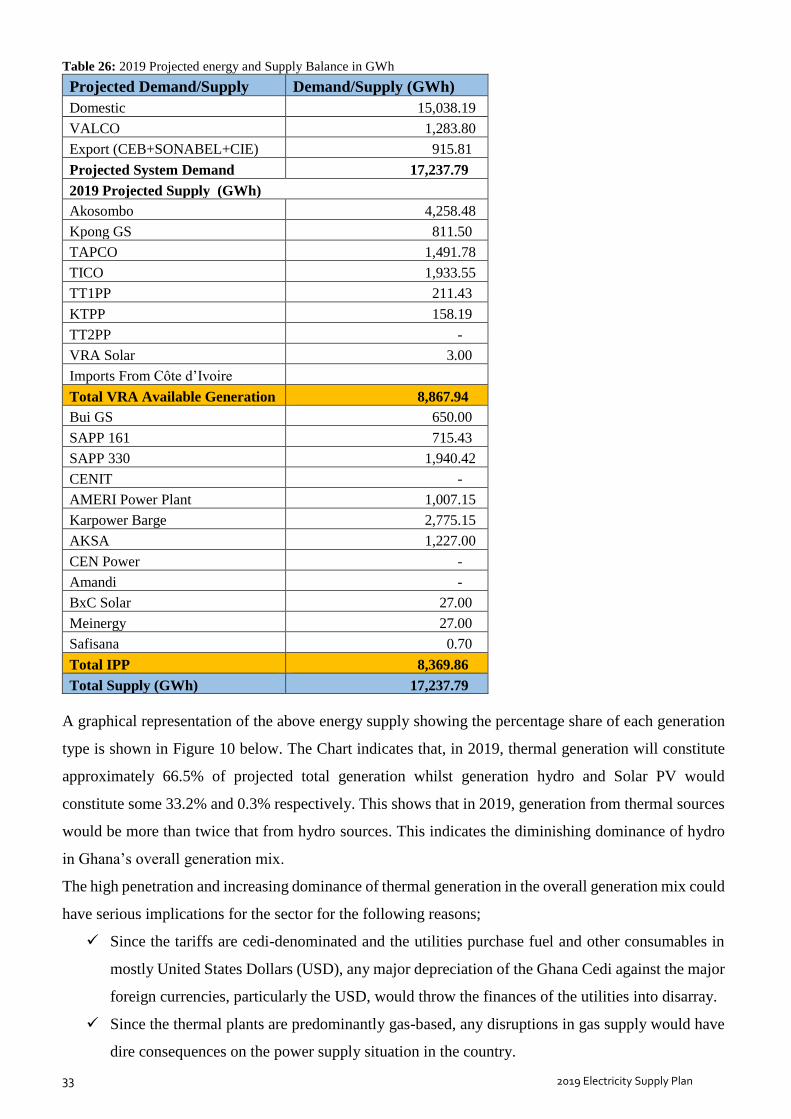
33 2019 Electricity Supply Plan
Table 26: 2019 Projected energy and Supply Balance in GWh
Projected Demand/Supply Demand/Supply (GWh)
Domestic 15,038.19
VALCO 1,283.80
Export (CEB+SONABEL+CIE) 915.81
Projected System Demand 17,237.79
2019 Projected Supply (GWh)
Akosombo 4,258.48
Kpong GS 811.50
TAPCO 1,491.78
TICO 1,933.55
TT1PP 211.43
KTPP 158.19
TT2PP -
VRA Solar 3.00
Imports From Côte d’Ivoire
Total VRA Available Generation 8,867.94
Bui GS 650.00
SAPP 161 715.43
SAPP 330 1,940.42
CENIT -
AMERI Power Plant 1,007.15
Karpower Barge 2,775.15
AKSA 1,227.00
CEN Power -
Amandi -
BxC Solar 27.00
Meinergy 27.00
Safisana 0.70
Total IPP 8,369.86
Total Supply (GWh) 17,237.79
A graphical representation of the above energy supply showing the percentage share of each generation
type is shown in Figure 10 below. The Chart indicates that, in 2019, thermal generation will constitute
approximately 66.5% of projected total generation whilst generation hydro and Solar PV would
constitute some 33.2% and 0.3% respectively. This shows that in 2019, generation from thermal sources
would be more than twice that from hydro sources. This indicates the diminishing dominance of hydro
in Ghana’s overall generation mix.
The high penetration and increasing dominance of thermal generation in the overall generation mix could
have serious implications for the sector for the following reasons;
Since the tariffs are cedi-denominated and the utilities purchase fuel and other consumables in
mostly United States Dollars (USD), any major depreciation of the Ghana Cedi against the major
foreign currencies, particularly the USD, would throw the finances of the utilities into disarray.
Since the thermal plants are predominantly gas-based, any disruptions in gas supply would have
dire consequences on the power supply situation in the country.

34 2019 Electricity Supply Plan
Figure 10: Contribution of Supply by Generation Types

35 2019 Electricity Supply Plan
2.8 Projected Capacity Situation
The projected monthly Supply capacity levels, taking planned units maintenance and Fuel Supply
Systems in to consideration is shown in Table 27.
Table 27: Projected Monthly Capacity Situation for 2019
The analysis of the above monthly demand and supply situation shows monthly positive generation
reserve margins of up to 56% in 2019, as such, supply challenges are not anticipated barring any
unforeseen fuel supply interruptions. With such a considerably high reserve capacity, it is anticipated
that some of the Power Plants may not be dispatched whilst others may be forced to operate well below
their full capacities.
2.9 Fuel Requirement
Currently, the main fuels for power generation include Light Crude Oil (LCO), Natural Gas and Heavy
Fuel Oil (HFO). The estimates of quantity and cost of fuel requirement in 2019 is indicated in Table 28.
Customer Category 2019 Proj. System Peak (MW) Jan Feb Mar Apr May Jun Jul Aug Sep Oct Nov Dec
Domestic 2358.26 2,290 2,300 2,357 2,356 2,343 2,259 2,174 2,176 2,253 2,331 2,358 2,288
VALCO 147.42 146 146 146 147 147 145 146 147 147 146 147 147
Export (CEB+SONABEL) 160.00 118 118 118 150 150 150 150 150 150 160 160 160
Projected System Demand 2665.68 2,554 2,564 2,621 2,653 2,641 2,554 2,470 2,473 2,550 2,637 2,666 2,595
Generation Sources Dependable Gen. Capacity (MW)
Akosombo 900 750 750 750 750 750 750 750 750 750 750 750 750
Kpong GS 105 105 105 105 105 105 105 105 105 105 105 105 105
TAPCO 300 200 200 200 300 300 300 300 300 300 300 300 300
TICO 320 320 320 320 320 320 320 320 320 320 160 160 320
TT1PP 100 - 100 0 100 0 100 0 100 0 100 0 100
MRP
KTPP 200 100 - 100 0 100 0 100 0 100 0 100 0
TT2PP 30
TT2PP-x 28
T3 0
VRA Solar 2.5
Imports From Cote d'Ivoire 0 - - - - - - - - - - - -
1,475 1,475 1,475 1,575 1,575 1,575 1,575 1,575 1,575 1,415 1,415 1,575
Bui GS 345 220 220 220 220 220 220 220 220 220 220 220 220
Bui Min Unit 4 4.0 4.0 4.0 4 4 4 4 4 4 4 4 4
SAPP 161 180 180 180 180 180 180 180 180 180 180 180 180 180
SAPP 330 350 175 175 350 350 350 350 350 350 175 175 175 175
CENIT 100 100 100 100 100 0 100 100 100 100 100 100 100
AMERI Power Plant 230 230 230 230 230 230 230 230 230 230 230 230 150
Karpower Barge 450 450 450 450 450 450 450 450 0 450 450 450 450
AKSA 350 350 350 350 350 350 350 350 350 350 350 350 350
CEN Power 340 - - - 340 340 340 340 340 340 340 340 340
Amandi 190 190
Trojan 44 39.6 39.6 39.6 39.6 39.6 39.6 39.6 39.6 39.6 39.6 39.6 39.6
Genser 22.4 22 22 22.4 22.4 22.4 22.4 22.4 22.4 22.4 22.4 22.4 22.4
Safisana 0.1
Meinergy 20
Solar (Central Region) 20
3,246 3,246 3,421 3,861 3,761 3,861 3,861 3,411 3,686 3,526 3,526 3,796
Surplus/deficit (MW) 692 682 800 1,208 1,120 1,307 1,391 938 1,136 889 860 1,201
460 462 472 477 475 460 445 445 459 475 480 467
27% 27% 31% 46% 42% 51% 56% 38% 45% 34% 32% 46%
Required Reserve (18% )
Actual Reserve Margin
Total VRA Available Generation
Total Available Generation (MW)

36 2019 Electricity Supply Plan
Table 28: Summary of Annual Fuel Requirements
PLANT LCO Natural Gas HFO
(Barrels) (MMbtu) (Barrels)
T1 15,668,149
T2 17,731,383
TT1PP 2,427,694
TT2PP
MRPP
KTPP 1,863,437
TOTAL VRA 37,690,663
CENIT
AMERI 11,360,507
Cenpower
SAPP+ SAPP Phase 2 22,270,931
Karpower 8,919,587 2,447,363
AKSA 2,861,364
TOTAL IPP 42,551,026 5,308,727
TOTAL (VRA&IPP) 80,241,689 5,308,727
The summary of major fuel requirements for 2019 is as presented below:
LCO: There would be no significant requirement for LCO in 2019 due to anticipated high
volumes of gas from Sankofa, Jubilee and TEN fields.
Natural Gas: Based on the assumed gas supply from Nigeria and Ghana, the total natural gas
consumption is projected to be about 80.24 million mmbtu. VRA plants will use about 37.69
million mmbtu and IPPs some 42.55 million mmbtu.
HFO: Karpower is expected to operate on HFO from January to September 2019. The AKSA
Plant is also scheduled to operate on HFO through the year. Therefore, an estimated 5,308,727
barrels would be required by AKSA and Karpower.

37 2019 Electricity Supply Plan
3.9.1 Monthly Fuel Requirement
The breakdown of Monthly fuel requirements and their associated costs are as shown in Figure 29 below.
Table 29: Monthly fuel requirements and associated costs
Units Jan Feb Mar Apr May Jun Jul Aug Sep Oct Nov Dec Total
Estimated Thermal Fuel Requirement Units
TAPCO - LCO barrels -
TAPCO - GAS mmbtu 1,153,362 1,064,612 2,167,043 1,253,739 1,342,714 911,837 978,433 1,479,244 1,386,702 1,289,797 1,295,535 1,345,131 15,668,149
TICO - LCO barrels -
TICO - GAS mmbtu 2,060,407 2,166,813 802,743 2,321,585 1,599,314 1,025,712 1,256,575 1,599,314 1,547,724 799,657 952,224 1,599,314 17,731,383
TT1PP - GAS mmbtu - 421,575 - - - - - 746,330 - 627,955 - 631,834 2,427,694
MRP - GAS mmbtu - - - - - - - - - - - - -
KTPP - Gas mmbtu 514,004 - - - - - - - 674,719 - 674,714 - 1,863,437
TT2PP - GAS mmbtu - - - - - - - - - - - - -
IPP Plants -
VRA/AMERI Power Plant - GAS mmbtu 1,737,183 1,569,068 1,737,183 942,995 974,429 868,118 582,075 582,075 672,458 642,593 672,458 379,874 11,360,507
Karpower Barge - HFO barrels 357,869 323,237 357,869 346,325 357,869 346,325 357,869 - - - - - 2,447,363
Karpower Barge - GAS mmbtu 2,174,003 2,325,110 2,174,003 2,246,470 8,919,587
SAPP - GAS mmbtu 646,694 525,158 589,548 625,831 590,118 625,831 646,694 646,694 625,831 646,694 625,831 614,299 7,409,223
SAPP (Phase 2) - GAS mmbtu 871,594 787,345 1,646,808 1,593,685 1,646,808 1,593,685 1,646,808 1,646,808 842,490 871,594 842,490 871,594 14,861,707
CENIT - LCO barrels -
Cenpower - LCO barrels
AKSA - HFO barrels 209,880 130,592 128,260 207,548 139,920 167,904 268,180 333,476 181,896 375,452 387,112 331,144 2,861,364
ESTIMATED FUEL COST
Total VRA LCO - Cost @ US$ 70/bbl MMUS$ - - - - - - - - - - - - -
Total VRA Gas - Cost @ US$ 7.4/mmbtu MMUS$ 27.59 27.03 21.98 26.46 21.77 14.34 16.54 28.30 26.71 20.11 21.63 26.46 278.91
Total VRA Fuel Cost MMUS$ 27.59 27.03 21.98 26.46 21.77 14.34 16.54 28.30 26.71 20.11 21.63 26.46 278.91
Total VRA Imports Cost @ US$ Cents 12/kWh MMUS$ - - - - - - - - - - - - -
Total VRA Cost of Fuel & Imports MMUS$ 27.59 27.03 21.98 26.46 21.77 14.34 16.54 28.30 26.71 20.11 21.63 26.46 278.91
IPP Fuel Cost
Total IPP LCO - Cost @ US$ 70/bbl MMUS$ - - - - - - - - - - - - -
Total IPP Gas - Cost @ US$ 7.4/mmbtu MMUS$ 24.09 21.32 29.40 23.40 23.76 22.85 21.28 21.28 31.93 33.20 31.93 30.43 314.88
Total IPP HFO - Cost @ US$ 84/bbl MMUS$ 47.69 38.12 40.83 46.53 41.81 43.20 52.59 28.01 15.28 31.54 32.52 27.82 445.93
Total IPP Fuel Cost MMUS$ 71.78 59.45 70.24 69.93 65.58 66.04 73.87 49.29 47.21 64.73 64.45 58.25 760.81
Total Cost MMUS$ 99.37 86.48 92.22 96.39 87.35 80.38 90.41 77.60 73.92 84.84 86.07 84.71 1,039.72

38 2019 Electricity Supply Plan
2.10 Estimates of Fuel Cost
The breakdown of the estimated cost of fuel for running all the Thermal Plants in 2019 is presented in
the Table 30. Based on the assumed unit prices, the total estimated fuel cost for the Thermal Plants is
US$ 1.04 Billion. This translates into an approximate monthly average of US$ 86.64 Million.
This total cost comprises US$ 278.91 Million or approximately US$ 23.24 Million per month for the
VRA Plants and US$ 760.81 Million or monthly average of US$ 63.40 Million for the Non-VRA Plants.
Table 30: Breakdown of Estimated Fuel Cost for 2019
Type of Fuel Cost (Million USD)
VRA - LCO -
VRA - GAS 278.91
TOTAL VRA FUEL COST 278.91
IPP - LCO
IPP - GAS 314.88
IPP - HFO 445.93
TOTAL IPP FUEL COST 760.81
TOTAL VRA & IPP COST 1,039.72

39 2019 Electricity Supply Plan
5. TRANSMISSION SYSTEM PERFORMANCE
2.1 Status of Ghana Transmission Grid
Within Ghana, electricity is transmitted at three main high voltage levels, namely; 69 kV, 161 kV and
330 kV. The 225 kV voltage lines within Ghana currently, only enables Ghana to interconnect with its
western neighbour, La Côte d’Ivoire and northern neighbour, Burkina Faso. A similar interconnection
with Togo is however through two 161 kV lines and a 330 kV line.
The Ghana transmission network consists approximately of 5,965.83 circuit kilometres of high voltage
transmission lines which connect generating plants at Akosombo, Kpong, Tema, Bui and Aboadze to
some sixty-four (64) Bulk Supply Points across the nation. The network has 134 transformers installed
at various load centres across the country with a Total Transformation Capacity of 7,191.20 MVA.
The National Interconnected Transmission System (NITS) has over 600 MVArs of fixed shunts installed
at various Substations including Achimota, Mallam, Smelter, Winneba, Takoradi, Kumasi etc. and a 40
MVArs of Static Synchronous Compensator (STATCOM) installed at the Tamale substation. The fixed
shunts and the STATCOM complement the generating units in providing the reactive power
requirements of the NITS, in order to maintain good voltages and minimize overall transmission losses.
The System Control Centre (SCC) in Tema is responsible for the real time dispatch (monitoring,
coordination and control) of the Ghana Power System as well as cross-border power exchanges with
neighboring countries. SCC is equipped with a Network Manager System (NMS), which is the main tool
used to monitor and control dispatch operations on the Ghana Power System.
2.2 Transmission Line, Feeder and Substation Availability
The criteria used for ensuring high transmission Line, Feeder and Substation availability are as presented
below:
All existing transmission lines are expected to be in service in 2019 to ensure transmission of
electricity from the generation stations to the Bulk Supply Points across the nation and to enable
the execution of power exchanges with neighboring countries.
Maintenance work on transmission lines and substations is to be organized in order not to
significantly affect power supply to customers except for single transformer substations and
consumers served on radial lines.

40 2019 Electricity Supply Plan
2.3 Steady State Network Analysis
Network analyses are carried out as part of the process for establishing a Supply Plan in order to
determine transmission line loadings, substation bus voltages and network loss levels across the
transmission network. In particular, the analyses seek to determine:
Transmission line constraints to the evacuation of power from the generating stations to the Bulk
Supply Points;
The ability of the entire power system to withstand an N-1 contingency (i.e. forced outage of a
single network element) e.g. transmission line, generator, transformer, etc;
Reactive power demand on the NITS and the level of VAr generation from the generating units;
Adequacy of reactive power compensation in the transmission network in achieving acceptable
system voltages;
Overall stability of the Ghana Power System;
Overall transmission system losses during peak and off-peak periods;
The impact of locational imbalance in generation resources.
4.3.1 Technical Adequacy Criteria
The following criteria were used to assess the performance of the system under both normal and
contingency conditions.
a. Normal Condition
Table 31: Criteria, normal condition
Parameter Range
Bus Voltages 0.95 pu to 1.05 pu
Transmission Line Power flows not exceeding 85% of Line Capacity
Transformers Not exceeding 100% (nameplate rating)
Generators Not exceeding their Capability Curves
b. Contingency Conditions
Table 32: Criteria, contingency condition
Parameter Range
Bus Voltages 0.90 pu to 1.10 pu
Transmission Line Power flows not exceeding 100% of Line Capacity
Transformers Not exceeding 120% of Nameplate Rating
Generators Not exceeding their Capability Curve
c. Technical Analysis
Load Flow analyses were carried out to determine the transfer capability and assess the level of reliability
of the transmission network to evacuate power from the generation centres to the various Bulk Supply
Points.

41 2019 Electricity Supply Plan
Loadings on transmission lines and other power equipment are monitored to determine whether there are
any limit violations. Also overall transmission system losses are compared to determine the impact of
generation and transmission investments on grid performance.
d. Assumptions and Development of a Base Case
The study was carried out on the 2019 network model as highlighted in Section 3 of this report.
e. Generation Additions
The 350 MW Cenpower Plant located in Tema and the 192 MW Amandi plant located in Aboadze are
expected to be commissioned into service in the second half of 2019.
f. Transmission Additions
The following transmission lines under construction modeled to assess their impact on the grid:
Transmission Lines
330 kV, Aboadze – Prestea - Kumasi Transmission line Project.
330 kV, Kintampo – Tamale - Bolgatanga Transmission line Project.
161 kV, Asawinso – Juabeso Transmission line Project.
161 kV, Volta – Accra East - Achimota Transmission line reconstruction
330 kV, Sekondi – Aboadze Transmission line Project for Karpower evacuation.
Substations
Partial completion of 330kV Aboadze Switchyard Expansion,
Kintampo 330kV
330kV Adobiyile
4.3.2 Summary of Results for the Steady State Network Analysis
The following scenarios were studied:
2019 Base Case with current system conditions.
2019 Base Case with commissioning of the 330kV Aboadze – Prestea – Kumasi line.
2019 Base Case with:
330 kV Aboadze – Prestea – Kumasi
330 kV Kintampo – Tamale – Bolgatanga
2019 Cases above with:
Relocation of 450MW KarPower barge to Sekondi and the construction of the 330kV
Sekondi - Aboadze line. This Case determines the impact of the KarPower in the West
(Sekondi) as compared to the East (Tema).

42 2019 Electricity Supply Plan
2019 Cases above with:
Maximum generation from the West
Maximum generation from the East
Balanced generation case
2019 Cases above with:
161kV Volta – Accra East- Achimota – Mallam transmission line upgraded.
4.3.2.1 Results of load Flow simulations
Q1: 2019 Base Case with current 2018 System conditions
This Case has a Peak demand of 2,539 MW, the results of the load flow simulations indicate average
transmission losses of 149.6 MW (~6%). This loss increment is attributable to increased Ghana system
demand and export to SONABEL on the 161kV Network. The Volta – Accra East – Achimota corridor
records 92% loading whilst the Achimota – Mallam line is overloaded to 107% due to the introduction
of Accra Central GIS. With the upgrade of the 161kV Volta – Achimota – Mallam corridor, the overloads
are expected to reduce. In the West, overloads will be recorded on the 161kV Tarkwa – New Tarkwa
line recording 106% of its line capacity. With the commissioning of the 330kV Aboadze – Kumasi line,
the line overloads will reduce.
Q2: 2019 Base Case with commissioning of the 330kV Aboadze – Prestea – Kumasi line
The load flow results indicate that system losses reduce to 110MW (4.81%). The new line carries
232MW from Aboadze towards Kumasi. This reduces the loading on the 161kV lines connecting
Aboadze to Prestea and clears the 161kV Tarkwa – New Tarkwa overloads. However, the Volta –
Achimota – Mallam lines remains overloaded.
Q3: 2019 Base Case with commissioning of the 330kV Aboadze – Kumasi and Kintampo – Tamale-
Nayagnia (Bolgatanga) lines.
System losses further reduces to 97.7MW (4.24%) due to the introduction of the 330kV line from
Kintampo to Nayagnia. The export to SONABEL increases from 53MW in the Base Case to 78MW on
the average. The 161kV Volta – Achimota – Mallam lines still remain highly loaded.
Q3: 2019 with previous case with introduction of 450MW KarPower Barge at the West.
This simulation is similar to the previous case except that 450MW KarPower Barge has been relocated
to the West. This relocation is to enable GNPC utilize all indigenous gas from the Sankofa, Jubilee and
Ten Fields in fulfilment of the Take or Pay Gas Contracts.
The simulation indicate that system losses increase from 97.7MW in the previous case to 104.86MW
(~7MW). The 330kV lines from Aboadze to Kumasi and Volta are loaded at 310MW and 183MW

43 2019 Electricity Supply Plan
respectively. The Autotransformers at Volta are loaded at 77% whilst Achimota – Mallam line remains
overloaded at 103%.
Q3: 2019 with previous case with Maximum generation in the West.
This case simulates the severest impact on the grid with majority of the Power Plant at Aboadze in
service. It is similar to the previous case except for increased generation from the Aboadze Enclave. Due
to gas contractual arrangements, this scenario is likely to occur and may be the must run scenario for
2019. System losses increases by 18MW to 122.9MW (4.86%). There will be low voltages in Achimota,
Mallam, Accra Central and Winneba. The 161kV Volta – Achimota – Mallam and Aboadze – Mallam
corridors will be overloaded. In this case the most critical issue will be the overload of the 330/161kV
Autotransformers at Volta (105%). As indicated in the 2018 Supply Plan, the relocation of KarPower
should be accompanied with A4BSP to utilize power on the 330kV to directly serve the loads in Accra.
In the absence of A4BSP the excess power overloads the autotransformers at Volta along with huge
losses in the transformers.
Q3: 2019 with previous case with Maximum generation in the East.
This simulation depicts a scenario where all the Hydro units at Akosombo are engaged and
complemented with Thermals in Tema. The load flow indicates that system losses will be 97.3MW
(3.91%) of generation. This is due to the close proximity of generation to the loads in Accra and Tama.
However, the 161kV Volta – Accra East lines will be overloaded at 96% as well as the short line from
KTPP- Volta overloaded at 109% with two units (220MW) engaged at KTPP. The 161kV Achimota –
Mallam line remains overloaded at 116%. An upgrade of the corridor will reduce the overloads and
further reduce losses.
Q3: 2019 with previous case with balanced generation in the West.
With a more balanced generation from both Eastern and Western generation enclaves, some line
overloads and bus voltage violations are recorded in the Accra to Tema areas. The 161kV Volta – Accra
East lines are loaded at 94% of its line capacity. There are observed low voltages at the Winneba, Mallam
and Accra Central substations. System losses recorded for this case is 105MW (4.18%).
Q3: 2019 with 161kV Volta – Achimota – Mallam lines upgraded.
The upgrade of the 161kV Volta – Achimota – Mallam lines from the simulations proves to be a better
case with improved system conditions. Line overloads from previous case above are cleared as well as
improved substation voltages at the flagged substations (i.e. Winneba, Mallam and Accra central).
Voltages at Mallam improves from 143kV to 152.5kV System losses improve as this case records

44 2019 Electricity Supply Plan
approximately 96.6 MW representing 3.86% of total system generation. This case hence represents the
ultimate scheme of developments expected in the Network to ensure improved system performance.
Contingency Analyses
In 2019, Aboadze will be the biggest Generation hub in Ghana with the inclusion of Amandi and the
relocation of the KarPower Barge. With a total generation capacity of approximately 1,540 MW power
flow studies indicate that contingencies out of the Aboadze Enclave towards load centres will have the
greatest impact on the grid. The contingencies are ranked in order of severity and are as follows:
a) 330kV Aboadze – Prestea – Kumasi line
Since it carries over 300MW at peak, a loss of the line means that 330 MW needs to be re-routed on
161kV lines from Aboadze – Kumasi. This may lead to system disturbances triggered by overload
tripping of 161kV lines from Aboadze to Prestea.
b) 161kV Kumasi – Anwomaso line
A strategic line connecting the 330kV from Aboadze to Kumasi, serving as an extension of the 330kV
to link the Network in Kumasi. An outage on the line collapses the load flow case. A solution is to
upgrade the line to a double circuit.
c) 161kV Aboadze – Mallam (Coastal lines)
A low capacity double circuit line that connects the load centres in Accra through Cape Coast and
Winneba. Due to the overload on the Volta autotransformers, the corridor carries excess power and gets
overloaded. In a contingency, the power it carries is transferred to the 330kV line but for the same
Autotransformer overloads the load flow case diverges.
d) 161kV Aboadze – Tarkwa line
A contingency on this line due to its higher capacity overloads the small capacity 161kV lines from
Aboadze – Takoradi – Tarkwa – New Tarkwa.
e) 330kV Kintampo – Tamale lines
An outage on the 330 kV Volta –Aboadze line results in overloads on the 330/161 kV auto transformers
at Volta, however with the Pokuase (A4BSP) station in service the overload situation clears.

45 2019 Electricity Supply Plan
4.3.3 Radial Lines and Single Transformer Stations
The following lines in the NITS are presently radial and therefore the customers served by these lines
suffer complete blackout anytime the lines are out-of-service. For the single transformer stations,
customers served by these transformers also suffer complete blackout anytime they go out-of-service.
Radial Lines
161 kV Takoradi – Esiama Line
161 kV Bogoso – Akyempim Line
161 kV Bolgatanga – Zebilla – Bawku Line
161 kV Tamale –Yendi Line
69 kV Asiekpe – Sogakope Line
69 kV Asiekpe – Ho – Kpeve – Kpandu -Kadjebi Line
Single Transformer Stations
Sogakope
Yendi
Esiama
Dunkwa
Konongo
Ayanfuri
Obotan
Mim
Buipe

46 2019 Electricity Supply Plan
6. POTENTIAL SUPPLY CHALLENGES IN 2019
This chapter presents the challenges that may occur during 2019 and its mitigation measures.
2.1 Managing the Hydro Risk
Due to the above-average inflow into the Akosombo and Bui hydro dams in 2018, optimum amount of
generation from hydro is expected. This however, requires proper coordination of maintenance activities.
The availability and reliability of the thermal units are also very key to maintain the planned hydro draft
rate.
2.2 Thermal Fuel Supply Risk
Reliability of Gas supply from WAGP and Ghana Gas Company remains a major risk to electricity
supply reliability in Ghana. Although, there is high installed generating capacity, any disruptions in fuel
supply, mostly gas, could adversely impact supply reliability.
5.2.1 Gas Supply Disruptions
There is a planned total shutdown of the Atuabo gas processing plant for two (2) week in April 2019.
This is to enable Ghana Gas to interconnect its systems with the West African Gas Pipeline Company
(WAPCO) for reverse gas flow to Tema through the WAGP pipeline. This would result in the
curtailment of gas supply from Ghana Gas to Aboadze generation enclave.
2.3 Supply Reliability of Customers served by Radial Lines and Single
Transformer Stations
5.3.1 Radial lines
Currently, supply reliability to customers served via single circuit radial lines is quite low. This is
because an outage on such single circuit radial lines interrupts supply to such customers. The following
are some of the single circuit radial lines on the NITS:
Tamale – Yendi line;
Takoradi – Esiama line;
Bogoso – Akyempim line;
Bolga - Zebilla line;
Zebila – Bawku line
Kpando – Kadebi
Asiekpe - Sogakope
Supply reliability to customers served on these lines would improve in future when such lines are
upgraded through construction of additional line(s) or by looping them into other adjoining substations.

47 2019 Electricity Supply Plan
5.3.2 Single Transformer Stations
Similar to single circuit radial lines, consumers supplied by single transformer substations also suffer
low level of supply reliability. Consumers facing such challenges are those in Akosombo Township,
Yendi, Sogakope and Esiama. Since these townships are supplied via single transformer stations,
Maintenance and/or upgrade works at these stations are often a challenge due to difficulties in securing
outages.
5.3.3 Power Evacuation
There are also transmission capacity constraints in some portions of the network which could lead to
transmission line overloads:
Insufficient reactive power compensation could lead to poor customer supply voltage in areas
such as Kumasi, Accra, and some parts of the Western region
Some sections of the NITS do not satisfy the N-1 criteria and will be unable to withstand some
single line/transformer contingencies
48 2019 Electricity Supply Plan
7. DISTRIBUTION OUTLOOK
2.1 ECG Network
Based on sub-transmission reliability studies undertaken by ECG, a number interventions and projects
were commissioned in 2018 or currently underway and expected to be completed in 2019 to resolve
various constraints of low voltages, feeder and transformer overloads during firm and non – firm
conditions. Some of the key projects under construction are the following:
Installation Voltage regulators at Nsawam, Mampong and Aburi to improve voltages
Construction of the Pokuase BSP, this project is under construction- Upon completion it will
boost voltage support to Dodowa, Mampong, Aburi and Ofankor. it will also improve reliability
by serving as an alternative to Achimota BSP and Afienya BSP
Construction of Afienya BSP- this will boost voltage at Dodowa, Mampong and Aburi
Ongoing construction of the Asekyem primary substation - To support load on the Ridge (“A”)
and Amanfrom substations
The details of the expansion projects are attached in Appendix B
2.2 NEDCo Distribution Network
Power supply reliability in NEDCo Areas is generally good. However, reliability in some areas of the
network has been lower than expected due to over extension of these lines and over-ageing resulting in
high technical losses. Some of these lines have been extended, as part of Self Help Electrification Project
(SHEP) implementation, beyond technically allowable distances. Some interventions, however, have
been made on some of these lines resulting in improved supply reliability on them.
The following are the lines and substations/equipment in NEDCo with challenges affecting supply
reliability to customers. Short-Medium term as well as long-term solutions being pursued are also
indicated.
6.2.1 Sunyani-Berekum-Dorma/Sampa 34.5 kV Line
This line takes its source from GRIDCo’s BSP in Sunyani. The increased load on this line has resulted
in low voltages to customers; especially, in some sections of Berekum, Dorma Ahenkro, Sampa and its
environs. There was also inadequate protective/control equipment at various branches of the lines. This
results in outage to the entire line when there is a fault on any section of the line.
6.2.2 Network Reinforcement and Technical Loss Reduction Strategy to Resolve Challenges
Autoreclosers have been installed at selected portions of the line to ensure that faulty portions of the line
are isolated automatically without interrupting supply to the entire line. Some distribution transformers

49 2019 Electricity Supply Plan
have also been installed in some communities within the distribution network to improve supply voltages
to customers.
As part of the implementation of the JICA funded Distribution Master Plan for Ghana, which was
completed in 2008. A 161/34.5kV BSP was proposed in Berekum to improve the supply voltages in the
Berekum and Dorma Ahenkro areas. GRIDCo is now constructing the proposed 161/34.5kV BSP at
Berekum. This new substation when completed, will improve the low voltage situation in the area.
6.2.3 Yendi-Bimbilla-Kete Krachi 34.5kV Line
This 34.5kV line takes its source from GRIDCo’s BSP in Yendi. This line is very long with high voltage
drops resulting in low voltages on some sections of the line. There is also inadequate protection/control
equipment on the line for segregation of faults.
6.2.4 Network reinforcement and technical loss reduction strategy to resolve challenges
A contract has been awarded for the installation of Autoreclosers and Sectionalizers on the line to
minimize outages on the line in the medium term. Some distribution transformers have been installed in
the distribution network to improve supply voltages to customers in the affected communities.
As part of the implementation of the JICA funded Distribution Master Plan for Ghana, a booster station
was proposed in Bimbilla to improve the voltage on the Yendi-Bimbilla- Kete-Krachi line. The Korea
EXIM Bank is proposing to fund the construction of this 20MVA booster/switching station. As part of
this construction, separate feeders with independent protection/control devices will be provided to
improve supply reliability in the Bimbilla and Kete-Krachi area.
The long-term measure to improve supply reliability in the Area is to construct a 161/34.5 kV BSP in
Kpandai to improve power supply to Bimbilla, Salaga, Kpandai and Kete-Krachi areas. NEDCo has also
communicated this request to GRIDCo for consideration.
6.2.5 Yendi-Gushegu-Gambaga-Bunkprugu 34.5kV Line
This 34.5kV line also takes its source from GRIDCo’s BSP in Yendi. This line is one of the longest lines
with numerous branches due to SHEP. There are no protective/control equipment on the branches for
segregation of faults. The effect is that a fault on a branch results in outage to the entire line, resulting in
increased and prolong outages.
6.2.6 Network Reinforcement and Technical Loss Reduction Strategy to Resolve Challenges
A contract has been awarded for the installation of Autoreclosers and Sectionalizers on the line to
minimize outages on the line in the medium term. Another measure being taken is to construct a 14km
line from Garu to transfer part of the load to the Bawku primary substation, which is fed from the Bawku
BSP.
The long-term measure to improve supply to the Gambaga, Gushiegu and Bunkprugu areas is to construct
a 161/34.5 kV BSP at Walewale to serve, not only Gambaga, Gushiegu and Bunkprugu areas, but also

50 2019 Electricity Supply Plan
serve the Walewale and Yagaba areas. Yagaba is currently served from the Bolgatanga BSP, a distance
of about 140km away. Gambaga and Gushiegu are located about 140km from the Yendi BSP. Walawale
is therefore seen as an ideal place for the construction of a 161kV substation. NEDCo has communicated
this request to GRIDCo.
6.2.7 Tamale-Dalun-Nasia 34.5kv Line
This 34.5kV line takes its source from GRIDCo’s BSP in Tamale. This line is one of the longest lines
with numerous branches due to SHEP. There are inadequate protective/control equipment on the
branches of the line for segregation of faults. The effect is that a fault on a branch results in outage to the
entire line, resulting in increase and prolong outages.
6.2.8 Network Reinforcement and Technical Loss Reduction Strategy to Resolve Challenges
A contract has been awarded for the installation of Autoreclosers and Sectionalizers on selected portions
to minimize outages on the line in the medium term. A switching station is to be constructed in the line
at Gumo in order to create separate feeders with independent protection/control equipment.
6.2.9 Wa-Jirapa-Nandom-Hamile 34.5kV Line
This 34.5kV line takes its source from NEDCo’s primary substation in Wa which also takes its source
from the GRIDCo’s BSP in Wa. This line serves various districts including Nadowli, Jirapa/Lambusie,
Lawra and Nandom. The Wa - Hamile line is about 110km long and has numerous branches with
inadequate protective/control equipment at the branches of the line for segregation of faults. The effect
is that a fault on a branch results in outage to the entire line. Also, there is low voltage at the receiving
end of the line due to the length of the line, and increasing load.
6.2.10 Network Reinforcement and Technical Loss Reduction Strategy to Resolve Challenges
A contract has been awarded for the installation of Autoreclosers and Sectionalizers on selected portions
to minimize outages on the line in the medium term. Work is yet to start, but it is expected that outages
on the line will be minimized after the completion of work. NEDCo has proposed to construct a
switching/booster station at Domwine to improve the voltage on the line and create separate lines with
independent protective/control equipment. The long-term measure being considered is the construction
of 161/34.5kV BSP at Nandom to improve power supply quality in the north-western part of the Upper
West region. NEDCo has communicated this request to GRIDCo.
6.2.11 Obsolete Switchgears at Navrongo and Bawku Substations
Switchgears and associated facilities at NEDCo’s primary substations at Bawku and Navrongo are
obsolete and unreliable.

51 2019 Electricity Supply Plan
6.2.12 Network Reinforcement and Technical Loss Reduction Strategy to Resolve Challenges
Some obsolete parts of the switchgears have been replaced to improve the reliability of the switchgears.
A contract has been awarded for the replacement of the switchgears and associated facilities.
6.2.13 Rampant Power Theft Militating Against Reliable Supply
NEDCo is challenged with widespread power theft, especially in its Northern Area that needs immediate
intervention. The situation is delicate as culprits steal with impunity with their expectation of getting
political and chieftaincy support.
This situation is increasing NEDCo’s commercial losses day by day to a level that is gradually becoming
unbearable and affecting reliable power supply.
6.2.14 Commercial Loss Reduction Strategy
NEDCo is investing in capital intensive projects such as relocating existing meters unto pole-tops,
replacing existing meters with smart prepaid meters and replacing bare conductors with bundled
conductors.

52 2019 Electricity Supply Plan
8. OVERVIEW OF MEDIUM-TERM SUPPLY: 2020 - 2024
In this chapter, the medium-term (2020 - 2024) peak demand and consumption forecast to serve as a
guide for power system investment and planning is presented. Typically, it takes at least five years for
conventional power plant projects to transition from conception through funding arrangements, detail
design, construction to commissioning and commencement of commercial operation. This section
therefore provides an outlook for generation and transmission system requirements for the next five years
(2020 – 2024) to enable adequate and timely measures to be put in place to ensure security of supply in
the Ghana Power System over the medium term. The high case demand scenario was used for the
analyses.
2.1 Demand Outlook
The Projected electricity demand over the period 2020 – 2024 is based on the ESP committee load
forecast. It covers natural growth in domestic demand over the period and some Spot Loads. The
expected spot loads for the period are as follows:
VALCO is expected to run 2 pot-lines (147 MW) in 2019 till 2022 when the demand increases
to 300 MW. The demand is expected to further increase to 500 MW by 2024
Mines:
Newmont Mines, Ahafo - demand is expected to increase by 10 MW in 2019 and a
further increase of 12.5 MW in 2021 at Ahafo-North.
Azuma Mines - 18 MW by 2022 at Yagha (50km North West of Wa)
Potential Exports:
Export to Burkina Faso is expected to increase to 150 MW from 2020;
Export to CEB is projected to be 120 MW from 2020
Export to Mali is expected to increase from 50 MW in 2023, to 100 MW by 2024
For the high case growth scenario, total electricity consumption of Ghana including power exports to
Togo, Benin, Burkina Faso and Mali is projected to increase from 20,071 GWh in 2020 to 28,999 GWh
in 2024 at a Compound Annual Growth Rate (CAGR) of approximately 9.6 %. The system peak demand
is projected to increase from 3,073 MW in 2020 to 4,394 MW in 2024.
The summary of 2020-2024 projected demand is illustrated in Tables 33 and 34.
Table 33: Projected High Case Energy Demand (GWh) (2020- 2024)
Energy Consumption
(GWh) 2020 2021 2022 2023 2024
Domestic 17,065 18,393 19,841 21,222 22,241
VALCO 1,284 1,284 2,628 2,628 4,380
Exports 1,721 1,721 1,721 2,050 2,378
TOTAL 20,071 21,399 24,190 25,900 28,999

53 2019 Electricity Supply Plan
Table 34: Projected High Case Peak Demand (MW) (2020- 2024)
Peak Demand (MW) 2020 2021 2022 2023 2024
Domestic 2,655 2,853 3,076 3,291 3,524
VALCO 147 147 300 300 500
Exports 270 270 270 320 370
TOTAL 3,073 3,270 3,646 3,911 4,394
2.2 Projected Supply Outlook
The power supply outlook was prepared considering the existing and committed capacity additions.
The assessment of generation adequacy is based on ensuring that sufficient generation resources are
available to meet the forecast demand plus the required 18% capacity reserve margin.
7.2.1 Existing Generation
The existing power supply facilities are made up of hydro, thermal and renewable energy sources. The
breakdown of projected high case demand versus expected supply from the existing generation resources
is as shown in Table 35.
Supply Assumptions
The following assumptions were made for Hydro Power Generation:
Akosombo & Kpong GS. Provision was made for the sustenance of the Akosombo reservoir. A
maximum of five (5) units were assumed over the period 2020 - 2021. From 2022 onwards, all the six
(6) units are expected to be available to support peak demand. Akosombo & Kpong are assumed to
generate a total of 4,800 GWh per annum over the period 2020-2021 and a total of 5,000 GWh in the
period 2022 -2023. It is assumed that from 2024 onwards, the firm output of 5,300 GWh per annum
would be generated by Akosombo and Kpong Plants.
Bui Generating Station. Bui hydro is assumed to produce about 756 GWh of electricity/year from
2019. Bui GS is assumed to generate an average of 230 MW during peak period to support peak
demand.
7.2.2 Committed Generation Projects
The following are the committed generation additions expected to come on line in the medium-term:
Projects Under Construction
Amandi Energy Limited: This is a 192 MW combined-cycle power plant expected to be
commissioned by 2019. The plant is located within the Aboadze Enclave.
Early Power: This is a 400 MW power plant to be located at Tema and is expected to be
commissioned in last quarter of 2019.
Projects not Under Construction
Marinus Energy:This is a 26.5 MW thermal plant to be located at Atuabo in the Western
Region. The plant is expected to come on line by 2021.

54 2019 Electricity Supply Plan
Jacobson Jelco: This is a 360 MW combined-cycle power plant to be located at Aboadze and
expected to be commissioned in 2021.
Rotan Power Limited: This is a 634 MW combined-cycle power plant. 300 MW is expected
to be commissioned in 2023 and the remaining 334 MW in 2025.
Table 35: Projected High Case Demand and Supply balance (2020- 2024)
Projected Demand Projected
Capacity Demand (MW) 2020 2021 2022 2023 2024
Domestic 2,655 2,853 3,076 3,291 3,524
VALCO 147 147 300 300 500
Exports 270 270 270 320 370
TOTAL 3,073 3,270 3,646 3,911 4,394
Projected Demand + 18% Reserve Margin 3,626 3,859 4,303 4,615 5,184
Existing Generation Capacity MW
Akosombo 1020 750 750 900 900 900
Kpong GS 160 105 140 140 140 140
Bui GS 400 100 100 100 100 100
TAPCO 330 300 150 150 320 320
TICO 340 320 320 320 320 320
TT1PP 110 100 100 100 100 100
MRP 0 0 0 0 0 0
KTPP 220 200 200 200 200 200
TT2PP 70 70 70 70 70 70
AMERI Power Plant 240 230 230 230 230 230
Karpower Barge 450 450 450 450 450 450
Asogli (SAPP(Phase 1)) 200 180 180 180 180 180
Asogli (SAPP (Phase 2)) 360 350 350 350 350 350
CENIT 110 100 100 100 100 100
AKSA 370 330 330 330 0 0
CENPOWER 360 340 340 340 340 340
VRA Solar 2.5
Solar (Central Region) 40
Total Existing Generation
4,782.50
3,925.00
3,810.00
3,960.00
3,800.00
3,800.00
Committed
Amandi Energy Ltd. (under construction) 192 190 190 190 190 190
VRA T3 132
Early Power Limited (under construction) 400 145 190 190 390 390
Marinus Energy Ltd. 26.5 18 18 18 18 18
Jacobsen Elektro AS 360 360 360 360
Rotan Power 634 300 300
Total Committed Generation 1,744.50 353 398 758 1258 1258
Total Dependable Generation
(MW)
6,527
4,278
4,208
4,718
5,058
5,058
Surplus/Deficit 1,205.26 937.99 1,071.75 1,147.35 664.42
Reserve Margin% 39.22% 28.68% 29.39% 29.34% 15.12%

55 2019 Electricity Supply Plan
Figure 11: Projected Demand Versus Supply balance (2020 - 2024)
7.2.4 Additional Generation Requirement
As seen in Table 32 and Figure 11, with the deployment of the committed generation capacity, there is
adequate generation capacity to meet projected demand until 2023. The highest reserve margin recorded
over the period is 39.22% and the lowest expected over the period is 15.12%. Since the 2024 reserve
margin falls short of the required reserve margin of 18% for reliability of supply, additional generation
capacity of about 130 MW would need to be procured and commissioned by January, 2024.
It is important to note that these additions are only required to meet the mandatory reserve margin of
18%. Most of the additional thermal generation capacity expected over the period will operate on natural
gas. It is therefore important to ensure that efforts are made to achieve adequacy in gas supply.
2.3 Medium Term Gas Supply Outlook
By the end of 2019, the infrastructure bottlenecks in the gas supply are expected to be resolved. Gas
supply is therefore expected to revert to committed levels as shown in Table 36. In addition to the existing
supply sources, two LNG projects are expected to add additional 430 MMscfd by 2022.
Table 36: Medium Term (2020 - 2024) Gas Delivery Profile (MMscfd)
2020 2021 2022 2023 2024
Jubilee FV 83 80 83 83 -
Greater Jubilee - - - - 80
TEN AG 26 26 26 26 26
Sankofa NAG 180 180 180 180 180
Takoradi LNG - - 180 180 180
Tema LNG 100 250 250 250 250
N-Gas 70 70 70 70 70
Total Gas Supply 459 606 789 789 789

56 2019 Electricity Supply Plan
2.4 Medium Term Transmission Network Expansion/Upgrade Requirements
The results of the extensive system network analyses carried out using the projected demand and
supply scenario in the Tables above, indicate that there would be the need for the following
transmission line and equipment additions in the medium term to meet the required supply reliability
indices, and this is in addition to the investment identified under Section 5. The following are the
critical transmissions additions required:
161kV Aboadze-Takoradi-Tarkwa-Prestea
Construction of a second 330 kV Prestea - Dunkwa – Kumasi line
161kV Aboadze-Mallam Upgrade
Construction of a second 330 kV Aboadze – A4 BSP circuit
Construction of a double circuit 330 kV line from A4BSP to Kumasi
Eastern Transmission Corridor Projects:
161kV Kpando – Juale Line
161kV Juale – Yendi Line
Construction of a 330 kV substation at Dunkwa with a link to the existing 161 kV substation
Construction of a third Bulk Supply Point in Kumasi

57 2019 Electricity Supply Plan
9. CONCLUSION
The following conclusions are drawn in respect of the electricity supply and demand plan for 2019:
2.1 Demand and Supply Outlook
a) The 2019 total system demand is projected to be 2,665.68 MW (base case), representing a 5 %
growth over the 2018 peak demand of 2,525 MW. The corresponding projected energy
consumption for 2019 is 17,237.79 GWh of which:
b) Hydro supply will be 5,669.95 GWh representing 33% of the total energy supply;
Thermal supply will be 11,460.11 GWh representing 66.9% of total energy supply; and
Renewables supply will be 57.7 GWh representing 0.1% of total energy supply
c) Total projected energy exports are 915.81GWh for 2019.
d) VALCO is expected to operate on two pot lines with projected total consumption of 1,283.8
GWh.
e) There is the need to dispatch Akosombo and Bui Hydro Plants conservatively throughout 2019
to ensure that the two reservoirs are not drawn down below their minimum operating levels to
guarantee sustainable operations in the coming years
f) In terms of fuel, the following quantities of the various fuel types are required;
Natural Gas - 80,241,689 MMbtu
HFO - 5,308,727 barrels
g) In terms of fuel cost, an annual total of approximately 1.04 billion USD is required, averaging a
monthly total of some US$ 86.64 Million.
h) In 2019, Aboadze will be the largest generation enclave in Ghana with an installed capacity of
1,540MW
i) Under maximum west generation scenario with KarPower in the West, the autotransformers at
Volta will become overloaded leading with low voltages in the East (Accra/Tema Area).
2.2 Requirements for Grid Reinforcement
a) The transmission system has inadequate available transfer capacity to meet the demand
requirements of the major load centres (of Accra, Kumasi, Tarkwa, etc.) particularly at peak. This
situation would result in low voltages, overloading of lines and increased overall transmission
system losses.
b) For radial lines and single transformer stations, significant percentage of network loads could be
islanded in the event of outage of such lines and transformers.
c) In normal operation, there would be congestion on the Volta –Accra East – Achimota - Mallam
transmission corridor especially when there is high generation in the east.

58 2019 Electricity Supply Plan
d) Low voltages would be experienced at Kumasi, Accra and surrounding areas due to poor
customer-end power factors.
e) A fair East-West balance in generation provide better system stability and minimal overall
transmission system losses.
2.3 Distribution Systems
a) The commissioning of the Accra Central BSP has increased the level of reliability and distribution
capacity to meet the growing demand within the ECG network in Accra. This has resolved the
loading constraints on selected 33 kV feeders and reduce technical losses within the ECG Accra
network.
b) In a bid to improve voltages in Nsawan and Aburi, ECG has installed a number of Voltage
Regulators to improve on reliability and quality of supply. Furthermore, a number upgrade
projects have either been commissioned into service or under construction. This is to increase
distribution capacity and reliability of supply customers.
c) Power supply reliability in NEDCo Areas is generally good. However, reliability in some areas
of the network has been lower than expected due to over extension and over-ageing resulting in
high technical losses. Some interventions, however, have been made on some of these lines
resulting in improved supply reliability on them.
2.4 Medium Term Supply
a) For the high case growth scenario, it is expected that with the deployment of the committed
generation capacity, there would be adequate dependable generation capacity to meet projected
demand for the period 2020 - 2023 with a maximum reserve margin of 39%.
b) The system peak demand for high case growth scenario is projected to be 4,394 MW by 2024
and a corresponding dependable generation capacity of 5,058 MW. Hence, to meet the reliability
requirement of the Ghana power system, an additional reserve margin of 18% representing 791
MW is required. This adds up to a total required supply capacity of 5,185 MW. This compared
to the projected supply capacity implies a deficit of about 130 MW. Thus, there is the need to
procure an additional generation capacity of 127 MW in time for commissioning by January,
2024.

59 2019 Electricity Supply Plan
10. RECOMMENDATIONS
Based on the above conclusions, the following recommendations are made:
a) The ongoing transmission expansion projects should be expedited and completed in 2019 to
ensure that the peak demand can be supplied. These are
Volta – Achimota – Mallam Transmission Line Upgrade Project
Aboadze – Prestea - Kumasi 330 kV Transmission Line Project
Kumasi – Bolgatanga 330 kV transmission line Project
b) GRIDCo should explore the possibility of installing the 3rd autotransformer at Volta Substation
c) A well-coordinated maintenance programme should be pursued by both GRIDCo and the
Generating Companies (GENCOs).
d) Fuel supply security and adequacy remains the single most important risk to power supply
reliability in Ghana. In this vein, it is strongly recommended that all the relevant sector agencies
stakeholders work conscientiously together to ensure that fuel supply is adequate and secure at
all times.
e) For the medium term, the reserve margin for the 2024 falls short of the required reserve margin
of 18% (for reliability of supply). Therefore, additional generation capacity would need to be
procured in time for commissioning by the beginning of 2024.
f) In order to meet the transmission reliability indices, the following are the critical transmissions
additions and upgrades are required:
Upgrade of 161kV Aboadze-Takoradi-Tarkwa-Prestea
Construction of a second 330 kV Prestea - Dunkwa – Kumasi line
Upgrade of 161kV Aboadze-Mallam transmission lines
Construction of a second 330 kV Aboadze – A4 BSP circuit
Construction of a double circuit 330 kV line from A4BSP to Kumasi
Construction of a 330 kV substation at Dunkwa with a link to the existing 161 kV
substation

60 2019 Electricity Supply Plan
11. APPENDICES
Appendix A –Forecast: Peak and Energy Demand
A1: Base Case - Peak Demand Forecast (MW): 2019 - 2028
A2: Base Case - Energy Demand Forecast (GWh) -2019 – 2028
A3: High Case - Energy Demand Forecast (MW): 2019 – 2028
A4: High Case - Peak Demand Forecast (MW): 2019 - 2028
Appendix B – List of ECG Ugrade Projects aimed at reducing network Constraints
Appendix C – Glossary
Appendix D – Grid Map
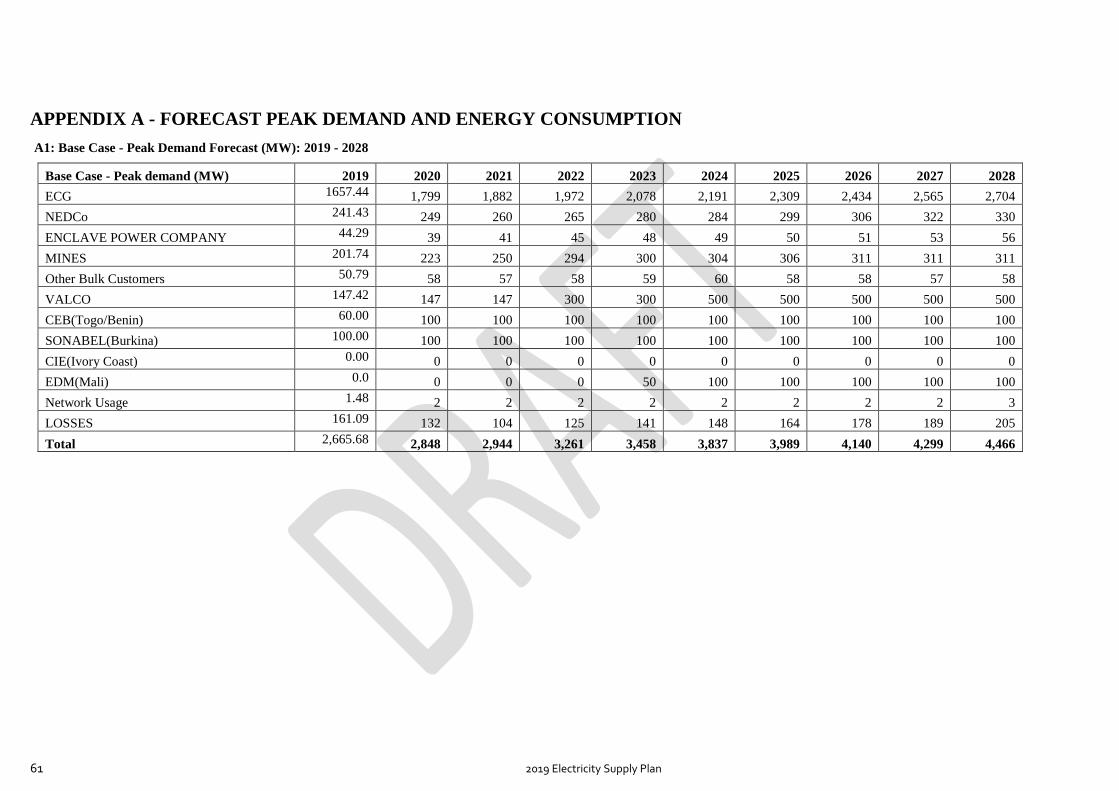
61 2019 Electricity Supply Plan
APPENDIX A - FORECAST PEAK DEMAND AND ENERGY CONSUMPTION
A1: Base Case - Peak Demand Forecast (MW): 2019 - 2028
Base Case - Peak demand (MW) 2019 2020 2021 2022 2023 2024 2025 2026 2027 2028
ECG 1657.44 1,799 1,882 1,972 2,078 2,191 2,309 2,434 2,565 2,704
NEDCo 241.43 249 260 265 280 284 299 306 322 330
ENCLAVE POWER COMPANY 44.29 39 41 45 48 49 50 51 53 56
MINES 201.74 223 250 294 300 304 306 311 311 311
Other Bulk Customers 50.79 58 57 58 59 60 58 58 57 58
VALCO 147.42 147 147 300 300 500 500 500 500 500
CEB(Togo/Benin) 60.00 100 100 100 100 100 100 100 100 100
SONABEL(Burkina) 100.00 100 100 100 100 100 100 100 100 100
CIE(Ivory Coast) 0.00 0 0 0 0 0 0 0 0 0
EDM(Mali) 0.0 0 0 0 50 100 100 100 100 100
Network Usage 1.48 2 2 2 2 2 2 2 2 3
LOSSES 161.09 132 104 125 141 148 164 178 189 205
Total 2,665.68 2,848 2,944 3,261 3,458 3,837 3,989 4,140 4,299 4,466
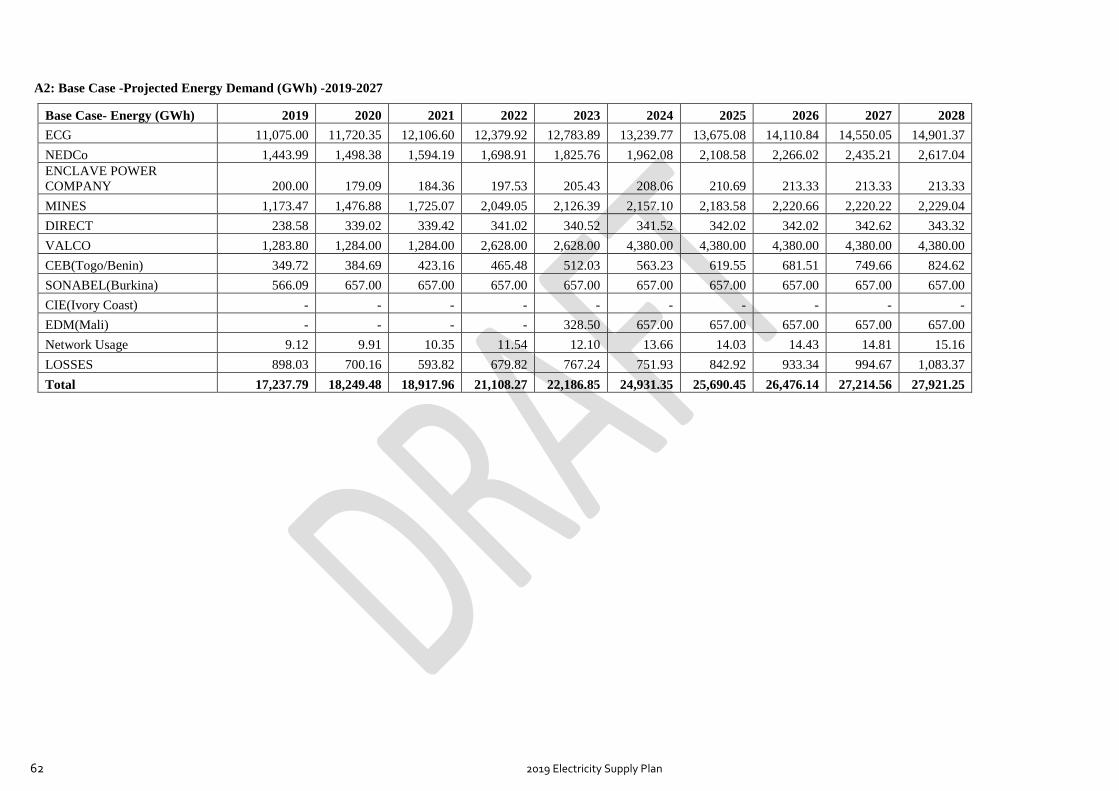
62 2019 Electricity Supply Plan
A2: Base Case -Projected Energy Demand (GWh) -2019-2027
Base Case- Energy (GWh) 2019 2020 2021 2022 2023 2024 2025 2026 2027 2028
ECG 11,075.00 11,720.35 12,106.60 12,379.92 12,783.89 13,239.77 13,675.08 14,110.84 14,550.05 14,901.37
NEDCo 1,443.99 1,498.38 1,594.19 1,698.91 1,825.76 1,962.08 2,108.58 2,266.02 2,435.21 2,617.04
ENCLAVE POWER
COMPANY 200.00 179.09 184.36 197.53 205.43 208.06 210.69 213.33 213.33 213.33
MINES 1,173.47 1,476.88 1,725.07 2,049.05 2,126.39 2,157.10 2,183.58 2,220.66 2,220.22 2,229.04
DIRECT 238.58 339.02 339.42 341.02 340.52 341.52 342.02 342.02 342.62 343.32
VALCO 1,283.80 1,284.00 1,284.00 2,628.00 2,628.00 4,380.00 4,380.00 4,380.00 4,380.00 4,380.00
CEB(Togo/Benin) 349.72 384.69 423.16 465.48 512.03 563.23 619.55 681.51 749.66 824.62
SONABEL(Burkina) 566.09 657.00 657.00 657.00 657.00 657.00 657.00 657.00 657.00 657.00
CIE(Ivory Coast) - - - - - - - - - -
EDM(Mali) - - - - 328.50 657.00 657.00 657.00 657.00 657.00
Network Usage 9.12 9.91 10.35 11.54 12.10 13.66 14.03 14.43 14.81 15.16
LOSSES 898.03 700.16 593.82 679.82 767.24 751.93 842.92 933.34 994.67 1,083.37
Total 17,237.79 18,249.48 18,917.96 21,108.27 22,186.85 24,931.35 25,690.45 26,476.14 27,214.56 27,921.25

63 2019 Electricity Supply Plan
A3: High Case - Energy Demand Forecast (MW): 2019 - 2028
High Case: Energy Forecast
(GWh) 2019 2020 2021 2022 2023 2024 2025 2026 2027 2028
Domestic 15,664.84 17,065.17 18,393.39 19,840.56 21,221.90 22,240.73 23,632.64 25,098.62 26,574.22 28,184.59
VALCO 1,283.80 1,284.00 1,284.00 2,628.00 2,628.00 4,380.00 4,380.00 4,380.00 4,380.00 4,380.00
CEB(Togo/Benin) 450 735.84 735.84 735.84 735.84 735.84 735.84 735.84 735.84 735.84
SONABEL (Burkina) 615.33 985.50 985.50 985.50 985.50 985.50 985.50 985.50 985.50 985.50
CIE(Ivory Coast) - - - - - - - - - -
EDM (Mali) - - - - 328.50 657.00 657.00 657.00 657.00 657.00
Total 18,013.97 20,070.51 21,398.73 24,189.90 25,899.74 28,999.07 30,390.98 31,856.96 33,332.56 34,942.93
A4: High Case - Peak Demand Forecast (MW): 2019 - 2028
High Case: Energy Forecast
(GWh) 2019 2020 2021 2022 2023 2024 2025 2026 2027 2028
Domestic 2,470 2,655 2,853 3,076 3,291 3,524 3,746 3,978 4,213 4,473
VALCO 147 147 147 300 300 500 500 500 500 500
CEB(Togo/Benin) 80 120 120 120 120 120 120 120 120 120
SONABEL (Burkina) 100 150 150 150 150 150 150 150 150 150
CIE(Ivory Coast) 0 0 0 0 0 0 0 0 0 0
EDM (Mali) 0 0 0 0 50 100 100 100 100 100
Total 2,797 3,073 3,270 3,646 3,911 4,394 4,616 4,848 5,083 5,343

64 2019 Electricity Supply Plan
B: List of ECG Upgrade Projects aimed at reducing network Contraints
No. Project Reason Benefits Consequences for not
implementing the Project Timeline
1 Construction of the
Accra Central BSP
High demand growth in
Accra. Distribution reliability
threat on feeders supplying
Accra central loads.
1. Increased level of reliability
especially during contingent
conditions.
2. Improved voltages within Accra
central load.
3. Reduction in loading of existing
feeders supplying Accra Central
Demand leading to TTC margins
improvement.
4. Capacity availability to serve
suppressed and additional demands.
5. Assist in existing BSP contingency.
1. Severe loading
constraints on feeders
supplying Accra central
load.
2. Improved level of
reliability of supply
during contingent
situations
Commissioned in
November 2018
2
Voltage Regulators
(In the absence of
Distributed
Generation (DG)
support along the
Mampong – Aburi
lines to improve
voltage at Nsawam.
As an alternative solution to
the DG option to improve
voltages at Ofankor, Nsawam,
Aburi and Mampong
1. Improve voltages at Ofankor, Nsawam,
Aburi and Mampong.
1. Severe low voltage leading to
poor power supply.
2. Limited power transfer
capability from Ofankor towards
Aburi as a result of the severe
low voltages.
3. Increase in technical losses in
the network
First one was Installed
2018. The second one is
expected to be installed
March – April 2109
3
Ongoing construction
of the Asekyem
primary substation
To support load on the Ridge
(“A”) and Amanfrom
substations
To avoid potential overloading of the
existing surrounding substations and improve
voltage levels
1. Poor voltages
2. Poor reliability of
supply
Commissioned in 2018
4
Construction of the
Pokuase BSP with its
associated circuits
This will boost voltage
support to Dodowa,
Mampong, Aburi and
Ofankor. It will also improve
reliability by serving as an
alternative to Achimota BSP
and Afienya BSP.
1. Improve power supply reliability to
Dodowa, Mampong and possibly
Aburi
2. Improve voltages at Dodowa, Aburi,
Mampong.
3. Reduce technical losses
1. Severe low voltages
2. Potential power outages to
customers supplied from the
Dodowa switching station
3. High suppressed demand
Last quarter of 2020
5
Construction of
Afienya BSP and its
associated circuits
This will boost voltage at
Dodowa, Mampong and
Aburi
1. Improve voltages at Dodowa,
Mampong and Aburi.
2. Improve reliability by serving as an
alternative source of supply to
Dodowa and beyond.
3. Capacity availability to serve
suppressed and additional demands
Severe low voltages
High unserved energy in the
event of a contingency on the
supply to Dodowa from Adenta.
Commissioned in
February, 2019

65 2018 Electricity Supply Plan
APPENDIX B: GLOSSARY OF ELECTRICAL UTILITY TERMS
1000 Watt-hours = 1 Kilo Watt-hour (kWh)
1000 Kilo Watt-hour = 1 Mega Watt-hour (MWh)
1000 Mega Watt-hour = 1 Giga Watt-hour (GWh)
1000 Giga Watt-hour = 1 Tera Watt-hour (TWh)
Average Day Load
The average system demand is indicative of the system’s load during most part of the day that is from 7:
am – 5: pm apart from the peak load.
Capability
The maximum load a generator, piece of equipment, substation, or system can carry under specified
(standardized) conditions for a given time interval without exceeding approved limits.
Capacitor
1) In a power system, installed to supply reactive power.
2) A device to store an electrical charge (usually made of two or more conductors separated by a non-
conductor such as glass, paper, air, oil, or mica) that will not pass direct current and whose impedance for
alternating current frequencies is inversely proportional to frequency. 3) In a power system, capacitors
consist of metal-foil plates separated by paper or plastic insulation in oil or other suitable insulating fluid
and sealed in metal tanks.
Capacitor bank
A grouping of capacitors used to maintain or increase voltages in power lines and to improve system
efficiency by reducing inductive losses.
Capacity
The rated continuous load-carrying ability, expressed in megawatts (MW) or megavolt-amperes (MVA)
of generation, transmission, or other electrical equipment.
Installed Capacity
The total of the capacities shown by the name plate ratings of similar kinds of apparatus, such as
generators, transformers, or other equipment in a station or system.

66 2018 Electricity Supply Plan
Combined Cycle
An electric generating technology in which electricity is produced from otherwise lost waste heat exiting
from one or more gas (combustion) turbines. The exiting heat is routed to a conventional boiler or to a
heat recovery steam generator for utilization by a steam turbine in the production of electricity. Such
designs increase the efficiency of the electric generating unit.
Conductor
A substance or body that allows an electric current to pas continuously along it.
Contingency
In a power system, the possibility of a fault or equipment failure. First contingency disturbances (outages)
involve only one system element, such as a transmission line fault or a transformer failure. A second
contingency disturbance would have one system element out of service and subject the system to a fault
and loss of a second element.
Demand
The rate at which electric energy is delivered to or by the System or part of the System and is the sum of
both Active and Reactive Power, unless otherwise stated.
Demand, Peak:
The highest electric requirement occurring in a given period (e.g., an hour, a day, month, season, or year).
For an electric system, it is equal to the sum of the metered net outputs of all generators within a system
and the metered line flows into the system, less the metered line flows out of the system.
Dispatch
The operating control of an integrated electric system to: (1) assign specific generating units and other
sources of supply to meet the relevant area Demand taken as load rises or falls; (2) control operations and
maintenance of high voltage lines, substations and equipment, including administration of safety
procedures; (3) operate interconnections; (4) manage energy transactions with other interconnected
Control Areas; and (5) curtail Demand.
Disturbance
An unplanned event that produces an abnormal system condition. Any occurrence that adversely affects
normal power flow in a system
67 2018 Electricity Supply Plan
Fault
An event occurring on an electric system such as a short circuit, a broken wire, or an intermittent
connection.
Generation (Electricity)
The process of producing electric energy from other forms of energy; also, the amount of electric energy
produced, expressed in watthours (Wh).
Giga (G)
A prefix indicating a billion (1,000,000,000); 109 in scientific notation. Hence Gigawatt (GW) and
Gigawatt-hour (GWh).
Grid
The transmission network (or “highway”) over which electricity moves from suppliers to customers.
Grid Operator
An entity that oversees the delivery of electricity over the grid to the customer, ensuring reliability and
safety.
High voltage:
Descriptive of transmission lines and electrical equipment with voltage levels from 100 kV through 287
kV.
Independent Power Producer (IPP):
A private entity that operates a generation facility and sells power to electric utilities for resale to retail
customers.
Insulator:
The porcelain support used to insulate electric service wires from the pole. All electric lines require an
insulator to attach the wires to the pole or to a residence.
Interconnected System
A system consisting of two or more individual electric systems that normally operate in synchronism
(matching frequency, voltage, phase angles, etc) and have connecting tie lines.
Kilowatt (kW)
One thousand watts of electricity (See Watt).

68 2018 Electricity Supply Plan
Kilo watthour (kWh):
One thousand watthours.
Load
The amount of power carried by a utility system or subsystem, or amount of power consumed by an electric
device at a specified time. May also be referred to as demand. A connection point or defined set of
connection points at which electrical power is delivered to a person or to another network or the amount
of electrical power delivered at a defined instant at a connection point, or aggregated over a defined set of
connection points.
Load Centers
A geographical area where large amounts of power are drawn by end-users.
Losses
Electric energy losses in the electric system which occur principally as energy transformation from
kilowatt-hours (kWh) to waste heat in electrical conductors and apparatus.
Maximum Demand:
The highest amount of electrical power delivered, or forecast to be delivered, over a defined period (day,
week, month, season or year) at a defined.
Megawatt (MW)
One million watts of electricity (See Watt).
masl
Metres above sea level
Overload
Operation of equipment in excess of its normal, full load rating or operation of a conductor in excess of
ampacity, and if continued for a sufficient length of time, would cause damage or overheating.
System Planning
The process by which the performance of the electric system is evaluated and future changes and additions
to the bulk electric systems are determined.
69 2018 Electricity Supply Plan
Power System
The electricity power system of the national grid including associated generation and transmission and
distribution networks for the supply of electricity, operated as an integrated arrangement.
Reactive Power
Means the product of voltage and current and the sine of the phase angle between them measured in units
of volt-amperes reactive and standard multiples thereof. Reactive power is a necessary component of
alternating current electricity which is separate from active power and is predominantly consumed in the
creation of magnetic fields in motors and transformers and produced by plant such as: (a) alternating
current generators (b) capacitors, including the capacitive effect of parallel transmission wires;(c)
synchronous condensers.
Reliability
The degree of performance of the elements of the bulk electric system that results in electricity being
delivered to customers within accepted standards and in the amount desired. It is a measure of the ability
of a power system to provide uninterrupted service, even while that system is under stress. Reliability may
be measured by the frequency, duration, and magnitude of adverse effects on the electric supply. Electric
system reliability has two components -- adequacy and security.
Adequacy is the ability of the electric system to supply the aggregate electrical demand and energy
requirements of the customers at all times, taking into account scheduled and reasonably expected
unscheduled outages of system elements.
Security is the ability of the electric system to withstand sudden disturbances such as electric short circuits
or unanticipated loss of system facilities.
Single Contingency
The sudden, unexpected failure or outage of a system facility(s) or element(s) (generating unit,
transmission line, transformer, etc.). Elements removed from service as part of the operation of a remedial
action scheme are considered part of a single contingency.
Stability
The ability of an electric system to maintain a state of equilibrium during normal and abnormal system
conditions or disturbances.

70 2018 Electricity Supply Plan
Supervisory Control and Data Acquisition (SCADA)
A computer system that allows an electric system operator to remotely monitor and control elements of an
electric system.
Switching Station
An installation of equipment where several transmission lines are interconnected. Does not include
equipment for transforming voltage levels.
Power System
An interconnected combination of generation, transmission, and distribution components comprising an
electric utility, an electric utility and independent power producer(s) (IPP), or group of utilities and IPP(s).
Right of Way (ROW)
A corridor of land on which electric lines may be located. The Transmission Owner may own the land in
fee, own an easement, or have certain franchise, prescription, or license rights to construct and maintain
lines.
Thermal Limit
The maximum amount of electrical current that a transmission line or electrical facility can conduct over
a specified time period before it sustains permanent damage by overheating or before it violates public
safety requirements.
Transfer Capability
The amount of power, usually the maximum amount, that can be transmitted between one system and
another; power flow and stability studies determine transfer capability under various outage, system
loading, and system operating conditions.
Transformer
A device for transferring electrical energy from one circuit to another by magnetic induction, usually
between circuits of different voltages. Consists of a magnetic core on which there are two or more
windings. In power systems, most frequently used for changing voltage levels.
Transmission System (Electric)
An interconnected group of electric transmission lines and associated equipment for moving or transferring
electric energy in bulk between points of supply and points at which it is transformed for delivery over the
distribution system lines to consumers, or is delivered to other electric systems.
Utility
A public or private organization created for the purpose of selling or supplying for general public use
water, electric energy, telephone service, or other items or services.
Voltage
The electronic force or electric potential between two points that gives rise to the flow of electricity.

71 2018 Electricity Supply Plan
Voltage Stability
The condition of an electric system in which the sustained voltage level is controllable and within
predetermined limits.
Wheeling
The use of the facilities of one transmission system to transmit power and energy from one power system
to another.

72 2018 Electricity Supply Plan
APPENDIX C – GRID MAP