reproductions supplied by edrs are the best that can be ... · dba increase in vocal intensity....
TRANSCRIPT

DOCUMENT RESUME
ED 463 640 EF 006 073
AUTHOR Rosenberg, Gail Gegg; Blake-Rahter, Patricia; Heavner, Judy;Allen, Linda; Redmond, Beatrice Myers; Phillips, Janet;Stigers, Kathy
TITLE Improving Classroom Acoustics (ICA): A Three-Year FM SoundField Classroom Amplification Study.
INSTITUTION Educational Audiology Association, Tampa, FL.SPONS AGENCY Florida State Dept. of Education, Tallahassee. Div. of
Public Schools.PUB DATE 1999-00-00NOTE 22p.; Federal assistance provided by the Individuals with
Disabilities Education Act (IDEA), Part B. Portions of thisarticle presented at the Annual Convention of the AmericanAcademy of Audiology (Dallas, TX, 1995) and the AnnualConvention of the Florida Association of Speech-LanguagePathologists and Audiologists (Ft. Lauderdale, FL, 1996).
PUB TYPE Journal Articles (080) -- Reports Research (143)Speeches/Meeting Papers (150)
JOURNAL CIT Journal of Educational Audiology; v7 p8-28 1999EDRS PRICE MF01/PC01 Plus Postage.DESCRIPTORS Acoustical Environment; *Audio Equipment; Listening; Noise
(Sound); Primary Education; *Program EffectivenessIDENTIFIERS *Frequency Modulation
ABSTRACTThe Improving Classroom Acoustics (ICA) special project was
designed to determine if students' listening and learning behaviors improvedas a result of an acoustical environment enhanced through the use of FM soundfield classroom amplification. The 3-year project involved 2,054 students in94 general education kindergarten, first-, and second-grade classrooms in 33elementary schools in Florida. The Easy Listener Freefield System[TMJ byPhonic Ear was provided in 64 experimental (amplified) classrooms, and theremaining 30 classrooms served as control (unamplified) classes. Analysis ofobservational data on 1,750 students indicated that students in amplifiedclassrooms demonstrated significant improvement in listening and learningbehaviors and skills, and progressed at a faster rate than their grade-alikepeers in unamplified classrooms, and that younger students demonstrated thegreatest improvement. Data showed that noise levels (dBA) and acousticaltreatments in elementary classrooms have not changed over the past decade. FMsound field classroom amplification provided teachers with an average 6.94dBA increase in vocal intensity. Students, teachers, parents, and schooladministrators gave FM sound field classroom amplification a positiveevaluation. Finally, data demonstrated that this instructional deliveryequipment is a cost effective means to manage an important variable inearly-grade classrooms--the intensity of the teacher's voice. (Contains 56references, 11 tables, and 7 figures.) (Author/EV)
Reproductions supplied by EDRS are the best that can be madefrom the original document.

Journal of Educational Audiology 7 (1999)
Improving Classroom Acoustics (ICA):A Three-Year FM Sound Field Classroom Amplification Study
PERMISSION TO REPRODUCE ANDDISSEMINATE THIS MATERIAL HAS
BEEN GRANTED BY
Sue Gaudin
TO THE EDUCATIONAL RESOURCESINFORMATION CENTER (ERIC)
Gail Gegg RosenbergSchool Board of Sarasota County, FL
Patricia Blake-RahterUniversity of South Florida*
Judy HeavnerFlorida Department of Education
Linda AllenSchool Board of Escambia County, FL
Beatrice Myers RedmondSchool Board of Orange County, FL
Janet PhillipsSchool Board of Brevard County, FL
Kathy StigersSchool Board of Volusia County, FL
*Previously with the School Board of Pinellas County, FL
U.S. DEPARTMENT OF EDUCATIONOffice of Educational Research and Improvement
EDUCATIONAL RESOURCES INFORMATION' CENTER (ERIC)Nethis document has been reproduced as
received from the person or organizationoriginating it.
0 Minor changes have been made toimprove reproduction quality.
Points of view or opinions stated in thisdocument do not necessarily representofficial OERI position or policy.
The IMPROVING CLASSROOM ACOUSTICS (ICA) special project was designed to determine if students'listening and learning behaviors improved as a result of an acoustical environment enhanced through the use ofFM sound field classroom amplification. The three-year project involved 2054 students in 94 general educationkindergarten, first, and second grade classrooms in 33 elementary schools in Florida. The Easy Listener FreefieldSystemTM by Phonic Ear was provided in 64 experimental (amplified) classrooms, and the remaining 30 classroomsserved as control (unamplified) classes. Analysis of obsen-/ational data on 1750 students indicated that students inamplified classrooms demonstrated significant improvement in listening and learning behaviors and skills, andprogressed at a faster rate than their grade-alike peers in unamplified classrooms, and younger students demon-strated the greatest improvement. Data showed that noise levels (dBA) and acoustical treatments in elementaryclassrooms have not changed over the past decade. FM sound field classroom amplification provided teachers withan average of +6.94 dBA increase in vocal intensity. Students, teachers, parents, and school administrators gaveFM sound field classroom amplification a positive evaluation. Finally, data demonstrated that this instructionaldelivery equipment is a cost effective means to manage an important variable in early grade classrooms theintensity of the teacher's voice.
IntroductionThe better children can hear, the more they are able to learn
(Ross, 1995). This is precisely the premise of the IMPROVINGCLASSROOM ACOUSTICS (ICA) project. In today's class-rooms, listening and learning opportunities for young childrenare often compromised when they are subjected to less thanoptimum acoustical educational environments. Many studentswho effectively use their hearing for speech recognition in quietenvironments may have difficulty participating effectively andefficiently in the learning process due to noise and reverberationthat often distort acoustic signals in the classroom (Crandell &Bess, 1987a; Crandell & Smaldino, 1995a, b). This is particularlydisturbing because young children spend 45% to 60% of their
8
school day involved in the listening process (Butler, 1975).Among the most devastating acoustical barriers are internal
and external classroom noise, reverberation, speaker-to-listenerdistance, and poor acoustical treatments in the classroom.Unfortunately, noise and reverberation levels in many classroomsexceed recommended acoustical standards (Crandell, Smaldino &Flexer, 1999). Numerous researchers have documented thedifficulties that children experience when listening in the pres-ence of background noise (Berg, Blair & Benson, 1996; Crandell,1993b; Crum & Matkin, 1976; Downs & Crum, 1978; Finitzo-Hieber & Tillman, 1978; McCroskey & Devens, 1975; Nabelek& Pickett, 1974; Nabelek & Robinson, 1982; Olsen, 1981; Papso& Blood, 1989; Sanders, 1965). Flexer (1992) pointed out that
BEST COPY AVAILABLE
Improving Classroom Acoustics (ICA): A Three-Year FM Sound Field Classroom Amplification Study
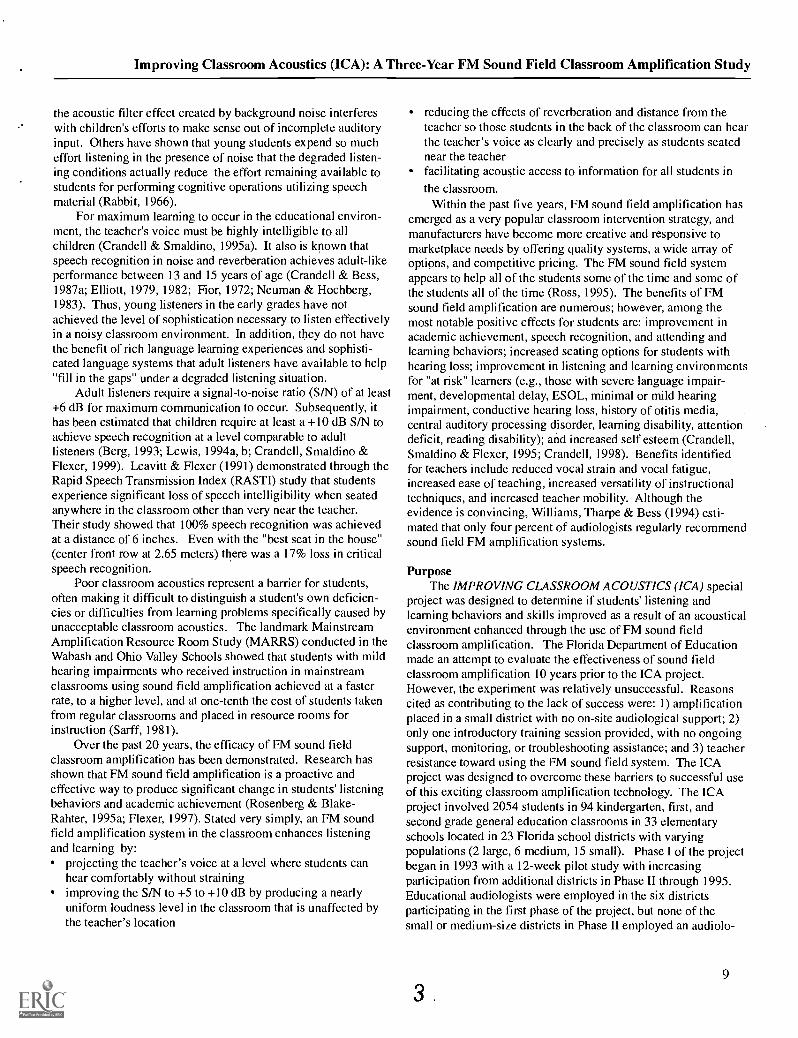
the acoustic filter effect created by background noise interfereswith children's efforts to make sense out of incomplete auditoryinput. Others have shown that young students expend so mucheffort listening in the presence of noise that the degraded listen-ing conditions actually reduce the effort remaining available tostudents for performing cognitive operations utilizing speechmaterial (Rabbit, 1966).
For maximum learning to occur in the educational environ-ment, the teacher's voice must be highly intelligible to allchildren (Crandell & Smaldino, 1995a). It also is known thatspeech recognition in noise and reverberation achieves adult-likeperformance between 13 and 15 years of age (Crandell & Bess,1987a; Elliott, 1979, 1982; Fior, 1972; Neuman & Hochberg,1983). Thus, young listeners in the early grades have notachieved the level of sophistication necessary to listen effectivelyin a noisy classroom environment. In addition, they do not havethe benefit of rich language learning experiences and sophisti-cated language systems that adult listeners have available to help"fill in the gaps" under a degraded listening situation.
Adult listeners require a signal-to-noise ratio (S/N) of at least+6 dB for maximum communication to occur. Subsequently, ithas been estimated that children require at least a +10 dB S/N toachieve speech recognition at a level comparable to adultlisteners (Berg, 1993; Lewis, 1994a, b; Crandell, Smaldino &Flexer, 1999). Leavitt & Flexer (1991) demonstrated through theRapid Speech Transmission Index (RASTI) study that studentsexperience significant loss of speech intelligibility when seatedanywhere in the classroom other than very near the teacher.Their study showed that 100% speech recognition was achievedat a distance of 6 inches. Even with the "best seat in the house"(center front row at 2.65 meters) there was a 17% loss in criticalspeech recognition.
Poor classroom acoustics represent a barrier for students,often making it difficult to distinguish a student's own deficien-cies or difficulties from learning problems specifically caused byunacceptable classroom acoustics. The landmark MainstreamAmplification Resource Room Study (MARRS) conducted in theWabash and Ohio Valley Schools showed that students with mildhearing impairments who received instruction in mainstreamclassrooms using sound field amplification achieved at a fasterrate, to a higher level, and at one-tenth the cost of students takenfrom regular classrooms and placed in resource rooms forinstruction (Sarff, 1981).
Over the past 20 years, the efficacy of FM sound fieldclassroom amplification has been demonstrated. Research hasshown that FM sound field amplification is a proactive andeffective way to produce significant change in students' listeningbehaviors and academic achievement (Rosenberg & Blake-Rahter, 1995a; Flexer, 1997). Stated very simply, an FM soundfield amplification system in the classroom enhances listeningand learning by:
projecting the teacher's voice at a level where students canhear comfortably without strainingimproving the S/N to +5 to +10 dB by producing a nearlyuniform loudness level in the classroom that is unaffected bythe teacher's location
reducing the effects of reverberation and distance from theteacher so those students in the back of the classroom can hearthe teacher's voice as clearly and precisely as students seatednear the teacherfacilitating acoustic access to information for all students inthe classroom.
Within the past five years, FM sound field amplification hasemerged as a very popular classroom intervention strategy, andmanufacturers have become more creative and responsive tomarketplace needs by offering quality systems, a wide array ofoptions, and competitive pricing. The FM sound field systemappears to help all of the students some of the time and some ofthe students all of the time (Ross, 1995). The benefits of FMsound field amplification are numerous; however, among themost notable positive effects for students are: improvement inacademic achievement, speech recognition, and attending andlearning behaviors; increased seating options for students withhearing loss; improvement in listening and learning environmentsfor "at risk" learners (e.g., those with severe language impair-ment, developmental delay, ESOL, minimal or mild hearingimpairment, conductive hearing loss, history of otitis media,central auditory processing disorder, learning disability, attentiondeficit, reading disability); and increased self esteem (Crandell,Smaldino & Flexer, 1995; Crandell, 1998). Benefits identifiedfor teachers include reduced vocal strain and vocal fatigue,increased ease of teaching, increased versatility of instructionaltechniques, and increased teacher mobility. Although theevidence is convincing, Williams, Tharpe & Bess (1994) esti-mated that only four percent of audiologists regularly recommendsound field FM amplification systems.
PurposeThe IMPROVING CLASSROOM ACOUSTICS (ICA) special
project was designed to determine if students' listening andlearning behaviors and skills improved as a result of an acousticalenvironment enhanced through the use of FM sound fieldclassroom amplification. The Florida Department of Educationmade an attempt to evaluate the effectiveness of sound fieldclassroom amplification 10 years prior to the ICA project.However, the experiment was relatively unsuccessful. Reasonscited as contributing to the lack of success were: 1) amplificationplaced in a small district with no on-site audiological support; 2)only one introductory training session provided, with no ongoingsupport, monitoring, or troubleshooting assistance; and 3) teacherresistance toward using the FM sound field system. The ICAproject was designed to overcome these barriers to successful useof this exciting classroom amplification technology. The ICAproject involved 2054 students in 94 kindergarten, first, andsecond grade general education classrooms in 33 elementaryschools located in 23 Florida school districts with varyingpopulations (2 large, 6 medium, 15 small). Phase I of the projectbegan in 1993 with a 12-week pilot study with increasingparticipation from additional districts in Phase II through 1995.Educational audiologists were employed in the six districtsparticipating in the first phase of the project, but none of thesmall or medium-size districts in Phase II employed an audiolo-
9
Journal of Educational Audiology 7 (1999)
gist on a full-time basis. The ICA project provided FM soundfield amplification in 64 experimental (amplified) classroomswhile 30 classrooms served as control (unamplified) classrooms.
MethodsSubjects
Phase I. Subjects were 1319 kindergarten, first, and secondgrade students in 30 experimental (amplified) and 30 control(unamplified) general education classrooms. Subjects wereenrolled in 14 schools in four medium and two large Floridaschool districts. Classes were paired only by grade level withineach school site for the experimental (N = 663) and control (N =656) treatment groups. Students (N = 804) in 20 classroomsfrom the ICA pilot project were followed for 30 weeks toexamine change over a longer period of time. (See Table 1.)There were slightly more male than female subjects, and minoritystudents accounted for 18.35% of the total group. Studentsparticipating in Exceptional Student Education (ESE) programsother than Speech/Language Therapy or Specific LearningDisabilities (SLD) represented 15.16% of the total group. Thenumber of students enrolled in alternative programs, such as
10
chapter classes or other district-provided remedial programs,accounted for 13.87% of the total group. The estimate of socio-economic status is based on free and reduced lunch data providedby districts. The classroom mean for students receiving free andreduced lunch was at 39.53% and this rate is below the stateaverage of 45.97% for elementary schools (Florida Departmentof Education). Demographic information for subjects, districts,otologic history, and prevalence of special services is provided inTable 2.
Phase II. A total of 735 students in kindergarten, first, andsecond grade general education classes were participants in PhaseII, which provided FM sound field amplification in all of theclassrooms. Subjects were enrolled in 19 schools in 15 small and2 middle-size Florida school districts. (See Table 1.) Pre- andpost-treatment student observation data were completed for 20 ofthe 34 classes (58.82%) yielding a participant group of 431students. The socio-economic status (SES) of district and schoolpopulations showed a district mean of 57.00% and the schoolmean of 61.38%, both of which are above the state average of45.97%. These incidence levels are higher than the mean districtSES of 37.79% identified for Phase I.
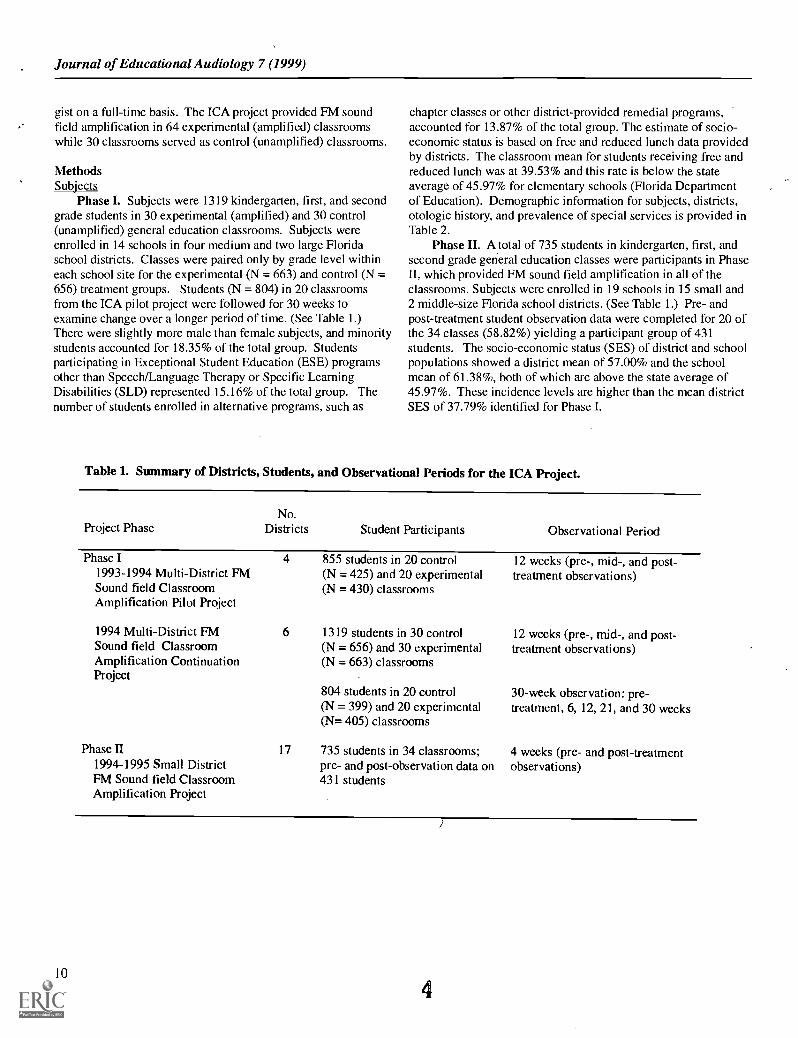
Table 1. Summary of Districts, Students, and Observational Periods for the ICA Project.
Project PhaseNo.
Districts Student Participants Observational Period
Phase I1993-1994 Multi-District FMSound field ClassroomAmplification Pilot Project
1994 Multi-District FMSound field ClassroomAmplification ContinuationProject
Phase H1994-1995 Small DistrictFM Sound field ClassroomAmplification Project
4 855 students in 20 control(N = 425) and 20 experimental(N = 430) classrooms
6 1319 students in 30 control(N = 656) and 30 experimental(N = 663) classrooms
804 students in 20 control(N = 399) and 20 experimental(N= 405) classrooms
17 735 students in 34 classrooms;pre- and post-observation data on431 students
12 weeks (pre-, mid-, and post-treatment observations)
12 weeks (pre-, mid-, and post-treatment observations)
30-week observation: pre-treatment, 6, 12, 21, and 30 weeks
4 weeks (pre- and post-treatmentobservations)
4

Improving Classroom Acoustics (ICA): A Three-Year FM Sound Field Classroom Amplification Study
Table 2. Subject and district demographic, otologic history, and special services information summary.(SES estimate is based on available free/reduced lunch district data.)
Phase I Phase II Total
CharacteristicGender
Control Experimental Experimental Combined
Male 345 (52.59%) 333 (50.23%) 230 (53.36%) 908Female 311 (47.41%) 330 (49.77%) 201 (46.64%) 842
Minority Students 114 (17.38%) 128 (19.31%) 83 (19.25%) 325
Student participants by gradeKindergarten 217 211 *(210) 66 *(638) 494Grade 1 211 217 *(269) 204 *(697) 632Grade 2 338 235 *(256) 161 *(719) 624Total Student Participants 656 663 *(735) 431 *(2054) 1750
Students receiving specialized servicesGeneral in-school special services 179 (27.29%) 192 (28.95%) 116 (26.91%) 487Remedial class 86 (13.11%) 92 (14.63%) 71 (16.47%) 249Speech/language therapy 71 (10.82%) 78 (11.76%) 22 (5.10%) 171SLD class 20 (3.05%) 24 (3.62%) 14 (3.25%) 58ESOL class 9 (1.37%) 9 (1.36%) 9 (2.09%) 27Other ESE services 92 (14.02%) 108 (16.29%) 7 (1.62%) 207
Otologic historyEar problems before age 1 169 (34.42%) 188 (33.81%) 126 (31.27%) 483Ear problem within last 6 months 85 (17.31%) 99 (17.81%) 92 (22.83%) 276More than 10 lifetime ear problems 64 (13.03%) 89 (16.01%) 56 (13.90%) 485Myringotomy with PE tubes 39 (7.94%) 52 (9.35%) 32 (7.94%) 123Four or more ear problems per year 27 (5.50%) 39 (7.01%) 45 (11.17%) 111Negative history (colds, sinus,
allergy)341 (69.45%) 383 (68.88%) 229 (56.82%) 953
Total Otologic History Forms 491 (74.84%) 556 (83.86%) 403 (54.82%) 1450
Mean MeanDistrict SES *** 6 37.79% 17 57.00%School SES *** 14 41.42% 19 61.38%District population 6 67008.00 17 5583.76School population 14 759.77 19 689.58School age in years 14 28.18 19 19.84Teaching experience in years 60 15.18 34 12.76
*Number of students using FM sound field amplification is in parentheses andof students for whom there were completed observation forms.
** Number of students reported by teachers on the Student Data section of theform.
***The State of Florida average for elementary schools for free/reduced lunchBusiness Services is 45.97% (Florida Department of Education).
5
the other number reveals the number
Listening and Learning Observation
reported by the Bureau of School
11

Journal of Educational Audiology 7 (1999)
Selection of Schools and TeachersPhase I. School principals in the six districts were inter-
viewed to ascertain interest in the FM sound field classroomamplification project. Teachers (N = 60) were selected based onthe principal's recommendation and each teacher's willingness toparticipate in the project. None of the participating teacherspresented with speech or voice pathology, and all used standardAmerican dialect. Teachers were not selected to ensure specificability groupings or specific classroom acoustic environments.The teachers possessed an average 15.18 years of teachingexperience (R = 1-35 years). The 60 classes were equally dividedwith 20 classes at each grade level (kindergarten, first, andsecond grade).
Phase II. Target groups for this phase were small, small-middle, and middle-size districts. Information was sent todistricts, and the Institute for Small and Rural Districts assisted inpublicizing the project and in recruiting interested districts.Exceptional Student Education (ESE) directors contactedprincipals in their respective districts to promote participation inthe project. Those districts willing to participate were asked toidentify two general education classroom teachers in kindergar-ten, first, or second grade. In addition, they were asked toappoint an ICA contact person to serve as facilitator for sharinginformation and management of project forms such as pre- andpost- student observation forms and project evaluation forms.Typically, small districts do not have an audiologist on staff toassist with a classroom amplification project. Thus, ICA contactpersons included ESE directors, speech-language pathologists,ESE teachers, ESE district-level employees, and in one middle-size district, a part-time audiologist. Fifteen of 27 small districts(55.56%) committed to the project and two middle-size districtswere invited to become part of this cohort to meet this project'sgoal of providing FM sound field amplification for a minimum of34 classrooms. Participating teachers had an average 12.76years of teaching experience.
Hearing ScreeningsHearing screenings (at both 15 and 20 dB HL, .5K, 1K, 2K,
and 4KHz, plus tympanometry) were performed on 1252 studentsin Phase I only, following ASHA (1996) guidelines for hearingscreening. Screenings were conducted by certified audiologistsand speech language pathologists, supervised audiology andspeech-language pathology graduate students, and traineddistrict-employed hearing screening aides. Hearing screeningswere not conducted in Phase II due to the inconsistent availabilityof personnel and the variability of existing district hearingscreening guidelines. Parents of students participating in bothphases of the project were given the opportunity to provideotologic history information for their child by completing anadaptation of the History of Ear and Hearing Problems (Ander-son, 1991). (See Table 2.)
12
Teacher Inservice TrainingPhase I. ICA inservice training sessions were provided for
60 general education classroom teachers and project supportpersons using materials from the ICA Inservice Training Manual(1995a) and accompanying ICA Inservice Training TransparencyMaster Manual (1995b). A minimum of four hours of inservicetraining was provided for participating teachers. Inservicesessions addressed an array of topics related to classroomacoustics, speech perception, strategies for improving studentlistening and learning behaviors, suggestions for acousticalmodifications and managing classroom noise, as well as thebenefits and use of FM sound field classroom amplification. Inaddition, teachers received instruction on the use of ICA projectmanagement forms (e.g., student observation forms, evaluationforms). A master inservice component was available to allowparticipating teachers the opportunity to earn credit by attendingthe inservice session and by completing student observations,other project forms, and related activities. Audiologists em-ployed by each district provided inservice training, coordinatedproject implementation in their district, and served on the ICAProject Advisory Committee.
Phase II. The inservice training format previously de-scribed was applied in Phase II. Fifty teachers, ICA contactpersons, and interested district level ESE staff received inservicetraining at one of four regional sessions conducted by theaudiologist who served as project manager.
Classroom EnvironmentTeachers completed the ICA Classroom Description
Worksheet (Florida Department of Education, 1995a), providinginformation about the classroom setting, acoustical treatments,noise measurements, classroom design, noise sources, and otherpertinent information about the classroom environment (e.g.,teaching style, grade level, student characteristics). In Phase I,fifty-four classes (90%) were self-contained, with the remainderhoused in relocateable classrooms. This distribution wasidentical for both treatment groups. The majority of classroomshad central heating/ventilation/air conditioning (HVAC) systems.Teachers rated the loudness of various classroom noise sourceson a scale of I (very quiet) to 5 (very noisy). The average ratingfor HVAC systems was moderate (3.27), suggesting that thesehave potential as intrusive noise sources. Average ratings forrestrooms in classrooms (2.67) and lighting systems (1.53) didnot suggest these to be major sources of classroom noise.Average ceiling height in classrooms was at an acceptable levelof 9.57 feet. Hart (1983) states that a ceiling height of 12 feet isan optimal height to achieve a relatively diffuse sound field.Schools in Phase II were somewhat newer than those in Phase I(Table 2).
6

Improving Classroom Acoustics (ICA): A Three-Year FM Sound Field Classroom Amplification Study
Figure 1. Noise Measurements portion of the ICA Classroom Description Worksheet for(Florida Department of Education, 1995a, pp. 133-134).
Classroom GridSchoolTeacher
Experimental Control
Teacher's Voice MeasurementdBA unamplified (6" from the mouth)dBA amplified (6" from the speaker)
Directions:Use the grid to mark the position number where each of the five measurements are taken.Take the dBC measurement in the center of the classroom.Take five measurements in the classroom under unoccupied and occupied conditions. (For control classes,measurements should be taken in the four corners and center of the room. For amplified classes, measure-ments should be taken at the four speaker positions and in the center of the room.)If unusual circumstances exist for a particular classroom (e.g., excessive hallway noise between 10:30 and 1:30while students access the cafeteria, excessive noise between 10:00 and 12:00 due to construction), an addi-tional noise measurement may be taken and recorded in the space provided.Take the dBA unamplified teacher's voice measurement 6" from the mouth. (Take the measurement in theunoccupied classroom.)Take the dBA amplified teacher's voice measurement 6" from a sound field speaker. (Take the measurementin the unoccupied classroom. Prior to making this measurement, check the output at each of the four speakersto determine uniformity of the signal.)
DateTime
Noise Measurement Data
DateTime
DateTime
Position Unoccupied (U) Occupied (0) Additional Measurement (U/O)1 dBA dBA dBA2 dBA dBA dBA3 dBA dBA dBA4 dBA dBA dBA5 dBA dBA dBA
Average dBA dBA dBA
Center dBC dBC dBC
1
Special Notes:
13
7

Journal of Educational Audiology 7 (1999)
Sound Level MeasurementsDuring Phase I, dBA and dBC sound level measurements
were taken in classrooms, using the Quest 2400 sound levelmeter according to protocol identified in the ICA ClassroomDescription Worksheet. (See Figure 1.) A representative samplingof ambient noise levels was obtained by taking measurements atfive positions in the classroom and computing an averagemeasurement for each weighting network under both unoccupiedand occupied conditions. Unoccupied measurements were takenbefore and after normal school hours with the HVAC systems inoperation because this is a component of typical classroom noisein Florida's schools. Occupied measurements were taken duringregular classroom activities. Teachers' vocal intensities weremeasured on the dBA scale at a distance of six inches from themouth. This distance was selected as it is a typical distance fromthe teacher's mouth to an FM system's microphone. Using thisprocedure, unamplified measurements were taken for all teachers(N = 60) and amplified measurements were recorded for allexperimental teachers (N = 30). This information was used todetermine the amount of amplified difference and unamplifiedmeasurements were used to set the intensity level of the ampli-fier/receiver. Teachers were instructed to maintain the volumelevel on the amplifier/receiver established during the first weekof use. During that time teachers found that they could decreasetheir vocal intensity and vocal effort by carefully increasing thevolume setting on the amplifier/receiver to achieve a subjectivelycomfortable listening level in the classroom.
FM Sound Field Classroom AmplificationThe Phonic Ear Easy Listener Free Field Sound System TM
with a four-speaker arrangement was used in all amplifiedclassrooms. Teachers used the PE300 transmitter, the PE200receiver/amplifier (Phase I) or the PE210 receiver/amplifier(Phase II), and were given the option of using a traditional lapelmicrophone or a boom mic headset assembly. The majority ofteachers (76.67%) chose to use the boom mic configuration.Teachers were provided with auxiliary input cords and adapters toencourage use of the FM system with external sound sourcessuch as tape players, televisions, VCRs, computers, and CDROMs. In Phase I, district audiologists installed the FM systemswith assistance from the manufacturer's territory manager.During Phase II, equipment was installed by participatingclassroom teachers, ICA contact persons, and support personnelat the schools. The ICA project manager and the manufacturer'sterritory representative were available for telephone consultationas needed in Phase II. Classroom configurations and studentsafety were important factors considered when placing speakersin the main teaching area of the classroom. Whenever possible,speakers were placed at the ear height of students as recom-mended by Allen (1991). Speaker stands were not a very popularaccessory, primarily due to space and safety concerns. In mostinstances, speakers were placed on bookshelves or other secureareas away from classroom traffic and use areas or mounted onwalls using brackets. Teachers were provided with use andtroubleshooting charts and product literature (Phonic Ear, 1993).Service/maintenance contracts also were provided through theICA project.
14
Student ObservationsThe student observation instruments used in the ICA project
were the Listening and Learning Observation (LLO) (FloridaDepartment of Education, 1995a) and an adaptation of theEvaluation of Classroom Listening Behaviors (ECLB) (VanDyke,1985). Written instructions were available to assist teachers inthe completion of the LLO and ECLB observation forms. Whilethere is merit to the use of standardized or criterion-referencedtest data as well as observational data to measure improvement instudent's abilities, it was not possible to use district-wide test datafor purposes of this study. In Florida, each district selects thespecific tests to be administered on an annual basis, and as aresult, common standardized or criterion- referenced test datawas not available.
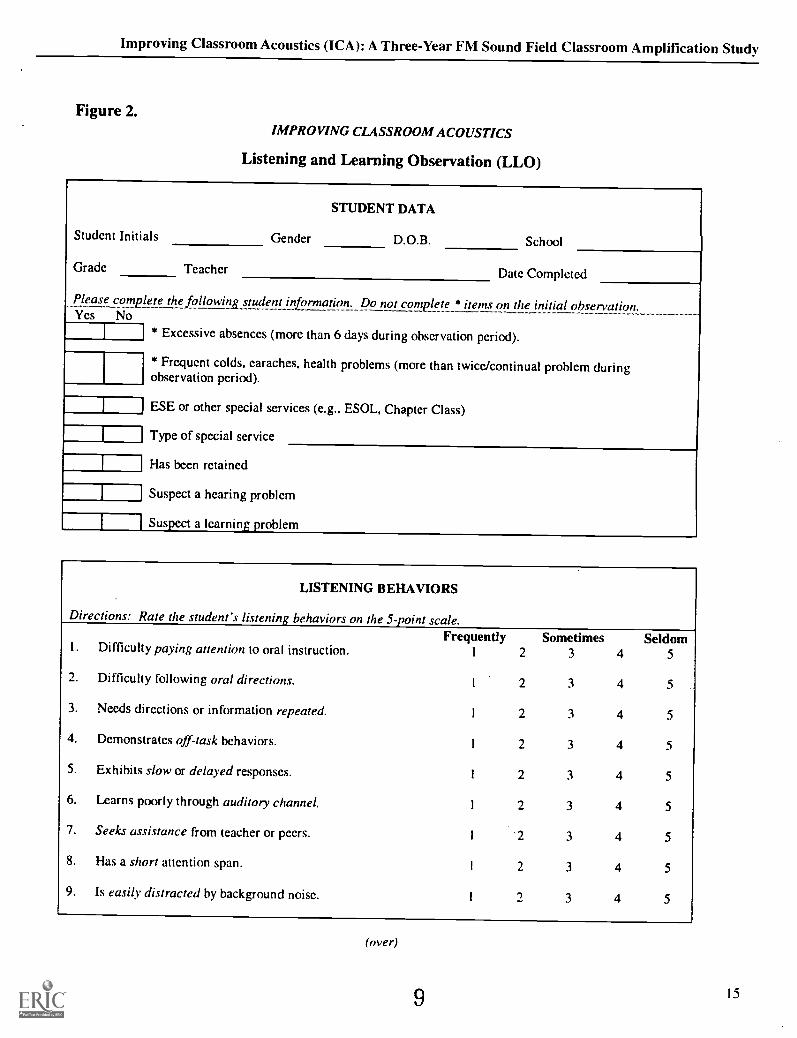
Listening and Learning Observation (LLO). The LLO,shown in Figure 2, includes information on: 1) general studentdata (e.g., excessive absences, retention, general health status,participation in special service programs at school), 2) listeningbehaviors, 3) academic/pre-academic behaviors, and 4) academic/pre-academic skills. Teachers rated students' behaviors and skillsin comparison to other students in the class. A 5-point scale (1 =frequently and 5 = seldom) was used to rate students on theListening Behaviors and Academic/Pre-Academic Behaviorssubsections. For Academic/Pre-Academic skills, 1 = belowaverage and 5 = above average on the rating scale. The maxi-mum total score on the LLO is 75, and maximum scores for theLLO subsections are: Listening Behaviors (45), Academic/Pre-Academic Behaviors (15), and Academic/Pre-Academic Skills(15). Information from the Student Data section is not includedin the LLO total score.
Evaluation of Classroom Listening Behaviors (ECLB). The10 items on the ECLB are paired for discrete classroom listeningtasks (e.g., close and distant listening, listening in noise andquiet, following single and multi-step directions, group and one-to-one listening). \Each behavior was rated on a 5-point scale (1= seldom and 5 = frequently). Maximum score on the ECLB is50.
Observation Schedule. Observations were conductedaccording to the schedule shown in Table I. In Phase I, the LLOobservation form was used for all students and the ECLB wascompleted for 10 students in each class who were selected usinga random numbers set. Student observations were completed atpre-treatment, mid-treatment (six weeks), and post-treatment (12weeks). The 12-week observation for students (N = 855) in fourdistricts from the pilot project was initiated six weeks after thebeginning of school in the fall. Pre-observation for the twodistricts joining the project mid-year occurred early in the secondsemester of the academic year. During the second semester, twoadditional observations were obtained on 804 students to demon-strate the effects of classroom amplification over a 30-weekperiod. For this group of students, the fourth observationoccurred at 21 weeks and the fifth observation at 30 weeks. ForPhase II, teachers were requested to complete both observationforms for each student. A pre-treatment observation was takenand four weeks later the post-observation occurred.
8
Improving Classroom Acoustics (ICA): A Three-Year FM Sound Field Classroom Amplification Study
Figure 2.IMPROVING CLASSROOM ACOUSTICS
Listening and Learning Observation (LLO)
STUDENT DATA
Student Initials Gender D.O.B. School
Gradc Teacher Datc Completed
Please complete the followitqt student infognution. Do not complete * items on the initial observation.Yes No
* Excessive absences (more than 6 days during observation period).
* Frequent colds, earaches, health problems (more than twice/continual problem duringobservation period).
ESE or other special services (e.g., ESOL, Chapter Class)
Type of special service
Has been retained
Suspect a hearing problem
Suspect a learning problem
LISTENING BEHAVIORS
Directions: Rate the student's listening behaviors on the 5-point scale.Frequently Sometimes Seldom
1. Difficulty paying attention to oral instruction. 1 2 3 4 5
2. Difficulty following oral directions. I 2 3 4 5
3. Needs directions or information repeated. I 2 3 4 5
4. Demonstrates off-task behaviors. I 2 3 4 5
5. Exhibits slow or delayed responses.1 2 3 4 5
6. Learns poorly through auditory channel.1 2 3 4 5
7. Seeks assistance from teacher or peers. 1 3 4 5
8. Has a short attention span. I 2 3 4 5
9. Is easily distracted by background noise.1 / 3 4 5
(over)
9 15

Journal of Educational Audiology 7 (1999)
16
ACADEMIC/PRE-ACADEMIC BEHAVIORS
Directions: Rate the student on the ollowin academic/ re-academic behaviors on the 5- oint scale.Frequently Sometimes Seldom
1. Difficulty completing tasks. 1 2 3 4 5
2. Difficulty participating appropriately in class (e.g., does notraise hand or take turns, shouts out).
1 2 3 4 5
3. Slow starter. 2 3 4 5
ACADEMIC/PRE-ACADEMIC SKILLS
Directions: Rate the student on the following academic/pre-academic behaviors on the 5-point scale. Thestudent should be rated according to his/her standing in comparison to that of his/her classmates.
BelowAverage Average
AboveAverage
Math or number concepts. 1 2 3 4 5
Language Arts (reading/pre-reading). 2 3 4 5
Vocabulary and word usage. 1 2 3 4 5
Score: LB /45 AB /15 AS /15 LLO Total Score: /75
Teacher Comments:
Hearing Screening Data(This section will be completed by the audiologist.)
Screening DatePure Tone Tympanogram Pressure Peak
RE LE RE LE
Initial Hearing Screening
Hearing Rescreening
Notes:
1 0

Improving Classroom Acoustics (ICA): A Three-Year FM Sound Field Classroom Amplification Study
Project EvaluationThe same evaluation forms were used throughout both
phases of the project. Students, teachers, parents, and schooladministrators completed forms to evaluate the use of FM soundfield classroom amplification. Written directions were availablefor each evaluation instrument, including specific text foradministration of the 5-item student evaluation form. Parents andschool administrators were encouraged to observe classroomswhen the FM system was in operation. All persons evaluating theICA project were invited to give narrative comments on severalitems and parents were encouraged to solicit information fromtheir child when completing the form. Some items included inthe evaluation instruments were selected based on findings ofprevious research, such as a decline in referrals for specialservices and teacher's perceptions on the benefits of FM soundfield amplification. All ICA forms are available in the ICAlnservice Training Manual (Florida Department of Education,1995a). All evaluations were completed at the conclusion of the12-week observation in Phase I, but additional evaluation was notconducted at the conclusion of the 30-week observation. Evalua-tion occurred after four weeks in Phase II.
Results and DiscussionStudents and Treatment Grou
Analysis of Variance (ANOVA) for Phase I showed nosignificant differences between treatment groups for any effectsother than the higher incidence of colds and health problems forthe control group per teacher report on the LLO. However, thegroups were not different for a similar item on the otologichistory form according to parent report. For Phase II, the onlysignificant finding through ANOVA was differences on both thepre- and post-LLO observations for gender and special serviceseffects. The StatView statistical package was used to analyzedata. The .05 significance level was used for all statisticalapplications.
Hearing ScreeningsPure tone hearing screenings were performed during Phase I
at 15 and 20 dB HL on 1258 students and tympanometry screen-ings were conducted for 1252 students. The pass rate foehearingscreenings at 15 dB was 74.88% and 94.36% at 20 dB HL;92.57% of the subjects had normal tympanometry results. Asmall number of students were not screened due to: 1) parentrequest for nonspecific or medical management reasons or 2)absenteeism. Hearing screening pass rates were compatiblewith contemporary research findings and also suggest that schoolfacilities may not be quiet enough to conduct pure tone screen-ings at 15 dB HL successfully. Based on otologic history volun-tarily provided by 1450 parents (67%) using an adaptation of theEar and Hearing Historv form (Anderson, 1991), nearly 15% ofthe students had experienced 10 or more ear problems duringtheir lifetime, and approximately 32% of the students had earproblems before age one. A majority of students (65.72%) weredescribed by their parents as having no history of colds, sinusproblems, or allergies. Data from the Ear and Hearing History(Table 2) form are consistent with prevalence levels reported byRichards, Flexer, Brandy and Wray (1993), who used a similaradaptation of the history form.
Classroom Ambient Noise LevelsData from Phase I revealed that only two of 60 classrooms
met the 35 dBA acceptable acoustical standard for unoccupiedclassrooms (ASHA, 1995). Figure 3 displays mean unoccupiedclassroom noise levels for the ICA project as well as data fromCrandell (1991) and Finitzo (1981). In the current study, theunoccupied mean was 47.48 dBA (R = 33.80-62.10. SD = 7.37)and 59.37 dBC (R = 50.10-73.20, SD = 5.56). Unoccupiedmeasurements were the quietest for kindergarten (46.40 dBA)and highest for first grade (48.50 dBA) classrooms . The meanoccupied classroom noise level was 62.63 dBA (R = 47.00-73.30,SD = 5.99) and 69.50 dBC (R = 57.00-82.80, SD = 4.77).Occupied kindergarten classes were the noisiest (M = 65.20 dBA)and second grade classes the quietest (M = 60.76 dBA). Thedifference between dBA and dBC measurements may be attrib-uted to the presence of low frequency noise in the 400 to 600 Hzrange that is most likely due to electrical and building-generatedvibratory noise. Findings show there has been little change inclassroom ambient noise levels reported over the past 20 yearsfor both dBA and dBC measurements (Crandell, 1991b; Crandell& Smaldino, 1992, I995b; Finitzo, 1981).
Figure 3. Summary of unoccupied classroom noise levels indBA (Phase I) and the recommended acoustical standard(ASHA, 1995).
62.00 62.10
Crandell (1991) Flidtzo (1981) ICA (1994)
(IRsoneriterated acanatkal standard: 35 dBA )
NM Lowest =II Highest =Mean -.0 Acoustical Standard
Acoustical TreatmentsFigure 4 summarizes the acoustical treatments available in
the 60 classrooms in Phase I and in studies by Bess, Sinclair andRiggs (1984) and Crandell (1991). Floor and ceiling surfaces ofclassrooms and study areas comprise approximately 60% of theroom's total surface area (Crum & Matkin, 1976). Use ofcarpeting reduces the reverberation of middle and high frequencysounds, generally beginning around 1000 Hz, and it reducesreverberation in the classroom. Acoustical ceiling tile has a moreuniform effect in producing a reduction of various sound frequen-cies, but typically with higher levels of reduction occurring in the500-4000 Hz range (Berg, 1987). Acoustical treatment of bothceiling and floor surfaces was available in 86.67% of the class-
1 1 17

Journal of Educational Audiology 7 (1999)
rooms. Draperies appear to be an unpopular classroom acces-sory; however, blinds were installed in 53.33% of classrooms,although the sound absorption capability of blinds is unknown atthis time. Fire code requirements and dry cleaning costs appearto have influenced the decision not to install draperies. Com-plaints about cleanliness and allergy factors related to carpetingmay also bring about change with this type of acoustical treat-ment. There has been little change in acoustical treatments inclassrooms reported over the past two decades as shown in Figure3, where ICA results are compared with two previous studies.
Figure 4. Summary of acoustical treatments in classrooms(Phase I).
100.00
90.00
84100
70.00
60.00
$0.00
40.00
30.00
20.00
10.00
0.00Acoustkal Carpeting Carpeting Draperies
The Ceiling over pad(no52)
Blinds
IIII ICA (1994) CI Bess, Sinclair & Riggs (1984) II Crandell (1991) 1
Increase in Teacher's Voice LevelThe average increase in teachers' vocal intensities produced
by the FM sound field system in Phase I is shown in Figure 5.The average increase was +6.94 dBA at a distance of six inchesfrom the speaker when compared to a measure of loudness sixinches from the mouth of the teacher. These findings are withinthe anticipated +5 to +10 dB of enhancement that an FM soundfield system is reputed to provide. Teachers found during theirfirst week of using the sound field system that they were able todecrease vocal intensity and effort by using the amplifier/receiverto achieve a comfortable listening level in the classroom. It isdifficult, at best, to predict signal-to-noise (S/N) ratios in class-rooms, because the teadher's voice level and classroom ambientnoise levels are constantly changing. Markides (1986) estimated59 dBA to be the level of a typical teacher's voice at a distance of1 meter (3+ feet). Using this estimate, the average occupiedclassroom in Phase I produced a -3.63 dB S/N at a distance ofslightly more than three feet. By adding the +6.94 averageincrease in amplified teachers' vocal intensities, the S/N may be
1812
speculated to be +3.31 dB. This level is slightly better than datareported by Zabel and Taber (1993). Interestingly, Crandell,Smaldino & Hexer (1999) reported that the signal-to-noise ratioin unamplified classrooms typically ranges from +5 to -7 dB.
Figure 5. Summary of increase in teachers' mean vocalintensity in dBA with FM sound field amplification(Phase I).
+8.00 +7.13+7.65
+6.94+7.00 +6.05+6.00
Et3 +5.00.9
+4.00
+3.00
+2.00
+1.00
+0.00
Gr.K (N=10) Gr.1 (N=10) Gr.2 (N=10) Total (N=30)
Listening and Learning Observation (LLO) AnalysisTable 3 provides a summary of mean scores for the LLO
total score and its three subsections for Phase I. Data from PhaseI showed that students in amplified (experimental) classroomsdemonstrated significantly greater improvement in listening andlearning behaviors and skills and changed at a faster rate thantheir peers in unamplified classes. Interestingly, students inexperimental classes exhibited lower pre-treatment scores thancontrol classes. Students in control classrooms exhibited a moregradual change in listening and learning behaviors and skills overthe 12-week observation period. Results of paired t-test scores(Table 3) for the LLO total score showed the experimental groupto be significantly different from the control group for pre-treatment to mid-treatment, mid-treatment to post-treatment, andpre-treatment to post-treatment. Table 4 shows that for Phase II,significant change was noted after only four weeks of sound fielduse based on the LLO and ECLB total scores as well as the LLOsubsection scores.
Table 5 shows that experimental first graders in Phase Idemonstrated the greatest improvement in LLO total score forobservation 1 to 2 (6 weeks) and 1 to 3 (12 weeks). Kindergartenstudents in unamplified (control) classes showed the least amountof improvement for the same observation periods. The p valuesfrom paired t-tests for each treatment group further amplify theobserved differences between groups and demonstrate thesignificantly higher scores attained by the experimental groupwhen using FM sound field amplification. First grade studentsshowed the greatest change on each of the four LLO measuresand second grade students demonstrated the least improvement.However, first graders exhibited lower pre-treatment mean scoresfor all measures and also showed the highest percentage ofstudents receiving special services (30.88%).

Improving Classroom Acoustics (ICA): A Three-Year FM Sound Field Classroom Amplification Study
Table 3. Summary of mean scores for the LLO total score and subsections and the ECLBand paired t-test results (Mean differences and p values) by treatment group for Phase I.
ObservationInstrument
ControlMean Score
(N=656)
ExperimentalMean Score
(N=663)
Observation1 to 2
(Mean Diff.)
Observation2 to 3
(Mean Diff.)
Observation1 to 3
(Mean Diff.)
LLO#1 Total 53.93 51.92 C -0.646 C -1.139* C -1.785*LLO#2 Total 54.58 58.36 E -6.541* E -1.050 E -7.591*LLO#3 Total 55.72 59.41
LLO (LB)#1 32.81 31.02 C -0.366 C -0.602 C -0.968*LLO (LB)#2 33.17 35.55 E -4.523* E -0.623 E -5.146*LLO (LB)#3 33.77 36.17
LLO (AB)#1 11.29 10.97 C -0.096 C -0.189 C -0.285LLO (AB)#2 11.39 12.17 E -1.202* E -0.219 E -1.421*LLO (AB)#3 11.58 12.39
LLO (AS)#1 9.84 9.83 C -0.184 C -0.348* C -0.532*LLO (AS)#2 10.02 10.65 E -0.816* E -0.208 E -1.024*LLO (AS)#3 10.37 10.86
ECLB#1 41.45 39.01 C -0.094 C -0.512 C -0.606ECLB#2 41.54 43.68 E -4.677* E -0.694 E -5.371*ECLB#3 42.06 44.38
*Significant (p<0.05)
Maximum score for the Listening and Learning Observation (LLO) total is 75, LLO Listening Behaviors (L.8) is 45,LW Academic Behaviors (AB) is 15, and LLO Academic Skills (AS) is 15. Maximum score for the Evaluation ofClassroom Listening Behaviors (ECLB) is 50.
Table 4. Summary of mean scores for the LLO total score and subsections and the ECLB and paired t-testresults (p values) for Phase II (N=431).
Observation Instrument Mean Score Observation 1 to 2 (p value)
LLO#1 Total 52.48LLO#2 Total 57.33 <.0001
LLO (LB)#1 31.81LLO (LB)#2 35.12 <.0001
LLO (AB)#1 11.36LLO (AB)#2 12.13 <.0001
LLO (AS)#1 9.66LLO (AS)#2 10.11 <.0001
ECLB#1 39.54ECLB#2 43.30 <.0001
Maximum score for the Listening and Learning Observation (LLO) total is 75, LLO Listening Behaviors (LB) is 45,LLO Academic Behaviors (AB) is 15, and LLO Academic Skills (AS) is 15. Maximum score for the Evaluation ofClassroom Listening Behaviors (ECLB) is 50.
13 19

Journal of Educational Audiology 7 (1999)
Table S. Summary of greatest and least improvement by grade level and treatment group(C = control, E = experimental) on the Listening and Learning Observation (LLO) and theEvaluation of Classroom Listening Behaviors (ECLB) for Phases I and II.
ObservationInstrument
GreatestImprovement
(Phase I)
LeastImprovement
(Phase I)
GreatestImprovement
(Phase II)
LeastImprovement
(Phase II)
LLO Listening BehaviorsObservation 1 to 2 Grade 1 (E)Observation 1 to 3 Grade 1 (E)
LLO Academic/Pre-academic BehaviorsObservation 1 to 2 Kindergarten (E)
Grade I (E)Observation 1 to 3 Kindergarten (E)
LLO Academic/Pre-academic SkillsObservation 1 to 2 Kindergarten (E)Observation 1 to 3 Kindergarten (E)
LLO Total ScoreObservation 1 to 2 Grade 1 (E)Observation 1 to 3 Grade 1 (E)Observation 1 to 4 Kindergarten (E)Observation 1 to 5 Kindergarten (E)
ECLBObservation 1 to 2 Kindergarten (E)Observation 1 to 3 Kindergarten (E)Observation 1 to 4 Kindergarten (E)Observation 1 to 5 Kindergarten (E)
Kindergarten (C)Kindergarten (C)
Grade 2 (C)
Grade 2 (C)
Grade 1 Grade 2
Grade 1 Grade 2
Kindergarten (C) Grade 1 Grade 2Grade 2 (C)
Kindergarten (C) Grade 1 Grade 2Kindergarten (C)Grade 2 (C)Grade 1 (C)
Grade 1 (C)Grade 2 (C)Grade 1 (C)Grade 1 (C)
Grade 1 Grade 2
Evaluation of Classroom Listening Behaviors (ECLB) AnalysisResults of the Evaluation of Classroom Listening Behaviors
(ECLB) (N = 741) for Phase I were similar to those shown for theLLO (Table 3). Again the lower pre-treatment score is noted forthe experimental group, and dramatic growth is seen for theexperimental group after six weeks of FM sound field amplifica-tion use. Paired t-test results show no significant mean differ-ences for the control group from pre-treatment (ECLB#1) to mid-treatment (ECLB#2) or from pre-treatment (ECLB#1) to post-treatment (ECLB#3). For the experimental group, both observa-tion periods showed significant findings. The greatest improve-ment on the ECLB at six and 12 weeks was shown by kindergar-ten students in amplified classrooms and the least improvementby first and second graders in unamplified classes respectively(Table 5). Crandell et al. (1995) have suggested that the greaterchange for younger students may be, at least in part, due to thefact that younger children are often plagued by otitis media andrequire speech to be louder in order to hear more clearly. Also,their immature linguistic and auditory systems make it less easyfor them to "fill in the gaps". Phase II showed the same trend forthe ECLB as noted for the LLO (Table 4). First graders showed
20
the greatest improvement and second grade students showed theleast improvement (Table 5). Other studies have shown thatyoung students exhibit improved attending and listening behav-iors in the presence of FM sound field amplification (Allen &Patton, 1990; Benafield, 1990).
LLO and ECLB 30-week ObservationLLO data collected from five observations on 804 students
over 30 weeks during Phase I are depicted in Figure 6. (Thisincluded students from the pilot study whose teachers continuedwith observations for the 30-week period.) The experimentalgroup exhibited significantly greater improvement in LLO totalscore than the control group for pre-treatment score to measure-ments taken at 6, 12, 21, and 30 weeks. Mean total scores for theEvaluation of Classroom Listening Behaviors (ECLB) (N = 369)for treatment groups over 30 weeks of observation are plotted inFigure 7 for students participating in Phase I. As on the LLO,the experimental group showed significantly higher meandifferences from pre-treatment to each of the subsequent observa-tions at 6, 12, 21, and 30 weeks. Treatment groups were notsignificantly different for other observation comparisons.
14

Improving Classroom Acoustics (ICA): A Three-Year FM Sound Field Classroom Amplification Study
Figure 6. Summary of LLO mean total scores for five observations (Phase I).
62
60
E 58
56
54 53.150.4
32 50
48
50.84
54.62
57.56 58.03
55.68
58.85
55.86 55.95
59.39
46
LLO#1 LLO#2 LLO#3 LLO#4
Control (N = 399) I Experimental (N = 405)
LLO#5
Figure 7. Summary of ECLB mean total scores for five observations (Phase I).
cz)
45
44
43
42
41
40
39
38
37
36
35
43.01 43.29
41.59
43.63 43.67
41.72
ECLB#1 ECLB#2 ECLB#3 ECLB#4
ControhN = 184) "'Experimental (N = 185)
15
ECLB#5
21

Journal of Educational Audiology 7 (1999)
LLO and ECLB CorrelationsCorrelations for the ECLB and LLO are strong, suggesting
that these observation instruments are measuring similarabilities. Correlations for the total mean scores for the twoinstruments for Phase I and II respectively are: 0.831 and 0.828(observation #1), 0.788 and 0.705 (observation #2), and 0.832
(observation #3, Phase I only). It also is important to note thatfor Phase I, from observation 1 to observation 2, the experimentalgroup also showed significant change on nine of the 10 listeningbehaviors on the ECLB, but the control group showed nosignificant change for any item. These findings further supportthe appropriateness of these instruments for the observation ofstudents' classroom listening behaviors.
Table 6. Summary of student, teacher, parent, and administrator comments about FMsound field classroom amplification (Phase I of the ICA Project).
Student comments.The microphone helps me hear better because my teacher has a soft voice and you can't always hear her.When my teacher turns off the speakers we cannot hear that good.It helps a lot of people who sit in the back and can't hardly hear without the microphone.Our teacher lets us read with it and that's good for shy people.When other kids tell stories to the class we can all hear real good.The speakers make us all pay attention better than we used to last year.I hope we get to have it in our classroom next year to hear better some more.
Teacher comments.Students could hear and understand better.The system encourages shy children to speak and share information in front of the class; it builds confidencein all students when they use the microphone.It helps students follow directions and enhances listening skills, especially low ability students.More seating options are available to students with hearing loss.It decreases teacher's voice problems, reduces vocal strain, produces a more relaxed feeling whcn teaching,and teachers feel less tired at the end of the day.It improves student attention; the system assists in getting and holding student's attention.It improves rate of learning phonics because students listen and understand better.It is an effective tool for chalkboard writing, giving tests, and playing tapes in class.Everyone benefits by using the FM system in the classroom. Every class should have one.
Parent comments,It improves the student's ability to hear the teacher more easily and clearly.It improves the student's ability to understand the teacher more easily.It makes learning easier.It increases self-confidence when students use the microphone in front of the class.It improves the attention and focus of students.It improves the student's ability to hear the teacher from any location in the room, when writing on the chalk-board, when speaking softly, and above classroom noise.It improves student's ability to concentrate and ignore classroom noise.It improves student's behavior.It is easier on the teacher when using the FM system.Students enjoy using the FM sound field classroom amplification system. Every classroom should have one.
Administrator comments.It saves the teacher's voice and they are less fatigued at the end of the day.Students could hear the teacher equally as well from any point in the classroom and able to hear the teacherclearly at all times.Students seemed to listen better.Students seemed to focus more quickly and consistently.Students were more in tune with the teacher.Students like using the amplification and felt important.Class time was saved because instructions did not have to be repeated.
2216

Improving Classroom Acoustics (ICA): A Three-Year FM Sound Field Classroom Amplification Study
Project EvaluationFM sound field amplification was evaluated by 1221
students (Table 6), 55 general education classroom teachers(Table 7), 630 parents (Table 8), and 27 school administrators(Table 9) using evaluation forms devised for the project (FloridaDepartment of Education, 1995a). Evaluations from both phase,sof the project were generally positive based on perceivedbenefits. A summary of convincing comments provided bystudents, teachers, parents, and school administrators whoparticipated in Phase I is provided in Table 6.
Student Evaluation. Use of the FM sound field amplificationsystem was evaluated by student participants in Phases I (N =663) and II (N = 558). Students were requested to respond "yes"or "no" to five statements read by the teacher according to aprepared script. A summary of the students' affirmative re-sponses is given in Table 7. Students in Phase II gave slightlyhigher affirmative responses on four of the five statements thandid those in Phase I. As may be seen, students were very strongin supporting the use of FM sound field amplification, whichsuggests that they felt the FM system was a valuable contributionto enhanced listening in the classroom.
Table 7. Summary of percentage of affirmative responses by students on the evaluation ofFM sound field classroom amplification for Phase I (N = 663) and Phase II (N = 558) of theICA Project.
Statement Phase I Phase II
It is easier to hear my teacher when he/she uses the microphone. 97.44% 98.59%
My teacher's voice is loud and clear when he/she uses the microphone. 94.57% 95.41%
The speakers help me listen better. 95.78% 96.47%
When my teacher is writing on the board I can still hear him/her. 96.53% 96.29%
I wain to use the listening equipment again next year. 94.70% 94.70%
Teacher Evaluation. As may be seen in Table 8, teachers wereunanimous in their agreement that decreased vocal strain wastheir greatest perceived benefit from FM sound field amplifica-tion. This result is not unexpected since research has shown thatteachers present a significantly higher frequency of vocalproblems than the general population (Sargent, Gidman,Humphreys, & Utley, 1980). Crandell and Smaldino (1995b)suggested that teachers' vocal problems may result, at least inpart, from their need to increase vocal output to be heard over theclassroom noise. There were no strongly disagree responsesoffered by teachers in either phase of this study. The markeddifference for assistance from the audiologist may be explainedbecause an audiologist was available in each of the districtsparticipating in Phase I. For Phase II, the audiologist/projectmanager provided the inservice training and was then availableonly by telephone for consultation. Teachers in Phase II citedmore technical difficulties than the Phase I group. In Phase I,teachers reported that they used the sound field system anaverage of 4.43 hours per day and the second group averaged3.88 hours of daily use. Teachers indicated that their use of thesound field amplification system was influenced by their classschedules (e.g., learning centers, out of classroom time forspecial classes).
Parent Evaluation. There was a 67.42% response rate for parentevaluations in Phase I (N = 447) and a 42.46% response forPhase II (N = 183). Of that number, 38.03% and 24.59% ofparents observed the sound field system in use in the classroomin Phases I and II respectively. A summary of their appraisal isprovided in Table 9.
Administrator Evaluation. Like the 14 school administrators inPhase I, the 13 administrators completing the evaluation form atthe conclusion of Phase II were in 100% agreement that teachersenjoyed using the FM sound field systems (Table 10.) The soundfield system was observed in use at least five times by 42.86%(Phase I) and 61.54% (Phase II) of the administrators, with theremainder observing five to ten times during the project'sdesignated observation period.
17 23

Journal of Educational Audiology 7 (1999)
24
Table 8. Summary of teacher evaluation of FM sound field classroom amplification for Phase I (N = 30) andPhase II (in italics) (N=25).
Statement RankStrongly
Agree Agree Neutral Disagree
Less emotional strain and fatigue during 8 73.33% 20.00% 6.67%teaching. 7 60.00% 40.00%
Students seem more attentive. 8 73.33% 20.00% 6.67%9 56.00% 44.00%
Decrease in need to repeat directions and 11 56.67% 43.33%information. 7 64.00% 32.00% 4.00%
Students seemed to listen and understand 10 66.67% 26.67% 6.67%better. 10 60.00% 32.00% 8.00%
Teacher's voice seemed to reach all students 5 90.00% 10.00%no matter where they were seated. 3 80.00% 20.00%
Did not have to strain voice to reach 1 100.00%students. 1 92.00% 8.00%
FM equipment helped with classroom 12 50.00% 30.00% 16.67% 3.33%control and managing student behavior. // 48.00% 48.00% 4.00%
FM equipment was easy to use. 2 93.33% 6.67%6 76.00% 20.00% 4.00%
Teacher enjoyed using FM sound field 5 90.00% 10.00%system. 3 80.00% 20.00%
Teacher felt comfortable using the FM 5 90.00% 10.00%equipment. 2 88.00% 8.00% 4.00%
Teacher would like to keep the ampli- 2 93.33% 6.67%fication system in their classroom. 3 88.00% 4.00% 8.00%
Assistance from the audiologist prepared 2 93.33% 6.67%teacher to use FM system. 11 68.00% 8.00% 24.00%
The "strongly disagree" category was available but not selected by any of the respondents.
18

Improving Classroom Acoustics (ICA): A Three-Year FM Sound Field Classroom Amplification Study
Table 9. Summary of parent evaluation of FM sound field classroom amplification for Phase I (N = 447) andPhase II (in italics) (N=183).
Statement
My child seemed to enjoy using theclassroom amplification system.
My child's behavior seemed to improve atschool when the classroom amplificationwas used.
My child's grades improved when usingthe classroom amplification system.
My child would like to continue using theclassroom amplification equipment atschool.
StronglyAgree Agree Neutral Disagree
StronglyDisagree
64.27% 18.88% 13.48% 1.35% 2.02%65.57% 20.22% 12.02% 1.09% 1.09%
24.65% 22.00% 48.07% 3.63% 2.04%28.42% 28.42% 44.81% 2.73% 3.83%
19.50% 26.98% 46.71% 431% 2.49%24.59% 24.59% 43.72% 4.37% 2.73%
69.51% 16.14% 8.74% 3.59% 2.02%65.85% 16.94% 8.74% 3.83% 1.09%
Table 10. Summary of school administrator evaluation of FM sound field classroom amplification for PhaseI (N = 14) and Phase II (in italics) (N=13).
StatementStronglyAgree Agree Neutral
Teachers seemed to enjoy using FM sound field classroom 78.57% 21.43%amplification. 76.92% 23.08%
FM sound field amplification enhanced class instruction and 64.29% 28.57% 7.14%management. 38.46% 61.54%
Decreased number of absences for teachers in amplified 14.29% 7.14% 78.57%classes. 7.69% 30.77% 61.64%
Decrease in behavior referrals from amplified classes. 14.29% 50.00% 35.71%53.85% 46.15%
Decrease in referrals for special services or interventions 14.29% 28.57% 57.14%from classes with amplification. 7.69% 15.38% 76.92%
Cost EffectivenessIn addition to other benefits, FM sound field technology is
noted to be a cost effective means to enhance the listening andlearning environment. It is well known that young listenersrequire an enhanced signal-to-noise ratio to achieve adult-likespeech recognition skills (Crandell & Smaldino, I995a, b;Nabelek & Pickett, 1974; Nabelek & Robinson, 1982; Neuman &
Hochberg, 1983; Papso & Blood, 1989;). Table 11 reveals thatthe daily per person cost ($.14) for the FM sound field system isless than the daily per person cost for several other frequentlyused types of instructional delivery equipment. Adding aminimum five year longevity factor, the cost of the basic systemwould decrease to $.03 per student per day for the system with orwithout the boom mic assembly.
1 925

Journal of Educational Audiology 7 (1999)
Table 11. Summary of daily per person cost for the FM sound field classroom amplification system and otherinstructional delivery equipment. (Per person cost for equipment is based on a typical class of 1 teacher and25 students.)
Instructional Delivery Equipment Daily Per Person Cost
FM Sound Field Classroom Amplification SystemFM Sound field Classroom Amplification System with Boom MicComputer with CD and Reference BundleBasic ComputerTV (25") with VCROverhead ProjectorFilmstrip Projector with SoundCassette Tape Player
$ 0.14$ 0.16$ 0.41$ 0.33$ 0.18$ 0.10$ 0.08$ 0.04
Cost for instructional equipment is based on the bid list held by the School Board of Sarasota County, FL
SummaryThe IMPROVING CLASSROOM ACOUSTICS (ICA) project
implemented in 33 Florida school districts over a three-yearperiod demonstrated that FM sound field classroom amplificationis an effective intervention strategy to produce significant changein students' listening and learning behaviors and skills. Studentsin early grade general education amplified classrooms demon-strated significantly greater change in listening and learningbehaviors and skills and progressed at a faster rate than grade-alike peers in unamplified classrooms, with younger studentsshowing the greatest improvement. Support from students,teachers, parents, and administrators was positive toward the useof the sound field system, and the success of this project hasenabled each of the participating districts to provide sound fieldamplification in additional classrooms. This study also showedthat unoccupied classroom noise levels and acoustical treatmentshave not changed over the past two decades. If this study were tobe repeated, it would be important to include reverberationmeasurements, for this characteristic, along with noise, is one ofthe major contributors to poor classroom acoustics. Becausethere are no enforceable standards for classroom acoustics at thistime, FM sound field amplification may be viewed as at least apart of the solution to improving listening conditions in class-rooms. However, audiologists also should advocate for acousti-cal standards and modifications to enhance the listening environ-ment in addition to recommending the use of sound field amplifi-cation. Finally, the vast array of sound field technology andoptions available as we enter the new millennium should con-tinue to make sound field amplification a very desirable andaffordable means to enhance listening and learning in theclassroom.
AcknowledgementsThe IMPROVING CLASSROOM ACOUSTICS (ICA) project
was funded by the Florida Department of Education, Division ofPublic Schools, Bureau of Student Services and Exceptional
26
Education, through federal assistance under the Individuals withDisabilities Education Act (IDEA), Part B, as a special project.The primary author managed the project.
Portions of this manuscript were presented at the 1995American Academy of Audiology Annual Convention, Dallas andthe 1996 Florida Association of Speech-Language Pathologistsand Audiologists (FLASHA) Annual Convention, Ft. Lauderdale,FL.
ReferencesAllen, L. (1991). A school handbook on classroom amplification
equipment. Elkader, IA: Keystone Area Education Agency.Allen, L. & Patton, D. (1990, November). Effects of sound field
amplification on students' on-task behavior Paper presentedat the American Speech-Language Hearing AssociationConvention, Seattle, WA.
American Speech-Language-Hearing Association. (1996).Guidelines for audiologic screening. Rockville, MD: Author.
American Speech-Language-Hearing Association. (1995).Guidelines for acoustics in educational environments. Asha,37( Suppl. 14), 15-19.
Anderson, K. (1991). Hearing conservation in the public schoolsrevisited. Seminars in Hearing, 12(4), 340-363.
Benafield, N. (1990). The effects of sound field amplification onthe attending behaviors of speech and language-delayedpreschool children. Unpublished master's thesis, Universityof Arkansas at Little Rock.
Berg, F. (1987). Facilitating classroom listening: A handbook forteachers of normal and hard of hearing children. Boston:College-Hill Press.
Berg, F. (1993). Acoustics and sound systems in schools. SanDiego, CA: Singular Publishing Group.
Berg, F., Blair, J. & Benson, P. (1996). Classroom acoustics: Theproblem, impact and solution. Language, Speech andHearing Services in Schools, 27, 16-20.

Improving Classroom Acoustics (ICA): A Three-Year FM Sound Field Classroom Amplification Study
Bess, F., Sinclair, J. & Riggs, D. (1984). Group amplification inschools for the hearing-impaired. Ear and Hearing, 5, 138-144.
Butler, K. (1975, November). Auditory perceptual skills: Theirmeasurement and remediation with preschool and school-age children. Paper presented at the American Speech-Language-Hearing Association Convention, Washington,D.C.
Crandell, C. (1991). The effects of classroom amplification onchildren with normal hearing: Implications for interventionstrategies. Educational Audiology Monograph, 2, 18-38.
Crandell, C. (1993). Speech recognition in noise by childrenwith minimal degrees of sensorineural hearing loss. Ear &Hearing, 14(3), 210-216.
Crandell, C. (1996). Effects of sound field FM amplification onthe speech perception of ESL children. EducationalAudiology Journal, 4, 1-5.
Crandell, C. (1998). Using sound field FM amplification in theeducational setting. The Hearing Journal, 51(5), 10-19.
Crandell, C. & Bess, F. (1987a, November). Developmentalchanges in speech recognition in noise and reverberation.Paper presented at the American Speech-Language-HearingAssociation Convention, New Orleans, LA.
Crandell, C. & Bess, F. (1987b, November). Sound-fieldamplification in the classroom setting. Paper presented atthe American Speech-Language-Hearing AssociationConvention, New Orleans, LA.
Crandell, C. & Smaldino, J. (1992). Sound field amplification inthe classroom setting. American Journal of Audiology, 1(4),14-16.
Crandell, C. & Smaldino, J. (1995a). Classroom acoustics. In R.Roeser,& M. Downs (Eds.) Auditory disorders in schoolchildren (3rd ed.) (pp. 219-234). New York: ThiemeMedical Publishers, Inc.
Crandell, C. & Smaldino, J. (1995b). Speech perception in theclassroom. In C. Crandell, J. Smaldino & C. Flexer (Eds.),Sound-field FM amplification: Theory and practicalapplications (pp. 29-48). San Diego: Singular PublishingGroup, Inc.
Crandell, C., Smaldino, J. & Flexer, C. (Eds.) (1995). Sound-field FM amplification: Theory and practical applications.San Diego: Singular PubliShing Group, Inc.
Crandell, C., Smaldino, J. & Flexer, C. (1999). An overview ofsound field FM amplification. The Hearing Review, 6 (6),40-42.
Crum, M. & Matkin, N. (1976). Room acoustics: The forgottenvariable. Language, Speech & Hearing Services in theSchools, 3, 106-110.
Downs, D. & Crum, M. (1978). Processing demands duringauditory learning under degraded listening conditions.Journal of Speech & Hearing Research, 21, 702-714.
Elliott, L. (1979). Performance of children aged 9 to 17 on a testof speech intelligibility in noise using sentence material withcontrolled word predictability. Journal of the AcousticalSociety of America, 66, 651-653.
Elliott, L. (1982). Effects of noise on perception of speech bychildren and certain handicapped individuals. Sound andVibration, 12, 9-14.
Fior, R. (1972). Physiological maturation of auditory functionbetween 3 and 13 years of age. Audiology, 11, 317-321.
Finitzo, T. (1981). Classroom acoustics. In R. Roeser & M.Downs (Eds.), Auditory disorders in school children (2nded.), (pp. 221-233). New York: Thieme-Stratton.
Finitzo-Hieber, T. & Tillman, T. (1978). Room acoustic effectson monosyllabic word discrimination ability for normal andhearing impaired children. Journal of Speech and HearingResearch, 21, 440-448.
Flexer, C. (1992). Classroom public address systems. In M. Ross(Ed.), FM auditory training systems: Characteristics,selection & use (pp. 189-209). Timonium, MD: York Press.
Flexer, C. (1997). Sound-field FM systems: Questions most oftenasked about classroom amplification. Hearsay, 11, 5-14.
Florida Department of Education (1995a). Improving classroomacoustics: Inservice training manual. Tallahassee, FL:Author.
Florida Department of Education (1995b). Improving classroomacoustics: 1nservice training transparency master manual.Tallahassee, FL: Author.
Hart, P. (1983). Classroom acoustical environments for childrenwith central auditory processing disorders. In E. Lasky & J.Katz (Eds.), Central auditory processing disorders:Problems of speech, language, and learning (pp. 343-352).Baltimore: University Park Press.
Leavitt, R. & Flexer, C. (1991). Speech degradation as measuredby the rapid speech transmission index (RASTI). Ear &Hearing, 12, 115-118.
Lewis, D. (1994a). Assistive devices for classroom listening.American Journal of Audiology, 3(1), 58-69.
Lewis, D. (1994b). Assistive devices for classroom listening:FM systems. American Journal of Audiology, 3(1), 70-83.
Markides, A. (1986). Speech levels and speech-to-noise ratios.British Journal of Audiology, 20, 115-120.
McCroskey, F. & Devens, J. (1975). Acoustic characteristics ofpublic school classrooms constructed between 1890 and1960. NOISEXPO Proceedings,101-103.
Nabelek, A. & Pickett, J. (1974) Monaural and binaural speechperception through hearing aids under noise and reverbera-tion with normal and hearing-impaired listeners. Journalof Speech and Hearing Research, 17, 724-739.
Nabelek, A. & Robinson, P. (1982). Monaural and binauralspeech perception in reverberation for listeners of variousages. Journal of the Acoustical Society of America, 71(5),1242-1248.
Neuman, A. & Hochberg, I. (1983). Children's perception ofspeech in reverberation. Journal of the Acoustical Society ofAmerica, 73(6), 2145-2149.
Olsen, W. (1981). The effects of noise and reverberation onspeech intelligibility. In F. Bess, B. Freeman & J. Sinclair(Eds.), Amplification in education (pp. 151-163).Washington, D.C.: A.G. Bell Assn. for the Deaf.
'2 1 27

Journal of Educational Audiology 7 (1999)
Papso, C. & Blood, I. (1989). Word recognition skills of childrenand adults in background noise. Ear and Hearing, 10(4),235-236.
Phonic Ear, Inc. (1993). Easy listener free field sound system:User instructions. Petaluma, CA: Author.
Rabbit, P. (1966). Recognition: Memory for words correctlyheard in noise. Psychonomic Sciences, 6, 383-384.
Richards, C., Flexer, C., Brandy, W. & Wray, D. (1993). Signal-to-noise enhancing devices can improve kids reading skills.Hearing Instruments, 44(1), 12-15.
Rosenberg, G. & Blake-Rahter, P. (1995a). Sound-field amplific-ation: A review of the literature. In C. Crandell, J. Smaldino& C. Flexer (Eds.), Sound-field FM amplification: Theoryand practical applications (pp. 107-124). San Diego:Singular Publishing Group, Inc.
Rosenberg, G. & Blake-Rahter, P. (1995b). Inservice training forthe classroom teacher. In C. Crandell, J. Smaldino & C.Flexer (Eds.), Sound-field FM amplification: Theory andpractical applications (pp. 149-190). San Diego: SingularPublishing Group, Inc.
Ross, M. (1995). Foreword. In C. Crandell, J. Smaldino & C.Flexer (Eds.), Sound-field FM amplification: Theory andpractical applications (pp. vii-ix). San Diego: SingularPublishing Group, Inc.
Sanders, D. (1965). Noise conditions in normal school classrooms. Exceptional Children, 31, 344-353.
Sarff, L. (1981). An innovative use of free-field amplification inclassrooms. In R. Roeser & M. Downs (Eds.), Auditorydisorders in school children (pp. 263-272). New York:Thieme-Stratton.
Sargent, J., Gidman, M., Humphreys, M. & Utley, W. (1980).The disturbance caused by school teachers to noise. Journalof Sound and Vibration, 62, 277-292.
VanDyke, J. (1985). Evaluating amplification in the classroom.Rocky Mountain Journal of Communication Disorders (1).
Williams, A., Tharpe, A. M., & Bess, F. (1994, October). Thestatus of amplification and earmolds worn by children in theU.S. Paper presented at the International Symposium onAmplification for Children with Auditory Deficits, PalmSprings, CA.
Zabel, H. & Tabor, M. (1993). Effects of classroom amplificationon spelling performance of elementary school children.Educational Audiology Monograph, 3, 5-9.
28 2 2

U.S. Department of EducationOffice of Educational Research and Improvement (0ERI)
National Library of Education (NLE)Educational Resources Information Center (ERIC)
REPRODUCTION RELEASE(Specific Document)
I. DOCUMENT IDENTIFICATION:
)1]
Title:Improving Classroom Acoustics (ICA): A Three-Year FM Sound Field ClassroomAmplification Study'
Author(s): Rosenberg, Gail Gregg, et al
Corporate Source:
Journal of Educational Audiology
Publication Date:
1999
II. REPRODUCTION RELEASE:
In order to disseminate as widely as possible timely and significant materials of interest to the educational community, documents announced in themonthly abstract journal of the ERIC system, Resources in Education (RIE), are usually made available to users in microfiche, reproduced paper copy,and electronic media, and sold through the ERIC Document Reproduction Service (EDRS). Credit is given to the source of each document, and, ifreproduction release is granted, one of the following notices is affixed to the document.
If permission is granted to reproduce and dissiminate the identified document, please CHECK ONE of the following three options and sign at the bottomof the page.
The sample sticker shown below will beaffixed to all Level 1 documents
PERMISSION TO REPRODUCE ANDDISSEMINATE THIS MATERIAL HAS
BEEN GRANTED BY
\se
Se'oc
TO THE EDUCATIONAL RESOURCESINFORMATION CENTER (ERIC)
Level
Check here for Level 1 release, permittingreproduction and dissemination in microfiche or other
ERIC archival media (e.g., electronic) end papercopy.
Signhere,)please
The sample sticker shown below will beaffixed to all Level 2A documents
PERMISSION TO REPRODUCE ANDDISSEMINATE THIS MATERIAL IN
MICROFICHE, AND IN ELECTRONIC MEDIAFOR ERIC COLLECTION SUBSCRIBERS ONLY,
HAS BEEN GRANTED BY
\eP
2A
TO THE EDUCATIONAL RESOURCESINFORMATION CENTER (ERIC)
Level 2A
Check here for Level 2A release, permittingreproduction and dissemination in microfiche and in
electronic media for ERIC archival collectionsubscribers only
The sample sticker shown below will beaffixed to all Level 2B documents
PERMISSION TO REPRODUCE ANDDISSEMINATE THIS MATERIAL IN
MICROFICHE ONLY HAS BEEN GRANTED BY
23
TO THE EDUCATIONAL RESOURCESINFORMATION CENTER (ERIC)
Level 2B
Check here for Level 2B release, permittingreproduction and dissemination in microfiche only
Documents will be processed as Indicated provided reproduction quality permits.If permission to reproduce is granted, but no box is checked, documents will be processed at Level 1.
I hereby grant to the Educational Resources Information Center (ERIC) nonexclusive permission to reproduce and disseminate this documentas indicated above. Reproduction from the ERIC microfiche or electronic media by persons other than ERIC employees and its systemcontractors requires permission from the copyright holder. Exception is made for non-profit reproduction by libraries and other service agenciesto satisfy information needs of educators in response to discrete inquiries.
Signature4., Printed Name/Positionfritle:
//1/. 4ssr.Organdation/Address:
obiazery ASA'. E-Mail Address:E44e, SerRof YE.
Com
FAXikifiisN 517Date 7 /hAeva_
(over)

III. DOCUMENT AVAILABILITY INFORMATION (FROM NON-ERIC SOURCE):
If permission to reproduce is not granted to ERIC, or, if you wish ERIC to cite the availability of the document from another source, pleaseprovide the following information regarding the availability of the document. (ERIC will not announce a document unless it is publiclyavailable, and a dependable source can be specified. Contributors should also be aware that ERIC selection criteria are significantly morestringent for documents that cannot be made available through EDRS.)
Publisher/Distributor:
Address:
Price:
IV. REFERRAL OF ERIC TO COPYRIGHT/REPRODUCTION RIGHTS HOLDER:
If the right to grant this reproduction release is held by someone other than the addressee, please provide the appropriate name andaddress:
Name:
Address:
V. WHERE TO SEND THIS FORM:
Send this form to the following ERIC Clearinghouse: National Clearinghouse for Educational FacilitiesNational Institute of Building Sciences1090 Vermont Ave., NW #700Washington, DC 20005-4905
However, if solicited by the ERIC Facility, or if making an unsolicited contribution to ERIC, return this form (and the document beingcontributed) to:
ERIC Processing and Reference Facility4483-A Forbes BoulevardLanham, Maryland 20706
Telephone: 301-552-4200Toll Free: 800-799-3742
FAX: 301-5524700e-mail: [email protected]
WWW: http://ericfac.piccard.csc.comEFF-088.(Rey. 2/2000)