reproducibility of contact line motion on surfaces exhibiting contact angle hysteresis
TRANSCRIPT
1618 Langmuir 1994,10, 1618-1623
Reproducibility of Contact Line Motion on Surfaces Ex hibit ing Contact Angle Hysteresis
G. D. Nadkarnit and S. Garoff‘
Department of Physics, Carnegie Mellon University, Pittsburgh, Pennsylvania 15213
Received December 13, 1993. In Final Form: February 18, 1994’
We examine the quasi-static microscopic motion of the contact line on an ambient surface which exhibits contact angle hysteresis. When the contact line configuration is static or moving slowly, the microscopic contact line configurations are highly reproducible between two cycles of immersion of the surface. Mechanical vibrations produce a time jitter in the onset of reconfigurations of the contact line as it pulls free from surface heterogeneities and moves rapidly across the surface. This time jitter causes the contact line configurations to become irreproducible during the short times they are falling. As the contact line repins on new defects, the contact line configurations again become reproducible from one macroscopic cycle to the next. The observations are explained by energy models used to describe wetting hysteresis. The presence of metastable states with temporally evolving energy barriers lead to the observed cyclical reproducibility/irreproducibility of the microscopic contact line configurations. In view of the reproducibility of the microscopic contact line configurations, we suggest methods of making reproducible macroscopic contact angle measurements on ambient surfaces.
Introduction Wetting plays an important role in many natural and
technological processes. Coatings of surfaces, oil recovery, water proofing, and printing are but a few technologies which are controlled by spreading of a liquid on a solid surface. The contact angle is the angle between the tangents to the solid-liquid and liquid-vapor interfaces a t the contact line, where liquid and vapor phases meet the surface. The contact angle characterizes wettability and is determined by the balance of the three interfacial energies.’ Ideally, each material system is characterized by one equilibrium contact angle. However, on almost all ambient surfaces, a range of metastable contact angles is observed depending on the history of the liquid motion.24 For a given solid-liquid-vapor system, two values of the contact angle bound this range of metastable angles. The “advancingn angle is the upper bound on the range of metastable angles and is determined by experimentally attempting to increase the solid-liquid contact area and measuring the angle just before the area begins to increase. The “recedingn angle is the lower bound and is determined by attempting to decrease the solid-liquid contact area and measuring the angle just before the area begins to decrease.
The observation of contact angle hysteresis implies that the macroscopic system can be trapped in local energy minima with barriers preventing it from falling into the global equilibrium statesz4 While there is speculation about the origins of hysteresis on molecularly smooth and clean surfaces, on all but the most pristine surfaces, the hysteresis arises from the physical roughness and chemical heterogeneity present on any ambient surfa~e.%~5 Model-
* To whom inquiries should be addressed. + Present address: International Paper, Corporate Research
Center, Long Meadow Dr., Tuxedo, NY 10987. @ Abstract published in Advance ACS Abstracts, April 1, 1994. (1) Adamson, A. W. Physical Chemistry of Surfaces, 4th ed.; Wiley
and Sons: New York, 1982; pp 433-435. (2) Neumann, A. W.; Good, R. J. J. ColloidInterface Sci. 1972,38,341. (3) Johnson, R. E.; Dettre, R. H. Surf. Colloid Sci. 1969, 2, 85. (4) Neumann, A. W. Ado. Colloid Interface Sci. 1974, 4 , 105. (5) de Gennes, P. G. Reu. Mod. Phys. 1985, 57, 828. (6) Leger, L.; Joanny, J. F. Rep. Prog. Phys. 1992, 55, 431. (7) Bigelow, W. C.; Brockway, L. 0. J. Colloid Sci. 1956,11, 60. (8) Bartell, L. S.; Ruch, R. J. J. Phys. Chem. 1964, 68, 1744. (9) Oliver, J. F.; Huh, C.; Mason, S. G. Colloid Surf. 1980, I , 79.
Q743-7463/94/241Q-1618$04.50/0
ing of wetting on such surfaces imposes the condition that a t each point on the surface the contact angle must attain its equilibrium value.lCz4 The local tilting of a rough surface and the local variation of the solid-vapor and solid- liquid interfacial energies on a chemically heterogeneous surface cause the local contact angle to vary spatially relative to the average surface. Subject to this boundary condition, the liquid-vapor interface and the contact line assume a shape which minimizes the energy of the system. Gravity and the liquid-vapor surface tension attempt to smooth the interface and contact line, while the spatially varying contact angle pins the contact line to the random heterogeneities. Competition among these forces results in the trapping of the contact line in local energy minima, producing a broken structure of the contact line and energy barriers to the microscopic motion of the contact line. Macroscopic contact angle hysteresis results from the net effect of these microscopic conditions.
The size of the energy barriers compared to energy fluctuations in the system determines the lifetime of a metastable state of the contact line or contact angle. Larger and more frequent energy fluctuations lead to shorter lifetimes of a given metastable position. Thus, energy fluctuations affect the ability of the system to access a given state reproducibly when the system undergoes a cycle of macroscopic states. To properly measure the wettability of a system, energy fluctuations must be identified and the time scale of any observation must be carefully
(10) Gaines, G. L. J. Colloid Sci. 1960, 15, 321. (11) Neumann, R. D. J. Microsc. (Oxford) 1975, 105, 283. (12) Garoff, S.; Hall, R. B.; Deckman, H. W. In Chemistry and Physics
of Composite Media; Tomkiewicz, M., Sen, P. N., Eds.; Electrochemical Society, Inc.: Pennington, NJ, 1985; p 112.
(13) Ulman, A.; et al. J. Am. Chem. Soc. 1991,113,1499. (14) Bain, C. D.; Whitesides, G. M. Langmuir 1989,5, 1370. (15) Byramli, E.; Mason, S. G. Can. J. Chem. 1981,59, 1962. (16) Johnson, R. E.; Dettre, R. H. In Contact Angle, Wettability and
Adhesion; Advances in Chemistry Seriea 43; Fowkes, F. M., Ed.; American Chemical Society: Washington, DC, 1964.
(17) Mason, S. G. In Wetting, Spreading and Adhesion; Padday, J. F., Ed.; Academic Press: New York, 1978. (18) Neumann, A. W.; Good, R. J. Surf. Colloid Sci., 1979,22, 31. (19) Cox, R. G. J. Fluid Mech. 1983, 131, 1. (20) Jansonns, K. M. J. Fluid. Mech. 1985, 154, 1. (21) Pomeau, Y.; Vannimenus, J. J. Colloid Interface Sci. 1985,104,
(22) Schwartz, L. W.; Garoff, S. Langmuir 1985, I , 219. (23) Robbins, M. 0.; Joanny, J. F. Europhys. Lett. 1987, 3, 729. (24) Joanny, J. F.; Robbins, M. 0. J. Chem. Phys. 1990, 92, 3206.
477.
0 1994 American Chemical Society

Reproducibility of Contact Line Motion
defined.2b*26 The relevant energy fluctuations for contact angle hysteresis on ambient surfaces are the mechanical vibrations present in the environment. Attempts have been made to understand the effect of vibrational noise on macroscopic contact angle, but its effect remains unclear.27
Historically, measurements of hysteretic contact angles have been plagued by irreprodu~ibility.3*~~~8 The presence of an unsteady motion of a contact line moving across an ambient surface further suggests a random, irreproducible history of the microscopic contact line configurations. This study is an experimental investigation of the reproduc- ibility of the contact line configurations and motions and the role noise plays in that reproducibility. We examine whether the irreproducibility of the macroscopic contact angle arises from the irreproducibility of the microscopic configurations of the contact line. We find that micro- scopic contact line configurations are highly reproducible. Our observations prove the existence of energy barriers which prevent equilibration of the contact line on a microscopic scale. We unambiguously identify the role of noise in the formation of these microscopic contact line configurations and conditions for reproducibly measuring macroscopic contact angles.
Experimental Procedures We measure the contact line configurations on avertical
plate being slowly withdrawn (38 f 3 pm/s) from a bath of pure water. The water (from a Barnstead Model ROpure LP with the NANOpure I1 filtration system) is low in organic impurities and salts and has a surface tension of 70 f 3 dyn/cm. The plate is glass and coated with Aquapel, a perfluorinated surfactant. X-ray reflectivity and optical ellipsometry show that the substrates are smooth (14 A root mean square roughness) and the coatings are on the order of a molecular monolayer.% Advancing water contact angles on these surfaces can be as high as 110' with a hysteresis below 10". The monolayer coatings are de- graded when exposed to ultraviolet light (UV) and humidity. Extreme exposure to UV completely removes the monolayer and produces a surface completely wetted by water. The plate used in our experiment was exposed to less harsh UV and humidity conditions and exhibited a macroscopic receding water contact angle of 72.8 f 3" and a hysteresis of 20". X-ray reflectivity studies of the sample before and after degradation show only slight changes in the root mean square roughness (4 A) of the outer surface of the monolayer, far less than the layer thickness. Thus, the UV and humidity exposure does not pit the glass or remove patches of the monolayer. Rather, the damage is some subtle change in the chemistry of the outermost portion of the monolayer. Therefore, the wetting hysteresis on our sample arises from random heterogeneity in surface energies.
The contact line configurations are obtained by using reflectance video microscopy and digital image analysis (see Figure 1). We use coaxial lighting to illuminate the sample which is a reflective surface. The sample itself reflects all the light back into the microscope and appears bright; the liquid wedge below the contact line reflects light away from the microscope and appears dark. A
Langmuir, Vol. 10, No. 5, 1994 1619
(25) Everett, D. H.; Whitton, W. I. Trans. Faraday SOC. 1952,48,749. (26) Everett, D. H.; Smith, F. W. Trans. Faraday SOC. 1954,50,174. (27) Smith, T.; Lindberg, G. J. Colloid Interface Sci. 1978, 66, 363. (28) Zisman, W. InContact Angle, WettabilityandAdhesion;Advances
in Chemistry Series 43; Fowkes, F. M., Ed.; American Chemical Society: Washington, DC, 1964.
(29) Birch, W., Physics Department, Carnegie Mellon University, private communications.
- .
r/ I u I
Figure 1. Schematic diagram of optics for reflectance micros- copy: S, sample; F, fluid; L, light source; BS, beam splitter; M, microscope; C, camera. Dashed arrows are incident light rays. Solid arrows are reflected light rays.
~ aL 200pm
120, , , , , I , , , , I , ' ' ' I ' ' I ' ' ' ' J
500 1000 1500 2000 2500 o ~ ~ " " " ' " ' " " " ' " " ' "
0 x (Irm)
Figure 2. Typical image of the contact line (a) and the corresponding contact line configuration extracted from the image (b).
typical image of a contact line appears in Figure 2a. The contact line is the boundary separating the dark and bright regions. The optical system has a resolution of 4.9 pml pixel (pixel = smallest element in the image digitizing system) except when we examine contact line fluctuations of a completely static plate when it is 1.45 pm/pixel. Fields of view are 552 pixels wide. Contact line configurations are found from digitized images to subpixel resolution by using a computer algorithm which tracks the gray scale gradient along the contact line using a 5 X 5 moment operator.30 An example of a contact line extracted from the image in Figure 2a is shown in Figure 2b.
To probe the reproducibility of contact line configura- tions, the plate is pulled out of the bath while recording the contact line configurations, removed from the water bath, cleaned, and redipped with the contact line con- figurations recorded a second time as the contact line crosses the same region of the plate. Marks are etched on the plate to ensure that the contact line motion was examined in the same region of the plate. Between each dipping the plate is rinsed with an aqueous surfactant solution, ethanol, and 2-propanol, each alternating with pure water rinses. This cleaning technique removes any adsorbed contaminants from the surface and restores its wettability. The coatings are resilient to this procedure and show the same macroscopic contact angles even after many such cleanings.
Noise due to ambient vibrations is reduced by mounting the experiment on a vibration isolated Newport Optics table, Model RS-48-12/XL-B. The root mean square acceleration of the sample mount due to the ambient vibrations present in the laboratory is on the order of 10-1
(30) Marsh, J. A., Thesis, Dynamic Contact Angles and Hydrodynamics Near a Moving Contact Line. Physics Department, Carnegie Mellon University, 1992.
1620 Langmuir, Vol. 10, No. 5,1994
cm/s2. Observation of the motion of the fluid surface and the effective vibration isolation of the optical table above 5 Hz indicate that the frequency of the dominant vibrations on the sample is low. Under these accelerations, the water- air interface suffers a displacement of 30 pm at 1750 pm from the contact line. While the interface vibrates a t low frequency away from the contact line, it pivots about the strongly pinned contact line.
The reproducibility of the contact line motion is determined by comparing the shape of the configurations observed in the two runs. Sequences of images from the two dippings are synchronized by determining the time when reference particles on the plate arrive at the same point in the laboratory frame in the two runs. The paired contact line configurations are then compared. The degree of reproducibility is represented by the variance of a quantity, A, physically representative of the difference in contact line configurations in the two runs
Nadkarni and Garoff
where x is the coordinate along the plate and perpendicular to gravity,yl(x) andyz(x) are the contact line heights above the bulk fluid level for the first and second runs, and A(xo) = y 1 ~ - y z is the difference between heights of the contact line averaged over the length L. The averaging length, L, is restricted to the width of the segment of the contact line which moves coherently during the unsteady contact line motion discussed below. The parameter xo is the center of that coherent portion of the contact line. To probe the local dynamics of the contact line, we also track yl(x0) and y ~ ( x 0 ) as a function of time.
The finite frame grabbing rate of our system and small reconfiguration of the contact line in the time between frames produces a finite contribution to u2 even if the configurations are perfectly reproducible on two runs. To estimate this contribution, the process used to grab and synchronize data from two runs is applied twice to the same segment of video data from one run. The value of uerp2 = 2.61 l m 2 found by this process represents a systematic noise - floor to any measurement of u2. By subtracting A(x,) in the calculation of u2(x0), we correct for any offsets of the two configurations independent of the x position which can arise from video jitter in the digital frame grabbing process. Our ability to detect small differences in contact line configurations is limited by the spatial resolution of our optics: 4.9 pm at the lower magnification used for most measurements and 1.45 pm at the higher magnification used for measurement of contact line fluctuations.
-
0 bservations As previously 0bserved,3~-~5 the contact line height a t
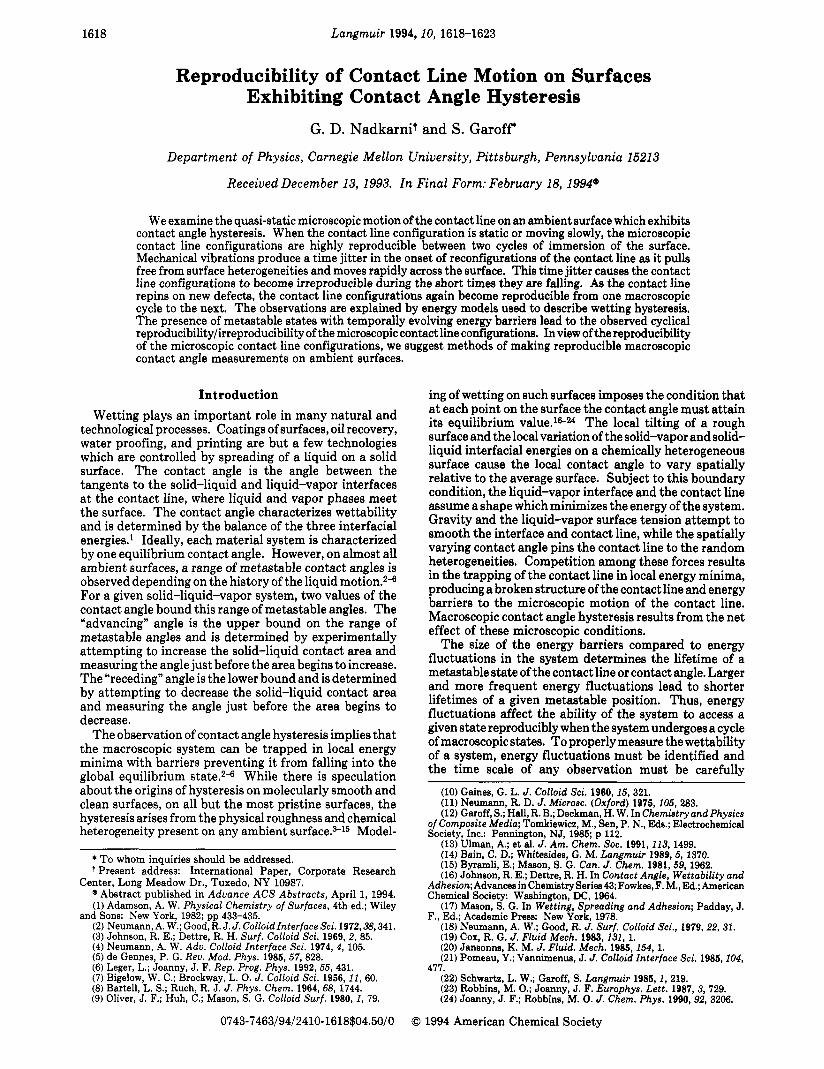
a given position, y(xo), shows an unsteady motion, composed of "stick", "slip", and "jump" behavior. As seen in Figure 3, during stick the contact line is fixed on the
(31) Schwartz, L. W.; Garoff, S. J. Colloid Interface Sci. 1985, 106.
(32) Sauer, B. B.; Carney, T. E. Langmuir 1990, 6, 1002. (33) Di Meglio, J.-M.; Quere, D. Europhys. Lett. 1990, 1 1 , 163. (34) Cazabat, A. M.; Heslot, F. Colloids Surf. 1990, 51, 309. (35) Ondarcuhu, T.; Veyssie, M. Nature 1991,352,418.
422.
250
h 200 E 3.
150
x 100
0 x v
50
~ ~ " ~ " ' ~ " ' ~ ' ' " ' ~ " 2 4 6 8 IO Time (sec)
Figure 3. Contact line height as a function of time. ST indicates when the point is stuck or at a fixed position on the surface. SL indicates when the point is slidingacross the surface. J indicates when the point is depinning from a heterogeneity and jumping. Solid line indicates position of a point (not on the contact line) fixed on the plate.
120 I . . . . , . . , . , . , . .
0 I 2 3 4 5 6
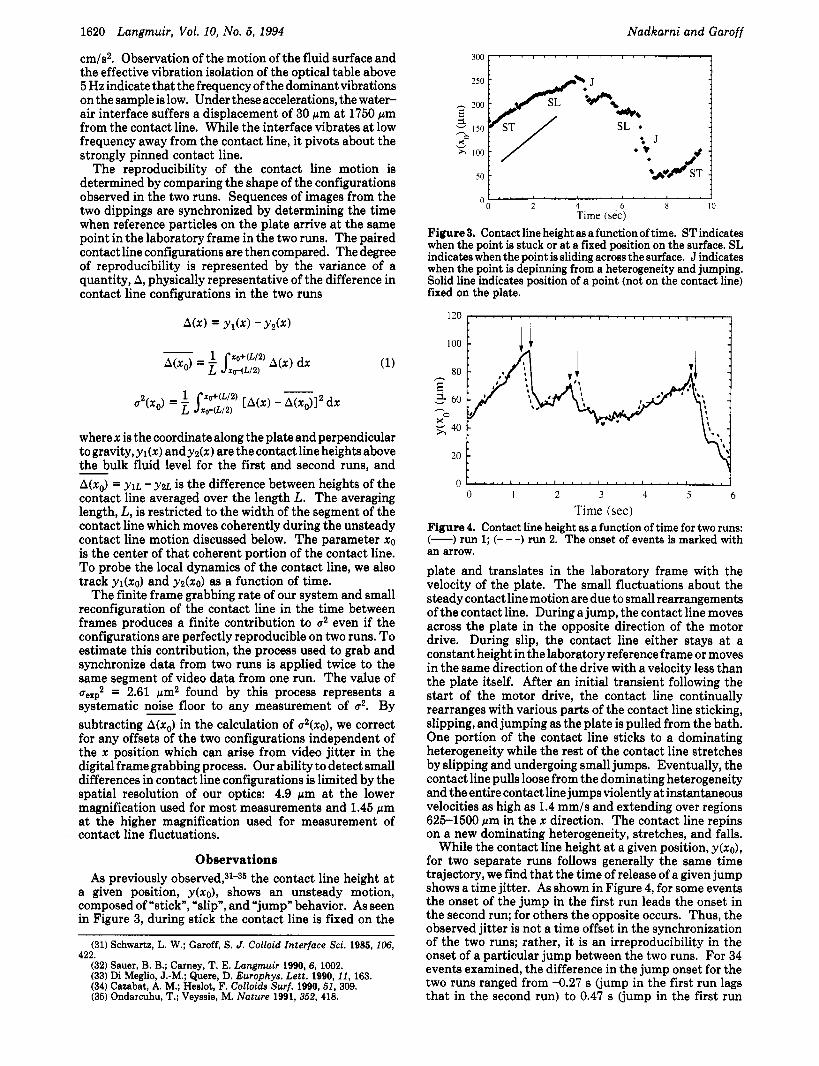
Time (sec) Figure 4. Contact line height as a function of time for two runs: (-) run 1; (- - -) run 2. The onset of events is marked with an arrow. plate and translates in the laboratory frame with the velocity of the plate. The small fluctuations about the steady contact line motion are due to small rearrangements of the contact line. During a jump, the contact line moves across the plate in the opposite direction of the motor drive. During slip, the contact line either stays a t a constant height in the laboratory reference frame or moves in the same direction of the drive with a velocity less than the plate itself. After an initial transient following the start of the motor drive, the contact line continually rearranges with various parts of the contact line sticking, slipping, and jumping as the plate is pulled from the bath. One portion of the contact line sticks to a dominating heterogeneity while the rest of the contact line stretches by slipping and undergoing small jumps. Eventually, the contact line pulls loose from the dominating heterogeneity and the entire contact line jumps violently at instantaneous velocities as high as 1.4 mm/s and extending over regions 625-1500 km in the x direction. The contact line repins on a new dominating heterogeneity, stretches, and falls.
While the contact line height a t a given position, y(xo), for two separate runs follows generally the same time trajectory, we find that the time of release of a given jump shows a time jitter. As shown in Figure 4, for some events the onset of the jump in the first run leads the onset in the second run; for others the opposite occurs. Thus, the observed jitter is not a time offset in the synchronization of the two runs; rather, it is an irreproducibility in the onset of a particular jump between the two runs. For 34 events examined, the difference in the jump onset for the two runs ranged from -0.27 s (jump in the first run lags that in the second run) to 0.47 s (jump in the first run

Reproducibility of Contact Line Motion
h . N E 80: A :
D
v
N 60
40
Langmuir, Vol. 10, No. 5, 1994 1621
140 I , , I ' ' ' , ' ' , I ,
100 120 a)
- -
120 140 L4 .- - -- - - - - v h
X" v x
80 :
60 :
40 :
20 -
\ *
o ~ " " ' " ' " ' " ' ' " 0 0.4 0.8 1.2 I .6 2
Figure 5. Contact line height as a function of time for two runs with the onset of the event forced to match in time: (-) run 1; (- - -) run 2. Arrow marks point where data are forced to match. Asterisk indicates where the fall of the contact line has been slowed by temporary interactions with a surface defect.
leads that in the second run) with an average absolute time difference of 0.17 s. As shown for a typical jump in Figure 5, even when the onset of the jumps or events are forced to match in time by offsetting the contact line heights in time for one of the runs, the two trajectories diverge as a jump progresses but reconverge as the contact line repins and reconfigures. The trajectories in Figure 5 show another typical result: during a fall, the contact line can slow down and even repins for a very short time period. Such temporary repinning may not be reproduc- ible between runs. Thus, the local dynamics of a point on the contact line are reproducible while the contact line is stuck but they are temporarily irreproducible during a jump. By extensive examination of contact line motions, we have found that falling motion occupies only a small fraction of the time of any point on the contact line. Therefore, the contact line configurations are reproducible between runs most of the time during the macroscopic cycle.
Just as the local dynamics of a point on the contact line move through cycles of reproducibility, reproducibility of the microscopic contact line configurations, measured by u2, also varies as the events occur. A typical example of the contact line configurations and the variation of u2 as an event occurs are shown in Figures 6 and 7, respectively. For times less than 0.3 s, an examination of the time sequence of contact line configurations in each run shows that the contact line is stuck. As seen in Figure 6a, the configurations of the two runs are very similar and u2 is small. Averaging over a number of representative events, when configurations are stuck, we find Ustuck2 = 2.16 pm2.36 When the jump begins in each run, the configurations of the two runs are no longer similar (see Figure 6b) and the irreproducibility between the runs increases. The time jitter in the onset of the event causes u2 to rise to very large values. To separate the effects of the time jitter in the onset from the irreproducibility due the dynamics during the event, we examine u2 with the onset of the events synchronized. The maximum irreproducibility occurs in the middle of the jump. For the events analyzed, the maximum u2 ranges from 13 to 124 pm2 with an average of 53 pm2 which is -25 times UStuck2. As the contact line in each run repins and restretches, the configurations in the two runs begin to look similar again (see Figure 6d) and u2 once again becomes small and levels off to a value approximately equal to Ustuck2.
Time (sec)
(36) The experimental noise, uexpz, has been removed from measured values, umm2, using quadrature u2 = um-z - ueexp2.
4 0 v 20
20 E 4
o ~ " ' " ' " ' " " ' ' ' ' ' ' ~ 0 400 800 1600 2000 x (pmj200
Figure 6. Synchronized contact line configurations for two runs: (a) stuck configurations; (b) early in an event; (c) late in an event; (d) after repinning.
1 4 0 ~ . . . , I . , , I t . I . , . . , I I . I . ' 1
100 120 i A i
2ou n 0 0.5 1 I .5
Time (sec) Figure 7. Irreproducibility between two runs during contact line rearrangement.
As discussed above, vibrations transmitted from the lab environment to the sample affect quasi-static contact line movements; they also relax static contact line configura- tions. Changes in static contact line configurations were studied by monitoring a point on the contact line at a high magnification (1.45 pm/pixel) after the plate had been withdrawn and stopped. Immediately after the withdrawal is stopped, a quick relaxation in ~ ( 3 ~ 0 ) on the order of 130 pm occurs. This movement is approximately the size of a typical contact line jump seen during the forced motion discussed earlier. From the configurations, we observe that this fast relaxation is caused by the depinning of a neighboring point of the stretched contact line. After the initial rapid relaxation, continued relaxation of the contact line occurs very slowly and only by small amounts (falling only 10 pm in 5 min). This strong pinning occurs despite the low frequency vibrations of the liquid-vapor interface which we observe away from the contact line. Thus, on the time scale of the experiment and at the lower magnification (4.9 pm/pixel) used in monitoring the contact line reproducibility, the effect of vibrations on the u2 is negligible.

1622 Langmuir, Vol. 10, No. 5, 1994 Nadkarni and Garoff
run to run, the structure and thus the energy stored in the stretched contact line configuration at the onset of the event differs slightly from run to run (see Figure 6). This variation in initial conditions leads to the observed irreproducibility of the trajectory of each point on the falling contact line even when the onset of the events in the two runs is forced to match. The temporary slowing down of the contact line as it falls is caused by random surface heterogeneities exerting local forces on the falling contact line. The strongest defects are sensed by the falling contact line causing recognizable distortions as the contact line passes over them (see Figure 5). We observe that the degree of such temporary distortions of falling contact lines is irreproducible, again indicating the sensitivity of the dynamics of a falling contact line to the initial conditions at the onset of an event.
As an event ends, the energy in the jump is dissipated and the contact line motion slows. The configurations again become reproducible as defects of higher wettability repin the contact line into a metastable configuration. Although the falling contact line configurations are irreproducible because of sensitivity to the precise condi- tions at the onset of the event, the repinned contact line configurations are reproducible. Therefore, the dynamics during the fall do not disrupt the contact line trajectories so badly that, after the kinetic energy of the jump is dissipated, the contact line is trapped in completely new configurations. When the jump ends, the pinning by heterogeneities again constrains the microscopic motion of the contact line to the same history leading to reproducibility of the contact line on the microscopic scale.
Since, microscopic contact line motion and configura- tions are reproducible, macroscopic contact angle mea- surements should be reproducible. To attain this repro- ducibility in the macroscopic measurement, this study shows that two issues must be appropriately addressed. First, the macroscopic measurement must include a sufficient portion of the contact line so that microscopic fluctuations of the contact line are averaged out. Then, the measured angle or line position form aproper boundary condition for the macroscopic interface shape. In the system we investigated, this distance is several times the dimensions of typical events we see (a distance on the order of millimeters). Second, the level of mechanical vibrations impinging on the system must relax the system. We have seen that vibrations cause fluctuations in the onset of events. Thus, if spatial averaging along the contact line encompasses many such events, these effects are averaged out. Finally, if the motion is completely stopped before the contact angle is measured, relaxation of the contact line will occur. We have seen that a rapid, initial relaxation is followed by a long time relaxation of the contact line. Measurement of the macroscopic contact angle or contact line position should occur after the rapid relaxation. The longer relaxation is small, so its effect on the macroscopic contact angle may not be great. However, precise measurements of the contact angle will continue to evolve over long periods. The time scale of both relaxations is inextricably linked to the level of vibration in the experimental environment.
Position Figure 8. Total energy of a section of the system as a function of the position of a point on the contact line in that section: (a) point trapped in a metastable position; (b) point can escape from metastable state due to vibrational energy. The solid circle indicates the metastable energy state of the point. E, is the energy of a mechanical vibration.
Discussion Our observations illustrate key features of the energy
model of contact angle h y ~ t e r e s i s . ~ J * ~ ~ ~ ~ ~ ~ Since the capil- lary number38 of the driven motion is on the order of 5 X
viscous forces are small compared to capillary forces and the system can be treated quasi-statically. As noted in the Introduction, on heterogeneous surfaces, the energy of the system has local minima which pin the contact line, giving it both a broken structure and unsteady, quasi- static motion. A schematic energy diagram such as the one shown in Figure 8 may be constructed for each point on the contact line. The abscissa is the total energy of a section of the entire system bounded by two planes at x = xo and x = xo + dx and is calculated as the point undergoes a virtual displacement Gy(x0) and all other parts of the contact line are allowed to relax.
Figure 8a shows the energy diagram for a point trapped in a local energy minimum and describes a metastable state of that point. Since this point on the contact line is trapped in an energy well, it moves at the speed of the plate as seen in Figure 3. If all the points on the segment of the contact line being observed are in such wells, the point and the entire configuration are stuck and move at the plate speed. As indicated by the observed low values of u2, when the contact line is stuck, the energy barriers bounding these states are high enough to retrap the system as the contact line returns to the same point on the plate after recleaning and redipping of the plate (see Figure 6a). Ambient mechanical vibration is not sufficient to drive the system out of these energy minima in the time frame of our experiments.
As the plate is withdrawn, the surface defect pinning the contact line moves up, the elastic forces on the point increase, and the energy barrier bounding the well decreases (see Figure 8b). Eventually, the barrier height becomes comparable to energy available from the vibra- tional noise in the experimental environment. Now, vibrations can cause the system to overcome the lowered barrier and the pinned point falls into a neighboring metastable state. However, this is a statistical process, the system being trapped until a large enough fluctuation from the random vibrations attacks the pinned point on the contact line. Thus, the exact time when the contact line depins varies statistically from run to run, causing the observed jitter in the onset of the event (see Figure 4). As this point depins, barriers on all neighboring points are altered and the entire line reconfigures.
Time jitter in the depinning causes the observed irreproducibility of falling contact line configurations. Since the events depin at statistically varying times from
~
(37) Joanny, J. F.; de Gennes, P. G. J. Chem. Phys. 1984,81,352. (38) Capillary number = Uq/nV where U is the motor velocity, q is the
viscosity, and ylv is the surface tension.
Summary Despite the physical smoothness and mild chemical
heterogeneity of our surface, the quasi-static motion of the contact line is characterized by strong pinning on these heterogeneities. The motion is unsteady. During most of this motion, contact line configurations are reproducible, strongly locked by the heterogeneities sampled by the
Reproducibility of Contact Line Motion
contact line as it passes them on each macroscopic cycle. Noise in the environment vibrates the fluid interface near the contact line but only causes minor relaxation of the contact line configurations. Thus, even on such a subtly heterogeneous surface: (1) slowly stretching contact line configurations are reproducible, (2) relaxation of contact line configurations occurs only over very long times, (3) macroscopic contact angles are hysteretic, and (4) vibra- tions do not easily relax hysteretic contact angles to their equilibrium value.
Our observations of the microscopic configurations of the contact line both illustrate key features of the energy model describing wetting of ambient surfaces and set a basis for making reproducible macroscopic contact angle measurements. The unsteady motion of the contact line is a consequence of the temporal evolution of the energy barriers as the contact line traverses the heterogeneous surface. Most of the time, these barriers are high compared to the vibrational energies in the environment of our experiment. These high barriers cause reproducibility of stuck and slowly stretching contact line configurations after macroscopic cycling of the system. The reproduc- ibility in the contact line height at a given point is approximately 1.5 pm out of a total capillary rise height on the order of 500 pm. When a configuration attains a
Langmuir, Vol. 10, No. 5, 1994 1623
critical stretching, the barrier height for one point on the contact line is lowered by the elastic energy and is comparable to vibrational energies. Then vibrations drive the pinned point over its barrier. As the single point falls, energy barriers pinning neighboring points are lowered and the contact line reconfigures. Since the reconfigu- ration is activated by a noise process, it occurs a t statistically varying times during different macroscopic dipping cycles, leading to different initial energies for the contact line configurations as they begin to fall on each cycle. This difference in initial energies, in turn, causes both the local dynamics of each point on the contact line as well as the contact line configurations to become irreproducible on different cycles. As the contact line repins on a new dominating heterogeneity and stretches, the contact line configurations once again become repro- ducible from one macroscopic cycle to the next. Our results show that macroscopic contact angle measurements should be reproducible and indicate the basis for making such reproducible measurements.
Acknowledgment. We acknowledge helpful conversa- tions with Professors R. T. Schumacher and R. M. Suter and the support of NSF Grant DMR-91-13152.