reprinted with permission. - universitylib.tkk.fi/diss/2008/isbn9789512292899/article3.pdfneous sqi...
TRANSCRIPT

III
Publication III
M.O.K. Sarkela, M.J. Ermes, M.J. van Gils, A.M. Yli-Hankala, V.H. Jantti, A.P.Vakkuri. 2007. Quantification of epileptiform electroencephalographic activity dur-ing sevoflurane mask induction. Anesthesiology 107, no. 6, pages 928-938.
c© 2007 The American Society of Anesthesiologists, Inc. Lippincott Williams &Wilkins, Inc. Reprinted with permission.

Anesthesiology 2007; 107:928–38 Copyright © 2007, the American Society of Anesthesiologists, Inc. Lippincott Williams & Wilkins, Inc.
Quantification of Epileptiform ElectroencephalographicActivity during Sevoflurane Mask InductionMika O. K. Sarkela, M.Sc.,* Miikka J. Ermes, M.Sc.,† Mark J. van Gils, Ph.D.,‡ Arvi M. Yli-Hankala, M.D., Ph.D.,§Ville H. Jantti, M.D., Ph.D.,� Anne P. Vakkuri, M.D., Ph.D.#
Background: Sevoflurane may induce epileptiform electro-encephalographic activity leading to unstable Bispectral Indexnumbers, underestimating the hypnotic depth of anesthesia.The authors developed a method for the quantification of epi-leptiform electroencephalographic activity during sevofluraneanesthesia.
Methods: Electroencephalographic data from 60 patients un-der sevoflurane mask induction were used in the analysis. Elec-troencephalographic data were visually classified. A novel elec-troencephalogram-derived quantity, wavelet subband entropy(WSE), was developed. WSE variables were calculated fromdifferent frequency bands. Performance of the WSE in detec-tion and quantification of epileptiform electroencephalo-graphic activity and the ability of the WSE to recognize mis-leading Bispectral Index readings caused by epileptiformactivity were evaluated.
Results: Two WSE variables were found to be sufficient forthe quantification of epileptiform activity: WSE from the fre-quency bands 4–16 and 16–32 Hz. The lower frequency bandwas used for monophasic pattern monitoring, and the higherfrequency band was used for spike activity monitoring. WSEvalues of the lower and higher bands followed the time evolu-tion of epileptiform activity with prediction probabilities of0.809 (SE, 0.007) and 0.804 (SE, 0.007), respectively. In deepanesthesia with epileptiform activity, WSE detected electroen-cephalographic patterns causing Bispectral Index readingsgreater than 60, with event sensitivity of 97.1%.
Conclusions: The developed method proved useful in detec-tion and quantification of epileptiform electroencephalo-graphic activity during sevoflurane anesthesia. In the future, itmay improve the understanding of electroencephalogram-de-rived information by assisting in recognizing misleading read-ings of depth-of-anesthesia monitors. The method also mayassist in minimizing the occurrence of epileptiform activity andseizures during sevoflurane anesthesia.
SEVOFLURANE is a nonpungent, short-acting volatileanesthetic agent. Clinical trials have confirmed its suit-ability for mask induction in children1 and in adults.2
Many studies have documented that sevoflurane mayinduce epileptiform electroencephalographic activity,3–8
and seizure-like movements have been described.9 De-spite these observations, sevoflurane remains one of themost widely used volatile anesthetics.
In current anesthesia practice, electroencephalogramand electroencephalogram-derived variables, such as theBispectral Index (BIS; Aspect Medical Systems, Nor-wood, MA) are often used to monitor the hypnotic com-ponent of anesthesia. BIS is composed of the weightedsum of three features derived from spectral, bispectral,and time-domain contents of the electroencephalo-gram.10 BIS has been shown to decrease consistentlywith increasing sevoflurane end-tidal concentrations anddecreasing Observer’s Assessment of Alertness and Seda-tion scale score,11 as well as with increasing estimatedsevoflurane effect site concentrations.12,13 However,during stable and deep sevoflurane anesthesia, BIS hasbeen reported to increase during epileptiform activity5
or to fluctuate abnormally.14
The objective of this study was to develop a methodfor the automatic detection and quantification of epilepti-form electroencephalographic waveforms during sevoflu-rane anesthesia to improve the reliability of electroen-cephalographic monitoring.
Materials and Methods
Electroencephalographic DataElectroencephalographic data from two previously
published studies were used.4,6 Both studies had institu-tional approval (Ethics Committee of the Department ofObstetrics and Gynecology, Helsinki University Hospital,Helsinki, Finland), and each patient gave written in-formed consent. Data were obtained from 60 patientswith American Society of Anesthesiologists physical sta-tus I or II, scheduled to undergo elective gynecologicalsurgery. Exclusion criteria were age older than 50 oryounger than 18 yr; history of cardiac, pulmonary, orneurologic disease; body mass index greater than 28kg/m2; history of esophageal reflux; or alcohol or drugabuse.
All patients breathed oxygen via a clear facemask for 2min before anesthetic induction. Anesthesia was in-duced with a single-breath method via a facemask usingsevoflurane (8% in nitrous oxide, 50% in oxygen) with asemiclosed anesthesia system containing a carbon diox-ide absorber and primed with a fresh gas flow of 10l/min. Nitrous oxide was used according to our routineclinical practice. The patients were asked to exhale
* Research Scientist, GE Healthcare Finland Oy. † Research Scientist,‡ Senior Research Scientist, VTT Technical Research Centre of Finland. § Re-search Professor, Department of Anesthesia, Tampere University Hospital andUniversity of Tampere. � Department of Clinical Neurophysiology, Tampere Uni-versity Hospital. # Head of the Department of Anesthesia, Peijas Hospital, Hel-sinki University Hospital.
Received from GE Healthcare Finland Oy, Helsinki, Finland; VTT TechnicalResearch Centre of Finland, Tampere, Finland; Helsinki University Hospital,Helsinki, Finland; Tampere University Hospital, Tampere, Finland; and Universityof Tampere, Tampere, Finland. Submitted for publication February 6, 2007.Accepted for publication August 15, 2007. Supported by Helsinki UniversityCentral Hospital Research Fund No. TYH9242 from Helsinki University Hospital,Helsinki, Finland, and by Tekes (the Finnish Funding Agency for Technology andInnovation), Helsinki, Finland. M. Sarkela is an employee GE Healthcare FinlandOy, Helsinki, Finland. Drs. Yli-Hankala and Vakkuri are medical advisors of GEHealthcare Finland Oy.
Address correspondence to M. Sarkela: GE Healthcare Finland Oy, P.O. Box900, 00031 GE, Finland. [email protected]. Information on purchasing re-prints may be found at www.anesthesiology.org or on the masthead page at thebeginning of this issue. ANESTHESIOLOGY’s articles are made freely accessible to allreaders, for personal use only, 6 months from the cover date of the issue.
Anesthesiology, V 107, No 6, Dec 2007 928
forcefully to the residual volume, followed by a vitalcapacity breath with a facemask placed tightly over thenose and the mouth; they were then asked to hold theirbreath as long as possible. Thereafter, the patients wereallowed to breathe normally until loss of consciousness(LOC). After LOC, anesthetic induction continued viafour different techniques: (1) spontaneous breathing for6 min after the first breath from the facemask, (2) con-trolled hyperventilation for 6 min after the first breath,(3) spontaneous breathing for 2 min after LOC followedby controlled hyperventilation for 3 min, and (4) con-trolled hyperventilation for 5 min after LOC. Anesthesiatechniques 1 and 2 were used in the work of Yli-Hankalaet al.,4 and techniques 3 and 4 were used in the work ofVakkuri et al.,6 wherein the anesthetic methods aredescribed in more detail. Because of technical difficul-ties, synchrony between the time stamps of the firstbreaths and the electroencephalographic data were ab-sent for six patients with anesthesia techniques 1 and 2.
Electroencephalographic measurements were per-formed with Zipprep electrodes (Aspect Medical Sys-tems) positioned on both temporal bones laterally to theeyes; both mastoid bones; Fp1; Fp2; Fpz; and the groundelectrode at the center of the forehead, between theeyebrows. A four-channel electroencephalogram was re-corded with an Aspect A-1000® monitor (Aspect MedicalSystems) using the following electrode pairs: Fp1 andleft mastoid, Fp2 and right mastoid, Fpz and left tempo-ral, and Fpz and right temporal. Impedances below 5 k�were considered acceptable. The electroencephalogramwas collected at a sample frequency of 128 Hz; spectralanalysis revealed that the collected electroencephalo-gram contained frequencies up to 47 Hz. Processedvariables of the A-1000® monitor were collected at 5-sintervals, including BIS (version 3.0), burst suppressionratio (BSR), and signal quality index (SQI) from all fourchannels. Data recording was performed with a laptopcomputer using Datalogger software (Aspect MedicalSystems).
Electroencephalographic analyses were conducted bya neurophysiologist familiar with the anesthesia electro-encephalogram (V.J.). The electroencephalographicphenomena were classified as � activity (�4 Hz; D), slow� activity (�2 Hz; DS), slow � monophasic activity(DSM), slow � monophasic activity with spikes (DSMS),burst suppression (BS), burst suppression with spikes(SBS), polyspikes, rhythmic polyspikes, and periodic ep-ileptiform discharges. Polyspikes refers to a waveformwith more than two negative and positive deflections;rhythmic polyspikes to polyspikes appearing at regularintervals; and periodic epileptiform discharges to bilat-eral, periodic complexes. To simplify algorithm develop-ment, the three latter classes were combined into oneclass, labeled periodic discharges (PD), mainly becausethe exact definition of time instants for transitions be-tween these classes is problematic even for an experi-
enced neurophysiologist. Electroencephalographic databefore the onset of � activity were classified as awake(AW). The electroencephalographic data periods includ-ing D or DS classes were considered to be associatedwith nonepileptiform activity. Although slow monopha-sic pattern is not typically considered as epileptiform,8
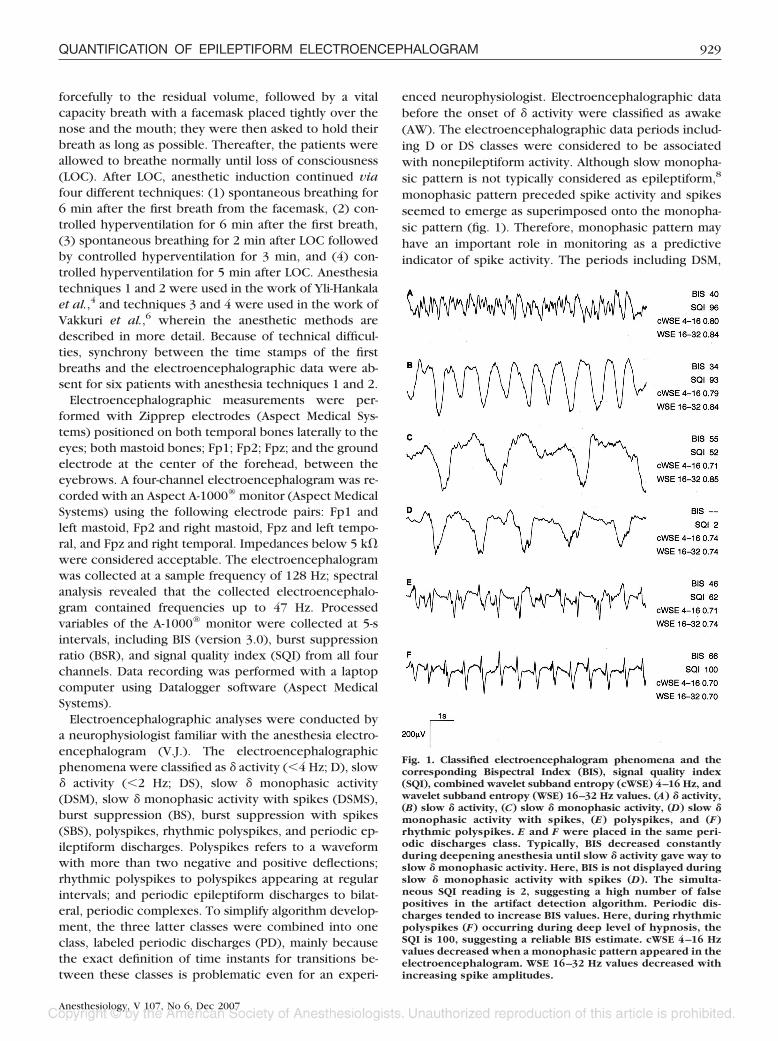
monophasic pattern preceded spike activity and spikesseemed to emerge as superimposed onto the monopha-sic pattern (fig. 1). Therefore, monophasic pattern mayhave an important role in monitoring as a predictiveindicator of spike activity. The periods including DSM,
Fig. 1. Classified electroencephalogram phenomena and thecorresponding Bispectral Index (BIS), signal quality index(SQI), combined wavelet subband entropy (cWSE) 4–16 Hz, andwavelet subband entropy (WSE) 16–32 Hz values. (A) � activity,(B) slow � activity, (C) slow � monophasic activity, (D) slow �monophasic activity with spikes, (E) polyspikes, and (F)rhythmic polyspikes. E and F were placed in the same peri-odic discharges class. Typically, BIS decreased constantlyduring deepening anesthesia until slow � activity gave way toslow � monophasic activity. Here, BIS is not displayed duringslow � monophasic activity with spikes (D). The simulta-neous SQI reading is 2, suggesting a high number of falsepositives in the artifact detection algorithm. Periodic dis-charges tended to increase BIS values. Here, during rhythmicpolyspikes (F) occurring during deep level of hypnosis, theSQI is 100, suggesting a reliable BIS estimate. cWSE 4–16 Hzvalues decreased when a monophasic pattern appeared in theelectroencephalogram. WSE 16–32 Hz values decreased withincreasing spike amplitudes.
929QUANTIFICATION OF EPILEPTIFORM ELECTROENCEPHALOGRAM
Anesthesiology, V 107, No 6, Dec 2007

DSMS, or PD were therefore considered to be associatedwith epileptiform activity in this study. Table 1 (“Alldata” column) presents the distribution of the data overthe different electroencephalographic classes. Figure 1illustrates some examples of the different electroen-cephalographic classes. Movements of eyes and headduring the awake state caused artifacts. In this phase ofour study, we focused on the electroencephalogramduring anesthesia, and therefore, these artifacts were notremoved.
Feature GenerationWe present a novel quantity, wavelet subband entropy
(WSE), for characterizing the evolution of the epilepti-form electroencephalogram waveforms. WSE is based ona dyadic multiresolution decomposition of the signalperformed with a discrete wavelet transform using theMallat algorithm.15
A wavelet is an oscillating function whose energy isconcentrated in time to better represent transient, non-stationary signals. For a function to qualify as a wavelet,it must exhibit certain mathematical properties, one ofwhich is to have band-pass filter characteristics. In thewavelet transform, correlation between the signal underobservation and the used wavelet basis function is de-rived, similarly to the Fourier transform. According to itsmathematical definition, the Fourier transform uses infi-nitely continuing sine and cosine functions as basis func-tions. In the wavelet transform basis functions are se-lected beforehand from the classes of mother wavelets.The wavelet basis functions are created from the motherwavelet by scaling and translating it in time. As a result,the wavelet transform produces information of bothscale and time of each signal component, whereas theFourier transform gives information only about the fre-quency contents of the signal. The fundamental idea ofanalyzing a signal at different scales is called multireso-lution analysis. Because of their better time-localizationproperty and the possibility to select differently shapedbasis functions, wavelets can be more effective than theFourier transform in describing steeply varying or dis-tinctly localized signals, such as spikes and bursts.16
The Mallat algorithm computes the discrete wavelettransform using a cascade implementation of filter banksof two quadrature mirror filters. At each level of signaldecomposition, two filters are used, a low-pass filter anda high-pass filter, both followed by down-sampling thefilter output by two. The obtained down-sampled outputsamples are wavelet coefficients (cj) at a certain scale j.Output samples from the low-pass filtering are approxi-mation coefficients (aj), characterizing original signal ona coarse degree, whereas samples obtained from thehigh-pass filtering are detail coefficients (dj), character-izing the signal on a fine degree. Detail coefficients dj, ateach scale j and translation index k, are correlationsbetween the observed signal x(t) and the discretizedmother wavelet �j,k(t):
dj�k� � ���
�
x(t) �j,k(t)dt (1)
Similarly, approximation coefficients are correla-tions between the observed signal and the discretizedscaling function, which is orthonormal to the motherwavelet. When the mother wavelet and scaling func-tion are discretized in a dyadic manner, i.e., scale andtranslation are discretized with steps of 2j, the originalsignal can still be reconstructed from the obtaineddetail and approximation coefficients.15 After eachlevel of signal decomposition, approximation coeffi-cients are supplied to an identical filter bank opera-tion, thus leading to a finer representation of thesignal at scale j � 1. The obtained approximation anddetail coefficients create a dyadic multiresolution rep-resentation of the original signal. As can be inferredfrom equation 1, it is advantageous to use motherwavelets that are intrinsically well adapted to repre-sent the original signal. This leads to better time lo-calization of the desired signal waveforms, i.e., fewercoefficients required to accurately describe the origi-nal signal.17
We performed the Mallat algorithm with three differ-ent mother wavelets (fig. 2): Daubechies 1, Daubechies
Table 1. Overview of Electroencephalographic Class Distributions in the Development, Test, and Full Data Sets
Development Data Test Data All Data
Class Incidence out of 30 Duration, h:mm:ss Incidence out of 30 Duration, h:mm:ss Incidence out of 60 Duration, h:mm:ss
AW 30 0:54:21 30 0:57:33 60 1:51:54D 28 0:26:41 28 0:24:27 56 0:51:58DS 22 0:20:49 22 0:24:08 44 0:44:57DSM 26 0:28:40 28 0:27:11 54 0:55:51DSMS 14 0:15:20 14 0:18:54 28 0:34:14PD 22 1:27:00 25 1:33:58 47 3:00:58BS 8 0:22:00 4 0:14:38 12 0:36:38SBS 4 0:08:50 3 0:06:10 7 0:15:00
AW � awake activity; BS � burst suppression; D � � activity; DS � slow � activity; DSM � slow � monophasic activity; DSMS � slow � monophasic activitywith spikes; PD � periodic discharges; SBS � burst suppression with spikes.
930 SARKELA ET AL.
Anesthesiology, V 107, No 6, Dec 2007

2, and Daubechies 3.18 The Daubechies wavelet familywas selected because Daubechies 1 is a unique motherwavelet composed of square waves, thus being poten-tially suitable to capture characteristics of monophasicpatterns. Higher-order mother wavelets Daubechies 2and Daubechies 3 are more spiky, therefore potentiallybeing better able to capture spiky electroencephalo-graphic waveforms. Daubechies wavelets of the orderfour and higher also exist, but they are more expandedin time axis and more sinusoidal-like. Therefore, theyare probably less suitable for our purposes to capturetransient and spiky waveforms. Other wavelet fami-lies, such as Coiflets and Symlets, also include spikymother wavelets. The Mallat algorithm was performedlike a conventional signal filtering, starting from thefirst recorded sample and ending with the last sampleof the data record. After processing the signal with theMallat algorithm, wavelet coefficients were obtainedat five scales: d1, a1, d2, a2, d3, a3, d4, a4, d5, and a5,which roughly correspond to frequency bands 32– 64,0 –32, 16 –32, 0 –16, 8 –16, 0 – 8, 4 – 8, 0 – 4, 2– 4, and0 –2 Hz, respectively. Wavelet analysis was conductedwith Matlab Wavelet Toolbox (version 2.2; The Math-Works Inc., Natick, MA), whose user’s guide19** isrecommended reading as an introduction to waveletanalysis.
Wavelet coefficients cj (both approximations [aj]and details [dj]) at each scale j, with each motherwavelet and within each 5-s epoch, sliding at 1-s in-tervals, were squared and normalized according to theequation:
cj�n� �cj�n�2
�m�1
Nj
cj�m�2
, (2)
where cj are coefficients at a certain scale j, Nj is thenumber of coefficients at each scale j within a givenepoch, n is the index used within each 5-s epoch, and mis the summation index. The coefficients cj at each scalewere analyzed with the relative form of the Shannon
entropy equation20; the resulting value is called waveletsubband entropy (WSE):
WSEcj� �
�n�1
Nj
cj�n� · log cj�n�
log Nj. (3)
Squaring (equation 2) makes coefficients nonnegative,which is a necessity for the application of the entropyequation. Furthermore, it enhances the contribution ofhigh-amplitude signal values in relation to lower-ampli-tude signal values, making the entropy equation moresensitive to the characteristic features of epileptiformactivity. Normalization (equation 2) makes WSE insensi-tive to changes in the total signal power. Equation 3 canbe interpreted as a “distance” between the wavelet basisfunction and the original signal.17
Feature SelectionEpileptiform activity in the data were characterized
mainly by two morphologically different waveforms:monophasic waves resembling K complexes of naturalsleep and spikes. Our goal was to find optimal featuresfor the monitoring of these two waveforms. The secondgoal was to develop a user-friendly method that workswith a minimal set of electrodes. Therefore, our aim wasto use only one-channel data for the final analysis.
Data were randomly divided into two sets, develop-ment and test data (table 1), so that both of the setscontained approximately the same number of cases rep-resenting each of the four anesthesia techniques. Thedevelopment data set was used for feature selection andmethod development. The test data set was used forperformance assessment.
Epileptiform activity evolved typically from D to DSand then to DSM, DSMS, and PD, in that sequence. Amonophasic pattern appeared at the transition from DSto DSM. The optimal feature set for detecting presenceof monophasic patterns was selected on the basis of theperformance of a linear discriminant classifier developedto discriminate between two groups of electroencepha-lographic classes. Groups were a union of D and DSclasses and a union of DSM, DSMS, and PD classes. Theroot-mean-square error was used as performance crite-rion of the classifier. The total group of potentially usefulfeatures contained 120 features; WSE values from theaforementioned 10 bands with 3 different mother wave-lets at 4 channels, creating 10 � 3 � 4 � 120 features.The optimal feature set was found using a feature selec-tion algorithm, sequential floating forward search,21 ef-fectively implementing an iterative stepwise regressionalgorithm but allowing for backtracking (possible re-moval of earlier selected features). Backtracking allevi-ates the potential problem of so-called nesting, the situ-ation when, once a feature has been added to a featuresubset, it cannot be removed anymore in later iterations.
** Available at: http://www.mathworks.com/access/helpdesk/help/toolbox/wavelet/. Accessed August 16, 2007.
Fig. 2. The mother wavelets used in the study: (A) Daubechies 1,(B) Daubechies 2, and (C) Daubechies 3.
931QUANTIFICATION OF EPILEPTIFORM ELECTROENCEPHALOGRAM
Anesthesiology, V 107, No 6, Dec 2007
Nesting may lead to suboptimal feature set selections.Considering the limited number of cases and for prac-tical monitoring reasons, the size of optimal featureset was predefined to be maximally three. If the in-crease in performance by adding a next best featurewas minimal (below a preset threshold), the featureselection process was stopped even if the number ofthree features was not reached, thus potentially lead-ing to feature set sizes of smaller than three. To enablethe use of one-channel electroencephalographic mon-itoring different classifiers and thus different optimalfeature sets, were developed for the four differentchannels separately (i.e., using only features from onesingle channel). The channel with the best-performingfeature set was then chosen for the implementation.Similarly, the optimal feature set for spike activitymonitoring was obtained using sequential floating for-ward search with a linear discriminant classifier thataimed to discriminate between the D, DS, and DSMgroups and the DSMS and PD groups. Table 2 illus-trates the division and labeling of the classes.
Performances of different best-performing classifierswere initially assessed with receiver operating character-istic (ROC) curve analysis. An ROC plot displays thesensitivity of the detector versus (1 � specificity) for allpossible cutoff values.16 For the detection of monopha-sic patterns, we conducted additional ROC curve analy-sis where only DS and DSM classes were included. Thiswas done to emphasize the method’s ability for detect-ing the important stage when a monophasic patternstarts to emerge, thus being the first predictive indicatorof the upcoming spike activity.
Cutoff values for monophasic pattern and spike detec-tion were specified using the ROC plot analysis. Toselect the optimal cutoff point, we need to evaluate theeffects of false-positive and false-negative results. Here,both of these effects were considered equal, and theoptimal cutoff value was found by looking for the pointon the curve with the smallest distance to sensitivity �1 and specificity � 1.16
Performance EvaluationThe optimal feature sets’ performances were assessed
using prediction probability, sensitivity, and specificityanalyses using the test data set. Prediction probability(PK) is commonly used to study the performance ofanesthetic depth indicators,22 where it quantifies theconcurrence between the correct behavior of the anes-thetic depth indicator with the observed depth of anes-thesia. We calculated PK values for each optimal featureset’s ability to predict the class of electroencephalo-graphic waveforms described. The electroencephalo-graphic classes were labeled according to increasingseverity of the epileptiform activity (arguments for this:see Discussion). In our classification, D and DS presentedwaveforms without epileptiform activity and were labeled0, DSM presented mild severity and was labeled 1, DSMSpresented moderate severity and was labeled 2, and PDpresented a severe pattern and was labeled 3. In addi-tion, we calculated PK values for the monophasic patterndetection and the spike activity detection. To compen-sate for bias and allowing derivation of robust estimatesof SEs and confidence intervals (CIs), PK values wereestimated using the jackknife method. In this case, for asample of n data points, the method requires computa-tion of n � 1 estimates of PK; one from the total sampleof n points and n estimates calculated from subsetsobtained by deleting one different data point per estima-tion. Cutoff values obtained from the development dataset were used to calculate sensitivity and specificity overthe test data set. Table 2 illustrates the division andlabeling of the electroencephalographic classes used toevaluate the method’s ability to detect monophasic pat-terns and spikes, and PK analysis for evolutionary elec-troencephalogram waveforms.
BIS and WSE during Epileptiform ActivityTo study the behavior of BIS, the SQI, and the WSE
variables of the optimal feature sets during epileptiformactivity, mean, SD, median, and quartiles for each vari-able were calculated for each electroencephalographicclass. Normality of the distribution of the variables wasassessed with the Kolmogorov-Smirnov test. In case thevariable distribution was found to be significantly differ-ent from the normal distribution, a nonparametric pair-wise test was used to assess differences between featurevalues of evolutionarily successive electroencephalo-graphic classes. More specifically, for each patient, aver-age feature values for each class were calculated andcompared with the Wilcoxon signed rank test (SPSSversion 14.0; SPSS Inc., Chicago, IL). A value of P � 0.05was considered significant in all tests. In some instances,the BIS algorithm was incapable of calculating reliableBIS values; in those cases, the value was not displayed onthe monitor screen. We analyzed BIS-not-displayed timeas a proportion of total time in each electroencephalo-graphic class.
Table 2. Division into Different ElectroencephalographicClasses for Classifier Development and PerformanceEvaluation
Class Monophasic Pattern Present Spike Present Severity
AW Not used Not used Not usedD No No 0DS No No 0DSM Yes No 1DSMS Yes Yes 2PD Yes Yes 3BS Not used Not used Not usedSBS Not used Not used Not used
AW � awake activity; BS � burst suppression; D � � activity; DS � slow �
activity; DSM � slow � monophasic activity; DSMS � slow � monophasicactivity with spikes; PD � periodic discharges; SBS � burst suppression withspikes.
932 SARKELA ET AL.
Anesthesiology, V 107, No 6, Dec 2007
We examined BIS and WSE values at a deep level ofhypnosis, using 2 min 30 s as the period of focus, starting3 min after the first breath of the inhalation induction.LOC was registered for 30 patients with anesthesia tech-niques 3 and 4. The median time from the beginning ofmask induction to LOC was 45 s, and the range was30–100 s. In 54 patients, the median time delay from thefirst facemask breath to the appearance of � or slow �activity was 63 s, with a range of 34–171 s. End-tidalsevoflurane concentrations for patients with anesthesiatechniques 1 and 2 were 4.4–6.5% during the timeperiod studied.
We estimated the capability of our method to detectthe situation where BIS was greater than 60 despite adeep level of hypnosis during the inspection time. De-tection was defined to have occurred if either of the WSEvariables was equal to or below its cutoff value. Eventsensitivity was calculated with the any-overlap method.The any-overlap is the traditional method used in study-ing the accuracy of automatic seizure detectors.23 Themethod calculates the ratio of matched seizures (analgorithm seizure overlaps a seizure as annotated by ahuman expert) by the total number of expert-annotatedseizures in the record. Our method’s event sensitivitywas calculated as the ratio of detections over the totalnumber of events when BIS was constantly greater than60. In addition, we conducted a pairwise comparisonbetween BIS and WSE variables by calculating traditionalsensitivity as a ratio of detections and the total number ofBIS readings greater than 60. All analyses were per-formed with Matlab 6.5 and 7.1 (The MathWorks, Inc.).
Results
Feature SelectionChannel Fp2–right mastoid proved to be the best chan-
nel in terms of performance with a linear discriminantclassifier. Channel Fp1–left mastoid was almost equallygood, whereas the other two channels were consider-ably worse in their performance. The WSE of coefficients(using mother wavelet Daubechies 1) corresponding tofrequency bands 4–8 and 8–16 Hz obtained the bestclassification performance for monophasic pattern de-tection. The WSE variable for the detection of monopha-sic patterns was a combination of WSE (cWSE) from thetwo frequency bands:
cWSE4�16 Hz � 0.4391 · WSE4�8 Hz
� 0.5609 · WSE8�16 Hz. (4)
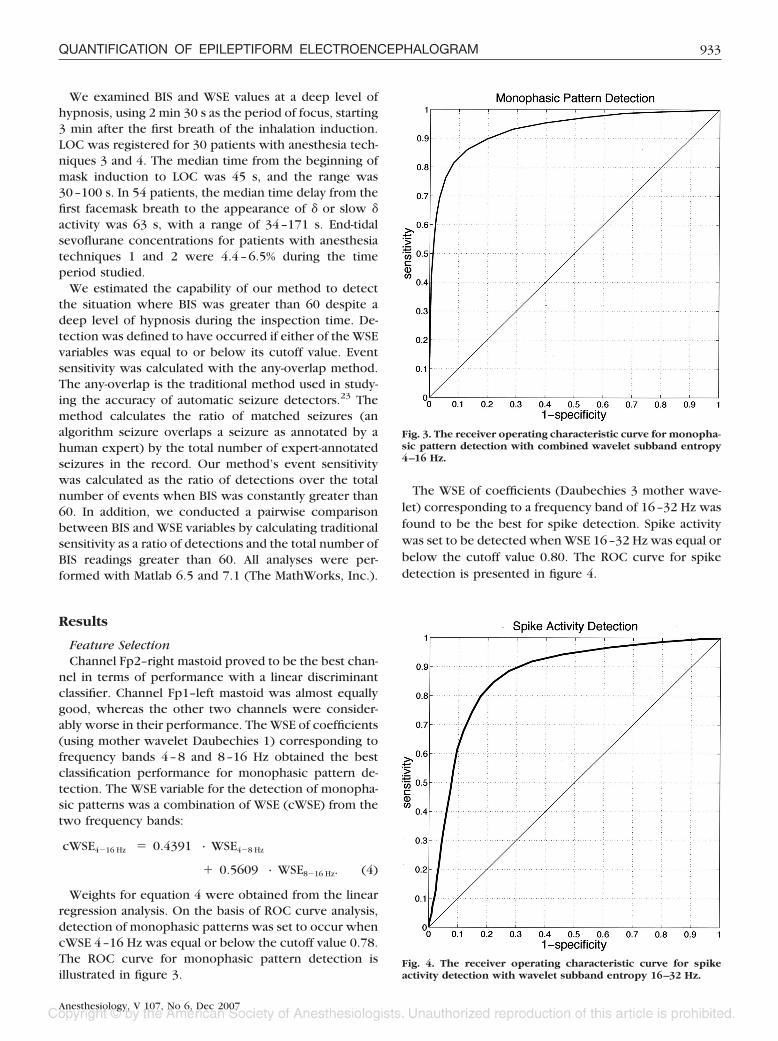
Weights for equation 4 were obtained from the linearregression analysis. On the basis of ROC curve analysis,detection of monophasic patterns was set to occur whencWSE 4–16 Hz was equal or below the cutoff value 0.78.The ROC curve for monophasic pattern detection isillustrated in figure 3.
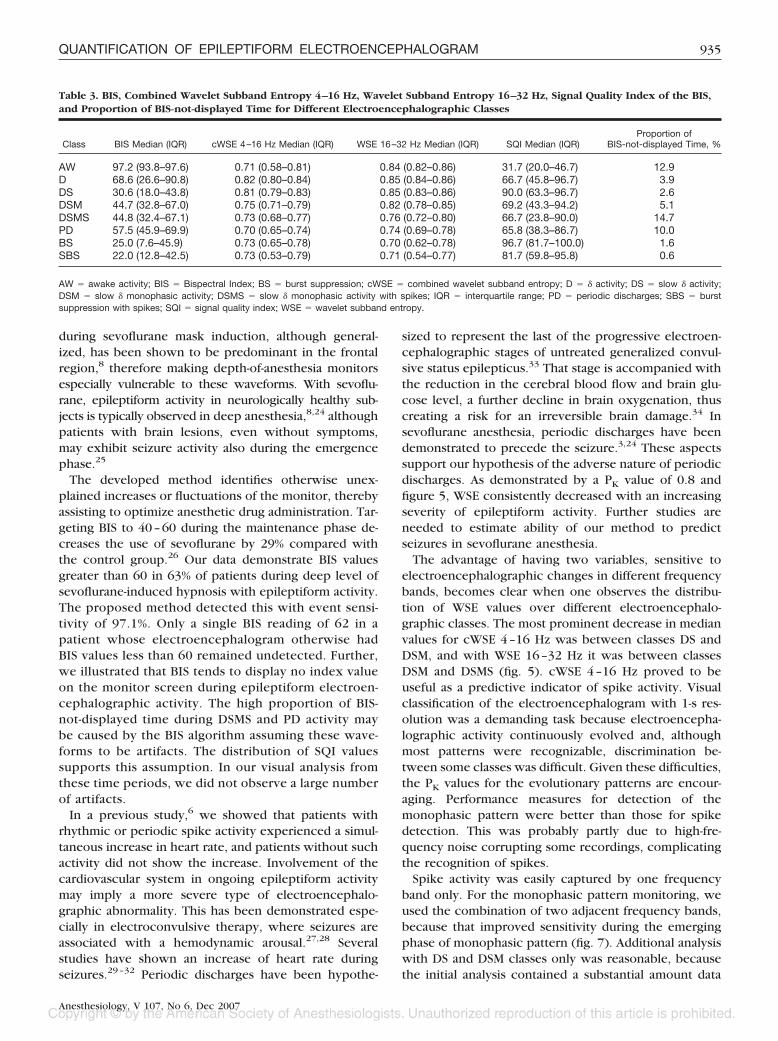
The WSE of coefficients (Daubechies 3 mother wave-let) corresponding to a frequency band of 16–32 Hz wasfound to be the best for spike detection. Spike activitywas set to be detected when WSE 16–32 Hz was equal orbelow the cutoff value 0.80. The ROC curve for spikedetection is presented in figure 4.
Fig. 3. The receiver operating characteristic curve for monopha-sic pattern detection with combined wavelet subband entropy4–16 Hz.
Fig. 4. The receiver operating characteristic curve for spikeactivity detection with wavelet subband entropy 16–32 Hz.
933QUANTIFICATION OF EPILEPTIFORM ELECTROENCEPHALOGRAM
Anesthesiology, V 107, No 6, Dec 2007

Performance EvaluationThe PK value for the cWSE 4–16 Hz ability to follow
evolutionary electroencephalographic patterns was0.809 (SE, 0.007; 95% CI, 0.795–0.823), and for WSE16–32 Hz the PK value was 0.804 (SE, 0.007; 95% CI,0.790–0.818). The PK value for cWSE 4–16 Hz to detectthe presence of monophasic patterns was 0.934 (SE,0.006; 95% CI, 0.922–0.946), sensitivity 86.1% (SE, 0.4%;95% CI, 85.3–86.8%), and specificity 87.2% (SE, 0.6%;95% CI, 86.0–88.4%). The PK value for WSE 16–32 Hzability to detect spike activity was 0.868 (SE, 0.008; 95%CI, 0.852–0.884), sensitivity 79.8% (SE, 0.5%; 95% CI,78.8–80.7%), and specificity 82.5% (SE, 0.6%; 95% CI,81.4–83.6%).
BIS and WSE during Epileptiform ActivityUsing the Kolmogorov-Smirnov test and visual exami-
nation of histograms, the distributions of the BIS andWSE values were found to be significantly different fromthe normal distribution. The medians and quartiles of BISand both WSE values in each electroencephalographicclass are presented in figure 5 and table 3. BIS valuesdecreased with deepening anesthesia from awake to �(df � 54, P � 0.001) and from � to slow � activity (df �40, P � 0.001).
Both WSE variables decreased in a monotonic fashionfrom class DS to DSM, from DSM to DSMS, and fromDSMS to PD. For cWSE 4–16 Hz, class D values aresignificantly higher than DS (df � 42, P � 0.05), DShigher than DSM (df � 39, P � 0.001), DSM higher thanDSMS (df � 24, P � 0.001), and DSMS higher than PD(df � 21, P � 0.05). For WSE 16–32 Hz, class DS valuesare significantly higher than DSM (df � 39, P � 0.001),DSM higher than DSMS (df � 24, P � 0.001), and DSMShigher than PD (df � 21, P � 0.01).
The signal quality index and proportion of BIS-not-displayed time for different electroencephalographicclasses are presented in table 3. During DSMS and PDactivity, the proportion of BIS-not-displayed time tendedto increase and SQI tended to decrease. BIS valuesgreater than 60 during the period of deep hypnosis wereobserved in 34 of the 54 patients. The event sensitivityfor detecting this situation was 97.1%. The sensitivity fordetection of a BIS reading greater than 60 was 92.5%.
Discussion
We developed a novel feature, wavelet subband entropy,for the monitoring of epileptiform electroencephalo-graphic waveforms occurring in sevoflurane anesthesia.Epileptiform activity during sevoflurane anesthesia ischaracterized by an evolutionary pattern,3,4,6,8,24 startingwith gradual slowing of the electroencephalogram (figs.1A and B), that leads first to appearance of the monopha-sic pattern (fig. 1C). Later, spike activity starts with a
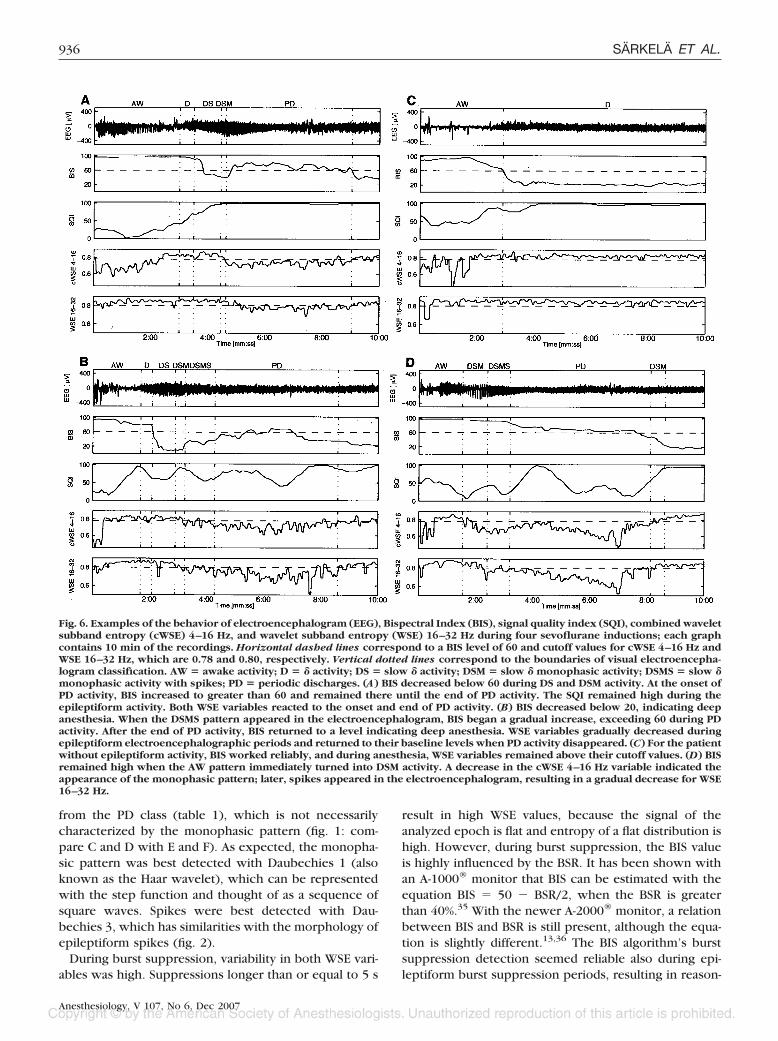
gradual increase in amplitude and, when evolving fur-ther, becomes rhythmic and periodic (figs. 1D–F). Themethod developed is able to react to the start and end ofthe epileptiform activity (fig. 6) and to produce consis-tently decreasing values following the evolutionarypattern described (fig. 5). The method improves under-standing of the electroencephalogram-derived informa-tion during anesthesia by recognizing and interpretingpotentially misleading readings of depth-of-anesthesiamonitors. The proposed method provides output that isspecific to epileptiform activity and does not react forother electroencephalographic changes occurring dur-ing anesthesia.
The method is aimed to be used as a supplementarycomponent for a depth-of-anesthesia monitor, thus im-proving the reliability of the device. Epileptiform activity
Fig. 5. Median and quartile values of (A) Bispectral Index, (B)combined wavelet subband entropy 4–16 Hz, and (C) waveletsubband entropy 16–32 Hz for each electroencephalographicclass. AW � awake activity; BS � burst suppression; D � �activity; DS � slow � activity; DSM � slow � monophasic activ-ity; DSMS � slow � monophasic activity with spikes; PD �periodic discharges; SBS � burst suppression with spikes.*Statistical significance (P < 0.05) between classes.
934 SARKELA ET AL.
Anesthesiology, V 107, No 6, Dec 2007
during sevoflurane mask induction, although general-ized, has been shown to be predominant in the frontalregion,8 therefore making depth-of-anesthesia monitorsespecially vulnerable to these waveforms. With sevoflu-rane, epileptiform activity in neurologically healthy sub-jects is typically observed in deep anesthesia,8,24 althoughpatients with brain lesions, even without symptoms,may exhibit seizure activity also during the emergencephase.25
The developed method identifies otherwise unex-plained increases or fluctuations of the monitor, therebyassisting to optimize anesthetic drug administration. Tar-geting BIS to 40–60 during the maintenance phase de-creases the use of sevoflurane by 29% compared withthe control group.26 Our data demonstrate BIS valuesgreater than 60 in 63% of patients during deep level ofsevoflurane-induced hypnosis with epileptiform activity.The proposed method detected this with event sensi-tivity of 97.1%. Only a single BIS reading of 62 in apatient whose electroencephalogram otherwise hadBIS values less than 60 remained undetected. Further,we illustrated that BIS tends to display no index valueon the monitor screen during epileptiform electroen-cephalographic activity. The high proportion of BIS-not-displayed time during DSMS and PD activity maybe caused by the BIS algorithm assuming these wave-forms to be artifacts. The distribution of SQI valuessupports this assumption. In our visual analysis fromthese time periods, we did not observe a large numberof artifacts.
In a previous study,6 we showed that patients withrhythmic or periodic spike activity experienced a simul-taneous increase in heart rate, and patients without suchactivity did not show the increase. Involvement of thecardiovascular system in ongoing epileptiform activitymay imply a more severe type of electroencephalo-graphic abnormality. This has been demonstrated espe-cially in electroconvulsive therapy, where seizures areassociated with a hemodynamic arousal.27,28 Severalstudies have shown an increase of heart rate duringseizures.29–32 Periodic discharges have been hypothe-
sized to represent the last of the progressive electroen-cephalographic stages of untreated generalized convul-sive status epilepticus.33 That stage is accompanied withthe reduction in the cerebral blood flow and brain glu-cose level, a further decline in brain oxygenation, thuscreating a risk for an irreversible brain damage.34 Insevoflurane anesthesia, periodic discharges have beendemonstrated to precede the seizure.3,24 These aspectssupport our hypothesis of the adverse nature of periodicdischarges. As demonstrated by a PK value of 0.8 andfigure 5, WSE consistently decreased with an increasingseverity of epileptiform activity. Further studies areneeded to estimate ability of our method to predictseizures in sevoflurane anesthesia.
The advantage of having two variables, sensitive toelectroencephalographic changes in different frequencybands, becomes clear when one observes the distribu-tion of WSE values over different electroencephalo-graphic classes. The most prominent decrease in medianvalues for cWSE 4–16 Hz was between classes DS andDSM, and with WSE 16–32 Hz it was between classesDSM and DSMS (fig. 5). cWSE 4–16 Hz proved to beuseful as a predictive indicator of spike activity. Visualclassification of the electroencephalogram with 1-s res-olution was a demanding task because electroencepha-lographic activity continuously evolved and, althoughmost patterns were recognizable, discrimination be-tween some classes was difficult. Given these difficulties,the PK values for the evolutionary patterns are encour-aging. Performance measures for detection of themonophasic pattern were better than those for spikedetection. This was probably partly due to high-fre-quency noise corrupting some recordings, complicatingthe recognition of spikes.
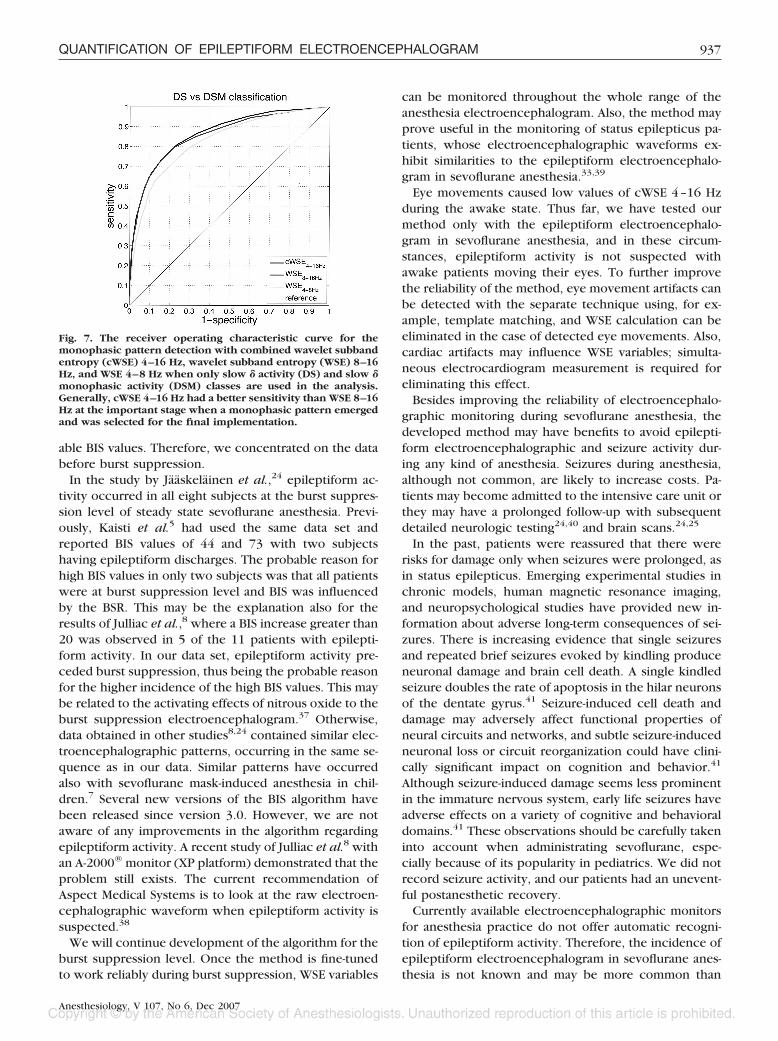
Spike activity was easily captured by one frequencyband only. For the monophasic pattern monitoring, weused the combination of two adjacent frequency bands,because that improved sensitivity during the emergingphase of monophasic pattern (fig. 7). Additional analysiswith DS and DSM classes only was reasonable, becausethe initial analysis contained a substantial amount data
Table 3. BIS, Combined Wavelet Subband Entropy 4–16 Hz, Wavelet Subband Entropy 16–32 Hz, Signal Quality Index of the BIS,and Proportion of BIS-not-displayed Time for Different Electroencephalographic Classes
Class BIS Median (IQR) cWSE 4–16 Hz Median (IQR) WSE 16–32 Hz Median (IQR) SQI Median (IQR)Proportion of
BIS-not-displayed Time, %
AW 97.2 (93.8–97.6) 0.71 (0.58–0.81) 0.84 (0.82–0.86) 31.7 (20.0–46.7) 12.9D 68.6 (26.6–90.8) 0.82 (0.80–0.84) 0.85 (0.84–0.86) 66.7 (45.8–96.7) 3.9DS 30.6 (18.0–43.8) 0.81 (0.79–0.83) 0.85 (0.83–0.86) 90.0 (63.3–96.7) 2.6DSM 44.7 (32.8–67.0) 0.75 (0.71–0.79) 0.82 (0.78–0.85) 69.2 (43.3–94.2) 5.1DSMS 44.8 (32.4–67.1) 0.73 (0.68–0.77) 0.76 (0.72–0.80) 66.7 (23.8–90.0) 14.7PD 57.5 (45.9–69.9) 0.70 (0.65–0.74) 0.74 (0.69–0.78) 65.8 (38.3–86.7) 10.0BS 25.0 (7.6–45.9) 0.73 (0.65–0.78) 0.70 (0.62–0.78) 96.7 (81.7–100.0) 1.6SBS 22.0 (12.8–42.5) 0.73 (0.53–0.79) 0.71 (0.54–0.77) 81.7 (59.8–95.8) 0.6
AW � awake activity; BIS � Bispectral Index; BS � burst suppression; cWSE � combined wavelet subband entropy; D � � activity; DS � slow � activity;DSM � slow � monophasic activity; DSMS � slow � monophasic activity with spikes; IQR � interquartile range; PD � periodic discharges; SBS � burstsuppression with spikes; SQI � signal quality index; WSE � wavelet subband entropy.
935QUANTIFICATION OF EPILEPTIFORM ELECTROENCEPHALOGRAM
Anesthesiology, V 107, No 6, Dec 2007
from the PD class (table 1), which is not necessarilycharacterized by the monophasic pattern (fig. 1: com-pare C and D with E and F). As expected, the monopha-sic pattern was best detected with Daubechies 1 (alsoknown as the Haar wavelet), which can be representedwith the step function and thought of as a sequence ofsquare waves. Spikes were best detected with Dau-bechies 3, which has similarities with the morphology ofepileptiform spikes (fig. 2).
During burst suppression, variability in both WSE vari-ables was high. Suppressions longer than or equal to 5 s
result in high WSE values, because the signal of theanalyzed epoch is flat and entropy of a flat distribution ishigh. However, during burst suppression, the BIS valueis highly influenced by the BSR. It has been shown withan A-1000® monitor that BIS can be estimated with theequation BIS � 50 � BSR/2, when the BSR is greaterthan 40%.35 With the newer A-2000® monitor, a relationbetween BIS and BSR is still present, although the equa-tion is slightly different.13,36 The BIS algorithm’s burstsuppression detection seemed reliable also during epi-leptiform burst suppression periods, resulting in reason-
Fig. 6. Examples of the behavior of electroencephalogram (EEG), Bispectral Index (BIS), signal quality index (SQI), combined waveletsubband entropy (cWSE) 4–16 Hz, and wavelet subband entropy (WSE) 16–32 Hz during four sevoflurane inductions; each graphcontains 10 min of the recordings. Horizontal dashed lines correspond to a BIS level of 60 and cutoff values for cWSE 4–16 Hz andWSE 16–32 Hz, which are 0.78 and 0.80, respectively. Vertical dotted lines correspond to the boundaries of visual electroencepha-logram classification. AW � awake activity; D � � activity; DS � slow � activity; DSM � slow � monophasic activity; DSMS � slow �monophasic activity with spikes; PD � periodic discharges. (A) BIS decreased below 60 during DS and DSM activity. At the onset ofPD activity, BIS increased to greater than 60 and remained there until the end of PD activity. The SQI remained high during theepileptiform activity. Both WSE variables reacted to the onset and end of PD activity. (B) BIS decreased below 20, indicating deepanesthesia. When the DSMS pattern appeared in the electroencephalogram, BIS began a gradual increase, exceeding 60 during PDactivity. After the end of PD activity, BIS returned to a level indicating deep anesthesia. WSE variables gradually decreased duringepileptiform electroencephalographic periods and returned to their baseline levels when PD activity disappeared. (C) For the patientwithout epileptiform activity, BIS worked reliably, and during anesthesia, WSE variables remained above their cutoff values. (D) BISremained high when the AW pattern immediately turned into DSM activity. A decrease in the cWSE 4–16 Hz variable indicated theappearance of the monophasic pattern; later, spikes appeared in the electroencephalogram, resulting in a gradual decrease for WSE16–32 Hz.
936 SARKELA ET AL.
Anesthesiology, V 107, No 6, Dec 2007
able BIS values. Therefore, we concentrated on the databefore burst suppression.
In the study by Jaaskelainen et al.,24 epileptiform ac-tivity occurred in all eight subjects at the burst suppres-sion level of steady state sevoflurane anesthesia. Previ-ously, Kaisti et al.5 had used the same data set andreported BIS values of 44 and 73 with two subjectshaving epileptiform discharges. The probable reason forhigh BIS values in only two subjects was that all patientswere at burst suppression level and BIS was influencedby the BSR. This may be the explanation also for theresults of Julliac et al.,8 where a BIS increase greater than20 was observed in 5 of the 11 patients with epilepti-form activity. In our data set, epileptiform activity pre-ceded burst suppression, thus being the probable reasonfor the higher incidence of the high BIS values. This maybe related to the activating effects of nitrous oxide to theburst suppression electroencephalogram.37 Otherwise,data obtained in other studies8,24 contained similar elec-troencephalographic patterns, occurring in the same se-quence as in our data. Similar patterns have occurredalso with sevoflurane mask-induced anesthesia in chil-dren.7 Several new versions of the BIS algorithm havebeen released since version 3.0. However, we are notaware of any improvements in the algorithm regardingepileptiform activity. A recent study of Julliac et al.8 withan A-2000® monitor (XP platform) demonstrated that theproblem still exists. The current recommendation ofAspect Medical Systems is to look at the raw electroen-cephalographic waveform when epileptiform activity issuspected.38
We will continue development of the algorithm for theburst suppression level. Once the method is fine-tunedto work reliably during burst suppression, WSE variables
can be monitored throughout the whole range of theanesthesia electroencephalogram. Also, the method mayprove useful in the monitoring of status epilepticus pa-tients, whose electroencephalographic waveforms ex-hibit similarities to the epileptiform electroencephalo-gram in sevoflurane anesthesia.33,39
Eye movements caused low values of cWSE 4–16 Hzduring the awake state. Thus far, we have tested ourmethod only with the epileptiform electroencephalo-gram in sevoflurane anesthesia, and in these circum-stances, epileptiform activity is not suspected withawake patients moving their eyes. To further improvethe reliability of the method, eye movement artifacts canbe detected with the separate technique using, for ex-ample, template matching, and WSE calculation can beeliminated in the case of detected eye movements. Also,cardiac artifacts may influence WSE variables; simulta-neous electrocardiogram measurement is required foreliminating this effect.
Besides improving the reliability of electroencephalo-graphic monitoring during sevoflurane anesthesia, thedeveloped method may have benefits to avoid epilepti-form electroencephalographic and seizure activity dur-ing any kind of anesthesia. Seizures during anesthesia,although not common, are likely to increase costs. Pa-tients may become admitted to the intensive care unit orthey may have a prolonged follow-up with subsequentdetailed neurologic testing24,40 and brain scans.24,25
In the past, patients were reassured that there wererisks for damage only when seizures were prolonged, asin status epilepticus. Emerging experimental studies inchronic models, human magnetic resonance imaging,and neuropsychological studies have provided new in-formation about adverse long-term consequences of sei-zures. There is increasing evidence that single seizuresand repeated brief seizures evoked by kindling produceneuronal damage and brain cell death. A single kindledseizure doubles the rate of apoptosis in the hilar neuronsof the dentate gyrus.41 Seizure-induced cell death anddamage may adversely affect functional properties ofneural circuits and networks, and subtle seizure-inducedneuronal loss or circuit reorganization could have clini-cally significant impact on cognition and behavior.41
Although seizure-induced damage seems less prominentin the immature nervous system, early life seizures haveadverse effects on a variety of cognitive and behavioraldomains.41 These observations should be carefully takeninto account when administrating sevoflurane, espe-cially because of its popularity in pediatrics. We did notrecord seizure activity, and our patients had an unevent-ful postanesthetic recovery.
Currently available electroencephalographic monitorsfor anesthesia practice do not offer automatic recogni-tion of epileptiform activity. Therefore, the incidence ofepileptiform electroencephalogram in sevoflurane anes-thesia is not known and may be more common than
Fig. 7. The receiver operating characteristic curve for themonophasic pattern detection with combined wavelet subbandentropy (cWSE) 4–16 Hz, wavelet subband entropy (WSE) 8–16Hz, and WSE 4–8 Hz when only slow � activity (DS) and slow �monophasic activity (DSM) classes are used in the analysis.Generally, cWSE 4–16 Hz had a better sensitivity than WSE 8–16Hz at the important stage when a monophasic pattern emergedand was selected for the final implementation.
937QUANTIFICATION OF EPILEPTIFORM ELECTROENCEPHALOGRAM
Anesthesiology, V 107, No 6, Dec 2007

expected. Several reports of seizure-like phenomenawith patients in propofol anesthesia also exist, but fewof these have accompanying electroencephalographicrecordings.40 Clinical detection of intraoperative sei-zures are difficult because neuromuscular blockingagents are commonly used.
Wavelet subband entropy variables proved successfulin detecting and quantifying sevoflurane-induced epilep-tiform activity and are suggested as a promising methodfor the prediction and prevention of epileptiform activ-ity during sevoflurane anesthesia.
References
1. Sarner JB, Levine M, Davis PJ, Lerman J, Cook DR, Motoyama EK: Clinicalcharacteristics of sevoflurane in children: A comparison with halothane. ANESTHE-SIOLOGY 1995; 82:38–46
2. Thwaites A, Edmends S, Smith I: Inhalation induction with sevoflurane: Adouble-blind comparison with propofol. Br J Anaesth 1997; 78:356–61
3. Woodforth IJ, Hicks RG, Crawford MR, Stephen JPH, Burke DJ: Electroen-cephalographic evidence of seizure activity under deep sevoflurane anesthesia ina nonepileptic patient. ANESTHESIOLOGY 1997; 87:1579–82
4. Yli-Hankala A, Vakkuri A, Sarkela M, Lindgren L, Korttila K, Jantti V: Epi-leptiform electroencephalogram during mask induction of anesthesia withsevoflurane. ANESTHESIOLOGY 1999; 91:1596–603
5. Kaisti KK, Jaaskelainen SK, Rinne JO, Metsahonkala L, Scheinin H: Epilep-tiform discharges during 2 MAC sevoflurane anesthesia in two healthy volunteers.ANESTHESIOLOGY 1999; 91:1952–5
6. Vakkuri A, Jantti V, Sarkela M, Lindgren L, Korttila K, Yli-Hankala A: Epi-leptiform EEG during sevoflurane mask induction: Effect of delaying the onset ofhyperventilation. Acta Anaesthesiol Scand 2000; 44:713–9
7. Vakkuri A, Yli-Hankala A, Sarkela M, Lindgren L, Mennander S, Korttila K,Saarnivaara L, Jantti V: Sevoflurane mask induction of anaesthesia is associatedwith epileptiform EEG in children. Acta Anaesthesiol Scand 2001; 45:805–11
8. Julliac B, Guehl D, Chopin F, Arne P, Burbaud P, Sztark F, Cros A-M: Riskfactors for the occurrence of electroencephalogram abnormalities during induc-tion of anesthesia with sevoflurane in nonepileptic patients. ANESTHESIOLOGY 2007;106:243–51
9. Adachi M, Ikemoto Y, Kubo K, Takuma C: Seizure-like movement duringinduction of anaesthesia with sevoflurane. Br J Anaesth 1992; 68:214–5
10. Rampil IJ: A primer for EEG signal processing in anesthesia. ANESTHESIOLOGY
1998; 89:980–100211. Katoh T, Suzuki A, Ikeda K: Electroencephalographic derivatives as a tool
for predicting the depth of sedation and anesthesia induced by sevoflurane.ANESTHESIOLOGY 1998; 88:642–50
12. Olofsen E, Dahan A: The dynamic relationship between end-tidal sevoflu-rane and isoflurane concentrations and Bispectral Index and spectral edge fre-quency of the electroencephalogram. ANESTHESIOLOGY 1999; 90:1345–53
13. Ellerkmann RK, Liermann V-M, Alves TM, Wenningmann I, Kreuer S,Wilhelm W, Roepcke H, Hoeft A, Bruhn J: Spectral entropy and BispectralIndex as measures of the electroencephalographic effects of sevoflurane.ANESTHESIOLOGY 2004; 101:1275–82
14. Chinzei M, Sawamura S, Hayashida M, Kitamura T, Tamai H, Hanaoka K:Change in Bispectral Index during epileptiform electrical activity under sevoflu-rane anesthesia in a patient with epilepsy. Anesth Analg 2004; 98:1734–6
15. Mallat SG: A theory for multiresolution signal decomposition: The waveletrepresentation. IEEE Trans Pattern Anal Mach Intell 1989; 11:674–93
16. Smith NJ, van Gils M, Prior P: Neurophysiological Monitoring during
Intensive Care and Surgery. Amsterdam, The Netherlands, Elsevier, 2006, pp 11,340–4
17. Coifmann RR, Wickerhauser MV: Entropy-based algorithms for best basisselection. IEEE Trans Inf Theory 1992; 38:713–8
18. Daubechies I: Ten Lectures on Wavelets, 9th printing Philadelphia, Societyfor Industrial and Applied Mathematics, 2006, pp 15, 197
19. Misiti M, Misiti Y, Oppenheim G, Poggi J-M: Wavelet Toolbox User’sGuide. Natick, MA, The MathWorks, 1997–2007
20. Shannon CE, Weaver W: The Mathematical Theory of Communication.Urbana and Chicago, University of Illinois Press, 1998, pp 48–56
21. Pudil P, Novovicova J, Kittler J: Floating search methods in feature selec-tion. Patt Rec Lett 1994; 15:1119–25
22. Smith WD, Dutton RC, Smith NT: Measuring the performance of anes-thetic depth indicators. ANESTHESIOLOGY 1996; 84:38–51
23. Wilson SB: Algorithm architectures for patient dependent seizure detec-tion. Clin Neurophysiol 2006; 117:1204–16
24. Jaaskelainen K, Kaisti K, Suni L, Hinkka S, Scheinin H: Sevoflurane isepileptogenic in healthy subjects at surgical levels of anesthesia. Neurology 2003;61:1073–8
25. Hilty CA, Drummond JC: Seizure-like activity on emergence from sevoflu-rane anesthesia. ANESTHESIOLOGY 2000; 93:1357–9
26. Aime I, Verroust N, Masson-Lefoll C, Taylor G, Laloe P-A, Liu N, Fischler M:Does monitoring Bispectral Index or spectral entropy reduce sevoflurane use?Anesth Analg 2006; 103:1469–77
27. Castelli I, Steiner LA, Kaufmann MA, Alfille PH, Schouten R, Welch CA,Drop LJ: Comparative effects of esmolol and labetalol to attenuate hyperdynamicstates after electroconvulsive therapy. Anesth Analg 1995; 80:557–61
28. Fu W, Stool LA, White PF, Husain MM: Is oral clonidine effective inmodifying the acute hemodynamic response during electroconvulsive therapy?Anesth Analg 1998; 86:1127–30
29. Blumhardt LD, Smith PE, Owen L: Electrocardiographic accompanimentsof temporal lobe epileptic seizures. Lancet 1986; 8489:1051–6
30. Keilson MJ, Hauser WA, Magrill JP: Electrocardiographic changes duringelectrographic seizures. Arch Neurol 1989; 46:1169–70
31. Nousiainen U, Mervaala E, Ylinen A, Uusitupa M, Riekkinen P: The impor-tance of electrocardiogram in ambulatory electroencephalographic recordings.Arch Neurol 1989; 46:1171–4
32. Zijlmans M, Flanagan D, Gotman J: Heart rate changes and ECG abnormal-ities during epileptic seizures: Prevalence and definition of an objective clinicalsign. Epilepsia 2002; 43:847–54
33. Treiman DM, Walton NY, Kendrick C: A progressive sequence of electro-encephalographic changes during generalized convulsive status epilepticus. Ep-ilepsy Res 1990; 5:49–60
34. Young GB: Status epilepticus and brain damage: Pathology and pathophys-iology, Advances in Neurology, Vol. 97: Intractable Epilepsies. Edited by BlumeWT, Carlen PL, Starreveld E, Wiebe S, Young GB. Philadelphia, LippincottWilliams & Wilkins, 2006, pp 217–20
35. Bruhn J, Bouillon TW, Shafer SL: Bispectral index (BIS) and burst suppres-sion: Revealing a part of the BIS algorithm. J Clin Monit Comput 2000; 16:593–6
36. Vakkuri A, Yli-Hankala A, Talja P, Mustola S, Tolvanen-Laakso H, SampsonT, Viertio-Oja H: Time-frequency balanced spectral entropy as a measure ofanesthetic drug effect in central nervous system during sevoflurane, propofol,and thiopental anesthesia. Acta Anaesthesiol Scand 2004; 48:145–53
37. Yli-Hankala A, Lindgren L, Porkkala T, Jantti V: Nitrous oxide-mediatedactivation of the EEG during isoflurane anaesthesia in patients. Br J Anaesth 1993;70:54–7
38. Kelley SD: Monitoring Level of Consciousness during Anesthesia andSedation: A Clinician’s Guide to the Bispectral Index®. Norwood, MA, AspectMedical Systems, 2003, p 6-5
39. Treiman DM: Electroclinical features of status epilepticus. J Clin Neuro-physiol 1995; 12:343–62
40. Walder B, Tramer MR, Seeck M: Seizure-like phenomena and propofol: Asystematic review. Neurology 2002; 58:1327–32
41. Sutula TP, Hagen J, Pitkanen A: Do epileptic seizures damage the brain?Curr Opin Neurol 2003; 16:189–95
938 SARKELA ET AL.
Anesthesiology, V 107, No 6, Dec 2007