representations on local plan expert group ... - peter brett · representations on local plan...
TRANSCRIPT

Representations on Local Plan Expert Group
Objectively Assessed Housing Need
NMSS
Peter Brett Associates
The University of Manchester
April 2016
Office Address:
Peter Brett Associates LLP
16 Brewhouse Yard, Clerkenwell, London EC1V 4LJ
T: +44 (0)207 566 8600 E: [email protected]

ii
THIS DOCUMENT IS FORMATTED FOR DOUBLE-SIDED PRINTING.

Representations on Local Plan Expert Group
Objectively Assessed Housing Need
NMSS, Peter Brett Associates, University of Manchester
April 2016 iii
These representations are produced by Neil Mc Donald (NMSS), Cristina Howick
(PBA) and Prof Ludi Simpson (University of Manchester)
with contributions from:
Andrew Donnelly, West Midlands Metropolitan Authorities
Ben Corr, Greater London Authority
William Tonkiss, Greater London Authority
John Hollis, demographic consultant, British Society of Population Studies past
President
Piers Elias, independent demographer, British Society of Population Studies current
Vice-President
Richard Pestell, PBA
Sunil Joshi, Experian Economics.

Representations on Local Plan Expert Group
Objectively Assessed Housing Need
NMSS, Peter Brett Associates, University of Manchester
April 2016 v
CONTENTS
1 INTRODUCTION .......................................................................................................... 1
2 THE CONSEQUENCES OF APPENDIX 6 ................................................................... 2
The England total ......................................................................................................... 2
The geography of housing need ................................................................................... 4
Cross-boundary unmet need ........................................................................................ 5
3 A SUGGESTED ALTERNATIVE ................................................................................. 8
Introduction .................................................................................................................. 8
Population .................................................................................................................... 8
Household formation ...................................................................................................10
Empty and second homes ...........................................................................................13
Past underprovision and market signals ......................................................................13
Future jobs ..................................................................................................................15
Affordable housing need .............................................................................................16
Backlogs .....................................................................................................................16
4 SUMMARY .................................................................................................................18
The consequences of Appendix 6 ...............................................................................18
A suggested alternative. ..............................................................................................18
APPENDICES
APPENDIX A ESTIMATED LPEG NEED
APPENDIX B UNATTRIBUTABLE POPULATION CHANGE
APPENDIX C FUTURE JOBS AND LABOUR MARKET ALIGNMENT


Representations on Local Plan Expert Group
Objectively Assessed Housing Need
NMSS, Peter Brett Associates, University of Manchester
April 2016 1
1 INTRODUCTION
1.1 There is much to be welcomed in the LPEG report. Plan-making is too complex and
involves too many stages. Examinations are often wasteful as time is spent on
endless technical detail. Yet more time, and large legal fees, are spent on arguing
about five-year land supply at planning inquiries. The Duty to Co-operate will not work
effectively without real teeth. The report suggests good solutions to these and other
problems.
1.2 But on the critical question of measuring housing need the LPEG proposals are not
helpful. This is much more than a technical issue, because housing numbers are a
core issue in planning. The report is right to be critical of the existing Planning
Practice Guidance (PPG). The assessment method set out in the PPG is poorly
drafted, often ambiguous and in places technically poor. A refresh of the method is
long overdue. LPEG report does put forward a revised version, in low-key
presentation at Appendix 6 of its report. But this proposed new guidance is at least as
unsatisfactory as the old one, and in similar ways, as this paper shows.
1.3 Below, in the next section we explore the practical consequences of the LPEG
proposals. In Section 3 we make alternative suggestions for a simplified method to
measure housing needs.
Representations on Local Plan Expert Group
Objectively Assessed Housing Need
NMSS, Peter Brett Associates, University of Manchester
April 2016 2
2 THE CONSEQUENCES OF APPENDIX 6
The England total
2.1 LPEG do not show the housing needs produced by their recommended method,
which is a pity. We have tried to fill the gap with our own estimates. This has involved
various approximations and omissions, which mean that our figures are under-
estimates. For example, we have excluded the affordable housing need adjustment,
which will increase the figure for some authorities by up to 10%.
2.2 On this basis we estimate that
The recommended method would produce total housing need of at least 312,000
net new homes per year (‘the LPEG housing need’), excluding any adjustment for
affordable housing need.
This is 40% above the 2012-based CLG household projection, published in 2015,
which produces an annual need of 222,000 homes.
2.3 The largest single factor behind this difference is LPEG’s market signals adjustment.
The second largest factor is double-counting, due to the fact that for some areas the
LPEG method projects migration from a five-year base and in other areas from a 10-
year base1. The result is that for each year of the projection some tens of thousands
of people are counted in two places at the same time.
2.4 We have also compared the estimated ‘LPEG need’ with past housebuilding. For
England as a whole, the ‘LPEG need’ for 2001-11 is:
More than double the average net new homes completed in the last three years,
2012/13 – 2014/15 (144,000 homes);
87% above the average net new homes completed over the last 10 years
(167,000 homes).
2.5 The thinking behind this uplift is that allocating more housing land will lower prices,
increase development and improve viability. But this will only happen if the sites
allocated are actually developed, which in turn requires that housebuilding be
financially viable, taking account of the costs of infrastructure and affordable housing.
2.6 There is no guaranteed that this will be the case. It is true that house prices are high
and rising, but this is the outcome of a long period in which housing delivery has
fallen far short of the official demographic projections. There is no evidence on what
would happen to demand and viability if land allocations increased steeply to a level
far above the projections, as the LPEG recommendations imply2. At the Planning
1 The base period is the past period whose trends the demographic projection rolls forward. We have assumed
that the adjustment applies both to national and international migration. 2 Research for the Barker report, which has been updated since, has estimated the impact of house prices of
lifting the actual supply of housing – that is, the number of homes built. But this is a very different matter from lifting land allocations (planned supply), because if too much land is allocated some of it will not be developed.

Representations on Local Plan Expert Group
Objectively Assessed Housing Need
NMSS, Peter Brett Associates, University of Manchester
April 2016 3
Summit on 21st April 2016 an early indication was given by Liz Peace, until recently
chief executive of the British Property Federation:
‘… a large part of the actual need is not going to be satisfied by the sort of product
that is produced by housebuilders who are commercial providers - they’re companies
who have to make a profit…. in order to ‘supply the real need, then we either need a
large building programme for social or council housing … or, we need housebuilders
to start building things that people can afford, but why would they do that?... ‘
2.7 Peace added that, as a non-executive director at housebuilder Redrow, she knew
that the firm’s executive committee ‘would love to build more houses, they’d love to
have more outlets but they don’t want to build so many more houses that they get to
the point where the price falls by 30 or 40 per cent, again, it’s hardly going to fit their
business model.
‘So you can’t look to the volume housebuilders to supply a large chunk of that need.
So we have a problem: who is actually going to build the houses in order to meet the
greater part of that need that we’re all agreed we have?’
2.8 Peter Andrew, deputy chairman of the Home Builders Federation, said ‘we need more
players in the market and one of those players may be the government’.
2.9 In summary, the LPEG recommendations imply land allocations 40% above the latest
official projections and more than double recent rates of housebuilding. There is no
guarantee that this amount of development can be delivered in practice, no matter
how much land the planning system allocates. In physical terms to bring forward this
much land would need a huge boost in infrastructure provision, which would take
many years to plan, design and deliver. In financial terms the risk is that oversupply
will threaten viability, especially in areas where the market is already fragile.
2.10 To minimise these risks, we need to ensure that land is allocated in the right places.
Unfortunately the Appendix 6 method does not do this, as we show in the next
section.
Representations on Local Plan Expert Group
Objectively Assessed Housing Need
NMSS, Peter Brett Associates, University of Manchester
April 2016 4
The geography of housing need
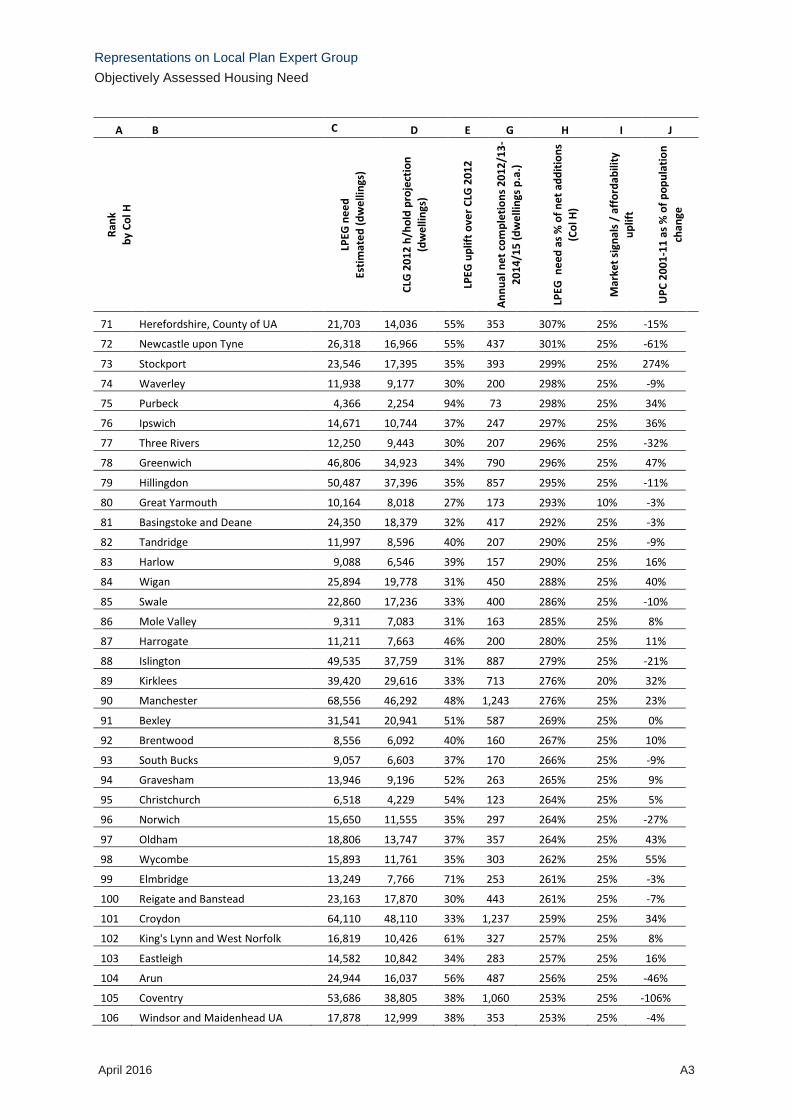
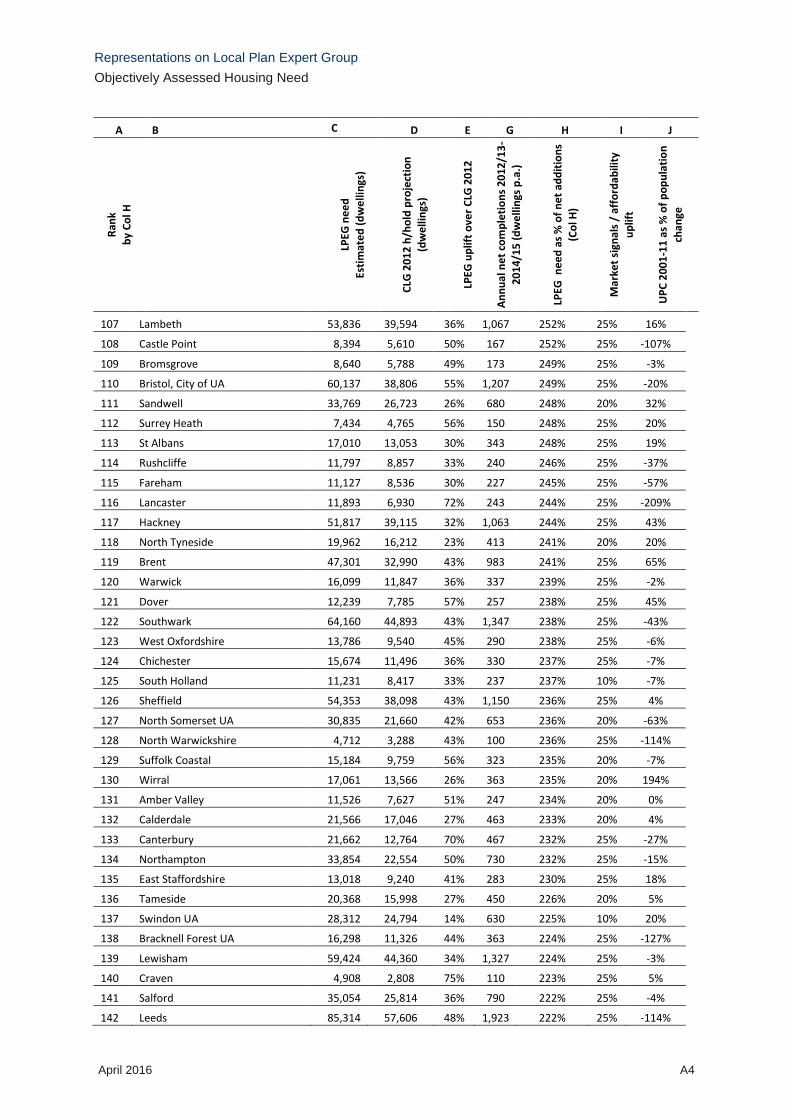
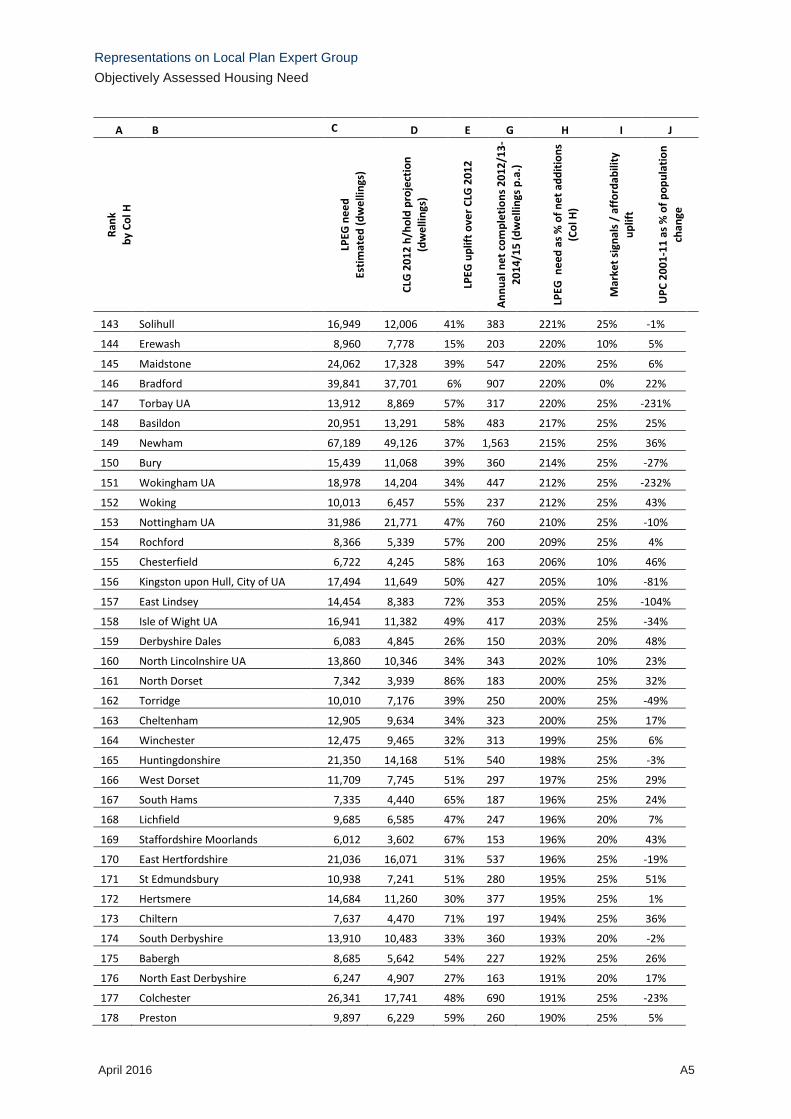
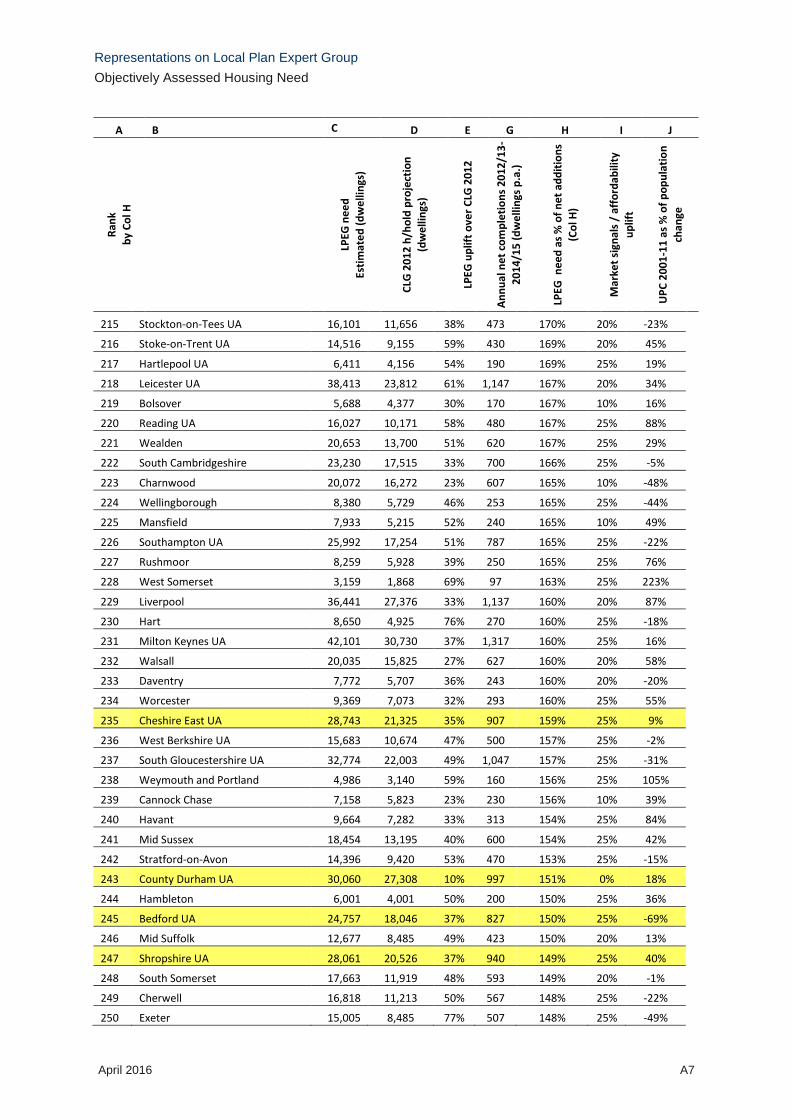
2.11 The table at Appendix A below shows our estimates by local authority, suggesting
that there are:
No authorities for which the LPEG need is less than the CLG 2012 projection;
24 authorities for which the LPEG need is 75% or more above CLG 2012; the
highest uplift is for Kensington & Chelsea (157%, followed by Copeland and
Oadby & Wigston (112%).
25 authorities for which the LPEG need is 25% or less above CLG 2012.
2.12 Following the Appendix 6 method, we estimate that nearly all authorities attract a
market signals uplift (the only exceptions are Bradford, County Durham, Gloucester,
Rotherham and Redcar & Cleveland). This is many more authorities than the LPEG
report suggests.
2.13 For house price affordability the last set of CLG tables, when applied using the
thresholds suggested, show a much higher uplift than suggested in the report.
2.14 For the rental affordability measure, the appendix requires earnings to be compared
to rents using ASHE data. This means that the approach assumes only one ‘earner’
per household paying rent as opposed to two or more which is common in the market
place. Using earnings data from ASHE, as specified, the Appendix 6 method again
results in many more authorities being given an uplift than suggested in the report.
2.15 The discrepancy in the rental indicator cannot be remedied simply by re-adjusting the
thresholds up or down. Many old style SHMAs, knowing that earnings cannot reliably
be applied to rents instead compare rents to household income. Household income
is normally sourced from commercial firms because this data is not collected by ONS.
2.16 The table at Appendix A is ordered according to the ratio of annual LPEG need to the
average housing completions achieved in the last three years, 2012/13 - 2014/15. To
meet their LPEG need for 2011-31:
Of the 325 local planning authorities, 324 would have to lift their recent rate of
delivery by more than 50% (the exception is Barrow-in-Furness, with an uplift of
37%);
162 authorities would have to more than double their recent delivery
72 authorities would have to more than triple their recent delivery
34 authorities would have to more than quadruple their recent delivery.
We might dismiss as anomalies the first two rows of the table, suggesting that
Gosport’s LPEG need is 18 times its recent output and Redbridge’s need is 11
times its recent output. Next in the ranking is Tunbridge Wells (eight times),
followed by York and Haringey (seven times).
2.17 The many examples of seemingly perverse results include:
London, with an LPEG need of 77,000 homes a year against 56,000 in CLG 2012
and 49,000 in the London Plan – mainly the result of rolling forward migration
from a period which is untypical of the long-term trend
Representations on Local Plan Expert Group
Objectively Assessed Housing Need
NMSS, Peter Brett Associates, University of Manchester
April 2016 5
Cambridge, where the UPC was 116% of total population change in 2001-11, and
ignoring it as LPEG recommends roughly halves the demographically projected
housing need;
2.18 In summary, the geography of the new housing numbers is arbitrary – the outcome of
double-counted migration, uncorrected technical errors such as Unattributable
Population Change (UPC) and near-universal market signals uplifts. Despite their
acknowledged limitations, the official demographic projections do provide useful
evidence on the likely location of future need and demand, especially if they are
corrected for major distortions such as the UPC. The LPEG adjustments strip away
much of that information.
2.19 Where the arbitrary LPEG numbers happen to be very large, the result will be
considerable resentment. In places where the market cannot realistically deliver these
numbers, that resentment may be felt by housebuilders and landowners as well as
local residents.
Cross-boundary unmet need
2.1 In addition to the numbers of homes discussed above, many local planning
authorities will be required to accommodate ‘exports’ from neighbours who do not
have the capacity to meet their own needs. We illustrate the resulting impacts through
a short case study of the London housing market area (HMA) and adjoining HMAs, as
defined in the NHPAU Geography of Housing Markets in England (2010)[1]. This is a
very large area, comprising some 110 local authorities in England. In round numbers,
we estimate that:
2.2 For London:
The LPEG need is around 77,000 new dwellings per annum before any affordable
need uplift is added (85,000 with a 10% affordable uplift).
As noted earlier this is at least 28,000 above the housing need of 49,000 dpa
assessed in the London Plan.
It is also 35,000 more than the supply capacity of 42,000 dpa identified in the
London Plan
2.3 Assuming that London remains constrained, under the LPEG proposals its unmet
need automatically transfers to the rest of the London HMA. For these 23 authorities:
The CLG household projection implies a need for 12,500 dpa.
The LPEG method would increase this number to around 17,000-19,000 dpa,
depending on the affordable housing adjustment.
Adding London’s LPEG unmet need triples this need to around 60,000 new homes
Because these areas are generally constrained, mainly due to the Green Belt, their
recent delivery has been much lower than even the CLG projections. To meet
[1]
For this analysis we use the NHPAU’s ‘single-tier’ HMAs.

Representations on Local Plan Expert Group
Objectively Assessed Housing Need
NMSS, Peter Brett Associates, University of Manchester
April 2016 6
their need in full, together with London’s unmet need, they would have to increase
delivery roughly tenfold.
2.4 We also considered the implications of spreading London’s unmet need more widely,
across the non-London authorities which are either in the London HMA or adjacent
HMAs.
Figure 2.1 London and adjoining HMAs
2.5 For this area, which covers around 75 local authorities, we estimate that:
Total need from the CLG projection is around 45,000 dpa.
The LPEG method lifts this to 62,000 dpa without an affordable uplift (up to 68,000
dpa with the uplift.
Adding the London gap of at least 35,000, the authorities would need to find land
for at least some 100,000 new homes a year.
Overall, this would require doubling the rate of delivery of recent years.
But many local authority areas have no undeveloped land within their boundaries,
and for others what land they have is protected by designations recognised in the
Framework, such as the Green Belt and AONBs.
Those authorities that do have land will have to make up the total, so the impact on
them will be much greater.
2.6 We have analysed recent SHMAs across the 75 authorities, to see how these
numbers compare with the authorities’ current position. Our findings suggest that the
authorities are collectively planning for housing need some 10% above the CLG 2012
projections, which equals slightly more than double their recent rates of delivery.

Representations on Local Plan Expert Group
Objectively Assessed Housing Need
NMSS, Peter Brett Associates, University of Manchester
April 2016 7
2.7 So, tortuous as the needs assessment process may be under the current PPG, it is
achieving a major boost in planned land supply around London – albeit it will be some
time until new homes are built and any impact on affordability materialises.
Meanwhile the GLA is working effectively with out-of-London authorities to ensure
that they address London’s unmet need as currently defined. These positive
developments will be disrupted if the much higher LPEG numbers are accepted.
2.8 As discussed earlier, we cannot be sure that there is enough effective demand (from
affordable providers as well as market housing) to deliver the very large new numbers
– especially as under the LPEG proposals the recipients of London’s unmet need will
include weak housing markets inaccessible to the capital.
2.9 Even if demand is forthcoming, development on the scale required by LPEG would
take a long time. There are at least two reasons for this:
The strategic solutions rightly favoured by LPEG, such as new settlements, have
long gestation periods, normally beyond the time horizon of a Local Plan, until new
rail connections, highway improvements, water treatment works etc are planned
and delivered.
Much of the development would have to be on sites which have never been
considered for development before, because they are in the Green Belt or other
protected areas hitherto considered sacrosanct. Little or no technical work has
been done to assess the feasibility and impacts of developing such sites. To fill this
information deficit will also take time.
2.10 Meanwhile, under the LPEG proposals the Councils concerned would be
accumulating ‘backlogs’ against targets that they have no chance of meeting within
the required timeframe.

Representations on Local Plan Expert Group
Objectively Assessed Housing Need
NMSS, Peter Brett Associates, University of Manchester
April 2016 8
3 A SUGGESTED ALTERNATIVE
Introduction
3.1 LPEG is right to seek to clarify and simplify the method set out in the PPG. That
guidance leads to protracted debate and excessive costs to all parties to a local plan
examination. However, as discussed above the LPEG proposals would produce
excessive OAN estimates and perverse consequences for many authorities. They
also have major technical flaws, which mean that they would be difficult to apply in
practice, probably causing even more delay, controversy and unnecessary cost than
the current PPG.
3.2 In the sections below we discuss these flaws where necessary, but our purpose is to
suggest practical alternatives. In this we accept that shortcuts and rough
approximations are necessary, to avoid excessive complication and protracted
debate. Our recommendations are set out in bold type.
3.3 The recommended assessment method will produce a ‘default number’ for each
local planning authority. Departure from that number should not be absolutely
prohibited, but it should only be allowed where there is compelling evidence
that not to do so would lead to the OAN being over- or underestimated by a
large margin, say 20%. This is to allow for the possibility that the default position
may be perverse for a small number of authorities. At the same time it will not
undermine the purpose of the exercise - to create a method that is both sound and
proportionate.
Population
Migration
3.4 The LPEG report recognises that the population projections on which the latest CLG
household projections are based (the 2012 SNPP) may need adjustment. Because
for many places migration is highly volatile over time, projections based on a period
as short as five years are generally unstable and unreliable. In relation to the current
official projections, a particular problem is that their base period, 2007-12, included a
severe economic downturn. The report proposes that the population projection
should be based on the higher of:
The official projection
A projection obtained using a 10-year internal migration trend to the latest Mid-
Year Estimates.
3.5 The weaknesses of this proposal include:
The use of an ‘up only’ adjustment:
Ignores the fact that internal migration is by definition a zero sum within the
UK, and therefore an upward adjustment in one place should be offset by a
downward adjustment somewhere else. But the LPEG method does not do

Representations on Local Plan Expert Group
Objectively Assessed Housing Need
NMSS, Peter Brett Associates, University of Manchester
April 2016 9
this, so the combined effect of local adjustments will be to exaggerate the
population growth expected nationally, as many people are counted twice in
different places.
Prevents downward adjustments where there is a good case that the 2012
SNPP exaggerates the likely population increase. A good example is the
London area, for which the Inspector examining the Further Alterations to the
London Plan agreed a GLA population projection that was below the 2012
SNPP and assumed some reversion to earlier trends in net out migration from
London.
The removal of discretion prevents consideration of exceptional factors which may
distort the projections. Examples include a large one-off urban extension which
will have caused atypical net internal migration during the base period, and flows
associated with special groups such as armed forces and students..
It ignores the technical issues involved in adjusting the projected inflows to an
authority. Some methods produce implausible results for some authorities,
presumably due to the size and complexity of the models and datasets used.
3.6 A better simplification would be to base the projected internal migration
(domestic and international) on flows in the most recent 10-year period for
which data are available. The new Guidance could specify a standard method
for this. But a better solution would be for CLG (or local authorities collectively)
to commission the ONS (and / or other demographic experts) to produce
revised projections on this basis. The result would not be an alternative to the
SNPP, but a projection created specifically for calculating the OAN.
3.7 This collective approach would produce more robust results and save money. It
would also avoid the lengthy and expensive controversies that arise where different
models, purportedly doing the same thing, produce different results.
3.8 In line with the general rule at paragraph 2.16 above, it should be allowed to
correct the 10-year-based projections (in either direction) if there is convincing
evidence that they are seriously distorted by special factors. Examples of such
factors include unusual events in the base period –e.g. where the area was a
growth area under now cancelled planning policy, special groups such as
armed forces and students, and technical anomalies in the modelling.
Unattributable Population Change
3.9 The LPEG proposal that no adjustments be made for UPC is a simplification too far,
because errors on this scale can cause very large distortions to the projections.
3.10 Appendix B below is a technical analysis of the UPC by the demographer John Hollis.
Its main findings include:
The UPC has a large impact on demographic projections for local authorities:
For the period 2001-11 it varied between +28,800 (London Borough of Brent)
and -40,000 (Leeds).

Representations on Local Plan Expert Group
Objectively Assessed Housing Need
NMSS, Peter Brett Associates, University of Manchester
April 2016 10
Its contribution to authorities’ total population change varied between plus
1,400% (Tendring DC) and minus1,800% (Oadby & Wigston DC).
In 91 of the 324 LAs in England (leaving aside City of London and the Isles of
Scilly) UPC was equivalent to more than 50% of the total population change.
As well as total population the UPC distorts the age profile of that population,
and hence on household formation and economic activity and the size of the
workforce.
At the level of local authorities, as opposed to England as a whole, the ONS’s
arguments for setting aside the UPC do not apply. Indeed the evidence suggests
that the errors that led to the UPC are still impacting on the Mid-Year Population
Estimates. These errors should be taken into account in making demographic
projections.
ONS in 2015 published a report and data tool that help explain the UPC for each
local authority area and correct for it. The tool provides extensive and valuable
new evidence. But it does not supply a corrected version of either historical
statistics or forward projections.
3.11 In conclusion, it is not acceptable to leave aside the UPC in assessments of future
housing need. To provide a robust demographic starting point, the 10-year
projection mentioned earlier should be adjusted so it includes in its migration
base a portion of the 2001-11 UPC. To quantify that portion, and determine its
age and sex profile, should be based on analysis of the ONS tool and the
results of the 2001 Census for areas of potential over-count. Like the 10-year
projection as a whole, it would be best for these adjustments to be made
centrally, by ONS and /or other demographic experts, who would be
commissioned by CLG or by local planning authorities collectively.
Household formation
3.12 LPEG proposes that the household formation rates (household representative rates,
headship rates) that convert population into households should be those in the 2012-
based CLG projections - except for groups aged 25-44, where formation rates should
move to the mid-point between the 2008 and 2012-based projections by 2033. The
result is to lift the assessed need, above the 2012 projections, because the 2008
projections generally show higher formation rates for these young adult age groups.
3.13 The basis of this recommendation is that the 2012-based formation rates are the
results of ‘suppressed’ household formation, caused by the recession and other
economic features of the preceding decade.
3.14 LPEG acknowledges the findings of demographic research that the 2008 rates over-
estimated household formation – largely due to demand-side factors which are not
due to the recession and will not change in the economic recovery, such as student
debt and more precarious employment. But LPEG dismisses these findings in a
footnote:
Representations on Local Plan Expert Group
Objectively Assessed Housing Need
NMSS, Peter Brett Associates, University of Manchester
April 2016 11
‘The reducing tends of household formation in any projection are estimates of what
will occur based on past trends rather than reflecting an assessment of what housing
people need… Our firm view is that the purpose of OAN is not as an abstract
exercise in projection, but to inform a local housing requirement figure and should be
seen in the context of the NPPF, which seeks to address the needs for all types of
housing, the needs of different groups in the community, and to widen opportunities
for home ownership…’’3
3.15 Clearly the underlined word ‘need’ is central to LPEG’s argument here. It is difficult to
understand the argument unless we know what ‘need’ means. But LPEG does not
address this question, except to mention in passing that ‘arriving at a definition of
objectively assessed need is undoubtedly complex’4. Without this definition, there is
no basis in LPEGs analysis for choosing between one projection and another.
Indeed, based on the footnote quoted above there is no good reason to use
demographic projections at all – bearing in mind that projections are nothing more
than a rolling forward of past trends, driven by the changing age and sex profile of the
population.
3.16 A simple way to avoid this logical dead end, following the existing PPG, which starts
by predicting future demand. Demand is the amount of housing that will be built if
planning does not restrict land supply, but rather releases as much land as
developers (in both the market and affordable sectors) want to develop. To predict
demand involves a sequence of steps, set out in the existing PPG:
i Start from demographic projections
which estimate what will happen to household numbers if past trends continue,
taking account of the changing age profile of the population, but assuming that
other drivers of demand will be the same in the future as in the past.
ii Adjust for any past undersupply
which would mean that past housebuilding and hence household growth fell short
of demand, because planning restricted land supply;
iii Adjust for other factors not captured by the projections
which means factors that impact on housing demand and are likely to be different
in the future from what they were in the past. In the PPG the main such factor is
future jobs.
3.17 Policy objectives or aspirations (how much housing ought to be built) are considered
separately at the next stage.
3.18 In the above logic, the role of the projections is to help determine what will happen to
number of homes and households, provided that the planning system allocates
enough development land. For this purpose it seems clear that the 2012 formation
rates are more helpful than the 2008 ones:
3 LPEG Discussion Paper No 2, page 16, footnote 16
4 LPEG Report to Government, paragraph 3.19
Representations on Local Plan Expert Group
Objectively Assessed Housing Need
NMSS, Peter Brett Associates, University of Manchester
April 2016 12
Authoritative studies5 have shown that the formation rates projected by CLG in
2008 were over-optimistic at the time they were produced, and have become
even more so in the intervening years.
The reasons are factors that suppress demand as opposed to supply: fewer
women are remaining childless; more people live in couples (partly because men
live longer so there are fewer widows); work is more precarious, social benefits
are lower, and young people are increasingly burdened by student debt.
Because household demand continues to be suppressed by these factors, in the
foreseeable future household formation rates across England will not rise as the
CLG 2008 projection expected, no matter how much land planning authorities
supply.
3.19 LPEG of course are right to be concerned about a future in which young adults have
a falling chance of establishing their own households. But allocating housing sites in
line with the 2008-based formation rates cannot solve the problem. Given that these
projections are unrealistic, they may lead to allocating land in the wrong places,
where demand is deficient and the allocated sites remain vacant. But even if the
homes being planned for do get built, in the market sector there is no way of
reserving those homes for the young adults we want to help. Increasing the planned
land supply cannot improve affordability for a specific group, because house prices
and rents are the same for everyone.
3.20 What the 2012-based projections tell us is that older age groups, who have more
capital, will acquire a greater share of the available housing; and this is why some
younger adults will have a lower chance of having a home of their own. If more
homes are built than suggested by the 2012-based projections the same forces will
be in play. Consequently the larger part of the additional homes will be occupied by
older and more affluent people, and the larger part of any improvement in affordability
will benefit more affluent people, except where younger people are helped by
targeted measures such as starter homes.
3.21 The problem cannot be solved by basing land allocations on technically inaccurate
demographic projections. It requires policy intervention beyond the scope of land-use
planning.,
3.22 In conclusion, housing needs assessments should take household formation
rates from the latest CLG projections, which are currently the 2012-base
projections.
3.23 Additionally the new Guidance should include a logical framework as set out at
para 3.16 above, to explain the logic of the OAN calculation and clarify the
meanings of need and demand.
3.24 The present PPG does not deal with these matters explicitly; this is one of the main
reasons why so much time and money is spent in fruitless debate, especially about
adjustments to household formation rates and market signals. Unless we are clear
5 See for example TCPA Tomorrow Series Paper 17, quoted in the LPEG Discussion Papers.

Representations on Local Plan Expert Group
Objectively Assessed Housing Need
NMSS, Peter Brett Associates, University of Manchester
April 2016 13
about the purpose of these adjustments, there are no ground rules about what they
should be. This is why under the present system every plan examination, and almost
every inquiry dealing with five-year-land supply, involves a lengthy debate on OAN
going back to first principles. Such principles should be set in national guidance, not
constantly reinvented.
Empty and second homes
3.25 To turn an estimate of the increase in the number of households into a housing
requirement we need to allow for empty and second homes – which at any one time
will not accommodate any households. LPEG proposes that this should be done
using data from the most recent Council Tax Base, except where the vacancy rate is
above the national rate - in which case the national rate should be used ‘to reflect the
impact of measures to encourage bringing empty homes back into use’.
3.26 It seems perverse to allow local authorities the ‘benefit’ in advance of steps they may
or may not take to reduce the proportion of empty homes.
3.27 It is also not entirely clear whether the cap would apply to second homes as well as
empty homes. It would be unreasonable to apply it to second homes. A significant
minority of local authority areas have proportions of second homes far above the
average, usually because they are attractive places for holidays or week-ends away.
This applies to a number of areas in the South West for example. There is no reason
to expect that numbers of second homes in these places will fall to equal the national
average. If the OAN calculation assumes that this fall will happen, it will wrongly
understate the true housing need in many places.
3.28 For the reasons above, we suggest that the OAN calculation should use actual
percentages of empty and second homes, as calculated from the latest Council
Tax Base, with no adjustments.
Past underprovision and market signals
3.29 It is to be welcomed that LPEG recommend narrowing the range of potential market
signals to house price affordability and rent affordability, as most of the other
indicators mentioned in the PPG add relatively little in practice. It is not clear why the
suggested indicators are median house price affordability and lower-quartile rent
affordability.
3.30 Another problem with the LPEG recommendations is possible double counting. A
demographically based OAN is determined by population change and household
formation (plus the assumptions for empty and second homes).
3.31 Arguably the OAN calculation should either adjust these variables in the demographic
projections, or adjust the results of the projections, but not both. But if our proposed
approach (see para 3.4 onwards) is accepted this problem disappears, because there
are no adjustments to the projections except to correct errors and anomalies.
Representations on Local Plan Expert Group
Objectively Assessed Housing Need
NMSS, Peter Brett Associates, University of Manchester
April 2016 14
3.32 Of far greater concern is the suggestion that, depending on the range within which
those indicators fall, 10%, 20% or 25% uplifts should be applied. These are arbitrary
quantities.
3.33 In our view fixed uplifts are a good proposal, because of their simplicity, and because
detailed analysis is unlikely to provide better answers. We have no experience of a
past with no planning and no other constraints on land supply. Therefore there is no
‘scientific’ basis for determining true, unconstrained demand – how much
development there would be if land supply were not constrained – either for local
areas or England as a whole.
3.34 But we consider that the proposed uplifts are too high, because of their aggregate
impact. Because they are upwards-only, they are the main reason why the overall
LPEG need for England is substantially about the CLG 2012 household projection, as
discussed in Section 2 above. Since we lack rigorous evidence, as discussed above,
the ‘correct’ aggregate need must be a matter of judgment. But the latest official
projections seem to be a good candidate:
The Framework advises that planning should be aspirational but realistic.
For England as a whole:
The official projections are aspirational, because they imply housing delivery
across England one third above the average of the last 10 years, and more than
50% above the average of the last three years.
They are arguably realistic because they roll forward much longer-term trends;
albeit maybe not quite realistic enough, in this long base period many of the
factors that are now reducing demand had not yet set in.
At local level, an argument in favour of using the projections (after correction for
errors and anomalies) is that they provide good (though not perfect) evidence on
the geography of future demand.
3.35 If the above is accepted, and the official projections are a robust starting point, the
market signals adjustment should not distort the projections too much. It should not
provide a near-universal uplift, as it does now, but apply only to places where market
pressures are exceptional. The national decision to use the official projections (or
another aggregate number) already incorporates a view on the standard position
across England. The market signals adjustment should correct for departures from
that standard.
3.36 In summary, we agree with LPEG that the market signals adjustment should be
much simplified, so it uses just two indicators and fixed adjustments. But these
fixed adjustments should be recalibrated so they apply to a minority of local
authority areas, where market pressures are exceptional.
3.37 We are unable to calculate such recalibration in the short time available for
these representations. But it should not be a difficult task.
3.38 Consideration ought to be given to whether market signal adjustments should be
applied where there is no prospect of a supply response in the relevant market area,
for example National Parks or London Boroughs.
Representations on Local Plan Expert Group
Objectively Assessed Housing Need
NMSS, Peter Brett Associates, University of Manchester
April 2016 15
Future jobs
3.39 At the local authority level econometric forecasts of jobs growth are highly volatile and
can vary substantial from one forecasting house to another. To provide a basis for a
soundly-based discussion of the housing needs of an area they need to be sense
checked against the available data on local economic performance and in many
cases this will lead to the conclusion that at least some of the sectoral forecasts
should be adjusted (up or down) for realism. This is complicated process which calls
for a fair degree of judgment to be exercised. As a consequence it is a fertile area for
lengthy and often inconclusive debate. There have been instances in which
consultants have argued in section 76 appeals that economically based OANs should
be uplifted by 100% or more to support economic growth.
3.40 The LPEG response to this is to suggest that the market signals and other
adjustments they propose are ‘likely to respond proportionately to housing market
pressures arising for local economic growth across the housing market area’.
Therefore ‘estimates of future employment growth should not be used as part of the
calculation of housing need’. However ‘
‘Where plan makers choose to set a ‘policy on’ housing requirement in excess of the
FOAHN, based on employment growth, this should be based on applying the
changes in economic activity rates that are projected in estimates produced annually
by the Office for Budget Responsibility, applied to the local baseline rates of
economic activity. The existing commuting ratio should be applied, based on a
comparison of economically active residents drawn from the Annual Population
Survey and the number of jobs drawn from BRES.’
3.41 We are concerned about two aspects of these recommendations. Firstly, it cannot be
right to relegate labour market balance to an optional ‘policy-on’ adjustment. Many
areas rightly expect much faster job growth in the future than they have in the past,
perhaps because due to exceptional economic opportunities, which may be driven by
the market rather than policy. Other things being equal above-trend job growth will
drive above-trend demand for housing, because many people move to places where
there are job opportunities. In line with the principles of the NPPF planning should
aim to meet that demand.
3.42 The second cause for concern is that the recommendation is technically faulty.
Appendix C below provides a critique by Experian Economics, one of the three main
providers of local economic forecasting in the UK. There are two main problems with
the LPEG approach (along with many smaller ones).
3.43 Firstly, the assumptions used to forecast job demand should be consistent with those
used to forecast labour supply. In particular, if jobs-to-housing calculations use OBR
trends in economic activity to forecast labour supply, as LPEG recommends, the
same trends should be used to forecast labour demand. Generally this will require a
bespoke forecast, because the main forecasters do not use the OBR rates. If a
standard forecast is used the calculation of labour market balance will be
inconsistent. The practical result is often a greatly inflated view of the population and
housing required to match a given number of new jobs.

Representations on Local Plan Expert Group
Objectively Assessed Housing Need
NMSS, Peter Brett Associates, University of Manchester
April 2016 16
3.44 Secondly, it does not make sense to keep the existing commuting ratio fixed.
Statistics show commuting ratios have always changed over time in response to the
interaction of supply and demand. Accordingly forecasting models show them
changing in the future. The only logical and feasible approach to commuting (and
other economic variables such as unemployment) is in two stages. First we should
use forecasts to estimate what will happen to commuting (among other variables).
Secondly, if this is not what policy considers should happen – for example because
the forecast changes in commuting are too large – we should consider policy
responses to alter that position.
3.45 To repair these and other problems, we suggest that the new PPG include a short
section to guide calculations of labour market alignment. Among other things
this should advise on ensuring that forecasts of job demand and labour supply
are based on mutually consistent assumptions. The guidance should have the
benefit of technical advice from economic forecasters.
Affordable housing need
3.46 LPEG proposes that, if housing development in line with the OAN would not provide
enough developer contributions from market housing to meet affordable need in full,
the OAN should be adjusted upwards by up t0 10%. As we understand it this
adjustment overlaps with the market signals adjustment if any.
3.47 This proposal does have the advantage of simplicity. But its logic is faulty, because,
the imperative to pay for affordable housing is nothing to do with the need or demand
for market housing. In many places there will not be enough viable demand for
market housing to deliver the 10% uplift.
3.48 Therefore we suggest that the affordable housing uplift should be treated as a
policy issue, separate from the OAN. The PPG should say that, if housing
development in line with the OAN would not generate enough developer
contributions to meet the affordable housing need, the authority should
consider lifting its policy target (requirement) by 10%, subject to demand and
viability.
3.49 In addition the revised PPG should make it clear that affordable housing need
is not part of the OAN and the OAN is not required to meet it in full. These two
numbers relate to different meanings of the word ‘need’. To avoid confusion we
suggest that the OAN be renamed ‘demand’.
Backlogs
3.50 The LPEG group suggest that shortfall or oversupply from previous plan targets
should automatically be carried into new plans. This is to “ensure that any surplus or
shortfall is not cancelled out by virtue of a regular plan review”.
3.51 This is a misguided proposal. The failure to deliver previous plan targets may be a
symptom of a lack of viable demand; the previous target was too high to be delivered.
Previous plan targets may not have been achieved because the OAN was set at a

Representations on Local Plan Expert Group
Objectively Assessed Housing Need
NMSS, Peter Brett Associates, University of Manchester
April 2016 17
level to match a job target which has not been achievable. Following the LPEG
approach, where targets are purposely divorced from viable demand this
circumstance can arrive more frequently than today. Manually adding unviable need
to a new plan may only further compound the issue in future plans.
3.52 Conversely, where delivery has exceeded plan targets it may be a symptom that the
past target was too low.
3.53 For new plans any overprovision in the past will be carried into new trend based the
demographic projections. So no further adjustment is needed.
3.54 In cases of under provision these people may have either migrated elsewhere; to
place where supply was more readily available, so they became part of another
area’s demographic projection and housing need which does need correction. Or
where they have been unable to unwilling to live in another authority area they may
have contributed to adverse market signals and the need assessment corrected
through that route. In either case no further adjustment to the OAN or new plan is
needed.
3.55 Further consideration needs to be given to where a failure to meet past targets
is a product of slow plan making, for example where site allocation documents
have not been progressed or where development management has caused
delay. There should be measures to ensure that such authorities are not seen
to benefit from past failures. But adjusting the OAN is not the right response.
Representations on Local Plan Expert Group
Objectively Assessed Housing Need
NMSS, Peter Brett Associates, University of Manchester
April 2016 18
4 SUMMARY
4.1 While there is much to be welcomed in the LPEG report, on the critical issue of
measuring housing need the report’s proposals are not helpful. LPEG is right to be
critical of the method set out in the PPG. But its own proposed new method, set out at
Appendix 6 of the report, is at least as unsatisfactory as the old one. In this paper we
explore the practical consequences of the Appendix 6 proposals and make alternative
suggestions for a better and simple method.
The consequences of Appendix 6
4.2 We estimate that the LPEG recommendations imply land allocations 40% above the
latest official projections and more than double recent rates of housebuilding. There is
no guarantee that this amount of development can be delivered in practice, no matter
how much land the planning system allocates. In physical terms to bring forward this
much land would need a huge boost in infrastructure provision, which would take
many years to plan, design and deliver. In financial terms the risk is that oversupply
will threaten viability, especially in areas where the market is already fragile.
4.3 To minimise these risks, we need to ensure that land is allocated in the right places.
Unfortunately the Appendix 6 method does not do this, as our authority –by-authority
estimates of the ‘LPEG housing need’ indicate.
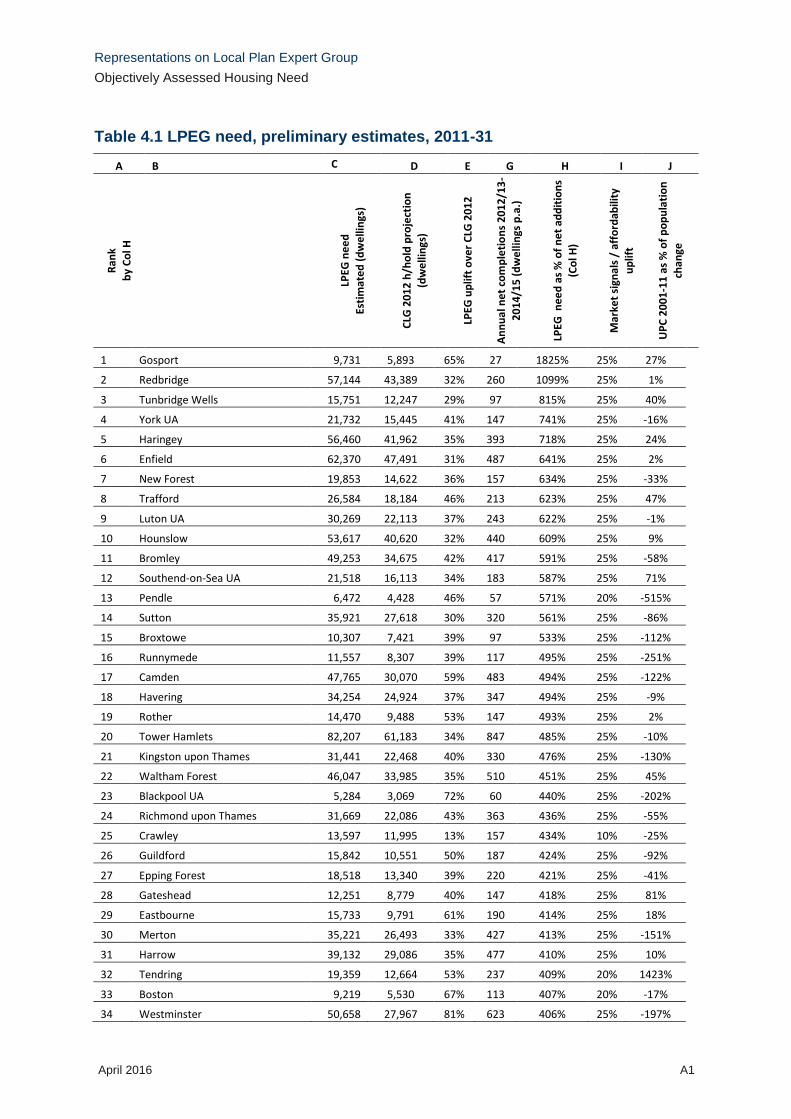
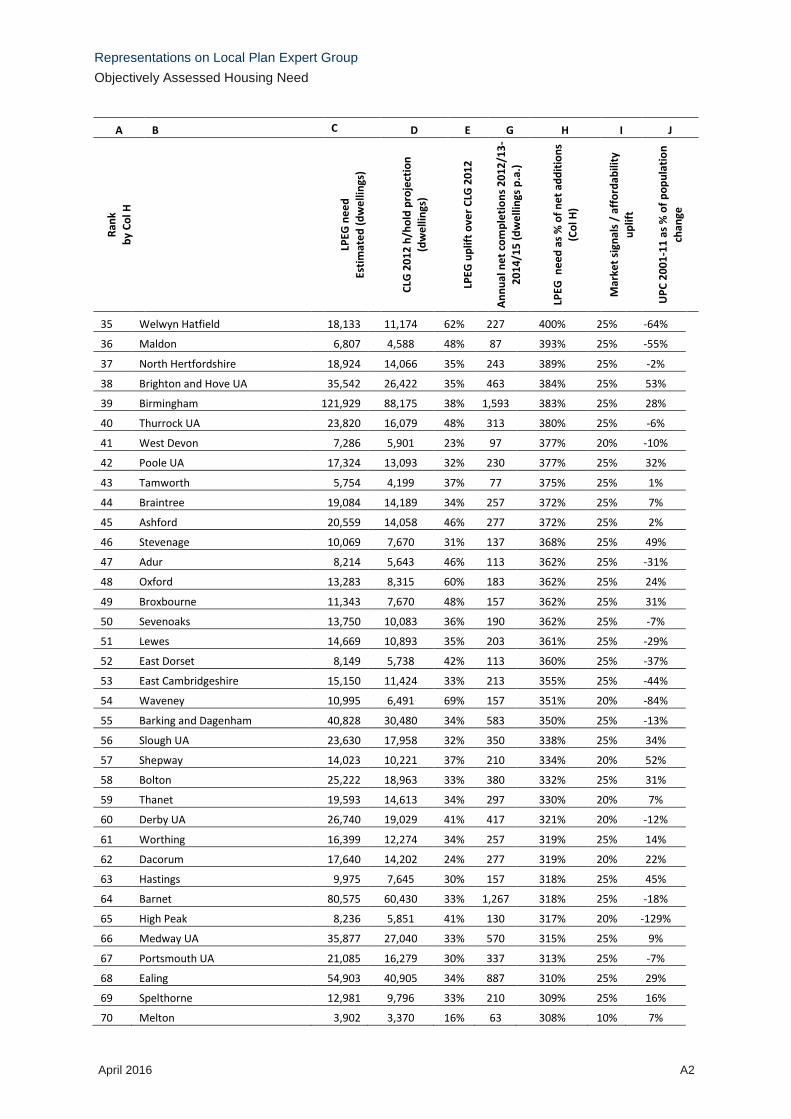
4.4 The table at Appendix A shows these local estimates. They suggest that, leaving
aside any adjustments for affordable need, the new method will increase the OAN
above the CLG projections for all local planning authorities. Compared to the rates of
delivery of the last three years, to meet the LPEG housing need 324 of the 325 local
planning authorities would have to lift their rates of delivery by more than 50%. 162
authorities would have to more than do e geography of the new housing numbers is
arbitrary – the outcome of double-counted migration, uncorrected technical errors
such as Unattributable Population Change (UPC) and near-universal market signals
uplifts. Despite their acknowledged limitations, the official demographic projections do
provide useful evidence on the likely location of future need and demand, especially if
they are corrected for major distortions such as the UPC. The LPEG adjustments
strip away much of that information.
4.5 Many authorities will be required to provide even more land that our OAN estimates
suggest, in order to accommodate unmet need from their more constrained
neighbours. Thus, if London’s recalculated unmet need is to be exported to the rest of
the London HMA, that area will have to increase its recent rates of delivery tenfold.
A suggested alternative.
4.6 We agree with LPEG that there should be a simpler and more standardised method
for measuring housing need. Departure from that method should not be absolutely
prohibited, but it should only be allowed where there is compelling evidence that not
Representations on Local Plan Expert Group
Objectively Assessed Housing Need
NMSS, Peter Brett Associates, University of Manchester
April 2016 19
to do so would lead to the OAN being over- or underestimated by a large margin, say
20%
4.7 Our main proposals for an alternative method are as follows.
i In establishing the ‘demographic starting point, projected internal migration
(domestic and international) on flows in the most recent 10-year period for which
data are available. The new Guidance could specify a standard method for this.
But a better solution would be for CLG (or local authorities collectively) to
commission the ONS (and / or other demographic experts) to produce revised
projections on this basis. The result would not be an alternative to the SNPP, but
a projection created specifically for calculating the OAN.
ii It should be allowed to correct the 10-year-based projections (in either direction) if
there is convincing evidence that they are seriously distorted by special factors.
Examples of such factors include unusual events in the base period – e.g. where
the area was a growth area under now cancelled planning policy, special groups
such as armed forces and students, and technical anomalies in the modelling.
iii Where Unattributable Population Change (UPC) is large, to provide a robust
demographic starting point, the 10-year projection mentioned earlier should be
adjusted so it includes in its migration base a portion of the 2001-11 UPC. To
quantify that portion, and determine its age and sex profile, should be based on
analysis of the ONS tool and the results of the 2001 Census for areas of potential
over-count. Like the 10-year projection as a whole, it would be best for these
adjustments to be made centrally, by ONS and /or other demographic experts,
who would be commissioned by CLG or by local planning authorities collectively.
iv Housing needs assessments should take household formation rates from the
latest CLG projections, which are currently the 2012-base projections.
v the new Guidance should include a logical framework as set out at para 3.16
above, to explain the logic of the OAN calculation and clarify the meanings of
need and demand.
vi To translate household numbers into dwellings, the OAN calculation should use
actual percentages of empty and second homes, as calculated from the latest
Council Tax Base, with no adjustments.
vii As suggested by LPEG, the market signals adjustment should be much simplified,
so it uses just two indicators and fixed adjustments. But these fixed adjustments
should be recalibrated so they apply to a minority of local authority areas, where
market pressures are exceptional. We are unable to calculate such recalibration
in the short time available for these representations. But it should not be a difficult
task.
viii The new PPG include a short section to guide calculations of labour market
alignment. Among other things this should advise on ensuring that forecasts of job
demand and labour supply are based on mutually consistent assumptions. The
guidance should have the benefit of technical advice from economic forecasters.
ix The affordable housing uplift should be treated as a policy issue, separate from
the OAN. The PPG should say that, if housing development in line with the OAN

Representations on Local Plan Expert Group
Objectively Assessed Housing Need
NMSS, Peter Brett Associates, University of Manchester
April 2016 20
would not generate enough developer contributions to meet the affordable
housing need, the authority should consider lifting its policy target (requirement)
by 10%, subject to demand and viability.
x In addition the revised PPG should make it clear that affordable housing need is
not part of the OAN and the OAN is not required to meet it in full. These two
numbers relate to different meanings of the word ‘need’. To avoid confusion we
suggest that the OAN be renamed ‘demand’.
xi Further consideration needs to be given to where a failure to meet past targets is
a product of slow plan making, for example where site allocation documents have
not been progressed or where development management has caused delay.
There should be measures to ensure that such authorities are not seen to benefit
from past failures. But adjusting the OAN is not the right response.

APPENDIX A
ESTIMATED LPEG NEED

Representations on Local Plan Expert Group
Objectively Assessed Housing Need
April 2016 A1
Table 4.1 LPEG need, preliminary estimates, 2011-31
A B C D E G H I J
Ran
k
by
Co
l H
LPEG
ne
ed
Esti
mat
ed
(d
we
llin
gs)
CLG
20
12
h/h
old
pro
ject
ion
(dw
elli
ngs
)
LPEG
up
lift
ove
r C
LG 2
01
2
An
nu
al n
et
com
ple
tio
ns
20
12
/13
-
20
14
/15
(d
we
llin
gs p
.a.)
LPEG
ne
ed
as
% o
f n
et
add
itio
ns
(Co
l H)
Mar
ket
sign
als
/ af
ford
abili
ty
up
lift
UP
C 2
00
1-1
1 a
s %
of
po
pu
lati
on
chan
ge
1 Gosport 9,731 5,893 65% 27 1825% 25% 27%
2 Redbridge 57,144 43,389 32% 260 1099% 25% 1%
3 Tunbridge Wells 15,751 12,247 29% 97 815% 25% 40%
4 York UA 21,732 15,445 41% 147 741% 25% -16%
5 Haringey 56,460 41,962 35% 393 718% 25% 24%
6 Enfield 62,370 47,491 31% 487 641% 25% 2%
7 New Forest 19,853 14,622 36% 157 634% 25% -33%
8 Trafford 26,584 18,184 46% 213 623% 25% 47%
9 Luton UA 30,269 22,113 37% 243 622% 25% -1%
10 Hounslow 53,617 40,620 32% 440 609% 25% 9%
11 Bromley 49,253 34,675 42% 417 591% 25% -58%
12 Southend-on-Sea UA 21,518 16,113 34% 183 587% 25% 71%
13 Pendle 6,472 4,428 46% 57 571% 20% -515%
14 Sutton 35,921 27,618 30% 320 561% 25% -86%
15 Broxtowe 10,307 7,421 39% 97 533% 25% -112%
16 Runnymede 11,557 8,307 39% 117 495% 25% -251%
17 Camden 47,765 30,070 59% 483 494% 25% -122%
18 Havering 34,254 24,924 37% 347 494% 25% -9%
19 Rother 14,470 9,488 53% 147 493% 25% 2%
20 Tower Hamlets 82,207 61,183 34% 847 485% 25% -10%
21 Kingston upon Thames 31,441 22,468 40% 330 476% 25% -130%
22 Waltham Forest 46,047 33,985 35% 510 451% 25% 45%
23 Blackpool UA 5,284 3,069 72% 60 440% 25% -202%
24 Richmond upon Thames 31,669 22,086 43% 363 436% 25% -55%
25 Crawley 13,597 11,995 13% 157 434% 10% -25%
26 Guildford 15,842 10,551 50% 187 424% 25% -92%
27 Epping Forest 18,518 13,340 39% 220 421% 25% -41%
28 Gateshead 12,251 8,779 40% 147 418% 25% 81%
29 Eastbourne 15,733 9,791 61% 190 414% 25% 18%
30 Merton 35,221 26,493 33% 427 413% 25% -151%
31 Harrow 39,132 29,086 35% 477 410% 25% 10%
32 Tendring 19,359 12,664 53% 237 409% 20% 1423%
33 Boston 9,219 5,530 67% 113 407% 20% -17%
34 Westminster 50,658 27,967 81% 623 406% 25% -197%
Representations on Local Plan Expert Group
Objectively Assessed Housing Need
April 2016 A2
A B C D E G H I J
Ran
k
by
Co
l H
LPEG
ne
ed
Esti
mat
ed
(d
we
llin
gs)
CLG
20
12
h/h
old
pro
ject
ion
(dw
elli
ngs
)
LPEG
up
lift
ove
r C
LG 2
01
2
An
nu
al n
et
com
ple
tio
ns
20
12
/13
-
20
14
/15
(d
we
llin
gs p
.a.)
LPEG
ne
ed
as
% o
f n
et
add
itio
ns
(Co
l H)
Mar
ket
sign
als
/ af
ford
abili
ty
up
lift
UP
C 2
00
1-1
1 a
s %
of
po
pu
lati
on
chan
ge
35 Welwyn Hatfield 18,133 11,174 62% 227 400% 25% -64%
36 Maldon 6,807 4,588 48% 87 393% 25% -55%
37 North Hertfordshire 18,924 14,066 35% 243 389% 25% -2%
38 Brighton and Hove UA 35,542 26,422 35% 463 384% 25% 53%
39 Birmingham 121,929 88,175 38% 1,593 383% 25% 28%
40 Thurrock UA 23,820 16,079 48% 313 380% 25% -6%
41 West Devon 7,286 5,901 23% 97 377% 20% -10%
42 Poole UA 17,324 13,093 32% 230 377% 25% 32%
43 Tamworth 5,754 4,199 37% 77 375% 25% 1%
44 Braintree 19,084 14,189 34% 257 372% 25% 7%
45 Ashford 20,559 14,058 46% 277 372% 25% 2%
46 Stevenage 10,069 7,670 31% 137 368% 25% 49%
47 Adur 8,214 5,643 46% 113 362% 25% -31%
48 Oxford 13,283 8,315 60% 183 362% 25% 24%
49 Broxbourne 11,343 7,670 48% 157 362% 25% 31%
50 Sevenoaks 13,750 10,083 36% 190 362% 25% -7%
51 Lewes 14,669 10,893 35% 203 361% 25% -29%
52 East Dorset 8,149 5,738 42% 113 360% 25% -37%
53 East Cambridgeshire 15,150 11,424 33% 213 355% 25% -44%
54 Waveney 10,995 6,491 69% 157 351% 20% -84%
55 Barking and Dagenham 40,828 30,480 34% 583 350% 25% -13%
56 Slough UA 23,630 17,958 32% 350 338% 25% 34%
57 Shepway 14,023 10,221 37% 210 334% 20% 52%
58 Bolton 25,222 18,963 33% 380 332% 25% 31%
59 Thanet 19,593 14,613 34% 297 330% 20% 7%
60 Derby UA 26,740 19,029 41% 417 321% 20% -12%
61 Worthing 16,399 12,274 34% 257 319% 25% 14%
62 Dacorum 17,640 14,202 24% 277 319% 20% 22%
63 Hastings 9,975 7,645 30% 157 318% 25% 45%
64 Barnet 80,575 60,430 33% 1,267 318% 25% -18%
65 High Peak 8,236 5,851 41% 130 317% 20% -129%
66 Medway UA 35,877 27,040 33% 570 315% 25% 9%
67 Portsmouth UA 21,085 16,279 30% 337 313% 25% -7%
68 Ealing 54,903 40,905 34% 887 310% 25% 29%
69 Spelthorne 12,981 9,796 33% 210 309% 25% 16%
70 Melton 3,902 3,370 16% 63 308% 10% 7%
Representations on Local Plan Expert Group
Objectively Assessed Housing Need
April 2016 A3
A B C D E G H I J
Ran
k
by
Co
l H
LPEG
ne
ed
Esti
mat
ed
(d
we
llin
gs)
CLG
20
12
h/h
old
pro
ject
ion
(dw
elli
ngs
)
LPEG
up
lift
ove
r C
LG 2
01
2
An
nu
al n
et
com
ple
tio
ns
20
12
/13
-
20
14
/15
(d
we
llin
gs p
.a.)
LPEG
ne
ed
as
% o
f n
et
add
itio
ns
(Co
l H)
Mar
ket
sign
als
/ af
ford
abili
ty
up
lift
UP
C 2
00
1-1
1 a
s %
of
po
pu
lati
on
chan
ge
71 Herefordshire, County of UA 21,703 14,036 55% 353 307% 25% -15%
72 Newcastle upon Tyne 26,318 16,966 55% 437 301% 25% -61%
73 Stockport 23,546 17,395 35% 393 299% 25% 274%
74 Waverley 11,938 9,177 30% 200 298% 25% -9%
75 Purbeck 4,366 2,254 94% 73 298% 25% 34%
76 Ipswich 14,671 10,744 37% 247 297% 25% 36%
77 Three Rivers 12,250 9,443 30% 207 296% 25% -32%
78 Greenwich 46,806 34,923 34% 790 296% 25% 47%
79 Hillingdon 50,487 37,396 35% 857 295% 25% -11%
80 Great Yarmouth 10,164 8,018 27% 173 293% 10% -3%
81 Basingstoke and Deane 24,350 18,379 32% 417 292% 25% -3%
82 Tandridge 11,997 8,596 40% 207 290% 25% -9%
83 Harlow 9,088 6,546 39% 157 290% 25% 16%
84 Wigan 25,894 19,778 31% 450 288% 25% 40%
85 Swale 22,860 17,236 33% 400 286% 25% -10%
86 Mole Valley 9,311 7,083 31% 163 285% 25% 8%
87 Harrogate 11,211 7,663 46% 200 280% 25% 11%
88 Islington 49,535 37,759 31% 887 279% 25% -21%
89 Kirklees 39,420 29,616 33% 713 276% 20% 32%
90 Manchester 68,556 46,292 48% 1,243 276% 25% 23%
91 Bexley 31,541 20,941 51% 587 269% 25% 0%
92 Brentwood 8,556 6,092 40% 160 267% 25% 10%
93 South Bucks 9,057 6,603 37% 170 266% 25% -9%
94 Gravesham 13,946 9,196 52% 263 265% 25% 9%
95 Christchurch 6,518 4,229 54% 123 264% 25% 5%
96 Norwich 15,650 11,555 35% 297 264% 25% -27%
97 Oldham 18,806 13,747 37% 357 264% 25% 43%
98 Wycombe 15,893 11,761 35% 303 262% 25% 55%
99 Elmbridge 13,249 7,766 71% 253 261% 25% -3%
100 Reigate and Banstead 23,163 17,870 30% 443 261% 25% -7%
101 Croydon 64,110 48,110 33% 1,237 259% 25% 34%
102 King's Lynn and West Norfolk 16,819 10,426 61% 327 257% 25% 8%
103 Eastleigh 14,582 10,842 34% 283 257% 25% 16%
104 Arun 24,944 16,037 56% 487 256% 25% -46%
105 Coventry 53,686 38,805 38% 1,060 253% 25% -106%
106 Windsor and Maidenhead UA 17,878 12,999 38% 353 253% 25% -4%
Representations on Local Plan Expert Group
Objectively Assessed Housing Need
April 2016 A4
A B C D E G H I J
Ran
k
by
Co
l H
LPEG
ne
ed
Esti
mat
ed
(d
we
llin
gs)
CLG
20
12
h/h
old
pro
ject
ion
(dw
elli
ngs
)
LPEG
up
lift
ove
r C
LG 2
01
2
An
nu
al n
et
com
ple
tio
ns
20
12
/13
-
20
14
/15
(d
we
llin
gs p
.a.)
LPEG
ne
ed
as
% o
f n
et
add
itio
ns
(Co
l H)
Mar
ket
sign
als
/ af
ford
abili
ty
up
lift
UP
C 2
00
1-1
1 a
s %
of
po
pu
lati
on
chan
ge
107 Lambeth 53,836 39,594 36% 1,067 252% 25% 16%
108 Castle Point 8,394 5,610 50% 167 252% 25% -107%
109 Bromsgrove 8,640 5,788 49% 173 249% 25% -3%
110 Bristol, City of UA 60,137 38,806 55% 1,207 249% 25% -20%
111 Sandwell 33,769 26,723 26% 680 248% 20% 32%
112 Surrey Heath 7,434 4,765 56% 150 248% 25% 20%
113 St Albans 17,010 13,053 30% 343 248% 25% 19%
114 Rushcliffe 11,797 8,857 33% 240 246% 25% -37%
115 Fareham 11,127 8,536 30% 227 245% 25% -57%
116 Lancaster 11,893 6,930 72% 243 244% 25% -209%
117 Hackney 51,817 39,115 32% 1,063 244% 25% 43%
118 North Tyneside 19,962 16,212 23% 413 241% 20% 20%
119 Brent 47,301 32,990 43% 983 241% 25% 65%
120 Warwick 16,099 11,847 36% 337 239% 25% -2%
121 Dover 12,239 7,785 57% 257 238% 25% 45%
122 Southwark 64,160 44,893 43% 1,347 238% 25% -43%
123 West Oxfordshire 13,786 9,540 45% 290 238% 25% -6%
124 Chichester 15,674 11,496 36% 330 237% 25% -7%
125 South Holland 11,231 8,417 33% 237 237% 10% -7%
126 Sheffield 54,353 38,098 43% 1,150 236% 25% 4%
127 North Somerset UA 30,835 21,660 42% 653 236% 20% -63%
128 North Warwickshire 4,712 3,288 43% 100 236% 25% -114%
129 Suffolk Coastal 15,184 9,759 56% 323 235% 20% -7%
130 Wirral 17,061 13,566 26% 363 235% 20% 194%
131 Amber Valley 11,526 7,627 51% 247 234% 20% 0%
132 Calderdale 21,566 17,046 27% 463 233% 20% 4%
133 Canterbury 21,662 12,764 70% 467 232% 25% -27%
134 Northampton 33,854 22,554 50% 730 232% 25% -15%
135 East Staffordshire 13,018 9,240 41% 283 230% 25% 18%
136 Tameside 20,368 15,998 27% 450 226% 20% 5%
137 Swindon UA 28,312 24,794 14% 630 225% 10% 20%
138 Bracknell Forest UA 16,298 11,326 44% 363 224% 25% -127%
139 Lewisham 59,424 44,360 34% 1,327 224% 25% -3%
140 Craven 4,908 2,808 75% 110 223% 25% 5%
141 Salford 35,054 25,814 36% 790 222% 25% -4%
142 Leeds 85,314 57,606 48% 1,923 222% 25% -114%
Representations on Local Plan Expert Group
Objectively Assessed Housing Need
April 2016 A5
A B C D E G H I J
Ran
k
by
Co
l H
LPEG
ne
ed
Esti
mat
ed
(d
we
llin
gs)
CLG
20
12
h/h
old
pro
ject
ion
(dw
elli
ngs
)
LPEG
up
lift
ove
r C
LG 2
01
2
An
nu
al n
et
com
ple
tio
ns
20
12
/13
-
20
14
/15
(d
we
llin
gs p
.a.)
LPEG
ne
ed
as
% o
f n
et
add
itio
ns
(Co
l H)
Mar
ket
sign
als
/ af
ford
abili
ty
up
lift
UP
C 2
00
1-1
1 a
s %
of
po
pu
lati
on
chan
ge
143 Solihull 16,949 12,006 41% 383 221% 25% -1%
144 Erewash 8,960 7,778 15% 203 220% 10% 5%
145 Maidstone 24,062 17,328 39% 547 220% 25% 6%
146 Bradford 39,841 37,701 6% 907 220% 0% 22%
147 Torbay UA 13,912 8,869 57% 317 220% 25% -231%
148 Basildon 20,951 13,291 58% 483 217% 25% 25%
149 Newham 67,189 49,126 37% 1,563 215% 25% 36%
150 Bury 15,439 11,068 39% 360 214% 25% -27%
151 Wokingham UA 18,978 14,204 34% 447 212% 25% -232%
152 Woking 10,013 6,457 55% 237 212% 25% 43%
153 Nottingham UA 31,986 21,771 47% 760 210% 25% -10%
154 Rochford 8,366 5,339 57% 200 209% 25% 4%
155 Chesterfield 6,722 4,245 58% 163 206% 10% 46%
156 Kingston upon Hull, City of UA 17,494 11,649 50% 427 205% 10% -81%
157 East Lindsey 14,454 8,383 72% 353 205% 25% -104%
158 Isle of Wight UA 16,941 11,382 49% 417 203% 25% -34%
159 Derbyshire Dales 6,083 4,845 26% 150 203% 20% 48%
160 North Lincolnshire UA 13,860 10,346 34% 343 202% 10% 23%
161 North Dorset 7,342 3,939 86% 183 200% 25% 32%
162 Torridge 10,010 7,176 39% 250 200% 25% -49%
163 Cheltenham 12,905 9,634 34% 323 200% 25% 17%
164 Winchester 12,475 9,465 32% 313 199% 25% 6%
165 Huntingdonshire 21,350 14,168 51% 540 198% 25% -3%
166 West Dorset 11,709 7,745 51% 297 197% 25% 29%
167 South Hams 7,335 4,440 65% 187 196% 25% 24%
168 Lichfield 9,685 6,585 47% 247 196% 20% 7%
169 Staffordshire Moorlands 6,012 3,602 67% 153 196% 20% 43%
170 East Hertfordshire 21,036 16,071 31% 537 196% 25% -19%
171 St Edmundsbury 10,938 7,241 51% 280 195% 25% 51%
172 Hertsmere 14,684 11,260 30% 377 195% 25% 1%
173 Chiltern 7,637 4,470 71% 197 194% 25% 36%
174 South Derbyshire 13,910 10,483 33% 360 193% 20% -2%
175 Babergh 8,685 5,642 54% 227 192% 25% 26%
176 North East Derbyshire 6,247 4,907 27% 163 191% 20% 17%
177 Colchester 26,341 17,741 48% 690 191% 25% -23%
178 Preston 9,897 6,229 59% 260 190% 25% 5%

Representations on Local Plan Expert Group
Objectively Assessed Housing Need
April 2016 A6
A B C D E G H I J
Ran
k
by
Co
l H
LPEG
ne
ed
Esti
mat
ed
(d
we
llin
gs)
CLG
20
12
h/h
old
pro
ject
ion
(dw
elli
ngs
)
LPEG
up
lift
ove
r C
LG 2
01
2
An
nu
al n
et
com
ple
tio
ns
20
12
/13
-
20
14
/15
(d
we
llin
gs p
.a.)
LPEG
ne
ed
as
% o
f n
et
add
itio
ns
(Co
l H)
Mar
ket
sign
als
/ af
ford
abili
ty
up
lift
UP
C 2
00
1-1
1 a
s %
of
po
pu
lati
on
chan
ge
179 Burnley 2,390 1,207 98% 63 189% 20% -38%
180 Bournemouth UA 24,989 19,969 25% 663 188% 20% 58%
181 Oadby and Wigston 2,637 1,246 112% 70 188% 20% -1802%
182 Fenland 15,946 9,077 76% 423 188% 25% -5%
183 Fylde 7,466 4,728 58% 200 187% 20% -41%
184 Rochdale 12,780 8,824 45% 343 186% 25% 90%
185 Nuneaton and Bedworth 10,293 8,908 16% 277 186% 10% 23%
186 Lincoln 7,797 5,226 49% 210 186% 25% 22%
187 Warrington UA 24,857 17,908 39% 677 184% 25% -9%
188 North Norfolk 12,951 8,556 51% 353 183% 20% -89%
189 Tonbridge and Malling 17,539 12,550 40% 480 183% 25% -2%
190 Wandsworth 39,334 27,421 43% 1,080 182% 25% 24%
191 South Tyneside 9,448 7,572 25% 260 182% 20% 80%
192 Breckland 15,140 11,174 35% 417 182% 10% -17%
193 Stafford 11,732 7,916 48% 323 181% 25% 37%
194 Rugby 14,021 9,240 52% 387 181% 25% 17%
195 Broadland 11,822 8,446 40% 327 181% 20% 8%
196 Gedling 10,312 7,313 41% 287 180% 25% -39%
197 Sefton 13,554 11,911 14% 380 178% 10% 24%
198 Wakefield 29,335 20,673 42% 823 178% 20% -41%
199 Barnsley 24,055 16,364 47% 677 178% 20% 13%
200 Bassetlaw 8,522 6,595 29% 240 178% 10% -3%
201 Wyre 7,777 5,465 42% 220 177% 10% -206%
202 Watford 13,978 10,885 28% 397 176% 25% 62%
203 Chelmsford 18,174 13,405 36% 517 176% 25% 9%
204 Wolverhampton 18,613 11,506 62% 530 176% 25% 58%
205 North Kesteven 11,638 8,806 32% 333 175% 20% 1%
206 Central Bedfordshire UA 43,590 32,337 35% 1,250 174% 25% -33%
207 Doncaster 20,456 12,301 66% 587 174% 25% 63%
208 South Northamptonshire 10,395 6,484 60% 300 173% 20% -67%
209 Kettering 13,511 9,123 48% 390 173% 25% 12%
210 Malvern Hills 7,134 4,499 59% 207 173% 20% -17%
211 Blackburn with Darwen UA 7,451 5,373 39% 217 172% 25% 52%
212 Epsom and Ewell 10,856 7,664 42% 317 171% 25% 14%
213 South Staffordshire 7,280 4,120 77% 213 171% 20% 53%
214 Forest Heath 8,401 6,154 37% 247 170% 25% -62%
Representations on Local Plan Expert Group
Objectively Assessed Housing Need
April 2016 A7
A B C D E G H I J
Ran
k
by
Co
l H
LPEG
ne
ed
Esti
mat
ed
(d
we
llin
gs)
CLG
20
12
h/h
old
pro
ject
ion
(dw
elli
ngs
)
LPEG
up
lift
ove
r C
LG 2
01
2
An
nu
al n
et
com
ple
tio
ns
20
12
/13
-
20
14
/15
(d
we
llin
gs p
.a.)
LPEG
ne
ed
as
% o
f n
et
add
itio
ns
(Co
l H)
Mar
ket
sign
als
/ af
ford
abili
ty
up
lift
UP
C 2
00
1-1
1 a
s %
of
po
pu
lati
on
chan
ge
215 Stockton-on-Tees UA 16,101 11,656 38% 473 170% 20% -23%
216 Stoke-on-Trent UA 14,516 9,155 59% 430 169% 20% 45%
217 Hartlepool UA 6,411 4,156 54% 190 169% 25% 19%
218 Leicester UA 38,413 23,812 61% 1,147 167% 20% 34%
219 Bolsover 5,688 4,377 30% 170 167% 10% 16%
220 Reading UA 16,027 10,171 58% 480 167% 25% 88%
221 Wealden 20,653 13,700 51% 620 167% 25% 29%
222 South Cambridgeshire 23,230 17,515 33% 700 166% 25% -5%
223 Charnwood 20,072 16,272 23% 607 165% 10% -48%
224 Wellingborough 8,380 5,729 46% 253 165% 25% -44%
225 Mansfield 7,933 5,215 52% 240 165% 10% 49%
226 Southampton UA 25,992 17,254 51% 787 165% 25% -22%
227 Rushmoor 8,259 5,928 39% 250 165% 25% 76%
228 West Somerset 3,159 1,868 69% 97 163% 25% 223%
229 Liverpool 36,441 27,376 33% 1,137 160% 20% 87%
230 Hart 8,650 4,925 76% 270 160% 25% -18%
231 Milton Keynes UA 42,101 30,730 37% 1,317 160% 25% 16%
232 Walsall 20,035 15,825 27% 627 160% 20% 58%
233 Daventry 7,772 5,707 36% 243 160% 20% -20%
234 Worcester 9,369 7,073 32% 293 160% 25% 55%
235 Cheshire East UA 28,743 21,325 35% 907 159% 25% 9%
236 West Berkshire UA 15,683 10,674 47% 500 157% 25% -2%
237 South Gloucestershire UA 32,774 22,003 49% 1,047 157% 25% -31%
238 Weymouth and Portland 4,986 3,140 59% 160 156% 25% 105%
239 Cannock Chase 7,158 5,823 23% 230 156% 10% 39%
240 Havant 9,664 7,282 33% 313 154% 25% 84%
241 Mid Sussex 18,454 13,195 40% 600 154% 25% 42%
242 Stratford-on-Avon 14,396 9,420 53% 470 153% 25% -15%
243 County Durham UA 30,060 27,308 10% 997 151% 0% 18%
244 Hambleton 6,001 4,001 50% 200 150% 25% 36%
245 Bedford UA 24,757 18,046 37% 827 150% 25% -69%
246 Mid Suffolk 12,677 8,485 49% 423 150% 20% 13%
247 Shropshire UA 28,061 20,526 37% 940 149% 25% 40%
248 South Somerset 17,663 11,919 48% 593 149% 20% -1%
249 Cherwell 16,818 11,213 50% 567 148% 25% -22%
250 Exeter 15,005 8,485 77% 507 148% 25% -49%
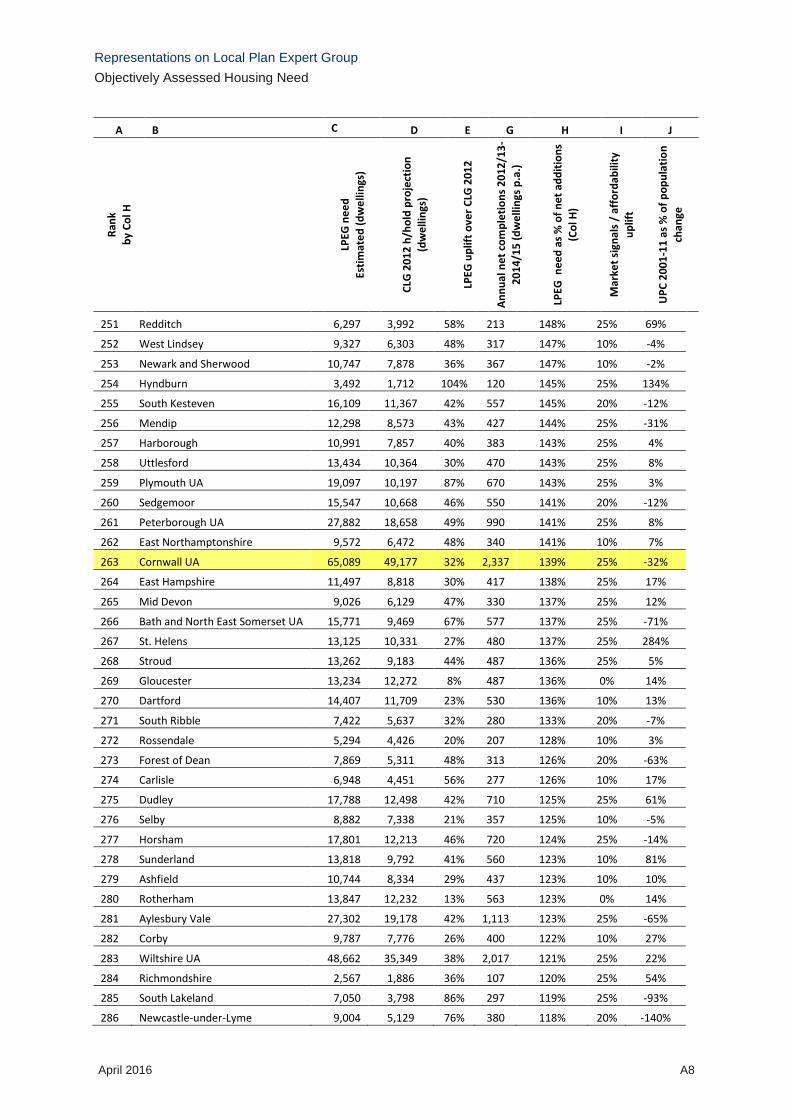
Representations on Local Plan Expert Group
Objectively Assessed Housing Need
April 2016 A8
A B C D E G H I J
Ran
k
by
Co
l H
LPEG
ne
ed
Esti
mat
ed
(d
we
llin
gs)
CLG
20
12
h/h
old
pro
ject
ion
(dw
elli
ngs
)
LPEG
up
lift
ove
r C
LG 2
01
2
An
nu
al n
et
com
ple
tio
ns
20
12
/13
-
20
14
/15
(d
we
llin
gs p
.a.)
LPEG
ne
ed
as
% o
f n
et
add
itio
ns
(Co
l H)
Mar
ket
sign
als
/ af
ford
abili
ty
up
lift
UP
C 2
00
1-1
1 a
s %
of
po
pu
lati
on
chan
ge
251 Redditch 6,297 3,992 58% 213 148% 25% 69%
252 West Lindsey 9,327 6,303 48% 317 147% 10% -4%
253 Newark and Sherwood 10,747 7,878 36% 367 147% 10% -2%
254 Hyndburn 3,492 1,712 104% 120 145% 25% 134%
255 South Kesteven 16,109 11,367 42% 557 145% 20% -12%
256 Mendip 12,298 8,573 43% 427 144% 25% -31%
257 Harborough 10,991 7,857 40% 383 143% 25% 4%
258 Uttlesford 13,434 10,364 30% 470 143% 25% 8%
259 Plymouth UA 19,097 10,197 87% 670 143% 25% 3%
260 Sedgemoor 15,547 10,668 46% 550 141% 20% -12%
261 Peterborough UA 27,882 18,658 49% 990 141% 25% 8%
262 East Northamptonshire 9,572 6,472 48% 340 141% 10% 7%
263 Cornwall UA 65,089 49,177 32% 2,337 139% 25% -32%
264 East Hampshire 11,497 8,818 30% 417 138% 25% 17%
265 Mid Devon 9,026 6,129 47% 330 137% 25% 12%
266 Bath and North East Somerset UA 15,771 9,469 67% 577 137% 25% -71%
267 St. Helens 13,125 10,331 27% 480 137% 25% 284%
268 Stroud 13,262 9,183 44% 487 136% 25% 5%
269 Gloucester 13,234 12,272 8% 487 136% 0% 14%
270 Dartford 14,407 11,709 23% 530 136% 10% 13%
271 South Ribble 7,422 5,637 32% 280 133% 20% -7%
272 Rossendale 5,294 4,426 20% 207 128% 10% 3%
273 Forest of Dean 7,869 5,311 48% 313 126% 20% -63%
274 Carlisle 6,948 4,451 56% 277 126% 10% 17%
275 Dudley 17,788 12,498 42% 710 125% 25% 61%
276 Selby 8,882 7,338 21% 357 125% 10% -5%
277 Horsham 17,801 12,213 46% 720 124% 25% -14%
278 Sunderland 13,818 9,792 41% 560 123% 10% 81%
279 Ashfield 10,744 8,334 29% 437 123% 10% 10%
280 Rotherham 13,847 12,232 13% 563 123% 0% 14%
281 Aylesbury Vale 27,302 19,178 42% 1,113 123% 25% -65%
282 Corby 9,787 7,776 26% 400 122% 10% 27%
283 Wiltshire UA 48,662 35,349 38% 2,017 121% 25% 22%
284 Richmondshire 2,567 1,886 36% 107 120% 25% 54%
285 South Lakeland 7,050 3,798 86% 297 119% 25% -93%
286 Newcastle-under-Lyme 9,004 5,129 76% 380 118% 20% -140%
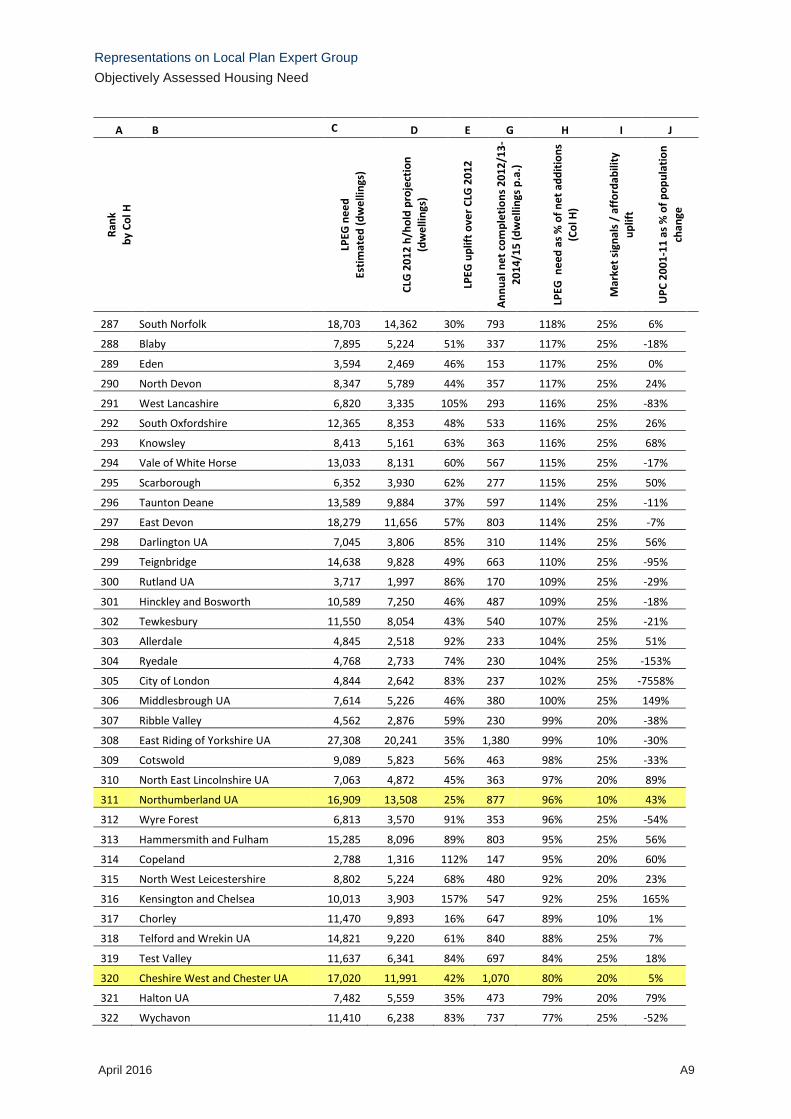
Representations on Local Plan Expert Group
Objectively Assessed Housing Need
April 2016 A9
A B C D E G H I J
Ran
k
by
Co
l H
LPEG
ne
ed
Esti
mat
ed
(d
we
llin
gs)
CLG
20
12
h/h
old
pro
ject
ion
(dw
elli
ngs
)
LPEG
up
lift
ove
r C
LG 2
01
2
An
nu
al n
et
com
ple
tio
ns
20
12
/13
-
20
14
/15
(d
we
llin
gs p
.a.)
LPEG
ne
ed
as
% o
f n
et
add
itio
ns
(Co
l H)
Mar
ket
sign
als
/ af
ford
abili
ty
up
lift
UP
C 2
00
1-1
1 a
s %
of
po
pu
lati
on
chan
ge
287 South Norfolk 18,703 14,362 30% 793 118% 25% 6%
288 Blaby 7,895 5,224 51% 337 117% 25% -18%
289 Eden 3,594 2,469 46% 153 117% 25% 0%
290 North Devon 8,347 5,789 44% 357 117% 25% 24%
291 West Lancashire 6,820 3,335 105% 293 116% 25% -83%
292 South Oxfordshire 12,365 8,353 48% 533 116% 25% 26%
293 Knowsley 8,413 5,161 63% 363 116% 25% 68%
294 Vale of White Horse 13,033 8,131 60% 567 115% 25% -17%
295 Scarborough 6,352 3,930 62% 277 115% 25% 50%
296 Taunton Deane 13,589 9,884 37% 597 114% 25% -11%
297 East Devon 18,279 11,656 57% 803 114% 25% -7%
298 Darlington UA 7,045 3,806 85% 310 114% 25% 56%
299 Teignbridge 14,638 9,828 49% 663 110% 25% -95%
300 Rutland UA 3,717 1,997 86% 170 109% 25% -29%
301 Hinckley and Bosworth 10,589 7,250 46% 487 109% 25% -18%
302 Tewkesbury 11,550 8,054 43% 540 107% 25% -21%
303 Allerdale 4,845 2,518 92% 233 104% 25% 51%
304 Ryedale 4,768 2,733 74% 230 104% 25% -153%
305 City of London 4,844 2,642 83% 237 102% 25% -7558%
306 Middlesbrough UA 7,614 5,226 46% 380 100% 25% 149%
307 Ribble Valley 4,562 2,876 59% 230 99% 20% -38%
308 East Riding of Yorkshire UA 27,308 20,241 35% 1,380 99% 10% -30%
309 Cotswold 9,089 5,823 56% 463 98% 25% -33%
310 North East Lincolnshire UA 7,063 4,872 45% 363 97% 20% 89%
311 Northumberland UA 16,909 13,508 25% 877 96% 10% 43%
312 Wyre Forest 6,813 3,570 91% 353 96% 25% -54%
313 Hammersmith and Fulham 15,285 8,096 89% 803 95% 25% 56%
314 Copeland 2,788 1,316 112% 147 95% 20% 60%
315 North West Leicestershire 8,802 5,224 68% 480 92% 20% 23%
316 Kensington and Chelsea 10,013 3,903 157% 547 92% 25% 165%
317 Chorley 11,470 9,893 16% 647 89% 10% 1%
318 Telford and Wrekin UA 14,821 9,220 61% 840 88% 25% 7%
319 Test Valley 11,637 6,341 84% 697 84% 25% 18%
320 Cheshire West and Chester UA 17,020 11,991 42% 1,070 80% 20% 5%
321 Halton UA 7,482 5,559 35% 473 79% 20% 79%
322 Wychavon 11,410 6,238 83% 737 77% 25% -52%

Representations on Local Plan Expert Group
Objectively Assessed Housing Need
April 2016 A10
A B C D E G H I J
Ran
k
by
Co
l H
LPEG
ne
ed
Esti
mat
ed
(d
we
llin
gs)
CLG
20
12
h/h
old
pro
ject
ion
(dw
elli
ngs
)
LPEG
up
lift
ove
r C
LG 2
01
2
An
nu
al n
et
com
ple
tio
ns
20
12
/13
-
20
14
/15
(d
we
llin
gs p
.a.)
LPEG
ne
ed
as
% o
f n
et
add
itio
ns
(Co
l H)
Mar
ket
sign
als
/ af
ford
abili
ty
up
lift
UP
C 2
00
1-1
1 a
s %
of
po
pu
lati
on
chan
ge
323 Cambridge 11,573 7,004 65% 833 69% 25% 116%
324 Redcar and Cleveland UA 3,392 2,743 24% 257 66% 0% 62%
325 Barrow-in-Furness 464 274 70% 63 37% 20% 58%
Source: LPEG, CLG, ONS, NMSS, PBA
‘CLG 2012 projection’ includes adjustment for empty homes as per Council Tax Base 2015.
Net completions are from CLG Live table 122.
For authorities re-organised in 2009 (shaded yellow) we were unable to calculate the impact of LPEG’s adjustments to household formation rates.
Where the LPEG proposals do not specify calculations precisely we have made assumptions.
In some cases we have had to use data for other years than specified by LPEG.
The figures take no account of the affordable need adjustment proposed by LPEG. We are unable to estimate this adjustment.

Representations on Local Plan Expert Group
Objectively Assessed Housing Need
April 2016 A11
APPENDIX B
UNATTRIBUTABLE POPULATION CHANGE


Representations on Local Plan Expert Group
Objectively Assessed Housing Need
April 2016 A13
Unattributable population change 2001-11
By John Hollis
Demographic consultant
For England between mid-2001 and mid-2011 ONS estimated that Unattributable Population
Change (UPC) amounted to 103,680, equivalent to 2.8% of total population change over the
ten years. At the local authority level UPC varied between +28,800 (London Borough of
Brent) and -40,000 (Leeds). In terms of its contributions to local authority total population
change this varied between in excess of 1,400% (Tendring DC) and -1,800% (Oadby &
Wigston DC).6 In 91 of 324 LAs in England (leaving aside City of London and the Isles of
Scilly) UPC was equivalent to in excess of 50% of the total population change.
UPC is effectively a correction factor between estimates for 2001 and 2011 and at the local
level may be affected by:
Errors in the 2001 Census and the 2001 MYE
Errors in the 2011 Census and the 2011 MYE
Errors in estimated International migration inflows or outflows
Errors in estimated Internal (UK) migration inflows and outflows.
Given the size of UPC at the individual local authority level compared to the national figure
and the range of both positive and negative effects, any UPC associated with migration is
likely to be a product of incorrect distribution of migrant flows within England as much as with
the estimation of flows into and out of England.
The ONS SNPP does not include UPC in its calculation of either internal or international
migration. LPEG propose that in creating alternative local authority and HMA population
projections based on the ten years prior to the latest ONS MYE no part of UPC should be
considered as corrected migration.
If, for the sake of exemplification, it is assumed that 100% of UPC is a correction of
estimated net migration it will have contributed in excess of 50% of 2001-11 adjusted
migration (the estimated net migration from MYE change analyses plus UPC) in 135 of 324
LAs in England. In 66 LAs the UPC effect is greater than 100% of adjusted net migration. In
only 136 LAs is the impact 25% or less. Clearly UPC is an important component of
population change in the majority of LAs.
In the 274 LAs with estimated net in migration there is a positive UPC in 130 and a
compensating negative UPC in 144.
In the 50 LAs with estimated net out migration there is a negative UPC in 12 and a
compensating positive UPC in 38.
To assist the interpretation of UPC ONS has produced a UPC Guidance Tool to help identify
the most appropriate component.
6 The contribution of UPC to ‘Total Change’ and ‘Adjusted Migration’ may be in excess of 100% in those local
authorities where the signs of the main elements of change (natural change, net migration and UPC) are in opposition. For instance in Tendring total change was -740, natural change was -8,591, net migration was +18,354 and UPC was -10,542.

Representations on Local Plan Expert Group
Objectively Assessed Housing Need
April 2016 A14
http://webarchive.nationalarchives.gov.uk/20160105160709/http://www.ons.gov.uk/ons/guide
-method/method-quality/specific/population-and-migration/population-statistics-research-unit-
-psru-/latest-publications-from-the-population-statistics-research-unit/data-tool-17-sept.zip)
If a UPC adjustment is to be applied then the decision on where to place it is important, as
the age/sex structures differ for the internal and international components and thus there are
differing effects on household formation and economic activity. The Tool helps make a
decision on whether UPC is a migration effect or a problem with the censuses or modelling.
An apportionment of all or part of UPC between internal and international flows can be made,
although much is left to judgement as the Tool does not numerically apportion UPC.
It is a further question as to whether a proportion of UPC should be added solely to the years
prior to 2011 in the ten-year period or whether that level should also be added to migration in
the years after 2011 as there have been no changes in the ONS methods used to roll
forward the MYEs since the publication of the 2011 MYEs.
The undercount from the 2001 Census was only addressed in 15 LAs where the MYEs were
adjusted following the Local Authority Studies.
http://webarchive.nationalarchives.gov.uk/20160105160709/http://www.ons.gov.uk/ons/guide
-method/method-quality/specific/population-and-migration/pop-ests/local-authority-
population-studies/index.html
Only LAs that were underestimated were adjusted, there was no adjustment for any
overestimation. No LA would have countenanced a reduction in MYE as it would have
affected their Annual Spending Settlements which were then based on MYEs.
There is, therefore, evidence that any over-count in 2001 was never addressed and
remained in the MYEs until the 2011 Census, which was considered a ‘better’ Census due to
improved Quality Assurance. Therefore In those local authorities where there was some
evidence of 2001 Census over-count, a portion of UPC should be excluded from any ten-
year trends projections on the basis that that the 2011 Census corrected the over-count with
negative UPC.
ONS argue that as the error does not introduce any bias into the trend data and that if it were
due to international migration, then it was likely to be mainly in the early part of the decade
(2001-2005) and as their international migration estimate methodology improved after 2005,
the error is thought less likely to recur. See Page 6 of the ONS QMI paper on why ONS
decided to exclude UPC from the SNPPs.
http://www.ons.gov.uk/file?uri=/peoplepopulationandcommunity/populationandmigration/popu
lationprojections/qmis/subnationalpopulationprojectionsqmi/qmisnnpsept15finalforpub_tcm77
-180681.pdf
This argument may be satisfactory for England as a whole but it does not tackle the issue of
the poor apportionment of flows amongst local authorities that is likely to be a major factor.
If however, the error is the third possibility identified by ONS, sub-national internal migration,
then while some of those improvements have been addressed through the use of HESA
data, the next set of improvements are yet to be incorporated.
There is no new evidence from ONS to demonstrate that the errors in the rolled forwards
methodology for MYEs have been resolved. Indeed, the methodological changes that ONS

Representations on Local Plan Expert Group
Objectively Assessed Housing Need
April 2016 A15
are working on will not be introduced until the MYEs of 2017 (publication expected June
2018) and therefore will not feed into the SNPPs until the cycle based on 2018 MYEs
(publication expected June 2019. The 2018 SNPPs are expected to be published in May
2020 - just one year before the next Census- with a further delay until converted to
households by CLG. It follows, therefore, that the errors inherent in the current rolled
forwards MYEs are still applicable and should be part of the consideration of any alternative
ten-year trends projection for calculating OAN.
In conclusion, it is better to prepare a ten-year projection solely for the purpose of calculating
OAN – not as an alternative to the ONS SNPP – by including a portion of 2001-11 UPC in
the migration base. That proportion and where to place it as either internal or international
migration flows should be based on analysis of the ONS Guidance Tool and the ONS
analysis of the results of the 2001 Census for areas of potential over-count. To make this
work there needs to be a pre-agreed strategy for ONS, or other demographic experts, to
allocate UPC appropriately in all districts, using the ONS UPC Tool and openly declared
rules.
S AND LABOUR MARKET ALIGNMENT

Representations on Local Plan Expert Group
Objectively Assessed Housing Need
April 2016 A16
APPENDIX C
FUTURE JOBS AND LABOUR MARKET ALIGNMENT

Representations on Local Plan Expert Group
Objectively Assessed Housing Need
April 2016 A17
Future jobs and labour market alignment
By Sunil Joshi
Experian Economics
1 Appendix 6 of the LPEG report advises on labour market balance as follows:
‘Where plan makers choose to set a ‘policy on’ housing requirement in excess of the FOAHN,
based on employment growth, this should be based on applying the changes in economic
activity rates that are projected in estimates produced annually by the Office for Budget
Responsibility, applied to the local baseline rates of economic activity. The existing commuting
ratio should be applied, based on a comparison of economically active residents drawn from
the Annual Population Survey and the number of jobs drawn from BRES’.
2 This advice involves a series of errors and omissions relating to economic forecasting models
and economic data. These are discussed below, roughly in order of their likely impact on the
result of the calculation.
3 The first problem is an omission and relates to economic activity rates. LPEG advises that
calculations of labour market balance should use activity rate forecasts from the OBR. The
OBR forecast only shows national figures, rather than rates for local areas. Therefore what
LPEG clearly means is that the OBR’s national trends (i.e. rates of change should be applied
to activity rates for individual areas.
4 The advice should add that, if the OBR’s national activity rate trends are used to forecast
labour supply, the forecast job demand used in the market balance calculation should be
based on the same trends in activity rates. Otherwise the calculation will be fundamentally
inconsistent, because:
Economic forecasting models incorporate a view about future trends in national activity
rates into their predictions of future jobs.
These trends in economic activity rates inform the prediction of national economic
performance and hence job growth, which largely drive forecasts of local job demand.
In the models as in real life, local and national activity rates follow similar trends,
because these rates everywhere are driven in large part by national factors – including
the rising State Pension Age and increasing longevity.
5 If inconsistent activity rates are used the calculation of labour market balance may be seriously
distorted, because assumptions on future activity rates have a large impact on forecasts of
local job demand.
6 Other significant problems with the advice include the following.
i. Using fixed activity rates is fundamentally unsound because:
- This requires that the increase in employment lead to a one-to-one reduction in
unemployment (and vice-versa);
- This is empirically not true and fails to take into the fact that activity rates are
endogenous responding to the state of the labour market:

Representations on Local Plan Expert Group
Objectively Assessed Housing Need
April 2016 A18
o As unemployment rises, discouragement rises and activity falls;
o As unemployment decreases, people are drawn into the market and
activity rates rise);
- Since the situation specifically involves a policy-on increase in employment, this
assumption cannot be made.
- As an assumption, it necessarily overstates the population required to satisfy a
particular increase in employment (since the inactive pool of workers are not
available to fill jobs).
ii. Using a fixed commuting ratio is fundamentally unsound for these reasons:
- A particular commuting ratio implies a certain structure to the forecast which
may be untenable:
o Each job provided in an area has implications regarding the labour force
in other areas (including the labour force available to fill jobs added
there):
A fixed number of additional workers must be added in the other area
(subject to flex in unemployment rates);
o Each worker provided in an area, it has implications regarding the
available jobs in other areas (including the jobs available in that area to
fill job there):
A fixed number of additional jobs must added in the other area (subject
to flex in unemployment rates);
- This structure may not be possible because (for instance):
o One area may be aging so that adding sufficient workers to maintain
commuting ratios may imply implausible activity rates (and potentially
contradict the fixed activity rate previously assumed);
o There may be no realistic way the additional jobs necessary to maintain
commuting ratios.
o Fundamentally, commuting ratios are likely to change (even ignoring
transport and preference issues which are hard to model) because of the
population and job demand factors being studied. These changes are
both cyclical and related to long-term trends.
- Commuting ratios must, accordingly, also be treated as endogenous (or at least
allowed to flex) in order to achieve realistic results.
7 Lesser problems with the advice are:
i. Using the economic activity rates from the Office of Budget Responsibility may not be
appropriate for this purpose for reasons we have set out elsewhere. In particular,
- They are prepared for the purpose of the FSR and not for planning purposes;

Representations on Local Plan Expert Group
Objectively Assessed Housing Need
April 2016 A19
- They have an unusual reduction in participation rates.
ii. Using raw BRES numbers to estimate jobs is problematic for the following reasons:
- BRES does not deal with agriculture satisfactorily;
- BRES does not address, and is not designed to address, self-employed workers
at all (it has some information on a subset of unincorporated self-employed
workers);
- BRES does not address Her Majesty’s Forces or Government Sponsored
Trainees;
- BRES’ coverage of the public sector is not adequate (the ONS uses the Public
Sector Census for Public Sector Jobs);
- Raw BRES numbers are inherently volatile because BRES is a survey and is not
constrained so as to be consistent with e.g. the Census or the APS;
- In particular, BRES on its own is not constrained so as to be consistent with the
official Workforce Jobs estimates at the Regional, GB and UK levels.
iii. BRES is a job count (not a people count as is APS employment). Some adjustments
must, accordingly, be made to address the issue of multiple jobs. Assuming a fixed-ratio
of multiple jobs does not take into account the facts that:
- The multiple jobs ratio varies over time;
- This variation is both:
o Cyclical (double jobbing decreases during times of economic hardship);
o A long-term shift (double-jobbing varies over time due to preferences and
policies regarding multiple jobbing and also demographic changes in the
labour force).
iv. It is not clear what is meant by the ‘existing commuting ratio’. If this is the commuting
ratio at the latest point in history, this is a very volatile measure, which can change
drastically between different dates. This is less of a problem if long-term averages or
endogenous commuting ratios are used. But using a fixed commuting ratio exacerbates
this problem, since results will vary arbitrarily based on the base date chosen.