reports of cases of tuberculosis to enhanced tuberculosis ......reports of cases of tuberculosis to...
TRANSCRIPT

Reports of cases of tuberculosis to enhanced tuberculosis surveillance systems: UK, 2000 to 2018 Official Statistics
Reports of cases of tuberculosis to enhanced tuberculosis surveillance systems: United Kingdom, 2000 to 2018
2
About Public Health England
Public Health England exists to protect and improve the nation’s health and wellbeing,
and reduce health inequalities. We do this through world-class science, knowledge and
intelligence, advocacy, partnerships and the delivery of specialist public health
services. We are an executive agency of the Department of Health, and are a distinct
delivery organisation with operational autonomy to advise and support government,
local authorities and the NHS in a professionally independent manner.
Public Health England
Wellington House
133-155 Waterloo Road
London SE1 8UG
Tel: 020 7654 8000
www.gov.uk/phe
Twitter: @PHE_uk
Facebook: www.facebook.com/PublicHealthEngland
© Crown copyright 2019
You may re-use this information (excluding logos) free of charge in any format or
medium, under the terms of the Open Government Licence v3.0. To view this licence,
visit OGL. Where we have identified any third party copyright information you will need
to obtain permission from the copyright holders concerned.
Published July 2019
PHE publications PHE supports the UN
gateway number: GW-594 Sustainable Development Goals

Reports of cases of tuberculosis to enhanced tuberculosis surveillance systems: United Kingdom, 2000 to 2018
3
Contents
Notes 4
Tuberculosis definition 4
Enhanced surveillance of tuberculosis 4
Data sources 5
Data type and methodology 5
Glossary 6
Table 1: Number of TB case notifications, rates and annual percentage change,
UK, 2000-2018 7
Table 2: Number of TB case notifications and rates by country, UK, 2000-2018 8
Table 3: Number of TB case notifications and rates by PHE Centrea, England,
2018 10
Table 4: Three-year average number of TB case notifications and rates by upper
tier local authority and local authority district, England, 2016-2018 11
Table 5: Number and proportion of culture confirmed TB cases and pulmonary TB
cases by country, UK, 2009-2018 21
Table 6: Number and proportion of TB casesa with drug resistance by country, UK,
2000-2018 22
Table 7: TB outcome at 12 months for drug sensitive TB cases with expected
treatment duration of <12 monthsa by country, UK, 2017 23
Table 8: Treatment completion at 12 months for drug sensitive TB cases with
expected treatment duration of <12 monthsa by country, UK, 2008-2017 24
Table 9: Last recorded TB outcome for the entire drug sensitive TB cohorta by
country, UK, 2017 25

Reports of cases of tuberculosis to enhanced tuberculosis surveillance systems: United Kingdom, 2000 to 2018
4
Notes
Tuberculosis definition
All new tuberculosis (TB) cases (including cases diagnosed post-mortem) that meet 1 of
the 2 following case definitions should be notified:
1. Culture confirmed case: culture confirmed disease, with speciation confirming
Mycobacterium tuberculosis complex (M. tuberculosis, M. bovis, M. africanum or
M. microti)
2. Clinically diagnosed case: in the absence of culture confirmation, a case that meets
the following criteria:
• a clinician’s judgement that the patient’s clinical and/or radiological signs
and/or symptoms are compatible with active TB, and
• a clinician’s decision to treat the patient with a full course of anti-TB therapy
for active TB
Enhanced surveillance of tuberculosis
Enhanced Tuberculosis Surveillance (ETS) was introduced in January 1999 in England
and Wales and the following year in Northern Ireland. The equivalent scheme in
Scotland, Enhanced Surveillance of Mycobacterial Infections (ESMI), was introduced in
2000. Data from the 2 systems is compiled for the purpose of UK reporting.
Clinical teams provide information on TB cases either directly through the web-based
ETS system entered at the clinic, or on a case report form entered onto the system at
the Health Protection Team level. Data includes notification details, demographic
information, clinical and microbiological information.
Data from all TB isolates identified in UK Mycobacteria Reference Laboratories
(excluding Scotland) is routinely imported into ETS and matched to case notifications
using patient identifiers common to both the laboratory isolate and the case notification.
In addition, external to the system, an annual probabilistic matching process based on
the patient identifiers is undertaken to identify additional matches. TB isolates in
Scotland are identified by the Scottish Mycobacteria Reference Laboratory and this data
is not matched using this method.

Reports of cases of tuberculosis to enhanced tuberculosis surveillance systems: United Kingdom, 2000 to 2018
5
Data sources
All TB data presented in this report for England, Wales and Northern Ireland is from
ETS, other than in London where cases are notified to the London TB Register (LTBR).
Data from the LTBR is routinely imported to ETS. Data for Scotland is from ESMI.
Population data used in the calculation of rates is from the Office for National Statistics
(ONS), incorporating data from the National Records of Scotland and Northern Ireland
Statistics and Research Agency.
Data was extracted from ETS at the beginning of March 2019, then cleaned and
validated by the end of June 2019. Data for Scotland in this report may differ slightly
from data presented in Scottish reports as cases that have transferred from England to
Scotland were deduplicated at UK level.
PHE has produced a detailed public health report with TB data for England to the end of
2018, which is available at:
https://www.gov.uk/government/collections/tuberculosis-and-other-mycobacterial-
diseases-diagnosis-screening-management-and-data
Reports produced by the Public Health Agency Northern Ireland are available at:
http://www.publichealth.hscni.net/directorate-public-health/health-protection/tuberculosis
Reports produced by Public Health Wales are available at:
http://www.wales.nhs.uk/sitesplus/888/page/43877
Reports produced by Health Protection Scotland are available at:
https://www.hps.scot.nhs.uk/a-to-z-of-topics/tuberculosis/
Data type and methodology
TB case notifications were reported by area of residence and by calendar year.
Overall TB rates per 100,000 population, as well as those by area of reporting, were
calculated using the mid-year population estimates provided by the ONS. Average annual
rates per 100,000 for the 3-year period were calculated by dividing the numerator (the
number of TB notifications in the 3-year period) by the denominator (the sum of the mid-
year population estimates for the same 3-year period) and multiplying by 100,000. A 95%
confidence interval for incidence was obtained assuming a Poisson distribution.
For the purposes of TB outcome reporting, the drug sensitive cohort is defined as all TB
cases, excluding those with multi-drug resistant/rifampicin resistant TB (MDR/RR-TB)

Reports of cases of tuberculosis to enhanced tuberculosis surveillance systems: United Kingdom, 2000 to 2018
6
(initial or acquired), and those treated with a second line regimen for MDR/RR-TB. TB
outcomes are reported at 12 months for drug sensitive cases with an expected duration
of treatment of less than 12 months. This group excludes cases with CNS disease, who
have an expected duration of treatment of 12 months. In addition, those with spinal,
cryptic disseminated or miliary disease are excluded from this group, as CNS
involvement cannot be reliably ruled out for the purposes of reporting. The last recorded
outcome is reported for the entire drug sensitive cohort.
Health Protection Scotland (HPS) aligned with the World Health Organization (WHO)
treatment outcome definitions in 2015, and outcomes in this report may differ to those in
the regional report.
Statistical analysis was carried out using Stata 15.
Glossary
Acquired resistance: resistance identified on repeat culture after 1 month of the first
specimen date. Cases with a change from a sensitive to resistant result following
treatment start are reclassified as acquired resistance, even if this is within the 1-
month period
CNS: central nervous system
CI: confidence interval (95% confidence intervals used)
DR cohort: drug resistant cohort is defined as cases that are culture confirmed with
initial and/or acquired multi-drug resistant/rifampicin resistant TB (MDR/RR-TB), as well
as those treated with a second line regimen for MDR/RR-TB without phenotypic DST
results or WGS resistance predictions
ESMI: Enhanced Surveillance of Mycobacterial Infections
ETS: Enhanced Tuberculosis Surveillance system
Initial resistance: a cultured isolate resistant to a particular drug within 1 month of the
first specimen date
Last recorded outcome: last known outcome, irrespective of when it occurred
LTBR: London TB Register
MDR-TB: multi-drug resistant TB is defined as resistance to at least isoniazid and
rifampicin, with or without resistance to other drugs
MDR/RR-TB: multi-drug resistant/rifampicin resistant TB is defined as resistance to
rifampicin including MDR-TB cases
ONS: Office for National Statistics
XDR-TB: extensively-drug resistant TB is defined as resistance to isoniazid and
rifampicin (MDR-TB), at least 1 injectable agent (capreomycin, kanamycin or amikacin)
and at least 1 fluoroquinolone (moxifloxacin, ofloxacin or ciprofloxacin)

Reports of cases of tuberculosis to enhanced tuberculosis surveillance systems: United Kingdom, 2000 to 2018
7
Table 1: Number of TB case notifications, rates and annual percentage change, UK, 2000 to 2018
Year
Total Annual change in case numbers (%)
Annual change in rate (%) Number of cases
Rate per 100,000 (95% CI)
2000 6,686 11.4 (11.1 - 11.6) - -
2001 6,760 11.4 (11.2 - 11.7) 1.1% 0.0%
2002 7,291 12.3 (12.0 - 12.6) 7.9% 7.9%
2003 7,219 12.1 (11.8 - 12.4) -1.0% -1.6%
2004 7,590 12.7 (12.4 - 12.9) 5.1% 5.0%
2005 8,283 13.7 (13.4 - 14.0) 9.1% 7.9%
2006 8,307 13.7 (13.4 - 14.0) 0.3% 0.0%
2007 8,259 13.5 (13.2 - 13.8) -0.6% -1.5%
2008 8,491 13.7 (13.4 - 14.0) 2.8% 1.5%
2009 8,870 14.2 (14.0 - 14.5) 4.5% 3.6%
2010 8,397 13.4 (13.1 - 13.7) -5.3% -5.6%
2011 8,919 14.1 (13.8 - 14.4) 6.2% 5.2%
2012 8,712 13.7 (13.4 - 14.0) -2.3% -2.8%
2013 7,871 12.3 (12.0 - 12.6) -9.7% -10.2%
2014 7,030 10.9 (10.6 - 11.1) -10.7% -11.4%
2015 6,229 9.6 (9.3 - 9.8) -11.4% -11.9%
2016 6,117 9.3 (9.1 - 9.6) -1.8% -3.1%
2017 5,537 8.4 (8.2-8.6) -9.5% -9.7%
2018 5,075 7.6 (7.4-7.9) -8.3% -9.5%
CI - confidence interval
Between 2000 and 2011, there was an overall increase in the number of cases and rate of
TB in the UK. Since 2011, there have been annual declines in the number of cases each
year, and between 2012 and 2018 the overall number has declined by 43.1%. Between
2017 and 2018 there was a 8.3% decline in the number of cases, to a rate of 7.6 per
100,000 (95% CI 7.4-7.9) (Table 1). The number and rate of TB cases in 2018 continues
to be the lowest since data from enhanced TB surveillance was first available in 2000.

Reports of cases of tuberculosis to enhanced tuberculosis surveillance systems: United Kingdom, 2000 to 2018
8
Table 2: Number of TB case notifications and rates by country, UK, 2000 to 2018
Year
England Scotland Wales Northern Ireland UK
Number of cases
Rate per 100,000 (95% CI)
Number of cases
Rate per 100,000 (95% CI)
Number of cases
Rate per 100,000 (95% CI)
Number of cases
Rate per 100,000 (95% CI)
Number of cases
Rate per 100,000 (95% CI)
2000 6,044 12.3 (12.0 - 12.6) 403 8.0 (7.2 - 8.8) 182 6.3 (5.4 - 7.2) 57 3.4 (2.6 - 4.4) 6,686 11.4 (11.1 - 11.6)
2001 6,169 12.5 (12.2 - 12.8) 351 6.9 (6.2 - 7.7) 183 6.3 (5.4 - 7.3) 57 3.4 (2.6 - 4.4) 6,760 11.4 (11.2 - 11.7)
2002 6,675 13.4 (13.1 - 13.8) 394 7.8 (7.0 - 8.6) 155 5.3 (4.5 - 6.2) 67 3.9 (3.1 - 5.0) 7,291 12.3 (12.0 - 12.6)
2003 6,631 13.3 (13.0 - 13.6) 367 7.2 (6.5 - 8.0) 164 5.6 (4.8 - 6.5) 57 3.3 (2.5 - 4.3) 7,219 12.1 (11.8 - 12.4)
2004 6,930 13.8 (13.5 - 14.1) 392 7.7 (7.0 - 8.5) 187 6.3 (5.4 - 7.3) 81 4.7 (3.8 - 5.9) 7,590 12.7 (12.4 - 12.9)
2005 7,658 15.1 (14.8 - 15.5) 365 7.1 (6.4 - 7.9) 185 6.2 (5.4 - 7.2) 75 4.3 (3.4 - 5.4) 8,283 13.7 (13.4 - 14.0)
2006 7,682 15.1 (14.7 - 15.4) 381 7.4 (6.7 - 8.2) 183 6.1 (5.3 - 7.1) 61 3.5 (2.7 - 4.5) 8,307 13.7 (13.4 - 14.0)
2007 7,577 14.7 (14.4 - 15.1) 409 7.9 (7.2 - 8.7) 204 6.8 (5.9 - 7.8) 69 3.9 (3.0 - 5.0) 8,259 13.5 (13.2 - 13.8)
2008 7,809 15.1 (14.7 - 15.4) 447 8.6 (7.8 - 9.4) 169 5.6 (4.8 - 6.5) 66 3.7 (2.9 - 4.7) 8,491 13.7 (13.4 - 14.0)
2009 8,112 15.5 (15.2 - 15.9) 486 9.3 (8.5 - 10.2) 213 7.0 (6.1 - 8.0) 59 3.3 (2.5 - 4.2) 8,870 14.2 (14.0 - 14.5)
2010 7,676 14.6 (14.3 - 14.9) 503 9.6 (8.7 - 10.4) 152 5.0 (4.2 - 5.8) 66 3.7 (2.8 - 4.7) 8,397 13.4 (13.1 - 13.7)
2011 8,280 15.6 (15.3 - 15.9) 447 8.4 (7.7 - 9.3) 131 4.3 (3.6 - 5.1) 61 3.4 (2.6 - 4.3) 8,919 14.1 (13.8 - 14.4)
2012 8,084 15.1 (14.8 - 15.4) 405 7.6 (6.9 - 8.4) 136 4.4 (3.7 - 5.2) 87 4.8 (3.8 - 5.9) 8,712 13.7 (13.4 - 14.0)
2013 7,266 13.5 (13.2 - 13.8) 390 7.3 (6.6 - 8.1) 142 4.6 (3.9 - 5.4) 73 4.0 (3.1 - 5.0) 7,871 12.3 (12.0 - 12.6)
2014 6,473 11.9 (11.6 - 12.2) 348 6.5 (5.8 - 7.2) 114 3.7 (3.0 - 4.4) 95 5.2 (4.2 - 6.3) 7,030 10.9 (10.6 - 11.1)
2015 5,736 10.5 (10.2 - 10.7) 316 5.9 (5.3 - 6.6) 116 3.7 (3.1 - 4.5) 61 3.3 (2.5 - 4.2) 6,229 9.6 (9.3 - 9.8)
2016 5,618 10.2 (9.9 - 10.4) 308 5.7 (5.1 - 6.4) 105 3.4 (2.8 - 4.1) 86 4.6 (3.7 - 5.7) 6,117 9.3 (9.1 - 9.6)
2017 5,070 9.1 (8.9 - 9.4) 293 5.4 (4.8 - 6.1) 104 3.3 (2.7 - 4.0) 70 3.7 (2.9 - 4.7) 5,537 8.4 (8.2 - 8.6)
2018 4,655 8.3 (8.1 - 8.6) 266 4.9 (4.3 - 5.5) 97 3.1 (2.5 - 3.8) 57 3.0 (2.3 - 3.9) 5,075 7.6 (7.4 - 7.9)
CI - confidence interval

Reports of cases of tuberculosis to enhanced tuberculosis surveillance systems: United Kingdom, 2000 to 2018
9
The majority of TB cases in the UK occurred in England, with the rate of TB being considerably higher than in the devolved
administrations. In 2018, there were 4,655 cases in England, a decline of 43.8% since the peak of 8,280 notifications in 2011, with a
rate of TB of 8.3 per 100,000 (Table 2). Similarly, in Scotland an annual decline in numbers has been observed since a peak of 503
notifications in 2010, to 266 cases and a rate of TB of 4.9 per 100,000 in 2018. In Wales, although the number of cases and rate of TB
has fluctuated annually there has been an overall decrease, with the rate of TB halving between 2000 and 2018 (6.3 per 100,000 vs
3.1 per 100,000) and the number of cases falling below 100 for the first time. Northern Ireland has both a small number of cases and
low rate of TB, with annual fluctuations. In 2018, there were 57 cases, the lowest number since 2003, and a rate of 3.0 per 100,000 –
the lowest recorded rate.

Reports of cases of tuberculosis to enhanced tuberculosis surveillance systems: United Kingdom, 2000 to 2018
10
Table 3: Number of TB case notifications and rates by PHE Centrea, England, 2018
PHE Centre Number of
cases Rate per 100,000
(95%CI)
London 1,691 19.0 (18.1 - 19.9)
West Midlands 613 10.4 (9.6 - 11.2)
South East 508 5.7 (5.2 - 6.3)
North West 479 6.6 (6.0 - 7.2)
East of England 361 5.2 (4.7 - 5.8)
Yorkshire and the Humber 352 6.4 (5.8 - 7.1)
East Midlands 338 7.0 (6.3 - 7.8)
South West 195 2.4 (2.1 - 2.8)
North East 118 4.4 (3.7 - 5.3)
a Ordered by decreasing total number of cases in 2018
CI - confidence interval
As in previous years, London PHE Centre (PHEC) accounted for the highest number of
TB cases in England during 2018, followed by the West Midlands PHEC. The rate of TB
per 100,000 population in the London PHEC was almost 8-times higher than that
reported for the South West PHEC, which had the lowest rate.

Reports of cases of tuberculosis to enhanced tuberculosis surveillance systems: United Kingdom, 2000 to 2018
11
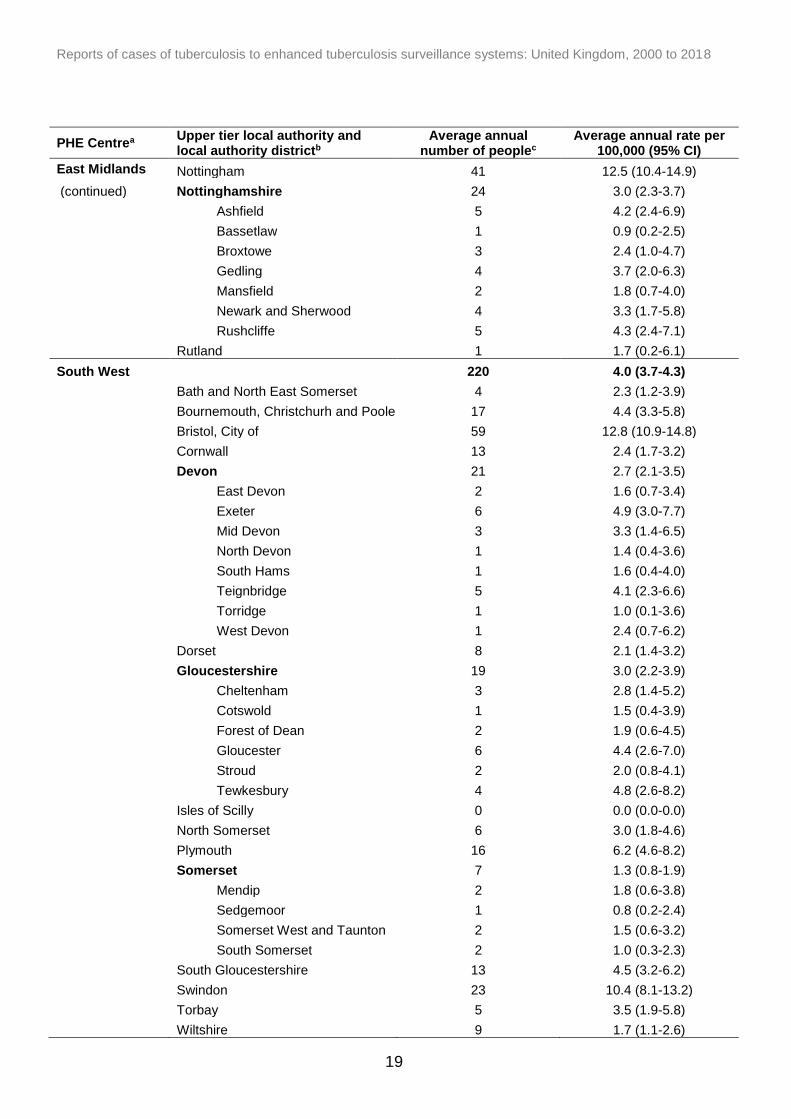
Table 4: Three-year average number of TB case notifications and rates by upper tier local authority and local authority district, England, 2016 to 2018
PHE Centrea Upper tier local authority and local authority districtb
Average annual number of peoplec
Average annual rate per 100,000 (95% CI)
London
1,932 21.9 (21.3-22.4)
Barking and Dagenham 58 27.4 (23.5-31.8)
Barnet 64 16.6 (14.3-19.1)
Bexley 29 11.8 (9.4-14.5)
Brent 150 45.6 (41.5-50.0)
Bromley 21 6.4 (4.9-8.2)
Camden 39 15.4 (12.8-18.5)
City of London 2 21.2 (6.9-49.4)
Croydon 74 19.2 (16.8-22.0)
Ealing 125 36.4 (32.8-40.3)
Enfield 60 18.1 (15.6-21.0)
Greenwich 66 23.3 (20.2-26.8)
Hackney 62 22.3 (19.2-25.8)
Hammersmith and Fulham 29 16.0 (12.8-19.7)
Haringey 59 21.7 (18.7-25.2)
Harrow 79 31.6 (27.7-35.9)
Havering 27 10.4 (8.3-13.0)
Hillingdon 76 25.0 (21.9-28.5)
Hounslow 93 34.5 (30.6-38.8)
Islington 38 16.0 (13.2-19.2)
Kensington and Chelsea 24 15.1 (11.8-19.1)
Kingston upon Thames 11 6.5 (4.5-9.1)
Lambeth 52 16.1 (13.7-18.9)
Lewisham 55 18.1 (15.5-21.1)
Merton 36 17.3 (14.2-20.9)
Newham 172 49.3 (45.1-53.8)
Redbridge 107 35.4 (31.6-39.5)
Richmond upon Thames 12 6.0 (4.1-8.3)
Southwark 64 20.5 (17.7-23.6)
Sutton 21 10.5 (8.1-13.4)
Tower Hamlets 72 23.4 (20.4-26.8)
Waltham Forest 71 25.7 (22.3-29.3)
Wandsworth 49 15.0 (12.7-17.7)
Westminster 37 14.8 (12.2-17.9)

Reports of cases of tuberculosis to enhanced tuberculosis surveillance systems: United Kingdom, 2000 to 2018
12
PHE Centrea Upper tier local authority and local authority districtb
Average annual number of peoplec
Average annual rate per 100,000 (95% CI)
West Midlands 664 11.3 (10.8-11.8)
Birmingham 248 21.9 (20.3-23.5)
Coventry 80 22.3 (19.6-25.3)
Dudley 23 7.3 (5.7-9.2)
Herefordshire, County of 5 2.8 (1.6-4.5)
Sandwell 73 22.5 (19.6-25.6)
Shropshire 5 1.7 (1.0-2.7)
Solihull 10 4.7 (3.2-6.7)
Staffordshire 31 3.6 (2.9-4.4)
Cannock Chase 4 3.7 (1.8-6.6)
East Staffordshire 6 5.4 (3.2-8.4)
Lichfield 1 1.0 (0.2-2.8)
Newcastle-under-Lyme 8 6.2 (4.0-9.2)
South Staffordshire 3 2.7 (1.2-5.1)
Stafford 5 4.0 (2.3-6.4)
Staffordshire Moorlands 1 1.4 (0.4-3.5)
Tamworth 2 3.0 (1.2-6.3)
Stoke-on-Trent 27 10.6 (8.4-13.2)
Telford and Wrekin 7 4.0 (2.5-6.1)
Walsall 46 16.4 (13.7-19.3)
Warwickshire 31 5.5 (4.4-6.7)
North Warwickshire 2 3.6 (1.5-7.5)
Nuneaton and Bedworth 10 7.8 (5.3-11.1)
Rugby 6 5.6 (3.3-8.9)
Stratford-on-Avon 4 2.9 (1.5-5.2)
Warwick 9 6.4 (4.2-9.3)
Wolverhampton 56 21.5 (18.4-25.1)
Worcestershire 20 3.4 (2.6-4.4)
Bromsgrove 4 4.4 (2.4-7.6)
Malvern Hills 2 2.2 (0.7-5.0)
Redditch 4 5.1 (2.7-8.7)
Worcester 4 3.9 (2.0-6.8)
Wychavon 5 3.7 (2.0-6.2)
Wyre Forest 1 1.0 (0.2-2.9)

Reports of cases of tuberculosis to enhanced tuberculosis surveillance systems: United Kingdom, 2000 to 2018
13
PHE Centrea Upper tier local authority and local authority districtb
Average annual number of peoplec
Average annual rate per 100,000 (95% CI)
South East 534 6.1 (5.8-6.4)
Bracknell Forest 5 4.1 (2.3-6.8)
Brighton and Hove 18 6.1 (4.6-8.0)
Buckinghamshire 48 9.0 (7.6-10.6)
Aylesbury Vale 15 7.5 (5.4-10.0)
Chiltern 7 7.0 (4.3-10.8)
South Bucks 4 5.2 (2.6-9.4)
Wycombe 23 13.3 (10.4-16.9)
East Sussex 15 2.8 (2.0-3.7)
Eastbourne 4 3.9 (2.0-6.8)
Hastings 4 3.9 (2.0-7.1)
Lewes 2 2.3 (0.9-4.7)
Rother 1 1.4 (0.4-3.6)
Wealden 4 2.5 (1.3-4.4)
Hampshire 61 4.4 (3.8-5.1)
Basingstoke and Deane 10 5.5 (3.7-7.9)
East Hampshire 4 3.3 (1.7-5.8)
Eastleigh 4 3.3 (1.8-5.7)
Fareham 2 2.0 (0.8-4.1)
Gosport 1 1.6 (0.4-4.0)
Hart 2 2.1 (0.8-4.6)
Havant 3 2.4 (1.1-4.6)
New Forest 3 1.7 (0.8-3.2)
Rushmoor 21 22.3 (17.2-28.5)
Test Valley 6 4.8 (2.9-7.6)
Winchester 4 3.0 (1.5-5.3)
Isle of Wight 2 1.4 (0.5-3.1)
Kent 95 6.1 (5.4-6.9)
Ashford 10 8.1 (5.5-11.5)
Canterbury 8 5.1 (3.3-7.5)
Dartford 10 9.6 (6.5-13.7)
Dover 6 5.2 (3.1-8.2)
Folkestone and Hythe 7 6.0 (3.6-9.2)
Gravesham 17 15.7 (11.6-20.7)
Maidstone 16 9.5 (7.0-12.6)
Sevenoaks 4 3.3 (1.7-5.8)
Shepway 6 3.9 (2.3-6.2)
Swale 6 4.2 (2.5-6.7)
Thanet 2 1.6 (0.6-3.4)
Tonbridge and Malling 3 2.5 (1.2-4.8)
Tunbridge Wells 14 5.0 (3.6-6.8)
Medway 534 6.1 (5.8-6.4)

Reports of cases of tuberculosis to enhanced tuberculosis surveillance systems: United Kingdom, 2000 to 2018
14
PHE Centrea Upper tier local authority and local authority districtb
Average annual number of peoplec
Average annual rate per 100,000 (95% CI)
South East Oxfordshire 40 5.9 (4.9-7.0)
(continued) Cherwell 10 6.8 (4.6-9.7)
Oxford 22 14.4 (11.2-18.3)
South Oxfordshire 3 1.9 (0.8-3.8)
Vale of White Horse 3 2.0 (0.9-4.0)
West Oxfordshire 2 2.1 (0.9-4.4)
Portsmouth 12 5.6 (3.9-7.7)
Reading 29 17.8 (14.3-21.9)
Slough 44 29.8 (25.0-35.4)
Southampton 32 12.7 (10.3-15.5)
Surrey 56 4.7 (4.0-5.5)
Elmbridge 4 2.9 (1.5-5.1)
Epsom and Ewell 6 7.1 (4.2-11.4)
Guildford 4 2.9 (1.6-5.0)
Mole Valley 3 3.1 (1.3-6.0)
Reigate and Banstead 7 4.8 (3.0-7.3)
Runnymede 4 4.6 (2.4-8.0)
Spelthorne 6 6.1 (3.6-9.6)
Surrey Heath 4 4.1 (2.1-7.4)
Tandridge 3 3.4 (1.6-6.5)
Waverley 5 4.0 (2.2-6.6)
Woking 10 10.2 (6.9-14.5)
West Berkshire 7 4.2 (2.6-6.5)
West Sussex 35 4.1 (3.3-4.9)
Adur 2 3.7 (1.5-7.5)
Arun 4 2.5 (1.3-4.4)
Chichester 2 1.7 (0.6-3.6)
Crawley 16 14.0 (10.3-18.6)
Horsham 3 2.1 (1.0-4.1)
Mid Sussex 3 2.2 (1.1-4.1)
Worthing 4 4.0 (2.1-6.8)
Windsor and Maidenhead 12 8.0 (5.6-11.1)
Wokingham 10 6.0 (4.1-8.6)

Reports of cases of tuberculosis to enhanced tuberculosis surveillance systems: United Kingdom, 2000 to 2018
15
PHE Centrea Upper tier local authority and local authority districtb
Average annual number of peoplec
Average annual rate per 100,000 (95% CI)
North West 532 7.3 (7.0-7.7)
Blackburn with Darwen 29 19.7 (15.8-24.3)
Blackpool 10 7.4 (5.0-10.5)
Bolton 43 15.0 (12.5-17.8)
Bury 15 7.7 (5.6-10.4)
Cheshire East 10 2.6 (1.8-3.8)
Cheshire West and Chester 7 2.1 (1.3-3.2)
Cumbria 9 1.7 (1.1-2.5)
Allerdale 3 3.4 (1.6-6.3)
Barrow-in-Furness 1 1.5 (0.3-4.3)
Carlisle 1 1.2 (0.3-3.2)
Copeland 1 1.5 (0.3-4.2)
Eden 0 0.0 (0.0-0.0)
South Lakeland 2 1.9 (0.7-4.2)
Halton 1 1.0 (0.3-2.7)
Knowsley 1 0.7 (0.1-2.0)
Lancashire 73 6.1 (5.3-7.0)
Burnley 9 10.2 (6.7-14.9)
Chorley 3 2.6 (1.2-4.9)
Fylde 1 1.3 (0.3-3.7)
Hyndburn 7 8.3 (5.1-12.8)
Lancaster 9 6.1 (4.0-8.9)
Pendle 13 13.9 (9.9-19.1)
Preston 21 14.6 (11.2-18.7)
Ribble Valley 2 2.8 (0.9-6.5)
Rossendale 2 3.3 (1.3-6.8)
South Ribble 2 2.1 (0.9-4.4)
West Lancashire 2 1.5 (0.5-3.4)
Wyre 4 3.3 (1.7-5.9)
Liverpool 34 7.0 (5.7-8.5)
Manchester 115 21.2 (19.0-23.5)
Oldham 37 15.7 (12.9-18.9)
Rochdale 29 13.4 (10.8-16.6)
Salford 23 9.2 (7.1-11.6)
Sefton 6 2.3 (1.4-3.6)
St. Helens 2 1.1 (0.4-2.4)
Stockport 16 5.5 (4.1-7.3)
Tameside 25 11.0 (8.6-13.8)
Trafford 21 8.9 (6.9-11.4)
Warrington 7 3.3 (2.1-5.1)
Wigan 9 2.9 (1.9-4.2)
Wirral 9 2.8 (1.8-4.1)

Reports of cases of tuberculosis to enhanced tuberculosis surveillance systems: United Kingdom, 2000 to 2018
16
PHE Centrea Upper tier local authority and local authority districtb
Average annual number of peoplec
Average annual rate per 100,000 (95% CI)
East of England 400 6.2 (5.9-6.6)
Bedford 15 8.6 (6.3-11.6)
Cambridgeshire 40 6.2 (5.2-7.4)
Cambridge 17 13.9 (10.3-18.2)
East Cambridgeshire 3 3.4 (1.5-6.4)
Fenland 4 4.3 (2.3-7.4)
Huntingdonshire 7 4.0 (2.5-6.1)
South Cambridgeshire 9 5.5 (3.6-8.1)
Central Bedfordshire 6 2.0 (1.2-3.2)
Essex 59 4.0 (3.4-4.6)
Basildon 11 6.1 (4.2-8.6)
Braintree 2 1.3 (0.5-2.9)
Brentwood 3 3.9 (1.8-7.4)
Castle Point 2 2.2 (0.8-4.8)
Chelmsford 5 2.7 (1.5-4.5)
Colchester 7 3.5 (2.1-5.4)
Epping Forest 4 3.1 (1.6-5.4)
Harlow 13 15.1 (10.7-20.6)
Maldon 2 3.1 (1.1-6.8)
Rochford 2 2.3 (0.9-5.0)
Tendring 4 2.5 (1.3-4.5)
Uttlesford 4 4.9 (2.6-8.4)
Hertfordshire 81 6.8 (6.0-7.8)
Broxbourne 7 7.6 (4.7-11.5)
Dacorum 7 4.8 (3.0-7.2)
East Hertfordshire 6 3.9 (2.2-6.2)
Hertsmere 12 11.2 (7.8-15.6)
North Hertfordshire 6 4.8 (2.9-7.4)
St Albans 7 4.5 (2.8-7.0)
Stevenage 8 8.8 (5.5-13.1)
Three Rivers 6 6.8 (4.1-10.7)
Watford 13 13.4 (9.6-18.4)
Welwyn Hatfield 9 7.1 (4.6-10.4)
Luton 54 25.0 (21.3-29.1)
Milton Keynes 28 10.3 (8.2-12.8)

Reports of cases of tuberculosis to enhanced tuberculosis surveillance systems: United Kingdom, 2000 to 2018
17
PHE Centrea Upper tier local authority and local authority districtb
Average annual number of peoplec
Average annual rate per 100,000 (95% CI)
East of England Norfolk 34 3.8 (3.1-4.6)
(continued) Breckland 4 2.9 (1.5-5.1)
Broadland 0 0.3 (0.0-1.4)
Great Yarmouth 13 12.8 (9.0-17.5)
King's Lynn and West Norfolk 7 4.4 (2.7-6.8)
North Norfolk 1 1.0 (0.2-2.8)
Norwich 8 5.9 (3.8-8.8)
South Norfolk 1 0.7 (0.2-2.2)
Peterborough 40 19.9 (16.5-23.9)
Southend-on-Sea 10 5.7 (3.9-8.1)
Suffolk 23 3.1 (2.4-3.9)
Babergh 2 1.8 (0.6-4.3)
East Suffolk 6 2.6 (1.5-4.0)
Ipswich 7 5.3 (3.3-8.0)
Mid Suffolk 1 1.3 (0.4-3.4)
West Suffolk 7 3.7 (2.3-5.8)
Thurrock 11 6.6 (4.6-9.3)
Yorkshire and the Humber 373 6.8 (6.4-7.2)
Barnsley 5 2.2 (1.3-3.6)
Bradford 85 15.9 (14.0-18.0)
Calderdale 13 6.2 (4.4-8.5)
Doncaster 14 4.4 (3.2-6.0)
East Riding of Yorkshire 8 2.3 (1.4-3.4)
Kingston upon Hull, City of 16 6.0 (4.4-8.0)
Kirklees 58 13.3 (11.4-15.4)
Leeds 68 8.7 (7.5-9.9)
North East Lincolnshire 4 2.7 (1.4-4.6)
North Lincolnshire 6 3.5 (2.1-5.5)
North Yorkshire 12 2.0 (1.4-2.8)
Craven 1 1.8 (0.4-5.2)
Hambleton 2 2.2 (0.8-4.8)
Harrogate 2 1.2 (0.5-2.7)
Richmondshire 3 6.2 (3.0-11.4)
Ryedale 0 0.0 (0.0-0.0)
Scarborough 3 2.5 (1.1-4.8)
Selby 1 1.5 (0.4-3.9)
Rotherham 13 4.9 (3.5-6.7)
Sheffield 52 8.9 (7.6-10.5)
Wakefield 16 4.6 (3.4-6.1)
York 3 1.6 (0.8-2.9)

Reports of cases of tuberculosis to enhanced tuberculosis surveillance systems: United Kingdom, 2000 to 2018
18
PHE Centrea Upper tier local authority and local authority districtb
Average annual number of peoplec
Average annual rate per 100,000 (95% CI)
East Midlands 343 7.2 (6.8-7.6)
Derby 29 11.4 (9.2-14.1)
Derbyshire 9 1.1 (0.7-1.6)
Amber Valley 1 0.5 (0.1-1.9)
Bolsover 0 0.4 (0.0-2.4)
Chesterfield 2 2.2 (0.9-4.6)
Derbyshire Dales 1 1.4 (0.3-4.1)
Erewash 2 1.7 (0.6-3.8)
High Peak 1 1.1 (0.2-3.2)
North East Derbyshire 1 1.0 (0.2-2.9)
South Derbyshire 0 0.3 (0.0-1.8)
Leicester 136 38.6 (35.0-42.6)
Leicestershire 26 3.8 (3.0-4.8)
Blaby 3 3.4 (1.6-6.2)
Charnwood 12 6.5 (4.5-9.0)
Harborough 3 2.9 (1.3-5.7)
Hinckley and Bosworth 2 2.1 (0.8-4.3)
Melton 1 1.3 (0.2-4.7)
North West Leicestershire 1 1.3 (0.4-3.4)
Oadby and Wigston 4 7.6 (4.1-13.1)
Lincolnshire 28 3.7 (3.0-4.6)
Boston 10 14.6 (9.8-20.8)
East Lindsey 3 2.4 (1.1-4.4)
Lincoln 5 4.7 (2.6-8.0)
North Kesteven 2 1.7 (0.6-3.8)
South Holland 3 3.6 (1.7-6.6)
South Kesteven 4 2.6 (1.3-4.6)
West Lindsey 1 1.1 (0.2-3.1)
Northamptonshire 48 6.5 (5.5-7.6)
Corby 4 6.2 (3.3-10.7)
Daventry 2 2.8 (1.1-5.8)
East Northamptonshire 3 3.2 (1.5-6.1)
Kettering 6 6.3 (3.8-9.9)
Northampton 23 10.4 (8.1-13.1)
South Northamptonshire 3 3.3 (1.5-6.2)
Wellingborough 6 7.2 (4.2-11.5)
Reports of cases of tuberculosis to enhanced tuberculosis surveillance systems: United Kingdom, 2000 to 2018
19
PHE Centrea Upper tier local authority and local authority districtb
Average annual number of peoplec
Average annual rate per 100,000 (95% CI)
East Midlands Nottingham 41 12.5 (10.4-14.9)
(continued) Nottinghamshire 24 3.0 (2.3-3.7)
Ashfield 5 4.2 (2.4-6.9)
Bassetlaw 1 0.9 (0.2-2.5)
Broxtowe 3 2.4 (1.0-4.7)
Gedling 4 3.7 (2.0-6.3)
Mansfield 2 1.8 (0.7-4.0)
Newark and Sherwood 4 3.3 (1.7-5.8)
Rushcliffe 5 4.3 (2.4-7.1)
Rutland 1 1.7 (0.2-6.1)
South West 220 4.0 (3.7-4.3)
Bath and North East Somerset 4 2.3 (1.2-3.9)
Bournemouth, Christchurh and Poole 17 4.4 (3.3-5.8)
Bristol, City of 59 12.8 (10.9-14.8)
Cornwall 13 2.4 (1.7-3.2)
Devon 21 2.7 (2.1-3.5)
East Devon 2 1.6 (0.7-3.4)
Exeter 6 4.9 (3.0-7.7)
Mid Devon 3 3.3 (1.4-6.5)
North Devon 1 1.4 (0.4-3.6)
South Hams 1 1.6 (0.4-4.0)
Teignbridge 5 4.1 (2.3-6.6)
Torridge 1 1.0 (0.1-3.6)
West Devon 1 2.4 (0.7-6.2)
Dorset 8 2.1 (1.4-3.2)
Gloucestershire 19 3.0 (2.2-3.9)
Cheltenham 3 2.8 (1.4-5.2)
Cotswold 1 1.5 (0.4-3.9)
Forest of Dean 2 1.9 (0.6-4.5)
Gloucester 6 4.4 (2.6-7.0)
Stroud 2 2.0 (0.8-4.1)
Tewkesbury 4 4.8 (2.6-8.2)
Isles of Scilly 0 0.0 (0.0-0.0)
North Somerset 6 3.0 (1.8-4.6)
Plymouth 16 6.2 (4.6-8.2)
Somerset 7 1.3 (0.8-1.9)
Mendip 2 1.8 (0.6-3.8)
Sedgemoor 1 0.8 (0.2-2.4)
Somerset West and Taunton 2 1.5 (0.6-3.2)
South Somerset 2 1.0 (0.3-2.3)
South Gloucestershire 13 4.5 (3.2-6.2)
Swindon 23 10.4 (8.1-13.2)
Torbay 5 3.5 (1.9-5.8)
Wiltshire 9 1.7 (1.1-2.6)

Reports of cases of tuberculosis to enhanced tuberculosis surveillance systems: United Kingdom, 2000 to 2018
20
PHE Centrea Upper tier local authority and local authority districtb
Average annual number of peoplec
Average annual rate per 100,000 (95% CI)
North East 116 4.4 (3.9-4.9)
County Durham 10 2.0 (1.3-2.8)
Darlington 5 4.4 (2.4-7.4)
Gateshead 9 4.4 (2.9-6.5)
Hartlepool 4 3.9 (2.0-7.1)
Middlesbrough 15 10.9 (8.0-14.6)
Newcastle upon Tyne 34 11.6 (9.4-14.0)
North Tyneside 6 3.1 (1.9-4.8)
Northumberland 5 1.7 (1.0-2.7)
Redcar and Cleveland 3 2.4 (1.2-4.5)
South Tyneside 3 2.2 (1.1-4.1)
Stockton-on-Tees 10 5.1 (3.4-7.3)
Sunderland 11 3.8 (2.6-5.4)
a Ordered by decreasing total number of cases in 2018 b Those highlighted in bold are upper-tier local authority districts only, those indented are local authority district only, and those neither highlighted nor indented are both an upper-tier local authority and a local authority district c Average number of cases in a local authority district may not be the same as the sum of the average number of cases in the corresponding upper tier local authority due to rounding CI (confidence intervals)

Reports of cases of tuberculosis to enhanced tuberculosis surveillance systems: United Kingdom, 2000 to 2018
21
Table 5: Number and proportion of culture confirmed TB cases and pulmonary TB cases by country, UK, 2009-2018
Year
England Scotland Wales Northern Ireland UK
Culture confirmed TB cases
Culture confirmed pulmonary TB cases
Culture confirmed TB cases
Culture confirmed pulmonary TB cases
Culture confirmed TB
cases
Culture confirmed pulmonary TB cases
Culture confirmed TB cases
Culture confirmed pulmonary TB cases
Culture confirmed TB cases
Culture confirmed pulmonary TB cases
n % n % n % n % n % n % n % n % n % n %
2009 4,670 57.6 3,023 68.1 325 66.9 215 74.4 118 55.4 79 62.7 49 83.1 38 86.4 5,162 58.2 3,355 68.5
2010 4,621 60.2 2,902 70.7 325 64.6 228 70.2 107 70.4 72 76.6 54 81.8 35 94.6 5,107 60.8 3,237 71.0
2011 5,049 61.0 3,139 72.0 295 66.0 195 68.9 94 71.8 57 79.2 47 77.0 38 80.9 5,485 61.5 3,429 72.0
2012 4,900 60.6 3,012 70.6 276 68.1 165 75.0 105 77.2 63 79.7 53 60.9 36 76.6 5,334 61.2 3,276 71.0
2013 4,396 60.5 2,770 73.3 241 61.8 156 71.9 87 61.3 65 74.7 45 61.6 29 69.0 4,769 60.6 3,020 73.2
2014 3,933 60.8 2,521 73.2 236 67.8 162 70.7 81 71.1 55 85.9 64 67.4 47 70.1 4,314 61.4 2,785 73.2
2015 3,507 61.1 2,296 74.4 209 66.1 130 78.3 80 69.0 61 91.0 39 63.9 33 82.5 3,835 61.6 2,520 75.0
2016 3,588 63.9 2,374 77.0 211 68.5 131 72.4 81 77.1 66 86.8 56 65.1 39 78.0 3,936 64.3 2,610 77.0
2017 3,171 62.5 2,129 75.6 198 67.6 134 77.0 75 72.1 52 85.2 47 67.1 34 70.8 3,491 63.0 2,349 75.8
2018 2,850 61.2 1,972 74.0 178 66.9 126 76.4 78 80.4 67 88.2 32 56.1 24 55.8 3,138 61.8 2,189 74.3
Over the last 10 years, the proportion of TB cases that were culture confirmed in the UK has remained relatively stable at around 60%,
with some annual fluctuations. Wales generally had the greatest proportion of culture confirmed TB cases ,which increased from
55.4% to 80.4% between 2009 and 2018, respectively. In Northern Ireland, the proportion decreased from 67.1% in 2017 to 56.1% in
2018, after remaining relatively high in previous years. The proportion for Scotland (2018: 66.9%) and England (2018: 61.2%) has
remained relatively consistent throughtout the 10-year period. Overall, culture confirmation was higher in pulmonary TB cases, with
almost three-quarters of these being culture confirmed in the UK during 2018.

Reports of cases of tuberculosis to enhanced tuberculosis surveillance systems: United Kingdom, 2000 to 2018
22
Table 6: Number and proportion of TB casesa with drug resistance by country, UK, 2000-2018
Year
England Scotland Wales Northern Ireland UK
INH-R TB casesᵇ
MDR/RR-TB cases
INH-R TB casesᵇ
MDR/RR-TB cases
INH-R TB casesᵇ
MDR/RR-TB cases
INH-R TB casesᵇ
MDR/RR-TB cases
INH-R TB casesᵇ
MDR/RR-TB cases
XDR-TB casesᶜ
DR cohortᵈ
n % n % n % n % n % n % n % n % n % n % n % N
2000 150 5.4 41 1.5 11 3.8 0 0.0 2 1.9 0 0.0 0 0.0 0 0.0 163 5.1 41 1.3 1 0.03 41
2001 187 5.9 33 1.0 7 2.8 2 0.8 2 2.6 3 3.8 0 0.0 1 2.7 196 5.6 39 1.1 0 0.00 44
2002 238 6.2 45 1.2 9 3.5 1 0.4 6 7.5 1 1.3 2 5.6 0 0.0 255 6.1 47 1.1 0 0.00 50
2003 232 6.1 68 1.8 8 3.0 1 0.4 6 5.5 3 2.8 1 3.2 0 0.0 247 5.8 72 1.7 1 0.02 74
2004 249 6.2 61 1.5 14 4.6 1 0.3 5 5.0 2 2.0 1 1.6 1 1.6 269 6.0 65 1.4 0 0.00 75
2005 281 6.2 56 1.2 11 4.1 0 0.0 1 0.8 2 1.7 0 0.0 1 2.2 293 5.9 59 1.2 0 0.00 62
2006 284 6.1 74 1.6 12 4.2 2 0.7 5 3.9 1 0.8 1 2.2 2 4.4 302 5.9 79 1.6 0 0.00 86
2007 254 5.8 63 1.4 8 2.8 5 1.7 10 7.9 4 3.2 2 3.5 3 5.3 274 5.6 75 1.5 0 0.00 83
2008 217 4.8 68 1.5 12 3.8 3 1.0 3 3.0 3 3.0 2 3.9 1 2.0 234 4.7 75 1.5 2 0.04 85
2009 268 5.8 70 1.5 18 5.6 2 0.6 6 5.1 1 0.8 0 0.0 0 0.0 292 5.7 73 1.4 2 0.04 80
2010 228 5.0 75 1.7 15 4.6 1 0.3 6 5.6 0 0.0 2 3.9 1 2.0 251 5.0 77 1.5 3 0.06 81
2011 295 5.9 89 1.8 18 6.1 2 0.7 1 1.1 2 2.1 1 2.3 2 4.5 315 5.8 95 1.8 6 0.11 101
2012 255 5.3 86 1.8 13 4.7 2 0.7 9 8.7 1 1.0 3 5.7 0 0.0 280 5.3 89 1.7 2 0.04 97
2013 232 5.4 78 1.8 11 4.7 5 2.1 6 6.9 2 2.3 6 13.3 0 0.0 255 5.5 85 1.8 3 0.06 93
2014 214 5.5 57 1.5 17 7.2 2 0.9 7 8.6 3 3.7 3 4.7 1 1.6 241 5.6 63 1.5 3 0.07 79
2015 192 5.5 54 1.5 9 4.3 2 1.0 6 7.5 1 1.3 3 7.7 0 0.0 210 5.5 57 1.5 10 0.26 70
2016 191 5.4 61 1.7 7 3.3 1 0.5 2 2.5 3 3.7 2 3.6 3 5.4 202 5.2 68 1.7 7 0.18 78
2017 180 5.7 54 1.7 12 6.1 3 1.5 7 9.6 3 4.1 1 2.1 0 0.0 200 5.8 60 1.7 4 0.12 69
2018 185 6.6 44 1.6 13 7.5 2 1.1 3 4.2 2 2.8 3 9.4 0 0.0 204 6.6 48 1.5 4 0.13 51
a Culture-confirmed TB cases with results for at least isoniazid and rifampicin. For all countries results are from phenotypic DSTs, with some cases in England having WGS resistance predictions b Cases who are resistant to isoniazid without MDR-TB c One of the XDR-TB cases was notified in Northern Ireland in 2010, all others were notified in England d The drug resistant (DR) cohort includes cases with confirmed initial or acquired MDR/RR-TB, as well as those treated with a second line regimen for MDR/RR-TB
(without phenotypic DST results or WGS resistance predictions)
Overall, the proportion of culture confirmed TB cases with isoniazid resistance without MDR-TB has slightly increased whilst the
proportion for those with MDR/RR-TB has remained relatively stable in the UK since 2000. The majority of MDR/RR-TB cases in the
UK were from England. Four confirmed cases of XDR-TB were notified in the UK in 2018, all of which were notified in England.

Reports of cases of tuberculosis to enhanced tuberculosis surveillance systems: United Kingdom, 2000 to 2018
23
Table 7: TB outcome at 12 months for drug sensitive TB cases with expected treatment duration of <12 monthsa by country, UK, 2017
Country Completed Died Lost to follow-up Still on treatment Stopped Not evaluatedb Total
n % n % n % n % n % n % n
England 3,796 84.7 204 4.6 183 4.1 209 4.7 55 1.2 35 0.8 4,482
Scotland 216 79.1 19 7.0 2 0.7 3 1.1 1 0.4 32 11.7 273
Wales 67 70.5 11 11.6 7 7.4 8 8.4 0 0.0 2 2.1 95
Northern Ireland 49 77.8 3 4.8 4 6.3 1 1.6 0 0.0 6 9.5 63
UK 4,128 84.0 237 4.8 196 4.0 221 4.5 56 1.1 75 1.5 4,913
a Excludes initial and acquired resistance to rifampicin and MDR-TB cases and those treated with an MDR-TB regimen. Also excludes those with CNS, spinal, miliary or cryptic disseminated TB b Not evaluated includes unknown and transferred out
For drug sensitive TB cases notified in 2017, with an expected treatment duration of less than 12 months, treatment completion at 12
months varied by country; the highest proportion being in England whereas Scotland, Wales and Northern Ireland each had low case
numbers. It should be noted that a high proportion of cases in Scotland and Northern Ireland who did not have a reported outcome
(‘not evaluated’ in Table 7) likely accounts for the low proportion of cases reported as having completed treatment. Overall, 4.8% of TB
cases died in the UK, and 4% were lost to follow up. The highest number of deaths was in England (204) although the greatest
proportion of deaths was recorded in Wales (11.6%).

Reports of cases of tuberculosis to enhanced tuberculosis surveillance systems: United Kingdom, 2000 to 2018
24
Table 8: Treatment completion at 12 months for drug sensitive TB cases with expected treatment duration of <12 monthsa by country, UK, 2008 to 2017
Country 2008 2009 2010 2011 2012 2013 2014 2015 2016 2017
n % n % n % n % n % n % n % n % n % n %
England 5,602 80.3 5,918 81.9 5,650 82.9 6,024 82.1 6,016 83.8 5,504 85.7 4,848 84.9 4,199 83.9 4,223 85.0 3,796 84.7
Scotland 284 67.9 318 69.9 362 77.0 322 75.9 303 79.3 287 81.5 258 80.4 225 80.6 213 75.0 216 79.1
Wales 118 78.1 148 77.5 107 77.5 90 76.3 90 75.0 101 83.5 76 82.6 86 85.1 77 82.8 67 70.5
Northern Ireland 36 61.0 41 75.9 39 67.2 42 79.2 55 70.5 43 74.1 74 85.1 42 87.5 59 77.6 49 77.8
UK 6,040 79.4 6,425 81.1 6,158 82.3 6,478 81.7 6,464 83.3 5,935 85.3 5,256 84.7 4,552 83.8 4,572 84.4 4,128 84.0
a Excludes initial and acquired resistance to rifampicin and MDR-TB cases and those treated with an MDR-TB regimen. Also excludes those with CNS, spinal, miliary or cryptic disseminated TB
In the UK, the proportion of drug sensitive TB cases with an expected treatment duration of less than 12 months who completed
treatment by 12 months improved between 2008 and 2013, with some annual fluctuations. Since the peak in 2013 (85.3%), there has
been a slight decline in this proportion. Due to small numbers of cases in Northern Ireland, Scotland and Wales, there are larger
annual fluctuations in the proportion of cases completing treatment. It should be noted that in 2017 the low proportions of cases
completing treatment may be due to missing outcomes (see explanation in text below Table 7).

Reports of cases of tuberculosis to enhanced tuberculosis surveillance systems: United Kingdom, 2000 to 2018
25
Table 9: Last recorded TB outcome for the entire drug sensitive TB cohorta by country, UK, 2017
Country Completed Died Lost to follow-up Still on treatment Stopped Not evaluatedb Total
n % n % n % n % n % n % n
England 4,323 86.3 264 5.3 211 4.2 102 2.0 61 1.2 47 0.9 5,008
Scotland 227 78.3 19 6.6 2 0.7 6 2.1 1 0.3 35 12.1 290
Wales 77 76.2 14 13.9 7 6.9 1 1.0 0 0.0 2 2.0 101
Northern Ireland 53 76.8 3 4.3 4 5.8 0 0.0 0 0.0 9 13.0 69
UK 4,680 85.6 300 5.5 224 4.1 109 2.0 62 1.1 93 1.7 5,468
a Excludes initial and acquired resistance to rifampicin and MDR-TB cases and those treated with an MDR-TB regimen b Not evaluated includes unknown and transferred out
Eighty-six percent of drug sensitive TB cases notified in the UK in 2017 completed treatment at their last recorded outcome, with 2%
reported to still be on treatment. Overall, 300 (5.5%) cases had died, and 224 (4.1%) cases were lost to follow-up.