reporting in bmc remedyforce · · 2018-04-06... they require an it service management solution...
TRANSCRIPT
White Paper
Reporting in BMC Remedyforce Getting Started with Remedyforce Series
Kiran Chaudhari (Persistent Systems)
Matthew Nadeau (BMC Software)
24 March 2015

PAGE 2 OF 13 Copyright BMC Software, Inc. 2015
Data Segregation Getting Started with Remedyforce Series
Welcome to the “Getting Started with BMC Remedyforce” Series
Today’s IT departments must drive business growth and innovation, while coping with less resources and increasing complexity. To
do this, they require an IT Service Management solution that provides best practices while minimizing costs. BMC Remedyforce is
built on Salesforce—the world's most widely used cloud platform—to deliver complete IT service management functionality with the
secure social, mobile, and collaborative capabilities users expect.
With the “Getting Started with Remedyforce” white paper series, our aim is to help you leverage BMC Remedyforce to improve the
effectiveness and efficiency of your ITSM operations. Each paper addresses a specific area of interest and provides you with
conceptual, functional and technical best practices to make configuration decisions and take action to gain value from your BMC
Remedyforce investment. This paper was co-written with a valued BMC Remedyforce partner, Persistent Systems.
Service Desk Reporting
In today's highly competitive business environment, providing efficient and effective services to the business is a primary
concern of any IT organization. With the Service Desk functioning as the nerve center of the IT organization, it falls to the
ITSM solution to provide the key performance metrics that play a vital role in optimizing service support, providing insights
for IT decision-making and improving customer satisfaction. In fact, the performance of a Service Desk is an indicator of the
overall health of an organization’s IT.
So how do you know if your Service Desk is optimized to support your organization? You may have a general feeling about
how the Service Desk is perceived, but without hard data and metrics, it is difficult to evaluate health, maturity, efficiency,
effectiveness and any opportunities to improve your Service Desk operations.
Reporting in BMC Remedyforce When you embark on a BMC Remedyforce implementation, one of the first topics a consultant will discuss with customers
is reporting. They will ask, "What information are you looking to get out of Remedyforce?" Also, "What are your reporting
requirements?" A customer’s reporting requirements are going to drive the design of the solution. This is something for all
Remedyforce customers to keep in mind, whether you are a current or new customer, going through Services or
implementing on your own - reporting is a key focus area of any Remedyforce roll-out.
Remedyforce is an ITIL-compliant ITSM tool. The design of various modules, their relationship in Remedyforce and the
Salesforce platform capabilities helps in creating various IT Service Desk reports that can be classified into different
groups.
Operational – These reports are for input data. They reflect day to day transactions of operational events.
Key Performance Indicators (KPIs) - In these reports, we are referring to data such as Incidents resolved or
Changes completed within a given reporting period. These reports indicate the key performance level of an
operation or process to provide that basis for actionable management decisions. These reports are derived from one or
more operational reports.
Tolerances - These reports show the success, at risk or failure of the KPIs. The upper and lower values
(thresholds) are set by the IT Service Manager with agreement from IT and business senior management.
Analytical - These reports are used to aid research into an Incident, Service Request or Problem. Typically, data
is collected and reported on for special purposes, an example would be to check the number of issues that meet
an SLA in a given month.

PAGE 3 OF 13 Copyright BMC Software, Inc. 2015
Data Segregation Getting Started with Remedyforce Series
Remedyforce Reports – Predefined and Customized Reporting within Remedyforce gives you the ability to provide unified real-time reporting, and the ability to filter and segment data
as needed for individual business units.
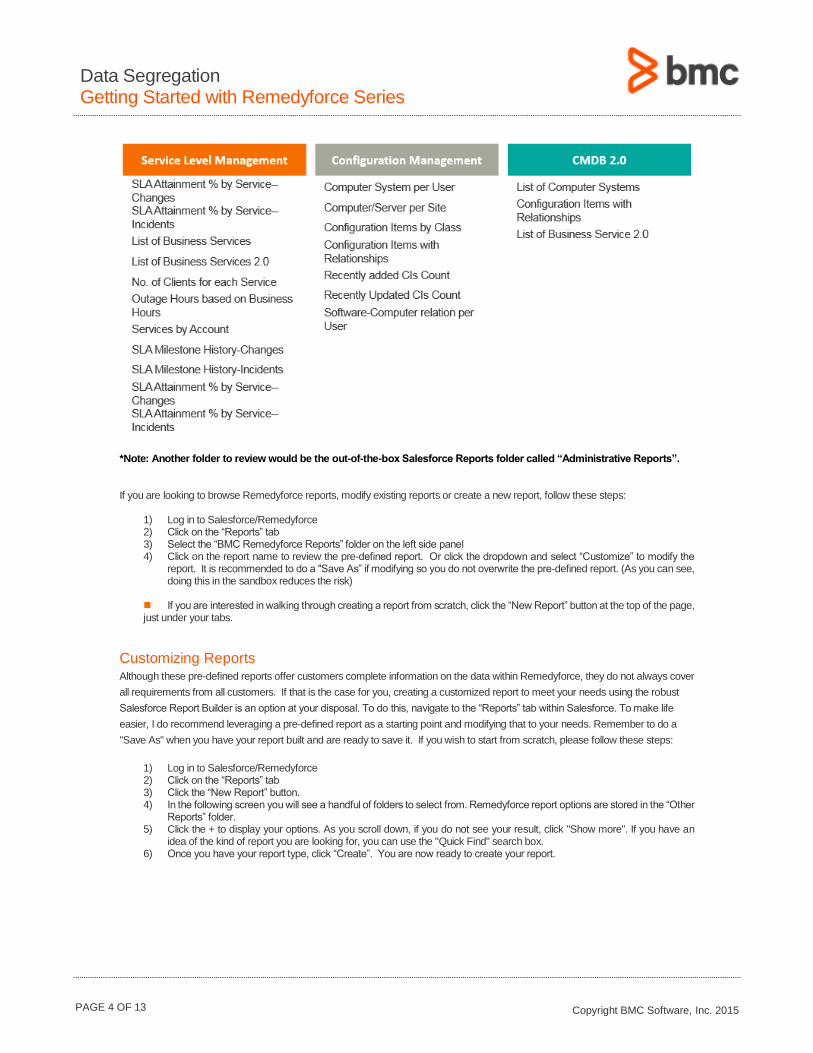
For your convenience, we have included a table of pre-defined reports for your review. You will also find a subsection on how you can create custom reports. Since the launch of Remedyforce, the pre-defined reports available to customers have grown drastically. Currently, as of the Winter ‘15 release, Remedyforce features 65 reports. Here is a list of those reports:
Pre-Defined Reports
PAGE 4 OF 13 Copyright BMC Software, Inc. 2015
Data Segregation Getting Started with Remedyforce Series
*Note: Another folder to review would be the out-of-the-box Salesforce Reports folder called “Administrative Reports”.
If you are looking to browse Remedyforce reports, modify existing reports or create a new report, follow these steps:
1) Log in to Salesforce/Remedyforce 2) Click on the “Reports” tab 3) Select the “BMC Remedyforce Reports” folder on the left side panel 4) Click on the report name to review the pre-defined report. Or click the dropdown and select “Customize” to modify the
report. It is recommended to do a "Save As” if modifying so you do not overwrite the pre-defined report. (As you can see, doing this in the sandbox reduces the risk)
If you are interested in walking through creating a report from scratch, click the “New Report” button at the top of the page, just under your tabs.
Customizing Reports Although these pre-defined reports offer customers complete information on the data within Remedyforce, they do not always cover
all requirements from all customers. If that is the case for you, creating a customized report to meet your needs using the robust
Salesforce Report Builder is an option at your disposal. To do this, navigate to the “Reports” tab within Salesforce. To make life
easier, I do recommend leveraging a pre-defined report as a starting point and modifying that to your needs. Remember to do a
"Save As" when you have your report built and are ready to save it. If you wish to start from scratch, please follow these steps:
1) Log in to Salesforce/Remedyforce 2) Click on the “Reports” tab 3) Click the “New Report” button. 4) In the following screen you will see a handful of folders to select from. Remedyforce report options are stored in the “Other
Reports” folder. 5) Click the + to display your options. As you scroll down, if you do not see your result, click "Show more". If you have an
idea of the kind of report you are looking for, you can use the "Quick Find" search box. 6) Once you have your report type, click “Create”. You are now ready to create your report.

PAGE 5 OF 13 Copyright BMC Software, Inc. 2015
Data Segregation Getting Started with Remedyforce Series
There are three main panes in the window, including fields, data criteria and preview.
To start, set your data criteria and filters. Filters are where you will set up which fields to filter your data on. You can also configure
your logic using AND OR statements. Next select your show criteria. Here you will have multiple options but select the group you
wish to pull data from. Finally, select your Date Field and ranges to finalize your data filters.
At this stage, you should start to see some data in the preview pane. If not, check to see if your filters are correct. If so, move into
the formatting of your report. First, start with the type of report you wish to use. Determine if you are going to use the Tabular
Format, Summary, Matrix or Joined report format. (Note: if you are unsure, I would highly suggest learning more about these report
types and getting some hands on experience with each. To learn more, click the "Help for this Page" link in the top right corner).
Depending on which format you select, the “Show” dropdown will display additional options. You may also have the ability to add a
chart.
Now that we have come this far, we can start to get into the fields we want to see. Salesforce has made it nice and easy to
customize the report by dragging and dropping a field into the report. You can also double click on the field name to have it added.
It is also possible to select multiple fields at once. Another helpful tip, if you are struggling to find the field needed, use the Quick
Find search box. If this is still not displaying your field, you may be in the wrong Salesforce object. You can either cancel your
progress and find the proper object to report on or build a Joined Report.
Salesforce makes Formula Fields available to you which will require a higher knowledge of the force.com platform. These fields
allow for a more robust report. You also have the ability to create bucket fields which gives you the ability to group, filter and
arrange report data.
PAGE 6 OF 13 Copyright BMC Software, Inc. 2015
Data Segregation Getting Started with Remedyforce Series
Once you have the report built and formatted to your liking, go ahead and save to the proper folder.
If you think the report that you are looking for is not possible creating using Salesforce Report Builder, then you can create it using a
Visualforce page or integrating Salesforce with third party charting tools such as Google Charts or Highcharts. Visualforce is a
component based framework that includes a tag-based markup language, similar to HTML. Visualforce can integrate with any
standard web technology or JavaScript framework to allow rich user interface.
Some helpful hints as you are thinking about reporting:
1) If I were an executive in my organization, what data would I look to have at my disposal to make business decisions or show value in the Service Desk?
2) If assistance is needed, check to see what kind of reports is desired. 3) Am I capturing the right data to build on my reporting needs? 4) If not, what changes need to take place to ensure I am? 5) When thinking of report design, what format should the data be made visible? 6) I always find drawing out the reporting/data requirements helps me compile the filters, fields and chart type needed. 7) What is going to be my method of distribution? 8) Who is going to need access to the reports? 9) How frequently do I need the report?
Socialize the work the helpdesk is doing. If you want to get the word out to your organization on how the helpdesk
is preforming and bringing value to the organization, share your dashboards via the Chatter functionality.
We have seen how easy to create Remedyforce reports using Salesforce Report Builder. Most of the reports can be created by
point and click. Also using Salesforce1 app, it is easy to access Remedyforce reports on mobile devices.
Salesforce has tutorial videos available if you wish to follow along on how to create reports. They even have a reporting workbook
to build some samples and gain that hands-on experience. The help page for reports and dashboards can be accessed here.
PAGE 7 OF 13 Copyright BMC Software, Inc. 2015
Data Segregation Getting Started with Remedyforce Series
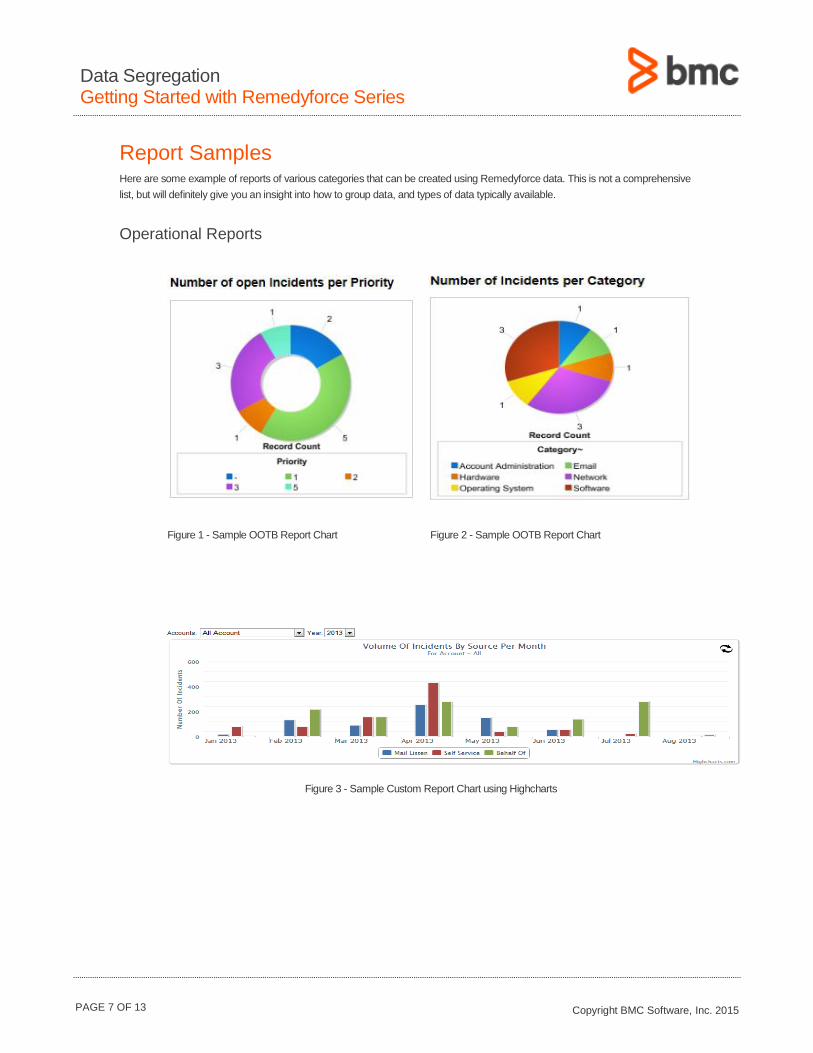
Report Samples Here are some example of reports of various categories that can be created using Remedyforce data. This is not a comprehensive
list, but will definitely give you an insight into how to group data, and types of data typically available.
Operational Reports
Figure 1 - Sample OOTB Report Chart Figure 2 - Sample OOTB Report Chart
Figure 3 - Sample Custom Report Chart using Highcharts
PAGE 8 OF 13 Copyright BMC Software, Inc. 2015
Data Segregation Getting Started with Remedyforce Series
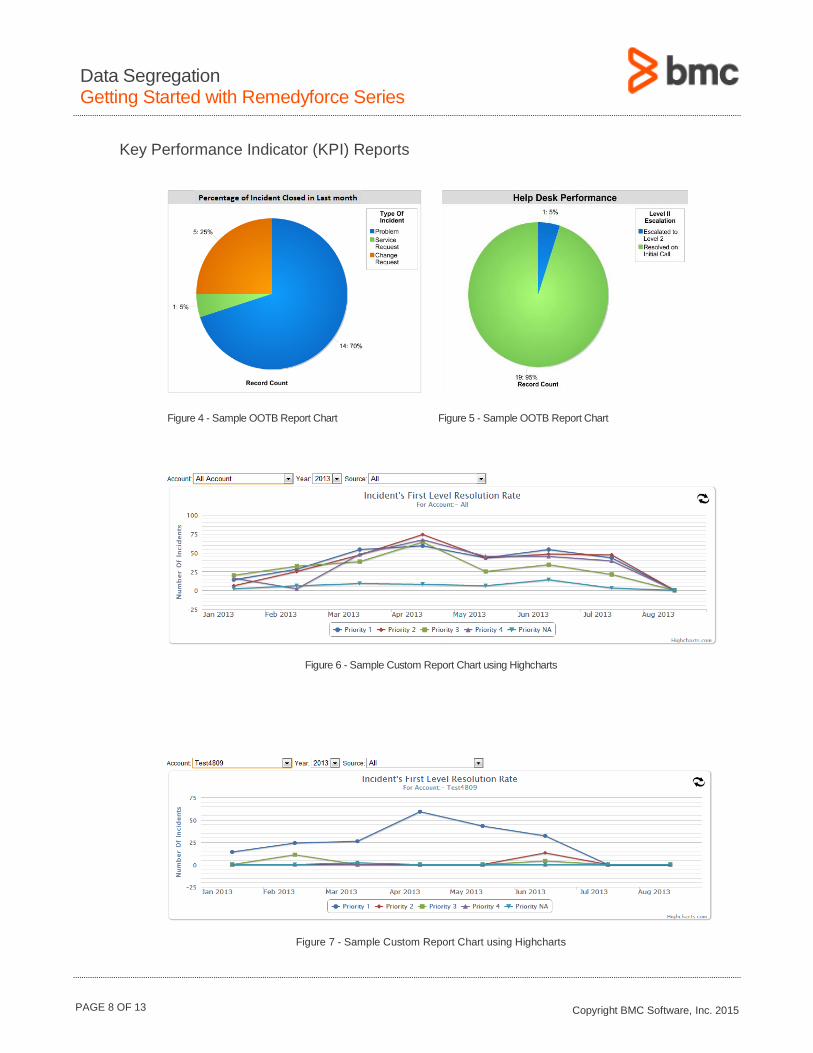
Key Performance Indicator (KPI) Reports
Figure 4 - Sample OOTB Report Chart Figure 5 - Sample OOTB Report Chart
Figure 6 - Sample Custom Report Chart using Highcharts
Figure 7 - Sample Custom Report Chart using Highcharts

PAGE 9 OF 13 Copyright BMC Software, Inc. 2015
Data Segregation Getting Started with Remedyforce Series
Figure 8 - Sample Custom Report Chart using Highcharts
Figure 9 - Sample Custom Report Chart using Highcharts
Tolerance Reports
KPI Example Target (Upper)
Warning (Lower)
Custome Satisfaction Rating 9.5 8.6
Unauthorized Change Rate 2.0% 3.5%
Average Incident Resolution Time (Hours) 3.0 4.5
Average Incident Resolution Per Month Per Priority
Table: KPI Table.
PAGE 10 OF 13 Copyright BMC Software, Inc. 2015
Data Segregation Getting Started with Remedyforce Series
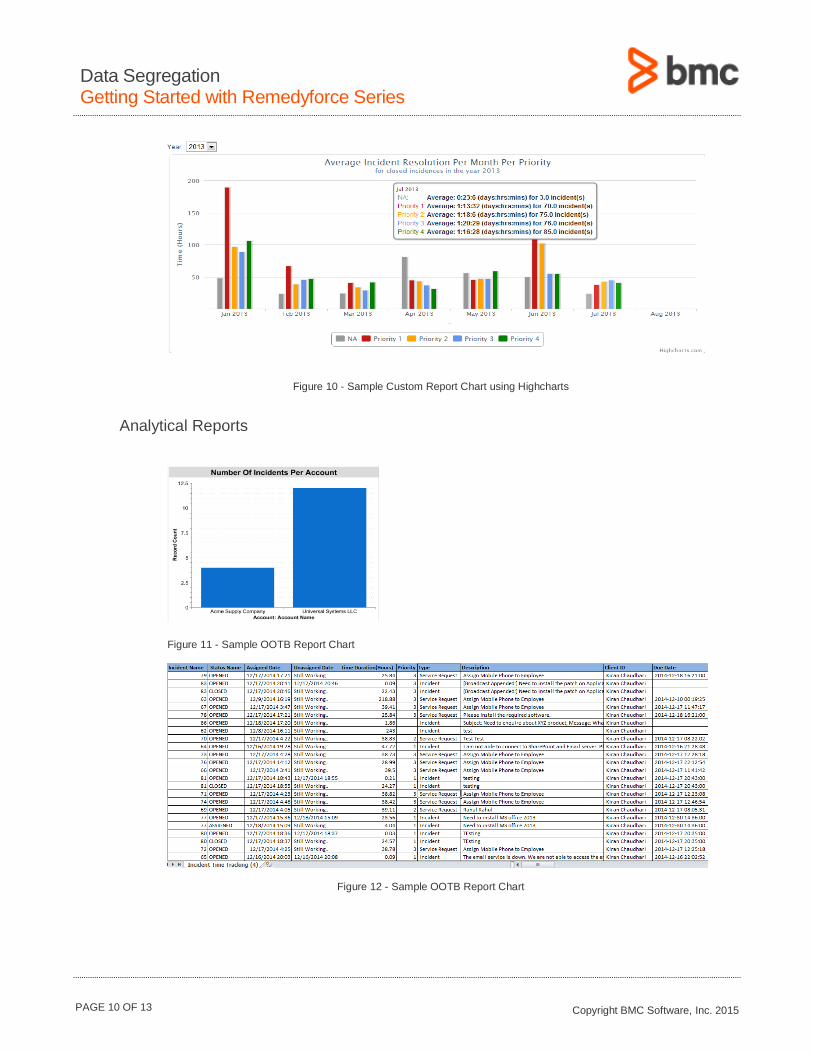
Figure 10 - Sample Custom Report Chart using Highcharts
Analytical Reports
Figure 11 - Sample OOTB Report Chart
Figure 12 - Sample OOTB Report Chart
PAGE 11 OF 13 Copyright BMC Software, Inc. 2015
Data Segregation Getting Started with Remedyforce Series
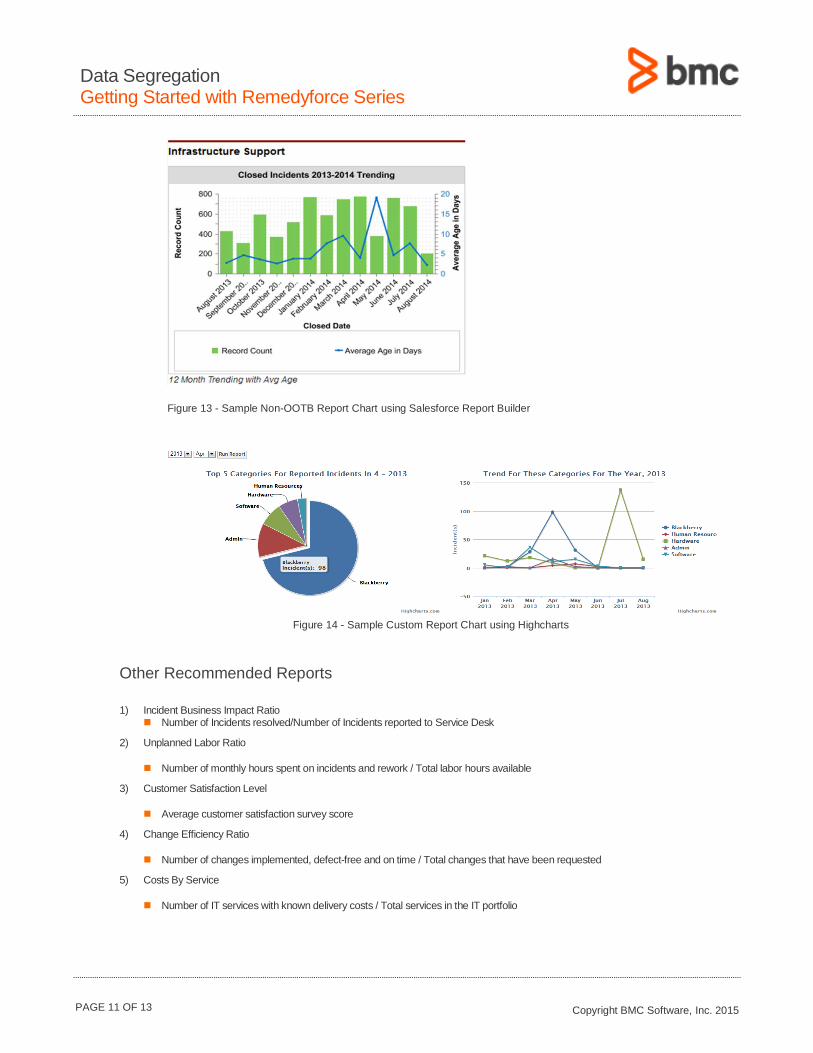
Figure 13 - Sample Non-OOTB Report Chart using Salesforce Report Builder
Figure 14 - Sample Custom Report Chart using Highcharts
Other Recommended Reports
1) Incident Business Impact Ratio Number of Incidents resolved/Number of Incidents reported to Service Desk
2) Unplanned Labor Ratio
Number of monthly hours spent on incidents and rework / Total labor hours available
3) Customer Satisfaction Level
Average customer satisfaction survey score
4) Change Efficiency Ratio
Number of changes implemented, defect-free and on time / Total changes that have been requested
5) Costs By Service
Number of IT services with known delivery costs / Total services in the IT portfolio
PAGE 12 OF 13 Copyright BMC Software, Inc. 2015
Data Segregation Getting Started with Remedyforce Series
In Summary
In this paper, we’ve explored the importance of Remedyforce reports, categories of available reports, the predefined reports that
come with BMC Remedyforce, how to build custom reports, and various examples of reports that can be built using Remedyforce
data. While you are planning your reporting strategy, we recommend browsing through the OOTB Remedyforce reports to get a
better understanding of what is available to you.
There are numerous predefined reports, and while these may not meet your specific need, these reports can easily be cloned and
modified to meet your specific requirements. If you cannot create your reports in the native Salesforce Report Builder you could
explore the following alternatives:
1) Create a Visualforce report through custom coding
2) Identify and implement your third party reporting solution and integrate with Salesforce
3) Export the data into CSV file, load and manipulate into non-integrated Salesforce solution
Resources 1) http://www.salesforce.com/us/developer/docs/workbook_analytics/workbook_analytics.pdf
2) https://help.salesforce.com/HTViewQuickStarts?id=000113375
3) http://www.highcharts.com/
The BMC Remedyforce Services team is here to assist you with reporting for Remedyforce. You can learn more about BMC
Remedyforce Services at http://www.bmc.com/it-services/remedyforce-services.html.
BMC Remedyforce has an extremely active user community where you can get answers to additional questions on this topic. We
encourage you to take a look at bmc.com/communities.
BMC delivers software solutions that help IT transform digital enterprises for the ultimate competitive business advantage. We
have worked with thousands of leading companies to create and deliver powerful IT management services. From mainframe to
cloud to mobile, we pair high-speed digital innovation with robust IT industrialization—allowing our customers to provide
amazing user experiences with optimized IT performance, cost, compliance, and productivity. We believe that technology is the
heart of every business, and that IT drives business to the digital age.
BMC – Bring IT to Life.