report to the nations on occupational fraud and abuse: 2014
TRANSCRIPT
AC
FE / R
EP
OR
T TO
TH
E N
AT
ION
S O
N O
CC
UPA
TIO
NA
L FRA
UD
AN
D A
BU
SE
/ 2014 GLO
BA
L FRA
UD
ST
UD
Y
REPORT TO THE NATIONS O N O C C U P AT I O N A L F R A U D A N D A B U S E
2014 GLObAL FrAUD STUDy
REPORT TO THE NATIONS O N O C C U P AT I O N A L F R A U D A N D A B U S E
2 REPORT TO THE NATIONS ON OCCUPATIONAL FRAUD AND ABUSE
Letter from the President & CEO
In 1988, Dr. Joseph T. Wells founded the ACFE with a stated mission to reduce the incidence of fraud and white-collar crime and to assist members in its detection and deterrence. Not long there-after, Dr. Wells directed an innovative research study into the costs, schemes, perpetrators and victims of occupational fraud. Thus, the ACFE Report to the Nations on Occupational Fraud and Abuse was born. The first Report, released in 1996, and each of its seven successors have reinforced the original mission of the ACFE by expanding the knowledge and understanding of the ways in which occupational fraud occurs and the financial impact this threat has on organizations around the world. The combined results of our research provide the most comprehensive and authoritative body of research on occupational fraud to date.
The 2014 edition of the Report is based on 1,483 cases of occupa-tional fraud, as reported by the Certified Fraud Examiners (CFEs) who investigated them. The analysis of these cases provides valuable lessons about how fraud is committed, how it is detected and how organizations can reduce their vulnerability to this risk.
On behalf of the ACFE and in honor of its founder, Dr. Wells, I am proud to present the 2014 Report to the Nations on Occupational Fraud and Abuse to all businesses, government agencies, anti-fraud practitioners, academicians, the media and the general public. We hope that the information contained in this Report is of great interest and provides an invaluable tool for those who seek to deter, detect or simply understand the impact of occupational fraud.
James D. Ratley, CFE President and CEO Association of Certified Fraud Examiners
The 2014 edition of the Report is based on 1,483 cases of occupational fraud, as reported by the Certified Fraud Examiners (CFEs) who investigated them. The analysis of these cases provides valuable lessons about how fraud is committed, how it is detected and how organizations can reduce their vulnerability to this risk.
REPORT TO THE NATIONS ON OCCUPATIONAL FRAUD AND ABUSE 3
Contents
Executive Summary ....................................4Summary of Findings ............................................................. 4Conclusions and Recommendations ....................................... 5
Introduction ...............................................6
The Cost of Occupational Fraud.................8Distribution of Losses............................................................. 9
How Occupational Fraud is Committed ...10Asset Misappropriation Sub-Schemes ................................... 13Corruption Cases by Region ................................................ 14Overlap of Fraud Schemes .................................................... 15Duration of Fraud Schemes .................................................. 16
Detection of Fraud Schemes .....................18Initial Detection of Occupational Frauds ............................. 19Median Loss and Median Duration by Detection Method ... 20Source of Tips ...................................................................... 21Impact of Hotlines ............................................................... 22Initial Detection of Frauds in Small Businesses ..................... 23Detection Method by Region ............................................... 23
Victim Organizations ...............................24Type of Organization ........................................................... 24Size of Organization ............................................................. 25
Methods of Fraud in Small Businesses ...................................... 26
Industry of Organization ...................................................... 27Schemes by Industry ................................................................ 29Corruption Cases by Industry .................................................. 30
Anti-Fraud Controls at the Victim Organization .................. 31Anti-Fraud Controls at Small Businesses .................................. 32Anti-Fraud Controls by Region ............................................... 33Effectiveness of Controls .......................................................... 38Control Weaknesses That Contributed to Fraud ...................... 39
Perpetrators ..............................................40Perpetrator’s Position ............................................................ 40
Position of Perpetrator Based on Region .................................. 42
The Impact of Collusion ....................................................... 46Methods of Fraud Based on Number of Perpetrators ............... 47
Perpetrator’s Age .................................................................. 48Perpetrator’s Gender ............................................................. 49
Perpetrator’s Gender Based on Region...................................... 49
Median Losses Based on Gender .............................................. 50
Position of Perpetrator Based on Gender .................................. 50
Perpetrator’s Tenure ............................................................. 52Perpetrator’s Education Level ................................................ 54Perpetrator’s Department ...................................................... 55
Schemes Based on Perpetrator’s Department ............................ 57
Perpetrator’s Criminal and Employment History .................. 58Perpetrator’s Criminal Background .......................................... 58Perpetrator’s Employment History ........................................... 58
Behavioral Red Flags Displayed by Perpetrators .................... 59Behavioral Red Flags Based on Perpetrator’s Position ............... 60
Behavioral Red Flags Based on Scheme Type ............................ 61
Behavioral Red Flags Based on Gender .................................... 62
Non-Fraud-Related Misconduct ........................................... 63Human-Resources-Related Red Flags ................................... 63
Case Results .............................................64Criminal Prosecutions .......................................................... 64Civil Suits............................................................................. 66Recovery of Losses ................................................................ 67
Methodology ............................................68Analysis Methodology .......................................................... 68Who Provided the Data? ...................................................... 69
Primary Occupation ................................................................ 69
Experience ............................................................................... 70
Nature of Fraud Examinations Conducted ............................... 70
Glossary of Terminology ..........................71
Appendix ..................................................72
Index of Figures ........................................74
Fraud Prevention Checklist ......................76
About the ACFE .......................................78Membership ......................................................................... 79Certified Fraud Examiners .................................................... 79
4 REPORT TO THE NATIONS ON OCCUPATIONAL FRAUD AND ABUSE
Executive Summary
Summary of Findings• Survey participants estimated that the typical orga-
nization loses 5% of revenues each year to fraud. If applied to the 2013 estimated Gross World Prod-uct, this translates to a potential projected global fraud loss of nearly $3.7 trillion.
• The median loss caused by the frauds in our study was $145,000. Additionally, 22% of the cases involved losses of at least $1 million.
• The median duration — the amount of time from when the fraud commenced until it was detected — for the fraud cases reported to us was 18 months.
• Occupational frauds can be classified into three primary categories: asset misappropriations, corrup-tion and financial statement fraud. Of these, asset misappropriations are the most common, occurring in 85% of the cases in our study, as well as the least costly, causing a median loss of $130,000. In con-trast, only 9% of cases involved financial statement fraud, but those cases had the greatest financial im-pact, with a median loss of $1 million. Corruption schemes fell in the middle in terms of both frequen-cy (37% of cases) and median loss ($200,000).
• Many cases involve more than one category of occupational fraud. Approximately 30% of the schemes in our study included two or more of the three primary forms of occupational fraud.
• Tips are consistently and by far the most common detection method. Over 40% of all cases were detect-ed by a tip — more than twice the rate of any other detection method. Employees accounted for nearly half of all tips that led to the discovery of fraud.
• Organizations with hotlines were much more likely to catch fraud by a tip, which our data shows is the most effective way to detect fraud. These organi-zations also experienced frauds that were 41% less costly, and they detected frauds 50% more quickly.
• The smallest organizations tend to suffer dispro-portionately large losses due to occupational fraud. Additionally, the specific fraud risks faced by small businesses differ from those faced by larger orga-nizations, with certain categories of fraud being
much more prominent at small entities than at their larger counterparts.
• The banking and financial services, government and public administration, and manufacturing industries continue to have the greatest number of cases reported in our research, while the mining, real estate, and oil and gas industries had the largest reported median losses.
• The presence of anti-fraud controls is associat-ed with reduced fraud losses and shorter fraud duration. Fraud schemes that occurred at victim organizations that had implemented any of several common anti-fraud controls were significantly less costly and were detected much more quickly than frauds at organizations lacking these controls.
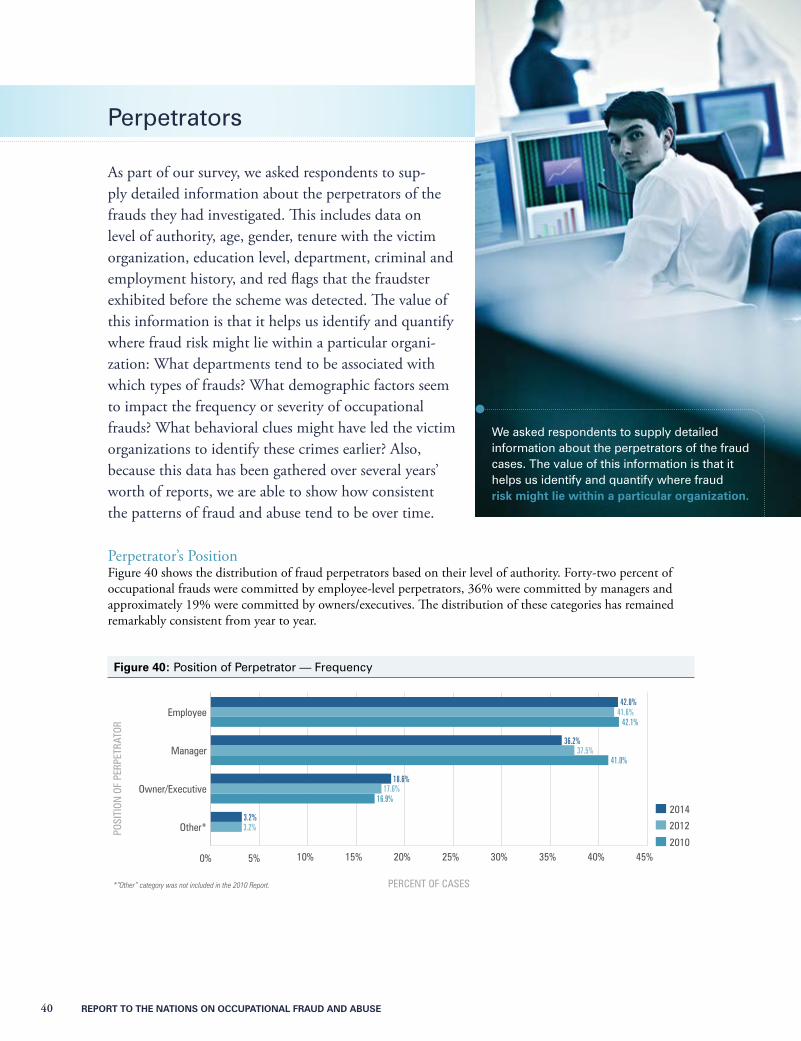
• The higher the perpetrator’s level of authority, the greater fraud losses tend to be. Owners/executives only accounted for 19% of all cases, but they caused a median loss of $500,000. Employees, conversely, committed 42% of occupational frauds but only caused a median loss of $75,000. Man-agers ranked in the middle, committing 36% of frauds with a median loss of $130,000.
• Collusion helps employees evade independent checks and other anti-fraud controls, enabling them to steal larger amounts. The median loss in a fraud committed by a single person was $80,000, but as the number of perpetrators increased, losses rose dramatically. In cases with two perpetrators the median loss was $200,000, for three perpetrators it was $355,000 and when four or more perpetrators were involved the median loss exceeded $500,000.
The median loss caused by the frauds in our study was $145,000, and 22% of the cases involved losses of at least $1 million.
REPORT TO THE NATIONS ON OCCUPATIONAL FRAUD AND ABUSE 5
•Approximately 77% of the frauds in our study were committed by individuals working in one of seven departments: accounting, operations, sales, executive/upper management, customer service, purchasing and finance.
•It takes time and effort to recover the money stolen by perpetrators, and many organizations are never able to fully do so. At the time of our survey, 58% of the victim organizations had not recovered any of their losses due to fraud, and only 14% had made a full recovery.
Conclusions and Recommendations•Occupational fraud is a universal problem for
businesses around the globe. Although some slight regional variations were noted in methods used both by fraudsters to commit their crimes and by organizations to prevent and detect fraud schemes, the overall trends in our data are quite consistent, both across borders and over time. This consis-tency underscores the nature and pervasiveness of fraud’s threat to all organizations.
•The longer frauds last, the more financial damage they cause. Passive detection methods (confession, notification by law enforcement, external audit and by accident) tend to take longer to bring fraud to management’s attention, which allows the relat-ed loss to grow. Consequently, proactive detection measures — such as hotlines, management review procedures, internal audits and employee moni-toring mechanisms — are vital in catching frauds early and limiting their losses.
•Small businesses are both disproportionately victimized by fraud and notably under-protected by anti-fraud controls, a combination that makes them significantly vulnerable to this threat. While resources available for fraud prevention and detection measures are limited in many small companies, several anti-fraud controls — such as an anti-fraud policy, formal management review procedures and anti-fraud training for staff mem-bers — can be enacted with little direct financial outlay and thus provide a cost-effective investment for protecting these organizations from fraud.
•External audits are implemented by a large number of organizations, but they are among the least effective controls in combating occupational fraud. Such audits were the primary detection method in just 3% of the fraud cases reported to us, compared to the 7% of cases that were detected
by accident. Further, although the use of inde-pendent financial statement audits was associated with reduced median losses and durations of fraud schemes, these reductions were among the smallest of all of the anti-fraud controls analyzed in our study. Consequently, while independent audits serve a vital role in organizational governance, our data indicates that they should not be relied upon as organizations’ primary anti-fraud mechanism.
•Many of the most effective anti-fraud controls are being overlooked by a significant portion of orga-nizations. For example, proactive data monitoring and analysis was used by only 35% of the victim organizations in our study, but the presence of this control was correlated with frauds that were 60% less costly and 50% shorter in duration. Other less common controls — including surprise audits, a dedicated fraud department or team and formal fraud risk assessments — showed similar associa-tions with reductions in one or both of these mea-sures of fraud damage. When determining how to invest anti-fraud dollars, management should consider the observed effectiveness of specific con-trol activities and how those controls will enhance potential fraudsters’ perception of detection.
•The vast majority of occupational fraudsters are first-time offenders; only 5% had been convicted of a fraud-related offense prior to committing the crimes in our study. Furthermore, 82% of fraud-sters had never previously been punished or termi-nated by an employer for fraud-related conduct. While background checks can be useful in screen-ing out some bad applicants, they might not do a good job of predicting fraudulent behavior. Most fraudsters work for their employers for years before they begin to steal, so ongoing employee monitor-ing and an understanding of the risk factors and warning signs of fraud are much more likely to identify fraud than pre-employment screening.
•Most occupational fraudsters exhibit certain behavioral traits that can be warning signs of their crimes, such as living beyond their means or having unusually close associations with vendors or customers. In 92% of the cases we reviewed, at least one common behavioral red flag was iden-tified before the fraud was detected. Managers, employees, auditors and others should be trained to recognize these warning signs that, when com-bined with other factors, might indicate fraud.
6 REPORT TO THE NATIONS ON OCCUPATIONAL FRAUD AND ABUSE
Introduction
Fraud is ubiquitous; it does not discriminate in its oc-currence. And while anti-fraud controls can effectively reduce the likelihood and potential impact of fraud, the truth is that no entity is immune to this threat. Unfortu-nately, however, many organizations still suffer from an “it can’t happen here” mindset. To help combat this mis-conception, to raise public awareness about the cost and universal nature of fraud and to support anti-fraud pro-fessionals around the globe, we have undertaken exten-sive research into the costs and trends related to fraud. The results of our initial research efforts were contained in the inaugural Report to the Nation on Occupational Fraud and Abuse, which was released in 1996; since then we have continued and expanded our research, with subsequent reports released biennially since 2002.
Although the types of fraud that affect organizations vary widely, the research contained in this Report and its predecessors focuses on a particularly pervasive form: occupational fraud, which is defined as:
The use of one’s occupation for personal enrichment through the deliberate misuse or misapplication of the employing organization’s resources or assets
Put more simply, occupational frauds are those schemes in which a person defrauds his or her employing organization. By its very nature, this form of fraud is a threat to all organizations that employ individuals to perform their business functions.
To explore and illuminate this risk, each of our Reports has been based on detailed information about specific cases of occupational fraud that were investigated by Certified Fraud Examiners (CFEs), and we undertook all Reports with the same goals:
•To summarize the opinions of experts on the percentage of organizational revenue lost to fraud each year
•To categorize the ways in which occupational fraud and abuse occur
•To analyze the characteristics of the individuals who commit occupational fraud and abuse
•To examine the characteristics of the organizations that are victimized by occupational fraud and abuse
Fraud is ubiquitous; it does not discriminate in its occurrence. And while anti-fraud controls can effectively reduce the likelihood and potential impact of fraud, the truth is that no entity is immune to this threat.
REPORT TO THE NATIONS ON OCCUPATIONAL FRAUD AND ABUSE 7
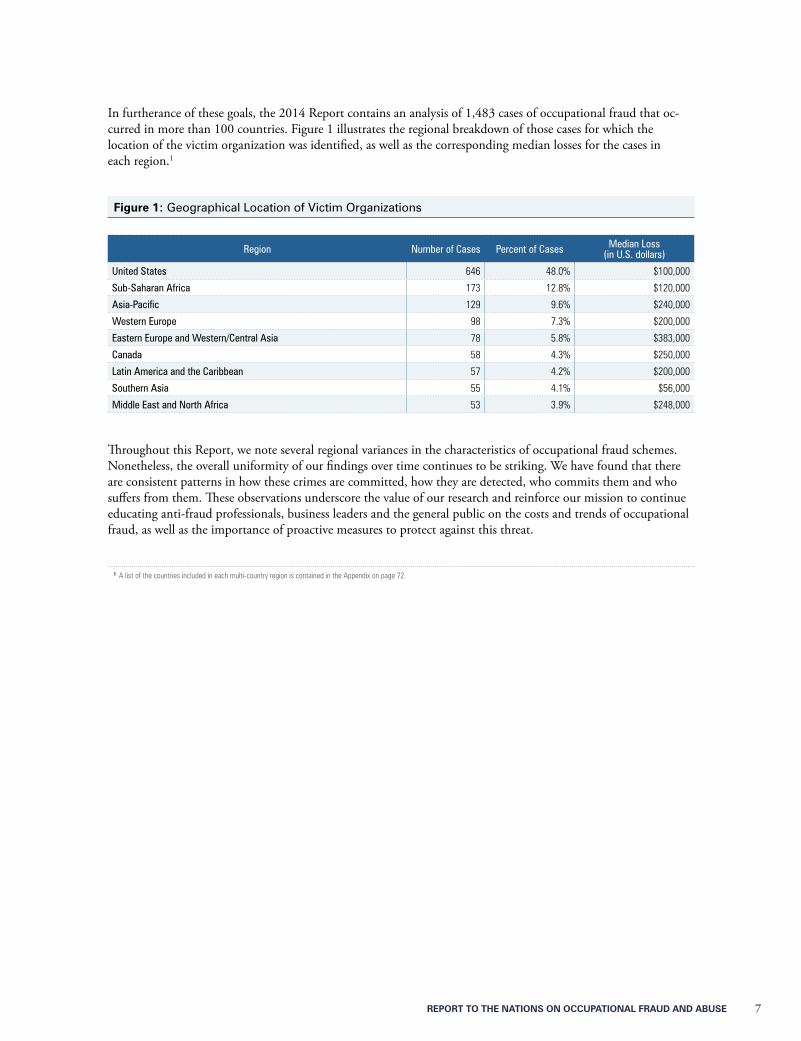
In furtherance of these goals, the 2014 Report contains an analysis of 1,483 cases of occupational fraud that oc-curred in more than 100 countries. Figure 1 illustrates the regional breakdown of those cases for which the location of the victim organization was identified, as well as the corresponding median losses for the cases in each region.1
Figure 1: Geographical Location of Victim Organizations
Region Number of Cases Percent of Cases Median Loss(in U.S. dollars)
United States 646 48.0% $100,000
Sub-Saharan Africa 173 12.8% $120,000
Asia-Pacific 129 9.6% $240,000
Western Europe 98 7.3% $200,000
Eastern Europe and Western/Central Asia 78 5.8% $383,000
Canada 58 4.3% $250,000
Latin America and the Caribbean 57 4.2% $200,000
Southern Asia 55 4.1% $56,000
Middle East and North Africa 53 3.9% $248,000
Throughout this Report, we note several regional variances in the characteristics of occupational fraud schemes. Nonetheless, the overall uniformity of our findings over time continues to be striking. We have found that there are consistent patterns in how these crimes are committed, how they are detected, who commits them and who suffers from them. These observations underscore the value of our research and reinforce our mission to continue educating anti-fraud professionals, business leaders and the general public on the costs and trends of occupational fraud, as well as the importance of proactive measures to protect against this threat.
1 A list of the countries included in each multi-country region is contained in the Appendix on page 72.
8 REPORT TO THE NATIONS ON OCCUPATIONAL FRAUD AND ABUSE
The Cost of Occupational Fraud
Understandably, there is considerable attention paid to determining the overall cost of fraud. Executives want to know how significant the risk of fraud is to their com-panies, anti-fraud professionals need to justify budgets and satisfy performance metrics and the media and general public are curious about just how much money white-collar criminals are taking us for.
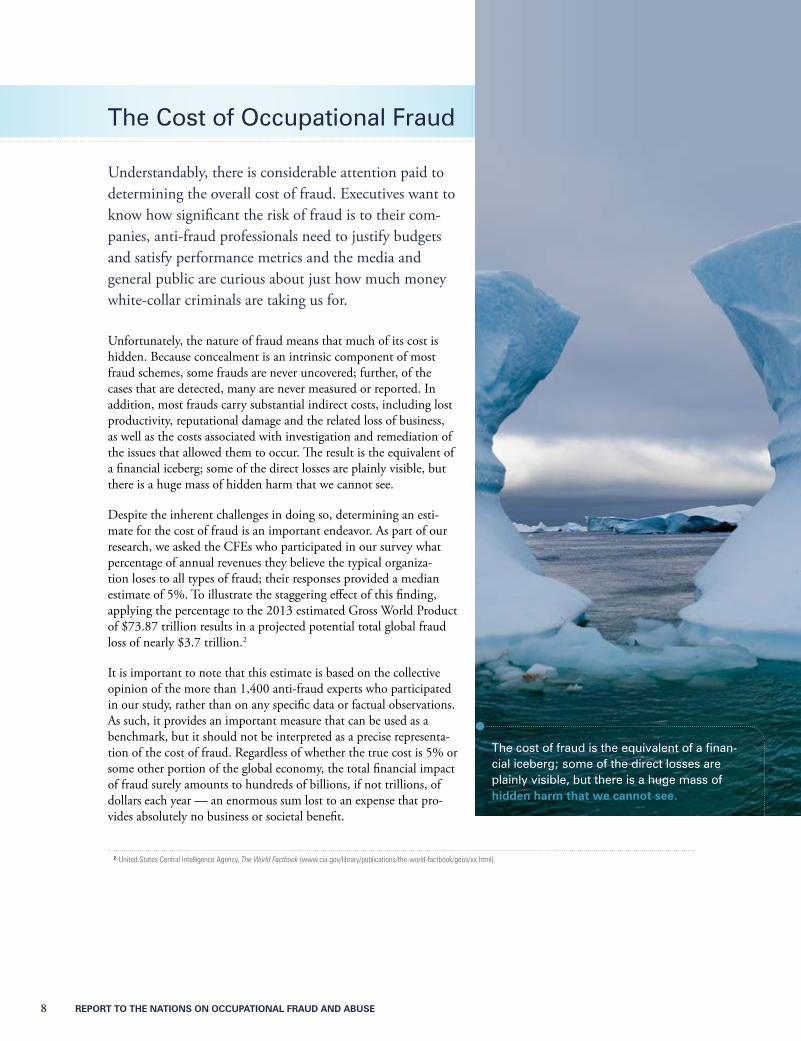
Unfortunately, the nature of fraud means that much of its cost is hidden. Because concealment is an intrinsic component of most fraud schemes, some frauds are never uncovered; further, of the cases that are detected, many are never measured or reported. In addition, most frauds carry substantial indirect costs, including lost productivity, reputational damage and the related loss of business, as well as the costs associated with investigation and remediation of the issues that allowed them to occur. The result is the equivalent of a financial iceberg; some of the direct losses are plainly visible, but there is a huge mass of hidden harm that we cannot see.
Despite the inherent challenges in doing so, determining an esti-mate for the cost of fraud is an important endeavor. As part of our research, we asked the CFEs who participated in our survey what percentage of annual revenues they believe the typical organiza-tion loses to all types of fraud; their responses provided a median estimate of 5%. To illustrate the staggering effect of this finding, applying the percentage to the 2013 estimated Gross World Product of $73.87 trillion results in a projected potential total global fraud loss of nearly $3.7 trillion.2
It is important to note that this estimate is based on the collective opinion of the more than 1,400 anti-fraud experts who participated in our study, rather than on any specific data or factual observations. As such, it provides an important measure that can be used as a benchmark, but it should not be interpreted as a precise representa-tion of the cost of fraud. Regardless of whether the true cost is 5% or some other portion of the global economy, the total financial impact of fraud surely amounts to hundreds of billions, if not trillions, of dollars each year — an enormous sum lost to an expense that pro-vides absolutely no business or societal benefit.
2 United States Central Intelligence Agency, The World Factbook (www.cia.gov/library/publications/the-world-factbook/geos/xx.html).
The cost of fraud is the equivalent of a finan-cial iceberg; some of the direct losses are plainly visible, but there is a huge mass of hidden harm that we cannot see.
REPORT TO THE NATIONS ON OCCUPATIONAL FRAUD AND ABUSE 9
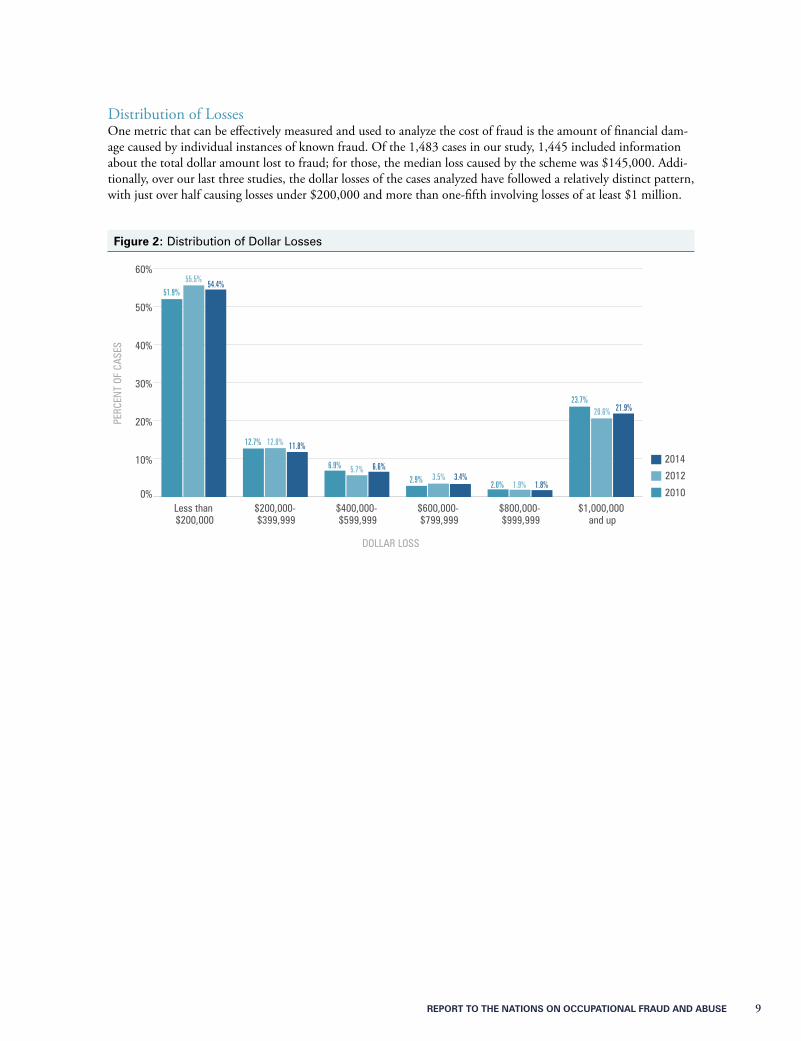
Distribution of LossesOne metric that can be effectively measured and used to analyze the cost of fraud is the amount of financial dam-age caused by individual instances of known fraud. Of the 1,483 cases in our study, 1,445 included information about the total dollar amount lost to fraud; for those, the median loss caused by the scheme was $145,000. Addi-tionally, over our last three studies, the dollar losses of the cases analyzed have followed a relatively distinct pattern, with just over half causing losses under $200,000 and more than one-fifth involving losses of at least $1 million.
Figure 2: Distribution of Dollar Losses
0%
10%
20%
30%
40%
50%
60%
2010
2012
2014
$1,000,000 and up
$800,000- $999,999
$600,000- $799,999
$400,000- $599,999
$200,000- $399,999
Less than $200,000
51.9%55.5% 54.4%
12.7% 12.8% 11.8%
6.9% 5.7% 6.6%2.9% 3.5% 3.4%
23.7%20.6% 21.9%
2.0% 1.9% 1.8%
DOLLAR LOSS
PERC
ENT
OF C
ASES
10 RepoRt to the NatioNs oN occupatioNal FRaud aNd abuse
How Occupational Fraud is Committed
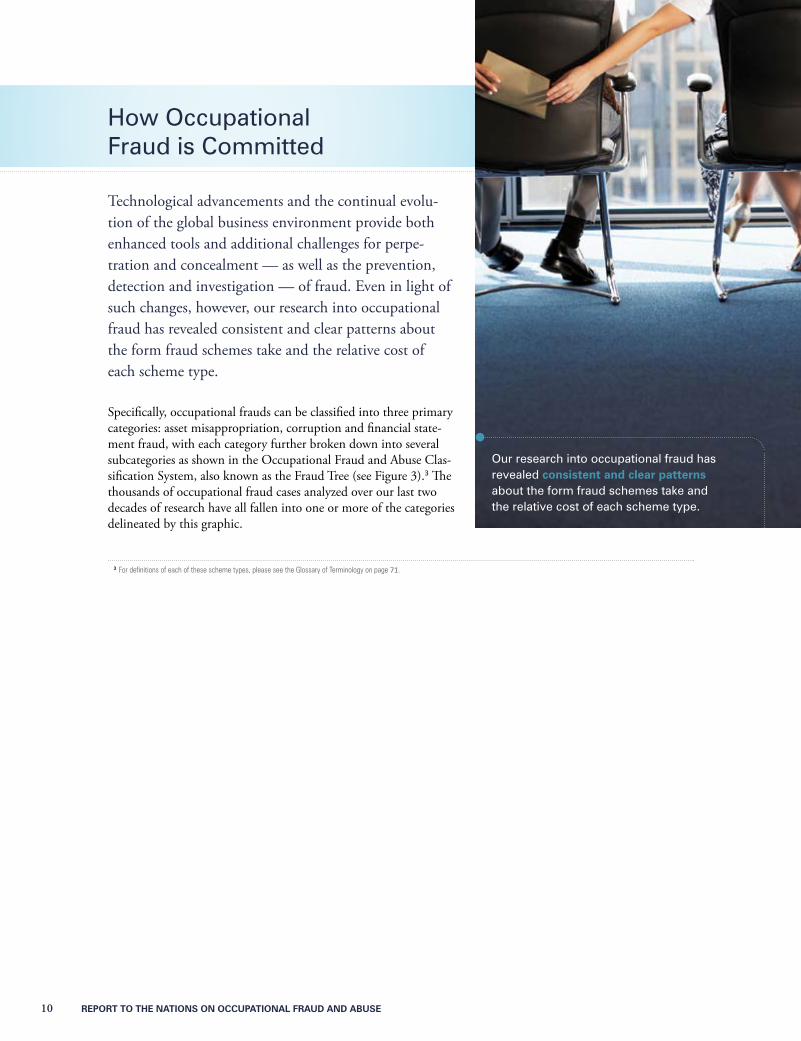
Technological advancements and the continual evolu-tion of the global business environment provide both enhanced tools and additional challenges for perpe-tration and concealment — as well as the prevention, detection and investigation — of fraud. Even in light of such changes, however, our research into occupational fraud has revealed consistent and clear patterns about the form fraud schemes take and the relative cost of each scheme type.
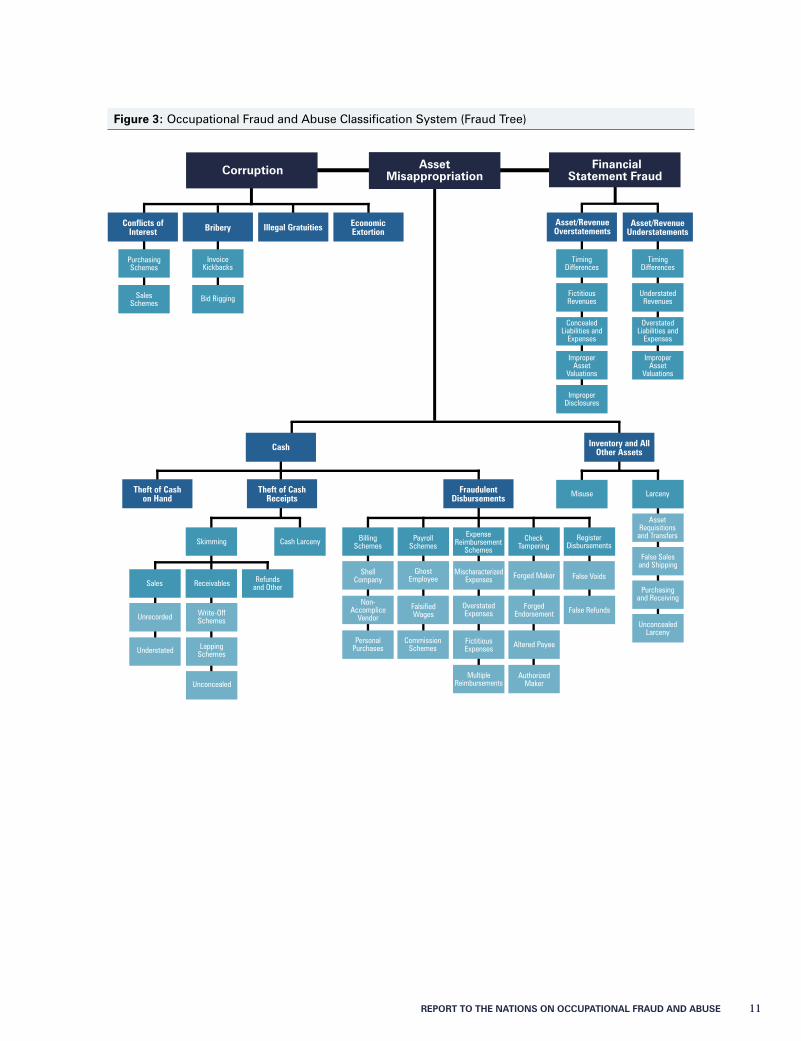
Specifically, occupational frauds can be classified into three primary categories: asset misappropriation, corruption and financial state-ment fraud, with each category further broken down into several subcategories as shown in the Occupational Fraud and Abuse Clas-sification System, also known as the Fraud Tree (see Figure 3).3 The thousands of occupational fraud cases analyzed over our last two decades of research have all fallen into one or more of the categories delineated by this graphic.
3 For definitions of each of these scheme types, please see the Glossary of Terminology on page 71.
Our research into occupational fraud has revealed consistent and clear patterns about the form fraud schemes take and the relative cost of each scheme type.
REPORT TO THE NATIONS ON OCCUPATIONAL FRAUD AND ABUSE 11
Figure 3: Occupational Fraud and Abuse Classification System (Fraud Tree)
Corruption
Conflicts of Interest
Cash
Theft of Cash on Hand
Theft of Cash Receipts
Fraudulent Disbursements
Inventory and All Other Assets
PurchasingSchemes
Sales Schemes Bid Rigging
Skimming Cash Larceny
Misuse Larceny
Asset Requisitions
and Transfers
False Sales and Shipping
Purchasing and Receiving
Unconcealed Larceny
Sales
Unrecorded Write-Off Schemes
Lapping Schemes
Unconcealed
Understated
Receivables Refunds and Other
Billing Schemes
Payroll Schemes
Expense Reimbursement
Schemes
Check Tampering
Register Disbursements
Forged Maker False Voids
False RefundsForged Endorsement
Authorized Maker
Altered Payee
Mischaracterized Expenses
Ghost Employee
Commission Schemes
Overstated Expenses
Fictitious Expenses
Multiple Reimbursements
Falsified Wages
Shell Company
Non-Accomplice
Vendor
Personal Purchases
Invoice Kickbacks
Timing Differences
Fictitious Revenues
Improper Asset
Valuations
Concealed Liabilities and
Expenses
Timing Differences
Understated Revenues
Improper Asset
Valuations
Overstated Liabilities and
Expenses
Improper Disclosures
Illegal Gratuities Economic Extortion
Asset/Revenue UnderstatementsBribery Asset/Revenue
Overstatements
Asset Misappropriation
Financial Statement Fraud
12 REPORT TO THE NATIONS ON OCCUPATIONAL FRAUD AND ABUSE
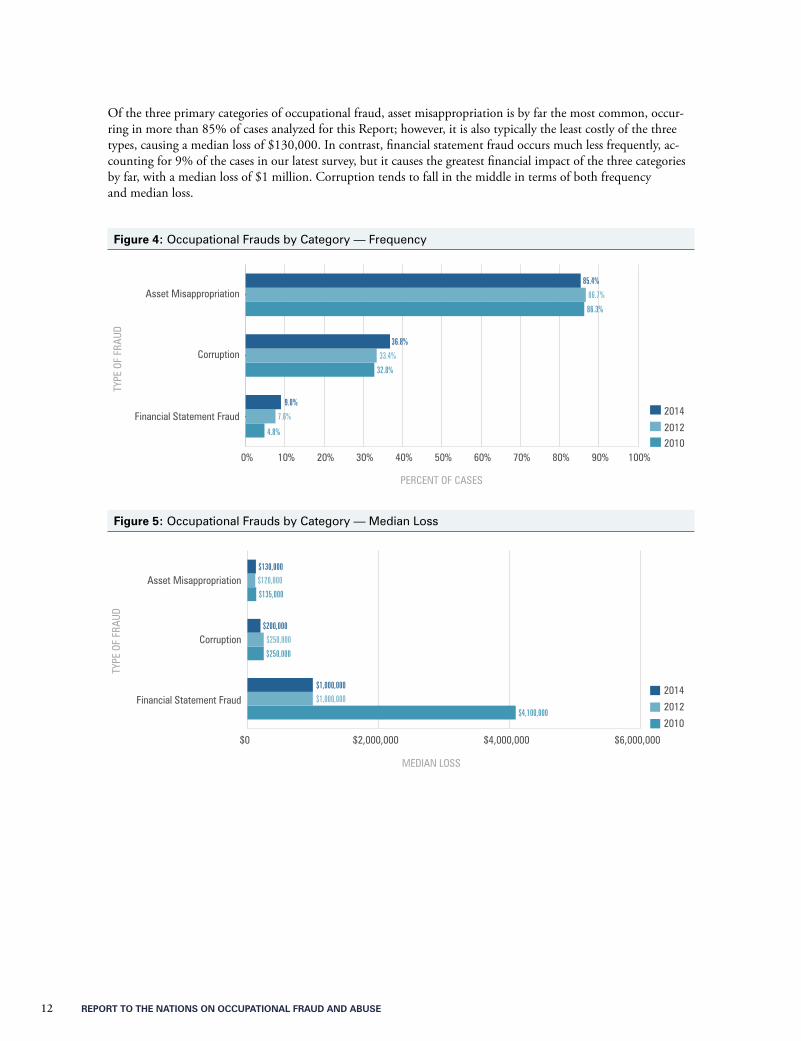
Of the three primary categories of occupational fraud, asset misappropriation is by far the most common, occur-ring in more than 85% of cases analyzed for this Report; however, it is also typically the least costly of the three types, causing a median loss of $130,000. In contrast, financial statement fraud occurs much less frequently, ac-counting for 9% of the cases in our latest survey, but it causes the greatest financial impact of the three categories by far, with a median loss of $1 million. Corruption tends to fall in the middle in terms of both frequency and median loss.
Figure 4: Occupational Frauds by Category — Frequency
0% 10% 20% 30% 40% 50% 60% 70% 80% 90% 100%20102012
2014Financial Statement Fraud
Corruption
Asset Misappropriation
TYPE
OF
FRAU
D
PERCENT OF CASES
85.4%
86.7%
86.3%
36.8%
33.4%
32.8%
9.0%
7.6%
4.8%
Figure 5: Occupational Frauds by Category — Median Loss
TYPE
OF
FRAU
D
MEDIAN LOSS
$130,000
$120,000
$135,000
$200,000
$250,000
$250,000
$0 $2,000,000 $4,000,000 $6,000,000
Financial Statement Fraud
Corruption
Asset Misappropriation
2014
2012
2010
$1,000,000
$1,000,000
$4,100,000
RepoRt to the NatioNs oN occupatioNal FRaud aNd abuse 13
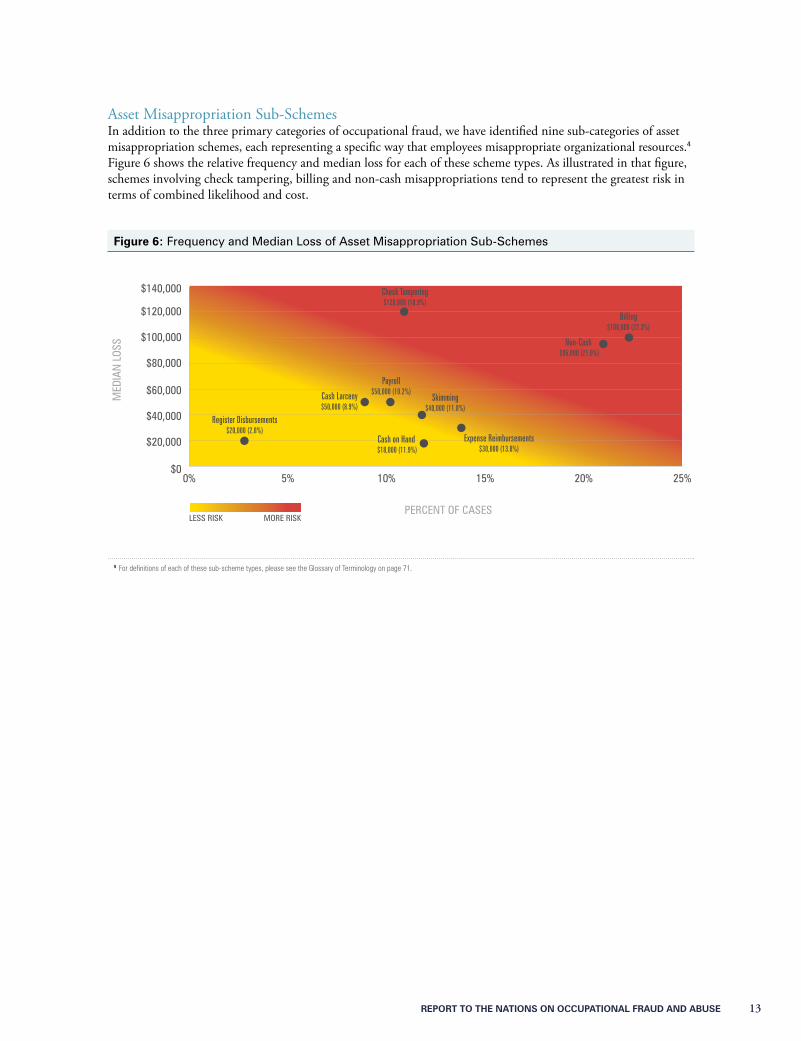
Asset Misappropriation Sub-SchemesIn addition to the three primary categories of occupational fraud, we have identified nine sub-categories of asset misappropriation schemes, each representing a specific way that employees misappropriate organizational resources.4 Figure 6 shows the relative frequency and median loss for each of these scheme types. As illustrated in that figure, schemes involving check tampering, billing and non-cash misappropriations tend to represent the greatest risk in terms of combined likelihood and cost.
Figure 6: Frequency and Median Loss of Asset Misappropriation Sub-Schemes
0% 5% 10% 15% 20% 25%$0
$20,000
$40,000
$60,000
$80,000
$100,000
$120,000
$140,000
LESS RISK MORE RISK
Register Disbursements$20,000 (2.8%)
Cash Larceny$50,000 (8.9%)
Cash on Hand $18,000 (11.9%)
Payroll$50,000 (10.2%)
Check Tampering$120,000 (10.9%)
Skimming$40,000 (11.8%)
Expense Reimbursements$30,000 (13.8%)
Non-Cash $95,000 (21.0%)
Billing$100,000 (22.3%)
MED
IAN
LOS
S
PERCENT OF CASES
4 For definitions of each of these sub-scheme types, please see the Glossary of Terminology on page 71.
14 REPORT TO THE NATIONS ON OCCUPATIONAL FRAUD AND ABUSE
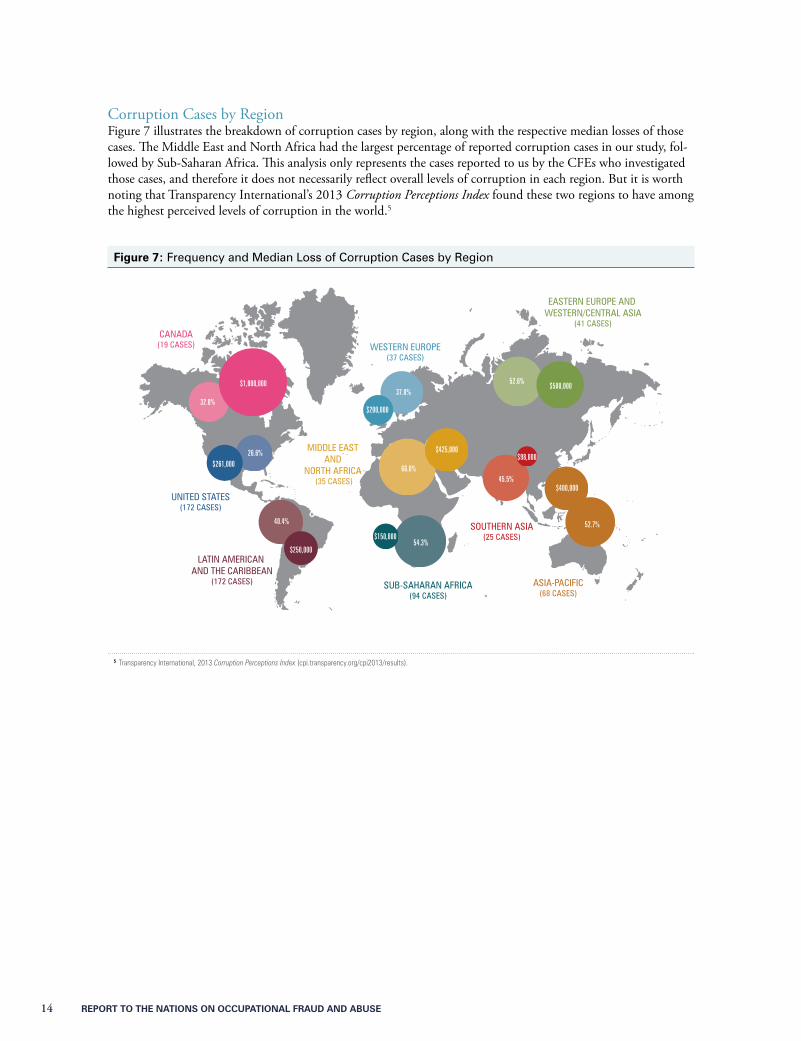
Corruption Cases by RegionFigure 7 illustrates the breakdown of corruption cases by region, along with the respective median losses of those cases. The Middle East and North Africa had the largest percentage of reported corruption cases in our study, fol-lowed by Sub-Saharan Africa. This analysis only represents the cases reported to us by the CFEs who investigated those cases, and therefore it does not necessarily reflect overall levels of corruption in each region. But it is worth noting that Transparency International’s 2013 Corruption Perceptions Index found these two regions to have among the highest perceived levels of corruption in the world.5
Figure 7: Frequency and Median Loss of Corruption Cases by Region
$261,00026.6%
37.8%
54.3%
52.7%
52.6%
32.8%
40.4%
45.5%66.0%
$150,000
$400,000
$200,000
$500,000
$250,000
$425,000$98,000
$1,000,000
UNITED STATES(172 CASES)
CANADA(19 CASES)
LATIN AMERICAN AND THE CARIBBEAN
(172 CASES) SUB-SAHARAN AFRICA(94 CASES)
ASIA-PACIFIC(68 CASES)
SOUTHERN ASIA(25 CASES)
MIDDLE EAST AND
NORTH AFRICA (35 CASES)
WESTERN EUROPE(37 CASES)
EASTERN EUROPE AND WESTERN/CENTRAL ASIA
(41 CASES)
5 Transparency International, 2013 Corruption Perceptions Index (cpi.transparency.org/cpi2013/results).
REPORT TO THE NATIONS ON OCCUPATIONAL FRAUD AND ABUSE 15
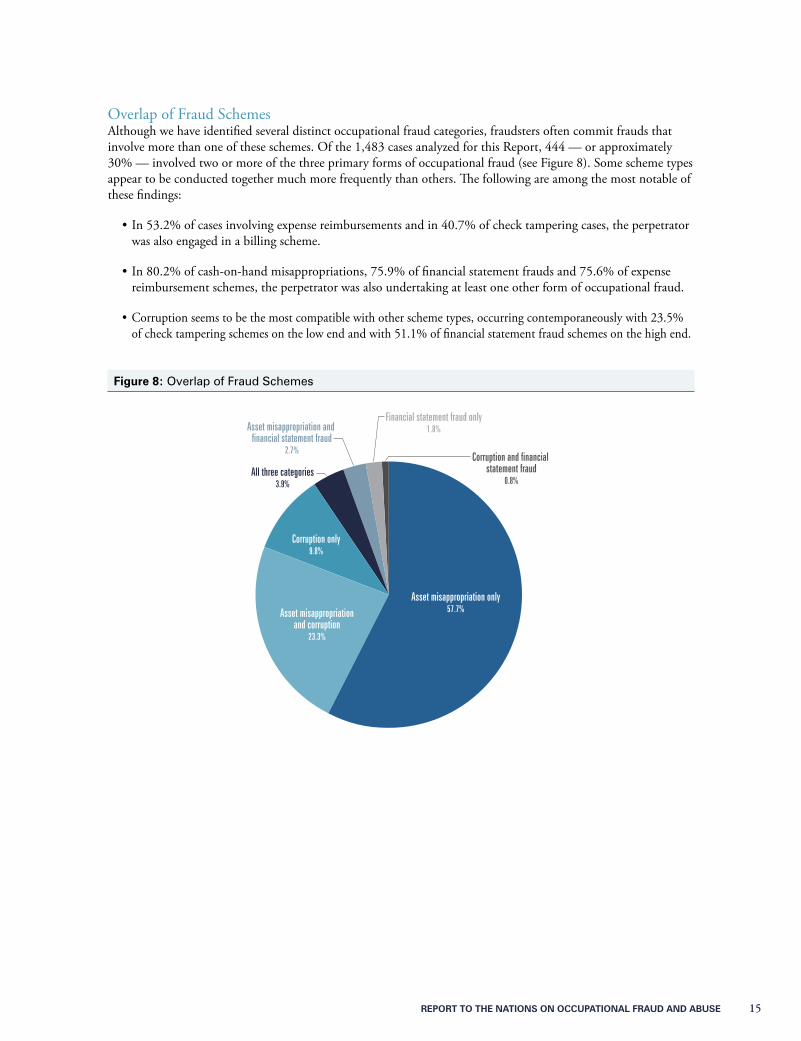
Overlap of Fraud SchemesAlthough we have identified several distinct occupational fraud categories, fraudsters often commit frauds that involve more than one of these schemes. Of the 1,483 cases analyzed for this Report, 444 — or approximately 30% — involved two or more of the three primary forms of occupational fraud (see Figure 8). Some scheme types appear to be conducted together much more frequently than others. The following are among the most notable of these findings:
•In 53.2% of cases involving expense reimbursements and in 40.7% of check tampering cases, the perpetrator was also engaged in a billing scheme.
•In 80.2% of cash-on-hand misappropriations, 75.9% of financial statement frauds and 75.6% of expense reimbursement schemes, the perpetrator was also undertaking at least one other form of occupational fraud.
•Corruption seems to be the most compatible with other scheme types, occurring contemporaneously with 23.5% of check tampering schemes on the low end and with 51.1% of financial statement fraud schemes on the high end.
Figure 8: Overlap of Fraud Schemes
6.6% 2.9%
Asset misappropriation and corruption
23.3%
Corruption only9.8%
Asset misappropriation only 57.7%
All three categories3.9%
Asset misappropriation and financial statement fraud
2.7%
Financial statement fraud only1.8%
Corruption and financial statement fraud
0.8%
16 REPORT TO THE NATIONS ON OCCUPATIONAL FRAUD AND ABUSE
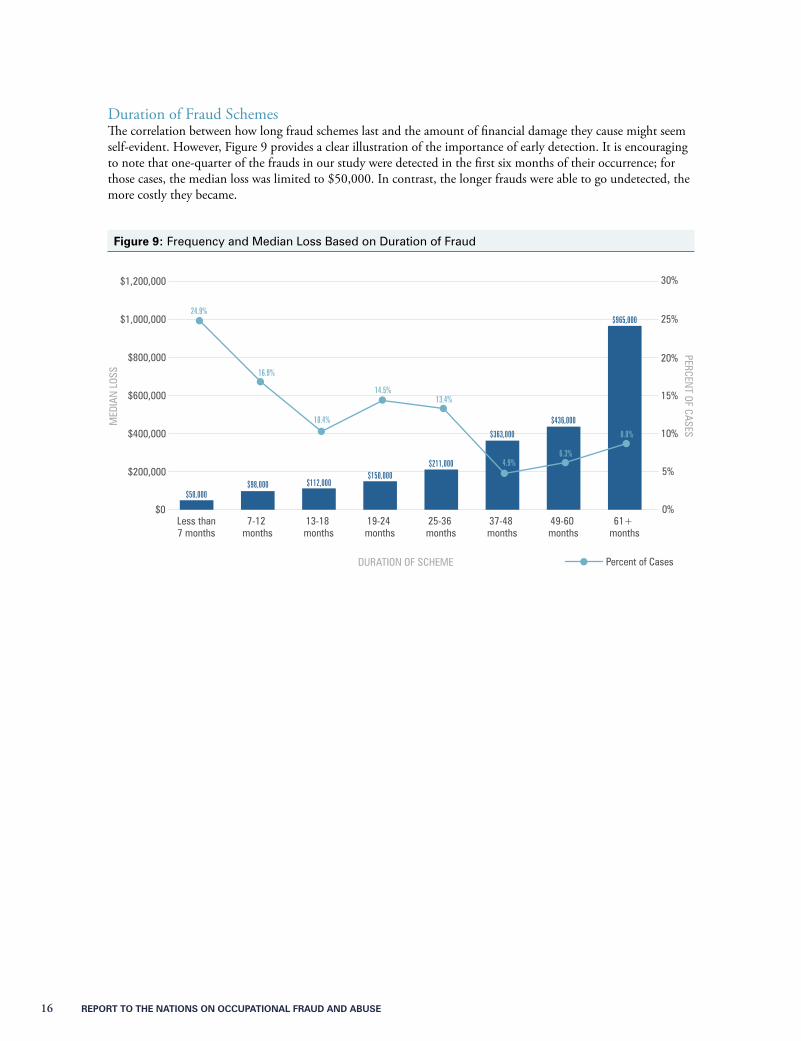
Duration of Fraud SchemesThe correlation between how long fraud schemes last and the amount of financial damage they cause might seem self-evident. However, Figure 9 provides a clear illustration of the importance of early detection. It is encouraging to note that one-quarter of the frauds in our study were detected in the first six months of their occurrence; for those cases, the median loss was limited to $50,000. In contrast, the longer frauds were able to go undetected, the more costly they became.
Figure 9: Frequency and Median Loss Based on Duration of Fraud
$0
$200,000
$400,000
$600,000
$800,000
$1,000,000
$1,200,000
61+ months
49-60 months
37-48 months
25-36 months
19-24 months
13-18 months
7-12 months
Less than7 months
5%
10%
15%
20%
25%
30%
0%
DURATION OF SCHEME
MED
IAN
LOS
SPERCEN
T OF CASES
$50,000$98,000 $112,000
$150,000$211,000
$363,000
$436,000
$965,00024.9%
16.9%
10.4%
14.5%13.4%
4.9%6.3%
8.8%
Percent of Cases
REPORT TO THE NATIONS ON OCCUPATIONAL FRAUD AND ABUSE 17
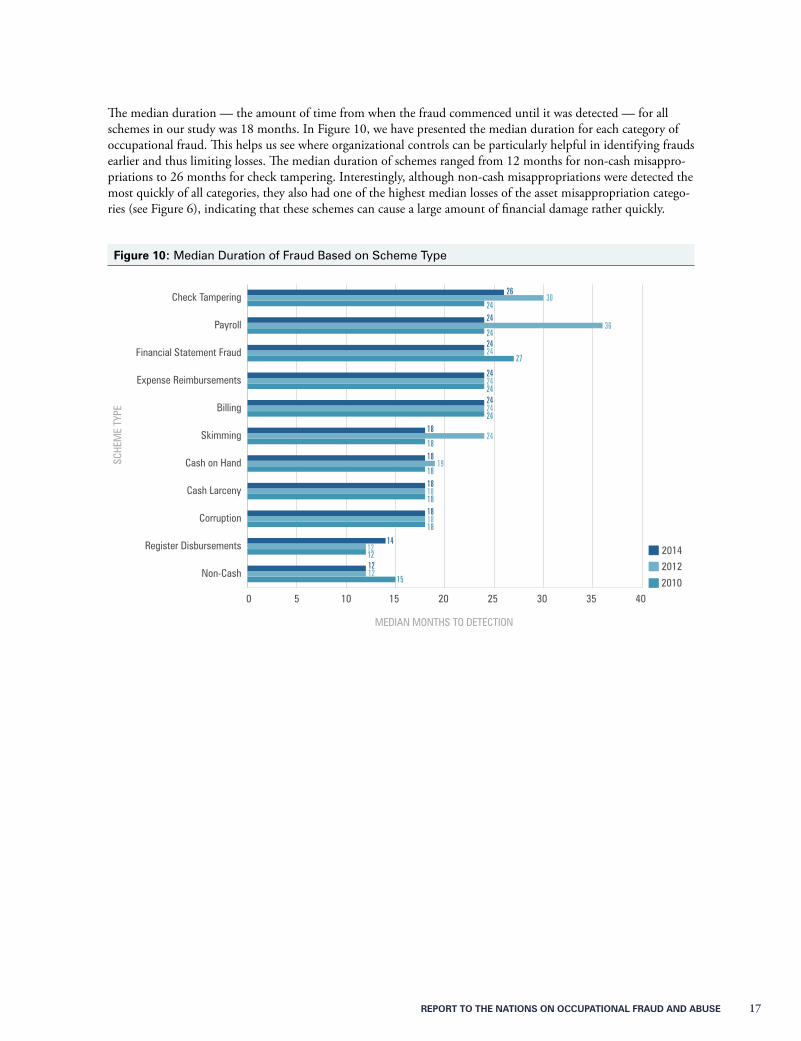
The median duration — the amount of time from when the fraud commenced until it was detected — for all schemes in our study was 18 months. In Figure 10, we have presented the median duration for each category of occupational fraud. This helps us see where organizational controls can be particularly helpful in identifying frauds earlier and thus limiting losses. The median duration of schemes ranged from 12 months for non-cash misappro-priations to 26 months for check tampering. Interestingly, although non-cash misappropriations were detected the most quickly of all categories, they also had one of the highest median losses of the asset misappropriation catego-ries (see Figure 6), indicating that these schemes can cause a large amount of financial damage rather quickly.
Figure 10: Median Duration of Fraud Based on Scheme Type
SCHE
ME
TYPE
MEDIAN MONTHS TO DETECTION
0 5 10 15 20 25 30 35 402010
2012
2014
Non-Cash
Register Disbursements
Corruption
Cash Larceny
Cash on Hand
Skimming
Billing
Expense Reimbursements
Financial Statement Fraud
Payroll
Check Tampering26
302424
36242424
27
242424242424
18
1824
18
1819
18
1818
18
18
18
12
1212
1215
14

18 REPORT TO THE NATIONS ON OCCUPATIONAL FRAUD AND ABUSE
Detection of Fraud Schemes
According to the fraud triangle theory — that those who commit occupational fraud tend to have a perceived financial need, opportunity and rationalization — the threat of likely detection is one of the most powerful factors in fraud prevention because it all but eliminates the fraudster’s perceived opportunity. In this Report and past versions, we asked respondents to provide infor-mation on how their occupational fraud schemes were first detected. One of the recurring trends we see is that some detection methods are more effective than others. When comparing the initial detection method to other information, such as the fraud’s duration and the finan-cial damage caused, we found substantial differences among the various ways frauds were uncovered. Detec-tion method, therefore, is directly related to both fraud prevention and loss mitigation.
Additionally, the manner by which frauds are detected is not purely incidental. Our data suggests that the likelihood of discovering fraud in particular ways can be shaped by the procedures and con-trols that an organization has in place. This information can help organizations detect frauds more efficiently.
Tips are consistently the most common detec-tion method for cases of occupational fraud by a significant margin.
REPORT TO THE NATIONS ON OCCUPATIONAL FRAUD AND ABUSE 19
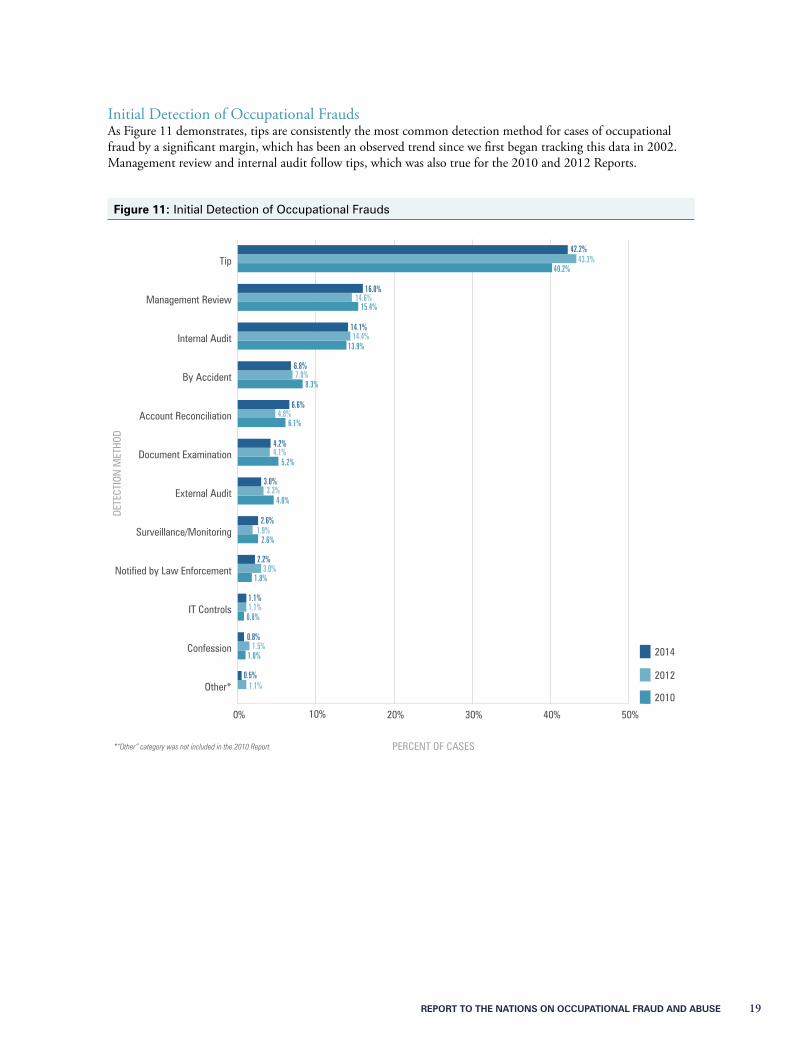
Initial Detection of Occupational FraudsAs Figure 11 demonstrates, tips are consistently the most common detection method for cases of occupational fraud by a significant margin, which has been an observed trend since we first began tracking this data in 2002. Management review and internal audit follow tips, which was also true for the 2010 and 2012 Reports.
Figure 11: Initial Detection of Occupational Frauds
0% 10% 20% 30% 40% 50%
2014
2012
2010Other*
Confession
IT Controls
Notified by Law Enforcement
Surveillance/Monitoring
External Audit
Document Examination
Account Reconciliation
By Accident
Internal Audit
Management Review
Tip
DETE
CTIO
N M
ETHO
D
PERCENT OF CASES*“Other” category was not included in the 2010 Report.
42.2%43.3%
40.2%
16.0%14.6%
15.4%
14.1%14.4%
13.9%
6.8%7.0%
8.3%
6.6%4.8%
6.1%
4.2%4.1%
5.2%
3.0%3.3%
4.6%
2.6%1.9%
2.6%
2.2%3.0%
1.8%
1.1%1.1%
0.8%
0.8%1.5%
1.0%
0.5%1.1%
20 REPORT TO THE NATIONS ON OCCUPATIONAL FRAUD AND ABUSE
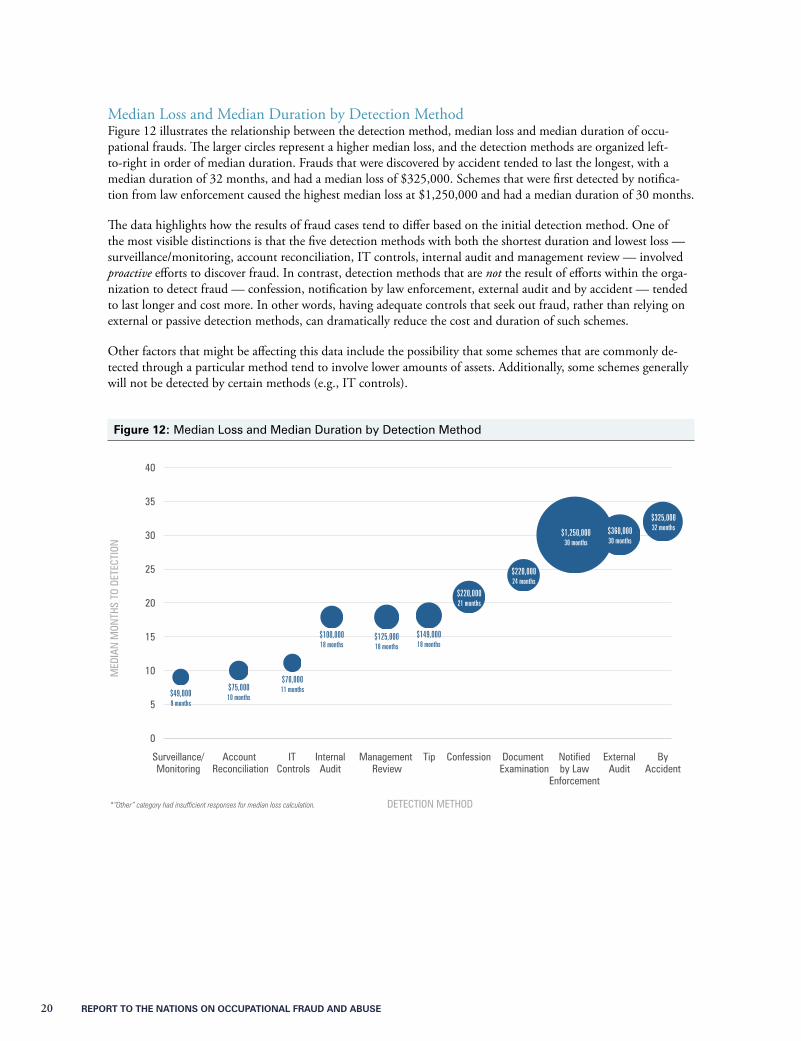
Median Loss and Median Duration by Detection MethodFigure 12 illustrates the relationship between the detection method, median loss and median duration of occu-pational frauds. The larger circles represent a higher median loss, and the detection methods are organized left-to-right in order of median duration. Frauds that were discovered by accident tended to last the longest, with a median duration of 32 months, and had a median loss of $325,000. Schemes that were first detected by notifica-tion from law enforcement caused the highest median loss at $1,250,000 and had a median duration of 30 months.
The data highlights how the results of fraud cases tend to differ based on the initial detection method. One of the most visible distinctions is that the five detection methods with both the shortest duration and lowest loss — surveillance/monitoring, account reconciliation, IT controls, internal audit and management review — involved proactive efforts to discover fraud. In contrast, detection methods that are not the result of efforts within the orga-nization to detect fraud — confession, notification by law enforcement, external audit and by accident — tended to last longer and cost more. In other words, having adequate controls that seek out fraud, rather than relying on external or passive detection methods, can dramatically reduce the cost and duration of such schemes.
Other factors that might be affecting this data include the possibility that some schemes that are commonly de-tected through a particular method tend to involve lower amounts of assets. Additionally, some schemes generally will not be detected by certain methods (e.g., IT controls).
Figure 12: Median Loss and Median Duration by Detection Method
0
5
10
15
20
25
30
35
40
By Accident
External Audit
Notified by Law
Enforcement
Document Examination
ConfessionTipManagement Review
Internal Audit
IT Controls
Account Reconciliation
Surveillance/Monitoring
MED
IAN
MON
THS
TO D
ETEC
TION
DETECTION METHOD
$49,0009 months
$75,00010 months
$70,00011 months
$100,00018 months
$125,00018 months
$149,00018 months
$220,00021 months
$220,00024 months
$360,00030 months
$325,00032 months
$1,250,00030 months
*“Other” category had insufficient responses for median loss calculation.
REPORT TO THE NATIONS ON OCCUPATIONAL FRAUD AND ABUSE 21
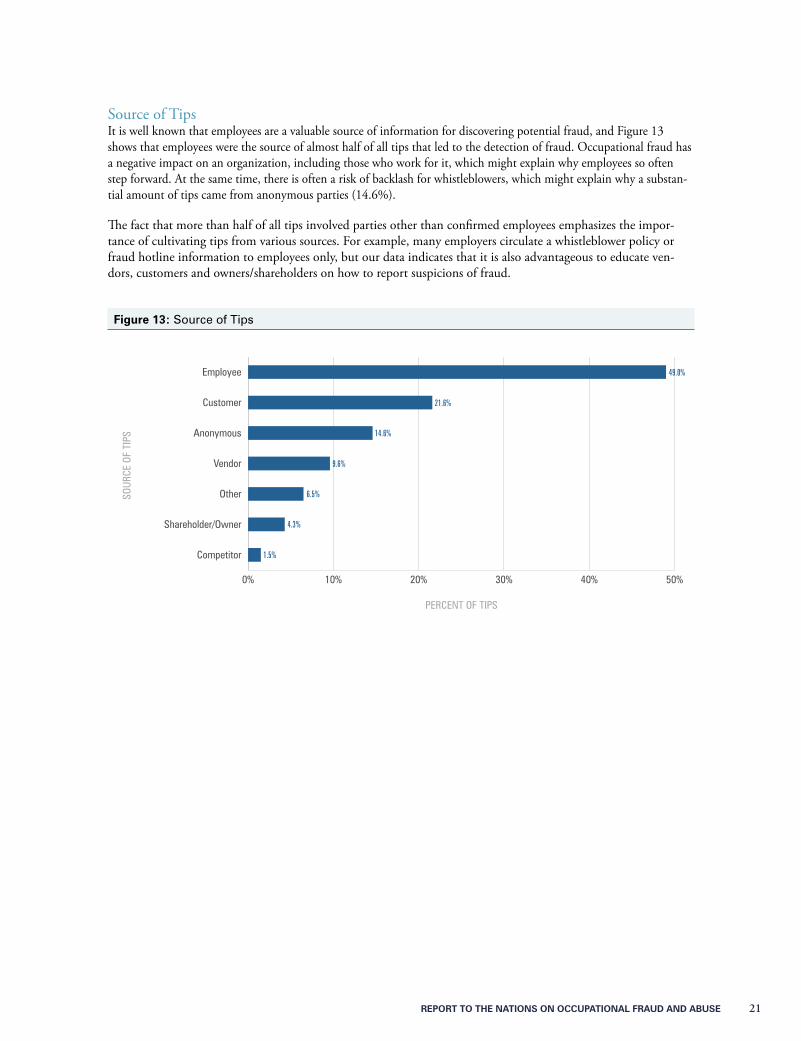
Source of TipsIt is well known that employees are a valuable source of information for discovering potential fraud, and Figure 13 shows that employees were the source of almost half of all tips that led to the detection of fraud. Occupational fraud has a negative impact on an organization, including those who work for it, which might explain why employees so often step forward. At the same time, there is often a risk of backlash for whistleblowers, which might explain why a substan-tial amount of tips came from anonymous parties (14.6%).
The fact that more than half of all tips involved parties other than confirmed employees emphasizes the impor-tance of cultivating tips from various sources. For example, many employers circulate a whistleblower policy or fraud hotline information to employees only, but our data indicates that it is also advantageous to educate ven-dors, customers and owners/shareholders on how to report suspicions of fraud.
Figure 13: Source of Tips
0% 10% 20% 30% 40% 50%
Competitor
Shareholder/Owner
Other
Vendor
Anonymous
Customer
Employee
SOUR
CE O
F TI
PS
PERCENT OF TIPS
49.0%
21.6%
14.6%
9.6%
6.5%
4.3%
1.5%
22 REPORT TO THE NATIONS ON OCCUPATIONAL FRAUD AND ABUSE
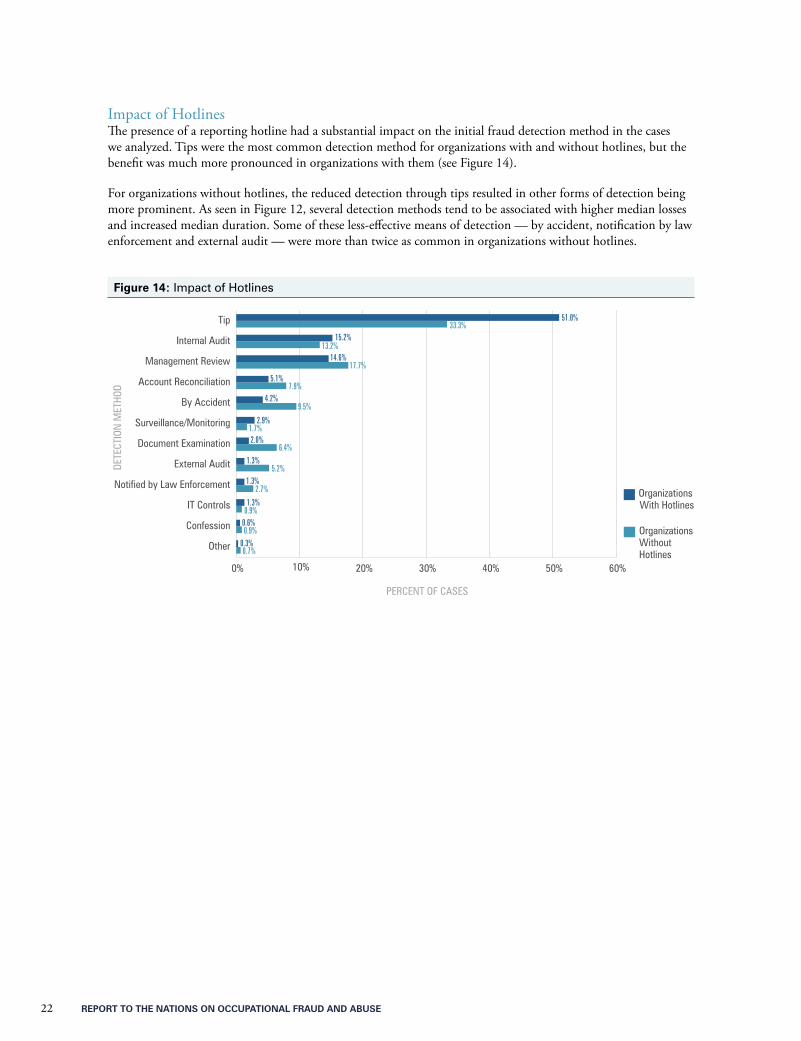
Impact of HotlinesThe presence of a reporting hotline had a substantial impact on the initial fraud detection method in the cases we analyzed. Tips were the most common detection method for organizations with and without hotlines, but the benefit was much more pronounced in organizations with them (see Figure 14).
For organizations without hotlines, the reduced detection through tips resulted in other forms of detection being more prominent. As seen in Figure 12, several detection methods tend to be associated with higher median losses and increased median duration. Some of these less-effective means of detection — by accident, notification by law enforcement and external audit — were more than twice as common in organizations without hotlines.
Figure 14: Impact of Hotlines
0% 10% 20% 30% 40% 50% 60%
Organizations Without Hotlines
Organizations With Hotlines
Other
Confession
IT Controls
Notified by Law Enforcement
External Audit
Document Examination
Surveillance/Monitoring
By Accident
Account Reconciliation
Management Review
Internal Audit
Tip
DETE
CTIO
N M
ETHO
D
PERCENT OF CASES
51.0%33.3%
15.2%13.2%
14.6%17.7%
5.1%7.9%
4.2%9.5%
2.9%1.7%2.0%
6.4%1.3%
5.2%1.3%
2.7%
1.3%0.9%
0.6%0.9%
0.3%0.7%
REPORT TO THE NATIONS ON OCCUPATIONAL FRAUD AND ABUSE 23
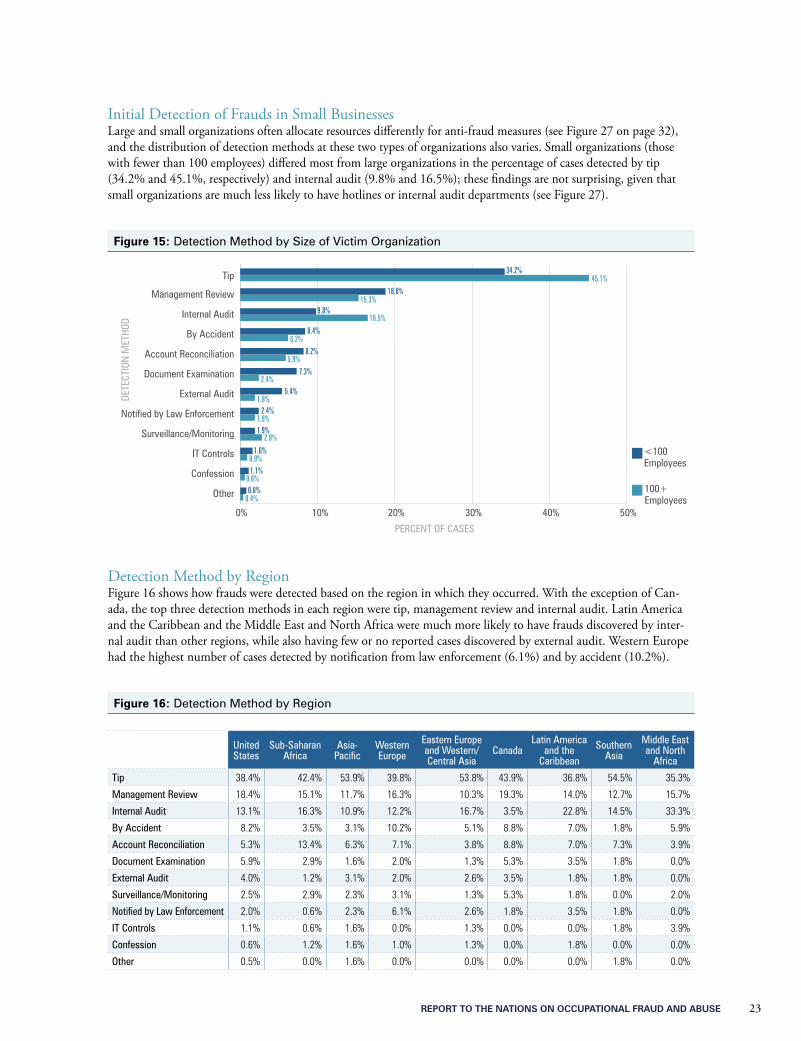
Initial Detection of Frauds in Small BusinessesLarge and small organizations often allocate resources differently for anti-fraud measures (see Figure 27 on page 32), and the distribution of detection methods at these two types of organizations also varies. Small organizations (those with fewer than 100 employees) differed most from large organizations in the percentage of cases detected by tip (34.2% and 45.1%, respectively) and internal audit (9.8% and 16.5%); these findings are not surprising, given that small organizations are much less likely to have hotlines or internal audit departments (see Figure 27).
Figure 15: Detection Method by Size of Victim Organization
0% 10% 20% 30% 40% 50%
100+ Employees
<100 Employees
Other
Confession
IT Controls
Surveillance/Monitoring
Notified by Law Enforcement
External Audit
Document Examination
Account Reconciliation
By Accident
Internal Audit
Management Review
Tip
DETE
CTIO
N M
ETHO
D
PERCENT OF CASES
0.8%0.4%
1.1%0.6%
1.6%0.9%
1.9%2.8%
2.4%1.9%
5.4%1.9%
7.3%2.4%
8.2%5.9%
8.4%6.2%
9.8%16.5%
18.8%15.3%
34.2%45.1%
Detection Method by RegionFigure 16 shows how frauds were detected based on the region in which they occurred. With the exception of Can-ada, the top three detection methods in each region were tip, management review and internal audit. Latin America and the Caribbean and the Middle East and North Africa were much more likely to have frauds discovered by inter-nal audit than other regions, while also having few or no reported cases discovered by external audit. Western Europe had the highest number of cases detected by notification from law enforcement (6.1%) and by accident (10.2%).
Figure 16: Detection Method by Region
United States
Sub-Saharan Africa
Asia-Pacific
Western Europe
Eastern Europe and Western/Central Asia
CanadaLatin America
and the Caribbean
Southern Asia
Middle East and North
Africa
Tip 38.4% 42.4% 53.9% 39.8% 53.8% 43.9% 36.8% 54.5% 35.3%
Management Review 18.4% 15.1% 11.7% 16.3% 10.3% 19.3% 14.0% 12.7% 15.7%
Internal Audit 13.1% 16.3% 10.9% 12.2% 16.7% 3.5% 22.8% 14.5% 33.3%
By Accident 8.2% 3.5% 3.1% 10.2% 5.1% 8.8% 7.0% 1.8% 5.9%
Account Reconciliation 5.3% 13.4% 6.3% 7.1% 3.8% 8.8% 7.0% 7.3% 3.9%
Document Examination 5.9% 2.9% 1.6% 2.0% 1.3% 5.3% 3.5% 1.8% 0.0%
External Audit 4.0% 1.2% 3.1% 2.0% 2.6% 3.5% 1.8% 1.8% 0.0%
Surveillance/Monitoring 2.5% 2.9% 2.3% 3.1% 1.3% 5.3% 1.8% 0.0% 2.0%
Notified by Law Enforcement 2.0% 0.6% 2.3% 6.1% 2.6% 1.8% 3.5% 1.8% 0.0%
IT Controls 1.1% 0.6% 1.6% 0.0% 1.3% 0.0% 0.0% 1.8% 3.9%
Confession 0.6% 1.2% 1.6% 1.0% 1.3% 0.0% 1.8% 0.0% 0.0%
Other 0.5% 0.0% 1.6% 0.0% 0.0% 0.0% 0.0% 1.8% 0.0%
24 REPORT TO THE NATIONS ON OCCUPATIONAL FRAUD AND ABUSE
Victim Organizations
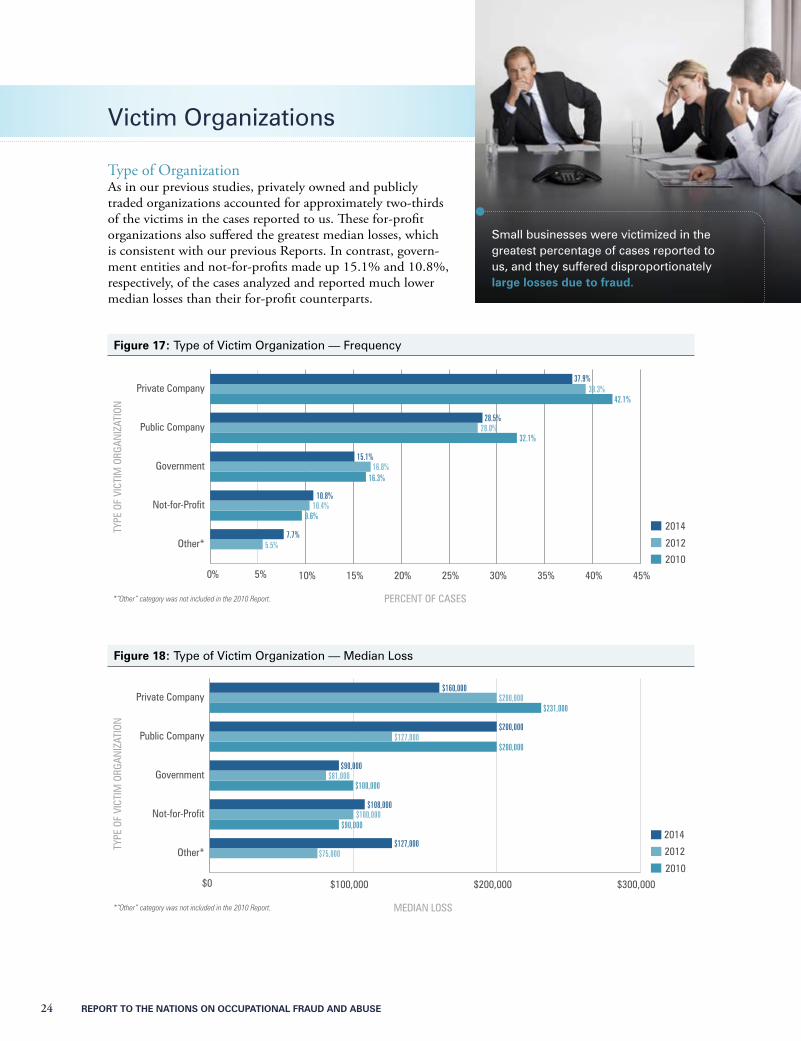
Type of OrganizationAs in our previous studies, privately owned and publicly traded organizations accounted for approximately two-thirds of the victims in the cases reported to us. These for-profit organizations also suffered the greatest median losses, which is consistent with our previous Reports. In contrast, govern-ment entities and not-for-profits made up 15.1% and 10.8%, respectively, of the cases analyzed and reported much lower median losses than their for-profit counterparts.
Figure 17: Type of Victim Organization — Frequency
0% 5% 10% 15% 20% 25% 30% 35% 40% 45%
2010
2012
2014
Other*
Not-for-Profit
Government
Public Company
Private Company
TYPE
OF
VICT
IM O
RGAN
IZAT
ION
PERCENT OF CASES
15.1%16.8%
16.3%
*“Other” category was not included in the 2010 Report.
37.9%39.3%
42.1%
28.5%28.0%
32.1%
10.8%10.4%
9.6%
7.7%5.5%
Figure 18: Type of Victim Organization — Median Loss
$0 $100,000 $200,000 $300,000
2010
2012
2014
Other*
Not-for-Profit
Government
Public Company
Private Company
TYPE
OF
VICT
IM O
RGAN
IZAT
ION
MEDIAN LOSS*“Other” category was not included in the 2010 Report.
$160,000$200,000
$231,000
$200,000$127,000
$200,000
$90,000$81,000
$100,000
$108,000$100,000
$90,000
$127,000$75,000
Small businesses were victimized in the greatest percentage of cases reported to us, and they suffered disproportionately large losses due to fraud.
REPORT TO THE NATIONS ON OCCUPATIONAL FRAUD AND ABUSE 25
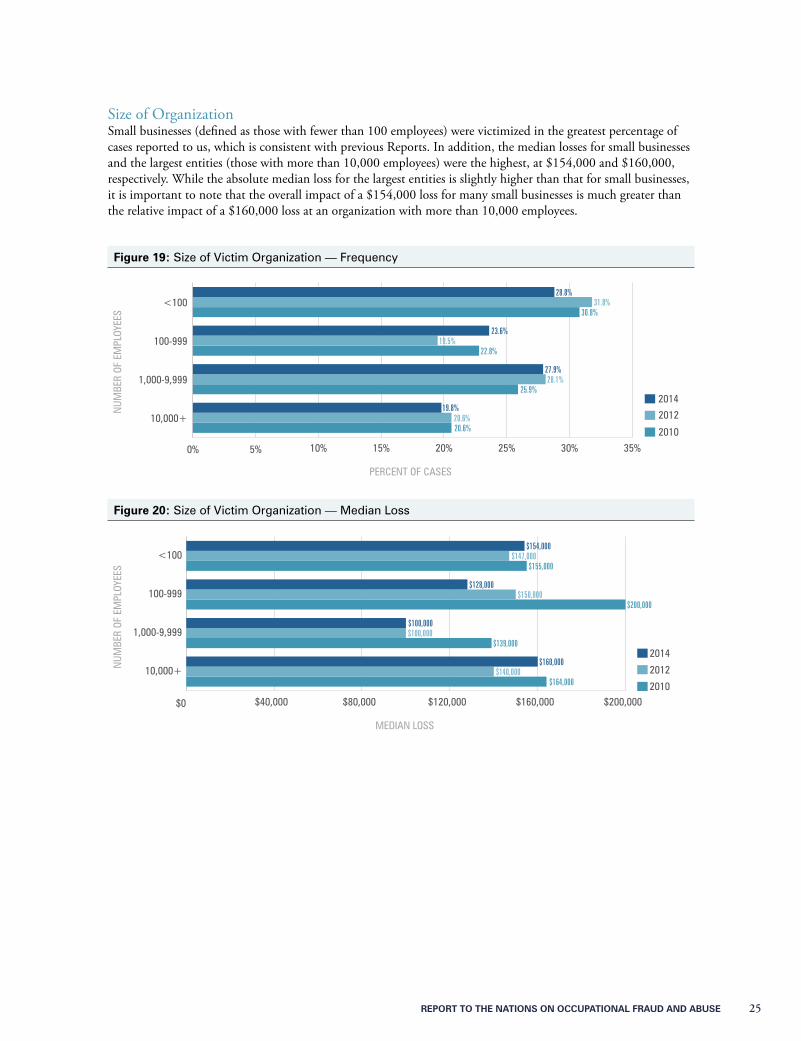
Size of OrganizationSmall businesses (defined as those with fewer than 100 employees) were victimized in the greatest percentage of cases reported to us, which is consistent with previous Reports. In addition, the median losses for small businesses and the largest entities (those with more than 10,000 employees) were the highest, at $154,000 and $160,000, respectively. While the absolute median loss for the largest entities is slightly higher than that for small businesses, it is important to note that the overall impact of a $154,000 loss for many small businesses is much greater than the relative impact of a $160,000 loss at an organization with more than 10,000 employees.
Figure 19: Size of Victim Organization — Frequency
0% 5% 10% 15% 20% 25% 30% 35%
2010
2012
2014
10,000+
1,000-9,999
100-999
<100
NUM
BER
OF E
MPL
OYEE
S
PERCENT OF CASES
28.8%31.8%
30.8%
23.6%19.5%
22.8%
27.9%28.1%
25.9%
19.8%20.6%20.6%
Figure 20: Size of Victim Organization — Median Loss
$0 $40,000 $80,000 $120,000 $160,000 $200,0002010
2012
2014
10,000+
1,000-9,999
100-999
<100
NUM
BER
OF E
MPL
OYEE
S
MEDIAN LOSS
$154,000$147,000
$155,000
$128,000$150,000
$200,000
$100,000$100,000
$139,000
$160,000$140,000
$164,000
26 REPORT TO THE NATIONS ON OCCUPATIONAL FRAUD AND ABUSE
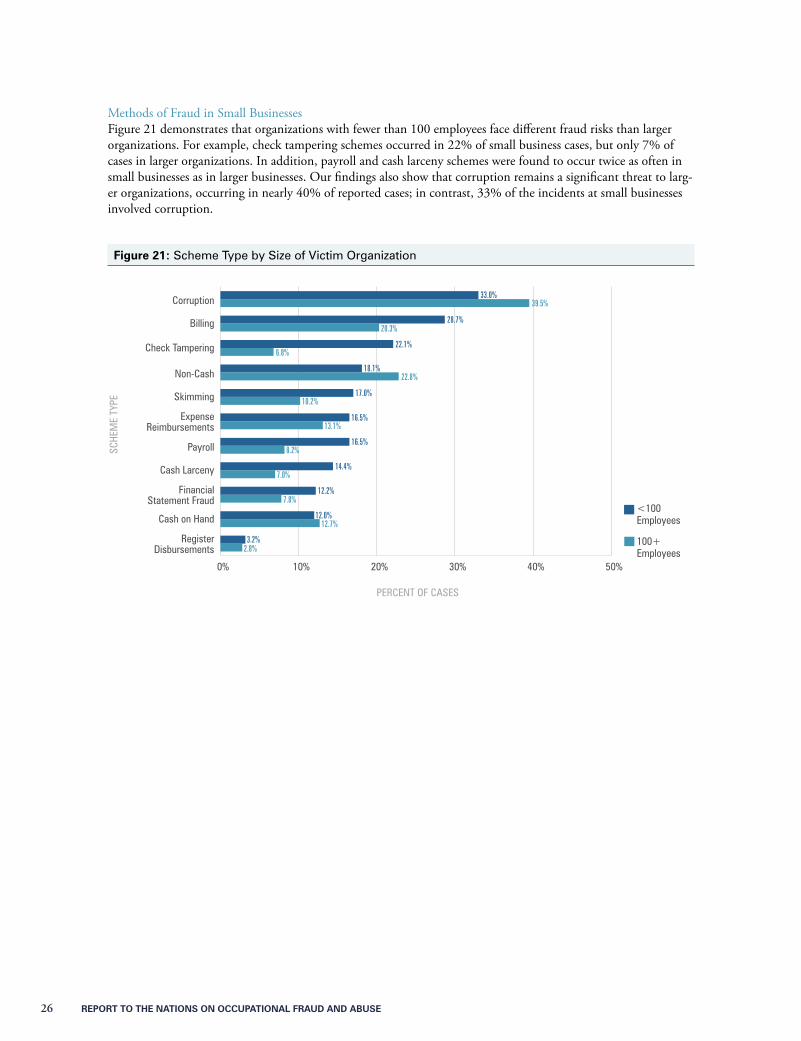
Methods of Fraud in Small BusinessesFigure 21 demonstrates that organizations with fewer than 100 employees face different fraud risks than larger organizations. For example, check tampering schemes occurred in 22% of small business cases, but only 7% of cases in larger organizations. In addition, payroll and cash larceny schemes were found to occur twice as often in small businesses as in larger businesses. Our findings also show that corruption remains a significant threat to larg-er organizations, occurring in nearly 40% of reported cases; in contrast, 33% of the incidents at small businesses involved corruption.
Figure 21: Scheme Type by Size of Victim Organization
0% 10% 20% 30% 40% 50%
100+ Employees
<100 Employees
RegisterDisbursements
Cash on Hand
FinancialStatement Fraud
Cash Larceny
Payroll
ExpenseReimbursements
Skimming
Non-Cash
Check Tampering
Billing
Corruption
SCHE
ME
TYPE
PERCENT OF CASES
33.0%39.5%
28.7%20.3%
22.1%6.8%
18.1%22.8%
17.0%10.2%
16.5%13.1%
16.5%8.2%
14.4%7.0%
12.2%7.8%
12.0%12.7%
3.2%2.8%
REPORT TO THE NATIONS ON OCCUPATIONAL FRAUD AND ABUSE 27
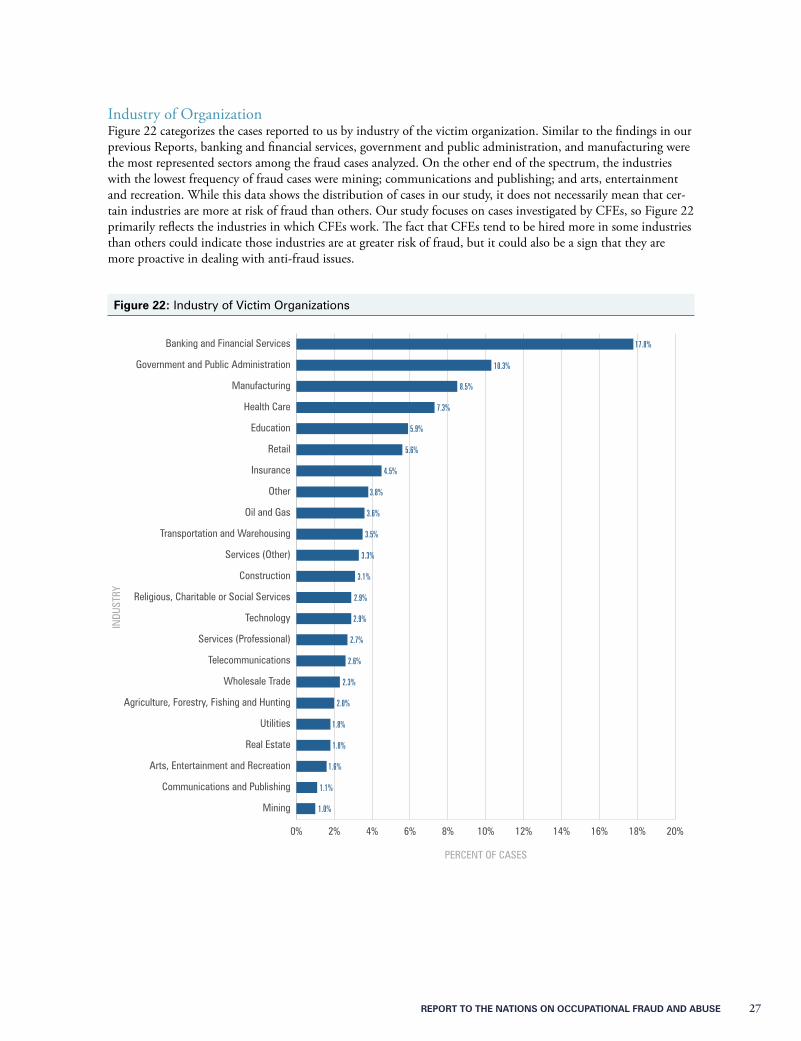
Industry of OrganizationFigure 22 categorizes the cases reported to us by industry of the victim organization. Similar to the findings in our previous Reports, banking and financial services, government and public administration, and manufacturing were the most represented sectors among the fraud cases analyzed. On the other end of the spectrum, the industries with the lowest frequency of fraud cases were mining; communications and publishing; and arts, entertainment and recreation. While this data shows the distribution of cases in our study, it does not necessarily mean that cer-tain industries are more at risk of fraud than others. Our study focuses on cases investigated by CFEs, so Figure 22 primarily reflects the industries in which CFEs work. The fact that CFEs tend to be hired more in some industries than others could indicate those industries are at greater risk of fraud, but it could also be a sign that they are more proactive in dealing with anti-fraud issues.
Figure 22: Industry of Victim Organizations
0% 2% 4% 6% 8% 10% 12% 14% 16% 18% 20%
Mining
Communications and Publishing
Arts, Entertainment and Recreation
Real Estate
Utilities
Agriculture, Forestry, Fishing and Hunting
Wholesale Trade
Telecommunications
Services (Professional)
Technology
Religious, Charitable or Social Services
Construction
Services (Other)
Transportation and Warehousing
Oil and Gas
Other
Insurance
Retail
Education
Health Care
Manufacturing
Government and Public Administration
Banking and Financial Services
IN
DUST
RY
PERCENT OF CASES
17.8%
10.3%
8.5%
7.3%
5.9%
5.6%
4.5%
3.8%
3.6%
3.5%
3.3%
3.1%
2.9%
2.9%
2.7%
2.6%
2.3%
2.0%
1.8%
1.0%
1.1%
1.6%
1.8%
28 REPORT TO THE NATIONS ON OCCUPATIONAL FRAUD AND ABUSE
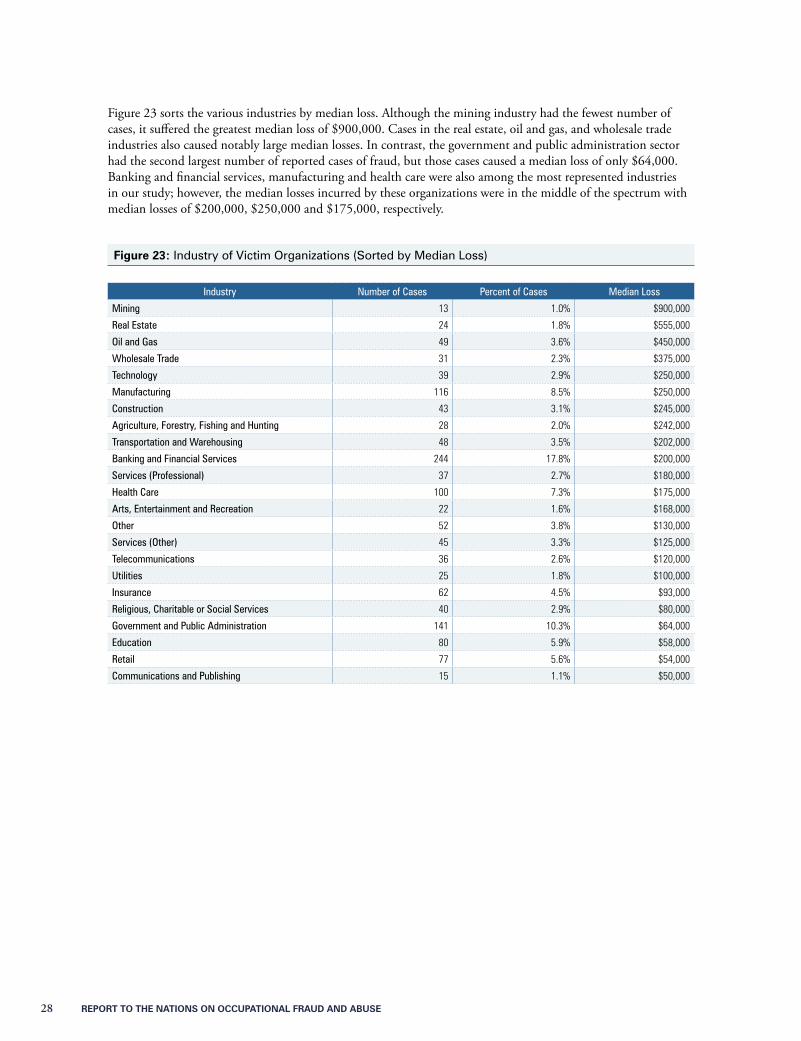
Figure 23 sorts the various industries by median loss. Although the mining industry had the fewest number of cases, it suffered the greatest median loss of $900,000. Cases in the real estate, oil and gas, and wholesale trade industries also caused notably large median losses. In contrast, the government and public administration sector had the second largest number of reported cases of fraud, but those cases caused a median loss of only $64,000. Banking and financial services, manufacturing and health care were also among the most represented industries in our study; however, the median losses incurred by these organizations were in the middle of the spectrum with median losses of $200,000, $250,000 and $175,000, respectively.
Figure 23: Industry of Victim Organizations (Sorted by Median Loss)
Industry Number of Cases Percent of Cases Median Loss
Mining 13 1.0% $900,000
Real Estate 24 1.8% $555,000
Oil and Gas 49 3.6% $450,000
Wholesale Trade 31 2.3% $375,000
Technology 39 2.9% $250,000
Manufacturing 116 8.5% $250,000
Construction 43 3.1% $245,000
Agriculture, Forestry, Fishing and Hunting 28 2.0% $242,000
Transportation and Warehousing 48 3.5% $202,000
Banking and Financial Services 244 17.8% $200,000
Services (Professional) 37 2.7% $180,000
Health Care 100 7.3% $175,000
Arts, Entertainment and Recreation 22 1.6% $168,000
Other 52 3.8% $130,000
Services (Other) 45 3.3% $125,000
Telecommunications 36 2.6% $120,000
Utilities 25 1.8% $100,000
Insurance 62 4.5% $93,000
Religious, Charitable or Social Services 40 2.9% $80,000
Government and Public Administration 141 10.3% $64,000
Education 80 5.9% $58,000
Retail 77 5.6% $54,000
Communications and Publishing 15 1.1% $50,000
REPORT TO THE NATIONS ON OCCUPATIONAL FRAUD AND ABUSE 29
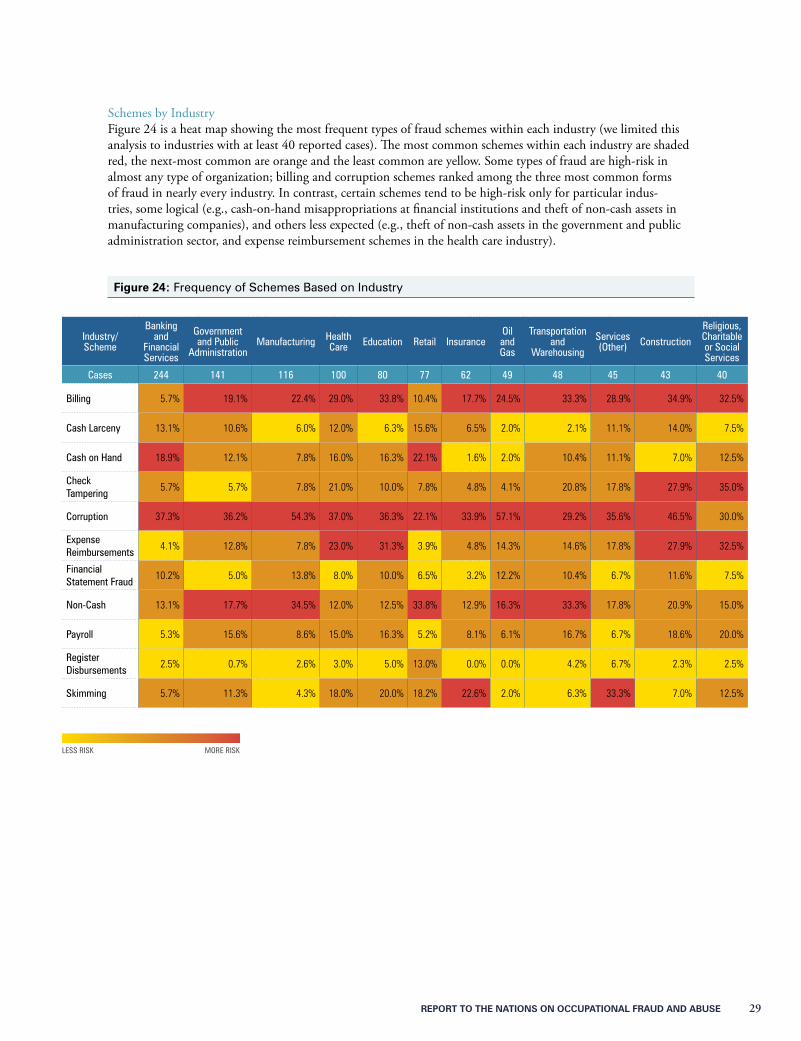
Schemes by IndustryFigure 24 is a heat map showing the most frequent types of fraud schemes within each industry (we limited this analysis to industries with at least 40 reported cases). The most common schemes within each industry are shaded red, the next-most common are orange and the least common are yellow. Some types of fraud are high-risk in almost any type of organization; billing and corruption schemes ranked among the three most common forms of fraud in nearly every industry. In contrast, certain schemes tend to be high-risk only for particular indus-tries, some logical (e.g., cash-on-hand misappropriations at financial institutions and theft of non-cash assets in manufacturing companies), and others less expected (e.g., theft of non-cash assets in the government and public administration sector, and expense reimbursement schemes in the health care industry).
Figure 24: Frequency of Schemes Based on Industry
LESS RISk MORE RISk
Industry/Scheme
Banking and
Financial Services
Government and Public
AdministrationManufacturing Health
Care Education Retail InsuranceOil and Gas
Transportation and
Warehousing
Services (Other) Construction
Religious, Charitable or Social Services
Cases 244 141 116 100 80 77 62 49 48 45 43 40
Billing 5.7% 19.1% 22.4% 29.0% 33.8% 10.4% 17.7% 24.5% 33.3% 28.9% 34.9% 32.5%
Cash Larceny 13.1% 10.6% 6.0% 12.0% 6.3% 15.6% 6.5% 2.0% 2.1% 11.1% 14.0% 7.5%
Cash on Hand 18.9% 12.1% 7.8% 16.0% 16.3% 22.1% 1.6% 2.0% 10.4% 11.1% 7.0% 12.5%
Check Tampering
5.7% 5.7% 7.8% 21.0% 10.0% 7.8% 4.8% 4.1% 20.8% 17.8% 27.9% 35.0%
Corruption 37.3% 36.2% 54.3% 37.0% 36.3% 22.1% 33.9% 57.1% 29.2% 35.6% 46.5% 30.0%
Expense Reimbursements
4.1% 12.8% 7.8% 23.0% 31.3% 3.9% 4.8% 14.3% 14.6% 17.8% 27.9% 32.5%
Financial Statement Fraud
10.2% 5.0% 13.8% 8.0% 10.0% 6.5% 3.2% 12.2% 10.4% 6.7% 11.6% 7.5%
Non-Cash 13.1% 17.7% 34.5% 12.0% 12.5% 33.8% 12.9% 16.3% 33.3% 17.8% 20.9% 15.0%
Payroll 5.3% 15.6% 8.6% 15.0% 16.3% 5.2% 8.1% 6.1% 16.7% 6.7% 18.6% 20.0%
Register Disbursements
2.5% 0.7% 2.6% 3.0% 5.0% 13.0% 0.0% 0.0% 4.2% 6.7% 2.3% 2.5%
Skimming 5.7% 11.3% 4.3% 18.0% 20.0% 18.2% 22.6% 2.0% 6.3% 33.3% 7.0% 12.5%
30 REPORT TO THE NATIONS ON OCCUPATIONAL FRAUD AND ABUSE
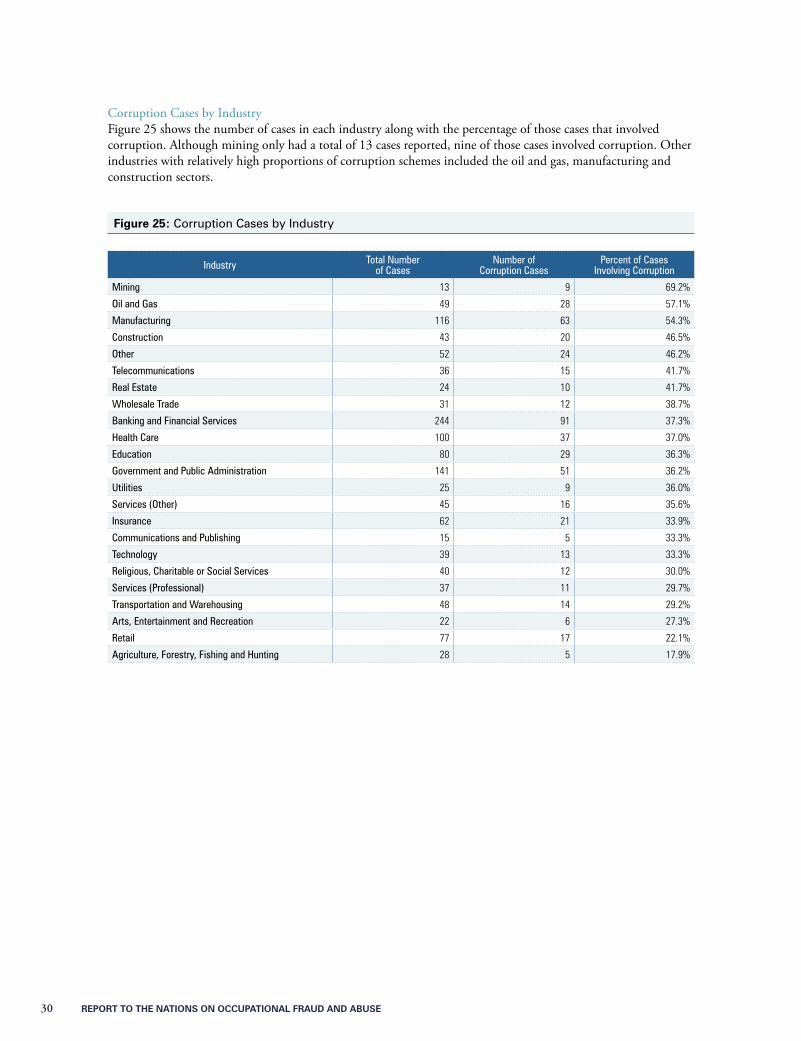
Corruption Cases by IndustryFigure 25 shows the number of cases in each industry along with the percentage of those cases that involved corruption. Although mining only had a total of 13 cases reported, nine of those cases involved corruption. Other industries with relatively high proportions of corruption schemes included the oil and gas, manufacturing and construction sectors.
Figure 25: Corruption Cases by Industry
Industry Total Number of Cases
Number of Corruption Cases
Percent of Cases Involving Corruption
Mining 13 9 69.2%
Oil and Gas 49 28 57.1%
Manufacturing 116 63 54.3%
Construction 43 20 46.5%
Other 52 24 46.2%
Telecommunications 36 15 41.7%
Real Estate 24 10 41.7%
Wholesale Trade 31 12 38.7%
Banking and Financial Services 244 91 37.3%
Health Care 100 37 37.0%
Education 80 29 36.3%
Government and Public Administration 141 51 36.2%
Utilities 25 9 36.0%
Services (Other) 45 16 35.6%
Insurance 62 21 33.9%
Communications and Publishing 15 5 33.3%
Technology 39 13 33.3%
Religious, Charitable or Social Services 40 12 30.0%
Services (Professional) 37 11 29.7%
Transportation and Warehousing 48 14 29.2%
Arts, Entertainment and Recreation 22 6 27.3%
Retail 77 17 22.1%
Agriculture, Forestry, Fishing and Hunting 28 5 17.9%

RepoRt to the NatioNs oN occupatioNal FRaud aNd abuse 31
Anti-Fraud Controls at the Victim OrganizationProactive fraud prevention and detection controls are a vital part in managing the risk of fraud, but are all anti-fraud controls created equal? As part of our survey, we asked participants to identify which of 18 common anti-fraud controls were present at the victim organization at the time the fraud occurred. The responses are reflected in Figure 26, which shows that external audits were the most common control enacted by the victim organizations, as they were present in more than 80% of the cases reported to us. But as noted in Figure 11 on page 19, external audits accounted for the detection of just 3% of the cases in our study. While external audits serve many important func-tions, this suggests they should not be strongly relied upon as a fraud detection tool.
With more than 42% of frauds being detected by tips (see Figure 11), hotlines ought to play a critical role in organi-zations’ anti-fraud programs. But of the organizations victimized by the frauds in our study, only 54% had a hotline mechanism in place, and less than 11% provided rewards for whistleblowers. These rates indicate that many organi-zations have room for improvement in encouraging the tips that so effectively help uncover fraudulent conduct.
Figure 26: Frequency of Anti-Fraud Controls
0% 10% 20% 30% 40% 50% 60% 70% 80% 90%
Rewards for Whistleblowers
Job Rotation/Mandatory Vacation
Surprise Audits
Formal Fraud Risk Assessments
Proactive Data Monitoring/Analysis
Dedicated Fraud Department, Function or Team
Anti-Fraud Policy
Fraud Training for Employees
Fraud Training for Managers/Executives
Employee Support Programs
Hotline
Independent Audit Committee
Management Review
External Audit of ICOFR
Management Certification of F/S
Internal Audit Department
Code of Conduct
External Audit of F/S
ANTI
-FRA
UD C
ONTR
OL
PERCENT OF CASES
81.4%
77.4%
70.6%
70.0%
65.2%
62.6%
62.0%
54.1%
52.4%
47.8%
47.8%
45.4%
38.6%
34.8%
33.5%
33.2%
19.9%
10.5%
the following key applies to Figures 26, 27, 37 and 38 (pages 31, 32 and 38):
External Audit of F/S = Independent external audits of the organization’s financial statements
External Audit of ICOFR = Independent audits of the organization’s internal controls over financial reporting
Management Certification of F/S = Management certification of the organization’s financial statements
32 REPORT TO THE NATIONS ON OCCUPATIONAL FRAUD AND ABUSE
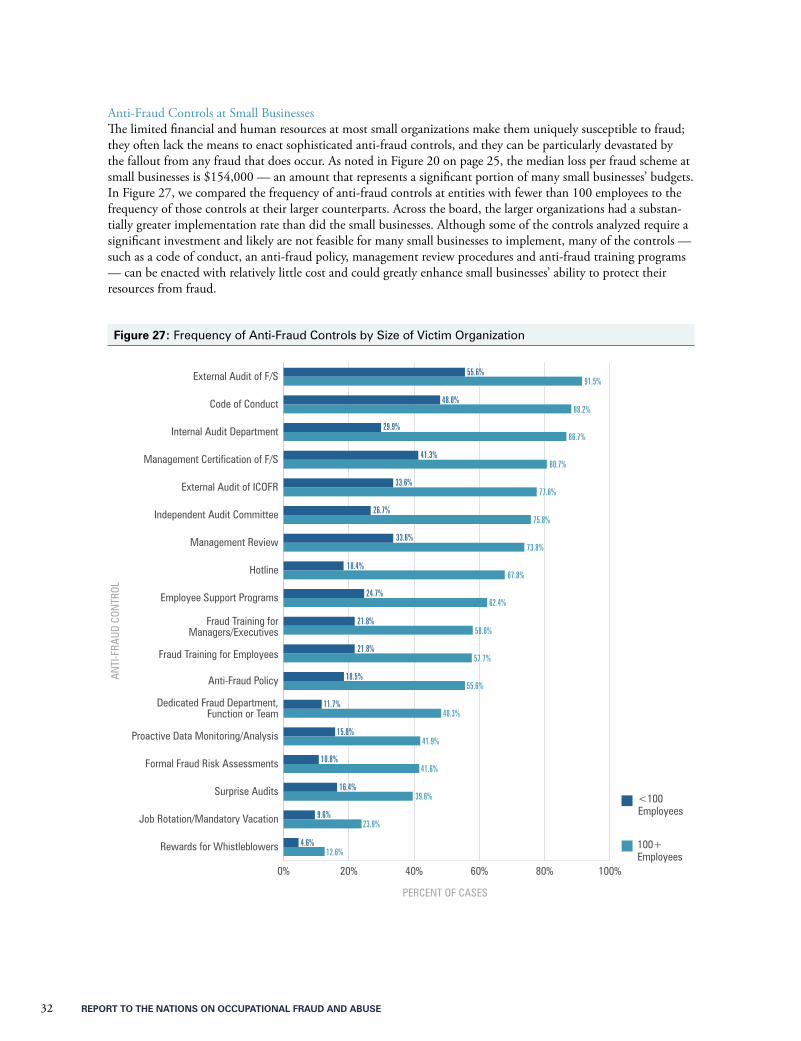
Anti-Fraud Controls at Small BusinessesThe limited financial and human resources at most small organizations make them uniquely susceptible to fraud; they often lack the means to enact sophisticated anti-fraud controls, and they can be particularly devastated by the fallout from any fraud that does occur. As noted in Figure 20 on page 25, the median loss per fraud scheme at small businesses is $154,000 — an amount that represents a significant portion of many small businesses’ budgets. In Figure 27, we compared the frequency of anti-fraud controls at entities with fewer than 100 employees to the frequency of those controls at their larger counterparts. Across the board, the larger organizations had a substan-tially greater implementation rate than did the small businesses. Although some of the controls analyzed require a significant investment and likely are not feasible for many small businesses to implement, many of the controls — such as a code of conduct, an anti-fraud policy, management review procedures and anti-fraud training programs — can be enacted with relatively little cost and could greatly enhance small businesses’ ability to protect their resources from fraud.
Figure 27: Frequency of Anti-Fraud Controls by Size of Victim Organization
0% 20% 40% 60% 80% 100%
Rewards for Whistleblowers
Job Rotation/Mandatory Vacation
Surprise Audits
Formal Fraud Risk Assessments
Proactive Data Monitoring/Analysis
Dedicated Fraud Department,Function or Team
Anti-Fraud Policy
Fraud Training for Employees
Fraud Training forManagers/Executives
Employee Support Programs
Hotline
Management Review
Independent Audit Committee
External Audit of ICOFR
Management Certification of F/S
Internal Audit Department
Code of Conduct
External Audit of F/S
ANTI
-FRA
UD C
ONTR
OL
PERCENT OF CASES
55.6%91.5%
48.0%88.2%
29.9%86.7%
41.3%80.7%
33.6%77.6%
26.7%75.8%
33.6%73.8%
18.4%67.8%
24.7%62.4%
21.8%58.0%
21.8%57.7%
18.5%55.6%
11.7%48.3%
15.8%41.9%
10.8%41.6%
16.4%39.6%
9.6%23.9%
4.6%12.6%
100+ Employees
<100 Employees
RepoRt to the NatioNs oN occupatioNal FRaud aNd abuse 33
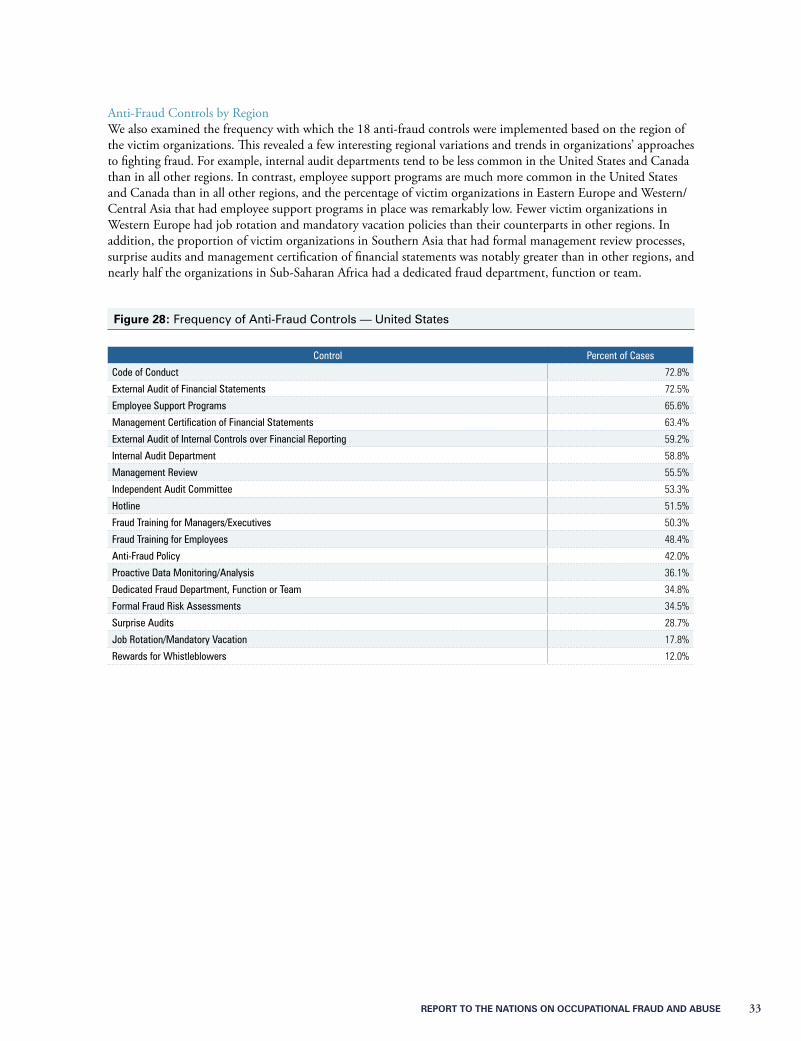
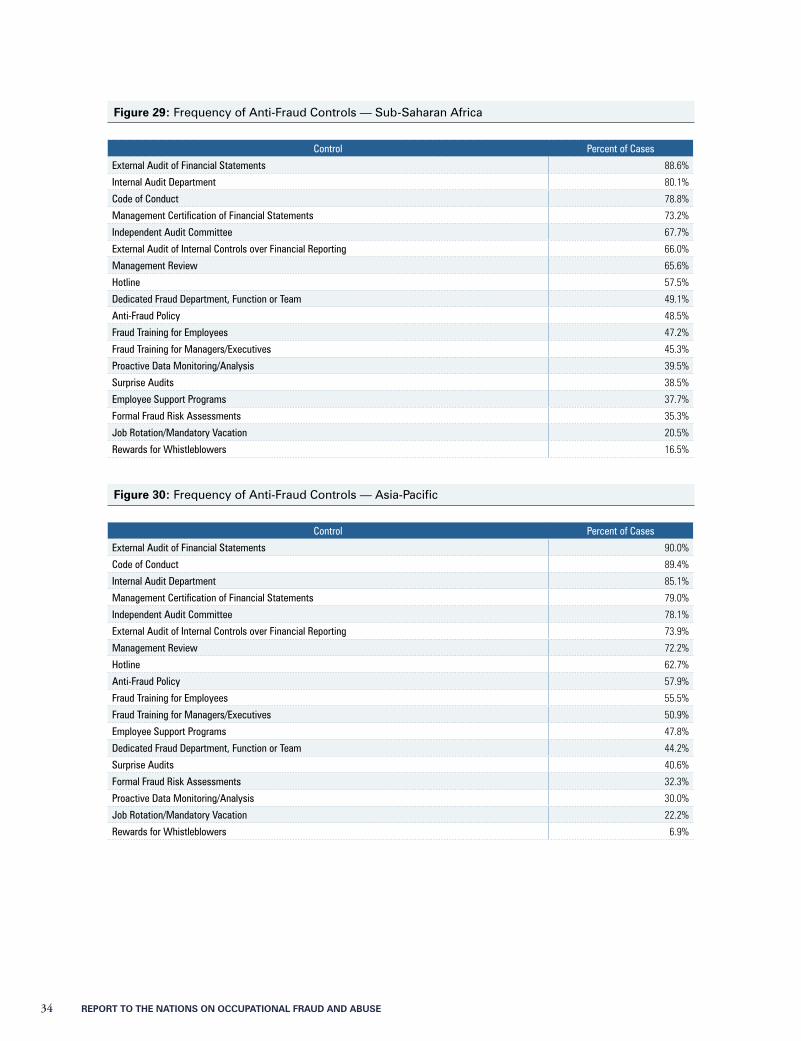
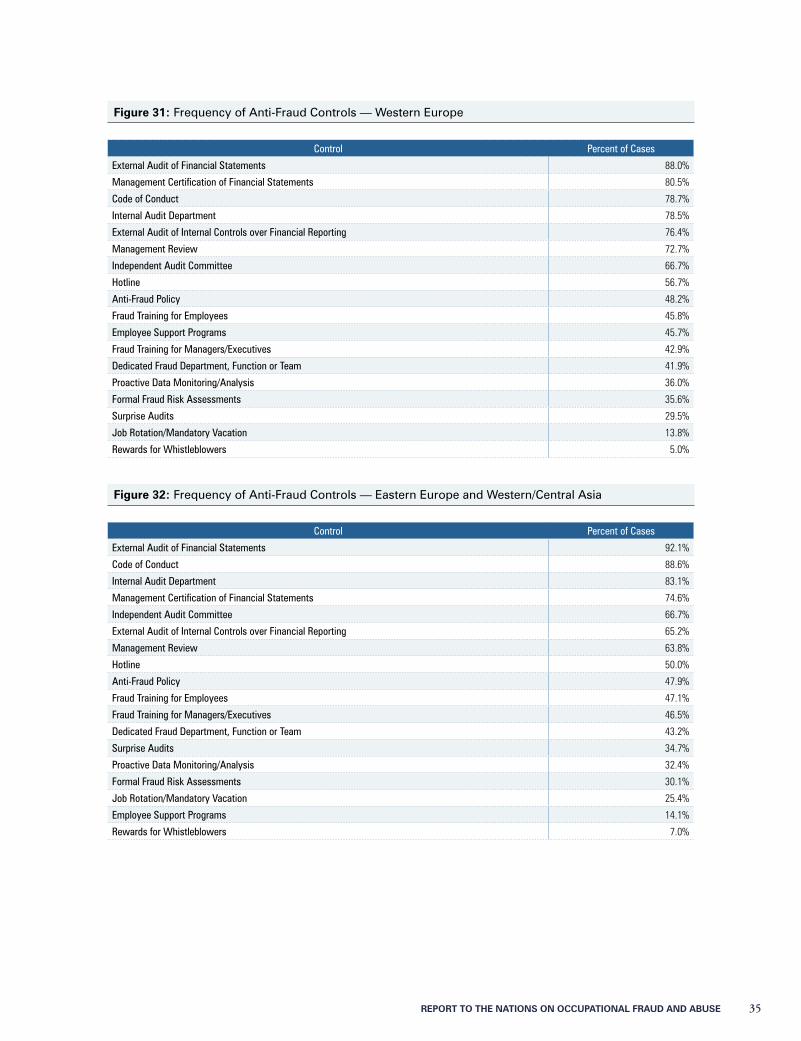
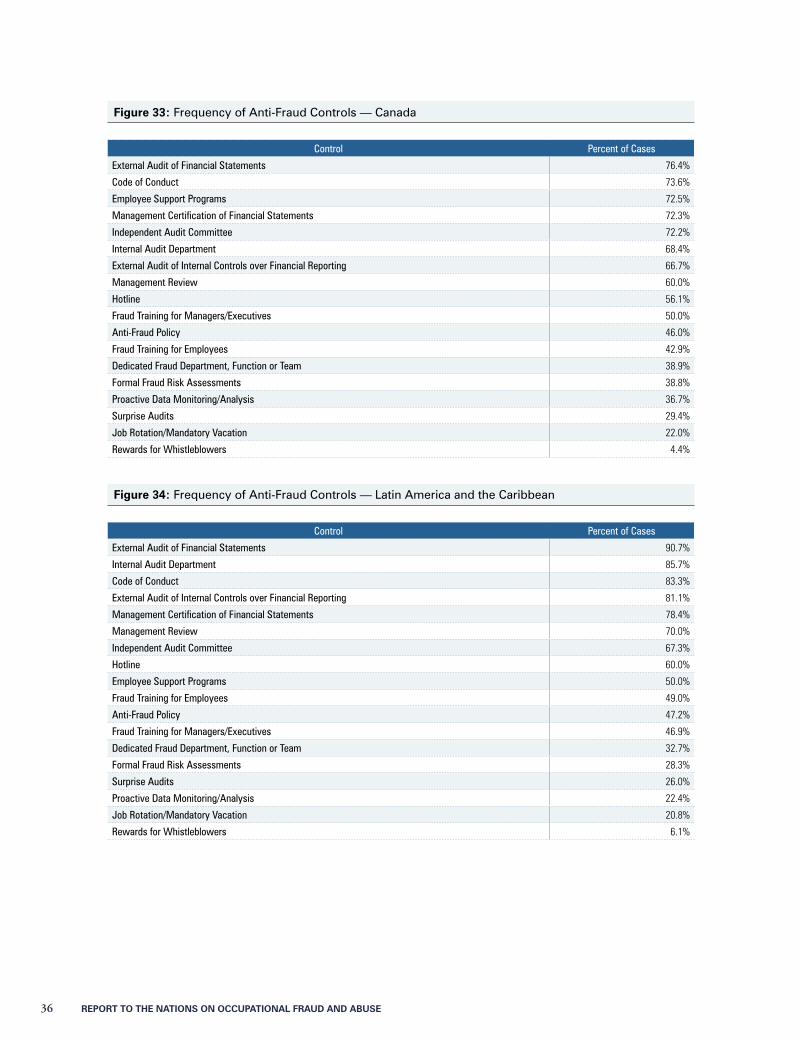
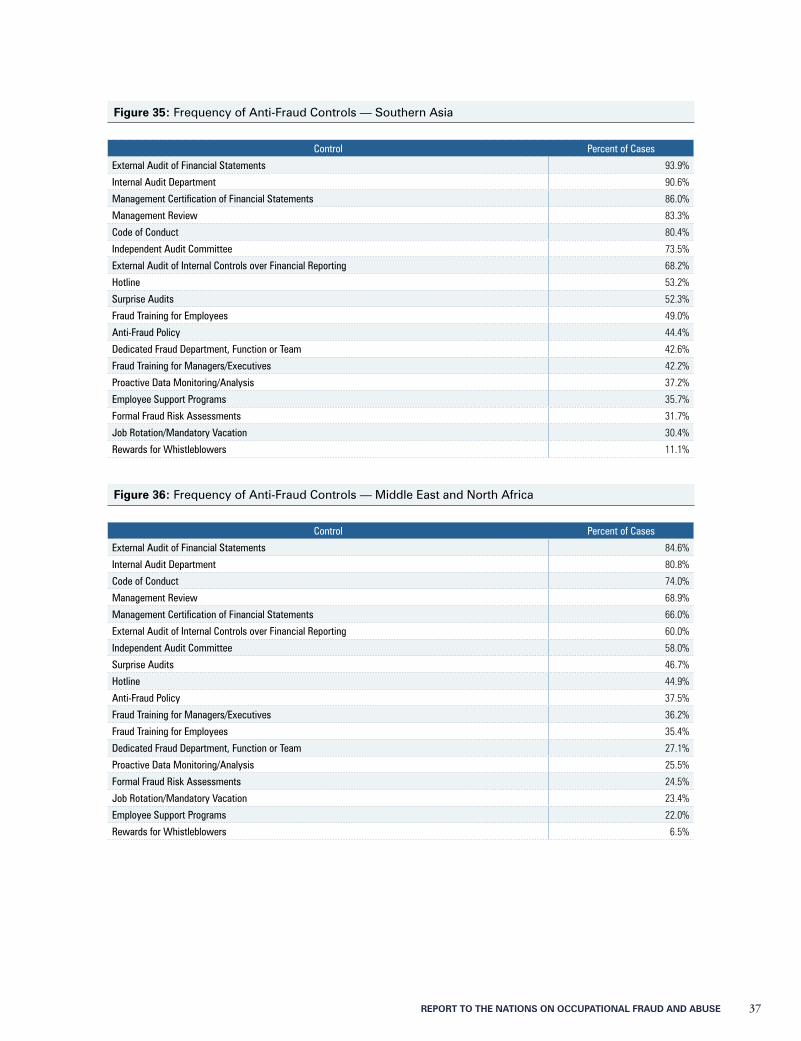
Anti-Fraud Controls by Region We also examined the frequency with which the 18 anti-fraud controls were implemented based on the region of the victim organizations. This revealed a few interesting regional variations and trends in organizations’ approaches to fighting fraud. For example, internal audit departments tend to be less common in the United States and Canada than in all other regions. In contrast, employee support programs are much more common in the United States and Canada than in all other regions, and the percentage of victim organizations in Eastern Europe and Western/Central Asia that had employee support programs in place was remarkably low. Fewer victim organizations in Western Europe had job rotation and mandatory vacation policies than their counterparts in other regions. In addition, the proportion of victim organizations in Southern Asia that had formal management review processes, surprise audits and management certification of financial statements was notably greater than in other regions, and nearly half the organizations in Sub-Saharan Africa had a dedicated fraud department, function or team.
Figure 28: Frequency of Anti-Fraud Controls — United States
Control Percent of Cases
Code of Conduct 72.8%
External Audit of Financial Statements 72.5%
Employee Support Programs 65.6%
Management Certification of Financial Statements 63.4%
External Audit of Internal Controls over Financial Reporting 59.2%
Internal Audit Department 58.8%
Management Review 55.5%
Independent Audit Committee 53.3%
Hotline 51.5%
Fraud Training for Managers/Executives 50.3%
Fraud Training for Employees 48.4%
Anti-Fraud Policy 42.0%
Proactive Data Monitoring/Analysis 36.1%
Dedicated Fraud Department, Function or Team 34.8%
Formal Fraud Risk Assessments 34.5%
Surprise Audits 28.7%
Job Rotation/Mandatory Vacation 17.8%
Rewards for Whistleblowers 12.0%
34 REPORT TO THE NATIONS ON OCCUPATIONAL FRAUD AND ABUSE
Figure 29: Frequency of Anti-Fraud Controls — Sub-Saharan Africa
Control Percent of Cases
External Audit of Financial Statements 88.6%
Internal Audit Department 80.1%
Code of Conduct 78.8%
Management Certification of Financial Statements 73.2%
Independent Audit Committee 67.7%
External Audit of Internal Controls over Financial Reporting 66.0%
Management Review 65.6%
Hotline 57.5%
Dedicated Fraud Department, Function or Team 49.1%
Anti-Fraud Policy 48.5%
Fraud Training for Employees 47.2%
Fraud Training for Managers/Executives 45.3%
Proactive Data Monitoring/Analysis 39.5%
Surprise Audits 38.5%
Employee Support Programs 37.7%
Formal Fraud Risk Assessments 35.3%
Job Rotation/Mandatory Vacation 20.5%
Rewards for Whistleblowers 16.5%
Figure 30: Frequency of Anti-Fraud Controls — Asia-Pacific
Control Percent of Cases
External Audit of Financial Statements 90.0%
Code of Conduct 89.4%
Internal Audit Department 85.1%
Management Certification of Financial Statements 79.0%
Independent Audit Committee 78.1%
External Audit of Internal Controls over Financial Reporting 73.9%
Management Review 72.2%
Hotline 62.7%
Anti-Fraud Policy 57.9%
Fraud Training for Employees 55.5%
Fraud Training for Managers/Executives 50.9%
Employee Support Programs 47.8%
Dedicated Fraud Department, Function or Team 44.2%
Surprise Audits 40.6%
Formal Fraud Risk Assessments 32.3%
Proactive Data Monitoring/Analysis 30.0%
Job Rotation/Mandatory Vacation 22.2%
Rewards for Whistleblowers 6.9%
REPORT TO THE NATIONS ON OCCUPATIONAL FRAUD AND ABUSE 35
Figure 31: Frequency of Anti-Fraud Controls — Western Europe
Control Percent of Cases
External Audit of Financial Statements 88.0%
Management Certification of Financial Statements 80.5%
Code of Conduct 78.7%
Internal Audit Department 78.5%
External Audit of Internal Controls over Financial Reporting 76.4%
Management Review 72.7%
Independent Audit Committee 66.7%
Hotline 56.7%
Anti-Fraud Policy 48.2%
Fraud Training for Employees 45.8%
Employee Support Programs 45.7%
Fraud Training for Managers/Executives 42.9%
Dedicated Fraud Department, Function or Team 41.9%
Proactive Data Monitoring/Analysis 36.0%
Formal Fraud Risk Assessments 35.6%
Surprise Audits 29.5%
Job Rotation/Mandatory Vacation 13.8%
Rewards for Whistleblowers 5.0%
Figure 32: Frequency of Anti-Fraud Controls — Eastern Europe and Western/Central Asia
Control Percent of Cases
External Audit of Financial Statements 92.1%
Code of Conduct 88.6%
Internal Audit Department 83.1%
Management Certification of Financial Statements 74.6%
Independent Audit Committee 66.7%
External Audit of Internal Controls over Financial Reporting 65.2%
Management Review 63.8%
Hotline 50.0%
Anti-Fraud Policy 47.9%
Fraud Training for Employees 47.1%
Fraud Training for Managers/Executives 46.5%
Dedicated Fraud Department, Function or Team 43.2%
Surprise Audits 34.7%
Proactive Data Monitoring/Analysis 32.4%
Formal Fraud Risk Assessments 30.1%
Job Rotation/Mandatory Vacation 25.4%
Employee Support Programs 14.1%
Rewards for Whistleblowers 7.0%
36 REPORT TO THE NATIONS ON OCCUPATIONAL FRAUD AND ABUSE
Figure 33: Frequency of Anti-Fraud Controls — Canada
Control Percent of Cases
External Audit of Financial Statements 76.4%
Code of Conduct 73.6%
Employee Support Programs 72.5%
Management Certification of Financial Statements 72.3%
Independent Audit Committee 72.2%
Internal Audit Department 68.4%
External Audit of Internal Controls over Financial Reporting 66.7%
Management Review 60.0%
Hotline 56.1%
Fraud Training for Managers/Executives 50.0%
Anti-Fraud Policy 46.0%
Fraud Training for Employees 42.9%
Dedicated Fraud Department, Function or Team 38.9%
Formal Fraud Risk Assessments 38.8%
Proactive Data Monitoring/Analysis 36.7%
Surprise Audits 29.4%
Job Rotation/Mandatory Vacation 22.0%
Rewards for Whistleblowers 4.4%
Figure 34: Frequency of Anti-Fraud Controls — Latin America and the Caribbean
Control Percent of Cases
External Audit of Financial Statements 90.7%
Internal Audit Department 85.7%
Code of Conduct 83.3%
External Audit of Internal Controls over Financial Reporting 81.1%
Management Certification of Financial Statements 78.4%
Management Review 70.0%
Independent Audit Committee 67.3%
Hotline 60.0%
Employee Support Programs 50.0%
Fraud Training for Employees 49.0%
Anti-Fraud Policy 47.2%
Fraud Training for Managers/Executives 46.9%
Dedicated Fraud Department, Function or Team 32.7%
Formal Fraud Risk Assessments 28.3%
Surprise Audits 26.0%
Proactive Data Monitoring/Analysis 22.4%
Job Rotation/Mandatory Vacation 20.8%
Rewards for Whistleblowers 6.1%
REPORT TO THE NATIONS ON OCCUPATIONAL FRAUD AND ABUSE 37
Figure 35: Frequency of Anti-Fraud Controls — Southern Asia
Control Percent of Cases
External Audit of Financial Statements 93.9%
Internal Audit Department 90.6%
Management Certification of Financial Statements 86.0%
Management Review 83.3%
Code of Conduct 80.4%
Independent Audit Committee 73.5%
External Audit of Internal Controls over Financial Reporting 68.2%
Hotline 53.2%
Surprise Audits 52.3%
Fraud Training for Employees 49.0%
Anti-Fraud Policy 44.4%
Dedicated Fraud Department, Function or Team 42.6%
Fraud Training for Managers/Executives 42.2%
Proactive Data Monitoring/Analysis 37.2%
Employee Support Programs 35.7%
Formal Fraud Risk Assessments 31.7%
Job Rotation/Mandatory Vacation 30.4%
Rewards for Whistleblowers 11.1%
Figure 36: Frequency of Anti-Fraud Controls — Middle East and North Africa
Control Percent of Cases
External Audit of Financial Statements 84.6%
Internal Audit Department 80.8%
Code of Conduct 74.0%
Management Review 68.9%
Management Certification of Financial Statements 66.0%
External Audit of Internal Controls over Financial Reporting 60.0%
Independent Audit Committee 58.0%
Surprise Audits 46.7%
Hotline 44.9%
Anti-Fraud Policy 37.5%
Fraud Training for Managers/Executives 36.2%
Fraud Training for Employees 35.4%
Dedicated Fraud Department, Function or Team 27.1%
Proactive Data Monitoring/Analysis 25.5%
Formal Fraud Risk Assessments 24.5%
Job Rotation/Mandatory Vacation 23.4%
Employee Support Programs 22.0%
Rewards for Whistleblowers 6.5%
38 REPORT TO THE NATIONS ON OCCUPATIONAL FRAUD AND ABUSE
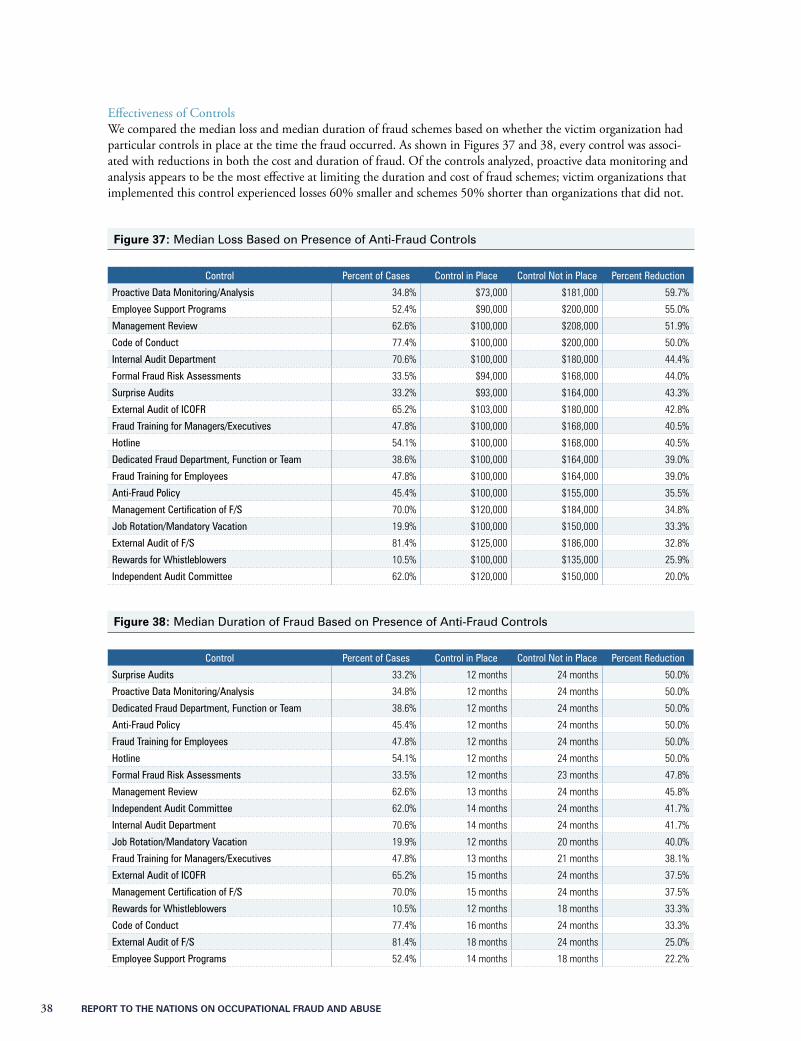
Effectiveness of ControlsWe compared the median loss and median duration of fraud schemes based on whether the victim organization had particular controls in place at the time the fraud occurred. As shown in Figures 37 and 38, every control was associ-ated with reductions in both the cost and duration of fraud. Of the controls analyzed, proactive data monitoring and analysis appears to be the most effective at limiting the duration and cost of fraud schemes; victim organizations that implemented this control experienced losses 60% smaller and schemes 50% shorter than organizations that did not.
Figure 37: Median Loss Based on Presence of Anti-Fraud Controls
Control Percent of Cases Control in Place Control Not in Place Percent Reduction
Proactive Data Monitoring/Analysis 34.8% $73,000 $181,000 59.7%
Employee Support Programs 52.4% $90,000 $200,000 55.0%
Management Review 62.6% $100,000 $208,000 51.9%
Code of Conduct 77.4% $100,000 $200,000 50.0%
Internal Audit Department 70.6% $100,000 $180,000 44.4%
Formal Fraud Risk Assessments 33.5% $94,000 $168,000 44.0%
Surprise Audits 33.2% $93,000 $164,000 43.3%
External Audit of ICOFR 65.2% $103,000 $180,000 42.8%
Fraud Training for Managers/Executives 47.8% $100,000 $168,000 40.5%
Hotline 54.1% $100,000 $168,000 40.5%
Dedicated Fraud Department, Function or Team 38.6% $100,000 $164,000 39.0%
Fraud Training for Employees 47.8% $100,000 $164,000 39.0%
Anti-Fraud Policy 45.4% $100,000 $155,000 35.5%
Management Certification of F/S 70.0% $120,000 $184,000 34.8%
Job Rotation/Mandatory Vacation 19.9% $100,000 $150,000 33.3%
External Audit of F/S 81.4% $125,000 $186,000 32.8%
Rewards for Whistleblowers 10.5% $100,000 $135,000 25.9%
Independent Audit Committee 62.0% $120,000 $150,000 20.0%
Figure 38: Median Duration of Fraud Based on Presence of Anti-Fraud Controls
Control Percent of Cases Control in Place Control Not in Place Percent Reduction
Surprise Audits 33.2% 12 months 24 months 50.0%
Proactive Data Monitoring/Analysis 34.8% 12 months 24 months 50.0%
Dedicated Fraud Department, Function or Team 38.6% 12 months 24 months 50.0%
Anti-Fraud Policy 45.4% 12 months 24 months 50.0%
Fraud Training for Employees 47.8% 12 months 24 months 50.0%
Hotline 54.1% 12 months 24 months 50.0%
Formal Fraud Risk Assessments 33.5% 12 months 23 months 47.8%
Management Review 62.6% 13 months 24 months 45.8%
Independent Audit Committee 62.0% 14 months 24 months 41.7%
Internal Audit Department 70.6% 14 months 24 months 41.7%
Job Rotation/Mandatory Vacation 19.9% 12 months 20 months 40.0%
Fraud Training for Managers/Executives 47.8% 13 months 21 months 38.1%
External Audit of ICOFR 65.2% 15 months 24 months 37.5%
Management Certification of F/S 70.0% 15 months 24 months 37.5%
Rewards for Whistleblowers 10.5% 12 months 18 months 33.3%
Code of Conduct 77.4% 16 months 24 months 33.3%
External Audit of F/S 81.4% 18 months 24 months 25.0%
Employee Support Programs 52.4% 14 months 18 months 22.2%
RepoRt to the NatioNs oN occupatioNal FRaud aNd abuse 39
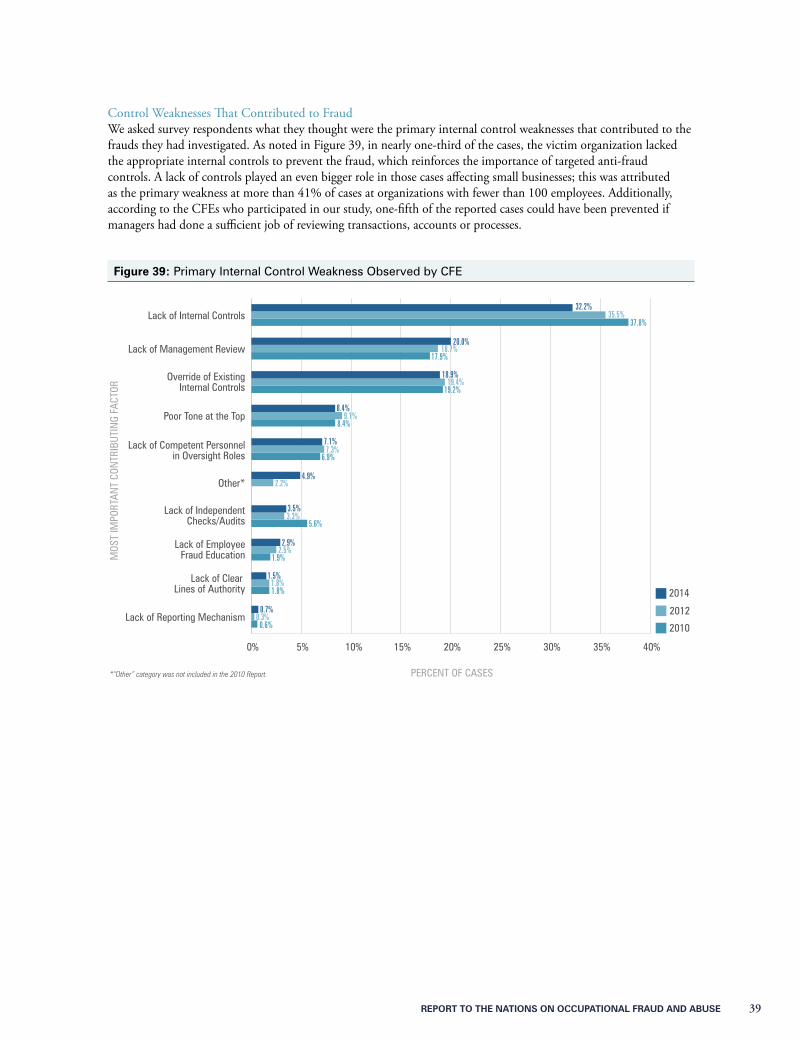
Control Weaknesses That Contributed to FraudWe asked survey respondents what they thought were the primary internal control weaknesses that contributed to the frauds they had investigated. As noted in Figure 39, in nearly one-third of the cases, the victim organization lacked the appropriate internal controls to prevent the fraud, which reinforces the importance of targeted anti-fraud controls. A lack of controls played an even bigger role in those cases affecting small businesses; this was attributed as the primary weakness at more than 41% of cases at organizations with fewer than 100 employees. Additionally, according to the CFEs who participated in our study, one-fifth of the reported cases could have been prevented if managers had done a sufficient job of reviewing transactions, accounts or processes.
Figure 39: Primary Internal Control Weakness Observed by CFE
0% 5% 10% 15% 20% 25% 30% 35% 40%
2010
2012
2014
Lack of Reporting Mechanism
Lack of Clear Lines of Authority
Lack of EmployeeFraud Education
Lack of IndependentChecks/Audits
Other*
Lack of Competent Personnelin Oversight Roles
Poor Tone at the Top
Override of ExistingInternal Controls
Lack of Management Review
Lack of Internal Controls
MOS
T IM
PORT
ANT
CON
TRIB
UTIN
G FA
CTOR
PERCENT OF CASES
32.2%
37.8%35.5%
20.0%
17.9%18.7%
18.9%
19.2%19.4%
8.4%
8.4%9.1%
7.1%
6.9%7.3%
3.5%
5.6%3.3%
2.9%
1.9%2.5%
1.5%
1.8%1.8%
0.7%
0.6%0.3%
4.9%2.2%
*“Other” category was not included in the 2010 Report.
40 RepoRt to the NatioNs oN occupatioNal FRaud aNd abuse
Perpetrators
As part of our survey, we asked respondents to sup-ply detailed information about the perpetrators of the frauds they had investigated. This includes data on level of authority, age, gender, tenure with the victim organization, education level, department, criminal and employment history, and red flags that the fraudster exhibited before the scheme was detected. The value of this information is that it helps us identify and quantify where fraud risk might lie within a particular organi-zation: What departments tend to be associated with which types of frauds? What demographic factors seem to impact the frequency or severity of occupational frauds? What behavioral clues might have led the victim organizations to identify these crimes earlier? Also, because this data has been gathered over several years’ worth of reports, we are able to show how consistent the patterns of fraud and abuse tend to be over time.
Perpetrator’s PositionFigure 40 shows the distribution of fraud perpetrators based on their level of authority. Forty-two percent of occupational frauds were committed by employee-level perpetrators, 36% were committed by managers and approximately 19% were committed by owners/executives. The distribution of these categories has remained remarkably consistent from year to year.
Figure 40: Position of Perpetrator — Frequency
0% 5% 10% 15% 20% 25% 30% 35% 40% 45%2010
2012
2014
Other*
Owner/Executive
Manager
Employee
POSI
TION
OF
PERP
ETRA
TOR
PERCENT OF CASES*“Other” category was not included in the 2010 Report.
42.0%41.6%
42.1%
36.2%37.5%
41.0%
18.6%17.6%
16.9%
3.2%3.2%
We asked respondents to supply detailed information about the perpetrators of the fraud cases. The value of this information is that it helps us identify and quantify where fraud risk might lie within a particular organization.
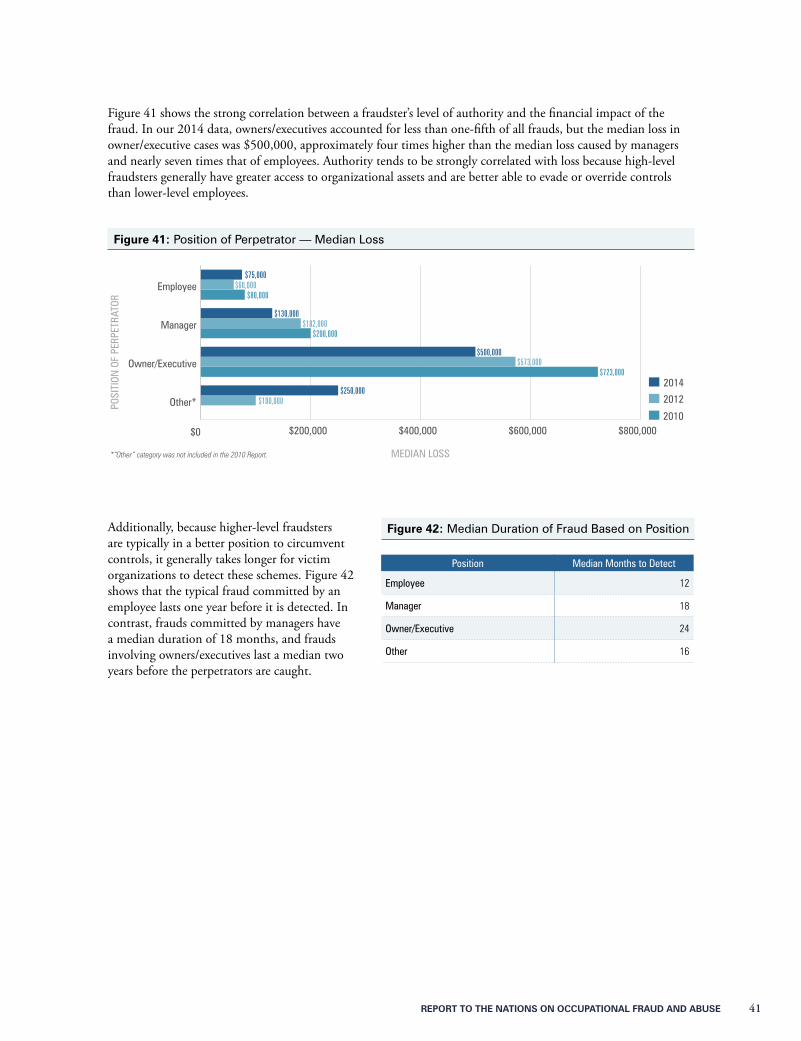
REPORT TO THE NATIONS ON OCCUPATIONAL FRAUD AND ABUSE 41
Figure 41 shows the strong correlation between a fraudster’s level of authority and the financial impact of the fraud. In our 2014 data, owners/executives accounted for less than one-fifth of all frauds, but the median loss in owner/executive cases was $500,000, approximately four times higher than the median loss caused by managers and nearly seven times that of employees. Authority tends to be strongly correlated with loss because high-level fraudsters generally have greater access to organizational assets and are better able to evade or override controls than lower-level employees.
Figure 41: Position of Perpetrator — Median Loss
$0 $200,000 $400,000 $600,000 $800,0002010
2012
2014
Other*
Owner/Executive
Manager
Employee
POSI
TION
OF
PERP
ETRA
TOR
MEDIAN LOSS
$75,000$60,000
$80,000
$130,000$182,000
$200,000
$500,000$573,000
$100,000
$723,000
$250,000
*“Other” category was not included in the 2010 Report.
Additionally, because higher-level fraudsters are typically in a better position to circumvent controls, it generally takes longer for victim organizations to detect these schemes. Figure 42 shows that the typical fraud committed by an employee lasts one year before it is detected. In contrast, frauds committed by managers have a median duration of 18 months, and frauds involving owners/executives last a median two years before the perpetrators are caught.
Figure 42: Median Duration of Fraud Based on Position
Position Median Months to Detect
Employee 12
Manager 18
Owner/Executive 24
Other 16
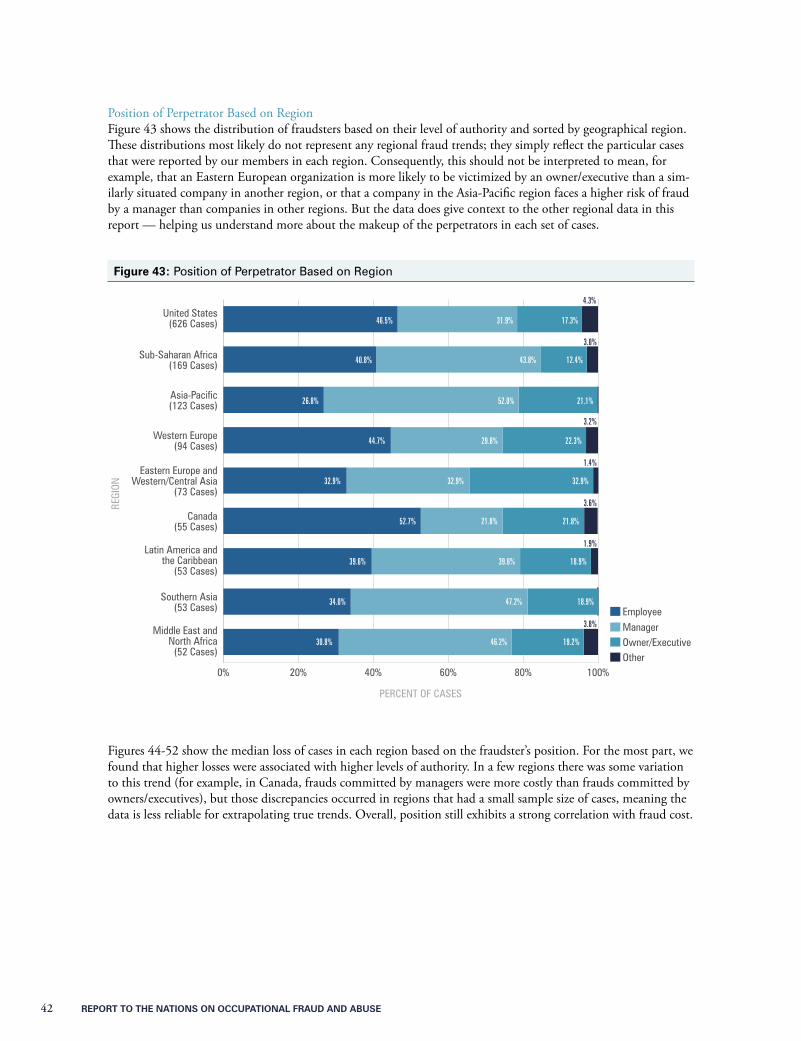
42 REPORT TO THE NATIONS ON OCCUPATIONAL FRAUD AND ABUSE
Position of Perpetrator Based on RegionFigure 43 shows the distribution of fraudsters based on their level of authority and sorted by geographical region. These distributions most likely do not represent any regional fraud trends; they simply reflect the particular cases that were reported by our members in each region. Consequently, this should not be interpreted to mean, for example, that an Eastern European organization is more likely to be victimized by an owner/executive than a sim-ilarly situated company in another region, or that a company in the Asia-Pacific region faces a higher risk of fraud by a manager than companies in other regions. But the data does give context to the other regional data in this report — helping us understand more about the makeup of the perpetrators in each set of cases.
Figure 43: Position of Perpetrator Based on Region
0% 20% 40% 60% 80% 100%
Middle East andNorth Africa
(52 Cases)
Southern Asia(53 Cases)
Latin America andthe Caribbean
(53 Cases)
Canada(55 Cases)
Eastern Europe andWestern/Central Asia
(73 Cases)
Western Europe(94 Cases)
Asia-Pacific(123 Cases)
Sub-Saharan Africa(169 Cases)
United States(626 Cases)
EmployeeManagerOwner/ExecutiveOther
PERCENT OF CASES
REGI
ON
46.5%
40.8%
26.8%
44.7%
32.9%
52.7%
39.6%
34.0%
30.8% 46.2% 19.2%
47.2% 18.9%
39.6% 18.9%
21.8% 21.8%
32.9% 32.9%
29.8% 22.3%
52.0% 21.1%
43.8% 12.4%
3.0%
3.2%
1.4%
3.6%
1.9%
3.8%
31.9% 17.3%
4.3%
Figures 44-52 show the median loss of cases in each region based on the fraudster’s position. For the most part, we found that higher losses were associated with higher levels of authority. In a few regions there was some variation to this trend (for example, in Canada, frauds committed by managers were more costly than frauds committed by owners/executives), but those discrepancies occurred in regions that had a small sample size of cases, meaning the data is less reliable for extrapolating true trends. Overall, position still exhibits a strong correlation with fraud cost.
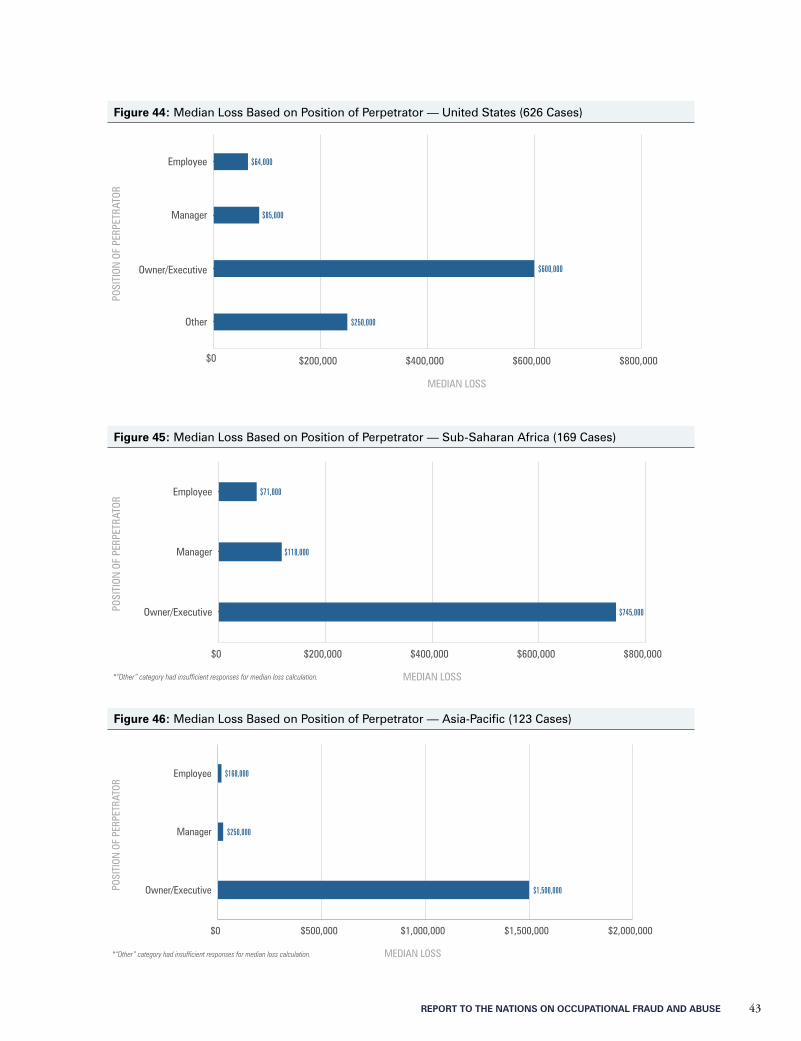
REPORT TO THE NATIONS ON OCCUPATIONAL FRAUD AND ABUSE 43
Figure 44: Median Loss Based on Position of Perpetrator — United States (626 Cases)
$0 $200,000 $400,000 $600,000 $800,000
Other
Owner/Executive
Manager
Employee
POSI
TION
OF
PERP
ETRA
TOR
MEDIAN LOSS
$64,000
$600,000
$250,000
$85,000
Figure 45: Median Loss Based on Position of Perpetrator — Sub-Saharan Africa (169 Cases)
$0 $200,000 $400,000 $600,000 $800,000
Owner/Executive
Manager
Employee
POSI
TION
OF
PERP
ETRA
TOR
$232,000 $200,000000 $91,000
MEDIAN LOSS
$71,000
$118,000
$745,000
*“Other” category had insufficient responses for median loss calculation.
Figure 46: Median Loss Based on Position of Perpetrator — Asia-Pacific (123 Cases)
$0 $500,000 $1,000,000 $1,500,000 $2,000,000
Owner/Executive
Manager
Employee
POSI
TION
OF
PERP
ETRA
TOR
000 $91,000 $232,000 $200,000
$168,000
$250,000
MEDIAN LOSS*“Other” category had insufficient responses for median loss calculation.
$1,500,000
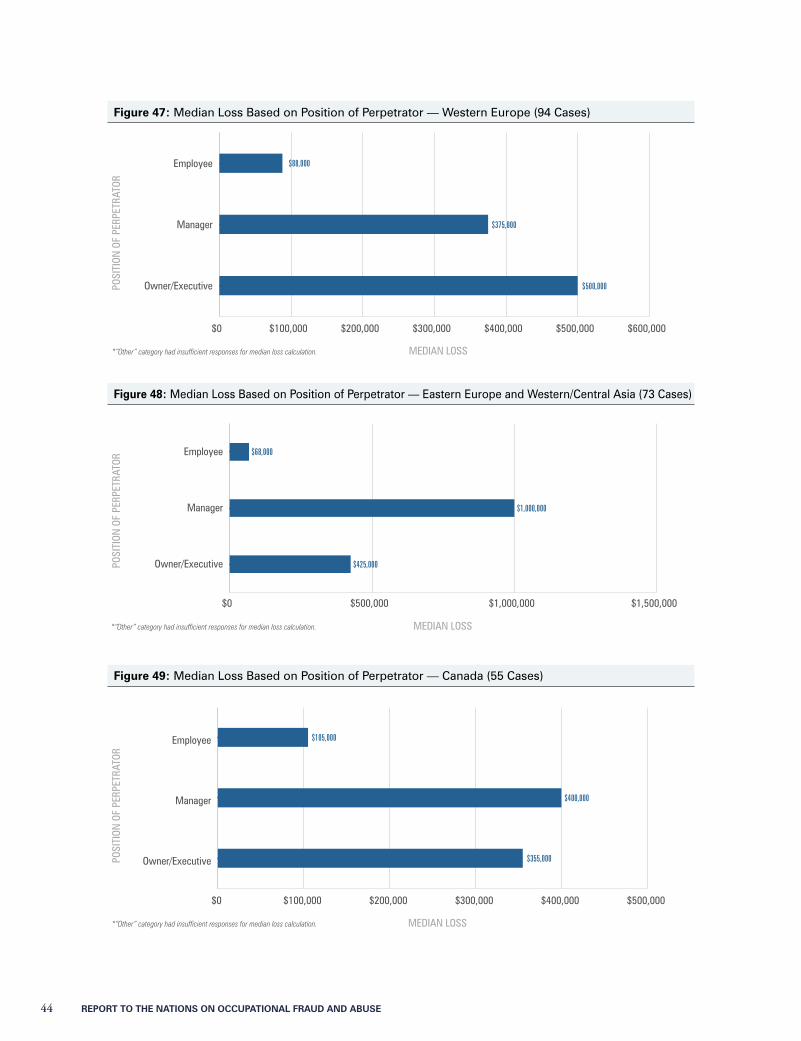
44 REPORT TO THE NATIONS ON OCCUPATIONAL FRAUD AND ABUSE
Figure 47: Median Loss Based on Position of Perpetrator — Western Europe (94 Cases)
$0 $100,000 $200,000 $300,000 $400,000 $500,000 $600,000
Owner/Executive
Manager
Employee
POSI
TION
OF
PERP
ETRA
TOR
MEDIAN LOSS*“Other” category had insufficient responses for median loss calculation.
$88,000
$375,000
$500,000
Figure 48: Median Loss Based on Position of Perpetrator — Eastern Europe and Western/Central Asia (73 Cases)
$0 $500,000 $1,000,000 $1,500,000
Owner/Executive
Manager
Employee
POSI
TION
OF
PERP
ETRA
TOR $68,000
MEDIAN LOSS*“Other” category had insufficient responses for median loss calculation.
$1,000,000
$425,000
Figure 49: Median Loss Based on Position of Perpetrator — Canada (55 Cases)
$0 $100,000 $200,000 $300,000 $400,000 $500,000
Owner/Executive
Manager
Employee
POSI
TION
OF
PERP
ETRA
TOR
MEDIAN LOSS*“Other” category had insufficient responses for median loss calculation.
$105,000
$400,000
$355,000

REPORT TO THE NATIONS ON OCCUPATIONAL FRAUD AND ABUSE 45
Figure 50: Median Loss Based on Position of Perpetrator — Latin America and the Caribbean (53 Cases)
$0 $50,000 $100,000 $150,000 $200,000 $250,000 $300,000
Owner/Executive
Manager
Employee
POSI
TION
OF
PERP
ETRA
TOR
$355,000
MEDIAN LOSS*“Other” category had insufficient responses for median loss calculation.
$181,000
$250,000
$188,000
Figure 51: Median Loss Based on Position of Perpetrator — Southern Asia (53 Cases)
$0 $20,000 $40,000 $60,000 $80,000 $100,000
Owner/Executive
Manager
Employee
POSI
TION
OF
PERP
ETRA
TOR
MEDIAN LOSS*“Other” category had insufficient responses for median loss calculation.
$49,000
$55,000
$99,000
Figure 52: Median Loss Based on Position of Perpetrator — Middle East and North Africa (52 Cases)
$0 $500,000 $1,000,000 $1,500,000
Owner/Executive
Manager
Employee
POSI
TION
OF
PERP
ETRA
TOR
MEDIAN LOSS*“Other” category had insufficient responses for median loss calculation.
$85,000
$246,000
$1,181,000
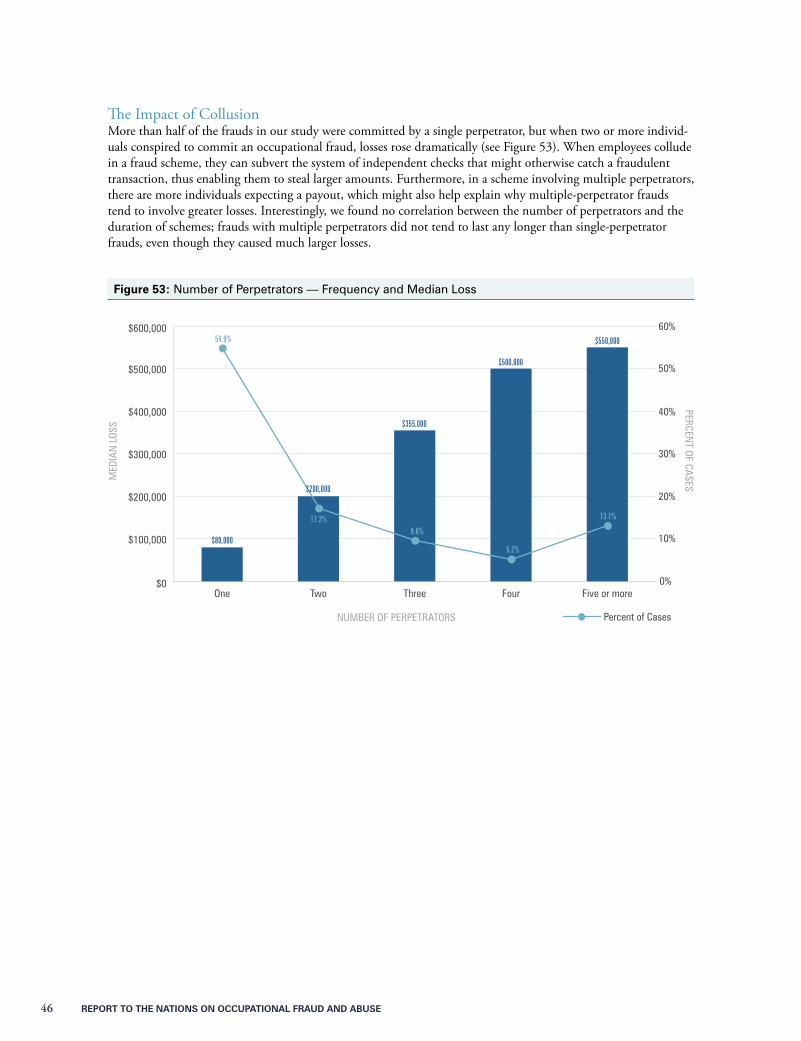
46 REPORT TO THE NATIONS ON OCCUPATIONAL FRAUD AND ABUSE
The Impact of CollusionMore than half of the frauds in our study were committed by a single perpetrator, but when two or more individ-uals conspired to commit an occupational fraud, losses rose dramatically (see Figure 53). When employees collude in a fraud scheme, they can subvert the system of independent checks that might otherwise catch a fraudulent transaction, thus enabling them to steal larger amounts. Furthermore, in a scheme involving multiple perpetrators, there are more individuals expecting a payout, which might also help explain why multiple-perpetrator frauds tend to involve greater losses. Interestingly, we found no correlation between the number of perpetrators and the duration of schemes; frauds with multiple perpetrators did not tend to last any longer than single-perpetrator frauds, even though they caused much larger losses.
Figure 53: Number of Perpetrators — Frequency and Median Loss
MED
IAN
LOS
SPERCEN
T OF CASES
NUMBER OF PERPETRATORS
$0
$100,000
$200,000
$300,000
$400,000
$500,000
$600,000
Five or moreFourThreeTwoOne
58.0% 43.0% 45.1%
60%
50%
40%
30%
20%
10%
0%
$80,000
$200,000
$355,000
$500,000
$550,00054.9%
17.2%9.6%
5.2%
13.1%
Percent of Cases
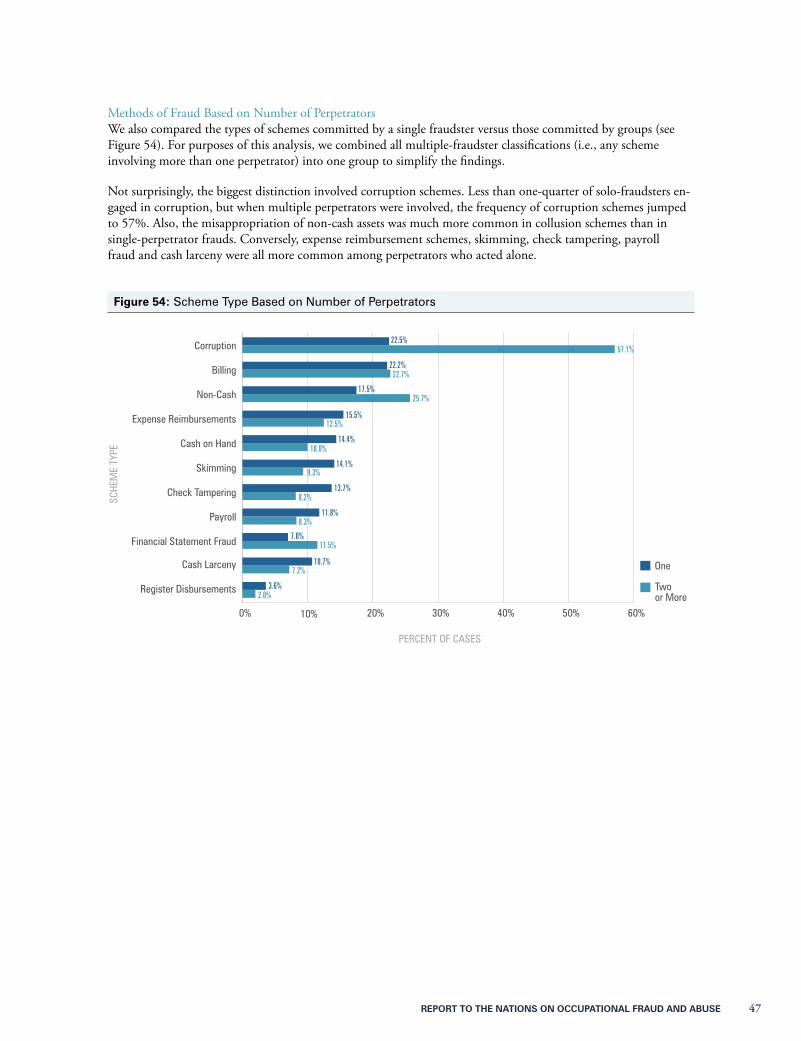
REPORT TO THE NATIONS ON OCCUPATIONAL FRAUD AND ABUSE 47
Methods of Fraud Based on Number of Perpetrators We also compared the types of schemes committed by a single fraudster versus those committed by groups (see Figure 54). For purposes of this analysis, we combined all multiple-fraudster classifications (i.e., any scheme involving more than one perpetrator) into one group to simplify the findings.
Not surprisingly, the biggest distinction involved corruption schemes. Less than one-quarter of solo-fraudsters en-gaged in corruption, but when multiple perpetrators were involved, the frequency of corruption schemes jumped to 57%. Also, the misappropriation of non-cash assets was much more common in collusion schemes than in single-perpetrator frauds. Conversely, expense reimbursement schemes, skimming, check tampering, payroll fraud and cash larceny were all more common among perpetrators who acted alone.
Figure 54: Scheme Type Based on Number of Perpetrators
0% 10% 20% 30% 40% 50% 60%
Two or More
One
Register Disbursements
Cash Larceny
Financial Statement Fraud
Payroll
Check Tampering
Skimming
Cash on Hand
Expense Reimbursements
Non-Cash
Billing
Corruption
SCHE
ME
TYPE
PERCENT OF CASES
22.5%57.1%
22.2%22.7%
17.5%25.7%
15.5%12.5%
14.4%10.0%
14.1%9.3%
13.7%8.2%
11.8%8.3%
7.0%11.5%
10.7%7.2%
3.6%2.0%
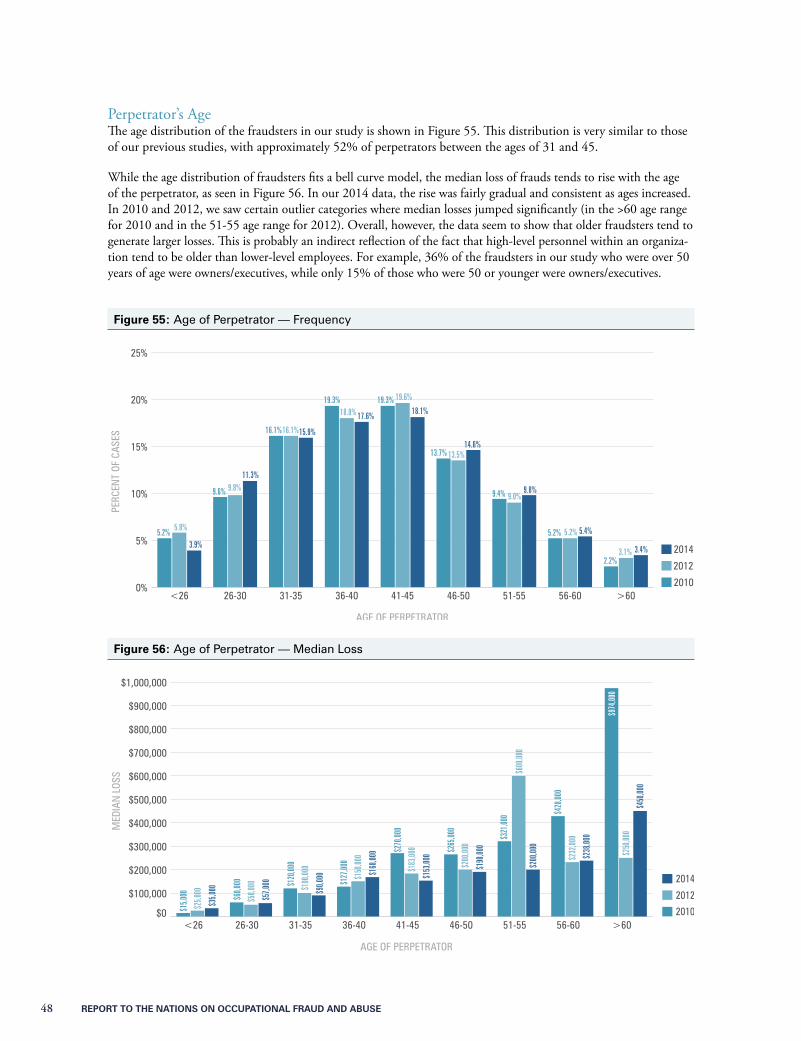
48 REPORT TO THE NATIONS ON OCCUPATIONAL FRAUD AND ABUSE
Perpetrator’s Age The age distribution of the fraudsters in our study is shown in Figure 55. This distribution is very similar to those of our previous studies, with approximately 52% of perpetrators between the ages of 31 and 45.
While the age distribution of fraudsters fits a bell curve model, the median loss of frauds tends to rise with the age of the perpetrator, as seen in Figure 56. In our 2014 data, the rise was fairly gradual and consistent as ages increased. In 2010 and 2012, we saw certain outlier categories where median losses jumped significantly (in the >60 age range for 2010 and in the 51-55 age range for 2012). Overall, however, the data seem to show that older fraudsters tend to generate larger losses. This is probably an indirect reflection of the fact that high-level personnel within an organiza-tion tend to be older than lower-level employees. For example, 36% of the fraudsters in our study who were over 50 years of age were owners/executives, while only 15% of those who were 50 or younger were owners/executives.
Figure 55: Age of Perpetrator — Frequency
0%
5%
10%
15%
20%
25%
2014
2012
2010>6056-6051-5546-5041-4536-4031-3526-30<26
AGE OF PERPETRATOR
PERC
ENT
OF C
ASES
5.8%
3.9%
11.3%
15.9%
17.6%
9.8%
16.1%
18.0% 18.1%
19.6%
14.6%13.5%
9.8%9.0%
5.4%5.2%
3.4%3.1%
5.2%
9.6%
16.1%
19.3% 19.3%
13.7%
9.4%
5.2%
2.2%
Figure 56: Age of Perpetrator — Median Loss
$0
$100,000
$200,000
$300,000
$400,000
$500,000
$600,000
$700,000
$800,000
$900,000
$1,000,000
2014
2012
2010>6056-6051-5546-5041-4536-4031-3526-30<26
AGE OF PERPETRATOR
MED
IAN
LOS
S
$25,0
00
$35,0
00
9.8%
$15,0
00 $50,0
00
$57,0
00
$60,0
00 $100
,000
$90,0
00
$120
,000
$150
,000
$168
,000
$127
,000
$183
,000
$153
,000$2
70,00
0
$200
,000
$600
,000
$232
,000
$250
,000
$190
,000
$200
,000
$238
,000
$450
,000
$265
,000
$321
,000 $4
28,00
0
$974
,000
5.2%
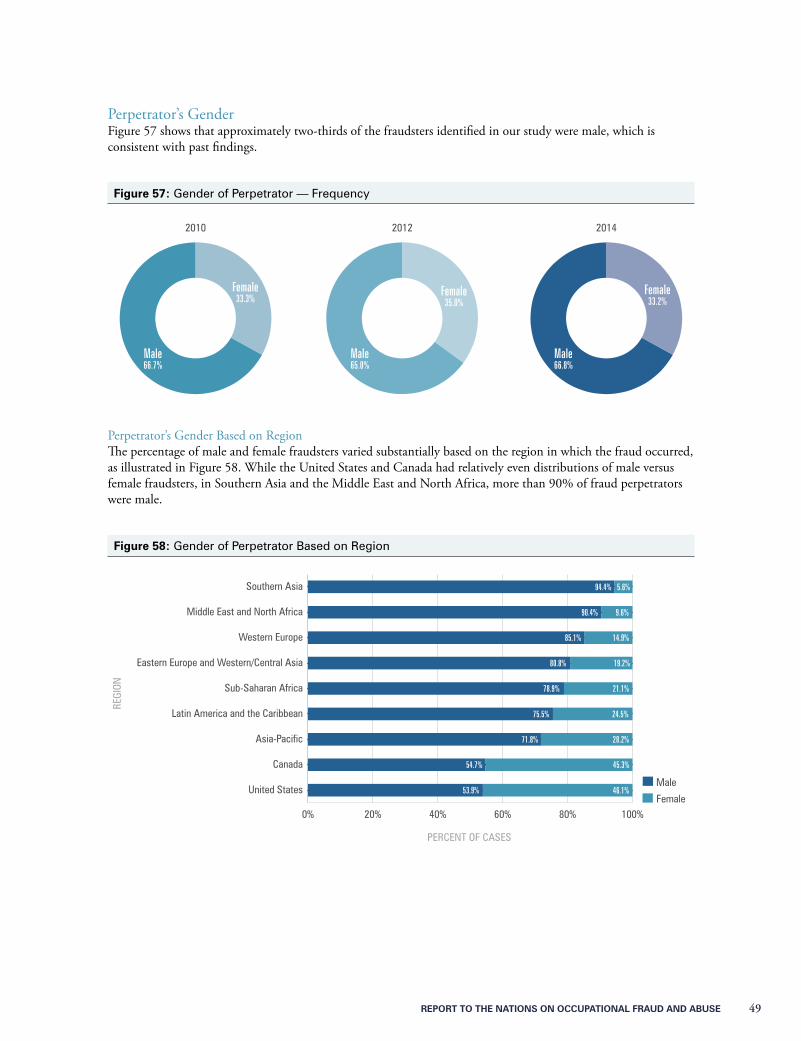
REPORT TO THE NATIONS ON OCCUPATIONAL FRAUD AND ABUSE 49
Perpetrator’s GenderFigure 57 shows that approximately two-thirds of the fraudsters identified in our study were male, which is consistent with past findings.
Figure 57: Gender of Perpetrator — Frequency
Perpetrator’s Gender Based on RegionThe percentage of male and female fraudsters varied substantially based on the region in which the fraud occurred, as illustrated in Figure 58. While the United States and Canada had relatively even distributions of male versus female fraudsters, in Southern Asia and the Middle East and North Africa, more than 90% of fraud perpetrators were male.
Figure 58: Gender of Perpetrator Based on Region
0% 20% 40% 60% 80% 100%Female
MaleUnited States
Canada
Asia-Pacific
Latin America and the Caribbean
Sub-Saharan Africa
Eastern Europe and Western/Central Asia
Western Europe
Middle East and North Africa
Southern Asia
REGI
ON
PERCENT OF CASES
94.4% 5.6%
90.4% 9.6%
85.1% 14.9%
80.8% 19.2%
78.9% 21.1%
75.5% 24.5%
71.8% 28.2%
54.7% 45.3%
53.9% 46.1%
33+67+A 35+65+A 33+67+A2010 2012 2014
Male66.8%
Male65.0%
Male66.7%
Female33.2%
Female35.0%
Female33.3%
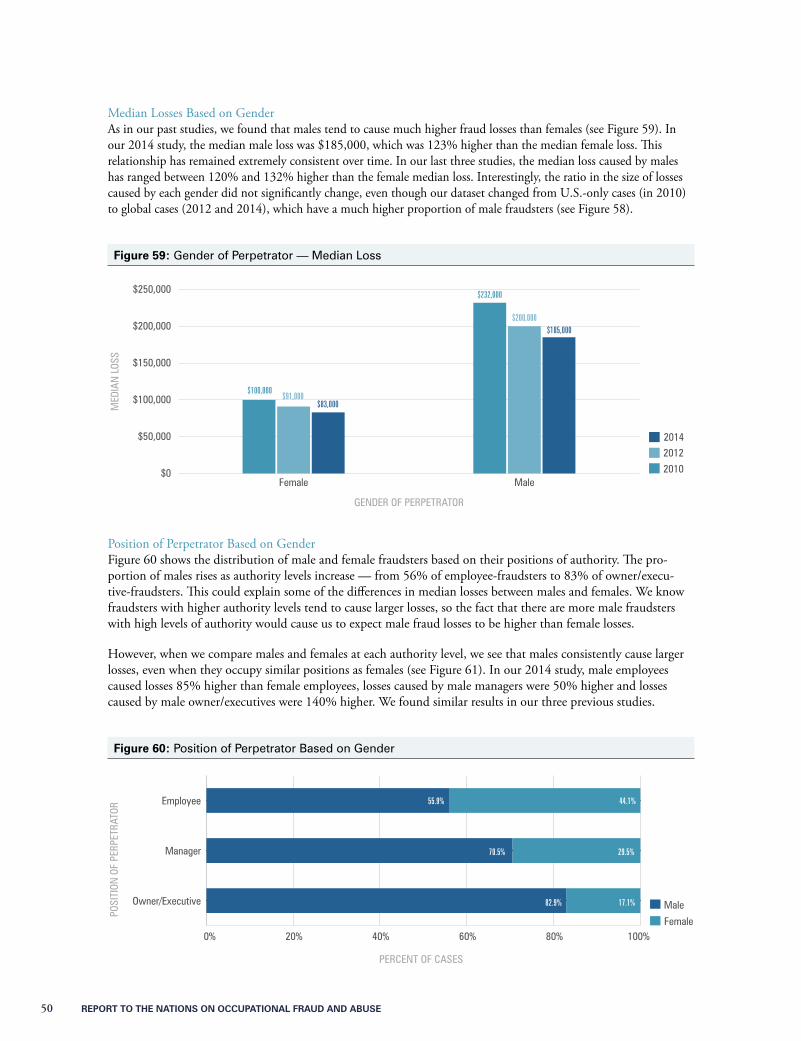
50 REPORT TO THE NATIONS ON OCCUPATIONAL FRAUD AND ABUSE
Median Losses Based on GenderAs in our past studies, we found that males tend to cause much higher fraud losses than females (see Figure 59). In our 2014 study, the median male loss was $185,000, which was 123% higher than the median female loss. This relationship has remained extremely consistent over time. In our last three studies, the median loss caused by males has ranged between 120% and 132% higher than the female median loss. Interestingly, the ratio in the size of losses caused by each gender did not significantly change, even though our dataset changed from U.S.-only cases (in 2010) to global cases (2012 and 2014), which have a much higher proportion of male fraudsters (see Figure 58).
Figure 59: Gender of Perpetrator — Median Loss
$0
$50,000
$100,000
$150,000
$200,000
$250,000
20142012
2010MaleFemale
MED
IAN
LOS
S
GENDER OF PERPETRATOR
$100,000$91,000
$83,000
$232,000
$200,000$185,000
Position of Perpetrator Based on GenderFigure 60 shows the distribution of male and female fraudsters based on their positions of authority. The pro-portion of males rises as authority levels increase — from 56% of employee-fraudsters to 83% of owner/execu-tive-fraudsters. This could explain some of the differences in median losses between males and females. We know fraudsters with higher authority levels tend to cause larger losses, so the fact that there are more male fraudsters with high levels of authority would cause us to expect male fraud losses to be higher than female losses.
However, when we compare males and females at each authority level, we see that males consistently cause larger losses, even when they occupy similar positions as females (see Figure 61). In our 2014 study, male employees caused losses 85% higher than female employees, losses caused by male managers were 50% higher and losses caused by male owner/executives were 140% higher. We found similar results in our three previous studies.
Figure 60: Position of Perpetrator Based on Gender
0% 20% 40% 60% 80% 100%Female
MaleOwner/Executive
Manager
Employee
POSI
TION
OF
PERP
ETRA
TOR
PERCENT OF CASES
55.9% 44.1%
70.5% 29.5%
82.9% 17.1%

REPORT TO THE NATIONS ON OCCUPATIONAL FRAUD AND ABUSE 51
Figure 61: Position of Perpetrator — Median Loss Based on Gender
$0 $200,000 $400,000 $600,000 $800,000Female
MaleOwner/Executive
Manager
Employee
POSI
TION
OF
PERP
ETRA
TOR
MEDIAN LOSS
$100,000$54,000
$140,000$119,000
$250,000$600,000
One possible reason for the discrepancy in median losses is that males tend to commit corruption and financial statement fraud schemes at a much higher rate than females. In Figure 62, we see that nearly half of all frauds committed by men involve corruption and 11% involve financial statement fraud. Women, conversely, only committed corruption in 20% of cases and financial statement fraud in 6%. Because corruption and financial statement fraud tend to cause larger losses than asset misappropriation, this might help explain the discrepancy in male and female median loss. However, it is not clear why men seem more likely than women to engage in corruption and financial statement fraud.
Figure 62: Frequency of Fraud Schemes Based on Gender
0% 20% 40% 60% 80% 100% 120% 140% 160%
Financial Statement Fraud
Corruption
Asset Misappropriation
Female
Male
GEN
DER
OF P
ERPE
TRAT
OR
PERCENT OF CASES
81.5% 46.8% 10.6%
93.6% 20.2% 6.0%
*Total percentages in chart exceed 100% because several cases fell into more than one scheme category.
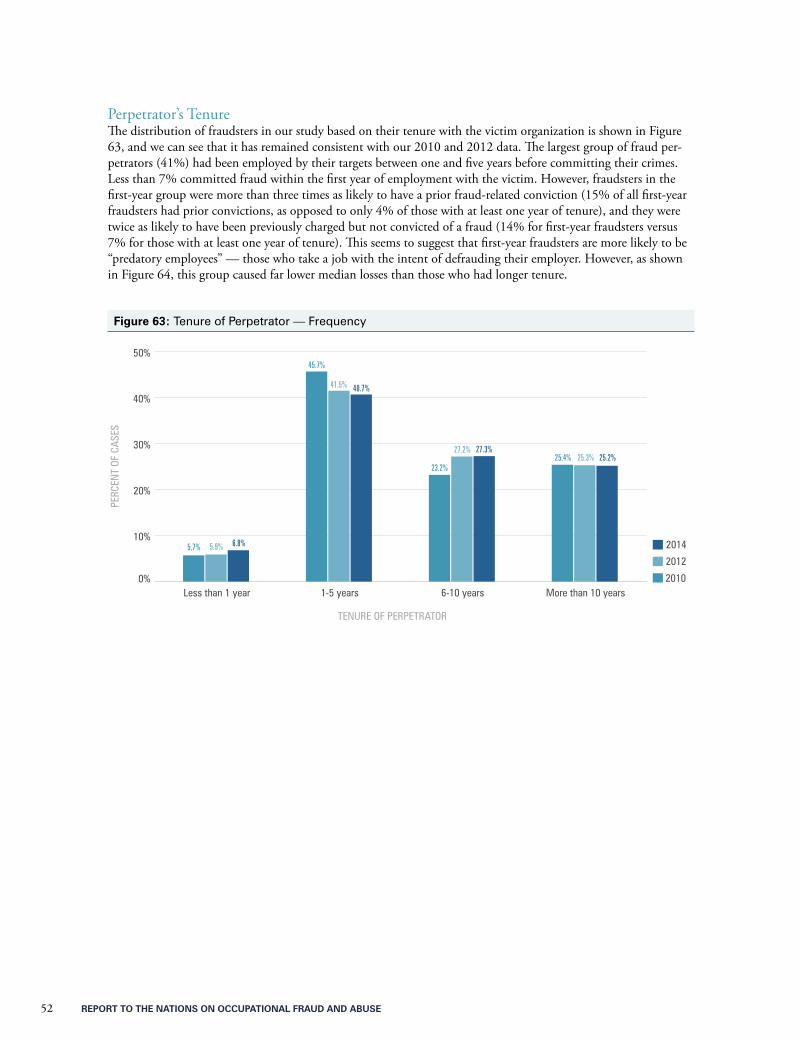
52 RepoRt to the NatioNs oN occupatioNal FRaud aNd abuse
Perpetrator’s Tenure The distribution of fraudsters in our study based on their tenure with the victim organization is shown in Figure 63, and we can see that it has remained consistent with our 2010 and 2012 data. The largest group of fraud per-petrators (41%) had been employed by their targets between one and five years before committing their crimes. Less than 7% committed fraud within the first year of employment with the victim. However, fraudsters in the first-year group were more than three times as likely to have a prior fraud-related conviction (15% of all first-year fraudsters had prior convictions, as opposed to only 4% of those with at least one year of tenure), and they were twice as likely to have been previously charged but not convicted of a fraud (14% for first-year fraudsters versus 7% for those with at least one year of tenure). This seems to suggest that first-year fraudsters are more likely to be “predatory employees” — those who take a job with the intent of defrauding their employer. However, as shown in Figure 64, this group caused far lower median losses than those who had longer tenure.
Figure 63: Tenure of Perpetrator — Frequency
0%
10%
20%
30%
40%
50%
2010
2012
2014
More than 10 years6-10 years1-5 yearsLess than 1 year
51.9% 6.6% 2.9%
5.7% 5.9% 6.8%
45.7%
41.5% 40.7%
23.2%
27.2%25.4% 25.3% 25.2%
27.3%
TENURE OF PERPETRATOR
PERC
ENT
OF C
ASES
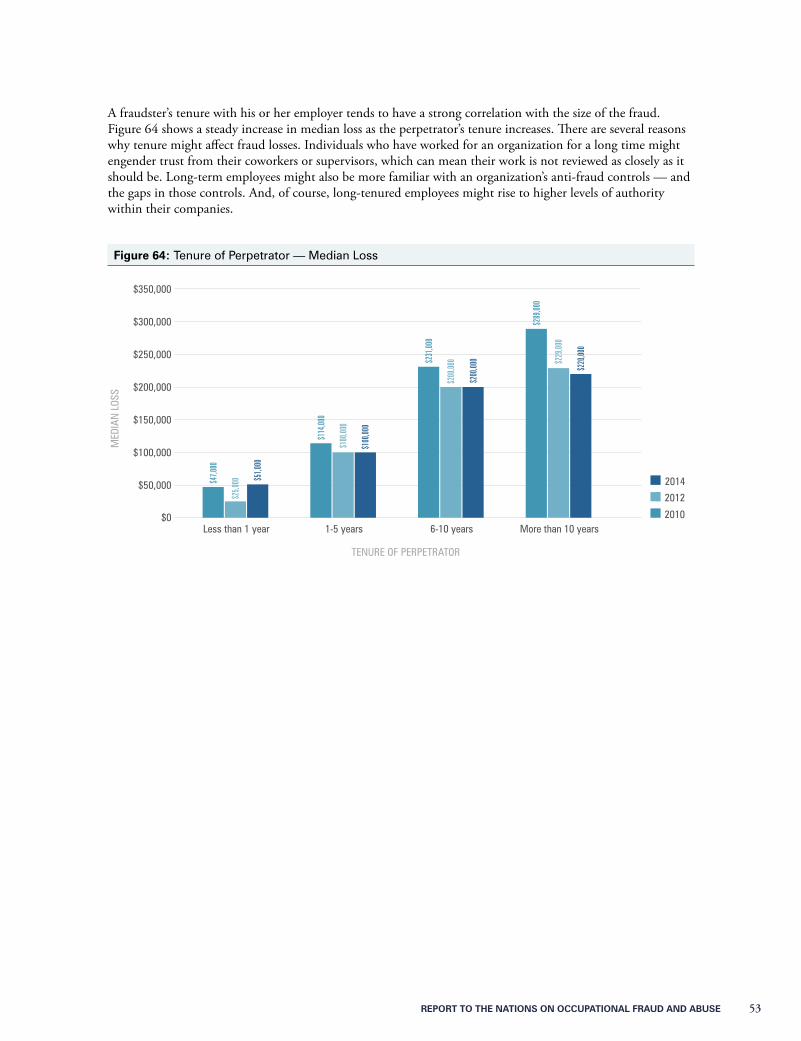
RepoRt to the NatioNs oN occupatioNal FRaud aNd abuse 53
A fraudster’s tenure with his or her employer tends to have a strong correlation with the size of the fraud. Figure 64 shows a steady increase in median loss as the perpetrator’s tenure increases. There are several reasons why tenure might affect fraud losses. Individuals who have worked for an organization for a long time might engender trust from their coworkers or supervisors, which can mean their work is not reviewed as closely as it should be. Long-term employees might also be more familiar with an organization’s anti-fraud controls — and the gaps in those controls. And, of course, long-tenured employees might rise to higher levels of authority within their companies.
Figure 64: Tenure of Perpetrator — Median Loss
$0
$50,000
$100,000
$150,000
$200,000
$250,000
$300,000
$350,000
2014
2012
2010More than 10 years6-10 years1-5 yearsLess than 1 year
6.6%
TENURE OF PERPETRATOR
MED
IAN
LOS
S
$47,0
00
$25,0
00 $51,0
00
$114
,000
$100
,000
$100
,000
$231
,000
$200
,000
$200
,000
$289
,000
$229
,000
$220
,000
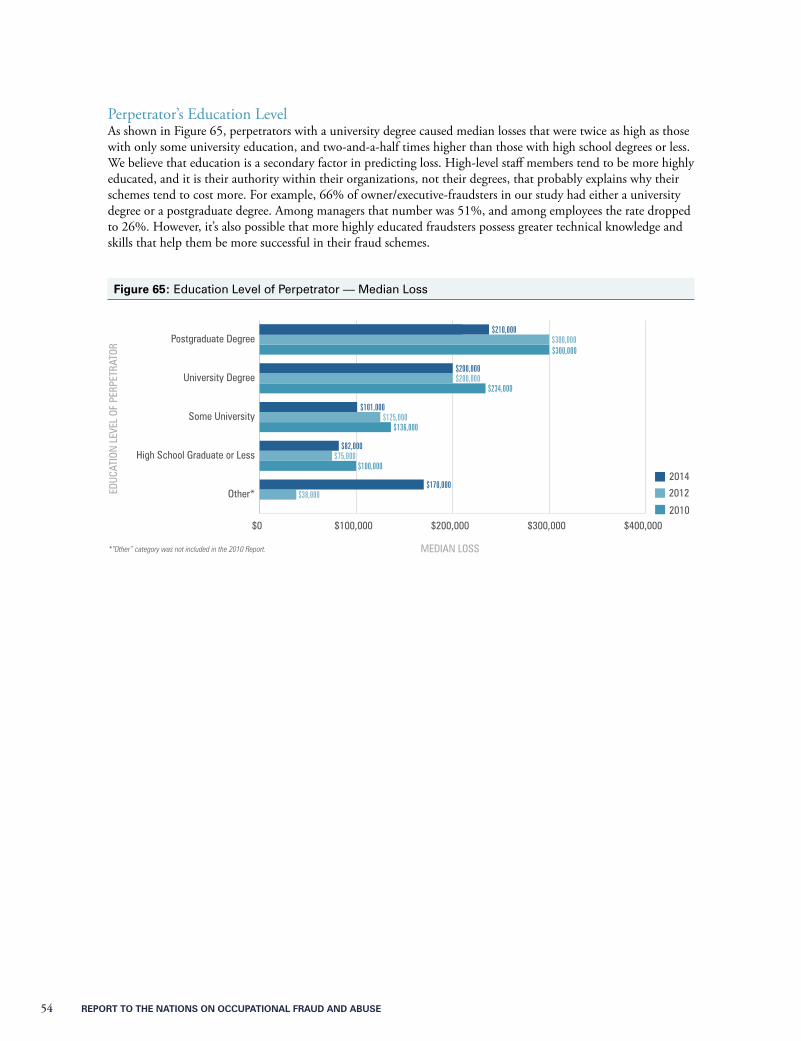
54 REPORT TO THE NATIONS ON OCCUPATIONAL FRAUD AND ABUSE
Perpetrator’s Education LevelAs shown in Figure 65, perpetrators with a university degree caused median losses that were twice as high as those with only some university education, and two-and-a-half times higher than those with high school degrees or less. We believe that education is a secondary factor in predicting loss. High-level staff members tend to be more highly educated, and it is their authority within their organizations, not their degrees, that probably explains why their schemes tend to cost more. For example, 66% of owner/executive-fraudsters in our study had either a university degree or a postgraduate degree. Among managers that number was 51%, and among employees the rate dropped to 26%. However, it’s also possible that more highly educated fraudsters possess greater technical knowledge and skills that help them be more successful in their fraud schemes.
Figure 65: Education Level of Perpetrator — Median Loss
$0 $100,000 $200,000 $300,000 $400,0002010
2012
2014
Other*
High School Graduate or Less
Some University
University Degree
Postgraduate Degree
EDUC
ATIO
N L
EVEL
OF
PERP
ETRA
TOR
MEDIAN LOSS
$300,000$300,000
$200,000$200,000
$234,000
$101,000$125,000
$136,000
$82,000$75,000
$100,000
$170,000$38,000
*“Other” category was not included in the 2010 Report.
$210,000
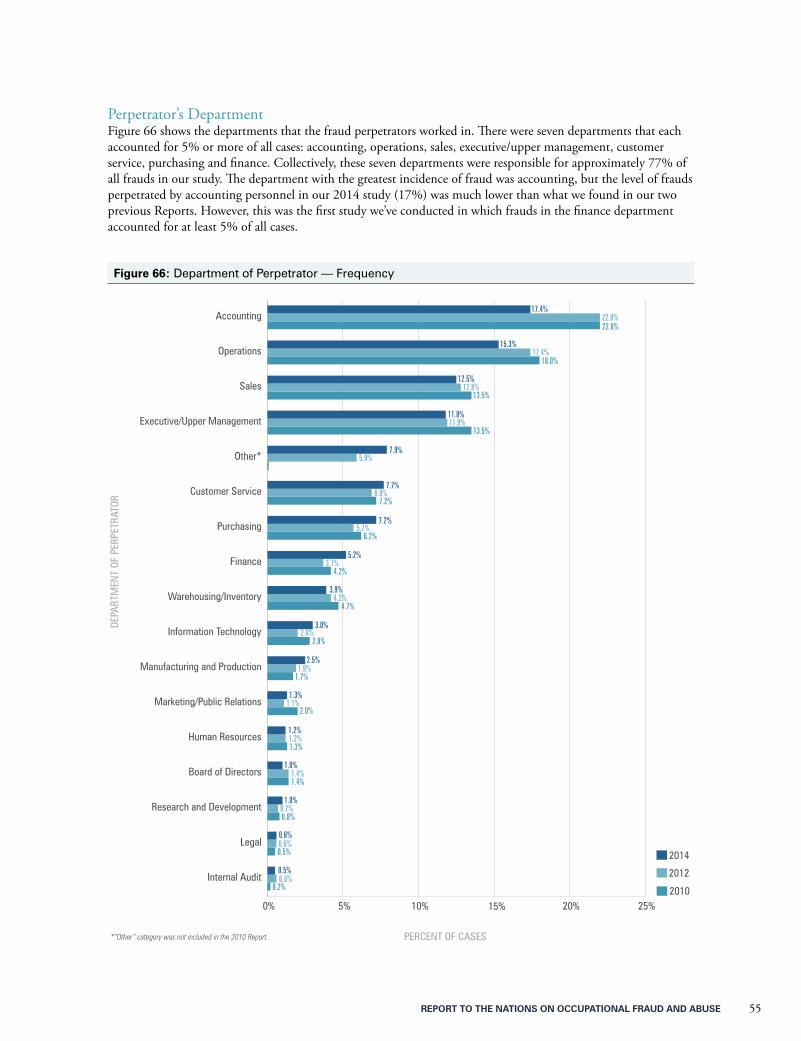
REPORT TO THE NATIONS ON OCCUPATIONAL FRAUD AND ABUSE 55
Perpetrator’s DepartmentFigure 66 shows the departments that the fraud perpetrators worked in. There were seven departments that each accounted for 5% or more of all cases: accounting, operations, sales, executive/upper management, customer service, purchasing and finance. Collectively, these seven departments were responsible for approximately 77% of all frauds in our study. The department with the greatest incidence of fraud was accounting, but the level of frauds perpetrated by accounting personnel in our 2014 study (17%) was much lower than what we found in our two previous Reports. However, this was the first study we’ve conducted in which frauds in the finance department accounted for at least 5% of all cases.
Figure 66: Department of Perpetrator — Frequency
0% 5% 10% 15% 20% 25%2010
2012
2014
Internal Audit
Legal
Research and Development
Board of Directors
Human Resources
Marketing/Public Relations
Manufacturing and Production
Information Technology
Warehousing/Inventory
Finance
Purchasing
Customer Service
Other*
Executive/Upper Management
Sales
Operations
Accounting
DEPA
RTM
ENT
OF P
ERPE
TRAT
OR
PERCENT OF CASES
17.4%22.0%22.0%
15.3%17.4%
18.0%
12.5%12.8%
13.5%
11.8%11.9%
13.5%
7.2%5.7%
6.2%
7.9%5.9%
7.7%6.9%
7.2%
5.2%3.7%
4.2%
3.9%4.2%
4.7%
3.0%2.0%
2.8%
2.5%1.9%
1.7%
1.3%1.1%
2.0%
1.2%1.2%1.3%
1.0%1.4%1.4%
1.0%0.7%0.8%
0.6%0.6%0.5%
0.5%0.6%
0.2%
*”Other” category was not included in the 2010 Report.
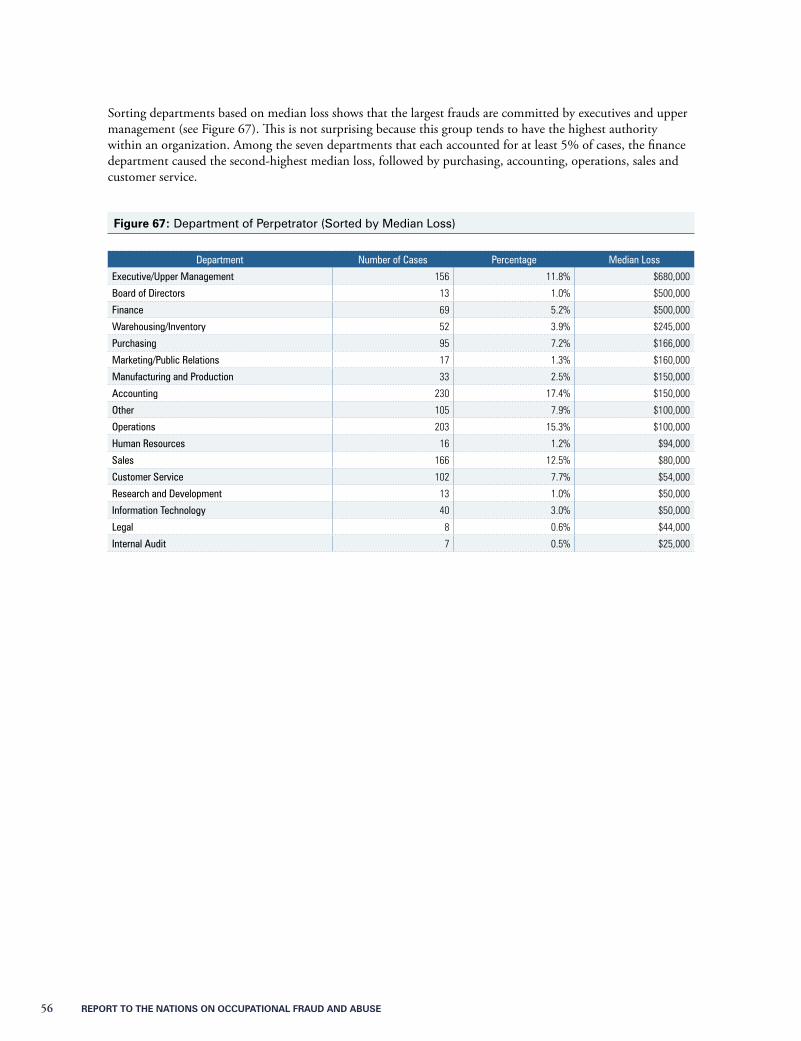
56 REPORT TO THE NATIONS ON OCCUPATIONAL FRAUD AND ABUSE
Sorting departments based on median loss shows that the largest frauds are committed by executives and upper management (see Figure 67). This is not surprising because this group tends to have the highest authority within an organization. Among the seven departments that each accounted for at least 5% of cases, the finance department caused the second-highest median loss, followed by purchasing, accounting, operations, sales and customer service.
Figure 67: Department of Perpetrator (Sorted by Median Loss)
Department Number of Cases Percentage Median Loss
Executive/Upper Management 156 11.8% $680,000
Board of Directors 13 1.0% $500,000
Finance 69 5.2% $500,000
Warehousing/Inventory 52 3.9% $245,000
Purchasing 95 7.2% $166,000
Marketing/Public Relations 17 1.3% $160,000
Manufacturing and Production 33 2.5% $150,000
Accounting 230 17.4% $150,000
Other 105 7.9% $100,000
Operations 203 15.3% $100,000
Human Resources 16 1.2% $94,000
Sales 166 12.5% $80,000
Customer Service 102 7.7% $54,000
Research and Development 13 1.0% $50,000
Information Technology 40 3.0% $50,000
Legal 8 0.6% $44,000
Internal Audit 7 0.5% $25,000
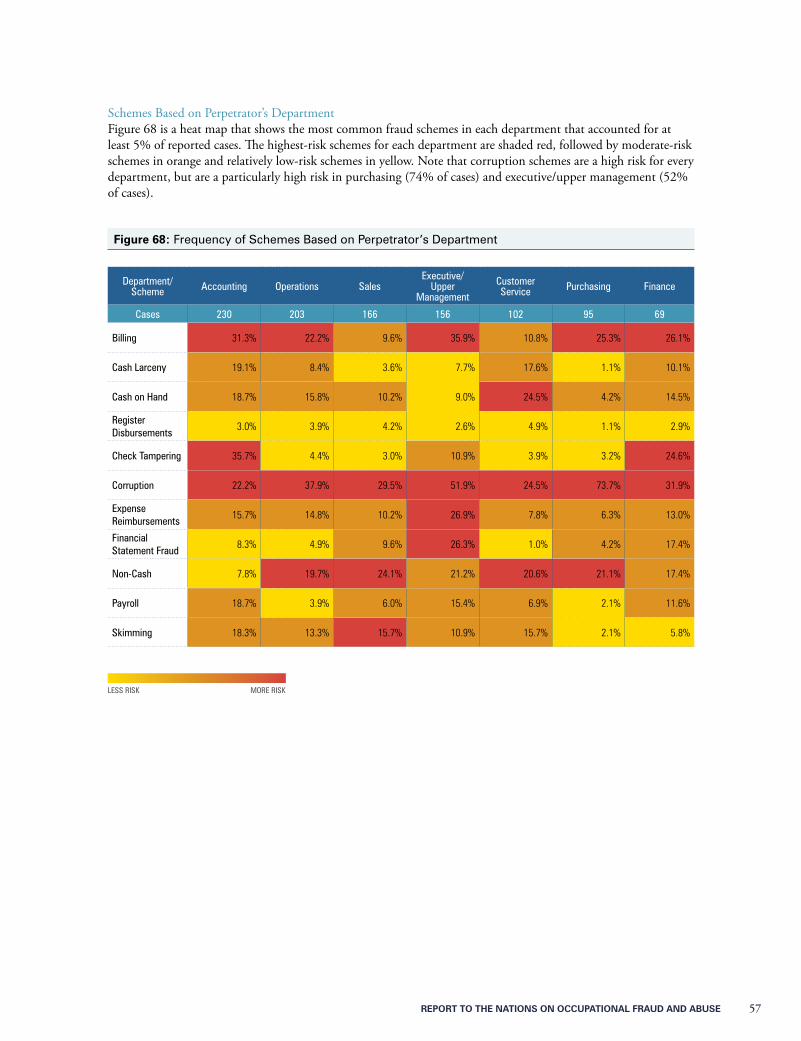
REPORT TO THE NATIONS ON OCCUPATIONAL FRAUD AND ABUSE 57
Schemes Based on Perpetrator’s DepartmentFigure 68 is a heat map that shows the most common fraud schemes in each department that accounted for at least 5% of reported cases. The highest-risk schemes for each department are shaded red, followed by moderate-risk schemes in orange and relatively low-risk schemes in yellow. Note that corruption schemes are a high risk for every department, but are a particularly high risk in purchasing (74% of cases) and executive/upper management (52% of cases).
Figure 68: Frequency of Schemes Based on Perpetrator’s Department
Department/Scheme Accounting Operations Sales
Executive/Upper
Management
Customer Service Purchasing Finance
Cases 230 203 166 156 102 95 69
Billing 31.3% 22.2% 9.6% 35.9% 10.8% 25.3% 26.1%
Cash Larceny 19.1% 8.4% 3.6% 7.7% 17.6% 1.1% 10.1%
Cash on Hand 18.7% 15.8% 10.2% 9.0% 24.5% 4.2% 14.5%
Register Disbursements
3.0% 3.9% 4.2% 2.6% 4.9% 1.1% 2.9%
Check Tampering 35.7% 4.4% 3.0% 10.9% 3.9% 3.2% 24.6%
Corruption 22.2% 37.9% 29.5% 51.9% 24.5% 73.7% 31.9%
Expense Reimbursements
15.7% 14.8% 10.2% 26.9% 7.8% 6.3% 13.0%
Financial Statement Fraud
8.3% 4.9% 9.6% 26.3% 1.0% 4.2% 17.4%
Non-Cash 7.8% 19.7% 24.1% 21.2% 20.6% 21.1% 17.4%
Payroll 18.7% 3.9% 6.0% 15.4% 6.9% 2.1% 11.6%
Skimming 18.3% 13.3% 15.7% 10.9% 15.7% 2.1% 5.8%
LESS RISk MORE RISk
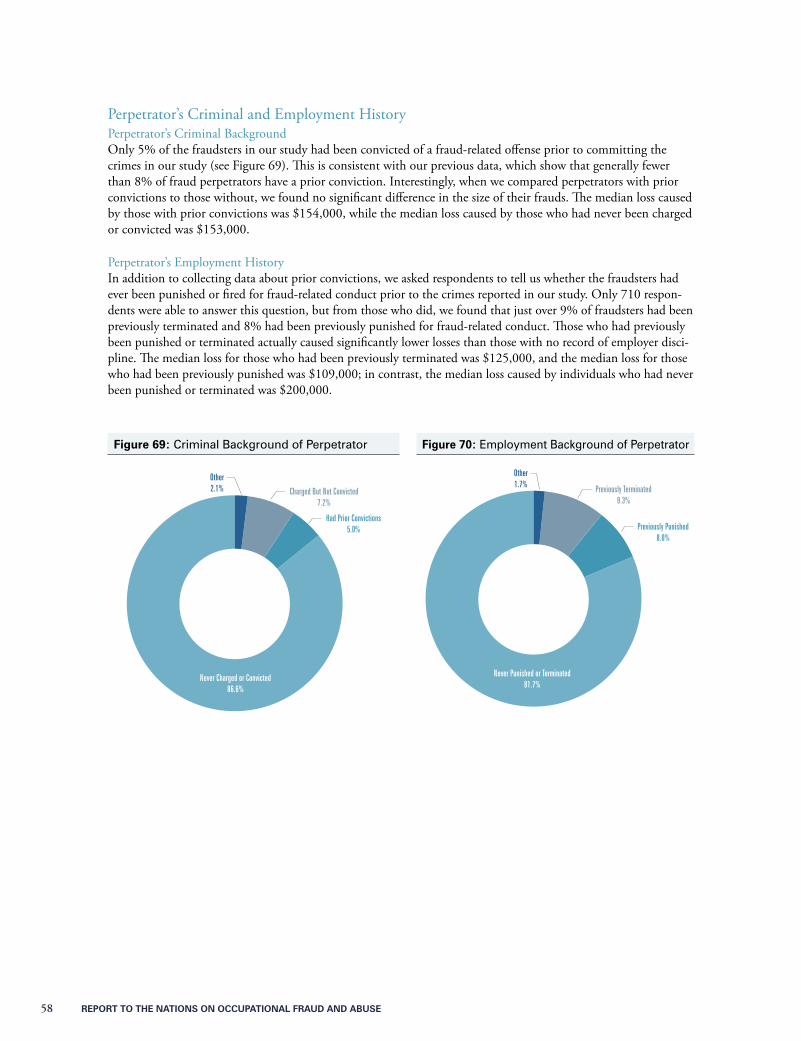
58 REPORT TO THE NATIONS ON OCCUPATIONAL FRAUD AND ABUSE
Perpetrator’s Criminal and Employment HistoryPerpetrator’s Criminal BackgroundOnly 5% of the fraudsters in our study had been convicted of a fraud-related offense prior to committing the crimes in our study (see Figure 69). This is consistent with our previous data, which show that generally fewer than 8% of fraud perpetrators have a prior conviction. Interestingly, when we compared perpetrators with prior convictions to those without, we found no significant difference in the size of their frauds. The median loss caused by those with prior convictions was $154,000, while the median loss caused by those who had never been charged or convicted was $153,000.
Perpetrator’s Employment HistoryIn addition to collecting data about prior convictions, we asked respondents to tell us whether the fraudsters had ever been punished or fired for fraud-related conduct prior to the crimes reported in our study. Only 710 respon-dents were able to answer this question, but from those who did, we found that just over 9% of fraudsters had been previously terminated and 8% had been previously punished for fraud-related conduct. Those who had previously been punished or terminated actually caused significantly lower losses than those with no record of employer disci-pline. The median loss for those who had been previously terminated was $125,000, and the median loss for those who had been previously punished was $109,000; in contrast, the median loss caused by individuals who had never been punished or terminated was $200,000.
6.6% 2.9%
Other 1.7%
Never Punished or Terminated 81.7%
Previously Terminated 9.3%
Previously Punished 8.0%
6.6% 2.9%
Other 2.1%
Never Charged or Convicted 86.6%
Charged But Not Convicted 7.2%
Had Prior Convictions 5.0%
Figure 69: Criminal Background of Perpetrator Figure 70: Employment Background of Perpetrator
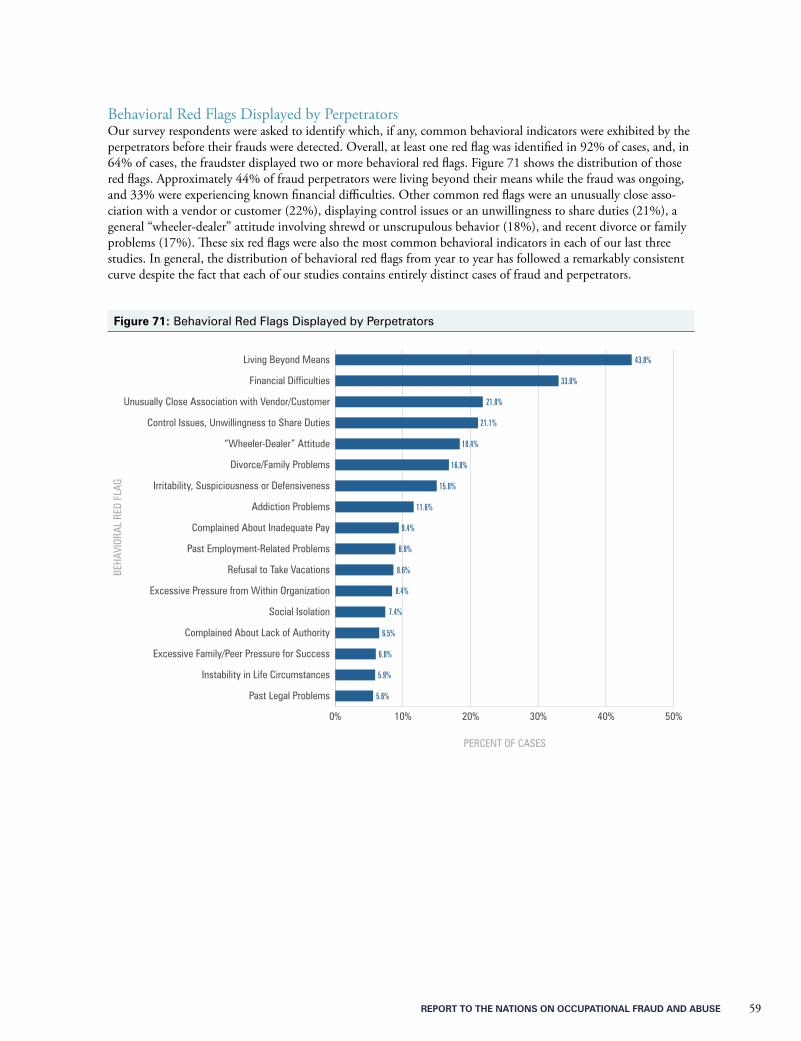
RepoRt to the NatioNs oN occupatioNal FRaud aNd abuse 59
Behavioral Red Flags Displayed by PerpetratorsOur survey respondents were asked to identify which, if any, common behavioral indicators were exhibited by the perpetrators before their frauds were detected. Overall, at least one red flag was identified in 92% of cases, and, in 64% of cases, the fraudster displayed two or more behavioral red flags. Figure 71 shows the distribution of those red flags. Approximately 44% of fraud perpetrators were living beyond their means while the fraud was ongoing, and 33% were experiencing known financial difficulties. Other common red flags were an unusually close asso-ciation with a vendor or customer (22%), displaying control issues or an unwillingness to share duties (21%), a general “wheeler-dealer” attitude involving shrewd or unscrupulous behavior (18%), and recent divorce or family problems (17%). These six red flags were also the most common behavioral indicators in each of our last three studies. In general, the distribution of behavioral red flags from year to year has followed a remarkably consistent curve despite the fact that each of our studies contains entirely distinct cases of fraud and perpetrators.
Figure 71: Behavioral Red Flags Displayed by Perpetrators
0% 10% 20% 30% 40% 50%
Past Legal Problems
Instability in Life Circumstances
Excessive Family/Peer Pressure for Success
Complained About Lack of Authority
Social Isolation
Excessive Pressure from Within Organization
Refusal to Take Vacations
Past Employment-Related Problems
Complained About Inadequate Pay
Addiction Problems
Irritability, Suspiciousness or Defensiveness
Divorce/Family Problems
“Wheeler-Dealer” Attitude
Control Issues, Unwillingness to Share Duties
Unusually Close Association with Vendor/Customer
Financial Difficulties
Living Beyond Means
BEHA
VIOR
AL R
ED F
LAG
PERCENT OF CASES
43.8%
33.0%
21.8%
21.1%
18.4%
16.8%
15.0%
11.6%
9.4%
8.9%
8.6%
8.4%
7.4%
6.5%
6.0%
5.9%
5.6%
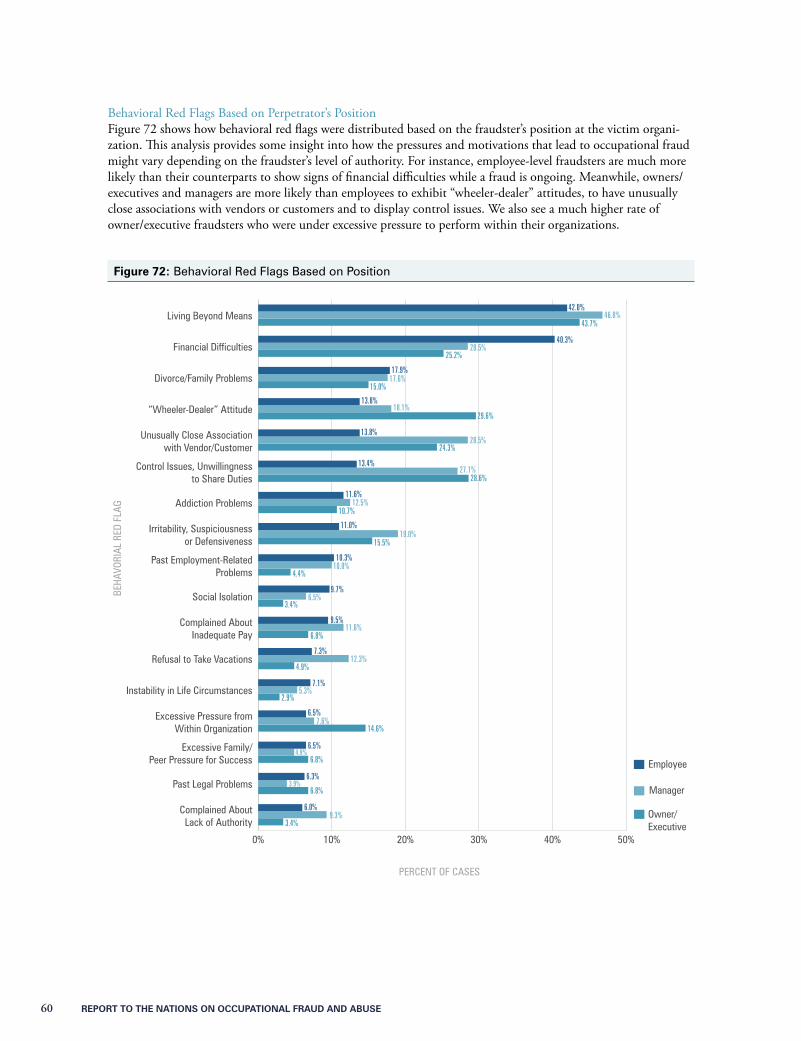
60 REPORT TO THE NATIONS ON OCCUPATIONAL FRAUD AND ABUSE
Behavioral Red Flags Based on Perpetrator’s PositionFigure 72 shows how behavioral red flags were distributed based on the fraudster’s position at the victim organi-zation. This analysis provides some insight into how the pressures and motivations that lead to occupational fraud might vary depending on the fraudster’s level of authority. For instance, employee-level fraudsters are much more likely than their counterparts to show signs of financial difficulties while a fraud is ongoing. Meanwhile, owners/executives and managers are more likely than employees to exhibit “wheeler-dealer” attitudes, to have unusually close associations with vendors or customers and to display control issues. We also see a much higher rate of owner/executive fraudsters who were under excessive pressure to perform within their organizations.
Figure 72: Behavioral Red Flags Based on Position
0% 10% 20% 30% 40% 50%
Owner/Executive
Manager
Employee
Complained AboutLack of Authority
Past Legal Problems
Excessive Family/Peer Pressure for Success
Excessive Pressure fromWithin Organization
Instability in Life Circumstances
Refusal to Take Vacations
Complained AboutInadequate Pay
Social Isolation
Past Employment-RelatedProblems
Irritability, Suspiciousnessor Defensiveness
Addiction Problems
Control Issues, Unwillingnessto Share Duties
Unusually Close Associationwith Vendor/Customer
“Wheeler-Dealer” Attitude
Divorce/Family Problems
Financial Difficulties
Living Beyond Means
BEHA
VORI
AL R
ED F
LAG
PERCENT OF CASES
42.0%46.8%
43.7%
40.3%28.5%
25.2%
17.9%17.6%
15.0%
13.8%18.1%
29.6%
11.6%12.5%
10.7%
13.8%28.5%
24.3%
13.4%27.1%
28.6%
11.0%19.0%
15.5%
10.3%10.0%
4.4%
9.7%6.5%
3.4%
9.5%11.6%
6.8%
7.3%12.3%
4.9%
7.1%5.3%
2.9%
6.5%7.6%
14.6%
6.5%4.9%
6.8%
6.3%3.9%
6.8%
6.0%9.3%
3.4%
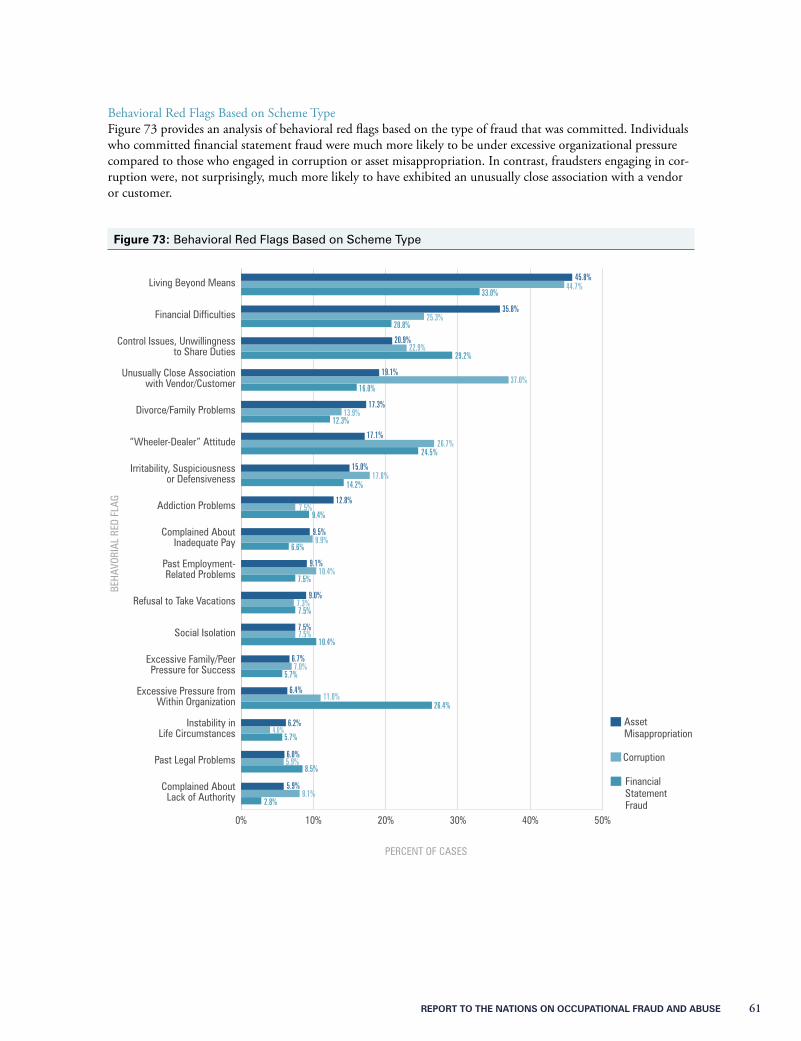
REPORT TO THE NATIONS ON OCCUPATIONAL FRAUD AND ABUSE 61
Behavioral Red Flags Based on Scheme TypeFigure 73 provides an analysis of behavioral red flags based on the type of fraud that was committed. Individuals who committed financial statement fraud were much more likely to be under excessive organizational pressure compared to those who engaged in corruption or asset misappropriation. In contrast, fraudsters engaging in cor-ruption were, not surprisingly, much more likely to have exhibited an unusually close association with a vendor or customer.
Figure 73: Behavioral Red Flags Based on Scheme Type
0% 10% 20% 30% 40% 50%
Financial Statement Fraud
Corruption
Asset Misappropriation
Complained AboutLack of Authority
Past Legal Problems
Instability inLife Circumstances
Excessive Pressure fromWithin Organization
Excessive Family/PeerPressure for Success
Social Isolation
Refusal to Take Vacations
Past Employment-Related Problems
Complained AboutInadequate Pay
Addiction Problems
Irritability, Suspiciousnessor Defensiveness
“Wheeler-Dealer” Attitude
Divorce/Family Problems
Unusually Close Associationwith Vendor/Customer
Control Issues, Unwillingnessto Share Duties
Financial Difficulties
Living Beyond Means
BEHA
VORI
AL R
ED F
LAG
PERCENT OF CASES
45.8%44.7%
33.0%
35.8%25.3%
20.8%
20.9%22.9%
29.2%
19.1%37.0%
16.0%
15.0%17.8%
14.2%
17.3%13.9%
12.3%
17.1%26.7%
24.5%
12.8%7.5%
9.4%
9.5%9.9%
6.6%
9.1%10.4%
7.5%
9.0%7.3%7.5%
7.5%7.5%
10.4%
6.7%7.0%
5.7%
6.4%11.0%
26.4%
6.2%4.0%
5.7%
6.0%5.9%
8.5%
5.9%8.1%
2.8%
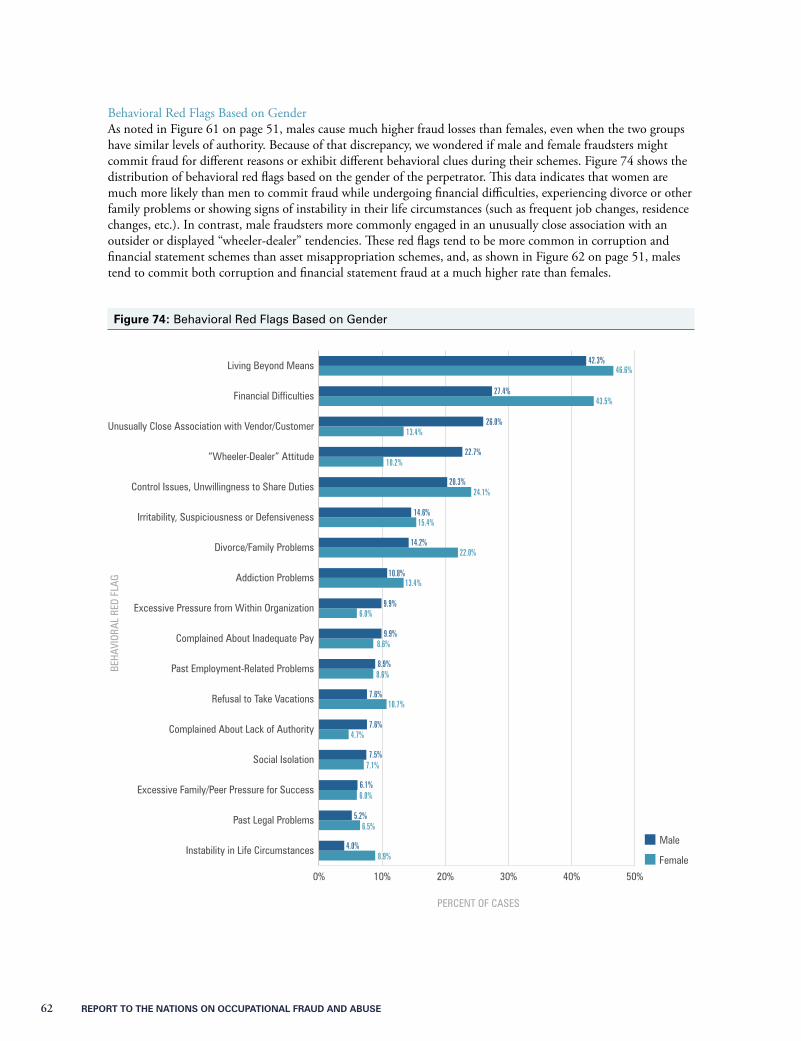
62 REPORT TO THE NATIONS ON OCCUPATIONAL FRAUD AND ABUSE
Behavioral Red Flags Based on GenderAs noted in Figure 61 on page 51, males cause much higher fraud losses than females, even when the two groups have similar levels of authority. Because of that discrepancy, we wondered if male and female fraudsters might commit fraud for different reasons or exhibit different behavioral clues during their schemes. Figure 74 shows the distribution of behavioral red flags based on the gender of the perpetrator. This data indicates that women are much more likely than men to commit fraud while undergoing financial difficulties, experiencing divorce or other family problems or showing signs of instability in their life circumstances (such as frequent job changes, residence changes, etc.). In contrast, male fraudsters more commonly engaged in an unusually close association with an outsider or displayed “wheeler-dealer” tendencies. These red flags tend to be more common in corruption and financial statement schemes than asset misappropriation schemes, and, as shown in Figure 62 on page 51, males tend to commit both corruption and financial statement fraud at a much higher rate than females.
Figure 74: Behavioral Red Flags Based on Gender
0% 10% 20% 30% 40% 50%
Female
MaleInstability in Life Circumstances
Past Legal Problems
Excessive Family/Peer Pressure for Success
Social Isolation
Complained About Lack of Authority
Refusal to Take Vacations
Past Employment-Related Problems
Complained About Inadequate Pay
Excessive Pressure from Within Organization
Addiction Problems
Divorce/Family Problems
Irritability, Suspiciousness or Defensiveness
Control Issues, Unwillingness to Share Duties
“Wheeler-Dealer” Attitude
Unusually Close Association with Vendor/Customer
Financial Difficulties
Living Beyond Means
BEHA
VIOR
AL R
ED F
LAG
PERCENT OF CASES
42.3%46.6%
27.4%43.5%
26.0%13.4%
22.7%10.2%
20.3%24.1%
14.6%15.4%
14.2%22.0%
10.8%13.4%
9.9%6.0%
9.9%8.6%
8.9%8.6%
7.6%10.7%
7.6%4.7%
7.5%7.1%
6.1%6.0%
5.2%6.5%
4.0%8.9%

RepoRt to the NatioNs oN occupatioNal FRaud aNd abuse 63
Non-Fraud-Related MisconductIn addition to behavioral red flags, we asked respondents if the fraudsters they investigated had engaged in any non-fraud-related workplace misconduct before or during their crimes. We wanted to see if there was a relation-ship between occupational fraud and other types of inappropriate workplace behavior. We received 908 responses to this question, and in 38% of those cases the perpetrator had engaged in at least one of the misbehaviors shown in Figure 75. The most common type of non-fraud misconduct was bullying or intimidation, which was displayed by one-sixth of the fraud perpetrators in our study. Another 14% of cases involved individuals who were excessively absent from work. Fewer than 5% of cases involved fraudsters who had engaged in sexual harassment or who had a history of visiting inappropriate websites (such as pornography or illegal gambling) at the office.
Human-Resources-Related Red FlagsWe also asked survey respondents if the perpetrators had experienced any of several human-resources-related events, such as fear of job loss, cuts in pay or demotions. These circumstances could potentially cause an individual to experience financial pressure that might lead to an occupational fraud, or they could provide the means for a perpetrator to rationalize his or her conduct. We received just over 1,000 responses to this question, and in 25% of those cases the perpetrator had experienced an HR-related event immediately before or during the commission of the fraud. As illustrated in Figure 76, the most common HR-related red flag was a poor performance evaluation, which occurred in 11% of all cases. Seven percent of occupational fraudsters also experienced a fear of job loss due to downsizing or restructuring in their company.
Bullying or Intimidation16.6% Poor Performance Evaluations
11.4%
Fear of Job Loss Due to Downsizing/Restructuring
7.4%
Actual Job Loss Due to Downsizing/Restructuring
3.1%
Demotion2.4%
Involuntary Cut in Hours1.4%
Cut in Pay3.1%
Cut in Benefits3.0%
Excessive Absenteeism14.4%
Excessive Tardiness8.1%
Excessive Internet Browsing
7.3%
Visiting Inappropriate Internet Sites
3.5%
Sexual Harrassment2.6%
Figure 75: Non-Fraud-Related Misconduct Figure 76: HR-Related Red Flags
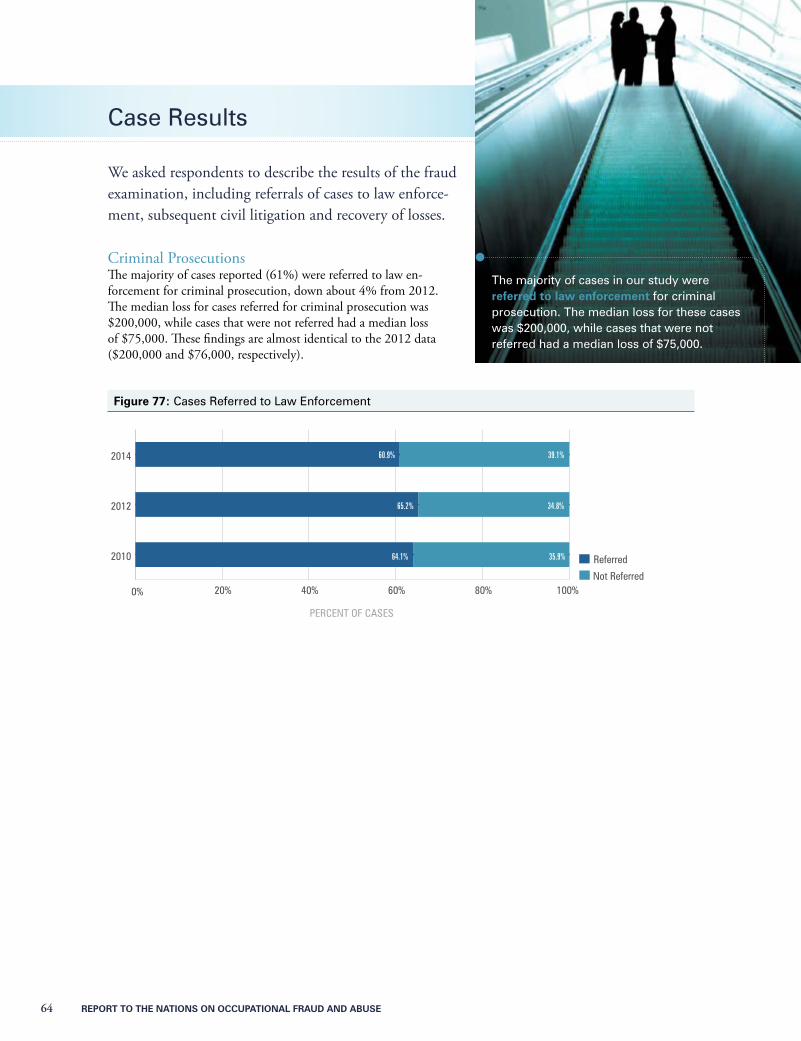
64 REPORT TO THE NATIONS ON OCCUPATIONAL FRAUD AND ABUSE
Case Results
We asked respondents to describe the results of the fraud examination, including referrals of cases to law enforce-ment, subsequent civil litigation and recovery of losses.
Criminal ProsecutionsThe majority of cases reported (61%) were referred to law en-forcement for criminal prosecution, down about 4% from 2012. The median loss for cases referred for criminal prosecution was $200,000, while cases that were not referred had a median loss of $75,000. These findings are almost identical to the 2012 data ($200,000 and $76,000, respectively).
Figure 77: Cases Referred to Law Enforcement
0% 20% 40% 60% 80% 100%Not Referred
Referred2010
2012
2014
PERCENT OF CASES
60.9% 39.1%
65.2% 34.8%
64.1% 35.9%
The majority of cases in our study were referred to law enforcement for criminal prosecution. The median loss for these cases was $200,000, while cases that were not referred had a median loss of $75,000.
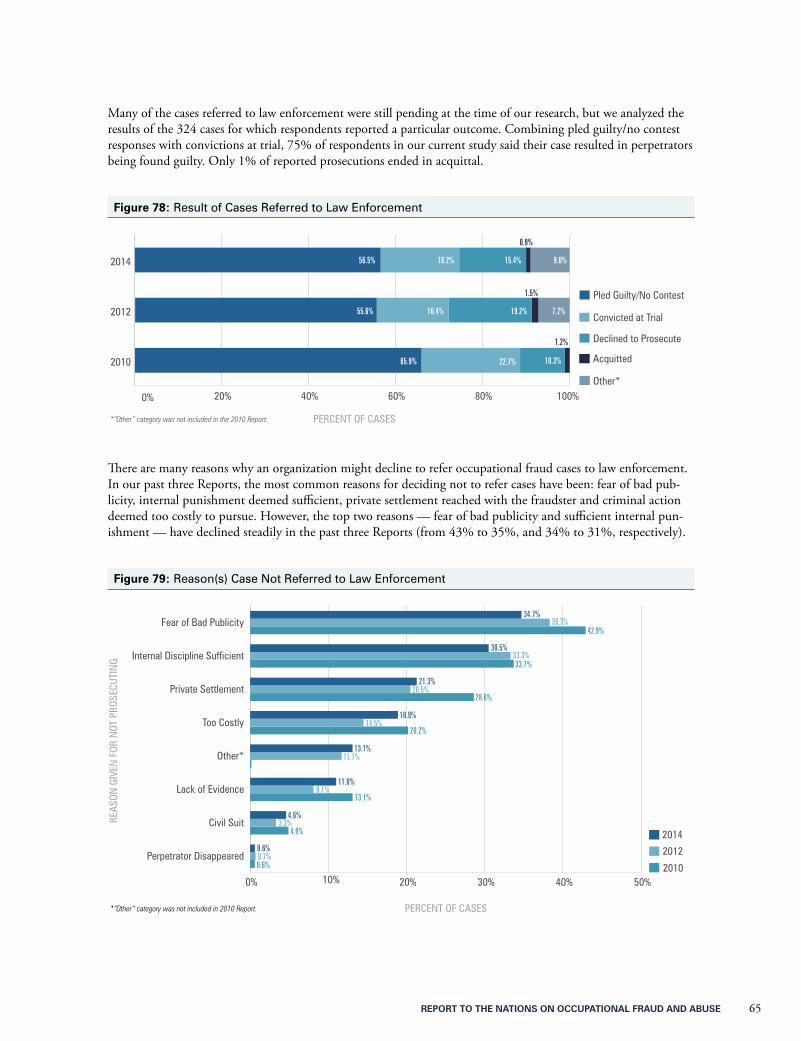
REPORT TO THE NATIONS ON OCCUPATIONAL FRAUD AND ABUSE 65
Many of the cases referred to law enforcement were still pending at the time of our research, but we analyzed the results of the 324 cases for which respondents reported a particular outcome. Combining pled guilty/no contest responses with convictions at trial, 75% of respondents in our current study said their case resulted in perpetrators being found guilty. Only 1% of reported prosecutions ended in acquittal.
Figure 78: Result of Cases Referred to Law Enforcement
0% 20% 40% 60% 80% 100%Other*
Acquitted
Declined to Prosecute
Convicted at Trial
Pled Guilty/No Contest
2010
2012
2014
65.9% 10.3%
55.6% 19.2%
56.5% 15.4%
22.7%
1.2%
16.4%
1.5%
7.2%
18.2% 9.0%
0.9%
PERCENT OF CASES*“Other” category was not included in the 2010 Report.
There are many reasons why an organization might decline to refer occupational fraud cases to law enforcement. In our past three Reports, the most common reasons for deciding not to refer cases have been: fear of bad pub-licity, internal punishment deemed sufficient, private settlement reached with the fraudster and criminal action deemed too costly to pursue. However, the top two reasons — fear of bad publicity and sufficient internal pun-ishment — have declined steadily in the past three Reports (from 43% to 35%, and 34% to 31%, respectively).
Figure 79: Reason(s) Case Not Referred to Law Enforcement
0% 10% 20% 30% 40% 50%2010
2012
2014
Perpetrator Disappeared
Civil Suit
Lack of Evidence
Other*
Too Costly
Private Settlement
Internal Discipline Sufficient
Fear of Bad Publicity
REAS
ON G
IVEN
FOR
NOT
PRO
SECU
TIN
G
PERCENT OF CASES*“Other” category was not included in 2010 Report.
34.7%
30.5%
21.3%
18.9%
13.1%
11.0%
4.6%
0.6%
38.3%
33.3%
20.5%
14.5%
11.7%
8.1%
3.3%
0.7%
42.9%
33.7%
28.6%
20.2%
13.1%
4.9%
0.6%

66 REPORT TO THE NATIONS ON OCCUPATIONAL FRAUD AND ABUSE
Civil SuitsFigure 80 demonstrates the percentage of cases in which a civil suit was filed against the fraudster. The data have remained consistent over our last three studies: less than one-fourth of victim organizations have filed suit against the perpetrators who defrauded them.
Figure 80: Cases Resulting in Civil Suits
0% 20% 40% 60% 80% 100%No Civil Suit
Civil Suit2010
2012
2014
CIVI
L SU
IT F
ILED
PERCENT OF CASES
75.9%24.1%
76.5%23.5%
77.8%22.2%
For those cases in which a civil suit was filed, we asked respondents to report on the results of the civil litigation. While many cases were still pending at the time of our study, the 72 cases for which results were provided are displayed in Figure 81. A little over half of the victims who filed a civil suit won a judgment in their favor, and another 31% settled with the defendant. Only 14% of the accused perpetrators obtained a favorable judgment.
Figure 81: Result of Civil Suits
0% 20% 40% 60% 80% 100%Other*
Judgment for Perpetrator
Settled
Judgment for Victim
2010
2012
2014
62.6% 20.9% 16.5%
51.4% 30.6% 13.9% 4.2%
49.4% 31.0% 14.9% 4.6%
PERCENT OF CASES*“Other” category was not included in the 2010 Report.
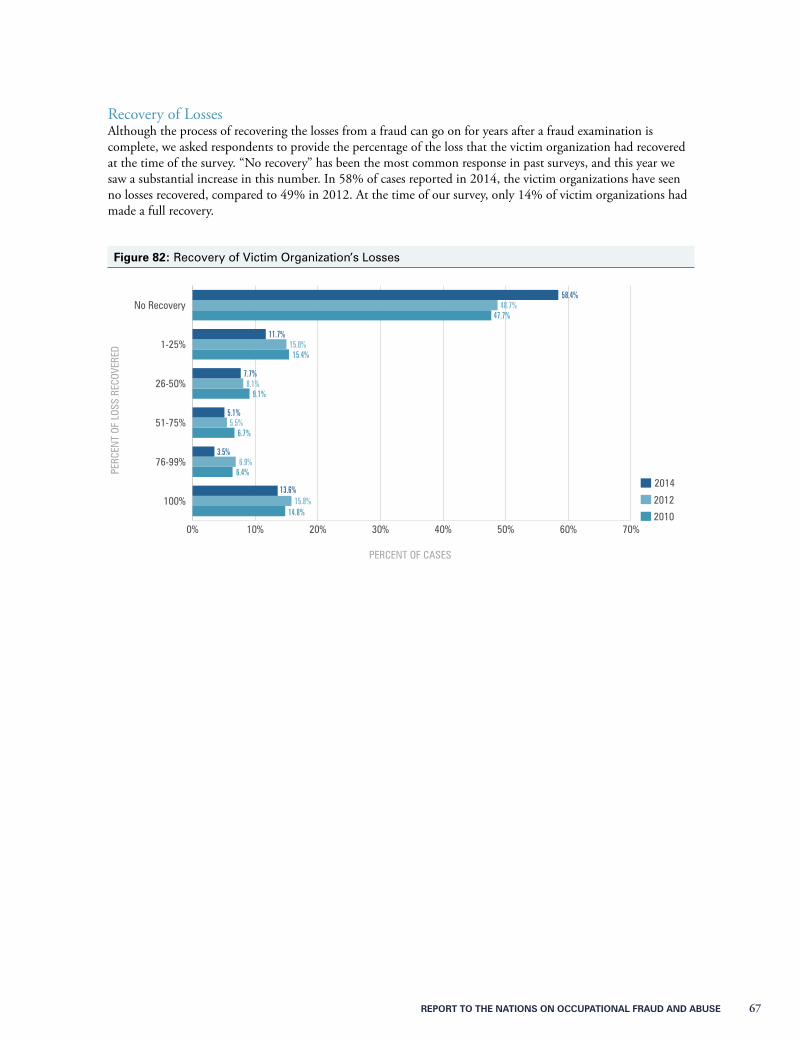
REPORT TO THE NATIONS ON OCCUPATIONAL FRAUD AND ABUSE 67
Recovery of LossesAlthough the process of recovering the losses from a fraud can go on for years after a fraud examination is complete, we asked respondents to provide the percentage of the loss that the victim organization had recovered at the time of the survey. “No recovery” has been the most common response in past surveys, and this year we saw a substantial increase in this number. In 58% of cases reported in 2014, the victim organizations have seen no losses recovered, compared to 49% in 2012. At the time of our survey, only 14% of victim organizations had made a full recovery.
Figure 82: Recovery of Victim Organization’s Losses
0% 10% 20% 30% 40% 50% 60% 70%2010
2012
2014
100%
76-99%
51-75%
26-50%
1-25%
No Recovery
PERC
ENT
OF L
OSS
RECO
VERE
D
PERCENT OF CASES
58.4%48.7%
47.7%
11.7%15.0%15.4%
7.7%8.1%
9.1%
5.1%5.5%
6.7%
3.5%6.9%
6.4%
13.6%15.8%
14.8%
68 REPORT TO THE NATIONS ON OCCUPATIONAL FRAUD AND ABUSE
Methodology
The 2014 Report to the Nations on Occupational Fraud and Abuse is based on the results of an online survey opened to 34,615 Certified Fraud Examiners (CFEs) from October 2013 to December 2013. As part of the survey, respondents were asked to provide a detailed narrative of the single largest fraud case they had inves-tigated. Additionally, for the first time in the Report’s history, we allowed respondents to submit information about a second case that they investigated; of the cases included in the Report, 68 were secondary cases. Each case submitted met the following four criteria:
1. The case must have involved occupational fraud (defined as internal fraud, or fraud committed by a person against the organization for which he or she works).
2. The investigation must have occurred between January 2012 and the time of survey participation.
3. The investigation must have been complete at the time of survey participation.
4. The CFE must have been reasonably sure the perpetrator(s) was (were) identified.
Respondents were then presented with 84 questions to answer regarding the particular details of the fraud case, including information about the perpetrator, the victim organization and the methods of fraud employed, as well as fraud trends in general. We received 1,713 total responses to the survey, 1,483 of which were usable for purposes of this Report. The data contained herein is based solely on the information provided in these 1,483 survey responses.
Analysis MethodologyIn calculating the percentages discussed throughout this Report, we used the total number of complete and rele-vant responses for the question(s) being analyzed. Specifically, we excluded any blank responses or instances where the participant indicated that he or she did not know the answer to a question. Consequently, the total number of cases included in each analysis varies.
Several survey questions allowed participants to select more than one answer. Therefore, the sum of percentages in many figures throughout the Report exceeds 100%.
All loss amounts discussed throughout the Report are calculated using median loss rather than mean, or aver-age, loss. Average losses were heavily skewed by a limited number of very high-dollar frauds. Using median loss provides a more conservative — and we believe more accurate — picture of the typical impact of occupational fraud schemes. Additionally, we excluded median loss calculations for categories for which there were fewer than 10 responses.
We received 1,713 total responses to our survey, 1,483 of which were usable for pur-poses of this Report. The data contained herein is based solely on the information provided in these 1,483 survey responses.
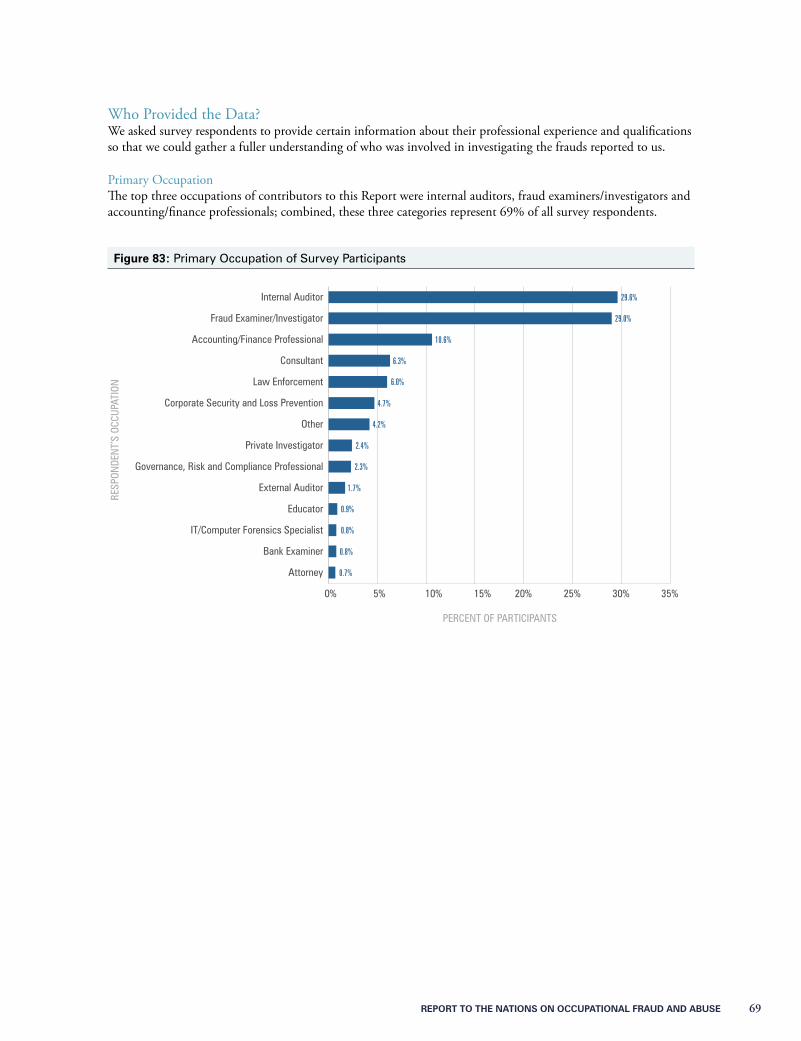
REPORT TO THE NATIONS ON OCCUPATIONAL FRAUD AND ABUSE 69
Who Provided the Data?We asked survey respondents to provide certain information about their professional experience and qualifications so that we could gather a fuller understanding of who was involved in investigating the frauds reported to us.
Primary OccupationThe top three occupations of contributors to this Report were internal auditors, fraud examiners/investigators and accounting/finance professionals; combined, these three categories represent 69% of all survey respondents.
Figure 83: Primary Occupation of Survey Participants
0% 5% 10% 15% 20% 25% 30% 35%
Attorney
Bank Examiner
IT/Computer Forensics Specialist
Educator
External Auditor
Governance, Risk and Compliance Professional
Private Investigator
Other
Corporate Security and Loss Prevention
Law Enforcement
Consultant
Accounting/Finance Professional
Fraud Examiner/Investigator
Internal Auditor
RESP
ONDE
NT’
S OC
CUPA
TION
PERCENT OF PARTICIPANTS
29.6%
29.0%
10.6%
6.3%
6.0%
4.7%
4.2%
2.4%
2.3%
1.7%
0.9%
0.8%
0.8%
0.7%
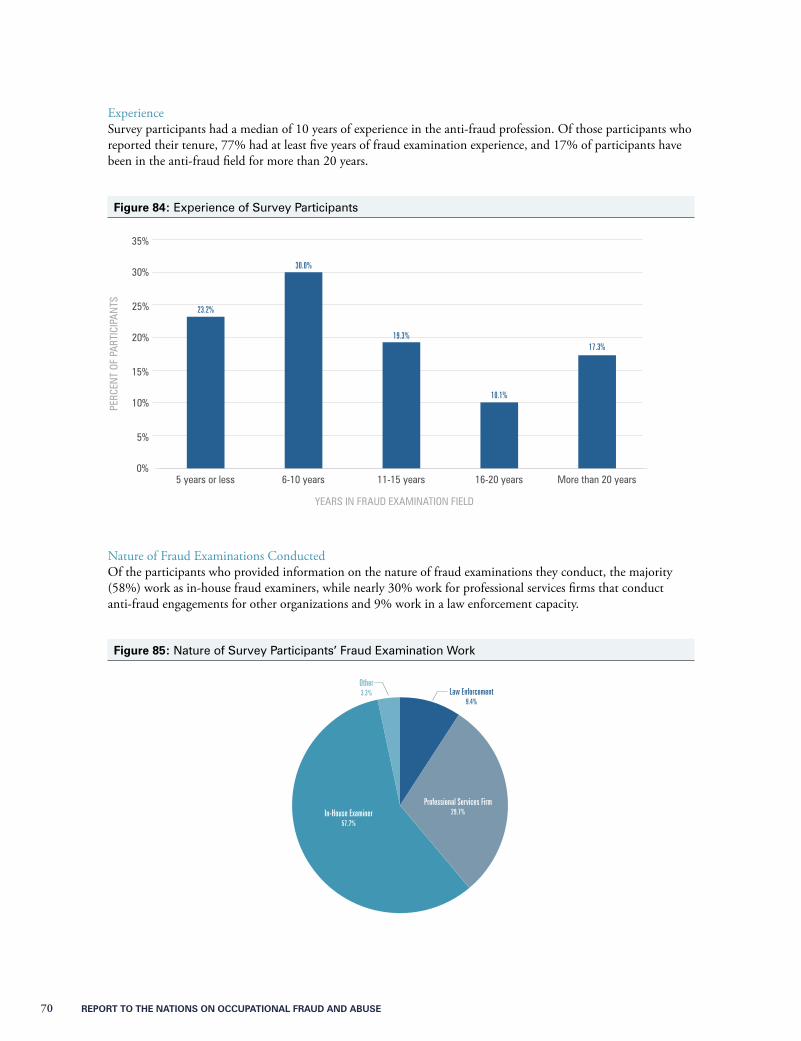
70 REPORT TO THE NATIONS ON OCCUPATIONAL FRAUD AND ABUSE
ExperienceSurvey participants had a median of 10 years of experience in the anti-fraud profession. Of those participants who reported their tenure, 77% had at least five years of fraud examination experience, and 17% of participants have been in the anti-fraud field for more than 20 years.
Figure 84: Experience of Survey Participants
0%
5%
10%
15%
20%
25%
30%
35%
More than 20 years16-20 years11-15 years6-10 years5 years or less
YEARS IN FRAUD EXAMINATION FIELD
PERC
ENT
OF P
ARTI
CIPA
NTS
23.2%
19.3%
10.1%
17.3%
30.0%
Nature of Fraud Examinations ConductedOf the participants who provided information on the nature of fraud examinations they conduct, the majority (58%) work as in-house fraud examiners, while nearly 30% work for professional services firms that conduct anti-fraud engagements for other organizations and 9% work in a law enforcement capacity.
Figure 85: Nature of Survey Participants’ Fraud Examination Work
6.6% 2.9%
Other 3.3%
In-House Examiner 57.7%
Professional Services Firm 29.7%
Law Enforcement9.4%
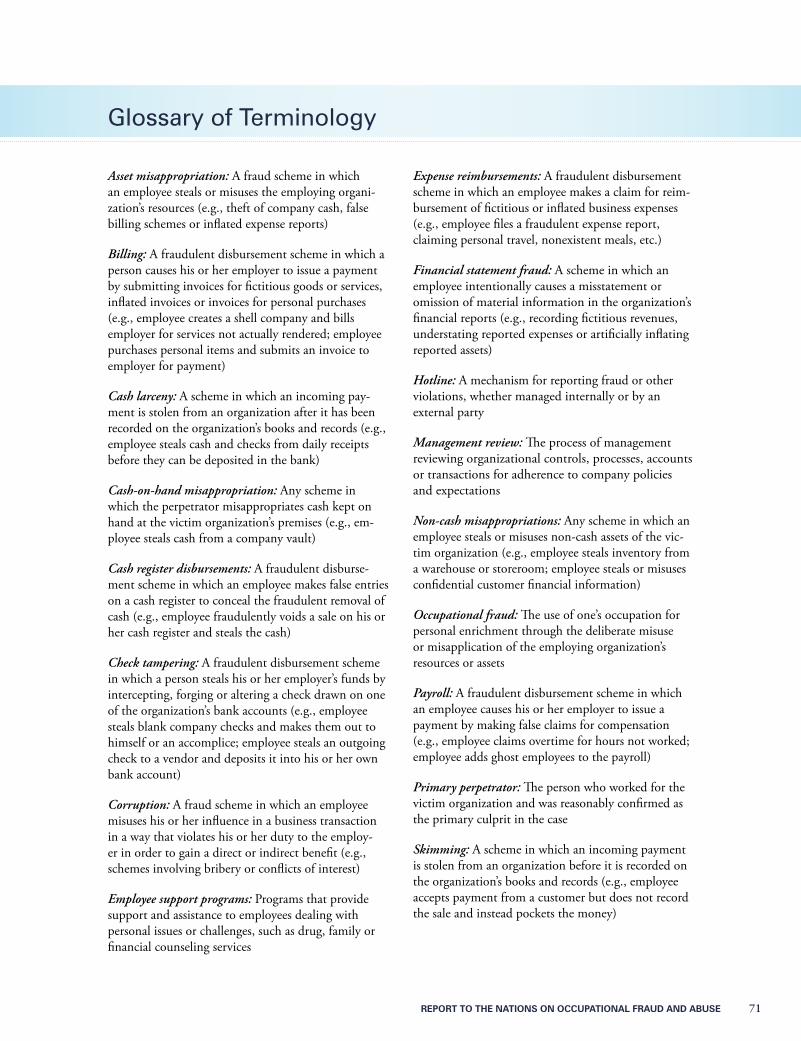
RepoRt to the NatioNs oN occupatioNal FRaud aNd abuse 71
Asset misappropriation: A fraud scheme in which an employee steals or misuses the employing organi-zation’s resources (e.g., theft of company cash, false billing schemes or inflated expense reports)
Billing: A fraudulent disbursement scheme in which a person causes his or her employer to issue a payment by submitting invoices for fictitious goods or services, inflated invoices or invoices for personal purchases (e.g., employee creates a shell company and bills employer for services not actually rendered; employee purchases personal items and submits an invoice to employer for payment)
Cash larceny: A scheme in which an incoming pay-ment is stolen from an organization after it has been recorded on the organization’s books and records (e.g., employee steals cash and checks from daily receipts before they can be deposited in the bank)
Cash-on-hand misappropriation: Any scheme in which the perpetrator misappropriates cash kept on hand at the victim organization’s premises (e.g., em-ployee steals cash from a company vault)
Cash register disbursements: A fraudulent disburse-ment scheme in which an employee makes false entries on a cash register to conceal the fraudulent removal of cash (e.g., employee fraudulently voids a sale on his or her cash register and steals the cash)
Check tampering: A fraudulent disbursement scheme in which a person steals his or her employer’s funds by intercepting, forging or altering a check drawn on one of the organization’s bank accounts (e.g., employee steals blank company checks and makes them out to himself or an accomplice; employee steals an outgoing check to a vendor and deposits it into his or her own bank account)
Corruption: A fraud scheme in which an employee misuses his or her influence in a business transaction in a way that violates his or her duty to the employ-er in order to gain a direct or indirect benefit (e.g., schemes involving bribery or conflicts of interest)
Employee support programs: Programs that provide support and assistance to employees dealing with personal issues or challenges, such as drug, family or financial counseling services
Expense reimbursements: A fraudulent disbursement scheme in which an employee makes a claim for reim-bursement of fictitious or inflated business expenses (e.g., employee files a fraudulent expense report, claiming personal travel, nonexistent meals, etc.)
Financial statement fraud: A scheme in which an employee intentionally causes a misstatement or omission of material information in the organization’s financial reports (e.g., recording fictitious revenues, understating reported expenses or artificially inflating reported assets)
Hotline: A mechanism for reporting fraud or other violations, whether managed internally or by an external party
Management review: The process of management reviewing organizational controls, processes, accounts or transactions for adherence to company policies and expectations
Non-cash misappropriations: Any scheme in which an employee steals or misuses non-cash assets of the vic-tim organization (e.g., employee steals inventory from a warehouse or storeroom; employee steals or misuses confidential customer financial information)
Occupational fraud: The use of one’s occupation for personal enrichment through the deliberate misuse or misapplication of the employing organization’s resources or assets
Payroll: A fraudulent disbursement scheme in which an employee causes his or her employer to issue a payment by making false claims for compensation (e.g., employee claims overtime for hours not worked; employee adds ghost employees to the payroll)
Primary perpetrator: The person who worked for the victim organization and was reasonably confirmed as the primary culprit in the case
Skimming: A scheme in which an incoming payment is stolen from an organization before it is recorded on the organization’s books and records (e.g., employee accepts payment from a customer but does not record the sale and instead pockets the money)
Glossary of Terminology
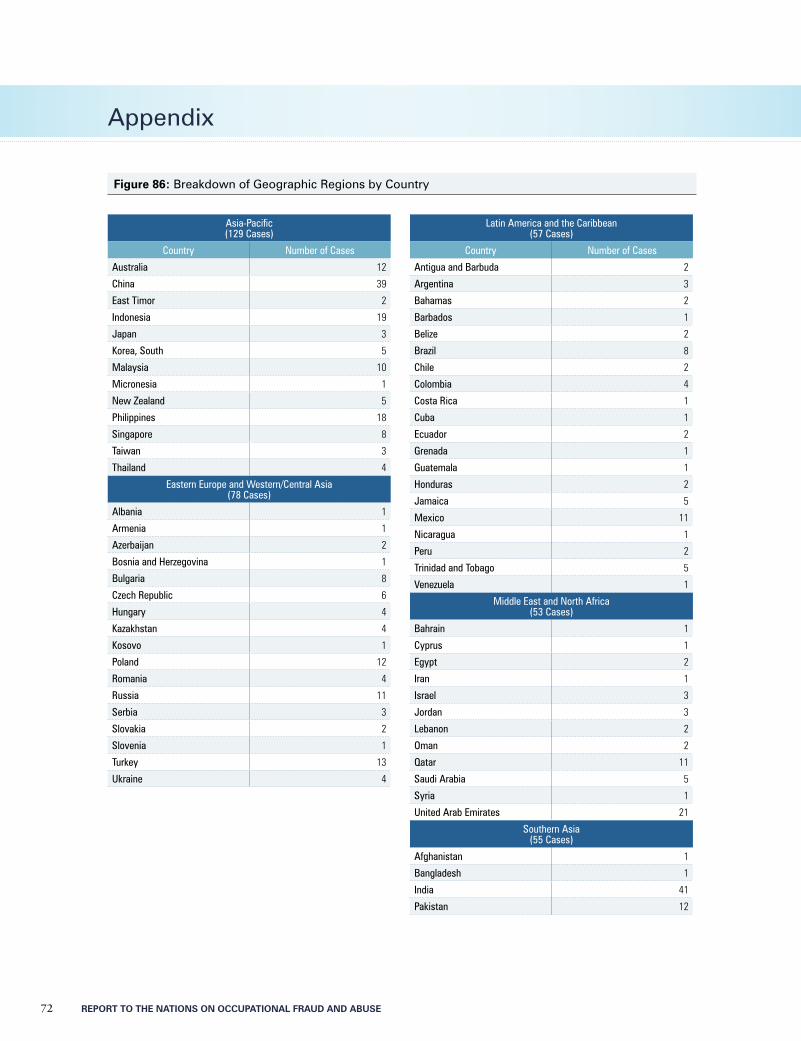
72 REPORT TO THE NATIONS ON OCCUPATIONAL FRAUD AND ABUSE
Appendix
Asia-Pacific(129 Cases)
Country Number of Cases
Australia 12
China 39
East Timor 2
Indonesia 19
Japan 3
korea, South 5
Malaysia 10
Micronesia 1
New Zealand 5
Philippines 18
Singapore 8
Taiwan 3
Thailand 4
Eastern Europe and Western/Central Asia(78 Cases)
Albania 1
Armenia 1
Azerbaijan 2
Bosnia and Herzegovina 1
Bulgaria 8
Czech Republic 6
Hungary 4
kazakhstan 4
kosovo 1
Poland 12
Romania 4
Russia 11
Serbia 3
Slovakia 2
Slovenia 1
Turkey 13
Ukraine 4
Latin America and the Caribbean(57 Cases)
Country Number of Cases
Antigua and Barbuda 2
Argentina 3
Bahamas 2
Barbados 1
Belize 2
Brazil 8
Chile 2
Colombia 4
Costa Rica 1
Cuba 1
Ecuador 2
Grenada 1
Guatemala 1
Honduras 2
Jamaica 5
Mexico 11
Nicaragua 1
Peru 2
Trinidad and Tobago 5
Venezuela 1
Middle East and North Africa(53 Cases)
Bahrain 1
Cyprus 1
Egypt 2
Iran 1
Israel 3
Jordan 3
Lebanon 2
Oman 2
Qatar 11
Saudi Arabia 5
Syria 1
United Arab Emirates 21
Southern Asia(55 Cases)
Afghanistan 1
Bangladesh 1
India 41
Pakistan 12
Figure 86: Breakdown of Geographic Regions by Country
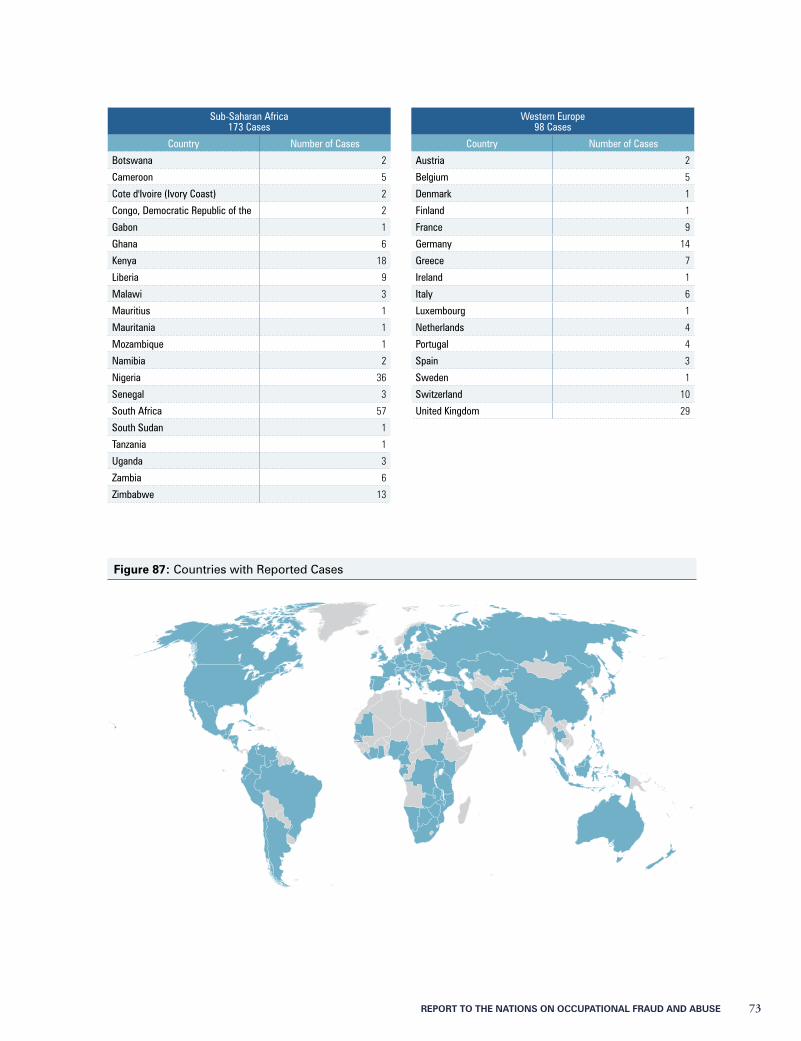
REPORT TO THE NATIONS ON OCCUPATIONAL FRAUD AND ABUSE 73
Sub-Saharan Africa173 Cases
Country Number of Cases
Botswana 2
Cameroon 5
Cote d'Ivoire (Ivory Coast) 2
Congo, Democratic Republic of the 2
Gabon 1
Ghana 6
kenya 18
Liberia 9
Malawi 3
Mauritius 1
Mauritania 1
Mozambique 1
Namibia 2
Nigeria 36
Senegal 3
South Africa 57
South Sudan 1
Tanzania 1
Uganda 3
Zambia 6
Zimbabwe 13
Western Europe98 Cases
Country Number of Cases
Austria 2
Belgium 5
Denmark 1
Finland 1
France 9
Germany 14
Greece 7
Ireland 1
Italy 6
Luxembourg 1
Netherlands 4
Portugal 4
Spain 3
Sweden 1
Switzerland 10
United kingdom 29
Figure 87: Countries with Reported Cases
74 REPORT TO THE NATIONS ON OCCUPATIONAL FRAUD AND ABUSE
Index of Figures
Age of PerpetratorAge of Perpetrator — Frequency .....................................................................................................................................................48Age of Perpetrator — Median Loss ..................................................................................................................................................48
Anti-Fraud ControlsFrequency of Anti-Fraud Controls ..................................................................................................................................................31Frequency of Anti-Fraud Controls by Region ........................................................................................................................... 33-37Frequency of Anti-Fraud Controls by Size of Victim Organization .................................................................................................32Median Duration of Fraud Based on Presence of Anti-Fraud Controls ............................................................................................38Median Loss Based on Presence of Anti-Fraud Controls ..................................................................................................................38Primary Internal Control Weakness Observed by CFE ....................................................................................................................39
Behavioral Red Flags of PerpetratorsBehavioral Red Flags Based on Gender ............................................................................................................................................62Behavioral Red Flags Based on Position ...........................................................................................................................................60Behavioral Red Flags Based on Scheme Type ...................................................................................................................................61Behavioral Red Flags Displayed by Perpetrators ...............................................................................................................................59HR-Related Red Flags .....................................................................................................................................................................63Non-Fraud-Related Misconduct ......................................................................................................................................................63
Case ResultsCases Referred to Law Enforcement ................................................................................................................................................64Cases Resulting in Civil Suits ..........................................................................................................................................................66Reason(s) Case Not Referred to Law Enforcement ..........................................................................................................................65Recovery of Victim Organization’s Losses ........................................................................................................................................67Result of Cases Referred to Law Enforcement .................................................................................................................................65Result of Civil Suits .........................................................................................................................................................................66
Criminal and Employment Background of PerpetratorCriminal Background of Perpetrator................................................................................................................................................58Employment Background of Perpetrator .........................................................................................................................................58
Demographics of Survey ParticipantsExperience of Survey Participants ....................................................................................................................................................70Nature of Fraud Examinations Conducted ......................................................................................................................................70Primary Occupation of Survey Participants .....................................................................................................................................69
Department of PerpetratorDepartment of Perpetrator — Frequency ........................................................................................................................................55Department of Perpetrator (Sorted by Median Loss) .......................................................................................................................56Frequency of Schemes Based on Perpetrator’s Department ..............................................................................................................57
Detection MethodDetection Method by Size of Victim Organization ..........................................................................................................................23Impact of Hotlines ..........................................................................................................................................................................22Initial Detection of Occupational Frauds ........................................................................................................................................19Median Loss and Median Duration by Detection Method ..............................................................................................................20Source of Tips .................................................................................................................................................................................21
Distribution of LossesDistribution of Dollar Losses ........................................................................................................................................................... 9
Education Level of PerpetratorEducation Level of Perpetrator — Median Loss ...............................................................................................................................54
REPORT TO THE NATIONS ON OCCUPATIONAL FRAUD AND ABUSE 75
Gender of PerpetratorFrequency of Fraud Schemes Based on Gender ................................................................................................................................51Gender of Perpetrator Based on Region ..........................................................................................................................................49Gender of Perpetrator — Frequency ................................................................................................................................................49Gender of Perpetrator — Median Loss ............................................................................................................................................50Position of Perpetrator Based on Gender .........................................................................................................................................50Position of Perpetrator — Median Loss Based on Gender................................................................................................................51
Geographical Region of Victim OrganizationBreakdown of Geographic Regions by Country ......................................................................................................................... 72-73Countries with Reported Cases .......................................................................................................................................................73Detection Method by Region ..........................................................................................................................................................23Geographical Location of Victim Organizations .............................................................................................................................. 7Frequency and Median Loss of Corruption Cases by Region ...........................................................................................................14
Industry of Victim OrganizationCorruption Cases by Industry .........................................................................................................................................................30Frequency of Schemes Based on Industry ........................................................................................................................................29Industry of Victim Organizations ....................................................................................................................................................27Industry of Victim Organizations (Sorted by Median Loss) .............................................................................................................28
Number of PerpetratorsNumber of Perpetrators — Frequency and Median Loss .................................................................................................................46Scheme Type Based on Number of Perpetrators ...............................................................................................................................47
Position of PerpetratorMedian Duration of Fraud Based on Position ..................................................................................................................................41Median Loss Based on Position of Perpetrator by Region ......................................................................................................... 43-45Position of Perpetrator Based on Region ..........................................................................................................................................42Position of Perpetrator — Frequency ..............................................................................................................................................40Position of Perpetrator — Median Loss ...........................................................................................................................................41
Scheme DurationFrequency and Median Loss Based on Duration of Fraud ...............................................................................................................16Median Duration of Fraud Based on Scheme Type ..........................................................................................................................17
Scheme TypeFrequency and Median Loss of Asset Misappropriation Sub-Schemes ..............................................................................................13Occupational Fraud and Abuse Classification System (Fraud Tree) ..................................................................................................11Occupational Frauds by Category — Frequency .............................................................................................................................12Occupational Frauds by Category — Median Loss ..........................................................................................................................12Overlap of Fraud Schemes ...............................................................................................................................................................15
Size of Victim OrganizationScheme Type by Size of Victim Organization ..................................................................................................................................26Size of Victim Organization — Frequency .....................................................................................................................................25Size of Victim Organization — Median Loss ...................................................................................................................................25
Tenure of PerpetratorTenure of Perpetrator — Frequency .................................................................................................................................................52Tenure of Perpetrator — Median Loss .............................................................................................................................................53
Type of Victim OrganizationType of Victim Organization — Frequency .....................................................................................................................................24Type of Victim Organization — Median Loss .................................................................................................................................24
76 REPORT TO THE NATIONS ON OCCUPATIONAL FRAUD AND ABUSE
Fraud Prevention Checklist
The most cost-effective way to limit fraud losses is to prevent fraud from occurring. This check-list is designed to help organizations test the effectiveness of their fraud prevention measures.
1. Is ongoing anti-fraud training provided to all employees of the organization?
❑ Do employees understand what constitutes fraud?
❑ Have the costs of fraud to the company and everyone in it — including lost profits, adverse publicity, job loss, and decreased morale and productivity — been made clear to employees?
❑ Do employees know where to seek advice when faced with uncertain ethical decisions, and do they believe that they can speak freely?
❑ Has a policy of zero-tolerance for fraud been communicated to employees through words and actions?
2. Is an effective fraud reporting mechanism in place?
❑ Have employees been taught how to communicate concerns about known or potential wrongdoing?
❑ Is there an anonymous reporting channel, such as a third-party hotline, available to employees?
❑ Do employees trust that they can report suspicious activity anonymously and/or confidentially and without fear of reprisal?
❑ Has it been made clear to employees that reports of suspicious activity will be promptly and thoroughly evaluated?
❑ Do reporting policies and mechanisms extend to vendors, customers and other outside parties?
3. To increase employees’ perception of detection, are the following proactive measures taken and publicized to employees?
❑ Is possible fraudulent conduct aggressively sought out, rather than dealt with passively?
❑ Does the organization send the message that it actively seeks out fraudulent conduct through fraud assessment questioning by auditors?
❑ Are surprise fraud audits performed in addition to regularly scheduled audits?
❑ Is continuous auditing software used to detect fraud and, if so, has the use of such software been made known throughout the organization?
REPORT TO THE NATIONS ON OCCUPATIONAL FRAUD AND ABUSE 77
4. Is the management climate/tone at the top one of honesty and integrity?
❑ Are employees surveyed to determine the extent to which they believe management acts with honesty and integrity?
❑ Are performance goals realistic?
❑ Have fraud prevention goals been incorporated into the performance measures against which managers are evaluated and that are used to determine performance-related compensation?
❑ Has the organization established, implemented and tested a process for oversight of fraud risks by the board of directors or others charged with governance (e.g., the audit committee)?
5. Are fraud risk assessments performed to proactively identify and mitigate the company’s vulnerabilities to internal and external fraud?
6. Are strong anti-fraud controls in place and operating effectively, including the following?
❑ Proper separation of duties
❑ Use of authorizations
❑ Physical safeguards
❑ Job rotations
❑ Mandatory vacations
7. Does the internal audit department, if one exists, have adequate resources and authority to operate effectively and without undue influence from senior management?
8. Does the hiring policy include the following (where permitted by law)?
❑ Past employment verification
❑ Criminal and civil background checks
❑ Credit checks
❑ Drug screening
❑ Education verification
❑ References checks
9. Are employee support programs in place to assist employees struggling with addiction, mental/ emotional health, family or financial problems?
10. Is an open-door policy in place that allows employees to speak freely about pressures, providing management the opportunity to alleviate such pressures before they become acute?
11. Are anonymous surveys conducted to assess employee morale?
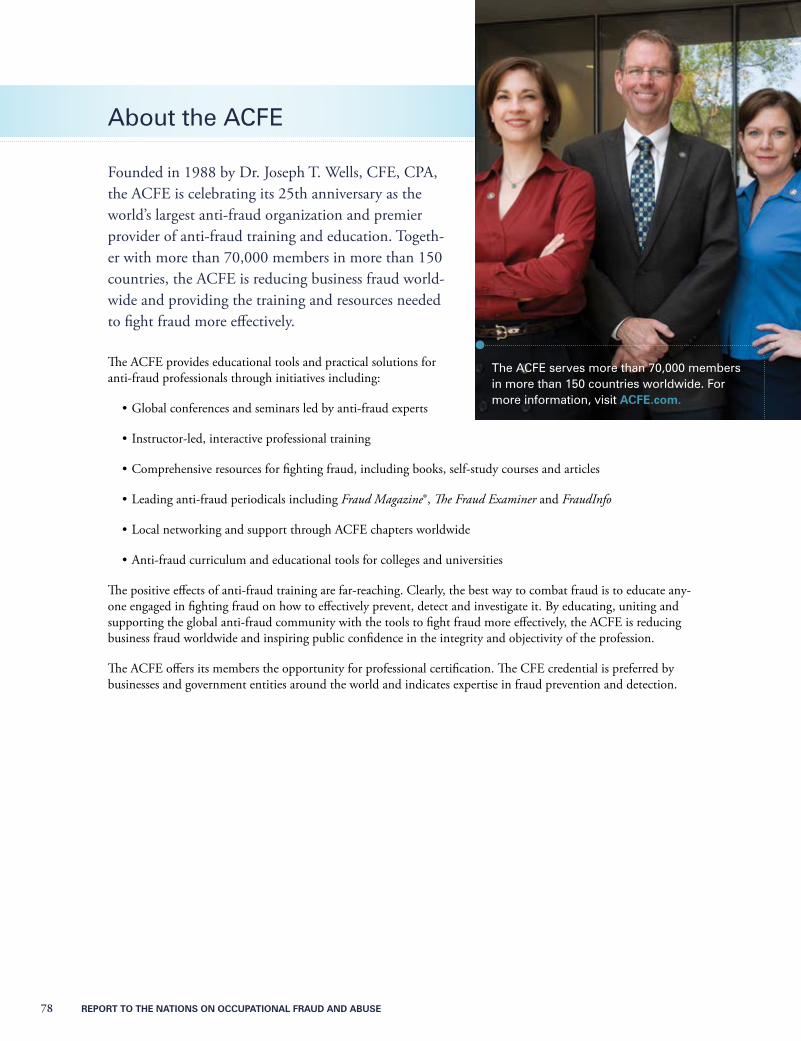
78 REPORT TO THE NATIONS ON OCCUPATIONAL FRAUD AND ABUSE
About the ACFE
Founded in 1988 by Dr. Joseph T. Wells, CFE, CPA, the ACFE is celebrating its 25th anniversary as the world’s largest anti-fraud organization and premier provider of anti-fraud training and education. Togeth-er with more than 70,000 members in more than 150 countries, the ACFE is reducing business fraud world-wide and providing the training and resources needed to fight fraud more effectively.
The ACFE provides educational tools and practical solutions for anti-fraud professionals through initiatives including:
•Global conferences and seminars led by anti-fraud experts
•Instructor-led, interactive professional training
•Comprehensive resources for fighting fraud, including books, self-study courses and articles
•Leading anti-fraud periodicals including Fraud Magazine®, The Fraud Examiner and FraudInfo
•Local networking and support through ACFE chapters worldwide
•Anti-fraud curriculum and educational tools for colleges and universities
The positive effects of anti-fraud training are far-reaching. Clearly, the best way to combat fraud is to educate any-one engaged in fighting fraud on how to effectively prevent, detect and investigate it. By educating, uniting and supporting the global anti-fraud community with the tools to fight fraud more effectively, the ACFE is reducing business fraud worldwide and inspiring public confidence in the integrity and objectivity of the profession.
The ACFE offers its members the opportunity for professional certification. The CFE credential is preferred by businesses and government entities around the world and indicates expertise in fraud prevention and detection.
The ACFE serves more than 70,000 members in more than 150 countries worldwide. For more information, visit ACFE.com.
REPORT TO THE NATIONS ON OCCUPATIONAL FRAUD AND ABUSE 79
MembershipImmediate access to world-class anti-fraud knowledge and tools is a necessity in the fight against fraud. Members of the ACFE include accountants, internal auditors, fraud investigators, law enforcement officers, lawyers, busi-ness leaders, risk/compliance professionals and educators, all of whom have access to expert training, educational tools and resources.
More than 70,000 members from all over the world have come to depend on the ACFE for solutions to the chal-lenges they face in their professions. Whether their career is focused exclusively on preventing and detecting fraud-ulent activities or they just want to learn more about fraud, the ACFE provides the essential tools and resources necessary for anti-fraud professionals to accomplish their objectives.
To learn more, visit ACFE.com or call (800) 245-3321 / +1 (512) 478-9000.
Certified Fraud ExaminersCertified Fraud Examiners (CFEs) are anti-fraud experts who have demonstrated knowledge in four critical areas: Fraudulent Financial Transactions, Fraud Investigation, Legal Elements of Fraud, and Fraud Prevention and Deterrence. In support of CFEs and the CFE credential, the ACFE:
•Provides bona fide qualifications for CFEs through administration of the CFE Examination
•Requires CFEs to adhere to a strict code of professional conduct and ethics
•Serves as the global representative for CFEs to business, government and academic institutions
•Provides leadership to inspire public confidence in the integrity, objectivity and professionalism of CFEs
GLOBAL HEADqUARTERS • THE GREGOR BUILDING716 West Ave • Austin, TX 78701-2727 • USAPhone: (800) 245-3321 / +1 (512) 478-9000Web: ACFE.com • [email protected]
©2014 Association of Certified Fraud Examiners, Inc.
“ACFE,” “CFE,” “Certified Fraud Examiner,” “CFE Exam Prep Course,” “Fraud Magazine,” “Association of Certified Fraud Examiners,” “EthicsLine,” the ACFE Seal, the ACFE Logo and related trademarks, names and logos are the property of the Association of Certified Fraud Examiners, Inc., and are registered and/or used in the U.S. and countries around the world.