report to the coastal erosion abatement commission
TRANSCRIPT

W&M ScholarWorks W&M ScholarWorks
Reports
9-1981
Report to the Coastal Erosion Abatement Commission Report to the Coastal Erosion Abatement Commission
Commonwealth of Virginia concerning the Inventory of Sand Commonwealth of Virginia concerning the Inventory of Sand
Supplies in the Southern Chesapeake Bay Supplies in the Southern Chesapeake Bay
Robert J. Byrne Virginia Institute of Marine Science
Carl H. Hobbs III Virginia Institute of Marine Science
Robert A. Gammish Virginia Institute of Marine Science
Follow this and additional works at: https://scholarworks.wm.edu/reports
Part of the Geomorphology Commons
Recommended Citation Recommended Citation Byrne, R. J., Hobbs, C. H., & Gammish, R. A. (1981) Report to the Coastal Erosion Abatement Commission Commonwealth of Virginia concerning the Inventory of Sand Supplies in the Southern Chesapeake Bay. Virginia Institute of Marine Science, William & Mary. https://scholarworks.wm.edu/reports/2300
This Report is brought to you for free and open access by W&M ScholarWorks. It has been accepted for inclusion in Reports by an authorized administrator of W&M ScholarWorks. For more information, please contact [email protected].

W-H\11S ARCl=UVES
Virginia Institute of Marine Science
School of Marine Science
College of William and Mary
Report to the
Coastal Erosion Abatement Commission
Commonwealth of Virginia
concerning the
Inventory of Sand Supplies
in the Southern Chesapeake Bay
prepared by
Robert J. Byrne
Carl H. Hobbs, III
Robert A. Gammisch
September, 1981
\f \ 'flf'1S
ti'\ C)3<) 13'6' \'ii\

I. I I
FOREWARD
In its report to the Governor and the General Assembly of
Virginia (Senate Document No. 4, Commonwealth of Virginia, 1979), the
Coastal Erosion Abatement Commission found that "there is a need to
locate sources of sand supplies for rebuilding public beaches.
Certain bottom areas in the lower Chesapeake Bay should be studied as
possible sources of sand supply for public beaches." And toward that
end, the Commission recommended that "The School of Marine Science,
Virginia Institute of Marine Science, College of William and Mary,
study and analyze possible sources of sand supply in the lower
Chesapeake Bay and vicinity for rebuilding public beaches. There
shall be appropriated _from the General Fund the sum of $136,600 for
the first year of the 1980-1982 Biennium and $127,000 for the second
year of the Biennium for such purpose."
The Governor and the members of the General Assembly concurred
with the Commission's recommendations and made the appropriation.
This report describes the investigations undertaken during the
first year of the appropriation, July 1980 through June 1981.
1
INTRODUCTION
In the section of its report that was concerned with the Analysis
of the Sand Resources in Chesapeake Bay, the Commission amplified its
recommendation for the funding and the Virginia Institute of Marine
Science for studies
to·assess the extent and quality of the sands for beach nourishment within the inner approaches to Hampton Roads which would include the entrance to Lynnhaven Inlet, Willoughby Bank, Horseshoe Shoal fronting Hampton, Hampton Flats .and other areas in the environs deemed appropriate. This study, to be completed in a period of three to f,our years, would include:
a. Determination of the extent and quality of sands for beach nourishment purposes in the aforementioned areas;
b. Study of the most ecqnomical means of recovery and transportation of potential sands to the target areas; and
c. Assessment of the environmental risk of extraction to the associated marine ecosystem.
The Commission's recommendations, which became a charge to the
Institute, stemmed from the following reasoning, also from Senate
Document No. 4.
The public beaches at Virginia Beach, Norfolk and Hampton rely upon beach nourishment to maintain their recreational capability and to provide a buffering beach width as protection for the fastland and shor.eside facilities •••• In all cases, locating suitable and economical marine sand sources which can be extracted at acceptable environmental risk is a serious problem. Implementation of the Corps of Engineers plans at Virginia Beach would require initial sand volume of 2.5 million cubic yards. If nourishment is the recommended strategy at East Ocean View and Willoughby Spit in Norfolk, about 2.5 million cubic yards will be required. Combined annual maintenance requirements would be about 250,000 cubic yards.
Studies of the. Corps of Engineers (1972) disclosed the existence of a very promising deposit in the Thimble
2

Shoals Channel area, estimated to be about 12 to 19 million cubic yards of coarse sand and g·ravel. In 197 4, about 452,000 cubic yards of material were stockpiled at Fort Story for later use. The extraction was part of an enlargement of the Thimble Shoals navigation channel. While it is encouraging to have such a deposit available, the extraction is only economical if very large volumes are dredged. Consequently, a large storage area would be required. The Corps of Engineers study included reconnaissance work in the zone offshore of oceanfront Virginia Beach. Materials comparable to the Thimble Shoals deposit were not found.
With the exception of about 20,000 cubic yards of sand placed from an upland site in 1979 just west of the Little Creek jetties, all of the prior nourishment sand placed on the East Ocean View-Willoughby Spit area in Norfolk has been derived from dredging operations in the Little Creek entrance and forebay area. In 1975, a channel enlargement was made but the material (about 800,000 cubic yards) was placed o~ the beaches of the U.S. Navy Amphibious Base at Little Creek. If the Corps of Engineers study, to be completed in 1982, justifies a nourishment program, approximately 2.5 million cubic yards of sand will be needed. Even without the federal project, the City of Norfolk needs to maintain a sand supply for the East Little Creek-Willoughby Spit area. While sand bypassing from the updrift side of Little Creek remains a possibility, the determination of the feasibility awaits the completion of the sand budget analysis by the Corps of Engineers.
Alternate sources must be evaluated. Willoughby Bank is a source worthy of investigatio~. During the construction of the second Hampton Roads tunnel, a borrow area on Willoughby Bank adjacent to Fort W.ool was utilized to provide foundation sand for the tunnel tube and surcharge for a tunnel island. Subsequent to that, the surcharge material was successfully used as beach nourishment sands at Buckroe Beach in Hampton.
Given the need for beach nourishment sands for the public beaches of Virginia Beach, Norfolk and Hampton, additional investigations of the extractable subaqueous sand resources are required. These investigations would augment the earlier studies by the Corps of Engineers east of the Chesapeake Bay Bridge-Tunnel by extending the assessment to the inner approaches to Hampton Roads and those areas fronting Hampton and Lynnhaven Inlet.
To these ends in July 1980, the Virginia Institute of Marine
Science (VIMS) of the College of William and Mary commenced an
3

inventory to delineate and characterize offshore sources for sand that
might be used to nourish the public beaches that rim the southern
Chesapeake Bay. The general area of the Bay which was studied is
bounded by the shoreline, the Hampton Roads Bridge-Tunnel and a line
beginning at the Northend or Factory Point, or the mouth of the Bank
River in Hampton and running approximately southeast to a point just
north of Cape Henry and the south to the shoreline (Figure 1).
Particular attention was paid to the Thimble Shoals-Horseshoe area,
Thimble Shoals Channel, the tail of the Horseshoe, Willoughby Banks,
Crumps Bank, Little Creek, Lynnhaven, and the Cape Henry nearshore
area. Most of these are shoal areas with geomorphology which suggests
that they are potential sand sources.
METHODS
The survey was conducted in two pha:3es. Phase one was a joint
study with the Norfolk District of the U.S. Army Corps of Engineers.
This project included taking 45 short (20-foot) vibratory cores and
using a 3.5 kHz sub-bottom profiling unit to delineate structures and
bedding in the sub-bottom sediment between core sites. The Norfolk
District provided a self-propelled crane barge, the Elizabeth, with
crew, marine geologist, and a project manager to coordinate the two
agencies. VIMS provided the vibracoring unit, supplies, the seismic
reflection unit, navigation equipment, .technicians, and a marine
scientist.
4
Subsurface samples were recovered using th~ vibracoring device
operated from the crane barge Elizabeth. The u~it utilizes a steel • ~i
casing with a 3 1/2 inch (8.9 cm) diameter clear plastic liner. Once
on the bottom, the unit is free standing and penetrates the sediment
using the energy of a vibrating, pneumatic power-head. Penetration
rate and depth are recorded on a strip chart. Once penetration is
completed, the unit is retrieved and returned to the barge where the
plastic liner is removed. Then the core tubes are cut into short
(5-foot) lengths, capped, sealed, labeled, and returned to VIMS. In
the laboratory, the core sections were cut open, described, logged,
and sampled. Sediments were classified according to the Unified Soils
Classification System and desc.ribed according to ·the inspector's
visual interpretation of Burmisters Method of Material Proportions.
Composite samples of all recovered cores were analyzed for grain size
distribution and beach-fill suitability.
The Norfolk District's report, "Sub-surface Investigation for
Beach Nourishment," was published in November 1980. In addition to a
discussion similar to the one in this report, it contains core logs
and grain-size distribution curves for the cores taken in the joint
portion of first phase of the project.
Phase two of the project was a more detailed study of areas
indicated as possible sand sources from data analyzed from Phase one.
During this phase, 28 additional cores were taken utilizing the
vibracore unit in its 40-foot mode.
5
During this phase, the vibracore unit was operated from a crane
barge owned and operated by Immel's Marine of Gwynn's Island,
Virginia. The long cores of the second phase were handled, logged,
and sampled the. same as in the first phase of the study, except that
there was no participation by the Corps of Engineers. Throughout the
study, core site location was documented with horizontal sextant
angles and Loran C navigation.
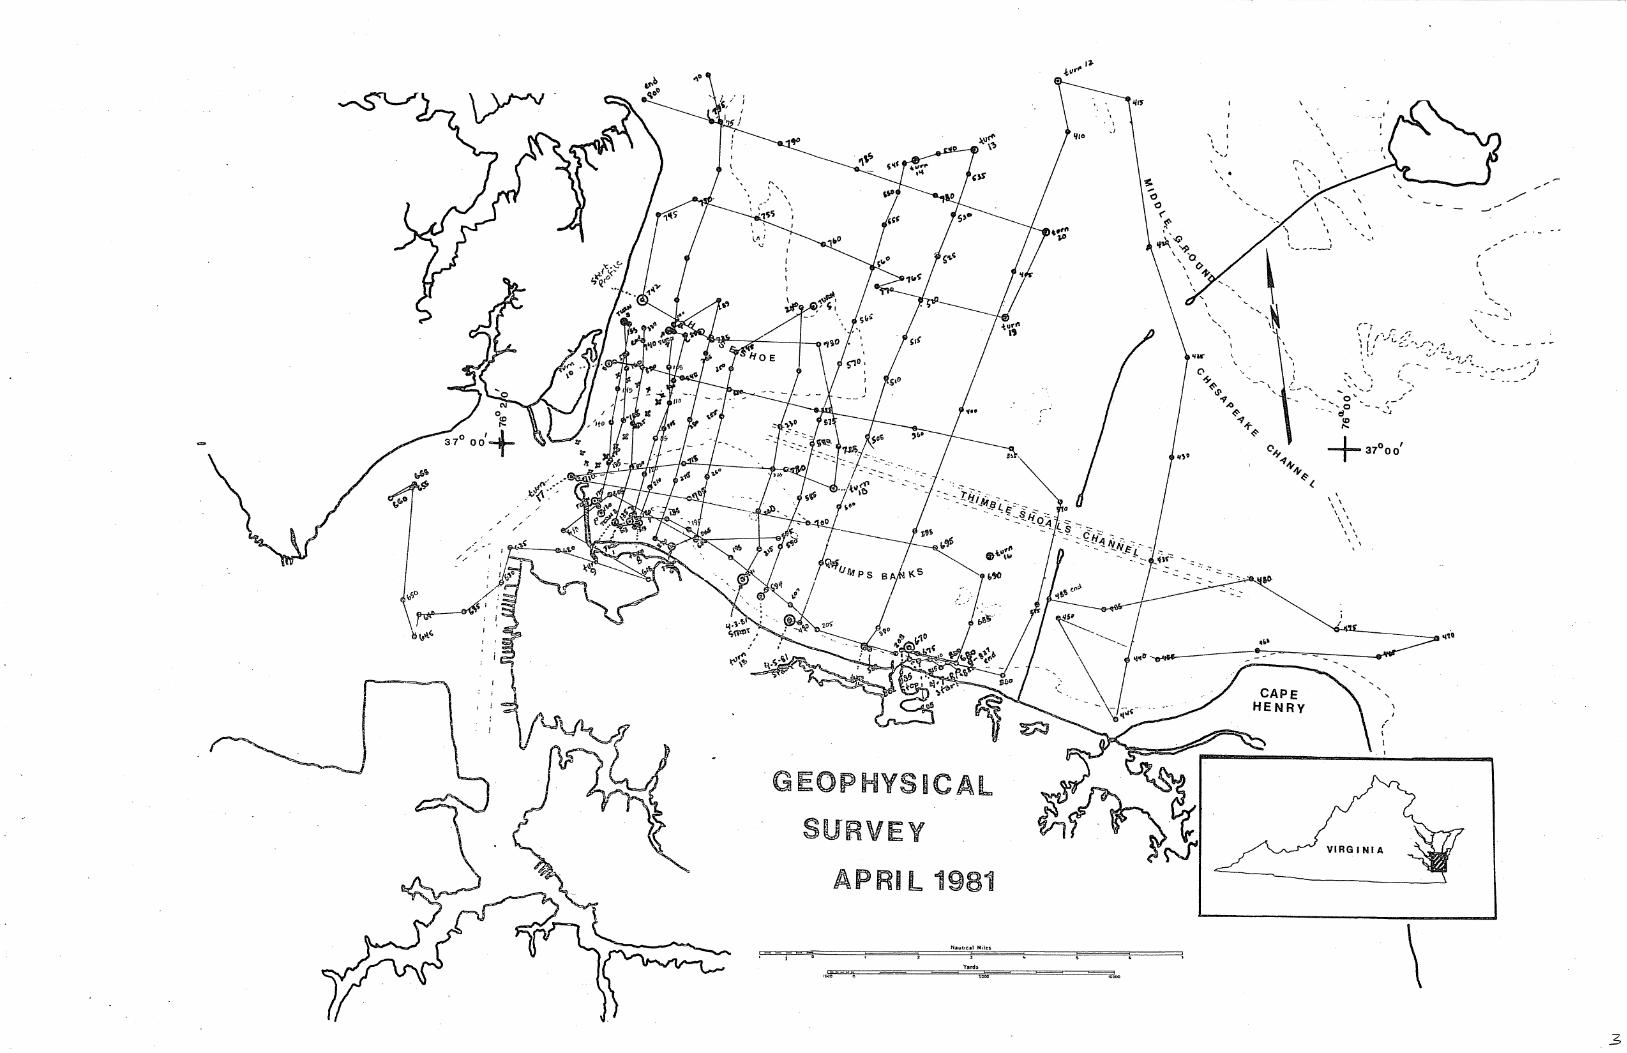
In addition to the 3.5 kHz sub-bottom profiles recorded while
steaming from one core location to the next, an independent seismic
survey was conducted in April 1981. This study was subcontracted to
Ocean Seismic Survey of Norwood, New Jersey, and consisted of 120
nautical miles of track lines. The survey was conducted aboard the
VIMS research vessel Captain John Smith and utilized; a 3.5 kHz O.R.E.
sub-bottom unit, a 100 joule EG&G "Uni-Boom" filtered for 1.5 kHz, a
100 kHz Kline side~scan sonar unit, and a 200 kHz Raytheon recording
fathometer to collect a full spectrum of bottom and sub-bottom data.
All data were automatically recorded on separate paper strip charts.
Navigation coordinates were controlled by a Loran C microprocessor
system combined with a X-Y plotter which enabled exact fix marks for
final interpretation and reduction of the data.
Core locations and the seismic track lines are shown in Figures 2
and 3.
6
RESULTS
Within the Thimble Shoals-Horseshoe region there are two areas
which contain sand suitable for use. One site is located near Thimble
Shoals Light and has approximately 20 million cubic yards of material
suitable for beach nourishment. The second site, adjacent to Buckroe
Beach and Old Point Comfort, contains approximately 14 million cubic
yards of sand; however, much of this material lies within the United
States Navy's restricted sector near Old Point Comfort. These
estimates of volume are conservative, as the calculations primarily
were based upon seismic-reflection data which need confirmation with
additional cores. Further work could confirm volumes greater than 90
million cubic yards within the Thimble Shoals-Horseshoe region.
Lynnhaven Inlet and the embayment directly inshore of the Route
60 bridge contain as much as 1.5 million cubic yards of sand.
However, the confines of the harbor prevented successful seismic
profiling, leaving some question concerning the continuity of the. sand
horizon.
Cores from shallow water near Cape Henry indicate a long, narrow
horizon of sand estimated to contain 6.5 million cubic yards of
suitable material, further exploration could yield estimates of as
much as 15 million cubic yards.
The east end of Thimble Shoals Channel was surveyed by the
Coastal Engineering Research Center (CERC) of the Corps of Engineers,
1972 (Meisburger, 1972). ·cores and seismic profiling delineated a
7
sand-horizon with a volume of 18.4 million cub+c yards. This region
has not been explored in the present study. However, it will be
includ~d during the second year as a site for additional research to
determine its suitability as a source of sediment for beach
nourishment. Meisburger's description of the sand body is as follows:
The most promising deposit crops out in Thimble Shoals Channel and along a reentrant in the south flank of Tail of the Horseshoe. This deposit is a coarse brown to reddish brown sand and gravelly sand. Data suggest that the deposit extends to and through the Tail of the Hosesshoe Shoal to near the south wall of Chesapeake Channel where it decreases to a thin layer ••• South of the Thimble Shoals outcrop area, the coarse sand body appears to extend under Lynnhaven Roads, but is deeply buried under a silt and silty clay layer ••• About 3,500,000 square yards of material is exposed, and the volume available in this area is calculated to be 11.9 x 10⁶ cubic yards. In addition, about 7 ~5 x 10⁶ cubic yards are estimated to be available in the area bordering the exposure with a removal of no more than 5 feet of overburden.
In terms of mechanical stability (for use on Virginia Beach), the Thimble Shoals material is considered good. Most of the sand grains are quartz which is resistant to mechanical and chemical degradation. Some gravel particles are composed of granitic rock which is partly decomposed. These fragments constitute only a minor fraction of the sediment.
Layers and lenses of well-sorted, clean sand closely matching the beach sand occur in the Thimble Shoals deposit. However, the split cores showed that / these layers are generally bedded with interspaced coarse sand mixed with gravel and occasional thin clay partings. The material finer than the native sand will be removed from the beach soon after placement, and the coarser particles will tend to remain.
In the Willoughby Banks region, four million cubic yards of
suitable sand has been located near the flanks of the natural Thimble
Shoals channel. Seismic reflection data indicate the volume could be
8

as great as 15 million cubic yards; however, more cores are needed to
determine the total volume of material suitable for beach nourishment.
The Crumps Bank region has little suitable sand with the exception of
two small sites adjacent to the beach at Little Creek Amphibious Base.
One site contains approximately two million cubic yards of material.
This sand may be unusable because of its close proximity to the
existing beach. The dredging of an area near the shore is usually
inadvisable as the artificial removal of sand so close to the beach
may accelerate the erosion of the beach. The second site is to the
east near the Chesapeake Bay Bridge...,.Tunnel with a volume of one
. million cubic yards.
This information is summarized in Figure 4 which depicts the
information at three levels of confidence. The greatest confidence is
attached to the areas identified as "suitable sand." In these areas,
both cores and seismic data confirm the presence of sandy sediments
which are physically suitable for use on beaches. These might be
considered the proven sand reserves. The areas of "possible" sand are
areas which, on the seismic records, are continuous with the suitable
sands but which have not been verified by coring. Finally, the areas
to be explored are areas which appear likely to be sand source, but
for which only the most tenuous evidence presently exists.
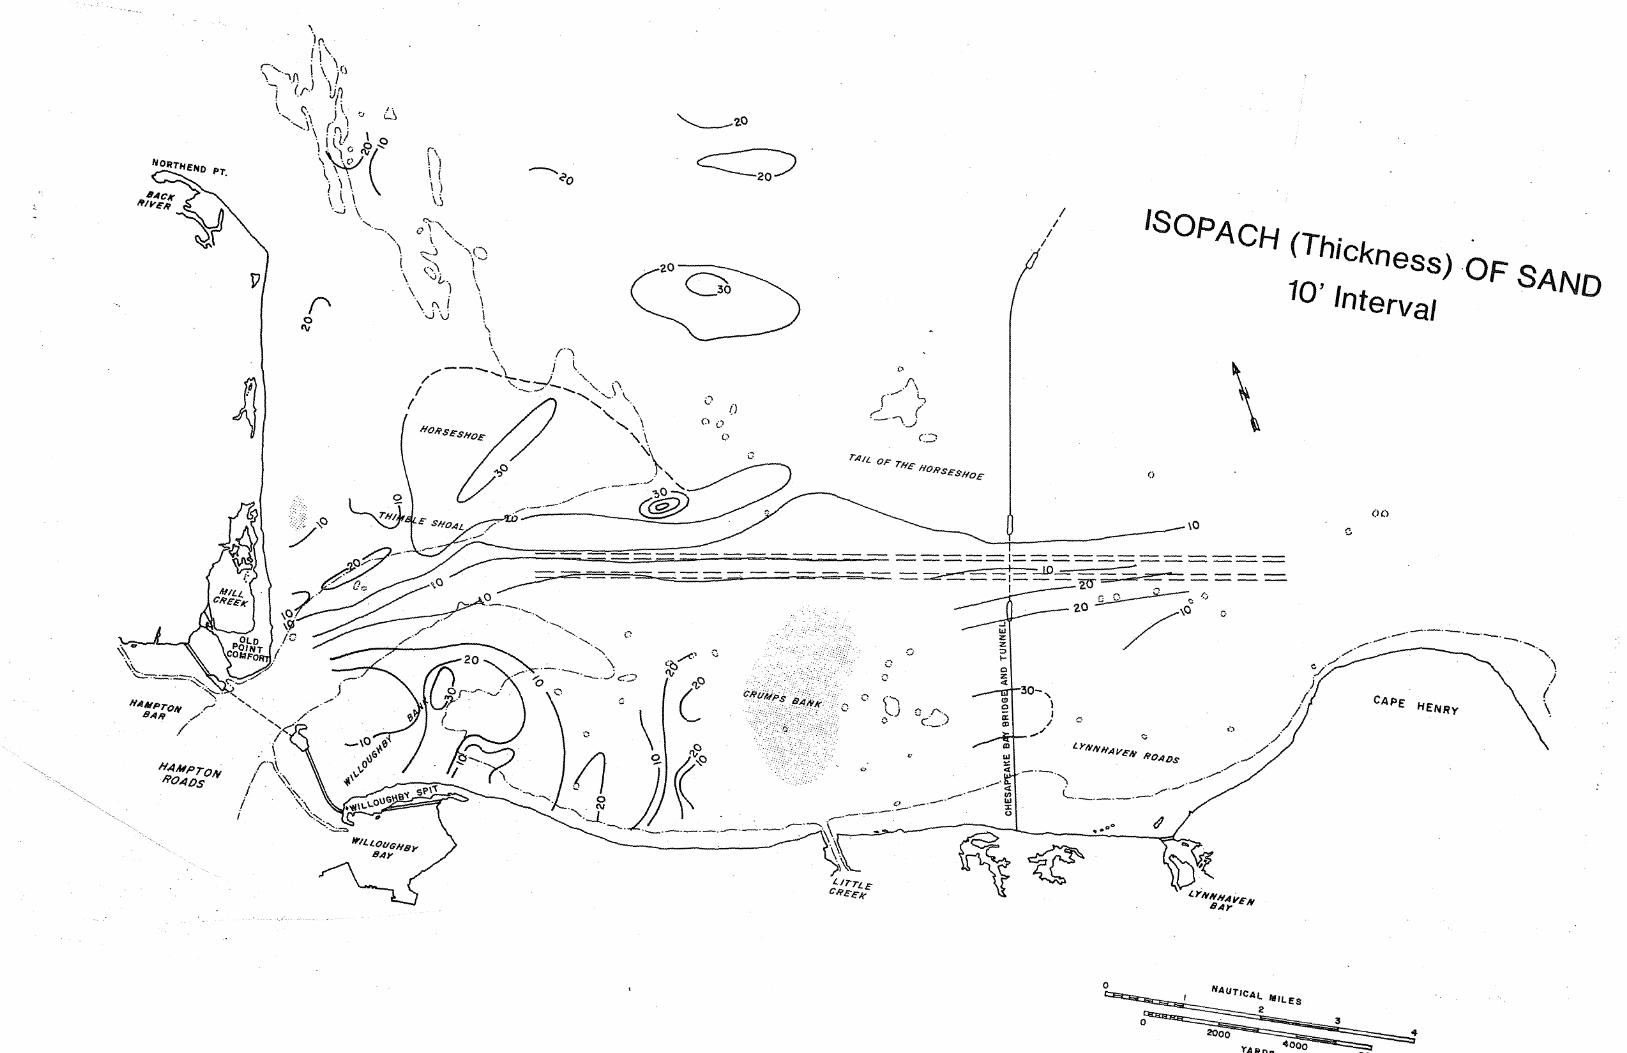
Figures 5 and 6 depict the estimated thickness of the layers of
potentially usable sand as well as the approximate depth from the
water surface to the bottom of those strata. This information will be
9

helpful in determining the best methods to use 'for excavation and the
probable costs thereof.
Although not due until later in the study, Figures 7 and 8
present information bearing on the environmental status of the bottom.
This information is important as the ultimate selection of sites for
extracting sand will, in part, be predicated upon the potential
magnitude of environmental modification caused by the operation.
Figure 7 is preliminary data on the distribution of the general
·benthic community and Figure 8 refers specifically to the distribution
of hard clams.
DISCUSS IOU
The characteristics and sediment of each area differ and must be
considered separately as to both the suitability of the material for
beach nourishment and generally accessibility. One of the
determinants for suitability for use as beach nourishment is the
similarity of the material from the borrow site to the native beach
material. In general, the closer the mean grain sizes and sorting
values (standard deviations), the more suitable the material.
Slightly coarser and better sorted materials are preferable to finer
or less well sorted sediments. There are a number of methods of
calculating a "suitability index" or "overfill ratio". These
calculations provide information that can be used as a guide in
augmenting and verifying the judgements made by professionals and
based upo~ their training and experience. The closer the overfill
10
ratio to unity, the better the suitability of t;he borrow material.
The overfill ratio is an estimate of the number of cubic yards of
borrow material that must be placed on the beach for one cubic yard to
remain after the system has had a chance to be subjected to wave
action and to approach equilibrium. Hence, an overfill ratio of 5:1
suggests that for each 5 cubic yards placed on the beach, 4 wash back
into deeper water whereas a ratio of 1:1 implies only a minimum of
adjustment. The method of calculating the overfill ratio is the
so-called "Dean Hethod" (Dean, 1974; Hobson, 1977).
Personn2l fr.om the Norfolk District of the Corps of Engineers
sampled the beaches of Willoughby Spit and Ocean View in order to
characterize the native sediment in August and November 1978.
Scientists from VI~S sampled the Buckroe Beach area of Hampton in June
1981. The sedi~ent from Buckroe Beach is finer (smaller grained) than
that found on Willoughby Spit and Ocean View. Thus, materials not
suitable for use on the two Norfolk beaches might still be usable on
Buckroe.
Willoughby Banks
The southern flank of the natural channel to the crest of the
shoal is the prime location of suitable sand in this region. The
material is a gray fine to medium ( .25-. 7 5 mm) sand with varying
amounts (up to 15%) of silt and clay. The horizon has a maximum
thickness of 28 feet (8.5 m) at the crest and thins to 3 feet (1.0 m)
at the flank of the channel. The horizon has little or no overburden
11

with overfill ratios ranging from 1.1 to 1.75 for the 4.0 x 10⁶ yds3
outlined in Figure 4. The increasing water depths from 3 feet at the
crest (1 m) to the channel should not affect the area as a viable
borrow site. Cores to the south of this area indicate the surface
material grades to a very fine silty sand overlying a layer of
inorganic clay th.at thick.ens landward. The overburden of fine grain
material is considerable on the southern and eastern part of the banks
(up to 10 feet in thickness), rendering most of the sand in deeper
horizons unaccessible for beach nourishment; however, the volume is
· appreciable and could be as high as 15 x 106 yds3 if the overburden
were removed.
Thimble Shoals - Horseshoe
Suitable surface material in this area is a light gray, fine to
medium grained sand (0.25 to 0.5 mm) containing small percentages of
silt and c1:'iy. The surface layer ranges from 1 to 4 feet (0.3 to
1.2 m) in thickness with little or no overburden of unsuitable
material. Below this layer the sand grades to a very clean coarse
sand ranging in size from 1.0 mm to 2.0 mm. The coarse sand layer
ranges from 6 to 15 feet (1.8 to 4.5 m) in thickness throughout the
region shown in Figure 4 outlined as suitable sand. Seismic profiles
indicate this horizon extends to the north and west; however, core
data is insufficient to insure the horizon remains suitable for beach
nourishment, thus calculations of volume may be conservative. Water
depths at this site range from 10-20 feet (3-6 m) allowing easy access
to sediment on or below·the bottom. As no overburden of unsuitable
12
L.~
material is present in this area, the finer grained sand at the
surface of this site would have little or no effect on the overfill
ratios of 1.02 to L 70 for the 30 x 106 yds3 of medium to coarse sand
found in this region•
The area indicated on the map as "possible sand area" probably
has little overburden. However, as seismic records indicate that a
paleo-channel crosses the area, additional cores are necessary to
confirm the continuity of the layers of suitable material.
Cape Henry
The three cores in the nearshore region of Cape Henry produced
medium to coarse grained sand (.50 to 1 mm) with varying amounts of
silt (up to 10%) for the length of the core. The depth of this
horizon was determined to be in excess of 35 feet (10 m) at all three
locations. The volume of suitable material has been calculated to be
6.5 x 10⁶ yds3. This site has the potential of supplying as much as
15 x 106 yds3 of suitable material for beach restoration; however, its
proximity to the shore may limit the advisability of using much of
this material.
Lynnhaven
Four cores were taken inside the Route 60 bridge. Thickness of
the surface sand deposit ranges from 10 to 35 feet (3 to 10 m). This
could yield as much as 1.5 x 10⁶ yds3 of suitable sand if the layer be
continuous throughout tm= site. Seismic reflection profiles were not
13

attainable at this site as limited water depth restricted operations
to the channel. Additional coring would help to delineate the extent
of the horizon.
Grumps Banks
The surface sediments in this area are mostly very fine grained
silty sands, grading to gray medium sand near the beach. Cores at
this site show a sand horizon starting at the beach and either
thinning or dipping seaward. This horizon has an increasing
overburden of inorganic clays and silts to the north and west. The
sand deposit near the existing beach has a thickness of 7 to 20 feet
(1 to 6 m). The volume of material with overfill ratio of less than
2.0 is about 3.0 x 10⁶ yds3. More sand may be found at this site
after further research is completed to delineate the extents of the
horizon and the overburden material.
Thimble Shoals Ship Channel
As previously noted, east end of the Thimble Shoals channel was
studied by CERC (Meisburger, 1972). The study indicated that
18.4 x 10⁶ yds3 of sand were present. The channel is slated for
dredging to a depth of 55 feet in the proposed project to improve
access to Hampton Roads. Dredging to 55 feet could yield
3.0 x 10⁶ yds3 of material. Should the channel be dredged to 50 feet,
the yield would be 1.5 x 10⁶ yds3. The amount of this material that
is sand size and suitable for beach nourtshment still needs to be
determined.
14
l ,:r
PLANNED WORK
During the second year of the study (July 1981 through June
1982), several lines of work will be followed. Additional cores will
.be taken to attempt to prove the resources of the "possible" areas and
to explore an area off Virginia Beach in the area of the entrance
channel. An engineering consultant will be hired to assess the
different methods of dredging as to costs, efficiency, and
environmental impacts. The study also will include a comparison of
the economics of upland and subaqueous sand sources. Additionally,
the biological resources of the bottom of the study area will be
inventoried to provide an estimate of the potential biological
consequences of sand extraction.
REFERENCES
Dean, R. J. 1974. Compatability of Borrow Materials for Beachfills: Proceedings of the 14th International Coastal Engineering Conference, p. 1319.
Hobson, R. D. 1977. Review of Design Elements for Beach-Fill Evaluation. Tech. Paper 77-6, Coastal Engineering Research Center.
Meisburger, E. ~~ Bay Entrance. Center.
1972. Geomorphology of Sediments of the Chesapeake Tech. Memo No. 38, Coastal Engineering Research
Norfolk District, U.S. Army Corps of Engineers. 1980. Subsurface Investigations for Beach Nourishment. Hurricane Protection of Beach Erosi?n Control Project, Willoughby Spit and Vicinity, Norfolk, Virginia.
Commonwealth of Virginia. 1979. Senate Document No. 4, Report to the Governor and the General Assembly of the Coastal Erosion Abatement Commission.
15
. i

FIGURES

·i I • s
Figure 1. Location map of place names within the study area.

0 5 Nautical Miles
Wi/lOU{lhby B. . On,t,
!~
··:: ·}: o·· :.·. ..-.~·-: ~:-~:.~;.~zy . .. -~ti)·
37°
oo'

Figure 2. Map showing the location of the 72 vibracores taken during fall of 1980.

... .., I / I I,
~J ' I
I I
. --. \ . " (:)WB064 • ', ~,., "
,, ' ',
' ,
, I
0WB072
{:)WB073
©weosg ©weoos
(:)WB028
{:)WB038
VIBRACORE SITE
LOCATIONS
' ' ., ' l
\ I
',,
\
'
\
', \
\
I
\
\
' \ ' I
. .;:::.
\
'-· ...... __
CAPE HENRY
~\
... ' ...... ' ""'o ... - ,-"'
......... 0 - - .... ~ . - - cl
~
+37°00'
\ \ \
\ \
\ ' \ \
\ ' \ '
\ \
/ (
I
I
VIRGINIA
' -- -
\
/
' : ~ ............ -'
,L

Figure 3. Map of the approximate 125 miles of seismic- lines that were run n April 1981.
-~
GEOPHYSICAL
SURVEY
APRIL 1981
' \
\
. '-·
\ . I .. _ ..... ___
•••
' '
CAPE HENRY
'' '-' ....... ' - 'o"' ... _ - ~-.,, ',o .... .., . - - d
:e + 37°00'
\ \ \ \ \
\ ' \ \
\ ' \ '
\ \ .
' ,.
r \
I
VIRGINIA
' _, -- - __,
\ 3

Figure 4. Map showing the location and distribution of probable and possible sand sources in the.southernmost Chesapeake Bay.

\ ·1~ f i \
,.... I \ \i:i · '·1n · · I \._, · 1 ,) u
11 ,, ·", ·\ <; l\ ·--... \\ . ·1
V
·,.\-\ (r._l .. l ) \ l.,l (;
\ \\° '· ·, \ ! \ \
·, \ ,? l ('\
SANO INVENTORY PROJECT STUoy AREA and SURVEY SITES
I
I I
I ~ ~
\ ..... l,-.)
\\ '.'. ! \JV
~ ~
AREA TO BE EXPLORED
AREA OF POSSIBLE SAND
(.
./\ _.,, ', ( . . ( r::::....,.J
C:::J \
0
; .,;. ~«,.,,,,,;,,, • • •"'i > = - - 18 4 X 10 y A : '\~ ·::;;;t:· ~o . ~ t ··~i~to/f1~ \\
1r.' - .. ,, . ., " 0
, ;;.,-. I ,:-·----~...... C
< i' ,J ). U•~~i,~ _ :2~\,: O (' O ChUNps BAN,c " C ~J c ") l""'i;;:-._--- ~ Al>• ·-•· r ' o -C .. ::f=' / Q ~
0
__ ,,.. LYN,V;fAVe,v lrOA!Js ./·
·11~1~:~!.~~'01~:~::, .. ' 0
0
0 2000
3 4
4000 eooo
Figure 5. Isopach map of the thickness of the layers of usable sand.
20 r---..., \......_30
0 Oo
0
C
/\ ./ I., ( . . (
C-~.J c:::;
I
I I
I
C·
ISOPACH (Thickness) OF SAND
10' Interval
(i
\ (le)
C
===::===-
C·
-·-·-·--·--.. __ .-· ............. -·- \ ,.- . /. I • / i / \
/ CAPE HENRy . I
-· /'
/ /
/
..,,.-· ·-· .-·-.'I .,,..,..-(_ _______ _
0 NAur,cAL liflLe:s
0 2 3 4

Figure 6. Contour map of the depth from the water surface to the bottom of the l~yers of usable sand.
i'

+:P
DEPTH (Feet) TO 80TTOfl(1 OF SAND LA YEAS I
I I
I
0 D
/\ ./ i.,
( . . (
c.\.J
C-\
0
,AO/ -- -
L./ -'-======~ ====-____ ,_ ~ -- 60 . --==:::=-- ,-======-- . ~ -:::=__ -- -1- GO 0
-==-
0
--------.--·
-0 .--· _.., .-· -·- .,o ..
0
0 2000
•ooo
()()
C
.-·-·-·-·-·-·,., -·- \ J
i \
4
eooo

Figure 7. Preliminary map of the density and distribution of benthos.

!\ (.....:,
p
r\ \ ) I ( I.
d \j
I ( --·-i
I ( ...... _
'-. ,_ \.
'-·, '-,
'-,
' \ \
\
\ j
0
0 l~
0
" (/
0
I I
I
I I
I
----- ..:.:::= === == ·---=:= N£l. == ;__ --------- - -:::::=== -- - - THIMBLE SHO,g_ CHAN====+-- -- - ------- - - --- ---- --- ------- I S ::, ----- I
0
0 0 ()
0
'--- -----...._ _____ _
~ ~ ;:
" z « w "' Cl
iii i w "' «
...... -·! _... w
5
" '\
(. _____ ---
o• • 0
0
()
·~· 0
-.,-
0 rooo
BENTHos DENS/Ty
\
0 /
/ / _.,
/ _,,,
zooo 3000
YARos
/ /
f'J/ r· j
/ I
i I
40Q()
,... /
/ ,-·
5000
_ _..
(}()
~ -·
&ooo
--·-·-·- -·-· --·-
4
7
-. ....... '\
\
i i
i \ \
Figure 8. Preliminary map of the density and distribution of hard clams.

HAMPTON ROADS
~667
(123 ~22
()sss
,a24
.663
\\ \ . \ 1 . \ \ \ \ \ \)
0666
"'9
/\ ,.,, .1.,
0 " \I
\ I ,, \ <...-·-\~/
.. 7
l) L"'
0
I I
I I
I
•• ()
HARD CLAM DENSITY
000000 s,; ~•2al0'1. CLAMS/ACRE
IOO 101 102 103 104 10' CLAMS/ACRE
-·-·- 181
DEPTH CONTOUR
STATIONS 5-24 HAVEN (1969)
STATIONS 656-775 HAVEN, LOESH 1 ond WHITCOMB (1973)
\
0
()0
(!J1a
HORSESHOE
..., '-
(!)5 --0660 • a ----\ ------ ----\ ---- ----(!)ss1
C 0
-----;-- --------- \ ------- r"'\
--- CHANNEL \ ----- THIMBLE SHOAL ---\ --------- -------- \ ---- -------- ------ ----· -------------
r----------1
r .. ,/ 0 763 ~111 -" '
0
{!)9 0 \
C,
C
~730
0765
) --)
//-~-;-7:;---·-·-· <=:·-CRUMP$ BANK 0 LYNNHAVEN ROADS
/ 0 C {_.,,,. .. __ )
~-72
j t __ ...,
~10
i
' I ,.,_ __ _ --- ./
/ /
,,/ .,,...._.,./
(}
0
,-/ ./
/
// /
(_-: -" \.. <!)11
~~-~~----~-----,_, ~~
--- • ·~o·----....~c5":;:;;-~
~:NNHAVEN
'----:--·-\!)--LITTLE CREEK
0
0
BAY
IOOO 2000
/
I I
-·-·-·- - -- -·--_,,.,.. . ...- - ........ .,,,.. ·"·, ..,. . .,,.-·
/ ) /.., I
/ i 0/ \ / \ i
/ i
I
CAPE HENRY
NAUTICAL MILES 2
3000 YARDS
4000 5000 6000