report to congress on competition in wholesale · pdf filereport to congress on competition in...
TRANSCRIPT

REPORT TO CONGRESS ON COMPETITION IN WHOLESALE AND RETAIL MARKETS
FOR ELECTRIC ENERGY
Pursuant to Section 1815 of the Energy Policy Act of 2005
The Electric Energy Market Competition Task Force

The Electric Energy Market Competition Task Force
Members:
J. Bruce McDonald, Department of Justice Michael Bardee, Federal Energy Regulatory Commission John H. Seesel, Federal Trade Commission David Meyer, Department of Energy Karen Larsen, Department of Agriculture
Report Contributors:
Robin Allen – Department of Justice Kathleen Barrón – Federal Energy Regulatory Commission Tracey Chambers – Department of Justice Lee-Ken Choo – Federal Energy Regulatory Commission Jade Eaton – Department of Justice Patricia Ephraim – Department of Energy Douglas Hale– Department of Energy; Energy Information Administration John Hilke – Federal Trade Commission Douglas Hilleboe – Federal Trade Commission David Kathan – Federal Energy Regulatory Commission Robin Meigel – Department of Agriculture Richard O'Neill – Federal Energy Regulatory Commission Moon Paul – Federal Energy Regulatory Commission Astrid Rapp – Federal Energy Regulatory Commission Steven Reich – Federal Energy Regulatory Commission Janelle Schmidt – Department of Energy Harry Singh – Federal Energy Regulatory Commission Michael Wroblewski – Federal Trade Commission (left the FTC in June 2006) David Zlotlow – Department of Justice
This report was prepared by the Task Force with the assistance of the Department of Justice, Federal Energy Regulatory Commission, Federal Trade Commission, Department of Energy, and Department of Agriculture. The Task Force assumes full responsibility for the report and the views expressed herein.


TABLE OF CONTENTS
Table of Contents...................................................................................................................... i Executive Summary ................................................................................................................. 1 Chapter 1. Industry Structure, Legal and Regulatory Background, Trends and Developments ................................................................................................... 10 Chapter 2. Context for the Task Force’s Study of Competition in Wholesale and Retail
Electric Power Markets ........................................................................................... 44 Chapter 3. Competition in Wholesale Electric Power Markets ............................................... 53 Chapter 4. Competition in Retail Electric Power Markets ....................................................... 84 Appendix A. Index of Comments Received ...........................................................................109 Appendix B. Task Force Meetings with Outside Parties ........................................................116 Appendix C. Annotated Bibliography of Cost Benefit Studies ..............................................117 Appendix D. State Retail Competition Profiles .....................................................................137 Appendix E. Analysis of Contract Length and Price Terms....................................................177 Appendix F. Bibliography of Primary Information on Electric Competition .........................182 Appendix G. Credit Ratings of Major American Electric Generation Companies…………..184 Table 1-1. U.S. Retail Electric Providers, 2004 ....................................................................... 14 Table 1-2. U.S. Retail Electric Sales, 2004 .............................................................................. 15 Table 1-3. U.S. Retail Electric Providers, 2004, Revenues from Sales to Ultimate Consumers ............................................................................................... 15 Table 1-4. U.S. Electricity Generation, 2004 ........................................................................... 16 Table 1-5. U.S. Electric Generation Capacity, 2004 ................................................................ 16 Table 1-6. Power Generation Asset Divestitures by Investor-Owned Electric Utilities, as of
April 2000 ............................................................................................................... 43 Table 4-1. Percentage of Utility Ownership of Generation Assets ………………………….. 93 Figure 1-1. U.S. Electric Power Industry, Average Retail Price of Electricity by State, 2004 ............................................................................................................. 26 Figure 1-2. Status of State Electric Industry Restructuring Activity and Retail Competition, July 2006 ......................................................................................... 28 Figure 1-3. RTO Configurations in 2006 ................................................................................. 32 Figure 1-4. Utility and Nonutility Generation Capacity Additions, 1995-2004 ....................... 35 Figure 1-5. Transmission Construction Expenditures by Investor-Owned Utilities, Actual and Projected, 1975-2009........................................................................... 36 Figure 1-6. National Average Retail Prices of Electricity for Residential Customers, 1960-2005 ............................................................................................................. 38 Figure 1-7. Natural Gas Plants Dominate New Generating Unit Additions ............................ 39 Figure 1-8. Net Generation Shares by Energy Source ............................................................. 40 Figure 1-9. Fossil Fuel Costs for Electric Generators, 2001-2006 .......................................... 41
i

Figure 3-1. U.S. Electric Generating Capacity Additions, 1960-2005 .................................... 60 Figure 3-2. Estimate of Annual New York Capacity Values .................................................. 65 Figure 4-1. U.S. Electric Power Industry, Average Retail Price of Electricity by State, 1995……………………………………………………………………. 87 Figure 4-2. States Retail Competition Status, 2003 ................................................................. 91 Figure 4-3. Average Revenues per kWh for Retail Customers, 1990-2005 ............................ 95 Appendix D Tables 1-34....................................................................................................139-174
ii
EXECUTIVE SUMMARY
A. Congressional Request The Energy Policy Act of 2005 (EPAct 2005)1 was designed to provide a comprehensive long-range energy plan for the United States. Section 1815 of the Act2 created an “Electric Energy Market Competition Task Force”3 (Task Force) to conduct a study of competition in wholesale and retail markets for electricity in the United States. Section 1815(b)(2)(B) required the Task Force to publish a draft final report for public comment at least 60 days prior to submitting the final report to Congress. The Task Force published the draft final report in June 2006 and sought comment on the preliminary observations contained in the draft. Based on those comments, and other input received earlier, the Task Force hereby submits this final report to Congress. B. Task Force Activities In preparing this report, the Task Force undertook several activities, as follows:
Section 1815(c) of the EPAct 2005 required the Task Force to “consult with and solicit comments from any advisory entity of the Task Force, the states, representatives of the electric power industry, and the public.” Accordingly, the Task Force published a Federal Register notice seeking comment on a variety of issues related to competition in wholesale and retail electric power markets. Over 80 commenters provided a variety of opinions and analyses in response. These comments are available online for public review in the Task Force docket maintained by the Federal Energy Regulatory Commission (FERC) under Docket No. AD05-17-000. The list of parties who submitted comments is attached as Appendix A.4
The Task Force met and discussed competition-related issues with a variety of
representatives of the states, the electric power industry, and other stakeholders in October-December 2005. These groups are listed in Appendix B.
The Task Force prepared an annotated bibliography of the public cost/benefit studies that
have attempted to analyze the status of wholesale and retail competition. Appendix C contains this bibliography.
The Task Force reviewed the status of retail competition in the states and examined in
detail the experiences of seven states with active retail competition programs: Illinois, Maryland, Massachusetts, New Jersey, New York, Pennsylvania, and Texas. These
1 Pub. L. No. 109-58, 119 Stat. 594 (2005). 2 Pub. L. No. 109-58, § 1815, 119 Stat. 594, 1128 (2005). 3 The Task Force consists of five members: (1) one employee of the Department of Justice, appointed by the Attorney General of the United States; (2) one employee of the Federal Energy Regulatory Commission, appointed by the Chairperson of that Commission; (3) one employee of the Federal Trade Commission, appointed by the Chairperson of that Commission; (4) one employee of the Department of Energy, appointed by the Secretary of Energy; and (5) one employee of the Rural Utilities Service, appointed by the Secretary of Agriculture. 4 Abbreviations for those parties are also listed in Appendix A.
1

states have taken a variety of approaches to introducing retail competition. Appendix D profiles these retail competition programs, updating information prepared by the Federal Trade Commission (FTC) staff.
The Task Force published the draft final report in the Federal Register for public
comment on June 13, 2006, 71 Fed. Reg. 34,083 (2006). The notice accompanying the draft requested comments on the Task Force observations. About 80 different entities provided comments and suggestions on the draft report. These commenters are listed in Appendix A. Draft report comments are available for public review online in the Task Force docket maintained by FERC under Docket No. AD05-17-000.
In preparing the draft report, the Task Force conducted further research and reviewed the
information from comments and interviews.
C. The Goal of Increasing Competition in Electric Power Markets
Federal and several state policymakers generally introduced competition in the electric power industry to overcome perceived shortcomings of traditional cost-based regulation. In competitive markets, prices are expected to guide consumption and investment decisions, leading to more economically efficient investments and lower prices than under traditional cost of service monopoly regulation. More specifically, market-based, as compared to regulated, pricing of electricity would be expected to more accurately reflect the underlying costs of production. These prices should thus align the price of electricity with the value customers place on electricity, leading to a more efficient allocation of electrical resources and lower overall prices than would be the case in the absence of market-based prices. These price signals should also serve to increase price during periods of scarcity, thereby eliciting reductions in consumption, moderating market power and improving reliability. D. Observations on Competition in Wholesale Electric Power Markets Congress has taken a number of steps to facilitate competition in wholesale electric power markets. The Public Utility Regulatory Policies Act of 1978 (PURPA),5 the Energy Policy Act of 1992 (EPAct 1992),6 and EPAct 2005 promoted competition by lowering entry barriers and increasing transmission access. Federal electricity policies have sought to strengthen competition but continue to rely on a combination of competition and regulation. In assessing wholesale competition, the Task Force addressed the following question: Has competition in wholesale markets for electricity resulted in sufficient generation supply and transmission to provide wholesale customers with the kind of choice that generally is associated with competitive markets? To answer this question, the Task Force examined whether competition has elicited the consumption and investment decisions generally associated with competitive wholesale markets.
5 Pub. L. No. 95-617, 92 Stat. 3117 (codified in U.S.C. titles 15, 16, 26, 30, 42, and 43) (1978). 6 Pub. L. No. 102-486, 106 Stat. 2776 (1992).
2

The Task Force found this question challenging to address due to a number of complicating factors. The various U.S. regional wholesale electric power markets developed differently since the introduction of widespread wholesale competition. There were significant regional regulatory and structural differences in the electric power industry when Congress enacted EPAct 1992 and when FERC adopted Order No. 8887 in 1996, mandating nondiscriminatory access to the transmission grid. Even today, the regional markets have different features and characteristics. As discussed in Chapter 3, these differences make it difficult to identify and separate the determinants driving consumption and investment decisions and thus make it difficult for the Task Force to evaluate the degree to which more competitive markets have influenced such decisions. Despite the difficulty of directly answering the question at hand, the Task Force’s examination of wholesale competition did yield useful observations, as outlined below. 1. Wholesale Market Structures Wholesale markets exhibit regional differences and generally rely on one of two types of market structures to support wholesale transactions. a. One approach to competition in wholesale markets is to base trades exclusively on bilateral sales negotiated directly between suppliers and scheduled through individual, non-regionalized transmission owners. This approach predominates in the Northwest and Southeast. This traditional trading format allows for somewhat independent operation of transmission control areas and, in the view of some market participants, better accommodates historical contracts. However, prices and terms are more transaction-specific and, for some timeframes, less publicly available than in organized markets, which may result in less efficient generation dispatch. It can be difficult for system operators to coordinate transmission efficiently in these systems, as congestion costs and impacts are not readily apparent. A lack of centralized, shared information about generation dispatch and trades on interconnected systems requires a transmission owner to hold part of its transmission capacity as unused “reserves” to ensure reliable system operation. In some of these markets, wholesale customers have difficulty gaining unqualified access to the transmission needed to access competitively priced generation, thus limiting their ability to shop for least-cost supply options. b. Another approach to wholesale competition relies on entities that are independent of market participants to control operation of all transmission facilities across a wide region and to operate trading markets – regional transmission organizations (RTOs) or independent system operators (ISOs). Variations of this approach predominate in the Northeast, Mid-Atlantic, Midwest, Texas, and California. The market designs in these regions provide participants with guaranteed physical access to the transmission system (subject to transmission security constraints). These customers are responsible for the cost of that access (if they choose to 7 Promoting Wholesale Competition Through Open Access Non-Discriminatory Transmission Services by Public Utilities; Recovery of Stranded Costs by Public Utilities and Transmitting Utilities, Order No. 888, 61 Fed. Reg. 21,540, FERC Stats. & Regs. ¶ 31,036, 31,639 (1996), order on reh’g, Order No. 888-A, FERC Stats. & Regs. ¶ 31,048 (1997); order on reh’g, Order No. 888-B, 81 FERC ¶ 61,248 (1997), order on reh’g, Order No. 888-C, 82 FERC ¶ 61,046 (1998), aff’d in relevant part sub nom. Transmission Access Policy Study Group v. FERC, 225 F. 3d 667 (D.C. Cir. 2000), aff’d sub nom. New York v. FERC, 535 U.S. 1 (2002) [hereinafter Order No. 888].
3

participate), and thus are exposed to congestion price risks. This more open access to transmission can increase competitive options for wholesale customers and suppliers as compared to most bilateral markets. The price transparency in these regional organized markets can increase the efficiency of the trading process for sellers and buyers and can give clear price signals indicating the best place and time to build new generation. Concerns have been raised, however, about the inability to obtain long-term transmission access at predictable prices in these markets and the impact that this can have on access to competing suppliers and incentives to construct new generation. Some customers have raised concerns about high and sometimes volatile commodity price levels in these markets. 2. Generation Investment in Competitive Wholesale Markets New generation investment has varied significantly by region since the adoption of open access transmission and the growth of competition. The Task Force examined comments on how competition policy choices have affected investment decisions of both buyers and sellers in wholesale markets. A number of issues emerged. One was the difficulty of raising capital to build facilities whose revenue streams are affected by changing fuel prices, demand fluctuations, and the potential for regulatory intervention. A related theme was the investment dampening effects of a perceived lack of long-term contracting options for generation and transmission. Overall, the Task Force identified several factors that affect investment decisions in wholesale power markets.
a. Availability of Long-Term Contracts. Both generators and wholesale customers cited long-term contracts as critical in obtaining financing for new generation and ensuring adequate supplies for retail loads at predictable prices. Several explanations were offered for a perceived lack of long-term contracting opportunities. First, short-term market conditions, particularly in organized markets with uniform price auctions, may be affecting the availability, pricing, and terms for long-term power supplies under bilateral contracts. Base-load and mid-merit generators may see relatively high profits in short-term markets where clearing prices are often set by higher cost mid-merit and/or peaking plants reliant on oil or natural gas, particularly when fuel prices rise. Second, generators and marketers may be unwilling to enter into long-term supply contracts because of limited opportunities to hedge the potential risks of long-term commitments in highly volatile electricity markets. Third, both generators and customers cited continuing uncertainties over availability and certainty of long-term delivery options (transmission). Fourth, long-term contracts may be difficult to arrange because of inherent uncertainties associated with federal and state regulation of these contracts. Finally, the uncertainty that distribution utilities face over how much supply they will need to procure for customers that have an option to switch can also discourage utilities from signing long-term contracts. b. Capital Investment. Potential entrants to generation markets must be able to convince capital markets that generation is a viable profitable undertaking. The availability of long-term contracts, as noted above, is critical to the ability of nonutility generators to secure capital for new investment. Transmission access can be vital to supporting competitive options for market participants. Recently, capital for large investment projects has flowed to traditional utilities
4
more than to merchant generators. This shift in part reflects reduced profitability of many merchant generators in recent years. c. Transmission Infrastructure. The availability of transmission is often key in determining whether a generating facility is likely to be profitable and, thus, elicit investment. Despite legislative and regulatory efforts to expand transmission access for competitive generation and to reduce the potential for discrimination, the perception of discrimination persists. Commenters reported that such discrimination can increase delivery risk because purchasers fear their transmission transactions could be terminated for anticompetitive reasons. One response to this risk is to turn over operation of the regional transmission grid to ISOs and RTOs. Another is to adopt additional reforms to the Order 888 Open Access Transmission Tariff (OATT). New federal authorities provided by EPAct 2005 also address transmission infrastructure issues.
3. Pricing and Entry in Wholesale Markets for Electricity Several options may be used to elicit adequate supply in wholesale markets: a. One possible, but controversial, way to spur entry is to allow wholesale price spikes when supply is short. The profits realized during these price spikes can provide incentives for generators to invest in new capacity. However, if wholesale customers have not hedged (or cannot hedge) against price spikes, then these spikes can lead to adverse customer reactions. Unfortunately, it can be difficult to distinguish high prices due to the exercise of market power from those due to genuine scarcity. Past price spikes have caused regulators and various wholesale market operators to adopt price caps in certain markets. Although price caps may limit price spikes and some forms of market manipulation, they can also limit legitimate scarcity pricing and impede incentives to build generation in the face of scarcity. Not all the caps in place may be necessary or set at appropriate levels. b. “Capacity payments” also can help elicit new supply and help moderate price volatility. Wholesale customers pay suppliers to assure the availability of generation when needed. Where there are capacity payments in organized wholesale markets, however, it is difficult for regulators to determine the appropriate level of capacity payments to spur entry without over-taxing market participants and customers. Also, capacity payments may elicit new generation when transmission or other responses to price changes might be more affordable and equally effective. Depending on their format, capacity payments also may discourage entry by paying uneconomical generation to continue running when market conditions otherwise would have led to not running, or even decommissioning. c. Expanding transmission capacity may encourage entry of new generation and/or the more efficient use of existing generation. However, transmission owners may resist building transmission facilities if they also own generation and if the proposed upgrades would increase competition in their sheltered markets. Another challenge is that it is often difficult to assess the beneficiaries of transmission upgrades, who should pay for the upgrades, and how regulators should provide for recovery of the investment through rates. This regulatory challenge may cause uncertainty about the price for transmission and about return on investment both for new generators and for transmission providers.
5
d. Another option for ensuring adequate generation supply is to exercise traditional regulatory authority over electricity generators/suppliers. In this situation, regulated monopoly utility providers operate under an obligation to plan and secure adequate generation to meet the needs of their customers. Regulators allow the utilities to earn a fair rate of return on their investment, thereby encouraging utility investment. This approach is not without risk to the utility, as regulators have authority to disallow excessive costs. Furthermore, these traditional methods are imperfect and can in some cases lead to overinvestment, underinvestment, excessive spending and unnecessarily high costs. These methods can distort both investment and consumption decisions. E. Observations on Retail Market Competition In the early 1990s, several states with high electricity prices began exploring opening retail electric service to competition. While customers would choose their supplier, the local distribution utility would still handle the delivery of electricity. Retail competition was expected to result in lower retail prices, innovative services and pricing options. It also was expected to shift the risks of assuring adequate new generation construction from ratepayers to competitive market providers. By 2006, 16 states and the District of Columbia had restructured retail electric service and allowed competitive suppliers to provide service to some, if not all, retail customers at prices set in the market. Most restructured states required the local utility to continue to offer service under regulated “provider of last resort” (POLR) rates for all retail customers who did not switch suppliers or who lost or discontinued competitive service. These POLR rates were typically fixed for extended periods of time. In many of these states, vertically integrated utilities divested or transferred their generation assets as part of restructuring plans. As a result, in these states the retail load serving utilities obtain electricity from wholesale markets to meet the needs of their retail customers, including POLR obligations. Some states also required that the utilities join RTOs. 1. Retail Competition Experience in Profiled States The Task Force examined in detail the implementation of retail competition in Illinois, Maryland, Massachusetts, New Jersey, New York, Pennsylvania, and Texas. Common goals for retail competition included:
lower electricity prices than under traditional cost of service regulation through retail suppliers’ (and eligible customers’) access to competitive wholesale markets;
better service and more options for customers; technological innovation and new products and services for consumers; and environmental improvements.
In most profiled states, retail competition has not developed as expected for all customer classes. Few residential customers have switched to alternative providers. (Exceptions include Massachusetts, New York, and Texas.) In most of the profiled states, few residential customers
6
have a wide variety of alternative suppliers and pricing options. Commercial and industrial (C&I) customers have more choices and options, but in several states large industrial customers have become increasingly dissatisfied with retail market prices. To the extent that multiple suppliers serve retail customers, prices have not decreased as expected, and the range of new options and services is often limited. At the same time, there is some evidence that alternative suppliers have offered new retail products, including “green” products that are more environmentally friendly for residential and non-residential customers and customized energy management products for large C&I customers. Legislative or regulatory limits on POLR prices have hampered entry by competitive suppliers in retail markets. In the profiled states, regulators often capped the POLR electricity price for “transitional” multi-year periods that are now just ending. Several states also required price reductions for POLR service below existing regulated rates (in order to proxy the expected benefits of competition). Over time, these capped and discounted POLR prices fell below prevailing wholesale market price levels. These POLR price caps have the unintended effect of dampening competitive price signals and discouraging entry by competitive suppliers. The POLR rate caps and the sharp increase in fossil fuel costs affecting all retail suppliers across the country, complicate Task Force efforts to discern any price differences attributable to the introduction of competition. The implementation of retail competition is a relatively new exercise, and retail competition policies involve a number of unresolved issues (including regulatory issues) that can inhibit vigorous competition. It should be easier to evaluate the impact of restructuring in retail electricity markets once some of these issues have been resolved. 2. State Retail Competition Issues Initial POLR rate discounts, freezes and caps have been lifted in several states, and caps in several more expire in 2006 and 2007. When the rate caps expire, states must decide whether to continue POLR for all customer classes, how POLR providers will secure adequate generation supplies, and how to price POLR service for each class. The Task Force identified some key issues that states may wish to consider as they evaluate their retail competition and POLR policies. a. Function of POLR Pricing. If regulated POLR service is to be a proxy for efficient price signals, POLR rates must closely approximate a competitive price, which is based on supply and demand at any given time. If the POLR service price does not closely match the competitive price, it is likely to distort consumption and investment decisions. b. Adjustments to POLR Rates. If POLR prices remain fixed while prices for fuel and wholesale power are rising, customers may experience rate shock when the transition period ends. This can create public pressure to continue the fixed POLR rates at below-market levels. One regulatory response may be to phase in the price increase gradually, by deferring recovery of part of the supplier’s costs. This approach reduces rate shock, but it is likely to distort retail electricity markets both in the short term (when costs are deferred) and in the long term (when
7
the deferred costs are recovered). The better practice is to make frequent adjustments to the cap (at least to reflect changes in fuel costs) or to abandon the cap altogether and use a competitive process to procure supply. c. Nature of POLR Service. States have different policy goals for establishing and maintaining POLR service in competitive retail markets. These policies can affect entry of competitive retail suppliers. POLR service (or an equivalent provision) that is limited to an obligation to serve customers of a supplier that has left the market, while the customer obtains another supplier, is the least intrusive form of POLR service. It also is consistent with protecting consumers against unanticipated loss of electric service. POLR service that goes beyond short-term access to the wholesale spot market involves providing a bundle of services that electricity marketers also could provide. A more expansive version of POLR service may hamper development of alternative suppliers. The economic rationale for maintaining a POLR service obligation usually is limited to trying to correct market imperfections. If a state adopts a more expansive version of POLR service, it should periodically review the rationale for continuing the service. d. Treatment of Different Customer Classes. States may find that effective retail competition programs require different POLR service designs for different customer classes. Large C&I customers are logical leaders for retail choice because of their familiarity with energy procurement processes and because they are comfortable with decisions to adjust input use based on input prices. State policies have allowed POLR rates for these large customers to reflect wholesale spot market prices more than POLR rates for residential customers. This approach generally has led large customers to switch suppliers more than small customers have. Also, more suppliers have tried to solicit these large customers. e. Consumer Education. Customers may find it difficult to find competitive supplier offers in the first place and to understand the terms and conditions of those offers. It also is unclear whether the perceived potential cost savings are sufficient to give customers incentives to undertake the effort to find this information. For these smaller, less sophisticated shoppers, issues of awareness and access to comparative pricing information should be addressed as retail customer choice is implemented. f. Customer Aggregation. Competitive provider interest in residential and small business customers has been slow to develop in most states. While POLR policies have dampened price signals, the higher per-unit costs of marketing and switching for small customers may also be a disincentive for providers. Retail aggregation programs can reduce shopping burdens and uncertainties for individual customers and lower customer acquisition costs for competitive providers. Several states have approved customer aggregation plans as an alternative approach to developing retail competition. Opt-out customer aggregations may be worth considering because they can minimize transaction costs without limiting customer choice.
8
g. Procurement of POLR Supply. In all retail competition states, a substantial number of retail customers continue to depend on POLR service. Some states have used, or are proposing to use, auctions to procure POLR supply. Auctions may allow retail customers to get the benefit of competition in wholesale markets as suppliers compete to supply the necessary load. Various auction processes have been suggested. h. Switching Costs. Switching is important for retail electricity competition to work. Rules and procedures for switching should allow customers to switch easily but should deter unauthorized switching (slamming). Section E of Chapter 4 presents a description of various approaches to overcoming some of the above-mentioned difficulties and to encouraging competition in retail electricity markets.
9

CHAPTER 1 INDUSTRY STRUCTURE, LEGAL AND REGULATORY
BACKGROUND, TRENDS AND DEVELOPMENTS For almost all of the 20th Century, the electric power industry was dominated by regulated monopoly utilities. Beginning in the late 1960s, a number of technological, economic, regulatory, and political developments led to fundamental changes in the structure of the industry. In the 1970s, vertically integrated utility companies (investor-owned, municipal, or cooperative) controlled over 95 percent of the electric generation in the United States. Typically, a single local utility sold and delivered electricity to retail customers under an exclusive franchise regulated under state law. Today, the electric power industry includes both utility and nonutility entities, including many new companies that produce, market and deliver electric energy in wholesale and retail markets. As a result of industry changes, by 2004 electric utilities owned less than 60 percent of electric generating capacity. Increasingly, decisions affecting retail customers and electricity rates are split among federal, state, and new private, regional entities. This chapter highlights structural changes in the industry since the late 1960s. It provides an overview of the important legislative and regulatory changes, as well as trends that have contributed to increased competition.
A. Industry Structure and Regulation Participants in the electric power sector in the United States include investor-owned utilities and electric cooperatives; federal, state, and municipal utilities, public utility districts and irrigation districts; cogenerators and onsite generators; and nonutility independent power producers (IPPs), affiliated power producers, power marketers, and independent transmission companies that generate, distribute, transmit, or sell electricity at wholesale or retail. In 2004, 3,276 regulated retail electric providers supplied electricity to over 136 million customers, with retail sales totaling almost $270 billion. Retail customers purchased more than 3.5 billion megawatt hours (MWhs) of electricity. Active retail electric providers include utilities, federal agencies, and power marketers selling directly to retail customers. These entities differ greatly in size, ownership, regulation, customer load characteristics, and regional conditions. These differences are reflected in policy and regulation. Tables 1-1 to 1-5 provide selected statistics for the electric power sector by type of ownership in 2004 based on information reported to the Department of Energy (DOE), Energy Information Administration (EIA). 1. Investor-Owned Utilities Investor-owned utility operating companies (IOUs) are private, shareholder-owned companies ranging from small local operations serving a retail customer base of a few thousand to giant multi-state holding companies serving millions of customers. Most IOUs are or are part of a vertically integrated system that owns or controls generation, transmission, and distribution
10
facilities/resources to meet the needs of retail customers in their franchise service areas. Many IOUs have undergone significant restructuring and reorganization under state retail competition plans over the past decade. As a result, many IOUs no longer own generation, but those that sell electric power to retail customers must procure electricity from wholesale markets. See Chapter 4 and Appendix D of this document for details on state experience with retail competition. IOUs continue to be a major presence. In 2004 there were 220 IOUs serving approximately 94 million retail distribution customers, accounting for 68.9 percent of all retail customers and 60.8 percent of retail electricity sales. IOUs directly owned about 39.6 percent of total electric generating capacity and accounted for 44.8 percent of generation for retail and wholesale sales in 2004. IOUs provide service to retail customers under state regulation of territories, finances, operations, services, and rates. States that have not restructured retail service generally regulate retail rates under traditional bundled cost-of-service rate methods. In states that have restructured IOUs, distribution services continue to be provided under monopoly cost-of-service rates, and retail customers obtain generation service either at market rates from alternative competitive providers or at regulated “provider of last resort” (POLR) rates from the distribution utility or another designated POLR service provider. IOUs serve retail customers in every state but Nebraska. Under the Federal Power Act (FPA),8 the Federal Energy Regulatory Commission (FERC) regulates wholesale electricity transactions (sales for resale) and unbundled transmission activities of IOUs as “public utilities” engaged in interstate commerce. The exceptions are IOUs that do not have direct interconnections with utilities in other states that allow unimpeded flow of electricity across systems. Thus, IOUs in Alaska, Hawaii, and the Electric Reliability Council of Texas (ERCOT) region of Texas generally are not subject to FERC jurisdiction. 2. Public Power Systems The more than 2,000 publicly owned power systems include local, municipal, state, and regional public power systems. These providers range from tiny municipal distribution companies to large systems such as the Los Angeles Department of Water and Power. Publicly owned systems operate in every state but Hawaii. About 1,840 of these systems are cities and municipal governments that own and control the day-to-day operation of their electric utilities.9 Public power systems served over 19.6 million retail customers in 2004, or about 14.4 percent of all customers. Together, they generated 10.3 percent of the nation’s power in 2004, accounted for 16.7 percent of total electricity sales and owned about 9.6 percent of total generating capacity. Many public systems are distribution-only utilities that purchase, rather than generate, power. According to the American Public Power Association, about 70 percent of public power retail sales were met from wholesale power purchases, including purchases from municipal joint action agencies by the agencies’ member systems. Only about 30 percent of the electricity for public power retail sales comes from power generated by a utility to service its own native load.10 Publicly owned utilities, thus, depend overwhelmingly on transmission and the wholesale market to bring electricity to their retail customers.
8 16 U.S.C. §§ 791a et seq. (2000). 9 APPA comments. 10 Id.
11
Regulation of public power systems varies among states. In some, the public utility commission exercises jurisdiction in whole or part over operations and rates of publicly-owned systems. In most states, public power systems are regulated by local governments or are self-regulated. Municipal systems usually are governed by a local city council or an independent board elected by voters or appointed by city officials. Other public power systems are operated by public utility districts, irrigation districts, or special state authorities. On the whole, state retail restructuring initiatives did not affect retail services in public systems. However, some states allow public systems to adopt retail choice alternatives voluntarily. 3. Electric Cooperatives Electric cooperatives are privately-owned, non-profit electric systems owned and controlled by the members they serve. Members vote directly for the board of directors. In 2004, 884 electric distribution cooperatives provided retail electric service to almost 16.6 million customers. In addition, another 65 generation and transmission cooperatives (G&Ts) own and operate generation and transmission and secure wholesale power and transmission services from others to meet the needs of their distribution cooperative members’ retail customers and other rural native load customers. G&T systems and their members engage in joint planning and power supply operations to achieve some of the savings available under a vertically integrated utility structure. Electric cooperatives operate in 47 states. Most were originally organized and financed under the federal rural electrification program and operate in primarily rural areas. Cooperatives provide electric service in all or parts of 83 percent of the counties in the United States.11
In 2004, electric cooperatives sold more than 345 million MWhs, served 12.2 percent of retail customers, and accounted for 9.7 percent of electricity sold at retail. Nationwide electric cooperatives generate about 4.7 percent of total electric generation and own approximately 4.2 percent of generating capacity. While some cooperative systems generate their own power and sell power in excess of their members’ needs, most G&Ts and distribution cooperatives are net buyers. Cooperatives nationwide generated only about half of the power needed by their retail customers. They secured approximately half of their power needs from other wholesale suppliers in 2004. Although cooperatives own and operate transmission facilities, almost all rely to some extent on transmission owned by others to deliver power to their customers. Regulatory jurisdiction over cooperatives varies among states. Some states exercise considerable authority over rates and operations, while others exempt cooperatives from state regulation. In addition to state regulation, cooperatives with outstanding loans under the Rural Electrification Act of 193612 are subject to financial and operating requirements of the Rural Utilities Service (RUS), Department of Agriculture. RUS must approve borrowers’ long-term wholesale power
11 NRECA comments. 12 7 U.S.C. 901 et seq.
12
contracts, operating agreements, and transfers of assets. Cooperatives that have repaid their RUS loans and that engage in wholesale sales or provide transmission services to others have been regulated by FERC as public utilities under the FPA. EPAct 2005 gave FERC additional discretionary jurisdiction over transmission services provided by larger electric cooperatives. 4. Federal Power Systems Federally-owned or chartered power systems include the federal power marketing administrations (PMAs), the Tennessee Valley Authority (TVA), and facilities operated by the U.S. Army Corps of Engineers, the Bureau of Reclamation, the Bureau of Indian Affairs, and the International Water and Boundary Commission. Wholesale power from federal facilities (primarily hydroelectric dams) is marketed through four federal power marketing agencies: Bonneville Power Administration, Western Area Power Administration, Southeastern Power Administration, and Southwestern Power Administration. The PMAs own and control transmission to deliver power to wholesale and direct service customers. They also may purchase power from others to meet contractual needs and may sell surplus power as available to wholesale markets. Existing legislation requires that the PMAs and TVA give preference in selling their generation to public power systems and to rural electric cooperatives. Together, federal systems have an installed generating capacity of approximately 71.4 gigawatts (GW) or about 6.9 percent of total capacity. Federal systems provided 7.2 percent of the nation’s power generation in 2004. Although most federal power sales are at the wholesale level, some are made to end users. Federal systems nationwide directly served 39,845 retail customers in 2004, mostly industrial customers and about 1.2 percent of retail load. 5. Nonutilities Nonutilities are entities that generate, transmit, or sell electric power but do not operate regulated retail distribution franchises.13 They include wholesale nonutility affiliates of regulated utilities, merchant generators, and qualifying facilities (QFs).14 They also include power marketers that buy and sell power at wholesale or retail but that do not own generation, transmission, or distribution facilities. Independent transmission companies that own and operate transmission facilities but do not own generation or retail distribution facilities or sell electricity to retail customers are also included in this category for EIA reporting purposes. Non-QF wholesale generators engaged in wholesale power sales in interstate commerce are subject to FERC regulation under the FPA. Power marketers selling at wholesale are also subject to FERC oversight. Power marketers selling only at retail are subject to state jurisdiction and oversight in states where they operate. FERC regulates interstate transmission services of independent transmission companies under the FPA. Such companies also may be organized and regulated as utilities where they are located for planning, siting, permitting, and other purposes.
13 “Nonutilities” – as that term is defined for EIA reporting purposes and as used here – may still be characterized as “utilities” and subject to public service regulation under state law and regulated as “public utilities” by FERC. 14 QFs are small power producers using eligible alternative electric generating technologies and industrial and commercial cogenerators (combined heat and power producers) that have special status under PURPA.
13

As retail electric providers, 152 power marketers reporting to EIA served about 6 million retail customers or about 4.4 percent of all retail customers and reported revenues of over $28 billion, on about 11.6 percent of retail electricity sold. Nonutilities are a growing presence in the industry. In 2004, nonutilities owned or controlled approximately 408,699 megawatts (MWs) or 39.6 percent of all electric generation capacity, compared to about 8 percent in 1993. About half of nonutility generation capacity is owned by nonutility affiliates or subsidiaries of holding companies that also own a regulated electric utility.15 Nonutilities accounted for about 33 percent of generation in 2004. Tables 1-1 through 1-5 summarize this information. Table 1-1. U.S. Retail Electric Providers, 2004
Ownership
Number of Electricity Providers
Percent of Total Number of Customers
Percent of Total
Full-Service
Delivery only* Total
Publicly-owned utilities 2,011 61.4 19,628,710 6,125 19,634,835 14.4
Investor-owned utilities 220 6.7 90,970,557 287,9114 93,849,671 68.9
Cooperatives 884 27 16,564,780 12,170 16,576,950 12.2
Federal Power Agencies 9 0.3 39,843 2 39,845 0.03
Power Marketers** 152 4.6 6,017,611 0 6,017,611 4.4
Total 3,276 100 133,221,501 2,897,411 136,118,912 100.0
Notes: *Delivery-only customers represent the number of customers in a utility’s service territory that purchase energy from an alternative supplier. ** Ninety-eight percent of all power marketers’ full-service customers are in Texas. Investor-owned utilities in the ERCOT region of Texas no longer report ultimate customers. Their customers are counted as full-service customers of retail electric providers (REPs), which are classified by the Energy Information Administration as power marketers. The REPs bill customers for full-service and then pay the IOU for the delivery portion. REPs include the regulated distribution utility’s successor affiliated retail electric provider that assumed service for all retail customers that did not select an alternative provider. Does not include U.S. territories. Source: American Public Power Association, 2006-07 Annual Directory & Statistical Report, from Energy Information Administration Form EIA-861, 2004, data.
15 EEI comments.
14
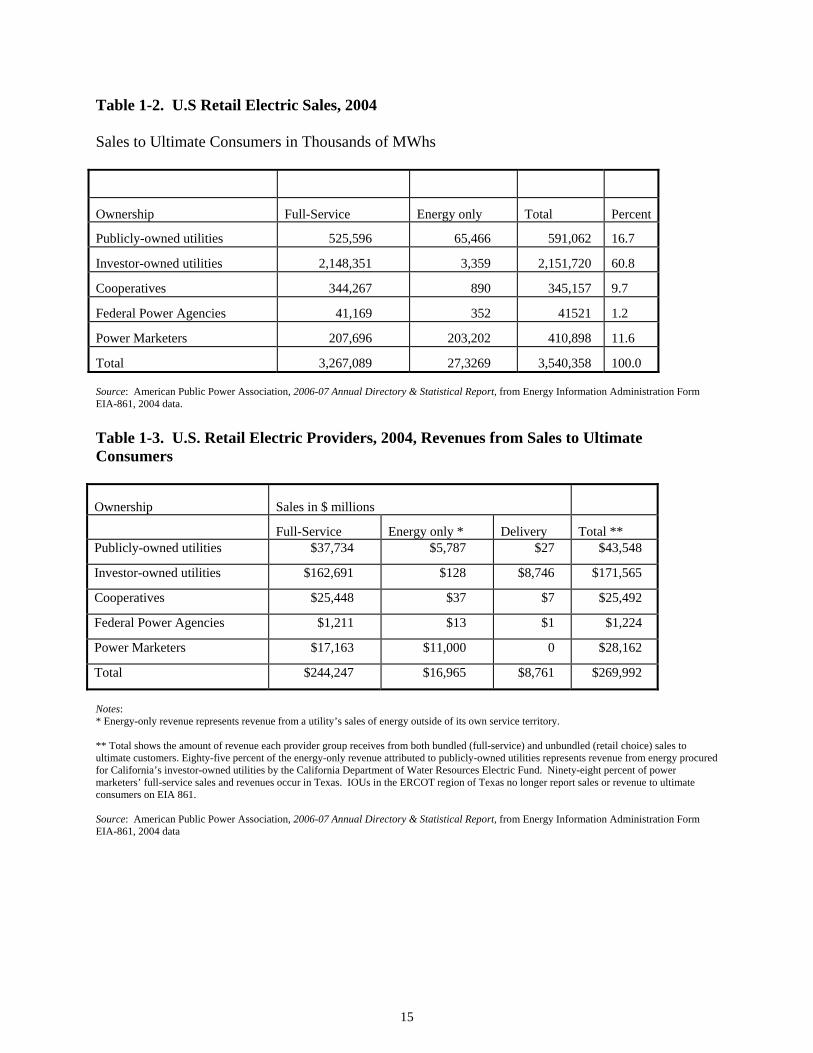
Table 1-2. U.S Retail Electric Sales, 2004 Sales to Ultimate Consumers in Thousands of MWhs
Ownership Full-Service Energy only Total Percent
Publicly-owned utilities 525,596 65,466 591,062 16.7
Investor-owned utilities 2,148,351 3,359 2,151,720 60.8
Cooperatives 344,267 890 345,157 9.7
Federal Power Agencies 41,169 352 41521 1.2
Power Marketers 207,696 203,202 410,898 11.6
Total 3,267,089 27,3269 3,540,358 100.0 Source: American Public Power Association, 2006-07 Annual Directory & Statistical Report, from Energy Information Administration Form EIA-861, 2004 data. Table 1-3. U.S. Retail Electric Providers, 2004, Revenues from Sales to Ultimate Consumers
Ownership Sales in $ millions
Full-Service Energy only * Delivery Total ** Publicly-owned utilities $37,734 $5,787 $27 $43,548
Investor-owned utilities $162,691 $128 $8,746 $171,565
Cooperatives $25,448 $37 $7 $25,492
Federal Power Agencies $1,211 $13 $1 $1,224
Power Marketers $17,163 $11,000 0 $28,162
Total $244,247 $16,965 $8,761 $269,992
Notes: * Energy-only revenue represents revenue from a utility’s sales of energy outside of its own service territory. ** Total shows the amount of revenue each provider group receives from both bundled (full-service) and unbundled (retail choice) sales to ultimate customers. Eighty-five percent of the energy-only revenue attributed to publicly-owned utilities represents revenue from energy procured for California’s investor-owned utilities by the California Department of Water Resources Electric Fund. Ninety-eight percent of power marketers’ full-service sales and revenues occur in Texas. IOUs in the ERCOT region of Texas no longer report sales or revenue to ultimate consumers on EIA 861. Source: American Public Power Association, 2006-07 Annual Directory & Statistical Report, from Energy Information Administration Form EIA-861, 2004 data
15

Table 1-4. U.S. Electricity Generation, 2004 Thousands of MWhs and Percent of Total
Ownership Generation Percent of Total
(thousands of MWhs)
Publicly-owned utilities
397,110 10.3
Investor-owned utilities
1,734,733 44.8
Cooperatives 181,899 4.7
Federal Power Agencies
278,130 7.2
Power Marketers 42,599 1.1
Nonutilities 1,235,298 31.9
Total 3,869,769 100.0 Source: American Public Power Association, 2006-07 Annual Directory & Statistical Report, from Energy Information Administration Form EIA-861 and EIA-906/920 for generation. Data are for 2004, adjusted for joint ownership. Table 1-5. U.S. Electric Generation Capacity, 2004
Ownership Nameplate Capacity Percent of Total
(in MWs)
Publicly-owned utilities 98,686 9.6
Investor-owned utilities 408,699 39.6
Cooperatives 43,225 4.2
Federal Power Agencies 71,394 6.9
Nonutilities 409,689 39.7
Total 1,031,692 100.0 Source: American Public Power Association, 2006-07 Annual Directory & Statistical Report, from Energy Information Administration Form EIA-860 for capacity, including adjustments for joint ownership. Data are for 2004.
B. Growth of the Electric Power Industry For a variety of legal, economic, and technological reasons, the electric utility industry in the United States developed as a collection of separate, mostly vertically-integrated monopoly franchises with wholesale and retail prices and services extensively regulated under state and federal law. Many states have elected to maintain this model. The legacy of this vertically-integrated monopoly structure creates substantial challenges for state and federal efforts to
16

restructure the industry and to create new institutional arrangements to facilitate increased reliance on competitive market prices. This section provides a brief overview of the evolutionary changes in the electric power industry. 1. The Rise of Electric Utility Monopolies and Public Utility Regulation In the late 19th Century, electric utilities developed as small central station power plants with limited local distribution networks. Franchise rights granted by manufacturers and by municipal governments allowed use of public streets and rights of ways. These franchises were often exclusive, but in some cities there was head-to-head competition among competing electric lighting companies.16 In addition, because lighting, electric motors, and traction were the major uses of electricity, customers could turn to alternatives – natural gas lighting or self-generation in the case of street railway, commercial, and industrial customers.17 Many municipalities elected to create and operate their own electric utility systems. Certain characteristics of providing electric service were recognized early on. Utility systems incurred high fixed costs for investments in generating plants needed to meet peak load and to extend the delivery system. Because they had relatively low operating costs, their profits were determined by the percent of time the power plant was in use. Complementary load diversity – such as balancing daytime traction and electric motor loads with evening lighting loads – could raise generating plant use and revenues to offset fixed costs and boost profits. The high capital costs of electric generating plants made investments risky. Steady gains in generation, transmission, and distribution economies of scale provided incentives to expand the electric networks. Larger plants produced cheaper electricity than many smaller plants. The substantial investment required for electric utility plants also spurred creation of long-term financing structures and the corresponding interest in providing assurances to investors that the entity would be profitable and would remain financially viable long enough to repay the debt. These characteristics led some to suggest that a single monopoly provider of integrated generation, transmission and distribution service could provide electric service most economically and safely. To avoid abuses of this monopoly power, it was suggested that impartial state agencies should be created to award franchises and establish rates and service standards. An early associate of Thomas Edison, Samuel Insull of Chicago Edison was among them and proposed state regulation of private utilities in a speech before the National Electric Light Association in 1898.18 Insull characterized electricity production as a “natural monopoly.”19 Initially, the proposal for state regulation was poorly received, but as private 16 LEONARD S. HYMAN, AMERICA’S ELECTRIC UTILITIES: PAST, PRESENT AND FUTURE 64 (Public Utility Reports, Inc. 1988) [hereinafter HYMAN]. In the City of Chicago, the city council granted 29 different electric franchises between 1882 and 1905; three of them were citywide. 17 For more on the history of electric utilities, see also U.S. Department of Energy, Energy Information Administration, The Changing Structure of the Electric Power Industry: 1970-1991, at 57 (March 1993), available at http://tonto.eia.doe.gov/FTPROOT/electricity/0562.pdf [hereinafter EIA 1970-1991]; U.S. Department of Energy, Energy Information Administration, The Changing Structure of the Electric Power Industry 2000: An Update, Appendix A (October 2000), available at http://www.eia.doe.gov/cneaf/electricity/chg_stru_update/update2000.html [hereafter EIA Update 2000]. 18 HYMAN at 68. 19 In economic literature, the concept of a “natural monopoly” developed over time as a rationalization for the regulation of electric utilities. In brief, a “natural monopoly” is an industry characterized by long-run decreasing costs where a single provider can supply product or service at a lower cost than competition. ALFRED E. KAHN, THE ECONOMICS OF REGULATION: PRINCIPLES AND INSTITUTIONS, Volume 1, at 11-12 (John Wiley & Sons, Inc. 1970). Kahn also notes the substantial legal and historical “public interest” rationale for regulation of the electric utility industry. Economists have debated whether the electric utility industry or segments of it are natural monopolies for several decades. This debate
17
electric companies began to grow and consolidate and concerns were raised over trusts in many industries, the concept began to gain support. In 1907, Wisconsin adopted legislation regulating electric utilities and was quickly joined by two other states. By 1916, 33 states had established state agencies to oversee private electric utilities.20
Generally, under this approach, the state regulatory commission granted exclusive retail electric franchises to private companies within specified territories, protecting the utility from competition. In return, the utility assumed an obligation to provide safe and adequate service to all retail customers within its territory under just and reasonable rates, terms and conditions overseen by the state. Often the utility was authorized to use public rights of way and eminent domain for electric facilities. To meet this obligation to serve, most private utilities built and controlled the generation, transmission, and distribution facilities needed to provide service to customers. Rates were set to cover the companies' reasonable costs plus a fair return on shareholders’ investment. The utility could expect a right to reasonable compensation for its services, although a specific rate of return was not guaranteed. Retail rates (price) were based on the average historical system cost of production (including the investors’ fair return on investment). In the early 20th Century, private electric utilities continued to expand under this system of state regulation. Most continued to build their own generation plants and transmission systems, primarily due to the cost and technological limitations of transmitting electricity over distances.21 Initially, there was little wholesale trade among utilities. As the industry grew, continued improvements in technology allowed expansion beyond central cities, and prices for electricity fell at the same time that demand increased substantially. Over the same period, electric utility holding companies were created and began to acquire local private and municipal utilities. While a holding company’s local utility operating companies were regulated by the state, the holding company and its other affiliates and subsidiaries were not, and often did business in several states. The proliferation, consolidation, and complexity of such companies coincided with a number of financial and securities abuses that were documented in an investigation by the Federal Trade Commission (FTC). These holding companies often became the sole providers of various services and products to their affiliated utilities, and their sometimes inflated costs were passed through to the retail customers. By 1932, the eight largest utility holding companies controlled 73 percent of the investor-owned electric industry.22
This pattern of consolidated ownership and holding company abuses led to calls for federal involvement in the electric power industry. As a result of the FTC findings, Congress passed the Public Utility Holding Company Act of 1935 (PUHCA 1935),23 which required the breakup and focuses on the economic theory rationalization for regulation and not the public policy or legal basis for electric power regulation. See, e.g., Vernon Smith, Regulatory Reform in the Electric Power Industry (1995) (working paper, on file with the Department of Economics, University of Arizona); RICHARD F. HIRSCH, POWER LOSS: THE ORIGINS OF DEREGULATION AND RESTRUCTURING IN THE AMERICAN UTILITY SYSTEM (MIT Press 1999); SHARON BEDER, POWER PLAY: THE FIGHT TO CONTROL THE WORLD’S ELECTRICITY (W.W. Norton 2003). 20 HYMAN at 68. 21 See EIA Update 2000. 22 HYMAN at 74. 23 15 U.S.C. §§ 79a et seq. (2000).
18

stringent federal oversight of the large utility holding companies. The FPA expanded the Federal Power Commission’s authority to include oversight and regulation of interstate sales of wholesale power (e.g., sales of power between utility systems) and interstate electricity transmission at wholesale by “public utilities” (i.e., investor-owned utilities). FPA jurisdiction over interstate sales closed a gap in electric industry regulation that the Supreme Court had identified in 1927.24
When the FPA was enacted, wholesale and interstate sales of electricity were limited. Most wholesale transactions were long-term power supply contracts by investor-owned utilities to sell and deliver power to neighboring public power and cooperative utilities. Over time, utilities became more interconnected via high-voltage transmission networks. Constructed primarily for reliability, these networks also facilitated more opportunities for interstate trade. However, wholesale trade was slow to develop. Until the late 1960s, the vertically integrated monopoly utility model appeared to work reasonably well. Utilities were able to meet increasing demand for electricity at decreasing prices as advances in generation technology and transmission provided increased economies of scale with larger units and decreased costs.25
2. The Energy Crisis of the 1970s, PURPA, and the Expansion of Nonutility Generation and Wholesale Power Markets The shift toward a more competitive marketplace for electricity was precipitated by industry changes that began in the late 1960s and accelerated throughout the 1970s. Resulting financial stresses challenged the continued profitability of the large vertically integrated utility model. They also provoked criticisms of the traditional cost-of-service regulatory model that allowed the pass-through of higher costs and risks of construction to consumers. By the end of the 1960s, electricity demand and generation were increasing at an annual rate of 7.5 percent, and residential rates were declining at an average annual rate of 1.5 percent.26 At the same time, the new large nuclear and coal plants built in the 1970s did not yield the dramatic improvements in economies of scale that earlier technological advances in generating plant size had produced. The industry’s characterization as a long-term decreasing cost industry came into question. Periods of rapid inflation and higher interest rates substantially increased the completion costs of large, base load generating plants.27 New environmental and safety regulations required addition of pollution controls and design features that added to costs and construction time. Moreover, once in operation, many of the new, larger units required more maintenance and longer downtimes than expected. Thus, by the late 1970s, a newer, larger, generation facility no longer could be assumed to be more cost-efficient than a smaller plant.28 24 In Public Utilities Commission of Rhode Island v. Attleboro Steam & Electric Co., 273 U.S. 83 (1927), the Supreme Court ruled that state regulators were barred by the Commerce Clause from setting the prices of electricity sold across state lines. 25 See EIA 1970-1991. 26 EIA Update 2000 at 114-15. 27 The costs of constructing new nuclear plants quadrupled between 1971 and 1976. Over 63 nuclear units were canceled between 1975 and 1980. EIA Update 2000 at 114-15. 28 Order No. 888, FERC Stats. & Regs. ¶ 31,036 at 31,640-41.
19
This experience stimulated interest in smaller, modular, more energy-efficient generating units. One expression of this interest resulted in commercialization of aeroderivative gas turbine technology. This technology allowed smaller generation units to be constructed at lower costs, more quickly, and at less financial risk than large base-load coal and nuclear plants.29 Thus, construction of low-cost generation became an option for utilities that were formerly captive to high-cost generators and emerged as a viable path for new nonutility generators to enter the market. As the difficulties plaguing utilities’ generation construction programs were playing out, utility fuel prices were escalating rapidly in response to the Arab oil embargo of 1973-1974 and subsequent world oil market disruptions. Significantly higher energy prices added to inflation and increased electric rates.30 Other developments also substantially contributed to the growing interest in electric utility reforms. First, the 1965 Northeast power blackout raised concerns about the reliability of weakly coordinated bulk power system operating arrangements among utilities.31 The nuclear accident at the Three Mile Island plant in Pennsylvania on March 28, 1979, heightened concerns over safety and led to stringent new regulatory requirements for nuclear plants. Criticism of the traditional cost-of-service utility regulation model by economists and policy analysts also increased during the 1970s with suggestions for alternate approaches to regulation and changes in industry structure. Critics of cost-based regulation argued that the industry structure limited opportunities for more efficient suppliers to expand, placed insufficient pressure on less efficient suppliers to improve performance, and insulated customers from the cost impacts of energy use.32 Congress enacted the Public Utility Regulatory Policies Act (PURPA) as a response to the energy crises of the 1970s. PURPA’s major goal was to promote energy conservation and alternative energy technologies and to reduce oil and gas consumption through use of improved technology and regulatory reforms. A perhaps unanticipated side effect was that PURPA prompted a number of parties to see potential profits in developing competitive generating plants, creating an opportunity for nonutilities to emerge as important electric power producers.33 PURPA required electric utilities to interconnect with and purchase power from cogeneration facilities and small power producers that met statutory criteria for a qualifying facility (QF). A utility had to pay the QF at the utility’s incremental cost of production. In a departure from cost-based rate approaches, FERC defined this as the utility’s avoided cost of power.34 Box 1-1 29 Id. at 31,641. 30 Id. at 31,639, n.9. 31 The response to the blackout included the formation of regional reliability councils and the North American Electric Reliability Council (NERC) to promote the reliability and adequacy of bulk power supply. EIA Update 2000 at 109. 32 Paul L. Joskow, The Difficult Transition to Competitive Electricity Markets in the U.S. 6-7 (AEI-Brookings Joint Ctr. for Regulatory Studies, Working Paper No. 03-13, 2003), available at http://www.aei-brookings.org/admin/authorpdfs/page.php?id=271 [hereinafter Joskow, Difficult Transition]. 33 See EIA 1970-1991 at 22. 34 PURPA specifically set forth criteria on who and what could qualify as QFs (mainly technology, size, and ownership criteria). Two types of QFs were recognized: cogenerators, which sequentially produce electric energy and another form of energy (such as heat or steam) using the
20
discusses how implementation of PURPA encouraged nonutility generation suppliers by guaranteeing a market for the electricity produced.35 PURPA changed prevailing views that vertically integrated public utilities were the only reliable sources of power36 and showed that nonutilities could build and operate generation facilities effectively and without disrupting the reliability of the electric grid. PURPA contributed substantially, both directly and indirectly, to the creation of an independent competitive generation sector.37
Box 1-1 State Implementation of PURPA
PURPA required states to determine each utility’s avoided costs of production. This cost was used to set the price for purchasing a QF’s power. To encourage renewable and alternative energy generation, several states, including California, New York, Massachusetts, Maine, and New Jersey, required utilities to sign long-term contracts with QFs at prices that eventually ended up being much higher than the utilities’ actual marginal savings of not producing the power itself (avoided costs). As a result, many utilities in these states entered into long-term purchase contracts at prices higher than those available in the competitive wholesale markets. The costs of these QF contracts were reflected in retail rates as cost pass-throughs. The experience added to the dissatisfaction with retail rate regulation.
Before passage of PURPA, nonutility generation was confined primarily to commercial and industrial facilities that generated heat and power for onsite use where it was advantageous to do so. Although nonutility generation facilities were located across the country, development was heavily concentrated geographically, with about two-thirds of such facilities located in California and Texas. Nonutility generation development advanced in states where avoided costs were high enough to attract interest and where natural gas supplies were available. Federal law largely precluded electric utilities from constructing new natural gas plants during the decade following enactment of PURPA, but nonutility generators faced no such restriction and quickly turned to the new smaller gas turbines as the preferred generating technology. The response to PURPA was dramatic. Annual QF filings at FERC rose from 29 applications covering 704 MW in 1980 to 979 in 1986 totaling over 18,000 MW. From 1980 to 1990, FERC received a total of 4,610 QF applications for a total of 86,612 MW of generating capacity.38
Following PURPA, continued improvement in generating technology lowered costs and further contributed to an influx of new entrants in wholesale markets. They could sell electric power same fuel source, and small power producers, which use waste, renewable energy, or geothermal energy as a primary energy source. See EIA 1970-1991 at 5. 35 Id. at 24. 36 Order No. 888, FERC Stats. & Regs. ¶ 31,036 at 31,642. 37 See Paul L. Joskow, Deregulation and Regulatory Reform in the U.S. Electric Power Sector, at 17 (February 16, 2000) (revised discussion draft prepared for the Brookings-AEI Conference on Deregulation in Network Industries, Dec. 9-10, 1999) [hereinafter Joskow, Deregulation]. 38 CONG. RESEARCH SERV., COMM. ON ENERGY AND COMMERCE, 102D CONG., ELECTRICITY: A NEW REGULATORY ORDER? 92 (Comm. Print 1991).
21

profitably with smaller scale generators, including renewable energy technologies and more efficient, modular gas turbines.39 Other nonutilities that could not meet QF criteria began building new capacity to compete in bulk power markets to meet the needs of utilities.40 These new entities were known as merchant generators or independent power producers (IPPs).41 By 1991, nonutilities (QFs and IPPs) owned about 6 percent of the electric generating capacity and produced about 9 percent of the total electricity generated in the United States.42 Nonutility facilities accounted for one-fifth of all additions to generating capacity in the 1980s.43 Beginning in the 1980s, FERC allowed many new utility and nonutility generators to sell electricity at rates negotiated in wholesale markets, rather than established under cost-of-service formulas.44
In 1988, FERC solicited public comments on three notices of proposed rulemaking (NOPRs) dealing with electricity pricing in wholesale transactions. These NOPRs addressed the following issues: (1) competitive bidding for new power requirements; (2) treatment of independent power producers; and (3) determination of avoided costs under PURPA.45 These proposals would have moved FERC towards greater use of a “non-traditional” market-based pricing approach in ratemaking as opposed to the agency’s “traditional” cost-based approach. The NOPRs, however, proved controversial, and efforts to establish formal rules or policies were abandoned. However, the overall policy goals were still pursued on a case-by-case basis. Between 1983 and 1991, FERC was asked to approve more than 30 non-traditional market-based rate proposals. These proposals were brought by IPPs, power brokers/marketers, utility-affiliated power producers, and traditional franchised utilities. FERC approved all but four.46 In explaining its approach, FERC staff wrote: “The Commission has accepted non-traditional rates where the seller or its affiliate lacked or had mitigated market power over the buyer, and there was no potential abuse of affiliate relationships which might directly or indirectly influence the market price and no potential abuse of reciprocal dealing between the buyer and seller.”47 In determining whether the seller could exercise market power over the buyer, FERC considered
39 Order No. 888, FERC Stats. & Regs. ¶ 31,036 at 31,644. 40 Joskow, Deregulation at 19. 41 Order No. 888, FERC Stats. & Regs. ¶ 31,036 at 31,642. 42 EIA 1970-1991 at vii. 43 Id. at 27. 44 See Order No. 888, FERC Stats. & Regs. ¶ 31,036 at 31,643. 45 See Regulations Governing Bidding Programs, Notice of Proposed Rulemaking, 53 Fed. Reg. 9,324 (Mar. 22, 1988), FERC Stats. & Regs. ¶ 32,455 (1988) (modified by 53 Fed. Reg. 16,882 (May 12, 1988)). This proposal would have adopted competitive bidding into the process of acquiring and pricing power from QFs and would have largely abandoned the prior avoided cost purchase rates.
See Regulations Governing Independent Power Producers, Notice of Proposed Rulemaking, 53 Fed. Reg. 9,327 (Mar. 22, 1988), FERC Stats. & Regs. ¶ 32,456 (1988) (modified by 53 Fed. Reg. 16882 (May 12, 1988)). This proposal would have relaxed rate review and regulation of wholesale sales by independent power producers, and other public utilities that did not operate retail distribution systems.
See Administrative Determination of Full Avoided Costs, Sales of Power to Qualifying Facilities, and Interconnection Facilities, Notice of Proposed Rulemaking, 53 Fed. Reg. 9,331 (Mar. 22 1988), FERC Stats. & Regs. ¶ 32,457 (1988) (modified by 53 Fed. Reg. 16882 (May 12, 1988)). This proposal would have revised the elements used in making administrative determinations of avoided costs for rates for utilities’ PURPA QF purchases. 46 Hearing on National Energy Security Act of 1991 (Title XV) Before the S. Comm. on Energy and Natural Resources, 102d Cong. 97 (1991) (statement of Cynthia A. Marlette, Associate General Counsel for Hydroelectric and Electric, Federal Energy Regulatory Commission). 47 Id. at 100.
22
whether the seller or its affiliates owned or controlled transmission that might prevent the buyer from accessing other power sources. A seller with transmission control might be able to force the buyer to purchase from the seller, thus limiting competition and significantly influencing price. The FPA does not allow rates to reflect an exercise of such market power.48
FERC recognized the potential for control of transmission to create market power and the challenge such control created in moving to greater reliance on market-based rates. FERC staff told Congress, “Because the Commission’s very premise of finding market-based rates just and reasonable under the FPA is the absence or mitigation of market power, or the existence of a workably competitive market, and because the FPA mandates that the Commission prevent undue preference and undue discrimination, we believe the Commission is legally required to prevent abuse of transmission control and affiliate or any other relationships which may influence the price charged a ratepayer.”49
Despite these developments, two limitations at that time were perceived to discourage competitive wholesale generation markets. First, IPPs and other generators of cheaper electric power could not easily access the transmission grid to reach potential customers.50 Under the FPA as then written, FERC had limited authority to order access. FERC would subsequently find that "intervening" transmitting utilities would deny or limit transmission service to competing suppliers of generation to protect demand for wholesale power supplied by their own facilities.51 Second, unlike QFs that enjoyed a statutory exemption under PURPA, IPPs were subject to PUHCA 1935, which discouraged nonutilities from entering the generation business.52 3. The Energy Policy Act of 1992 and FERC Orders Nos. 888 and 889 EPAct 1992 amended the FPA and PUHCA 1935 to address what were then seen as the two major limitations to the development of a competitive generation sector. First, EPAct 1992 created a new category of power producers, called exempt wholesale generators (EWGs).53 An EWG is an entity that directly, or indirectly through one or more affiliates, owns or operates facilities dedicated exclusively to producing electric power for sale in wholesale markets.54 EWGs are exempted from PUHCA 1935 regulations, thus eliminating a 48 Id. 49 Id. at 102. 50 Order No. 888, FERC Stats. & Regs. ¶ 31,036 at 31,642-43. 51 Joskow, Deregulation at 21. See Order No. 888, FERC Stats. & Regs. ¶ 31,036 at 31,644. 52 Joskow, Deregulation at 23. Under PUHCA 1935, those public utility holding companies that did not qualify for an exemption were subject to extensive regulation of their financial activities and operations. These regulations limited the availability of exemptions and the growth and expansion of electric utility companies. PUHCA 1935 restricted utility operations to a single integrated public-utility system and prevented utility holding companies from owning other businesses that were not reasonably incidental or functionally related to the utility business. Further, registered holding companies had to obtain Securities and Exchange Commission (SEC) approval for the sale and issuance of securities, for transactions among their affiliates and subsidiaries and for services, sales, and construction contracts, and they were required to file extensive financial reports with the SEC.
Although PUHCA 1935 provided for limited exemptions, it was long criticized as discouraging new investment in the electric utility industry by nonutility entities. Mergers and acquisitions of utilities subject to PUHCA 1935 have largely been by other domestic and foreign utilities. Investment by entities outside the industry has been limited, as these entities avoid the extensive regulations imposed by PUHCA 1935. 53 Order No. 888, FERC Stats. & Regs. ¶ 31,036 at 31,645. 54 Joskow, Deregulation at 24.
23
major barrier for utility-affiliated and nonaffiliated power producers that wanted to build or acquire new non-rate-based power plants to sell electricity at wholesale.55
Second, EPAct 1992 expanded FERC’s authority to order transmitting utilities to provide transmission service for wholesale power sales to any electric utility, federal power marketing agency, or any person generating electric energy.56 It provided for orders to be issued on a case-by-case basis following a hearing if certain protective conditions were met. Although FERC implemented this new mandatory wheeling authority, it ultimately concluded that procedural limitations restricted its reach and a broader remedy was needed to eliminate pervasive undue discrimination in transmission service that hindered competition in wholesale markets. In April 1996, FERC adopted Order No. 888 in exercise of its statutory obligation under the FPA to remedy undue transmission discrimination. The goal was to ensure that transmission owners do not use their transmission facility monopoly to unduly discriminate against IPPs and other sellers of electric power in wholesale markets. In Order No. 888, FERC found that undue discrimination and anti-competitive practices existed in transmission service provided by public utilities in interstate commerce. FERC determined that non-discriminatory open access transmission service was an appropriate remedy and one of the most critical components of a successful transition to competitive wholesale electricity markets. Accordingly, FERC required all public utilities that own, control or operate facilities used for transmitting electric energy in interstate commerce to file open access transmission tariffs (OATTs) containing certain non-price terms and conditions. They also were required to “functionally unbundle” wholesale power services from transmission services.57 This meant that a public utility was required to: (1) take wholesale transmission services under the same tariff of general applicability as it offered its customers; (2) define separate rates for wholesale generation, transmission and ancillary services; and (3) rely on the same electronic information network that its transmission customers rely on to obtain information about the utility’s transmission system.58
Concurrent with Order No. 888, FERC issued Order No. 88959 that imposed standards of conduct governing communications between a utility’s transmission and wholesale power functions to prevent the utility from giving its power marketing arm preferential access to transmission information. Order No. 889 requires each public utility that owns, controls, or operates facilities used for the transmission of electric energy in interstate commerce to create or participate in an Open Access Same-Time Information System (OASIS). OASIS must provide information regarding available transmission capacity, prices, and other information that will
55 See EIA 1970-1991 at 30; Joskow, Deregulation at 23. 56 Pub. L. No. 102-486, §§ 721-26, 106 Stat. 2776 (1992). 57 Order No. 888, FERC Stats. & Regs. ¶ 31,036, at ¶ 31,654. 58 Id. Order No. 888 also clarified FERC's interpretation of the federal/state jurisdictional boundaries over transmission and local distribution. While it reaffirmed that FERC has exclusive jurisdiction over the rates, terms, and conditions of unbundled retail transmission in interstate commerce by public utilities, it nevertheless recognized the legitimate concerns of state regulatory authorities for the development of competition within their states. FERC therefore declined to extend its unbundling requirement to the transmission component of bundled retail sales and reserved judgment on whether its jurisdiction extends to such transactions. The United States Supreme Court affirmed this element of Order No. 888. New York v. FERC, 535 U.S. 1 (2002). 59 Open Access Same-Time Information System (Formerly Real-Time Information Networks) and Standards of Conduct, Order No. 889, 61 Fed. Reg. 21,737 (May 10, 1996), FERC Stats. & Regs. ¶ 31,035 at 31,583 (1996), order on reh'g, Order No. 889-A, FERC Stats. & Regs. ¶ 31,049 (1997), order on reh'g, Order No. 889-B, 81 FERC ¶ 61,253 (1997).
24
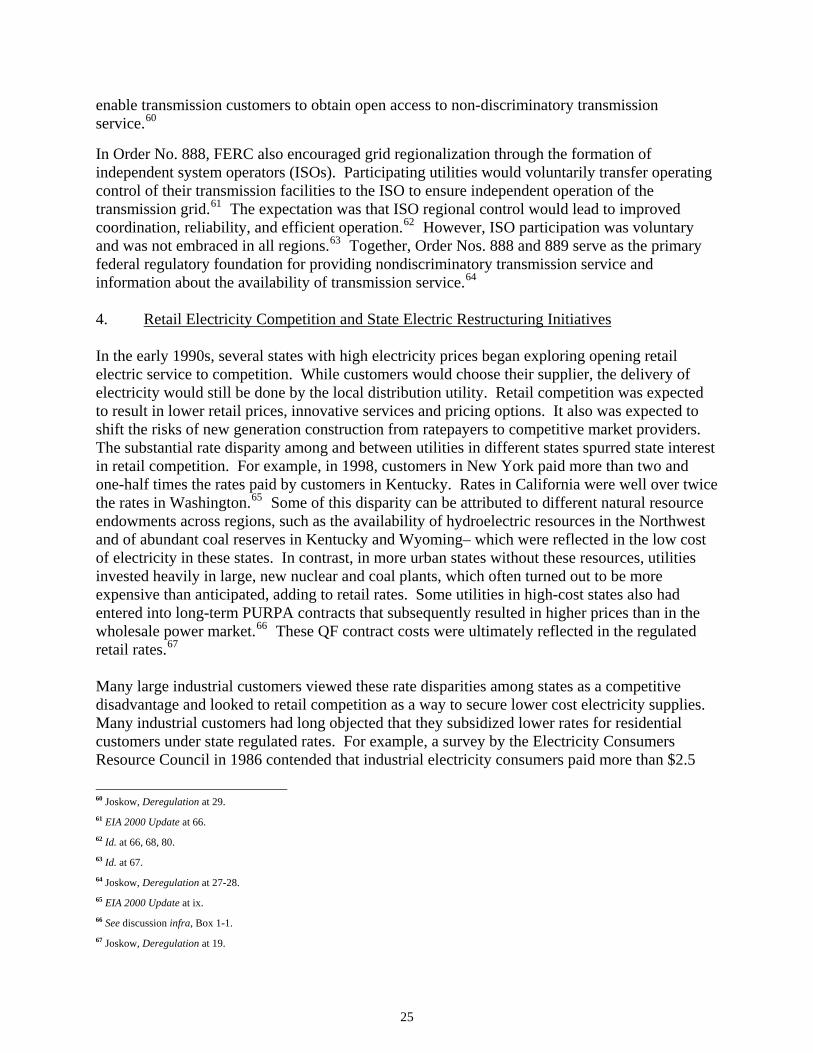
enable transmission customers to obtain open access to non-discriminatory transmission service.60 In Order No. 888, FERC also encouraged grid regionalization through the formation of independent system operators (ISOs). Participating utilities would voluntarily transfer operating control of their transmission facilities to the ISO to ensure independent operation of the transmission grid.61 The expectation was that ISO regional control would lead to improved coordination, reliability, and efficient operation.62 However, ISO participation was voluntary and was not embraced in all regions.63 Together, Order Nos. 888 and 889 serve as the primary federal regulatory foundation for providing nondiscriminatory transmission service and information about the availability of transmission service.64
4. Retail Electricity Competition and State Electric Restructuring Initiatives In the early 1990s, several states with high electricity prices began exploring opening retail electric service to competition. While customers would choose their supplier, the delivery of electricity would still be done by the local distribution utility. Retail competition was expected to result in lower retail prices, innovative services and pricing options. It also was expected to shift the risks of new generation construction from ratepayers to competitive market providers. The substantial rate disparity among and between utilities in different states spurred state interest in retail competition. For example, in 1998, customers in New York paid more than two and one-half times the rates paid by customers in Kentucky. Rates in California were well over twice the rates in Washington.65 Some of this disparity can be attributed to different natural resource endowments across regions, such as the availability of hydroelectric resources in the Northwest and of abundant coal reserves in Kentucky and Wyoming– which were reflected in the low cost of electricity in these states. In contrast, in more urban states without these resources, utilities invested heavily in large, new nuclear and coal plants, which often turned out to be more expensive than anticipated, adding to retail rates. Some utilities in high-cost states also had entered into long-term PURPA contracts that subsequently resulted in higher prices than in the wholesale power market.66 These QF contract costs were ultimately reflected in the regulated retail rates.67 Many large industrial customers viewed these rate disparities among states as a competitive disadvantage and looked to retail competition as a way to secure lower cost electricity supplies. Many industrial customers had long objected that they subsidized lower rates for residential customers under state regulated rates. For example, a survey by the Electricity Consumers Resource Council in 1986 contended that industrial electricity consumers paid more than $2.5
60 Joskow, Deregulation at 29. 61 EIA 2000 Update at 66. 62 Id. at 66, 68, 80. 63 Id. at 67. 64 Joskow, Deregulation at 27-28. 65 EIA 2000 Update at ix. 66 See discussion infra, Box 1-1. 67 Joskow, Deregulation at 19.
25
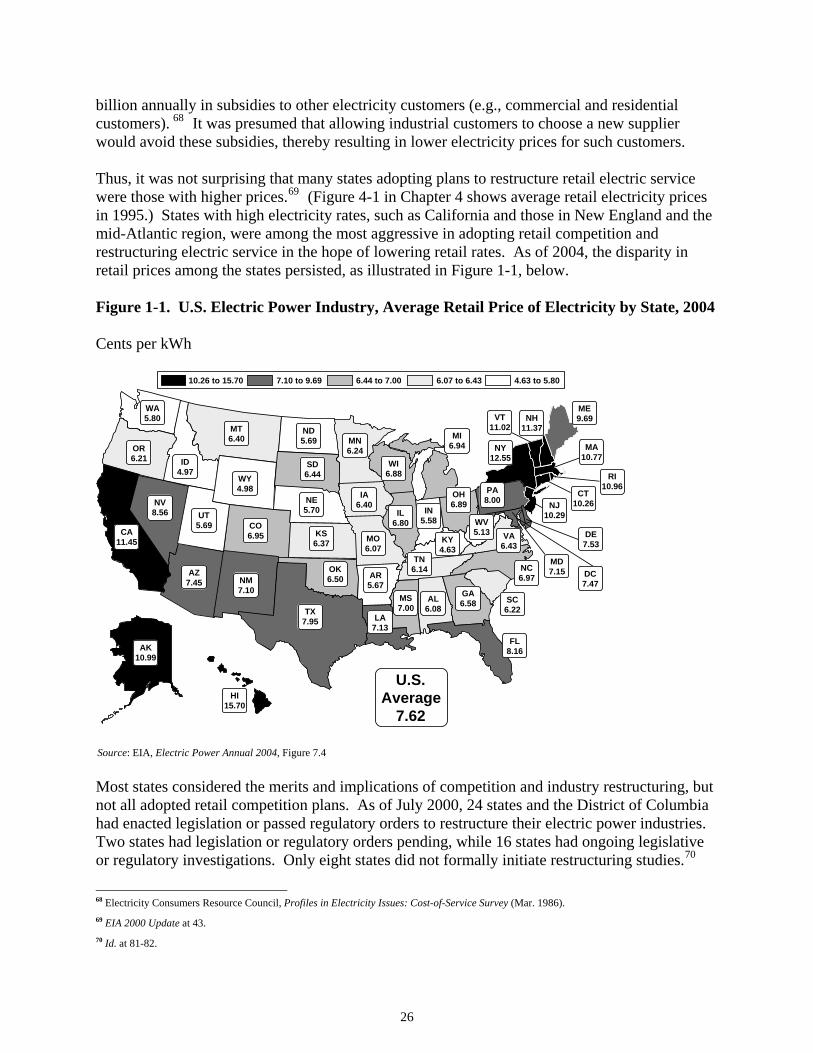
billion annually in subsidies to other electricity customers (e.g., commercial and residential customers). 68 It was presumed that allowing industrial customers to choose a new supplier would avoid these subsidies, thereby resulting in lower electricity prices for such customers. Thus, it was not surprising that many states adopting plans to restructure retail electric service were those with higher prices.69 (Figure 4-1 in Chapter 4 shows average retail electricity prices in 1995.) States with high electricity rates, such as California and those in New England and the mid-Atlantic region, were among the most aggressive in adopting retail competition and restructuring electric service in the hope of lowering retail rates. As of 2004, the disparity in retail prices among the states persisted, as illustrated in Figure 1-1, below. Figure 1-1. U.S. Electric Power Industry, Average Retail Price of Electricity by State, 2004 Cents per kWh
AL6.08
AK10.99
AZ7.45
AR5.67
CA11.45
CO6.95 DE
7.53
DC7.47
FL8.16
GA6.58
HI15.70
ID4.97
IL6.80
IN5.58
IA6.40
KS6.37 KY
4.63
LA7.13
ME9.69
MD7.15
MA10.77
MI6.94MN
6.24
MO6.07
MT6.40
NE5.70
NV8.56
NH11.37
NM7.10
NY12.55
NC6.97
ND5.69
OH6.89
OK6.50
OR6.21
PA8.00
RI10.96
SD6.44
TN6.14
TX7.95
UT5.69
VT11.02
VA6.43
WA5.80
WV5.13
WI6.88WY
4.98
U.S.Average
7.62
SC6.22
CT10.26NJ
10.29
MS7.00
7.10 to 9.69 6.44 to 7.00 6.07 to 6.43 4.63 to 5.8010.26 to 15.70
Source: EIA, Electric Power Annual 2004, Figure 7.4 Most states considered the merits and implications of competition and industry restructuring, but not all adopted retail competition plans. As of July 2000, 24 states and the District of Columbia had enacted legislation or passed regulatory orders to restructure their electric power industries. Two states had legislation or regulatory orders pending, while 16 states had ongoing legislative or regulatory investigations. Only eight states did not formally initiate restructuring studies.70
68 Electricity Consumers Resource Council, Profiles in Electricity Issues: Cost-of-Service Survey (Mar. 1986). 69 EIA 2000 Update at 43. 70 Id. at 81-82.
26
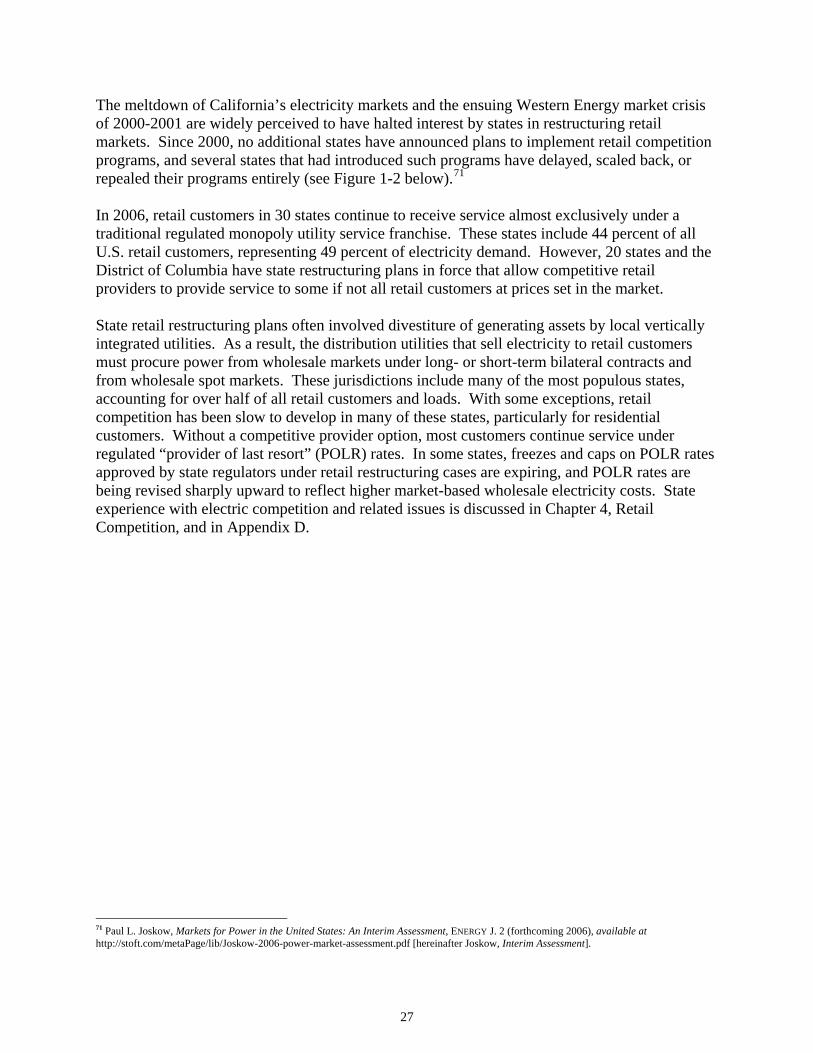
The meltdown of California’s electricity markets and the ensuing Western Energy market crisis of 2000-2001 are widely perceived to have halted interest by states in restructuring retail markets. Since 2000, no additional states have announced plans to implement retail competition programs, and several states that had introduced such programs have delayed, scaled back, or repealed their programs entirely (see Figure 1-2 below).71 In 2006, retail customers in 30 states continue to receive service almost exclusively under a traditional regulated monopoly utility service franchise. These states include 44 percent of all U.S. retail customers, representing 49 percent of electricity demand. However, 20 states and the District of Columbia have state restructuring plans in force that allow competitive retail providers to provide service to some if not all retail customers at prices set in the market. State retail restructuring plans often involved divestiture of generating assets by local vertically integrated utilities. As a result, the distribution utilities that sell electricity to retail customers must procure power from wholesale markets under long- or short-term bilateral contracts and from wholesale spot markets. These jurisdictions include many of the most populous states, accounting for over half of all retail customers and loads. With some exceptions, retail competition has been slow to develop in many of these states, particularly for residential customers. Without a competitive provider option, most customers continue service under regulated “provider of last resort” (POLR) rates. In some states, freezes and caps on POLR rates approved by state regulators under retail restructuring cases are expiring, and POLR rates are being revised sharply upward to reflect higher market-based wholesale electricity costs. State experience with electric competition and related issues is discussed in Chapter 4, Retail Competition, and in Appendix D. 71 Paul L. Joskow, Markets for Power in the United States: An Interim Assessment, ENERGY J. 2 (forthcoming 2006), available at http://stoft.com/metaPage/lib/Joskow-2006-power-market-assessment.pdf [hereinafter Joskow, Interim Assessment].
27
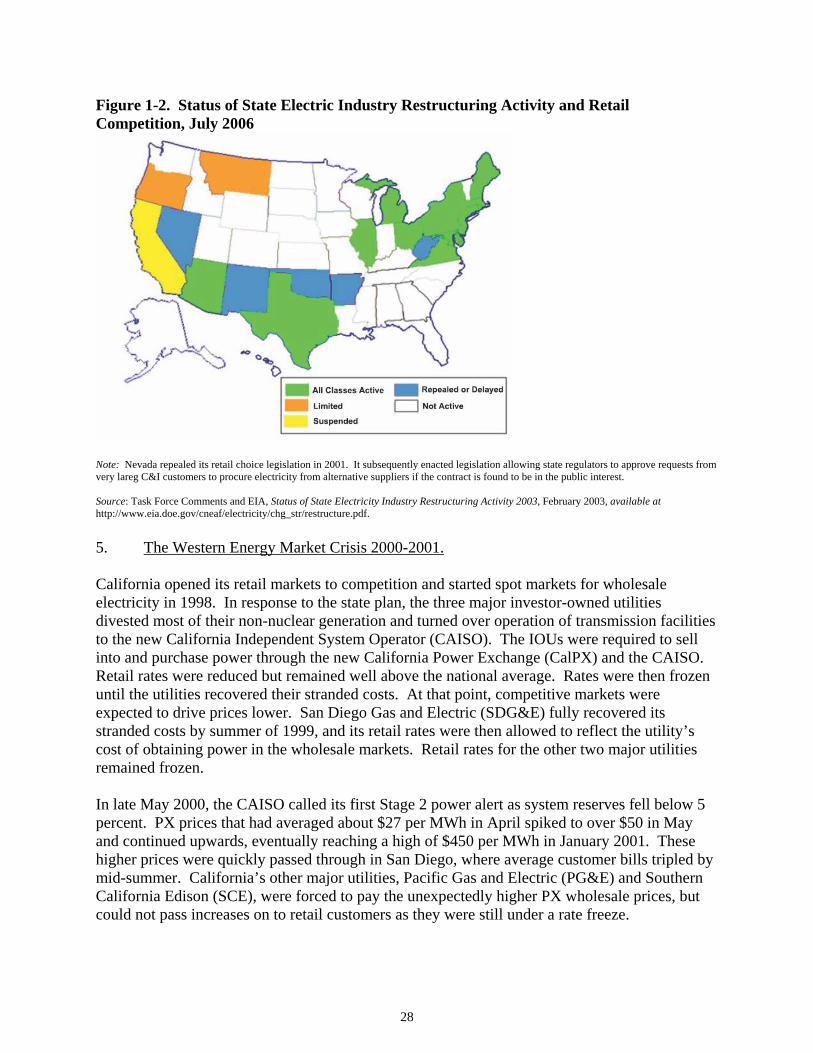
Figure 1-2. Status of State Electric Industry Restructuring Activity and Retail Competition, July 2006
Note: Nevada repealed its retail choice legislation in 2001. It subsequently enacted legislation allowing state regulators to approve requests from very lareg C&I customers to procure electricity from alternative suppliers if the contract is found to be in the public interest. Source: Task Force Comments and EIA, Status of State Electricity Industry Restructuring Activity 2003, February 2003, available at http://www.eia.doe.gov/cneaf/electricity/chg_str/restructure.pdf. 5. The Western Energy Market Crisis 2000-2001. California opened its retail markets to competition and started spot markets for wholesale electricity in 1998. In response to the state plan, the three major investor-owned utilities divested most of their non-nuclear generation and turned over operation of transmission facilities to the new California Independent System Operator (CAISO). The IOUs were required to sell into and purchase power through the new California Power Exchange (CalPX) and the CAISO. Retail rates were reduced but remained well above the national average. Rates were then frozen until the utilities recovered their stranded costs. At that point, competitive markets were expected to drive prices lower. San Diego Gas and Electric (SDG&E) fully recovered its stranded costs by summer of 1999, and its retail rates were then allowed to reflect the utility’s cost of obtaining power in the wholesale markets. Retail rates for the other two major utilities remained frozen. In late May 2000, the CAISO called its first Stage 2 power alert as system reserves fell below 5 percent. PX prices that had averaged about $27 per MWh in April spiked to over $50 in May and continued upwards, eventually reaching a high of $450 per MWh in January 2001. These higher prices were quickly passed through in San Diego, where average customer bills tripled by mid-summer. California’s other major utilities, Pacific Gas and Electric (PG&E) and Southern California Edison (SCE), were forced to pay the unexpectedly higher PX wholesale prices, but could not pass increases on to retail customers as they were still under a rate freeze.
28
Price spikes were not California’s only problems. On June 14, 2000, the CAISO imposed rolling blackouts in PG&E’s San Francisco service area because of shortages attributed to the maintenance shutdown of several generating plants. These were the first of many power emergencies and blackouts affecting the state that did not end until July 2001. Responding to public concern, the California Public Utilities Commission, the state’s attorney general, and FERC all launched investigations. On August 2, 2000, SDG&E filed a complaint at FERC against all sellers in the PX and ISO markets and asked for a price cap of $250.72 FERC opened a formal investigation of wholesale pricing in California and the West in general. A preliminary FERC staff report in November 2000 found that the market rules and structure were “seriously flawed” and, coupled with supply and demand imbalance, could result in rates that were not “just and reasonable.”73 The staff report concluded that the state’s market structure created the potential for abuse of market power when supplies were tight. FERC proposed interim emergency remedies that were instituted in December 2000.74 As the state’s market problems continued and spread, price spikes affected electricity pricing hubs and utilities across the West, including states that had not adopted retail competition and that were not included in the CAISO. The region’s increased power costs were estimated in the tens of billions and led to retail rate increases in many Western states.75 California declared multiple power emergencies in December 2000, followed by blackouts in January and March 2001. High wholesale market prices that utilities were not allowed to recover through retail rates threatened the solvency of the state’s three major IOUs. California sought to end the procurement difficulties faced by IOUs in the state by entering into long-term contracts to secure power on behalf of the utilities and to preserve service to retail customers. Contract prices were set at some of the highest prices prevailing over this period.76 As a condition of assuming responsibility for power procurement, the state suspended retail competition for all but large customers that already had contracts with competitive suppliers. In April, PG&E’s retail electric utility subsidiary, one of the largest in the nation, filed for bankruptcy protection, later joined by a number of wholesale seller-creditors, because the financially distressed distribution utilities did not make timely payments to these generators. Power prices did not return to “normal” ranges until fall of 2001. Over this period, FERC issued a number of orders setting and lowering price caps, establishing market monitoring requirements, and opening an investigation of possible market manipulation in the run-up of natural gas prices in the West. State, federal, and private investigations ultimately uncovered a number of market abuses and regulatory gaps.77 Many FERC and other
72 Federal Energy Regulatory Commission, The Western Energy Crisis, the Enron Bankruptcy, and FERC’s Response, available at http://www.ferc.gov/industries/electric/indus-act/wec/chron/chronology.pdf. 73 Id. 74 Id. 75 For example, the Idaho PUC commented that the pass-through power cost adjustment portion of retail rates increased between 30 to 50 percent as a direct result of the impacts of the Western energy crisis. Idaho PUC comments. 76 See discussion infra, Box 4-3. 77 See, e.g., California Attorney General, Energy White Paper: A Law Enforcement Perspective on the California Energy Crisis, Recommendations for Improving Enforcement and Protecting Consumers in Deregulated Energy Markets (April 2004), available at http://ag.ca.gov/publications/energywhitepaper.pdf [hereinafter Cal. Atty Gen. White Paper]; Federal Energy Regulatory Commission, Final Report on Price Manipulation in Western Energy Markets: Fact Finding Investigation of Potential Manipulation of Electric and Natural Gas
29
proceedings arising out of the dysfunctional California markets continue today.78 A number of energy traders eventually faced criminal charges. The 2000-2001 Western Energy Crisis had wide repercussions as other regions adapted their market rules and structures to avoid the problems encountered in the West.
6. Development of Regional Transmission Organizations and Regional Wholesale Markets After issuing Order Nos. 888 and 889, FERC continued to receive complaints about transmission owners discriminating against independent generating companies. Transmission customers remained concerned that implementation of functional unbundling did not produce complete separation between operating the transmission system and marketing and selling electric power in wholesale markets. There were also concerns that Order No. 888 made some discriminatory behavior in transmission access more subtle and difficult to identify and document. After FERC issued Order Nos. 888 and 889, the electric industry continued to evolve in response to competitive pressures and state retail restructuring initiatives. Utilities today purchase more wholesale power to meet load than in the past and are relying more on availability of other utility transmission facilities to deliver power. Retail competition increased significantly, and state initiatives brought about the divestiture of generation plants by traditional electric utilities. In addition, there were a number of mergers among traditional electric utilities and among electric utilities and gas pipeline companies. The number of power marketers and independent generation developers increased dramatically, and ISOs were established to manage large parts of the transmission system. Trade in wholesale power markets has increased significantly, and the nation's transmission grid is now used more heavily and in new ways. In December 1999, responding to continuing complaints of discrimination and lack of transmission availability, FERC issued Order No. 2000.79 This order recognized that Order No. 888 set up the foundation for competitive electric markets, but did not eliminate the potential to engage in undue discrimination and preference in providing transmission service.80 FERC concluded that regional transmission organizations (RTOs) could eliminate transmission rate pancaking,81 increase region-wide reliability, and eliminate any residual discrimination in transmission services where operation of the transmission system remains in the control of a vertically integrated utility. Accordingly, FERC encouraged voluntary formation of RTOs.
Prices, Docket No. PA02-2-000 (March 26, 2003); U.S. General Accounting Office, Restructured Electricity Markets, California Market Design Enabled Exercise of Market Power (June 2002), available at http://www.gao.gov/new.items/d02828.pdf; Lockyer v. FERC, 383 F.3d 1006 (9th Cir., 2004); U.S. Senate, Committee on Governmental Affairs, Committee Staff Investigation of the Federal Energy Regulatory Commission’s Oversight of Enron Corp (November 2002), available at http://hsgac.senate.gov/_files/111202fercmemo.pdf. 78 For more on FERC proceedings, see the FERC webpage, “Addressing the 2000-2001 Western Energy Crisis,” at http://www.ferc.gov/industries/electric/indus-act/wec.asp. 79 Regional Transmission Organizations, Order No. 2000, FERC Stats. & Regs. ¶ 31,089, 65 Fed. Reg. 809 (Jan. 6, 2000), order on reh’g, Order No. 2000-A, FERC Stats. & Regs. ¶ 31,092, 65 Fed. Reg. 12,088 (March 8, 2000), aff'd, Public Utility District No. 1 v. FERC, 272 F.3d 607 (D.C. Cir. 2001) [hereinafter Order No. 2000]. 80 In Order No. 2000, FERC found that “opportunities for undue discrimination continue to exist that may not be remedied adequately by [the] functional unbundling [remedy of Order No. 888].” Order No. 2000, FERC Stats. & Regs. ¶ 31,089 at 31,105. 81 The term “rate pancaking” refers to circumstances in which a transmission customer must pay separate access charges for each utility service territory crossed by the customer's contract path.
30

RTOs are entities set up in response to FERC Order Nos. 888 and 2000 encouraging utilities to voluntarily enter into arrangements to operate and plan regional transmission systems on a nondiscriminatory open access basis. RTOs are independent entities that control and operate regional electric transmission grids for the purpose of promoting efficiency and reliability in the operation and planning of the transmission grid and for ensuring non-discrimination in the provision of electric transmission services. RTOs currently do not own transmission.82
FERC has approved RTOs or ISOs in several regions including the Northeast (PJM, New York ISO, ISO-New England), California, the Midwest (MISO) and the Southwest (SPP), as shown in Figure 1-3 below. By the end of 2004, regions accounting for 68 percent of all economic activity in the United States had chosen the RTO option.83 In 2004 and 2005, the PJM RTO grid expanded substantially to include several additional service territories in the Midwest. In 2004, the territories served by Commonwealth Edison (ComEd), American Electric Power (AEP), and Dayton Power and Light joined PJM. The expansion continued in 2005 with the addition of Duquesne Light and Dominion Resources. PJM now covers about 18 percent of total electricity consumption in the United States and includes utility service territories in the Mid-Atlantic, Midwest, and parts of the Southeast.84
In most cases, RTOs have assumed responsibility to calculate the amount of available transfer capability (ATC) for wholesale trades for member systems across the footprint of the RTO. RTOs also are responsible for coordinating regional planning, at least for facilities necessary for reliability above a certain voltage. As of 2004, all RTOs coordinate dispatch of generators in their systems and provide transmission services under a single RTO open access tariff. In addition to operating the regional transmission grid, RTOs operate regional organized energy markets, including a short-term market which prices energy, congestion, and losses. RTOs in the East offer day-ahead and real-time markets, while California and Texas offer real-time markets alone. All current RTOs use or plan to use some form of locational pricing to manage transmission congestion and have independent market monitors that assess and report on market activities.85 RTOs and regional wholesale markets are described in more detail in Chapter 3. 82 Although RTOs do not now own transmission facilities, they are not precluded by regulation from doing so. FERC’s Order No. 2000 allows RTOs that are independent transcos – transmission-owning RTOs that do not own or operate generation and are not affiliated with generation owners or operators. Order No. 2000, FERC Stats. & Regs. ¶ 31,089 at 31,036-37. 83 Federal Energy Regulatory Commission, Office of Market Oversight and Investigations, State of the Markets Report: An Assessment of Energy Markets in the United States in 2004, at 51 (2005) [hereinafter FERC State of the Markets Report 2004], available at http://www.ferc.gov/legal/staff-reports.asp. 84 Id. at 53. 85 Id. at 52.
31

Figure 1-3. RTO Configurations in 2006
Note: The above map shows the general location of approved RTOs. Not all transmitting utilities within the shaded area of an RTO are necessarily members of the RTO and some RTO members are not shown in this map. Source: FERC RTO Regional Map, 2006, created using Platts POWERmap, available at http://www.ferc.gov/industries/electric/indus-act/rto/rto-map.asp The RTO model and regional organized wholesale markets have been voluntarily adopted by utilities and market participants in the Northeast, Mid-Atlantic, California, and parts of the Midwest and Southwest. Some states required RTO participation as part of restructuring under the state retail competition plan. RTO members include utilities in states that have not adopted retail competition. State regulators often serve on RTO advisory bodies and have been active in FERC proceedings involving RTOs. Although RTOs enjoy broad participation by utilities and competitive power suppliers, some comments filed with the Task Force86 raised concerns over perceived high costs of RTO implementation and operations and oversight of RTO markets. In other regions, including most of the Southeast, the West outside of California, and other parts of the Midwest, RTOs have been considered, but formation has stalled. State regulators and utilities in these regions have found it difficult to assess the potential benefits and costs of establishing RTOs. They have been reluctant to create new institutional arrangements that could diminish local control over transmission facilities and could impose additional costs on retail customers.
86 See, e.g., APPA comments (2); NRECA comments (2); Alliance of State Leaders Protecting Electricity Consumers comments (2); Wisconsin Load Serving Entities comments (2); Progress and Santee Cooper comments (2).
32
7. August 2003 Blackout On August 14, 2003, an electrical outage in Ohio precipitated a cascading blackout across seven other states and as far north as Ontario, Canada, leaving more than 50 million people without power.87 The August 2003 blackout was the largest in United States history, leaving some parts of the nation without power for up to four days and costing between $4 billion and $10 billion.88 It affected large portions of the Midwest and Northeast United States and Ontario and an estimated 61,800 MWs of load. It was the eighth major blackout in North America since the 1965 Northeast Blackout. A Joint U.S.-Canada Power System Outage Task Force issued a final Blackout Report in April 2004. The report identified factors that were common to some of the eight major outages from 1965 through the 2003, as shown below:
(1) conductor contact with trees; (2) overestimation of dynamic reactive output of system generators; (3) inability of system operators or coordinators to visualize events on the entire system; (4) failure to ensure that system operation was within safe limits; (5) lack of coordination on system protection; (6) ineffective communication; (7) lack of “safety nets;” and (8) inadequate training of operating personnel.89
In addition to the Joint Study, affected states and NERC90 carried out their own investigations.
8. The Energy Policy Act of 2005 In August 2005, Congress passed EPAct 2005, which amended the core statutes (FPA, PURPA, PUHCA 1935) governing the electric power industry. Among the notable provisions of EPAct 2005 are the following:
Reliability: Section 1211 authorizes FERC to certify an Electric Reliability Organization to propose and enforce reliability standards for the bulk power system. EPAct 2005 authorized penalties for violation of these mandatory standards.
Transmission Siting: Section 1221 requires the Secretary of Energy to conduct a study of
electricity congestion within one year of the enactment of EPAct 2005 and every three years thereafter. It authorizes the Secretary of Energy to designate certain areas experiencing congestion as “National Interest Electric Transmission Corridors” based on these studies. In certain limited circumstances, FERC is authorized to approve construction permits for transmission facilities in designated corridors when states either lack such authority, or withhold approval for more than one year after filing of an application or corridor designation. Proponents of this new federal authority argue that it
87 U.S. Canada Power System Outage Task Force, Final Report on the August 14, 2003 Blackout in the United States and Canada: Causes and Recommendations (April 2004), at 1. 88 Id. In contrast, the November 1965 Northeast Blackout resulted in the loss of over 20,000 MWs of load and affected 30 million people. 89 Id. at 107. 90 See, e.g., New York State Public Service Commission, NYPSC Staff Second Report on the August 13-14, 2003 Blackout (November 2005), available at http://www.dps.state.ny.us. Also, see the NERC blackout website materials, available at http://www.nerc.com/~filez/blackout.html, and the reports of the Michigan Public Service Commission, available at http:www.michigan.gov/mpsc.
33

will facilitate construction of new transmission and help alleviate transmission congestion that can impair competition in electric markets.
Transmission Investment Incentives: Section 1241 requires FERC to establish incentive-
based rate treatments for public utilities’ transmission infrastructure to promote capital investment in transmission infrastructure, attract new investment with an attractive return on equity, encourage improvement in transmission technology, and allow for recovery of prudently incurred costs related to reliability and improved transmission infrastructure. Proponents contend this will encourage the expansion of transmission capacity and, thus, help foster greater competition in electric markets.
PURPA Reform: Section 1253 permits FERC to terminate, prospectively, the obligation
of electric utilities to buy power from QFs, such as industrial cogenerators. FERC may do so when the QFs in the relevant area have adequate opportunities to make competitive sales, as defined by EPAct 2005. The premise is that growth in competitive opportunities in electric markets negates the need for PURPA’s “forced sale” requirements.
PUHCA 1935 Repeal: Title XVII, subtitle F repeals PUHCA 1935 and replaces it with
new PUHCA 2005. It provides FERC and state access to books and records of holding companies and their members. It also provides that certain holding companies or states may obtain FERC-authorized cost allocations for non-power goods or services provided by an associate company to public utility members in the holding company. PUHCA 2005 also contains a mandatory exemption from the federal books and records access provisions for entities that are holding companies solely with respect to EWGs, QFs or foreign utility companies. The goal is to reduce legal obstacles to investment in the electric utility industry and, thereby, help facilitate the construction of adequate infrastructure.
C. Recent Trends Related to Competition in the Electric Energy Industry This section discusses several more recent electric industry policy developments and characteristics.
1. Increases in Generation and Growth of Nonutility Generation Suppliers Electric power industry restructuring has been sustained largely by technological improvements in gas turbines. It is no longer necessary to build a larger generating plant to gain operating efficiencies. Combined-cycle gas turbines reach maximum efficiency at 400 MW, while aero-derivative gas turbines can be efficient at sizes as low as 10 MW. These new gas-fired combined cycle plants can be more energy efficient and less costly than the older oil and gas-fired plants.91 Because of their smaller footprint and low emissions, gas turbine generators can often be located close to load, avoiding the need for additional transmission. Coupled with greater transmission access as a result of Order No. 888, it became feasible for generating plants hundreds of miles apart to compete with each other, giving customers more choices in electricity suppliers.92
91 EIA 2000 Update at ix. The size of the cost improvements depends on the underlying fuel prices. 92 Id.
34
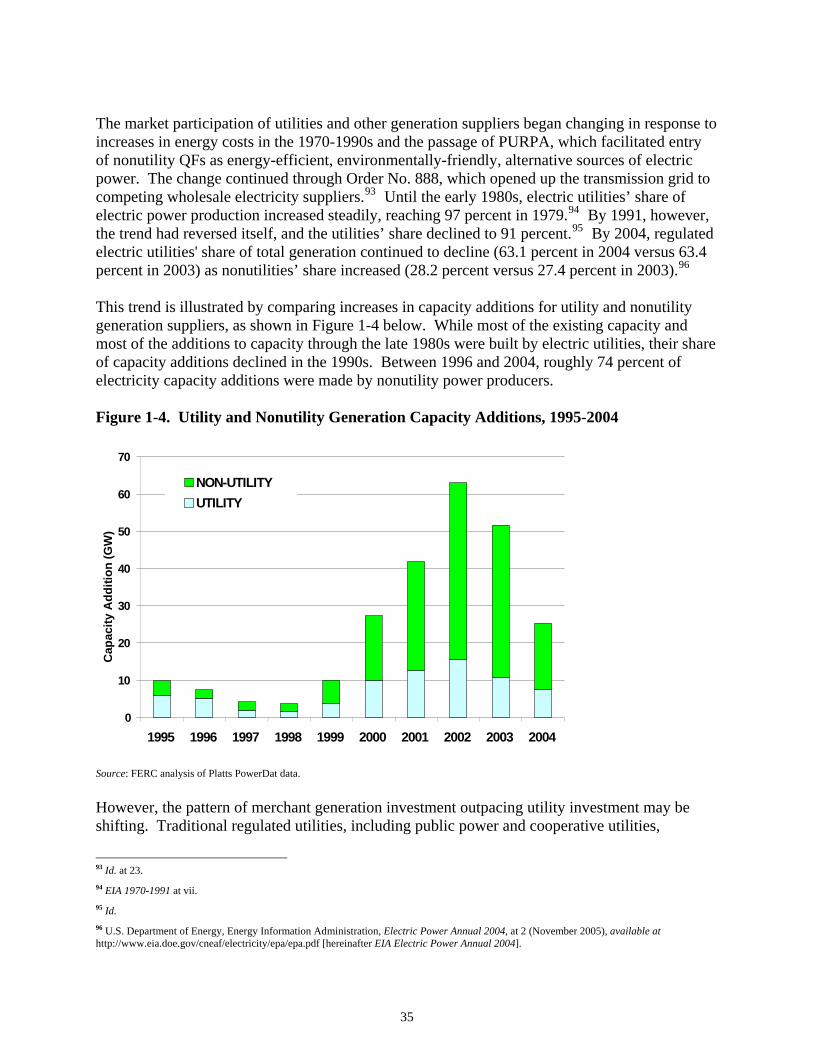
The market participation of utilities and other generation suppliers began changing in response to increases in energy costs in the 1970-1990s and the passage of PURPA, which facilitated entry of nonutility QFs as energy-efficient, environmentally-friendly, alternative sources of electric power. The change continued through Order No. 888, which opened up the transmission grid to competing wholesale electricity suppliers.93 Until the early 1980s, electric utilities’ share of electric power production increased steadily, reaching 97 percent in 1979.94 By 1991, however, the trend had reversed itself, and the utilities’ share declined to 91 percent.95 By 2004, regulated electric utilities' share of total generation continued to decline (63.1 percent in 2004 versus 63.4 percent in 2003) as nonutilities’ share increased (28.2 percent versus 27.4 percent in 2003).96 This trend is illustrated by comparing increases in capacity additions for utility and nonutility generation suppliers, as shown in Figure 1-4 below. While most of the existing capacity and most of the additions to capacity through the late 1980s were built by electric utilities, their share of capacity additions declined in the 1990s. Between 1996 and 2004, roughly 74 percent of electricity capacity additions were made by nonutility power producers. Figure 1-4. Utility and Nonutility Generation Capacity Additions, 1995-2004
0
10
20
30
40
50
60
70
1995 1996 1997 1998 1999 2000 2001 2002 2003 2004
Cap
acity
Add
ition
(GW
)
NON-UTILITY UTILITY
Source: FERC analysis of Platts PowerDat data. However, the pattern of merchant generation investment outpacing utility investment may be shifting. Traditional regulated utilities, including public power and cooperative utilities,
93 Id. at 23. 94 EIA 1970-1991 at vii. 95 Id. 96 U.S. Department of Energy, Energy Information Administration, Electric Power Annual 2004, at 2 (November 2005), available at http://www.eia.doe.gov/cneaf/electricity/epa/epa.pdf [hereinafter EIA Electric Power Annual 2004].
35

accounted for about 60 percent of capacity additions from 2005 through May 2006. In California, six new power plants began operations, including four owned by public utilities and two owned by IOUs.97
2. Transmission Investment Despite these increased investments in new generation, the Edison Electric Institute (EEI) reports that IOU investment in transmission declined from 1975 through 1999. See Figure 1-5. Over that period, electricity demand more than doubled, resulting in a significant decrease in transmission capacity relative to demand. Box 1-2 suggests reasons for this trend. Since 1999, according to EEI surveys, transmission investment has increased annually. From 1999 to 2003, IOU investment increased 12 percent annually.98 For 2004 to 2008, IOUs expect to invest about $28 billion in transmission, an almost 60 percent increase over the prior five-year period. Figure 1-5. Transmission Construction Expenditures by Investor-Owned Utilities, Actual and Projected, 1975-2009
97 APPA comments (2). 98 Edison Electric Institute, EEI Survey of Transmission Investment: Historical and Planned Capital Expenditures, at 1 (May 2005).
36
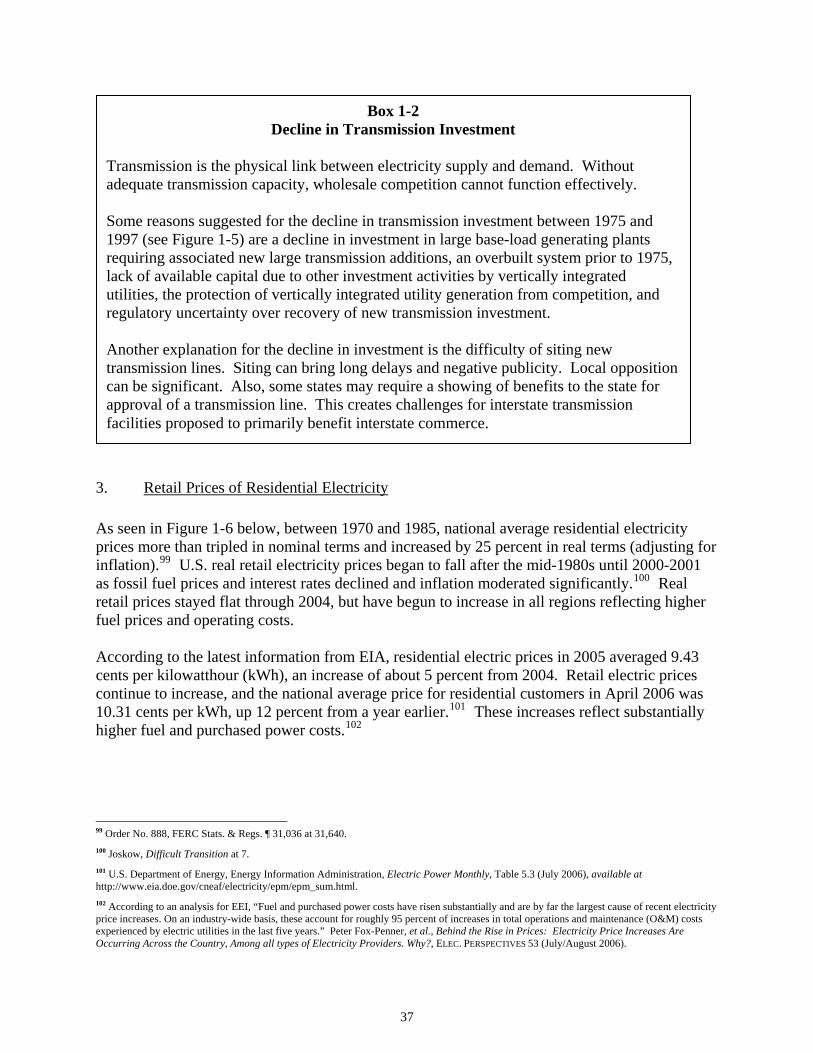
Box 1-2 Decline in Transmission Investment
Transmission is the physical link between electricity supply and demand. Without adequate transmission capacity, wholesale competition cannot function effectively. Some reasons suggested for the decline in transmission investment between 1975 and 1997 (see Figure 1-5) are a decline in investment in large base-load generating plants requiring associated new large transmission additions, an overbuilt system prior to 1975, lack of available capital due to other investment activities by vertically integrated utilities, the protection of vertically integrated utility generation from competition, and regulatory uncertainty over recovery of new transmission investment. Another explanation for the decline in investment is the difficulty of siting new transmission lines. Siting can bring long delays and negative publicity. Local opposition can be significant. Also, some states may require a showing of benefits to the state for approval of a transmission line. This creates challenges for interstate transmission facilities proposed to primarily benefit interstate commerce.
3. Retail Prices of Residential Electricity As seen in Figure 1-6 below, between 1970 and 1985, national average residential electricity prices more than tripled in nominal terms and increased by 25 percent in real terms (adjusting for inflation).99 U.S. real retail electricity prices began to fall after the mid-1980s until 2000-2001 as fossil fuel prices and interest rates declined and inflation moderated significantly.100 Real retail prices stayed flat through 2004, but have begun to increase in all regions reflecting higher fuel prices and operating costs. According to the latest information from EIA, residential electric prices in 2005 averaged 9.43 cents per kilowatthour (kWh), an increase of about 5 percent from 2004. Retail electric prices continue to increase, and the national average price for residential customers in April 2006 was 10.31 cents per kWh, up 12 percent from a year earlier.101 These increases reflect substantially higher fuel and purchased power costs.102
99 Order No. 888, FERC Stats. & Regs. ¶ 31,036 at 31,640. 100 Joskow, Difficult Transition at 7. 101 U.S. Department of Energy, Energy Information Administration, Electric Power Monthly, Table 5.3 (July 2006), available at http://www.eia.doe.gov/cneaf/electricity/epm/epm_sum.html. 102 According to an analysis for EEI, “Fuel and purchased power costs have risen substantially and are by far the largest cause of recent electricity price increases. On an industry-wide basis, these account for roughly 95 percent of increases in total operations and maintenance (O&M) costs experienced by electric utilities in the last five years.” Peter Fox-Penner, et al., Behind the Rise in Prices: Electricity Price Increases Are Occurring Across the Country, Among all types of Electricity Providers. Why?, ELEC. PERSPECTIVES 53 (July/August 2006).
37
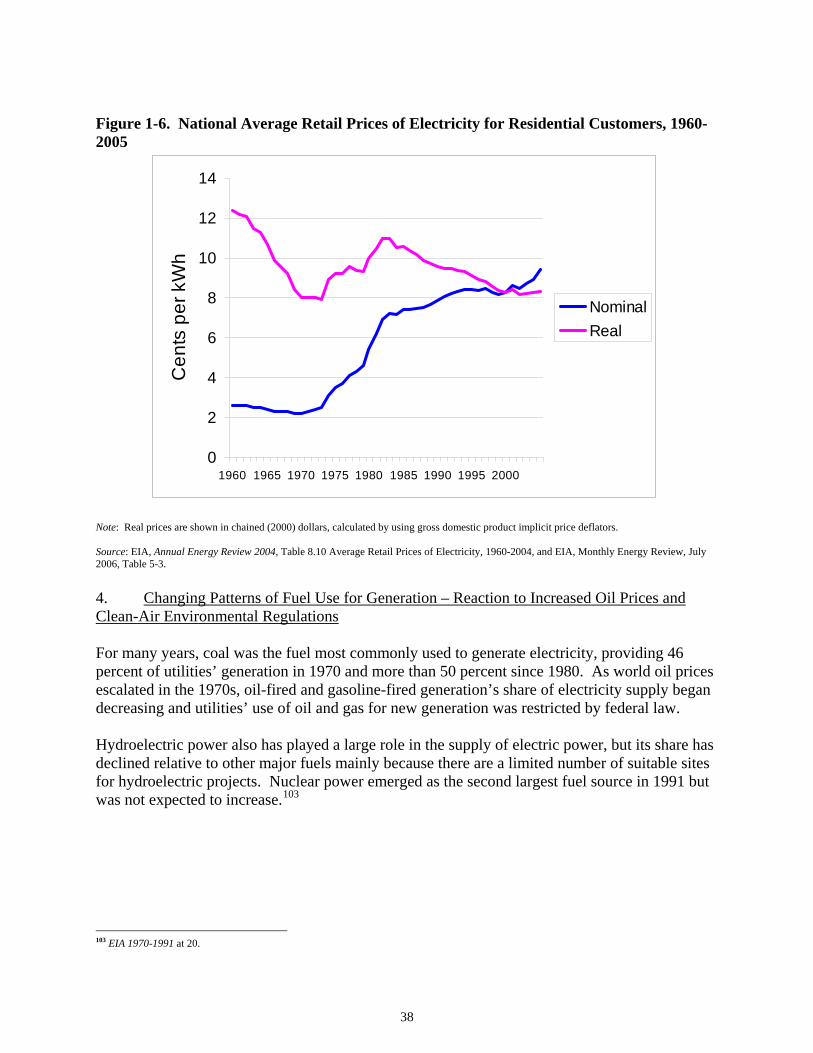
Figure 1-6. National Average Retail Prices of Electricity for Residential Customers, 1960-2005
0
2
4
6
8
10
12
14
1960 1965 1970 1975 1980 1985 1990 1995 2000
Cen
ts p
er k
Wh
NominalReal
Note: Real prices are shown in chained (2000) dollars, calculated by using gross domestic product implicit price deflators. Source: EIA, Annual Energy Review 2004, Table 8.10 Average Retail Prices of Electricity, 1960-2004, and EIA, Monthly Energy Review, July 2006, Table 5-3. 4. Changing Patterns of Fuel Use for Generation – Reaction to Increased Oil Prices and Clean-Air Environmental Regulations For many years, coal was the fuel most commonly used to generate electricity, providing 46 percent of utilities’ generation in 1970 and more than 50 percent since 1980. As world oil prices escalated in the 1970s, oil-fired and gasoline-fired generation’s share of electricity supply began decreasing and utilities’ use of oil and gas for new generation was restricted by federal law. Hydroelectric power also has played a large role in the supply of electric power, but its share has declined relative to other major fuels mainly because there are a limited number of suitable sites for hydroelectric projects. Nuclear power emerged as the second largest fuel source in 1991 but was not expected to increase.103
103 EIA 1970-1991 at 20.
38
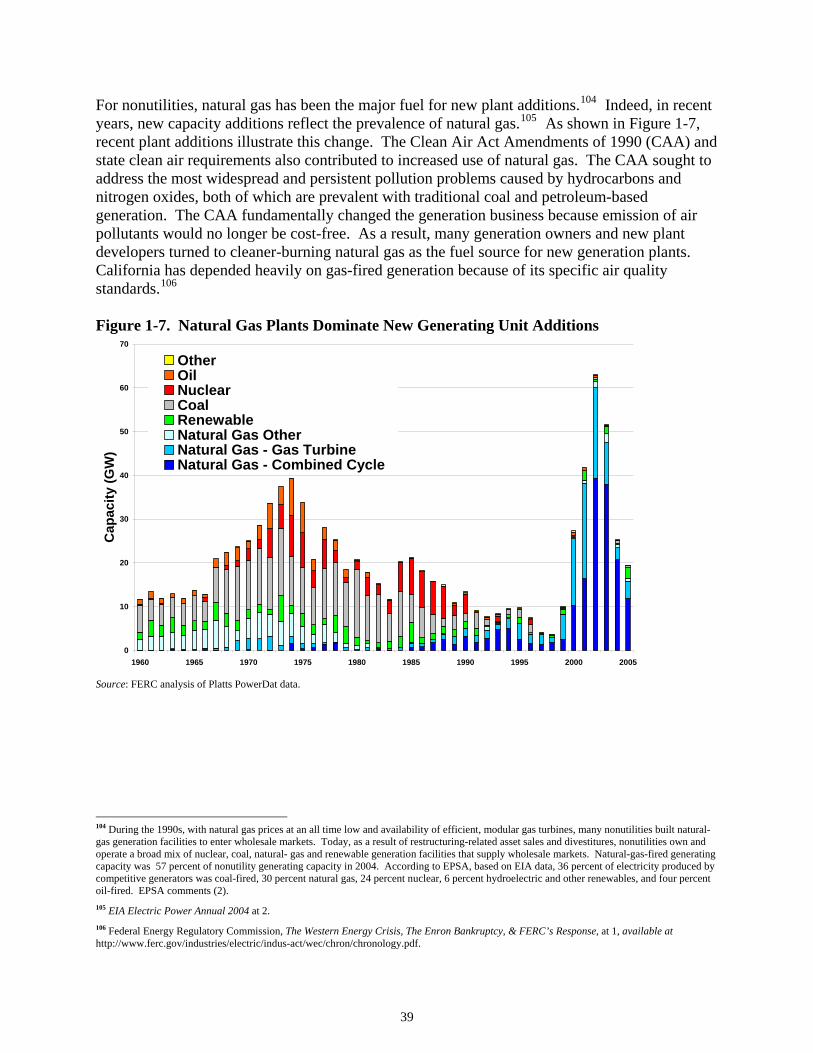
For nonutilities, natural gas has been the major fuel for new plant additions.104 Indeed, in recent years, new capacity additions reflect the prevalence of natural gas.105 As shown in Figure 1-7, recent plant additions illustrate this change. The Clean Air Act Amendments of 1990 (CAA) and state clean air requirements also contributed to increased use of natural gas. The CAA sought to address the most widespread and persistent pollution problems caused by hydrocarbons and nitrogen oxides, both of which are prevalent with traditional coal and petroleum-based generation. The CAA fundamentally changed the generation business because emission of air pollutants would no longer be cost-free. As a result, many generation owners and new plant developers turned to cleaner-burning natural gas as the fuel source for new generation plants. California has depended heavily on gas-fired generation because of its specific air quality standards.106
Figure 1-7. Natural Gas Plants Dominate New Generating Unit Additions
0
10
20
30
40
50
60
70
1960 1965 1970 1975 1980 1985 1990 1995 2000 2005
Cap
acity
(GW
)
OtherOilNuclearCoalRenewableNatural Gas OtherNatural Gas - Gas TurbineNatural Gas - Combined Cycle
Source: FERC analysis of Platts PowerDat data. 104 During the 1990s, with natural gas prices at an all time low and availability of efficient, modular gas turbines, many nonutilities built natural-gas generation facilities to enter wholesale markets. Today, as a result of restructuring-related asset sales and divestitures, nonutilities own and operate a broad mix of nuclear, coal, natural- gas and renewable generation facilities that supply wholesale markets. Natural-gas-fired generating capacity was 57 percent of nonutility generating capacity in 2004. According to EPSA, based on EIA data, 36 percent of electricity produced by competitive generators was coal-fired, 30 percent natural gas, 24 percent nuclear, 6 percent hydroelectric and other renewables, and four percent oil-fired. EPSA comments (2). 105 EIA Electric Power Annual 2004 at 2. 106 Federal Energy Regulatory Commission, The Western Energy Crisis, The Enron Bankruptcy, & FERC’s Response, at 1, available at http://www.ferc.gov/industries/electric/indus-act/wec/chron/chronology.pdf.
39

The result of these plant additions through December 2005 is that 49.9 percent of the nation's electric power was generated at coal-fired plants (Figure 1-8). Nuclear plants contributed 19.3 percent; 18.6 percent was generated by natural gas-fired plants, and 2.5 percent was generated at petroleum liquid-fired plants. Conventional hydroelectric power provided 6.6 percent of the total, while other renewables (primarily biomass, but also geothermal, solar, and wind) and other miscellaneous energy sources generated the remaining electric power. Figure 1-8. Net Generation Shares by Energy Source: Total (All Sectors), January-December 2005
Coal, 49.9% Natural Gas, 18.6%
Petroleum, 3.0%
Nuclear, 19.3%
Hydroelectric, 6.4% Renewables, 2.3%
Other, 0.5%
Coal Natural Gas Petroleum Nuclear Hydroelectric Renewables Other
Source: EIA, Electric Power Monthly, July 2006, Table 1-1.
The trend toward gas-fueled capacity additions may be changing. There is renewed interest in coal-fired generation as reflected in utilities’ and nonutilities’ announcements of new coal plant construction projects. Two major reasons may explain coal’s resurgence: (1) the relative price of natural gas compared to coal has increased substantially and (2) the cost of environmental equipment for coal plants, such as scrubbers, has decreased. “Over the past decade, many merchant combined-cycle gas-fired units were built on the assumption that natural gas would be relatively inexpensive and that cleaning technology for coal plants would drive the price of coal plants significantly higher. Sharp increases in natural gas prices in recent years have challenged these assumptions.” DOE’s EIA estimated that 573 MWs of new coal generation would be added nationally in 2005, which compares with an estimate of 15,216 MWs of gas-fired additions for the same year. For 2009, however, predicted trends shift; the EIA projects that 8,122 MWs of new coal generation will be added that year, whereas only 5,451 MWs of gas-fired generation additions are predicted.107 DOE predicts a resurgence of coal-fired generation as far into the future as 2025.108
107 See EIA Electric Power Annual 2004 at 17, table 2.4, available at http://www.eia.doe.gov/cneaf/electricity/epa/epat2p4.html. 108 See U.S. Department of Energy, National Energy Technology Lab, Tracking New Coal-Fired Power Plants, at 3-4, available at http://www.netl.doe.gov/coal/refshelf/ncp.pdf (predicting 85 GWs of new coal capacity created by 2025).
40
Higher gas prices and environmental concerns have also spurred renewed interest in nuclear generation. EPAct 2005 includes a number of provisions intended to encourage and facilitate a new and improved generation of nuclear power plants.
5. Fuel Price Trends
Natural gas prices have been increasing in recent years, due in part to historically high petroleum prices. Natural gas prices increased 51.5 percent between 2002 and 2003, 10.5 percent between 2003 and 2004, and 37.6 percent between 2004 and 2005. Strong demand for natural gas, as well as natural gas production disruptions in the Gulf of Mexico, contributed to these increases. As shown in Figure 1-9, for December 2005 the overall price of fossil fuels was influenced by the price increases in natural gas. In December 2005, the average price for fossil fuels was $3.71 per million Btu (MMBtu), 10.1 percent higher than for November 2005, and 44.4 percent higher than in December 2004. As natural gas prices increase relative to coal prices, the change may make development of clean-burning coal plants more economically attractive than they were when natural gas fuel prices were lower. Figure 1-9. Fossil Fuel Costs for Electric Generators, 2001-2006 Dollars per Million Btu
0
2
4
6
8
10
12
14
Jan-
01
Jan-
02
Jan-
03
Jan-
04
Jan-
05
Jan-
06
Dol
lars
per
Mill
ion
Btu
CoalPetroleumNatural GasAll Fossil Fuel
Source: EIA, Monthly Energy Review, July 2006, Table 9.10. Cost of Fossil-Fuel Receipts at Electric Generating Plants.
41

6. Mergers, Acquisitions, and Power Plant Divestitures of Investor-Owned Electric Utilities109
Many IOUs have fundamentally reassessed their corporate strategies to function more like competitive, market-driven entities than in their more regulated past.110 One result is that there was a wave of mergers and acquisitions in the late 1980s through the late 1990s between traditional electric utilities and between electric utilities and gas pipeline companies. IOUs also have divested a substantial number of generation assets to IPPs or transferred them to an unregulated nonutility subsidiary within the company.111 Even though FERC-regulated IOUs have functionally unbundled generation from transmission, and some have formed RTOs and ISOs, many utilities have divested their power plants because of state requirements. Some states that opened the electric market to retail competition view the separation of power generation ownership from power transmission and distribution ownership as a prerequisite for retail competition. For example, California, Connecticut, Maine, New Hampshire, and Rhode Island enacted laws requiring utilities to divest their power plants. In other states, the state public utility commission may encourage divestiture to arrive at a quantifiable level of stranded costs for purposes of recovery during the transition to competition.112 Since 1997, IOUs have divested power generation assets at unprecedented levels,113 and these power plant divestitures have also reduced the total number of IOUs that own generation capacity.114 A few utilities have decided to sell their power plants, as a business strategy, deciding that they cannot compete in a competitive power market. In a few instances, an IOU has divested power generation capacity to mitigate potential market power resulting from a merger.115 As described in Table 1-6 below, between 1998 and 2001, over 300 plants, representing nearly 20 percent of U.S. installed generating capacity, changed ownership. Since 2001 the merger trends have shifted slightly, as financial difficulties of the merchant generating sector have prompted the sale or transfer of a substantial share of the merchant fleet. Some purchasers have been traditional utilities, including public power and cooperative utilities.116
109 The information provided in this section is current as of July 2006 and does not reflect any subsequent changes. 110 See U.S. Congress, Office of Technology Assessment, Electric Power Wheeling and Dealing: Technological Considerations for Increasing Competition, at 47, OTA-E-409 (Washington, DC: U.S. Government Printing Office, May 1989). 111 EIA 2000 Update at 91. 112 Id. at 105-06. 113 Id. at 105. 114 Id. at 91. 115 Id. at 106. 116 The EIA periodically reports on generation plant transfers. For a list of plants transferred in 2003- 2006, see the EIA Electric Power Monthly (July 2006), available at http://www.eia.doe.gov/cneaf/electricity/epm/tablees4.html.
42

There were no significant electric power company mergers from 2001 to 2004, but in 2004 utilities and financial institutions exhibited growing interest in mergers and acquisitions, prompting many analysts to herald 2004 as a new round of consolidation in the power sector.117 One utility-to-utility acquisition closed,118 and three were announced.119 Most electric acquisitions in 2004 involved the purchase of specific generation assets. Many companies strove to stabilize financial profiles through asset sales. In aggregate, almost 36 GW of generation, or nearly 6 percent of installed capacity, changed hands in 2004.120
Table 1-6. Power Generation Asset Divestitures by Investor-Owned Electric Utilities, as of April 2000 GWs and Percent of Total and U.S. Generating Capacity
Status Category Capacity (GW) Percent of Total Percent of Total U.S.Generation Capacity
Sold 58.0 37 8
Pending Sale (Buyer Announced)
28.2 18 4
For Sale (No Buyer Announced)
31.9 20 4
Transferred to Unregulated Subsidiary
4.1 3 1
Pending Transfer to Unregulated Subsidiary
34.2 22 5
Total 156.5 100 22 Source: EIA, The Changing Structure of the Electric Power Industry 2000: An Update, (October 2000), Table 19.
117 FERC State of the Markets Report 2004 at 30-32. 118 Announced in December 2003, Ameren closed its acquisition of Illinois Power Co. in September 2004. Id. at 31. 119 In January 2004, Black Hills Corp announced the acquisition of Cheyenne Light, Fuel & Power from Xcel Energy. In July 2004, PNM Resources, the parent of Public Service Company of New Mexico, announced the intention to acquire TNP Enterprises, the parent of Texas New Mexico Power Company from a group of private equity investors. Id. at 31-32. In December 2004, Exelon announced its intent to merge with PSEG, a plan that would create the nation’s largest utility company by generation ownership, market capitalization, revenues, and net income. Id. at 32. 120 Id. at 30.
43

CHAPTER 2 CONTEXT FOR THE TASK FORCE’S STUDY OF COMPETITION IN
WHOLESALE AND RETAIL ELECTRIC POWER MARKETS This chapter provides context and theoretical underpinnings to the Task Force’s study of competition in wholesale and retail electric power markets. It describes (1) perceived shortcomings of traditional cost-based regulation that motivated restructuring and regulatory reform, (2) the theoretical role competitive market price signals play in guiding consumption and investment decisions,121 and (3) a brief discussion of expected benefits of shifting from cost-based rate regulation to market-based pricing of electricity. A. Overview of Perceived Shortcomings of Cost-Based Rate Regulation State and federal policymakers regulated providers of the generation, transmission, and distribution of electric power as vertically-integrated monopolies for approximately 70 years. For much of this period it was considered economically inefficient and technologically challenging to have multiple sources of generation, transmission, and distribution facilities serving customers in the same geographic area. Competition was considered impractical and not in the public interest because it would require costly duplication of facilities and likely engender competition that would not be sustainable due to economies of scale. Under this model, competition was expected eventually to result in ratepayers paying for failed facilities without benefiting from alternative sources of supply. The traditional “regulatory compact” required an electric power utility to serve all retail customers in a defined franchise area in exchange both for the opportunity to earn a reasonable return on its investment and for protection against entry by potential rivals. Consumer prices or “rates” were based on the regulated utilities’ average historic cost of production plus an adder for a fair return on investment and often adjustments for changing fuel prices. Regulators used this “cost-based” regulation to try to ensure adequate supplies at reasonable prices for consumers, as required by state laws. Under most state regulatory policies, utilities could not recover new investments in rates until regulators determined that the investment was “prudent” and the facilities were “used and useful” (actually being used to serve customers). Historically, some states allowed large nuclear cost overruns to be included in the rate base, while other states did not. In general, disallowances of investments have been rare. As described in Chapter 1, beginning in the 1970s, the combined effects of a number of changes – improvements in smaller-scale generation technology, transmission, communications and control technologies, rising energy prices, environmental policy concerns, increased concerns about the effectiveness of traditional utility rate regulation, and favorable experience with the introduction of increased competition in other network industries – began to transform the structure and regulation of the electric power sector. 121 For a full discussion of the theory of competition in wholesale electricity markets, see STEVEN STOFT, POWER SYSTEM ECONOMICS: DESIGNING MARKETS FOR ELECTRICITY (IEEE Press 2002).
44
1. Effects on Electricity Demand and Prices Under cost-based regulation, end-use, and sometimes wholesale, customers often paid prices for their electricity that were based on average costs calculated over extended periods of months or years so that the prices did not vary with consumption or the marginal cost of generation. These rates were stable and often only varied by season. Although time-based rates and certain regulated products such as interruptible or curtailable services had been used within the electric power industry for decades, they had not been applied to the vast majority of retail customers. The average cost-based pricing formula precludes economically accurate price signals from guiding consumption decisions.122 Inefficiency has resulted as consumers purchased either too much electricity (when the average price was below the efficient price) or too little electricity (when the average price exceeded the efficient price). Inefficient resource use can translate to higher production costs and prices. Historical average cost electricity prices, for example, gave consumers no economic reason to conserve electricity when supplies were short or demand was high. Similarly, suppliers did not receive economically accurate price signals to guide their short- and long-term sales of generation. In addition, many industrial customers among others have objected that retail rate structures frequently contained cross-subsidies among customer classes and thus, further distorted prices.123
2. Effect on Investment Decisions Regulators’ influence over generation construction decisions likely also contributed to inefficiency. Historically, regulators had encouraged local utilities to build or contract for sufficient generation to serve customers within their territories. Regulators blocked entry by independent generators or allowed the utilities to do so. This resulted in utilities owning nearly all generation assets within their service territories and discouraged competition among generators. While the intent of these policies was partly to keep price down, the unintended effect was to dampen incentives for cost reduction, investment in new capacity and innovation.124 More competition might have led earlier to technological innovation and lower generation costs. The fact that regulators had to agree that a capital investment was necessary and prudent before rate recovery was allowed125 further discouraged innovation. Utilities were reluctant to take investment risks that might end up being unrecoverable if regulators deemed their cost unreasonable. Thus, long-term planners and regulators had significant influence over when and where generation would be built. In making decisions, regulators struggled to strike a balance between reasonable rates and providing utilities with incentives to make necessary and sufficient investments.
122 From an economic perspective, retail electricity prices (or rates) that do not closely track wholesale price trends do not send economically “accurate” price signals when they do not reflect temporal variations in production costs and wholesale market prices within days, across seasons, or even across years (except after long lags). 123 Electricity Consumers Resource Council, Profiles in Electricity Issues: Cost-of-Service Survey (March 1986). 124 See, e.g., KIP VISCUSI ET AL., ECONOMICS AND REGULATION OF ANTITRUST 6-7 (MIT Press, 4th ed. 2005) [hereinafter VISCUSI, ET AL.]. 125 Most states also regulate the siting of major electric power facilities.
45

This regulatory oversight also possibly encouraged an overcapitalization of the industry, as generators were assured a rate of return on any approved capital project. It might also have led to undercapitalization if a regulator was too conservative. Further, if rates were set too high, utilities could earn a higher return on new generation investments than would be warranted by the cost of capital. If regulators were unlikely or unable to identify and disallow excessive construction costs, utilities had little incentive to design new generation plants cost-effectively. At the same time, regulatory disallowances of some costs imposed risk on utility decisions to elicit capital and build new generation, and investors sought compensation for this risk when they supplied capital to utilities.126
Ultimately, ratepayers were left to bear much of the investment risk, as they had to pay for regulator-approved projects resulting in overinvestment as well as any subsequent higher costs from underinvestment (for example, costs of running higher cost generation more often than is economically efficient). A 1983 DOE analysis of electric power generation plant construction showed that electric utilities (regulated under a cost-based regulatory regime) had limited ability to control construction costs of coal and nuclear plants. During the 1970s and early 1980s, the cost range per MW to build a nuclear plant varied by nearly 400 percent and by 300 percent for coal plants. The study showed that some companies were not competent to manage such large-scale, capital-intensive projects. In addition, they tended to custom design plants, as opposed to using a basic design and then refining it.127 One alternative to traditional cost-based rate-of-return regulation is price cap regulation. Under this approach, the regulator caps the price a firm is allowed to charge.128 This alternative may remedy some of the incentive problems of cost-based regulation, but comes with its own costs. Another alternative is the addition of an open, transparent Integrated Resource Planning process by utilities to consider and support choices about building new generation procuring supplies from wholesale markets, and/or investing in demand-side options to meet projected load growth. In some states, regulators are involved in the utility IRP process and may approve the resulting plan. Even with this oversight mechanism, regulators have few reference points to determine if a builder’s choices about design, efficiency, and materials for the IRP selected plant are prudent. 126 In the academic literature, the risk of utility overinvestment has been explained by the Averch-Johnson Effect. The Averch-Johnson Effect reflects that “a firm that is attempting to maximize profits is given, by the form of regulation itself, incentives to be inefficient. Furthermore, the aspects of monopoly control that regulation is intended to address, such as high prices, are not necessarily mitigated, and could be made worse, by the regulation.” KENNETH E. TRAIN, OPTIMAL REGULATION 19 (1991) [hereinafter TRAIN]. The Averch-Johnson Effect also predicts that if a regulator attempts to reduce a firm’s profits by reducing its rate of return, the firm will have an incentive to further increase its relative use of capital. Id. at 56. Thus, the most obvious regulatory control within cost-base rate regulation creates further distortions. The Averch-Johnson Effect is sometimes thought to explain why a regulated firm is led to “gold plate” its facilities, i.e., incur excessive costs so long as those expenses can be capitalized. 127 U.S. Department of Energy, The Future of Electric Power in America: Economic Supply for Economic Growth (June 1983) (DOE/PE-0045). 128 Under price cap regulation, a firm can theoretically “produce with the cost-minimizing input mix [and] invest in cost-effective innovation.” TRAIN at 318. However, this dynamic only occurs where the price cap is fixed over time and the utility receives the benefit of cost reductions and cost-effective innovations. Further, the benefit of this increased efficiency “accrues entirely to the firm: consumers do not benefit from the production efficiency.” Id. Where the price cap is adjusted over time, firms are induced to engage in strategic behavior. Additionally, “if, as . . . expected, the review of price caps is conducted like the price reviews under cost-base rate regulation, then the distinction blurs between price-cap regulation and cost-base rate regulation.” Id. at 319. One way for consumers under a rate cap system to share the benefits of efficiency improvements without eliciting strategic behavior from the regulated firm is to include periodic, automatic reductions in rates based on general trends in productivity.
46
3. Motivation for Change In part, the struggles of regulators to ensure adequate supplies of power at reasonable rates led policymakers to examine whether competition could provide more timely and efficient incentives for what to consume and build. Advances in technology also allowed the entry of a variety of new, nonutility generators and demand response alternatives and weakened the argument for preserving utilities’ monopolies on generation services. These developments set the stage for considering competitive pricing as an option for eliciting entry by new generators or expansion by existing generators. Generally, transmission and distribution have continued to be regulated services. B. Overview of the Role of Price in Competitive Wholesale and Retail Electric Power Markets How much a supplier will produce at a given price is determined by many things, including (in the long run) how much it must pay for the labor it hires, the land and resources it uses, the capital it employs, the fuel inputs it must purchase to generate the electric power, the transmission it must use to deliver the electric power to end users, and the risks associated with its investment. Consumers’ overall willingness to pay for a product also is determined by a large variety of factors, such as the existence and prices of substitutes, income, and individual preferences. The following is a review of expectations based on economic theory of how competition might determine prices and discipline investment in the electric utility industry. Chapters 3 and 4 examine how well actual wholesale and retail electricity market structures are meeting these expectations. 1. Price Affects Customer Consumption Price changes play an important economic function by encouraging customers and suppliers to respond to changing market conditions. Price changes signal to customers in wholesale and retail markets that they should change their decisions about how much and when to consume electric power. Price increases signal customers to reduce consumption. The more consumers reduce their consumption in response to an increase in prices, the less market power sellers are likely to have. Lower prices encourage customers to increase consumption. Consumer price responsiveness is often referred to as “demand response.”129
The primary purpose of incorporating market driven prices into wholesale and retail electric power markets is to provide price signals that accurately reflect underlying costs of production and thereby encourage efficient consumption patterns. Economic analysis suggests that the market dynamics of this type of pricing will result in lower overall production costs, which will translate into lower consumer prices. 129 U.S. Department of Energy, Benefits of Demand Response in Electricity Markets and Recommendations for Achieving Them: A Report to the United States Congress Pursuant to Section 1252 of the Energy Policy Act of 2005 (February 2006) [hereinafter DOE EPAct Demand Response Report]. The DOE EPAct Demand Response Report discusses the benefits of demand response in electric power markets and makes recommendations to achieve these benefits.
47
Accurate price signals are expected to improve the efficiency of electric power production by more closely aligning the price that customers pay for and the value they place on electricity. In particular, by exposing customers to prices based on marginal production costs, resources can be allocated more efficiently.130 Accurate price signals also reduce cross subsidies between customers and among customer classes.131 Flat electricity prices based on average costs can lead customers to “over-consume – relative to an optimally efficient system in hours when electricity prices are higher than the average rates, and under-consume in hours when the cost of producing electricity is lower than average rates.”132 Efficient price signals also have the benefit of increasing price response during periods of scarcity and high prices, which can help moderate generator market power and improve reliability.
Box 2-1 Market Prices
Market prices reflect myriad individual decisions about prices at which to sell or buy. They act as a mechanism that equalizes the quantity demanded and the quantity supplied. Rising prices signal consumers to purchase less and producers to supply more. Falling prices signal consumers to purchase more and producers to supply less. Prices will stop rising or falling when they reach the new equilibrium price: the price at which the quantity that consumers demand matches the quantity that producers supply.
When there are many close substitutes for a particular commodity, a relatively small price increase will result in a relatively large reduction in consumption. For example, if natural gas were a very good substitute for electric power at prevailing prices, then even a relatively small increase in electricity prices could persuade many consumers to switch in part or entirely to natural gas. To induce those consumers to return to electricity, electricity prices would not need to fall by very much. However, where there are no close substitutes for electric power, the price of electricity may have to rise substantially to reduce consumption by a significant amount. Empirical literature shows that, even if the retail price of electricity increases by a large percentage, consumption of electricity does not decline much. In economic terms, it is said that the short-run demand for electricity is “inelastic” with respect to price. See Box 2-2. This inability to substitute other products for electricity in the short run means that changes in supply conditions (price of input fuels, etc.) are likely to cause wider price fluctuations than would be the case if customers could easily reduce consumption when prices rise. Furthermore, electric power has few viable substitutes for key end uses such as refrigeration and lighting, and thus the 130 There is substantial literature on setting rates based on marginal costs in the electric sector. See, e.g., M. CREW & P. KLEINDORFER, PUBLIC UTILITY ECONOMICS (St. Martin’s Press 1979); B. MITCHELL, W. MANNING, & J. PAUL ACTON, PEAK–LOAD PRICING (Ballinger 1978). Other papers suggest that setting rates based on marginal costs will result in a misallocation of resources. See S. Borenstein, The Long-Run Efficiency of Real-Time Pricing, 26:3 ENERGY J. (2005). Nevertheless, the literature also indicates that marginal-cost pricing may result in a revenue shortfall or excess, and standard rate-making practice is to require an adjustment (presumably to an inelastic component) to reconcile with embedded cost-of-service. Various rate structures to accomplish marginal-cost pricing include two-part tariffs and allocation of shortfalls to rate classes. See VISCUSI, ET AL. 131 The reduction of cross subsidies can be seen as having both positive and negative implications for society as a whole – depending on one’s perspective and whether the cross-subsidy supports publicly acceptable goals, such as rural electrification. 132 DOE EPAct Demand Response Report at 7.
48
consequences for supply shortfalls can be significant.133 In the long run, this effect may be somewhat muted as customers may have more ability to adjust consumption and fuel sources in response to price changes.
Box 2-2 Price Elasticity of Demand
The desire and ability of consumers to change the amount of a product they will purchase when its price increases is at the core of the concept of price elasticity of demand for that product. The price elasticity of demand is the ratio of the percent change in the quantity demanded to the percent change in price. That is, if a 10 percent price increase results in a 5 percent decrease in the quantity demanded, the price elasticity of demand equals -0.5 (-5 percent ÷ 10 percent). If the ratio is close to zero, demand is considered "inelastic," and demand is more "elastic" as the ratio increases. Short-run elasticities are typically lower than long-run elasticities.
Experience with retail pricing experiments in New York, Georgia, California, and other states have demonstrated that customers are able to adjust their electricity consumption and are at least somewhat responsive to short-run price changes (i.e., have a non-zero short-run price elasticity of demand). Georgia Power's Real Time Pricing (RTP) tariff option found that certain large industrial customers who receive RTP based on an hour-ahead market are somewhat price-responsive (short-run price elasticities ranging from approximately -0.2 at moderate prices, to -0.28 at prices of $1/kWh or more). Among day-ahead RTP customers, short-run price elasticities range from approximately -0.04 at moderate prices to -0.13 at high prices. National Grid also found limited responsiveness to price in its pricing program.134 A critical peak pricing (CPP) experiment in California in 2004 determined that a test group of residential and small business customers responded to price and significantly reduced consumption (13 percent on average, and as much as 27 percent when automated controls such as controllable thermostats were installed) during critical peak periods. In addition, the California pilot found that most customers on the CPP tariffs had a favorable opinion of the rates and would be interested in continuing in the program.135
Customer response to prices requires the following conditions: (1) that time-differentiated price signals are communicated to customers; (2) that customers have the ability to respond to price signals (e.g., by reducing consumption and/or turning on an on-site generator); and (3) that customers have interval meters (i.e., so the utility can determine how much power was used at
133 Estimates of the total costs in the United States due to the August 14, 2003, blackout range between $4 billion and $10 billion. Electricity Consumers Resource Council, The Economic Impacts of the August 2003 Blackout (Feb. 2, 2004). 134 Chuck Goldman, et al., Does Real-Time Pricing Deliver Demand Response? A Case Study of Niagara Mohawk’s Large Customer RTP Tariff, Lawrence Berkeley National Laboratory (August 2004), available at http://drrc.lbl.gov/pubs/54974.pdf; Nicole Hopper, Charles Goldman and Bernie Neenan, Demand Response from Day-Ahead Hourly Pricing for Large Customers, 19:3 ELECTRICITY J. 52 (Apr. 2006) [hereinafter Hopper, et al.]. 135 Charles River Associates, Final Report on the Impact Evaluation of the California Statewide Pricing Pilot (March 16, 2005), available at http://www.energy.ca.gov/demandresponse/documents/group3_final_reports/2005-03-24_SPP_FINAL_REP.PDF. Customers on a similar CPP program at Gulf Power also have high satisfaction with the program, which incorporates automated response to CPP events.
49

what time and bill accordingly).136 Most conventional metering and billing systems are inadequate for charging time-varying rates, and most customers are not used to considering price changes in making consumption decisions on a daily or hourly basis. There is, however, a significant effort underway to improve metering technology and infrastructure to better facilitate end-use price responsiveness.137
2. Supplier Responses Interact with Customer Demand Responses to Drive Production Generation supply responses are equally important in the theoretical determination of an appropriate market price. The extent of supply responses will depend on the cost of increasing or decreasing output. Generally, the longer industry has to adjust to a change in demand, the lower the cost of expanding output will be. With more time, firms have more opportunity to change their operations or invest in new capacity. If the cost of increasing production is small, a relatively small price increase may be enough to encourage producers to increase production in response to increased demand. If the cost of increasing electricity output is high, however, suppliers will not increase production unless the price increases enough to cover the higher costs. In that case, customers would be compelled to pay significantly higher prices for additional supply. Additionally, when suppliers are already delivering as much electric power as they physically can, increased demand can be met only from new capacity. If prices are to provide incentives for resource additions, suppliers must be confident that prices will remain high enough for long enough to justify building a new generating plant. These supply decisions are complicated because electric power cannot be stored economically, thus there are generally no inventories of electricity. Therefore, electricity generation must always exactly match electricity consumption.138 The lack of inventories means that wholesale demand is nearly completely determined by end-use demand.139 Moreover, any distant generation must “travel” over a transmission system with its own limiting physical characteristics.140 Transmission capability must allow customers access to distant generation sources. The system is further complicated by the dynamics of the AC transmission grid, which can create network effects and can produce positive externalities (depending on the method used in accounting for transmission costs).141 That is to say, where transmission users are not charged for the congestion impacts of their use patterns, users’ actions can cause costs to others which the causal party is not obligated to pay. This dynamic can distort the effect of price signals on dispatch efficiencies.
136 See EEI comments. Pepco cautions that many customers, particularly residential and commercial customers, are relatively inflexible in responding to price changes due to constraints imposed by their operations and equipment. See Pepco comments. 137 See DOE EPAct Demand Response Report; Mercatus Center comments (2). 138 APPA comments. 139 While the demand for surplus energy in wholesale markets can vary as a function of the cost of owned generation and existing contracts, the ultimate demand for energy is entirely a function of end-use load. 140 Alcoa comments. 141 TAPS comments.
50

Another complication derives from the fact that aggregate retail demand fluctuates throughout the day and over seasons, with typically higher demand during the day than at night. System operators must maintain a sufficient mix of generating capacity and demand response (plus a margin of standby generation and demand response for system support and reliability purposes) to meet peak customer demands at all times – even if a substantial share of that resource mix is only used during a small portion of the day or year. Thus, load-serving entities must supply or procure (through long-term contracts and/or short-term “spot” market purchases) sufficient “energy” and demand response to meet varying loads. Generating resources designed to meet these load changes are generally categorized as “base” load, “intermediate” load and “peak” load. Base load generation runs more or less constantly and can be expensive to build but inexpensive to run once it is built (i.e., large coal and nuclear plants). Intermediate load plants are designed to be brought online and shut down quickly to meet fairly predictable daily changes in load above the base level and below peak. A variety of generating plants can be used for intermediate loads, including gas turbines, gas- and oil-fired steam boilers and hydro-electric plants. Peak load generation tends to come from units such as combustion turbines that can respond rapidly to changes in load, are quick and inexpensive to build, but are often expensive to run. The costs of generating electricity for these different applications can differ substantially. In any case, a higher price driven by resource scarcity should signal a legitimate opportunity for economic profit, attracting new resource construction where it is most highly valued. At the same time customer demand may decrease in response to rising prices. The increase in resources coupled with a demand response should work together to bring prices down. 3. Customer and Supplier Behavior Responding to Price Changes in Markets In sum, the combined impact of consumer and supplier responses to changed market conditions should produce a new market equilibrium price. Current prices must change when they create an imbalance between the quantity demanded and the quantity supplied. For example, when demand spikes, short-run prices might have to swing sharply higher to provide incentives for short-run supply increases. However, consumers do not have many good substitutes for electric power, and suppliers usually cannot increase output instantly or transport distant available generation to increase the quantity supplied to a market. Even if higher prices give incentives to change behavior, consumers and producers may have little ability to do so in the short term. Over longer time frames, however, they have more options to react to higher prices. The result is that long-run price increases usually will be much smaller than the short-run price increases needed to induce additional generation. C. Comparing the Benefits to the Costs of Restructuring Markets for Electricity While the shortcomings of cost-based regulation played a major role in the shift toward competitive electricity market structures, some market participants question whether the benefits outweigh the costs associated with establishing such markets. Some question whether electricity markets are, by nature, sufficiently competitive to warrant expected price reductions.142 They note the cost of operating ISOs and the cost to consumers of market manipulations and failures. Respondents to these concerns suggest that these markets are too new to warrant passing such
142 APPA comments.
51
judgment. They note that these failures may be a result of ill-advised market designs, and they find benefits despite such failures.
As various regulatory bodies considered whether to deregulate electricity markets, some conducted formal cost-benefit studies to address the relative benefits of the status quo versus proposed policy changes. The Task Force received many comments identifying, endorsing, or criticizing such studies. The Task Force did not, however, have the resources or time to fully examine, critique, or draw definitive conclusions from these widely varying studies. An annotated bibliography of many of these studies is attached as Appendix C. The Task Force also refers the reader to the summary conclusion of a recent DOE review of RTO benefit cost studies. See Box 2-3.
Box 2-3 Review of Cost-Benefit Studies
In December 2005, the Department of Energy released a study reviewing recent RTO Cost/Benefit analyses. This study provides a review of the state of the art in RTO Cost/Benefit studies and suggests methodological improvements for future studies. Following is a summary of this study’s conclusions. In recent years, government and private organizations have issued numerous studies of the benefits and costs of regional transmission organizations (RTOs) and other electric market restructuring efforts. Most studies have focused on benefits that can be readily estimated using traditional production-cost simulation techniques, which compare the cost of centralized dispatch under an RTO to dispatch in the region without an RTO, and on the costs associated with RTO start-up and operation. Taken as a whole, it is difficult to draw definitive conclusions from these studies because they have not examined potentially much larger benefits (and costs) resulting from the impacts of RTOs on reliability management, generation and transmission investment and operation, and on wholesale electricity market operation. Existing studies should not be criticized for often failing to consider these additional areas of impact, because for the most part neither data nor methods yet exist on which to base definitive analyses. The primary objective of future studies should be to establish a more robust empirical basis for ongoing assessment of the electric industry’s evolution. These efforts should focus on impacts that have not been adequately examined to date, including reliability management, generation and transmission investment and operational efficiencies, and wholesale electricity markets. Systematic consideration of these impacts is neither straightforward nor possible without improved data collection and analysis. J. Eto, B. Lesieutre, & D. Hale, A Review of Recent RTO Benefit-Cost Studies: Toward More Comprehensive Assessments of FERC Electricity Restructuring Policies (December 2005) (prepared for the Department of Energy).
52

CHAPTER 3 COMPETITION IN WHOLESALE ELECTRIC POWER MARKETS
A. Introduction and Overview As described in the preceding chapters, prior to the introduction of wholesale market competition, vertically integrated utilities sold their excess electric power to other utilities and to wholesale customers such as municipalities and cooperatives that had little or no generating capacity of their own.143 FERC and its predecessor agency, the Federal Power Commission, regulated prices, terms and conditions of interstate wholesale sales by investor-owned utilities. Wholesale purchasers’ desire to escape being captive to a vertically integrated monopoly supplier of electricity was a fundamental impetus to opening the generation sector to competition.144 Sellers of wholesale power were also interested in accessing more customers. This desire for competition to play a greater role in determining supply and demand is consistent with standard economic theory, which asserts that effective competition ensures an economically efficient allocation of resources. As described in Chapter 2, an important effect of a competitive market operation is that it provides customers with prices that reflect market conditions (abundance, scarcity, etc.). These market-based prices are an essential component of effective competition, as they discipline both consumption and production such that the cost of generating electricity is minimized. However, the demand for wholesale power is derived entirely from consumption choices at the retail level. In electricity there has been an impediment to efficiency in that prices of electricity to retail customers often are not directly connected to the wholesale prices in the market in which supplies are sold. This is because states have jurisdiction over retail prices, and state regulators generally set retail rates based on average costs. Thus, unlike wholesale market-based prices, retail prices did not vary with consumption or the cost of production.145
The effects of this regulated price disconnect are heightened by one of the shortcomings of cost-based rate regulation: its difficulty in providing incentives for investors to make economically efficient decisions concerning when, where, and how to build new generation.146 If competition is to allocate resources in an economically efficient manner, customers must have access to a sufficient number of competing suppliers either via transmission, incumbent generation, demand response, or new local generation.147 143 Wholesale markets involve sales of electric power among generators, marketers, and load serving entities (i.e., distribution utilities and competitive retail providers) that ultimately resell the electric power to end-use customers (e.g., residential, commercial, and industrial customers). 144 U.S. v. Otter Tail Power Company, 410 U.S. 366 (1973) (the United States sued a vertically integrated utility when it refused to deal with the Town of Elbow Lake, MI, a town that was seeking alternative sources of wholesale power for a planned municipal distribution system). 145 See discussion infra Chapter 1. 146 Retail price impacts of competition are discussed in this report's Chapter 4. 147 In a 2002 report, the then-named General Accounting Office made a related point, connecting increasing competition to structural changes. U.S. General Accounting Office, GAO-03-271, Lessons Learned From Electric Industry Restructuring, at 21 (2002) (“Increasing the amount of competition requires structural changes within the electric industry, such as allowing a greater number of sellers and buyers of electricity to enter the market”).
53
Competitive policies in electricity markets were introduced to alleviate these disconnects between retail demand, wholesale demand, and investment incentives and to create more efficient markets.148 In EPAct 1992, Congress determined that competition in wholesale electric markets would benefit from two changes to the traditional regulatory landscape: (1) expansion of FERC’s authority to order utilities to transmit, or “wheel,” electric power on behalf of others over their own transmission lines and (2) reduction of entry barriers so additional nonutilities could enter the market. The former change permitted wholesale customers to purchase supply from distant generators, while the latter provided customers with competitive alternatives from independent entrants.149 In examining the experience with competition to date, a fundamental question to ask is whether competition in wholesale markets has resulted in sufficient generation supply and transmission to provide wholesale customers with the kind of choice that is generally associated with competitive markets. This is the primary question the Task Force attempts to address in this chapter. Answering this question has been challenging due to difficulties in identifying determinants of investment decisions. Each region was at a different regulatory and structural point when Congress enacted EPAct 1992. For example, some regions began with tight power pools, while others operated transmission and generation in a less centralized manner. Some regions had higher population densities and thus more tightly configured transmission networks than did others. Some regions had access to fuel sources unavailable or less available in other regions (e.g., natural gas supply in the Southeast, hydropower in the Northwest). Currently, some regions operate under a transmission open-access regime that has not changed since the early days of open access, while other regions have well developed independent providers of transmission services and organized day-ahead exchange markets for electric power and ancillary services. This chapter discusses the question at hand anecdotally – by addressing whether and how entry has occurred in several regions with different forms of competition (i.e., the Midwest, Southeast, California, the Northwest, Texas, and the Northeast). It includes a discussion of how long-term purchase and supply contracts, capital requirements, regulatory intervention, and transmission investment affect supplier and customer decisions. The chapter concludes with observations on various regional experiences with wholesale competition.150 These observations highlight the trade-offs involved with various policy instruments used to introduce competition. B. Background One of the overall purposes of EPAct 1992 was “to use the market rather than government regulation wherever possible both to advance energy security goals and to protect consumers.”151 Policymakers recognized that vertically integrated utilities had market power in both 148 It is important to note that competition in wholesale electric markets may not lead to an efficient allocation of resources involving the services that prevent network collapse. Where there are “public good” aspects to the delivery of a good or service, such as with reliability, regulation may be the best way to ensure that the correct level of the good or service is provided. In some circumstances, however, market remedies may be available that are superior to regulation. 149 See EPAct 1992 House Report, H.R. REP. NO. 102-474(I), at 138. 150 The New York State Public Service Commission correctly commented that another metric with which to measure competition is its effect on production efficiencies. The Task Force did not seek to quantify this effect, given the constraints of the Report. 151 EPAct 1992 House Report, H.R. REP. NO. 102-474(I), at 133.
54
transmission and generation because they owned all transmission and nearly all generation plants within certain geographic areas. Congress enhanced FERC’s ability to reduce monopoly power by enhancing its authority to order utilities, case by case, to transmit power for alternative sources of generation supply. Today, vertically integrated utilities and other entities that operate transmission systems generally are required to offer transmission service under the terms of the standard Open Access Transmission Tariff (OATT) adopted by FERC in Order No. 888.152 Transmission providers offer two types of long-term transmission service under the OATT: network integration transmission service (network service) and point-to-point transmission service. Box 3-1 describes both types of transmission service. The OATT seeks to put market participants on equal footing when it comes to transmission access – making competition more viable. Price has been predictable and stable for both OATT services over the long term.153
152 See discussion infra Chapter 1 for more information on FERC Order No. 888. 153 The demand charge for long-term point-to-point transmission service is known in advance. For network service, the transmission customer pays a load-ratio share of the transmission provider’s FERC-approved transmission revenue requirement. Thus, even if redispatch to relieve transmission congestion occurs and the costs are charged to customers, or expansion is necessary and the expansion costs are added to the revenue requirement, the distribution over the whole system has allowed the charges to individual customers to remain relatively stable. Customers who take either service have a right to continue taking service when their contract expires, although point-to-point customers may have to pay a different rate (up to the maximum rate in the transmission provider’s tariff) if another customer offers a higher rate.
55

Box 3-1 How Transmission Services Are Provided Under the OATT
OATT contracts can be for point-to-point (PTP) or “network” transmission service. Network integration transmission service allows transmission customers (e.g., load-serving entities) to integrate their generation supply and load demand with that of the transmission provider. A transmission customer taking network service designates “network resources,” which include all generation owned, purchased or leased by the network customer to serve its designated load, and individual network loads to which the transmission provider will provide transmission service. The transmission provider then provides transmission service as necessary from the customer’s network resources to its network load. The customer pays a monthly charge for this basic service, based on a “load ratio share” (i.e., the percentage share of the total load on the system that the customer’s load represents) of the transmission-owning and operating utility’s “revenue requirement” (i.e., FERC-approved cost-of-service plus a reasonable rate of return).
In addition to this basic charge, there may be additional charges. For example, when a transmission customer takes network service, it agrees to “redispatch” its generators as requested by the transmission provider. Redispatch occurs when a utility, due to congestion, changes the output of its generators (either by producing more or less energy) to maintain the energy balance on the system. If the transmission provider redispatches its system due to congestion to accommodate a network customer’s needs, the costs of that redispatch are passed through to all of the transmission provider’s network customers, as well as to its own customers, on the same load-ratio share basis as the basic monthly charge.
The transmission provider must plan, construct, operate and maintain its transmission system to ensure that its network customers can continue to receive service over the system. To the extent that upgrades or expansions are needed to maintain service to a network customer, the costs are included in the transmission-owning utility’s revenue requirement, thus impacting the load-ratio share paid by network customers.
Point-to-point transmission service, which is available on a firm or non-firm basis and on a long-term (one year or longer) or short-term basis, provides for transmission between designated points of receipt and designated points of delivery. Transmission customers that take this kind of service specify a contract path. A customer taking firm point-to-point transmission service pays a monthly demand charge based on the amount of capacity it reserves. Generally, the demand charge may be the higher of the transmission provider’s embedded costs to provide the service, or the incremental costs of any system expansion needed to provide the service. If the transmission system is constrained, the demand charge may reflect the higher of the embedded costs or the transmission provider’s “opportunity” costs, with the latter capped at incremental expansion costs.
Comments to the Task Force raised several concerns over transmission-dependent customers’ access to alternative generator suppliers via OATTs. In particular, some commenters noted the
56

continued possibility of transmission discrimination in their regions and that the ability for transmission suppliers to discriminate can block access to alternative suppliers.154 Commenters concluded that transmission discrimination can increase delivery risk because purchasers fear their transmission transactions might be terminated for anticompetitive reasons by their vertically integrated rival, if they purchase from a generator that is not affiliated with the transmission provider. The facts that electricity cannot be stored economically and electricity demand is very inelastic in the short term heighten delivery risk. One response to this risk is to turn over operation of the regional transmission grid to an independent operator, such as the ISOs and RTOs that now operate in New England, New York, the Mid-Atlantic, the Midwest, Texas, and California (organized markets).155 RTOs address deliverability concerns in several ways.156 The market designs in these regions provide participants with guaranteed physical access to the transmission system (subject to transmission security constraints). See Box 3-2 for a discussion of how transmission is provided in organized wholesale markets.
154 APPA comments; TAPS comments. See also Midwest Stand-Alone Transmission Companies comments. 155 Prior to wholesale competition, several of the regions listed had “power pools” of utilities that undertook some central economic dispatch of plants and divided the cost savings among the vertically integrated utility members. 156 For example, RTOs using LMP pricing address physical deliverability concerns by giving physical access to all users willing to pay the market-determined price. The potential for high LMPs due to limited transmission availability presents a risk that many market participants prefer to hedge. Financial transmission rights (FTRs) have been developed as a means for transmission users to hedge against transmission pricing risk. The amount of FTR MWs available for hedging are determined by the transmission capabilities of the grid, so that a holder of an FTR generally can depend on being able to use the transmission service covered by the FTR. In some RTOs, FTRs are allocated on the basis of historic transmission use. In others, FTRs are allocated either through an auction or through a process that awards FTRs in proportion to the total requests for FTRs for a particular transmission service. Under the latter two approaches, some historic transmission users may have to acquire additional FTRs from other parties in order to hedge their previous levels of transmission use. In particular, in circumstances where certain transmission paths have become highly congested, historic transmission users may have to make significant expenditures to maintain traditional levels of transmission rights.
57

Box 3-2 How Transmission Is Priced in an ISO or RTO
ISOs and RTOs (hereinafter RTOs) provide transmission service across a region under a single transmission tariff. They also operate organized electricity markets for the trading of wholesale electric power and/or ancillary services. Transmission customers in these regions schedule with the RTO injections and withdrawals of electric power on the system, instead of signing contracts for a specific type of transmission service with the transmission owner under an OATT. The pricing for transmission service is substantially different in these regions than under a standard OATT. RTOs generally manage congestion on the transmission grid through a pricing mechanism called Locational Marginal Pricing (LMP). Under LMP, the price to withdraw electric power (whether bought in the exchange market or obtained through some other method) at each location in the grid at any given time reflects the cost of making available an additional unit of electric power for purchase at that location and time. In other words, congestion may require the additional unit of energy to come from a more expensive generating unit than the one that cannot be accessed due to the system congestion. In the absence of transmission congestion, all prices within a given area are the same at any given time. However, when congestion is present, the prices at various locations typically will not be the same, and the difference between any two locational prices represents the cost of transmission system congestion between those locations. This congestion cost constitutes the only significant “variable cost” of transmission – the fixed costs of infrastructure investment are recovered through a standard transmission access fee. Because congestion on the grid changes constantly, a transmission customer may be unable to determine beforehand the price for electric power at any location. To reduce this uncertainty, RTOs make a financial form of transmission rights available to transmission customers, as well as other market participants. Generally known as financial transmission rights (FTRs), they confer on the holder the right to receive certain congestion payments. Generally, an FTR allows the holder to collect the congestion costs paid by any user of the transmission system and collected by the RTO for electricity delivered over the specific path. In short, if a transmission customer holds an FTR for the path it takes service over, it will pay on net either no congestion charges (if the FTR matches the path exactly) or lower congestion charges (if the FTR partially matches), providing a financial “hedge” against the uncertainty. In general, FTRs are now available for one-year terms (or less) and are allocated to entities that pay access charges or fixed transmission rates. Pursuant to EPAct 2005, FERC has adopted rules to ensure the availability of long-term FTRs.
In regions with RTOs, wholesale electricity can be bought and sold through negotiated bilateral contracts, through “standard commercial products” available in all regions, and through various products offered by the organized exchange market. For bilateral contracts, the contract can be individually negotiated with terms and conditions unique to a single transaction. Standard products are available through brokers and over-the-
58
counter (OTC) exchanges such as the NYMEX and InterContinental Exchange (ICE).157 Standard products have a standard set of specifications so that the main variant is price. Finally, some RTOs also operate organized exchange markets that offer various products including electric power and ancillary services. These markets typically involve both real-time and day-ahead sales. Ancillary services include various categories of generation reserves such as spinning and non-spinning reserves in addition to Automatic Generation Control (AGC) for frequency control. As described above, there is a question as to whether the price signals described in Chapter 2 have functioned to elicit the consumption and investment decisions that were expected to occur with wholesale market competition. C. Wholesale Electric Power Markets and Generation Investment by Region New generation investment has varied significantly by region since the adoption of open access transmission and the growth of competition. Figure 3-1 shows the overall pattern of new investment by region. There has been substantial new investment in the Southeast, Midwest, and Texas, while other regions have not experienced as much investment. Each region has different pricing formats for transmission services. Moreover, regions that operate exchange markets for electric power and ancillary services use different forms of locational pricing, price mitigation, and capacity markets.
157 Companies can also limit their exposure to price swings through financial instruments rather than contracts for physical delivery of electricity. Such contracts are essentially a bet between two parties as to the future price level of a commodity. If the actual price for power at a given time and location is higher than a financial contract price, Party A pays Party B the difference; if the price is lower, Party B pays Party A the difference. In fact, in the United States electricity markets, such agreements are sometimes called “contracts for differences.” Purely financial contracts involve no obligation to deliver physical power. In this report, the Task Force discusses contracts for physical delivery rather than financial contracts, unless otherwise noted.
59
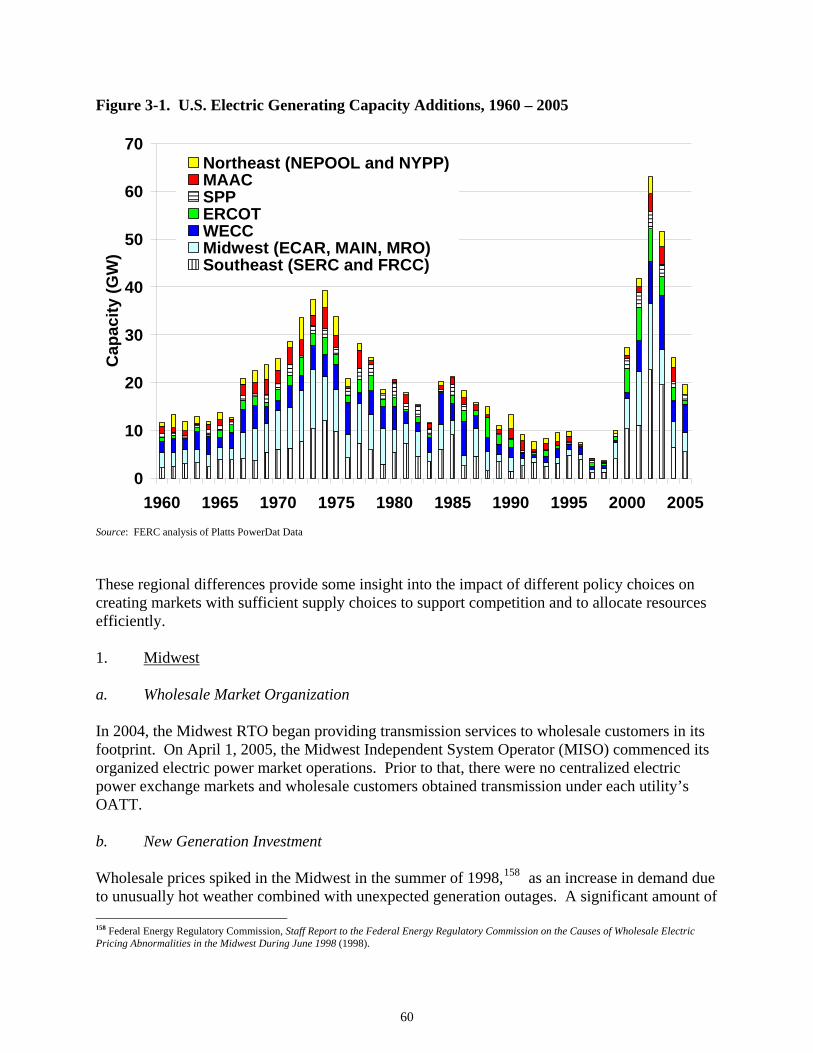
Figure 3-1. U.S. Electric Generating Capacity Additions, 1960 – 2005
0
10
20
30
40
50
60
70
1960 1965 1970 1975 1980 1985 1990 1995 2000 2005
Cap
acity
(GW
)
Northeast (NEPOOL and NYPP)MAACSPPERCOTWECCMidwest (ECAR, MAIN, MRO)Southeast (SERC and FRCC)
Source: FERC analysis of Platts PowerDat Data These regional differences provide some insight into the impact of different policy choices on creating markets with sufficient supply choices to support competition and to allocate resources efficiently. 1. Midwest a. Wholesale Market Organization In 2004, the Midwest RTO began providing transmission services to wholesale customers in its footprint. On April 1, 2005, the Midwest Independent System Operator (MISO) commenced its organized electric power market operations. Prior to that, there were no centralized electric power exchange markets and wholesale customers obtained transmission under each utility’s OATT. b. New Generation Investment Wholesale prices spiked in the Midwest in the summer of 1998,158 as an increase in demand due to unusually hot weather combined with unexpected generation outages. A significant amount of 158 Federal Energy Regulatory Commission, Staff Report to the Federal Energy Regulatory Commission on the Causes of Wholesale Electric Pricing Abnormalities in the Midwest During June 1998 (1998).
60

new generation was built in response to the price spike, as shown in Table 3-1. For example, from January 2002 through June 2003, the Midwest added 14,471 MW in capacity.159
Most of the new generation was gas-fired, even though the region as a whole relies primarily on coal-fired generation.160 More recently, new generation has been coal fired, in part because of rising natural gas prices.161 This entry and the subsequent drop in wholesale power prices has resulted in (1) merchant generators in the region declaring bankruptcy and (2) vertically integrated utilities returning certain generation assets from unregulated wholesale affiliates to rate-base. 2. Southeast a. Wholesale Market Organization Wholesale customers in the region obtain transmission under each utility’s OATT (e.g., Entergy or Southern Companies). There are no centralized electric power markets specific to the region. b. New Generation Investment Due to the Southeast’s proximity to natural gas in the Gulf of Mexico and pipelines to transport it, natural gas is a popular fuel choice for those building plants in the region. The Southeast has seen considerable new generation construction, as shown in Figure 3-1. More than 23,000 MW of capacity were added in the Southern control area between 2000 and 2005,162 and several generation units owned by merchants or load-serving entities have been built in the Carolinas in the past few years. A significant portion of the region’s new generation was nonutility merchant generation, and a number of merchant companies that built plants in the 1990s have sought bankruptcy protection. Often, the plants of bankrupt companies have been purchased by local vertically integrated utilities and cooperatives, such as Mirant’s sale of its Wrightsville plant to Arkansas Electric Cooperative Corporation and NRG’s sale of its Audrain plant to Ameren.163 Even apart from bankruptcies, some independent power producers have withdrawn from the region.
159 Federal Energy Regulatory Commission, Office of Market Oversight and Investigations, State of the Markets Report: Assessment of Energy Markets for the Period January 1, 2002 through June 30, 2003, at 109 (2004), available at http://www.ferc.gov/legal/staff-reports.asp [hereinafter FERC State of the Markets Report 2002-2003]. 160 Id. at 50. 161 FERC State of the Markets Report 2004 at 77. 162 Southern comments. 163 See Fitch Ratings, Wholesale Power Market Update (Mar. 13, 2006), available at http://www.fitchratings.com/corporate/sectors/special_reports.cfm?sector_flag=2&marketsector=1&detail=&body_content=spl_rpt.
61
3. California a. Wholesale Market Organization The California ISO began operation in 1998 to provide transmission services. Concurrently, a separate Power Exchange (PX) operated electric power exchanges. After the 2000-2001 energy crisis, the PX was dissolved.164
b. New Generation Investment Even before the California energy crisis, California depended on imported electric power from neighboring states. Much of the generation capacity that serves load in Southern California was built a substantial distance away from the population it serves, making the region heavily dependent upon transmission. In the past few years, much of the generation in California has operated under long-term contracts negotiated by the state during the energy crisis.165 Since 2000-2001, California’s demand has increased, but construction of local generation has not kept pace. Over 6,000 MW of new generation capacity entered California in 2002-2003, but very little was built in congested, urban areas such as San Francisco, Los Angeles, and San Diego.166 Most new generation projects have been in Northern California.167 In the past five years, transmission investments have improved links between Southern and Northern California, and accessible generation investment in the Southwest has increased. 4. New England a. Wholesale Market Operation The New England ISO (ISO-NE) provides transmission services as well as a centralized electric power market. Under the electric power pricing mechanism adopted by ISO-NE, certain units used to maintain local resource adequacy must bid into the energy markets at marginal costs under must-run reliability contracts. The fixed costs of these high-priced units are recovered from users in the pertinent reliability zone. b. New Generation Investment Much of New England’s net new generation has been built in less populated areas of the region, such as Maine, while most of the demand for power is in southern New England. From January 2002 through June 2003, ISO-NE added 4,159 MW in capacity.168 There were fewer capacity additions in 2004 than in the two previous years. In 2004, four generation projects came on line. Generation retirements in 2004 totaled 343 MW, of which 212 MW are deactivated reserves.
164 Currently, the CAISO operates only an imbalance energy market. 165 See discussion infra Chapter 1, for a more extensive discussion of the Western Energy Crisis of 2000-2001. 166 FERC State of the Markets Report 2004 at 69; FERC State of the Markets Report 2002-2003 at 41-43. 167 CAISO comments. 168 FERC State of the Markets Report 2002-2003 at 109.
62

Demand growth in the organized New England markets has led to “load pockets,” areas of high population density and high peak demand that lack adequate local supply to meet demand and for which transmission congestion prevents use of distant generation. These pockets have not seen entry of generation to meet local demand, and transmission has not always been adequate to bridge this gap. In general, New England needs new generation in the congested areas of Boston and Southwest Connecticut, increased demand response, or increased transmission investment to reduce congestion. Significant transmission upgrades were expected to go into operation in Boston and Southwest Connecticut during 2006.169 Theoretically, locational prices should elicit generation investment where needed, but this has been inadequate in load pockets. The ISO-NE pricing methodology often did not allow the market clearing price to reflect the cost of generation used to serve the congested areas.170 The resulting locational prices were not sufficient to attract significant new entry. Several policies have been adopted to provide the needed incentives. In 2003, ISO-NE implemented a temporary measure known as the Peaking Unit Safe Harbor (PUSH) mechanism, which was intended to enable greater cost recovery for high-cost, low-use units in designated congestion areas; however, PUSH units were not able to recover all their fixed costs.171 In June 2006, FERC approved a settlement establishing a forward capacity market in New England that will project demand three years in advance and hold annual auctions to purchase power resources for the region’s needs.172 The forward capacity market includes a locational component to account for areas where transmission congestion limits the ability to import capacity necessary to meet local demand. 5. New York a. Wholesale Market Operation NYISO provides transmission services as well as a centralized electric power market. NYISO uses price mitigation to guard against wholesale price spikes, but, in contrast to early ISO-NE practice, it includes high-cost generators in marginal locational pricing. b. New Generation Investment New York traditionally has built generation in less populated areas and transmitted the power to more populated areas. For example, the New York Power Authority was created, in part, to get hydroelectric power from the Niagara Falls area into more congested areas of the state. From January 2002 through June 2003, NYISO added 316 MW in capacity.173 Three generating plants
169 ISO New England Inc., Forecast Report of Capacity, Energy, Loads, and Transmission, at 76 (2006), available at http://www.iso-ne.com/trans/celt/report/2006/2006_CELT_Report.pdf. 170 FERC State of the Markets Report 2002-2003 at 83 (“These load pockets did not exhibit materially higher locational prices in 2004, probably because the cost of expensive units used to ensure resource adequacy and transmission security in these areas are frequently not eligible to set the clearing price”). 171 Id. at 36. 172 Devon Power LLC, 115 FERC ¶ 61,340 (2006); Press Release, ISO New England Inc., ISO New England Announces Broad Stakeholder Agreement on New Capacity Market Design (Mar. 6, 2006), available at http://www.iso-ne.com/nwsiss/pr/2006/march_6_settlement_filing.pdf. 173 FERC State of the Markets Report 2002-2003 at 109.
63

with a total summer capacity of 1,258 MW came on line in 2004. Three plants totaling 170 MW retired in 2004.174 Currently, transmission constraints in and around New York City limit competition in the city and lead to greater use of expensive local generation, which results in high prices. NYISO uses price mitigation measures designed to avoid mitigating prices resulting from genuine scarcity. NYISO has separate mitigation rules for New York City. In an effort to lessen distortion of market signals, NYISO includes the cost of running generators to serve load pockets in its calculation of locational prices. Thus, potential entrants get a more accurate price signal regarding investment in the load pocket. In a further effort to spur new construction, NYISO also sets a more generous “reference price” for new generators in their first three years of operation (bids above the reference prices may trigger price mitigation).175 Unlike New England, New York is seeing new generation investment in at least one congested area. Approximately 1,000 MW of new capacity entered commercial operation in the New York City area in 2006. The fact that New York is better able than New England to match locational need with investment is likely due to New York’s clearer market price signals, both in energy markets and capacity markets. However, the Public Utility Law Project of New York commented that it is the public power agencies and traditional investor-owned utilities – rather than merchants responding to NYISO prices – that have invested in new infrastructure. The effect of load pockets on prices is shown in Figure 3-2, which estimates the annual value of capacity based on weighted average results of three types of auctions run by the NYISO. Capacity prices are higher in the tighter supply areas of NYC and Long Island.
174 FERC State of the Markets Report 2004 at 97. 175 FERC State of the Markets Report 2002-2003 at 39.
64

Figure 3-2. Estimate of Annual NY Capacity Values Dollars per kilowatt-year ($/kW-yr)
0.00
20.00
40.00
60.00
80.00
100.00
120.00
2003 2004 2005 2006 YTD (resultsthrough 7/28/06)W
eigh
ted
Ave
rage
ICA
P ($
/kw
-yr) LI
NYCROS
Source: FERC analysis of NYISO data 6. PJM a. Wholesale Market Operation The PJM Interconnection provides transmission services as well as a centralized electric power market. PJM has both energy and capacity markets. Its energy market has locational prices, and FERC recently approved, in principle, PJM’s proposal to shift to locational prices in its capacity markets.176 The locational capacity market has not yet been implemented. b. New Generation Investment PJM capacity includes a broad mix of fuel types. Recent PJM expansion into new territories has added significant low-cost coal resources to PJM’s overall generation mix, although the National Rural Electric Cooperative Association (NRECA) commented that other parts of PJM lack sufficient generation as a result of inadequate capacity additions. From January 2002 through June 2003, PJM added 7,458 MW in capacity.177 Capacity additions in 2004 were lower than in the two previous years, especially considering that PJM added significant new territory in 2004. In 2004, 4,202 MW of new generation was completed in PJM. During the year, 78 MW of generation was mothballed and 2,742 MW was retired.178 176 PJM Interconnection, L.L.C., 115 FERC ¶ 61,079, at 61,236, reh’g denied, 117 FERC ¶ 61,331 (2006). 177 FERC State of the Markets Report 2002-2003 at 109. 178 FERC State of the Markets Report 2004 at 112.
65

Like other areas, PJM depends on transmission to move power from areas of low-cost generation to areas of high demand. The flow is generally from the western part of PJM, an area with significant low-cost coal-fired generation, to eastern PJM. The easternmost part of PJM is limited by transmission line capacity constraints, which at times limit the deliverability of generation from the west. This means that higher-cost generation must be run in the eastern region to meet local demand. Furthermore, within the eastern region, there are areas of even more limited transmission. As a result, in some areas generation that is not economical to run is given reliability must-run (RMR) contracts to prevent it from retiring and possibly reducing local reliability.179 Recently, three utilities in PJM proposed major transmission expansions to increase capacity for moving power into eastern parts of PJM.180 In its comments, PJM contends that it is experiencing a “robust” level of new transmission investment for reliability upgrades. 7. Texas
a. Wholesale Market Operation
The Electric Reliability Council of Texas (ERCOT) manages power scheduling on an electric grid consisting of about 77,000 MWs of generation capacity and 38,000 miles of transmission lines. It also manages financial settlement for market participants in Texas's deregulated wholesale bulk power and retail electric market. The Public Utility Commission of Texas regulates ERCOT. ERCOT generally is not subject to FERC jurisdiction because its operations are not integrated with other electric systems outside of Texas (i.e., there is no interstate electric transmission). ERCOT is the only market in which regulatory oversight of the wholesale and retail markets is performed by the same governmental entity.
Each year, ERCOT determines the set of transmission constraints within its system that it deems Commercially Significant Constraints (CSCs). Once approved by the ERCOT Board, the CSCs and the resulting Congestion Zones are used by the ERCOT dispatch process for the next year. In 2005, ERCOT had six CSCs and five Congestion Zones. When the CSCs bind, ERCOT economically dispatches generation units’ bids against load within each zone. To balance the system in real time, ERCOT issues unit-specific instructions to manage Local (intra-zonal) Congestion, then clears the zonal Balancing Energy Market. The balancing energy bids from all the generators are cleared in order of lowest to highest bid.181
179 Id. at 188. 180 AEP proposes to build a new 765-kilovolt (kV) transmission line stretching from West Virginia to New Jersey, with a projected in-service date of 2014. AEP Interstate Project Summary, available at http://www.aep.com/newsroom/resources/docs/AEP_InterstateProjectSummary.pdf. Allegheny Power (Allegheny) proposes to construct a new 500-kV transmission line, with a targeted completion date of 2011, which will extend from southwestern Pennsylvania to existing substations in West Virginia and Virginia and continue east to Dominion Virginia Power’s Loudoun Substation. Allegheny Power Transmission Expansion Proposal, available at http://www.alleghenypower.com/TrAIL/TrAIL.asp. More recently, Pepco has proposed to build a 500-kv transmission line from Northern Virginia, across the Delmarva Peninsula and into New Jersey. 181 ERCOT Response to the DOE Question Regarding the Energy Policy Act 2005, available at http://www.oe.energy.gov/DocumentsandMedia/ercot2.pdf.
66
At least one study asserts that when there is local congestion, local market power is mitigated in ERCOT by ad hoc procedures aimed at keeping prices relatively low while maintaining transmission flows within limits. The study concludes that, as a result, prices may be too low to elicit needed investment when there is local scarcity. Since it is difficult for new entrants to enter local markets at these prices, local monopoly positions are essentially entrenched.182
b. New Generation Investment
In the late 1990s, developers added more than 16,000 MW of new capacity to the Texas market.183 Certain aspects of this market may make it attractive to new investment. Texas consumers directly pay (via their electricity bills) for transmission system updates made to accommodate new plants. In other states, FERC often requires developers to pay for system upgrades upfront and recoup the cost over time through credits against their transmission rates.184 In addition, the Texas PUC plans to implement an energy-only resource adequacy market design in the fall of 2006 that requires incrementally raising the energy offer caps over time. More than 13,000 MWs of new capacity is scheduled to be online in 2009-2011.185
c. Hybrid Wholesale/Retail Demand Response
ERCOT has a competitive market-based demand response program that allows competitive retailers, along with willing customers, to respond to market-based price signals. Under the Load Acting As a Resource Program (LAAR), customers bid demand response into ERCOT's ancillary services market for responsive reserves through their scheduling agent.186 If needed by ERCOT, the load is then paid the market-clearing price for responsive reserve. The LAAR program is fully subscribed at 1,150 MWs.
8. The Northwest
a. Wholesale Market Organization Wholesale customers obtain transmission service through agreements executed pursuant to individual utility OATTs. There are no centralized exchange markets specific to the region, but there is an active bilateral market for short-term sales within the Northwest and to the Southwest and California, which makes use of centralized electronic exchange platforms (such as the InterContinental Exchange). Several trading hubs with significant levels of liquidity provide price information. Multiple attempts to establish a centralized Northwest transmission operator have proven unsuccessful for a variety of reasons, including difficulties in applying standard restructuring ideas to a system dominated by cascading (i.e., interdependent nodes) hydroelectric generation and difficulties in understanding the potential cost shifts that might result in
182 Ross Baldick and Hui Niu, Lessons Learned: The Texas Experience, available at http://www.ece.utexas.edu/~baldick/papers/lessons.pdf. 183 U.S. General Accounting Office, GAO-02-427, Restructured Electricity Markets, Three States' Experiences in Adding Generating Capacity, at 9 (2002) [hereinafter GAO, Restructured Electricity Markets, Three States’ Experiences].184 Id. at 19. 185 Public Utilities Commission of Texas comments (2). 186 For more information regarding LAAR, see http://www.ercot.com/services/programs/load/laar.
67
restructuring contract-based transmission rights. A nascent organization created to enhance coordinated regional reliability and planning, ColumbiaGrid, has recently seated a board and begun development of various “functional agreements.”187
b. New Generation Investment The Northwest’s generation portfolio is dominated by hydroelectric generation, which comprises roughly half of all generation resources in the region on an energy basis.188 Coal and natural gas resources make up most of the remaining generation, with smaller contributions from wind, nuclear, and other resources. The hydroelectric share has decreased steadily since the 1960s. The Northwest’s hydroelectric base allows the region to meet almost any capacity demands within the region, but the region is susceptible to energy limitations (given the finite amount of water available to flow through dams). This ability to meet peak demand buffers incentives for building new generation, which might be needed to assure sufficient energy supplies during times of drought. In three out of four years, hydro generation can displace much of the existing thermal generation in the Northwest. However, generation was added in recent years to meet load growth and to attempt to capitalize on high-prices during the Western energy crisis of 2001-2002. Due to high power purchase costs during this crisis, some utilities have added thermal resources as insurance against drought-induced energy shortages and high prices. Altogether, over 3,800 MWs of new generation has been added to the Northwest Power Pool since 1995. Of that, 75 percent was commissioned in 2001 or later. D. Observations on Current Wholesale Market Options One of the most diffiult questions federal regulators currently face is whether the different forms of competition in wholesale markets have resulted in an efficient allocation of resources. The various approaches used by the different regions show the range of available options. 1. Open Access Transmission without an Organized Exchange Market One option is to rely on the OATT to make generation options available to wholesale customers. No centralized transmission operator or exchange market for electric power operates in regions that rely on this option (the Northwest and Southeast). However, active trading platforms can be found in these regions. These platforms provide liquidity and price transparency in some day-ahead or longer-term markets – although the prices do not directly reflect the costs of congestion. For long-term sales in these markets, wholesale customers shop for alternatives through bilateral contracts with suppliers. In both cases, customers separately arrange for transmission via the OATT. With a range of supply options to choose from, long-term bilateral contracts for physical supply can provide price stability for wholesale customers and send them a rough price signal so they can determine whether to build or buy. However, prices and terms can be unique to each transaction and may not be publicly available. Furthermore, the lack of centralized information about trades leaves transmission operators with system security risks that constrain transmission 187 Available at http://www.columbiagrid.org 188 For a complete discussion of generation characteristics of the Northwest, see NW Power & Con. Council, The Fifth Northwest Power and Conservation Plan, Ch. 2 (2005), available at http://www.nwcouncil.org/energy/powerplan/plan/Default.htm.
68
capacity. The lack of price transparency can add to the difficulty of pricing long-term contracts in these markets. This model depends significantly on the availability of transmission capacity that is sufficient to allow buyers and sellers to connect. Thus, it also depends on the accurate calculation and reporting of available transmission capacity. Short-term availability is not sufficient, even if accurately reported, to form a basis for long-term decisions such as contracting for supply or building new generation. Not only must transmission be available, it also must be seen to be available on a nondiscriminatory basis. As FERC noted in Order 2000, persistent allegations of discrimination can discourage investment even if they are not proven. Without the assurance of long-term transmission rights, wholesale customers may remain dependent on local generation owned by one or only a few sellers, because they cannot access competitive options supplied by more distant generation. Similarly, new suppliers may have no means of competing with incumbent generators located close to traditional load. 2. Organized Wholesale Markets In organized markets, market participants have access to an exchange market where prices for electric power are set in reference to supply offers by generators and demand by wholesale customers (including Load-Serving Entities or LSEs). While prices can be set by a number of mechanisms, all U.S. exchange markets have a uniform price auction to determine the price of electric power. Uniform price auctions theoretically provide suppliers an incentive to bid their marginal costs, to maximize their chance of getting dispatched. The principal alternative to uniform price auctions is a pay-as-bid market.189 Research on whether pay-as-bid auctions result in lower prices than do uniform price auctions has been evolving and the results are, at best, mixed. Theoretically, pay-as-bid auctions do not result in lower market-clearing prices and may even raise prices as suppliers base their bids on forecasts of market-clearing prices instead of their marginal costs. Recent research suggests that pay-as-bid can sometimes result in lower costs for customers.190 But the pay-as-bid approach may reduce dispatch efficiency, to the extent generator bids deviate from their marginal costs.191 From a practical perspective, academics and market designers generally agree that uniform price auctions in competitively structured markets produce economically efficient prices. Currently, in uniform price auction markets some generators (e.g., coal- or nuclear-fueled units) may be earning a return above those typically allowed under cost-based regulation. But other generators (e.g., natural gas-fueled units) are earning returns below those typically allowed under cost-based regulation. In a competitive market, a unit’s profitability in a uniform price auction will depend on whether, and by how much, its production costs are below the market clearing price. A uniform price auction thus may produce very high prices compared with the costs of 189 Under a pay-as-bid market, sellers are paid their actual bid prices, while under a “single price” or uniform price market, all sellers are paid the single market-clearing price. 190 Par Holmberg, Comparing Supply Function Equilibria of Pay-as-Bid and Uniform Price Auctions (2005) (Uppsala University, Sweden Working Paper 2005:17); G. Federico & D. Rahman, Bidding in an Electricity Pay-As-Bid Auction (Nuffield College Discussion Paper No 2001-W5, 2001); Joskow, Difficult Transition at 6-7. 191 Alfred E. Kahn, et al., Uniform Pricing or Pay-as-Bid Pricing: A Dilemma for California and Beyond (Blue Ribbon Panel Report, study commissioned by the California Power Exchange, 2001).
69

some generators and yet not high enough to give investors an incentive to build new generation that could moderate prices going forward. The uniform price auction creates strong incentives for entry by low-cost generators that will be able to displace high-cost generators in the merit dispatch order. The sufficiency of entry in uniform price auction markets has been a topic of discussion among policymakers and market participants. Four policy options have been suggested. a. Unmitigated Exchange Market Pricing One possible, but controversial, way to spur entry is to let wholesale market prices rise with scarcity.192 As discussed in Chapter 2, the market likely will respond in two ways. First, the resulting price spikes will attract capital and investment. To assure that the price signals elicit appropriate investment and consumption decisions, they must reflect the differences in prices of electricity available to serve particular locations. The costs of supplying customers within the region may vary where transmission capacity limits the availability of electric power from some generators within a regional market. Without locational prices, investors may not make wise choices about where to invest in new generation. Unfortunately, it is difficult to distinguish high prices due to the exercise of market power from those due to genuine scarcity. High prices due to scarcity are consistent with the existence of a competitive market, and therefore perhaps suggest less need for regulatory intervention. High prices stemming from the exercise of market power in the form of withholding capacity may justify regulatory intervention. Being able to distinguish between the two situations is therefore important in markets with market-based pricing.193
Second, higher prices likely will influence customer decisions about how much and when to consume. Price increases signal customers to reduce the amount they consume. Indeed, during the Midwest wholesale price spikes in the summer of 1998, consumption fell when prices rose as customers purchased little supply during those periods.194 To reduce consumption efficiently, retail customers must have the ability to react to accurate price signals. As discussed in Chapter 4, customers often have limited incentive, even in markets with retail competition, to reduce their consumption when the marginal cost of electricity is high. This is because retail rates in the short term do not vary to account for the costs of providing the electricity at the actual time it was consumed. b. Moderation of Price Volatility with Caps and Capacity Payments To date, the alternative to unmitigated exchange market pricing has been price and bid caps in wholesale exchange markets. Although price and bid caps may moderate wide swings in 192 In theory, a pivotal supplier could bid $1 million or more and set the clearing price, so in practice the ISO would have still set a cap, albeit a high one. In its comments, the Public Utilities Commission of Texas describes a plan it expects to adopt in summer 2006, to raise offer caps incrementally in its energy-only market. The Public Utilities Commission of Texas expects to ultimately pay $3000 per MWh for energy in some hours of the year. 193 See generally Edison Mission Energy, Inc. v. FERC, 394 F.3d 964 (D.C. Cir. 2005). 194 Robert J. Michaels and Jerry Ellig, Price Spike Redux: A Market Emerged, Remarkably Rational, 137 PUB. UTIL. FORTNIGHTLY 40 (1999). Wholesale customers with supply contracts for which the prices were tied to the market price paid higher prices for electric power during those hours.
70
market-clearing prices, there is disagreement as to the appropriate level of the caps. Higher caps may strike a balance between a policy of smoothing out the peaks of the highest price spikes and one of demonstrating where capital is required and can recover its full investment. Some argue, however, that high price caps may burden consumers with high prices and yet not allow prices to rise to the level that will actually ensure that investors will recover the cost of new investment.195 Thus prices can rise significantly and yet not attract additional supply that could eventually moderate price. Capacity payments are one way to ensure that investors recover fixed costs. Such payments can provide a regular payment stream that, when added to power market income, can make a project more economically viable. Like any regulatory construct, however, capacity payments have limitations. It is difficult to determine the appropriate level of capacity payments to spur entry without over-taxing market participants and consumers. In addition, because capacity payments include a reserve margin added on to demand, capacity markets may be more susceptible to market power than energy markets. These markets may not be viable unless there is some mitigation policy, but determining the appropriate mitigation policy is a challenge.196
To the extent that capacity rules change, there is a perception of risk about capacity payments that may limit their effectiveness in promoting investment and ultimately new generation. When rules change, builders and investors may take advantage of short-term capacity payment spikes in a manner that is inefficient from a longer-term perspective. If capacity payments are provided for generation, they may prompt generation entry when transmission or demand response would be more affordable and equally effective. Capacity payments also may reward traditional utilities and their affiliates disproportionately by providing significant revenues for units that are fully depreciated. Capacity payments also may discourage entry by paying uneconomical units to keep running instead of exiting the market. These concerns can be addressed somewhat by appropriate rules – e.g., NYISO’s rules giving capacity payment preference to newly-entered units. In general, however, it is difficult to tell whether capacity payments alone would spur economically efficient entry. One issue is whether capacity prices should be locational, similar to locational electric power prices. PJM, ISO-NE and NYISO have either proposed or implemented locational capacity markets that may increase incentives for building in transmission-constrained, high-demand areas. The combination of high electric power prices and high capacity prices in these areas may create adequate incentive to build generation in load pockets.197
195 Sometimes, in fact, entry may not be justified, even in the face of high prices. Potential entrants must consider the benefits as well as the costs of entry. Some areas may be so costly to enter, that it is more efficient for society as a whole to pay the higher prices rather than pay the high investment costs to build lower cost generation, institute price-responsive demand programs, or invest in transmission access to lower-cost generation. 196 Making demand response eligible to meet reserve margins may ease these concerns. 197 In the areas that need capacity the most – densely populated areas significantly bounded by topographical barriers such as oceans – land prices, environmental restrictions, aesthetic considerations, and other factors may make new generation more (or even prohibitively) expensive. In fact, there are some environmental restrictions that serve as de facto bars to new generation entry.
71
c. Encouraging Additional Transmission Investment Building the right transmission facilities may encourage entry of new generation or more efficient use of existing generation located near, but outside, load pockets. But transmission expansion to serve increased or new load raises the difficulty of creating a rate structure that ties the economic and reliability benefits of transmission to particular consumers. Because transmission investments can benefit multiple market participants, it is difficult to assess who should pay for the upgrade, particularly when some market participants do not require the transmission to meet their needs. This regulatory challenge may cause uncertainty about the price for transmission and about return on investment both for new generators and for transmission providers. Merchant transmission lines, built by nonutilities, once were thought to be a solution to the need for long distance transmission lines. However, few merchant lines have been built. Uncertainties about revenue have made financing difficult. In addition, difficulties in obtaining needed rights-of-way and environmental approvals have chilled potential merchant projects.198 Provisions of EPAct 2005 that allow for federal permitting of transmission projects under certain circumstances appear to have encouraged interest in new transmission projects, including merchant projects.199
Building or expanding transmission capacity, where possible, may remove the congestion that contributes to higher electricity prices in load pockets and other transmission-constrained areas. However, the potential for building new transmission may reduce the incentive to build new generation in the load pockets or develop demand response and thus may sustain the high prices there. Once new transmission capacity is built, it will increase supply options and decrease or dampen prices just as newly built generation or demand response would. Building or expanding transmission may increase supply more cost effectively than building new generation in load pockets and other constrained areas. Both generation and merchant transmission builders must deal with an existing transmission owner or an RTO/ISO to obtain permission to interconnect their facilities. Moreover, there are substantial difficulties in siting new transmission lines. It is difficult to assess whether these risks are higher for transmission builders than for generation builders or demand response programs. d. Governmental Control of Generation Planning and Entry The final alternative is a regulatory, rather than market, mechanism to assure that adequate generation is available to wholesale customers. As a method to spur investment, regulatory oversight of planning has some positive aspects, but it also has costs. Using regulation through governmentally determined resource planning to encourage entry could result in more entry than through market-based solutions, but that entry may not occur where, when, or in a way that most
198 PJM Interconnection, L.L.C., PJM Regional Transmission Expansion Plan, at 20 (2006), available at http://www.pjm.com/planning/reg-trans-exp-plan.html. 199 See supra note 180. AEP and Allegheny are both requesting that their proposed transmission projects be designated as a National Interest Electric Transmission Corridor under EPAct 2005.
72

benefits customers. Regulatory oversight of investment also means regulators can bar entry for reasons other than efficiency. The stable rate of return on invested capital under rate regulation can encourage investment. On the other hand, rate regulation can lead to overinvestment, excessive spending and unnecessarily high costs. Regulation also does not provide the same market discipline that effective competition provides. Under regulation, ratepayers may bear the risk of mistakes resulting from where and how investments are made. In competitive markets, the penalties for such mistakes fall on management and shareholders. Future accountability for investment decisions can lead to better decision-making at the outset.200
Some commenters strongly supported Integrated Resource Planning or other governmentally supervised planning processes to provide optimal fuel diversity.201 In particular, they were concerned that the market acting alone creates boom-bust cycles where investors overreact to market signals and too many parties invest in one region. This creates overcapacity, which in turn leads to lower prices. Regulatory oversight of planning could result in greater fuel diversity, and thus less exposure to risks associated with changes in fuel prices or availability. Although IRP often includes consideration of future fuel prices, it is difficult to determine in advance the appropriate mix of fuels given the difficulty of projecting fuel prices. Regulators and planners too can make flawed resource decisions and have done so in the past. 3. Market Oversight of Wholesale Energy Markets
Under current law, market oversight to prevent anticompetitive behavior is an important feature of organized wholesale electricity markets. There is consensus about the need for market oversight and rules to ensure that wholesale electricity markets function efficiently and provide benefits to consumers. FERC’s Office of Enforcement and state regulators perform this service by reviewing wholesale electricity markets and the reports of internal and independent market monitors.202 Organized markets also are subject to ongoing scrutiny by state regulators and the independent market monitoring arms of RTOs.203 In sum, market oversight continues to be a vital element of organized wholesale markets, and efforts are ongoing to strengthen the oversight process. E. Factors that Affect Investment Decisions in Wholesale Electric Power Markets The Task Force examined comments on how competition policy choices have affected investment decisions of buyers and sellers in wholesale markets. A number of issues emerged. One was the difficulty of raising capital to build facilities whose revenue streams are affected by changing fuel prices, demand fluctuations, and the potential for regulatory intervention. A related theme was the investment dampening effects of a perceived lack of long-term contracting options. Some commenters asserted that significant problems still exist in organized markets, including steep price increases in some locations without the moderating effect of long-term
200 Regulatory solutions, more so than market-based outcomes, may outlive the circumstances that made them seem reasonable. 201 New York G&E comments; Idaho PUC comments. 202 FERC’s efforts are not limited to the organized markets, and extend to other markets as well. Also, federal and state antitrust enforcement agencies have jurisdiction to challenge anticompetitive conduct in electricity markets. 203 NYPSC comments.
73
contracting and new construction.204 Alternately, the comment was made that in some markets prices are so low that they discourage entry by new suppliers, despite growing projected demand relative to supply.205 Overall, the Task Force identified six factors that affect investment decisions in wholesale power markets. Commenters cited long-term contracts as a critical prerequisite in obtaining financing for new generators.206 Both generators and consumers said they were unable to arrange long term contracts. 1. Unavailability of Long-Term Supply Contracts - Wholesale Buyer Perspective Many wholesale buyers said they had sought to enter into long-term contracts but found few or no offers.207 The Task Force attempted to determine whether the available data supported these allegations by examining 2004-2005 data collected by FERC through its Electric Quarterly Reports for three regions – New York, the Midwest, and the Southeast. Appendix E contains this analysis. Although inconclusive (due to data limitations described in Appendix E) the analysis showed that contracts of less than one year predominated in each of the three regional markets examined. In two of the markets, longer contract terms were observed to be associated with lower contract prices on a per MWh basis. Three reasons may explain why buyers perceive they cannot enter long-term purchase power contracts.208 First, the APPA commented that its members in RTO regions who attempt to procure power under long-term bilateral arrangements have found it difficult to arrange contracts with base-load and mid-merit generators at prices that reflect the generators' long-term total cost structure. Base-load and mid-merit generators may see relatively high profits when gas-fueled generators are the marginal units, particularly when natural gas prices rise. Natural gas-fueled generators in a uniform price auction may see lower profits as their fuel costs rise, to the extent other generation becomes relatively more economical.209 When natural gas units set the market price, these units may recover only a small margin over their operating costs, while nuclear and coal units recover larger margins. Under the competitive model, entry will occur if long-term prices exceed long-term costs. In fact, recent proposals for new generation show a significant number of proposals to build base-load and mid-merit generation.210 In addition, at least some wholesale customers may have the option of investing in their own generation projects - either directly or through affiliates or joint ventures with other interested parties - if they are dissatisfied with the 204 ELCON comments; NRECA comments; APPA comments. 205 E.g., PJM comments; EPSA comments. 206 Constellation comments; Mirant comments. 207 ELCON comments. 208 In competitive markets, customers also have the ability to build their own generation facility if they are unable to obtain the long-term purchase contracts that they seek. 209 See, e.g., Maine Public Advocate comments; NASUCA comments. 210 The July 2006 Energy Velocity database shows that of the 165,163 MW of generation that is permitted, proposed, application-pending or has had a feasibility study performed, 110,964 MW, about two-thirds, is nuclear, combined cycle, coal-fired steam or integrated coal gasification technology (generation types typically considered base-load or mid-merit).
74

terms offered by incumbent suppliers. Indeed, in some regions, public power and cooperative utilities have announced plans to participate in new base-load generating plants. Because of the long lead times and considerable uncertainties involved, it will be some years before electricity from any of these plants can enter the market. There are additional theoretical problems with the effectiveness of competition in providing investment incentives in that the very competitiveness of these markets cannot be assumed. For example, over 10 years ago, FERC requested comments on a wholesale “PoolCo” proposal, the predecessor to today’s organized electricity market with open transmission access.211 At the time, the U.S. Department of Justice generally supported the emerging market form but warned:
The existence of a PoolCo cannot guarantee competitive pricing, since there may be only a small number of significant sellers into or buyers from the pool. The Commission should not approve a PoolCo unless it finds that the level of competition in the relevant geographic markets would be sufficient to reasonably assure that the benefits of eliminating traditional rate regulation exceed the costs.212
These concerns are heightened by the fact that the market-clearing price in organized exchange markets may be established by a changing subset of generators depending upon fluctuations in consumer demand and transmission congestion.213 Indeed, some commenters specifically cited recent studies that argue that electricity markets need a larger number of suppliers to sustain competitive pricing than are needed for other commodities.214
A second explanation for the perceived lack of long-term purchase contracts may be related to limited trading opportunities to hedge the potential costs of long-term commitments. Long-term contracts in other commodities are often priced with reference to a “forward price curve.” A forward price curve graphs the price of contracts with different maturities. The forward prices graphed are instruments that can be used to hedge (or limit) the risk that market prices at the time of delivery may differ from the price in a long-term contract. In a market with liquid forward or futures contracts, parties to a long-term contract can buy or sell products of various types and durations to limit their price risk. Currently, liquid electricity forward or futures markets often do not extend beyond two to three years.215 In some markets, one-year contracts are the longest available. In markets where retail load is served by contracts of fixed durations, such as the three-year obligations in New Jersey and Maryland, contracts for the duration of the obligation are growing slowly in number. But the relative lack of liquidity may discourage parties from 211 See Inquiry Concerning Alternative Power Pooling Institutions Under the Federal Power Act, Notice of Inquiry, 59 Fed. Reg. 54,851 (Oct. 26, 1994), FERC Stats. & Regs. ¶ 35,529 (1995) (FERC Docket No. RM94-20-000). 212 Comments of U.S. Department of Justice, Inquiry Concerning Alternative Power Pooling Institutions Under the Federal Power Act, at 6 (Mar. 2, 1995) (FERC Docket No. RM94-20-000). See also Reply Comments of the U.S. Department of Justice, Inquiry Concerning Alternative Power Pooling Institutions Under the Federal Power Act (Apr. 3, 1995) (FERC Docket No. RM94-20-000). 213 See Comment of the Federal Trade Commission, Market-Based Rates for Public Utilities, at 7-8 (Jul. 16, 2004) (FERC Docket No. RM04-7-000), available at http://www.ftc.gov/os/comments/ferc/v040021.pdf. 214 APPA comments; Carnegie Mellon comments. 215 Nodir Adilov, Forward Markets, Market Power, and Capacity Investment (2005) (Cornell Univ. Dep’t of Econ. Job Mkt. Papers), available at http://www.arts.cornell.edu/econ/na47/JMP.pdf.
75

signing long-term contracts, because they lack the ability to "hedge" these longer-term obligations. Finally, the availability of long-term purchase contracts depends on the availability and certainty of long-term delivery options (transmission). Box 3-2 above describes how transmission prices are set in organized exchange markets. Wholesale customers have argued that the inability to secure firm transmission rights for multiple years at a known price, particularly in organized markets, introduces unacceptable uncertainty in resource planning, investment, and contracting.216 They say this financial uncertainty has hurt their ability to obtain financing for new generation projects, especially new base-load generation. Congress addressed the issue of insufficient long-term contracting in the context of RTOs and ISOs in EPAct 2005. In particular, section 1233 of EPAct 2005 provides that:
[FERC] shall exercise the authority of the Commission under this Act in a manner that facilitates the planning and expansion of transmission facilities to meet the reasonable needs of load-serving entities to satisfy the service obligations of the load-serving entities, and enables load-serving entities to secure firm transmission rights (or equivalent tradable or financial rights) on a long-term basis for long-term power supply arrangements made, or planned, to meet such needs.217
To implement this provision in RTOs and ISOs, FERC adopted new rules regarding FTRs in July 2006. The rules require such organizations to offer long-term firm transmission rights. FERC did not specify a particular type of long-term firm transmission right, but instead established guidelines for the design and administration of these rights, such as the length of terms and the allocation of those rights to transmission customers. 2. Unavailability of Long-Term Supply Contracts – Generator/Investor Perspective Commenters cited long-term contracts as a critical prerequisite in obtaining financing for new generators.218 Comments from generation investors suggested that their ability to arrange long-term contracts is inhibited by several uncertainties. Most of these uncertainties arise from the unpredictability of state and federal regulation. Finally, the nascence of market structures for the sale of electricity can make it difficult for market participants to have settled expectations about the risk of long-term contracts. A description of the uncertainties associated with regulatory risk follows. One type of regulatory uncertainty derives from the fact that most wholesale contracts are subject to regulation by FERC, and a party to a contract can ask FERC to change prices and terms, even
216 APPA comments; TAPS comments. 217 Pub. L. No. 109-58, § 1233, 119 Stat. 594, 958 (2005) (emphasis added). 218 Constellation comments; Mirant comments.
76

if the specific contract has been approved previously.219 For example, in 2001-2002, several wholesale power purchasers asked FERC to modify certain contracts entered into during the California energy crisis. They alleged that problems in the California electricity exchange markets had caused their contracts to be unreasonable. The sellers argued that if FERC overrides existing contracts, market participants would not be able to rely on contracts when transacting for power and managing price risk. In declining to change the contracts,220 FERC cited its obligation to respect contracts except when other action is necessary to protect the public interest.221
A second type of regulatory uncertainty involving bankruptcy may limit future market opportunities for merchant generators and thus reduce their ability to raise capital. In recent years, several merchant generators (NRG, Mirant and Calpine) have sought to use the bankruptcy process to break long-term power contracts.222 This bankruptcy risk may create an additional incentive to favor construction of generation by load-serving entities or to purchase from utility affiliates over wholesale purchases from merchant generators.223 These disputes have spawned conflicting rulings in the courts. In particular, these cases have centered on separate, but intertwined issues. First, there is a question of where jurisdiction over efforts to end power contracts properly lies, as between FERC and the bankruptcy courts, and to what extent courts may enjoin FERC from acting to enforce power contracts. Second, there is an issue of what standard applies to such efforts (what showing must a party make to rid itself of a contract). The law remains unsettled, as do parties’ expectations.
A third type of regulatory uncertainty concerns regulated retail service in states with retail competition.224 The uncertainty over how much supply a distribution utility will need to serve its customers, who have the option to switch, can prevent or discourage utilities from signing long-term contracts.225 The extent of this disincentive is unclear if competitive options are available for distribution utilities to purchase needed supply or sell excess supply.
A fourth type of uncertainty relates to a general concern about institutional instability. Some market participants argue that they cannot count on current rules and trading mechanisms 219 In December 2005, FERC proposed to adopt a general rule on the standard of review that must be met to justify proposed modifications to contracts under the FPA, except transmission service agreements executed under an open access transmission tariff as provided for under Order No. 888, and under the Natural Gas Act, except agreements for the transportation of natural gas executed pursuant to the standard form of service agreement in pipeline tariffs. Standard of Review for Modifications to Filed Agreements, Notice of Proposed Rulemaking, 71 Fed. Reg. 303 (January 4, 2006), FERC Stats. & Regs. ¶ 61,317 (2005) (Comm’r Kelly, dissenting). Specifically, FERC proposed that, in the absence of specified contractual language permitting the Commission to act on proposed modifications to an agreement on its own motion or on behalf of a signatory or non-signatory under the “just and reasonable” standard, the Commission, a signatory or a non-signatory seeking to change a contract must show that the change is necessary to protect the public interest. FERC explained that its proposal recognized the importance of providing certainty and stability in energy markets, and helped promote the sanctity of contracts. A final rule is pending. 220 Nevada Power Company v. Enron, 103 FERC ¶ 61,353, order on reh’g, 105 FERC ¶ 61,185 (2003); Public Utilities Commission of California
v. Sellers of Long Term Contracts, 103 FERC ¶ 61,354, order on reh’g, 105 FERC ¶ 61,182 (2003); PacifiCorp v. Reliant Energy Services, Inc., 103 FERC ¶ 61,355, order on reh’g, 105 FERC ¶ 61,184 (2003).
221 See Northeast Utilities Service Co., v. FERC, 55 F.3d 686, 689 (1st Cir. 1995). 222 See Howard L. Siegel, The Bankruptcy Court vs. FERC- The Jurisdictional Battle, 144 PUB. UTILS. FORTNIGHTLY 34 (2006). 223 Another factor creating a potential preference for self-built generation as opposed to long-term purchases is the treatment by some credit rating agencies of power purchase contracts as imputed debt. If a utility’s self-built generation is treated as an asset but long-term purchase contracts are treated as imputed debt, it may cause utilities and state regulators to favor constructing and owning over purchasing. See EPSA comments. 224 See infra Chapter 4 for a discussion of regulated service offerings in states with retail competition. 225 Mirant comments; Constellation comments.
77
because market rules and institutions change so frequently. This can serve to deter new entry.226 At the same time, many market participants continue to advocate changes in regulatory policy, even long-settled policy. 3. Capital Requirements - Risk and Reward in the Face of Price and Cost Volatility New generation construction in wholesale markets depends on the ability of a company to acquire capital, either from internal sources or external capital markets. There is no federal regulation of generation entry, and most states that have permitted retail competition have eliminated any “need-based” showing to build a generation plant. In the United States, private capital has funded most electric generation investment. Under traditional cost-base rate regulation, utility investment decisions were based in part on the promise of a regulated revenue stream with little associated risk to the utility. Ratepayers often bore the risk, and money from capital markets was generally available when utilities needed to fund new infrastructure. One significant problem, however, was that regulators had limited ability to ensure that utilities spent their money wisely.227 Investors view regulatory disallowances of imprudent expenditures as regulatory risk. Some believe that Integrated Resource Planning processes with opportunities for public and regulator participation in advance of resource procurement decisions will reduce the risks of later regulatory disallowances.228
In competitive markets, project funding is based on anticipated market-based projections of costs, revenues, and relevant risks factors. The ability to obtain funding is impacted by the degree to which these projections compare with projected risks and returns for other investment opportunities.229 Using this information, potential entrants to generation markets must be able to convince capital markets that new generation is a viable profitable undertaking. In the late 1990s, investors appeared to prefer market investments to cost-based rate-regulated investments, as merchant generators were able to finance numerous generation projects, even without a contractual commitment from a customer to buy the power.230
Recently, capital for large investment projects has flowed to traditional utilities more than to merchant generators.231 In part, this preference reflects the reduced profitability of many merchant generators in recent years and the relative financial strength of many traditional utilities. It also may reflect a disproportionate impact of the collapse of credit and thus trading capability of nonutilities after Enron’s financial collapse.232 As shown in the Table in Appendix G, virtually all electric companies rated A- or higher are traditional utilities, not merchant generators. 226 Paul L. Joskow, Competitive Electricity Markets and Investment in New Generating Capacity (April 28, 2006) (MIT Working Paper). 227 CONG. BUDGET OFFICE, FINANCIAL CONDITION OF THE U.S. ELECTRIC UTILITY INDUSTRY (1986), available at http://www.cbo.gov/showdoc.cfm?index=5964&sequence=0. 228 Southern comments; Duke comments. 229 Commodity Futures Trading Commission, The Economic Purpose of Futures Markets, available at http://www.cftc.gov/opa/brochures/opaeconpurp.htm. 230 APPA comments. 231 Task Force Meetings with Credit Agencies, see Appendix B. 232 GAO, Restructured Electricity Markets, Three States’ Experiences at 13.
78

Investor preference for traditional utilities also may be affected by increasing volatility in electric power markets. As wholesale markets opened to competition, investors recognized that income streams from the newly-built plants would not be as predictable as in the past.233 Under cost-based regulation, vertically integrated utilities’ monopoly service territories significantly limited the risk of not recovering the costs of investments. Once generators had to compete for sales, generation plant investors were no longer guaranteed that construction costs would be repaid or that the output from plants could be sold at a profit.234 Financing was easier to obtain for projects such as combined cycle gas and particularly gas turbines that can be built relatively quickly. At the time, they were thought to have a cost advantage over existing generation, including less efficient gas-fueled generators.235 In 1996, the EIA projected that 80 percent of electric generators between 1995 and 2015 would be combined cycle or combustion turbines.236 Base-load units, such as coal plants, with construction and payout periods that would put capital at risk for a much longer time, were harder to finance.237
The increasing amount of new generation fueled by natural gas, however, has caused electricity prices to vary more frequently as natural gas is a commodity subject to wide swings in price.238 With input costs varying widely, but merchant revenues often limited by contract or by regulatory price mitigation, investors may worry that merchant generators may not recover their costs and provide an attractive rate of return. Commenters suggest that competitive suppliers are beginning to focus on developing facilities fueled by other sources. They cite 2006 announcements by NRG Energy, Inc. (investing $16 billion to develop 10,500 MW of nuclear, wind, and coal facilities), TXU (investing in multiple coal-fired plants), Constellation Energy and Exelon Corp. (developing a nuclear plant), BP and Edison Mission Group (investing $1 billion in a hydrogen-fueled plant), and AES (investing $1 billion in renewable technologies).239
4. Regulatory Intervention May Affect Investment Returns Economic theory says that, in an unregulated world, needed generation investments will be made and generation investors will recover not only their variable and fixed costs but also make an adequate return on these needed investments to maintain long-term financial viability. The mechanism for this cost recovery of the correct level of generation investment is allowing the highest cost generator being dispatched at a particular time and place to determine the market clearing price. The mechanism works as follows: As resources become scarce relative to demand, market prices are set by more and more expensive resources. Generators with variable
233 Connecticut DPUC comments. 234 GAO, Restructured Electricity Markets, Three States’ Experiences at 13. 235 U.S. Department of Energy, Energy Information Administration, The Changing Structure of the Electric Power Industry: An Update, at 38 (December 1996), available at http://tonto.eia.doe.gov/FTPROOT/electricity/056296.pdf. 236 Id. 237 Hearing on Nuclear Power, Before the Subcomm. on Energy of the S. Comm. on Energy & Nat’l Res. (Mar. 4, 2004) (statement of Mr. James Asselstine, Managing Director, Lehman Brothers). See also Nuclear Energy Institute, Investment Stimulus for New Nuclear Power Plant Construction: Frequently Asked Questions, available at http://www.nei.org/documents/New_Plant_Investment_Stimulus.pdf. 238 Natural Gas Factors Affecting Prices and Potential Impacts on Consumers: Testimony Before the Permanent Subcommittee on Investigations, Committee on Homeland Security and Governmental Affairs, United States Senate; GA-06-420T (Feb. 13, 2006), at 7. 239 EPSA comments.
79

costs below the market clearing price receive “scarcity rents” that cover their fixed costs and provide a return on investment. If high prices in a particular energy market reflect scarcity, these economic rents generally are efficient and serve to provide incentives for construction. However, regulators may limit recovery of high prices during these periods due to the unpalatability of even temporarily high prices and/or suspicion of inappropriate market gaming. Thus regulators may deter suppliers from making needed investments in new capacity by imposing price caps and limiting recovery of legitimate costs and delivery of adequate returns. This dynamic leads to a chicken-and-egg conundrum: if there were efficient investment, wholesale price or bid caps might not be needed. More investment in capacity would lead to less scarcity, and thus fewer or shorter episodes of high prices that may require mitigation. By contrast, it may be that price regulation during high-priced hours diminishes investors’ confidence that market forces (rather than regulation) will set prices. That diminished confidence in their ability to earn sufficient investment returns thus deters entry of new generation supply, thereby limiting competition and giving cause for price caps. Price mitigation through price or bid caps has become an integral component of most organized markets. The use of price mitigation has led generators to seek adequate returns through implementation of supplemental revenue streams (capacity credits) to encourage entry of new supply. See Box 3-3 for a discussion of capacity credits. In practice, however, the presence or absence of capacity credits has not always resulted in predicted outcomes. California did not have capacity credits and did not experience much new generation, but two regions (Southeast and Midwest) experienced significant new generation entry without capacity credits. Northeast RTOs with capacity credits continue to have some difficulty attracting entry, especially in major metropolitan areas.
Box 3-3 The Use of Capacity Credits in Organized Wholesale Markets
In theory, capacity credits could support new investment because suppliers and their investors would be assured a certain level of return even on a marginal plant that ran only in times of high demand. Capacity credits might allow merchant plants to be sufficiently profitable to survive even in competition with the generation of formerly-integrated local utilities that may have already recovered their fixed costs.
As noted, much of the new generation in the Southeast was nonutility merchant generation that relied on the region’s proximity to natural gas supplies. In the Midwest, in the late 1990s, largely uncapped prices were allowed to send price signals for investment. In California, price caps of various kinds have been used for a number of years, limiting price signals for new entry. In the Northeast, organized markets have offered capacity payments for long-term investments in addition to electric power prices that are sometimes capped in the short term. There is no conclusive result from any of these approaches – no one model appears to be the perfect answer for how to spur efficient investment with acceptable levels of price volatility.
80

Net revenue analyses for centralized markets with price mitigation suggest that price levels are inadequate for new generation projects to recover their full costs. For example, in the last several years, net revenues in the PJM markets have been, for the most part, too low to cover the full costs of new generation in the region.240 Based on 2004 data, net revenues in New England, PJM and California would have allowed a new combined-cycle plant to recover no more than 70 percent of its fixed costs. Regulation also may interfere with efficient exit of generation plants due to the use of reliability-must-run requirements. In some load pockets in organized markets, plant owners are paid above-market prices to run plants that are no longer economical at the market-clearing price. For example, in its Reliability Pricing Model filing with FERC, PJM states, “PJM also has been forced to invoke its recently approved generation retirement rules to retain in service units needed for reliability that had announced their retirement. As the Commission often has held, this is a temporary and suboptimal solution. Such compensation, like the RMR contracts allowed elsewhere, is outside the market, and permits no competition from, and sends no price signals to, other prospective solutions (such as new generation or demand resources) that might be more cost effective.”241 To the extent that market rules allocate the cost of keeping these plants running for customers outside of the load pocket, such payments may distort price signals that, in the long run, could elicit entry. Graduated capacity payments that favor entry of efficient plants may be a partial solution to retiring inefficient old plants. 5. Investment in Transmission: A Necessary Adjunct to Generation Entry Transmission access can be vital to supporting competitive options for market participants. For example, merchant generators depend on the availability of transmission to sell power, and transmission constraints can limit their range of potential customers. Small utilities, such as many municipal and cooperative utilities, depend on the availability of transmission to buy wholesale power, and transmission constraints can limit their range of potential suppliers. Much of the transmission grid is owned by vertically-integrated, investor-owned utilities. Some have alleged that these utilities have an incentive to limit grid use by others to the extent that such use conflicts with sales by their own generation. In short, the availability of transmission is often key in determining whether a generating facility is likely to be profitable and, thus, elicit investment. Since Order No. 888, questions have arisen concerning the efficacy of various terms and conditions governing transmission availability. For example, customers have raised concerns regarding the calculation of Available Transfer Capacity (ATC). Another concern has been a lack of coordinated transmission planning between transmission providers and their customers. Finally, customers have raised concerns about some aspects of transmission pricing. Based on these concerns, in May 2006 FERC proposed modifications to Order 888 open access transmission tariffs to further limit undue discrimination in transmission services. FERC is soliciting public comments on its proposed modifications.
240 Occasionally in the past few years net revenues have been sufficient to cover the costs of new peaking units, and in 2005 they were enough to cover the costs of a new coal plant. PJM Interconnection, LLC, Market Monitoring Unit, 2005 State of the Market Report, at 118 (2006), available at http://www.pjm.com/markets/market-monitor/som.html 241 PJM Interconnection, 115 FERC at 61,236.
81

As discussed above, generation that is built where construction costs are low and fuel supplies readily available, but not necessarily near demand, relies heavily on readily available transmission. The Connecticut DPUC noted that, while generation growth may have been sufficient for some regions such as New England as a whole, some localized areas saw demand grow without increases in supply, raising prices in load pockets. If transmission access to the load pocket were available, a large base-load plant outside the load pocket might become an attractive investment. Less regulatory intervention in wholesale markets for generation may be necessary if transmission upgrades, rather than unrestricted high prices or capacity credits, are used to address the concerns about future generation adequacy. Although capacity credits may spur generators within a load pocket to add additional capacity, capacity credits may not be required for base-load plants outside the load pocket. Those base-load plants would not have the problem of average revenues falling below average costs because they would have access to more load, and would be able to run profitably during more hours of the day. Similarly, price caps may be unnecessary if improved transmission brought power from more base-load units into the congested areas. Prices would be lower because there would be less scarcity, and high-cost units would run for fewer hours. 6. Some Types of Generation Investment May Not Be Adequate without Government Intervention System reliability, the prevention of network collapse, is a public good.242 The market may not elicit enough generation that has the technical capability (i.e., the ability to generate MWs within a very short period of time in a critical location) to prevent network collapse. An administrative process may be needed to provide the correct level of generation technically capable of responding to reliability needs. Some argue that perceived inadequate generation entry 243 may be due to competitive policies that are inadequate for eliciting appropriate levels of technically capable generation. 7. The Level of Investment in Demand Response Can Affect the Need for Generation and Transmission Investment Chapter 2 described the typical disconnect between wholesale and retail prices in electric markets. This disconnect can lead to wider price fluctuations than would be the case if customers could easily reduce their demand when prices rise. There are several means to influence the level of demand for power, including energy efficiency and demand response. Examples of energy efficiency include giving customers incentives to replace inefficient refrigerators and air conditioners and imposing appliance standards or more energy-efficient
242 Public goods have two characteristics – “nonexclusiveness” and “nonrivalry.” Nonexclusiveness means that others cannot be excluded from the use of the good (e.g., if one person refuses to pay taxes, that person still can enjoy public parks) and nonrivalry implies that one person’s consumption of the good does not diminish another person’s consumption (e.g., the fact that one person enjoys the increased safety engendered by military spending doesn’t decrease another person’s safety.) “Preventing network collapse” is nonexclusive because if the network collapses there is nothing one can do to escape it (unless one constructs freestanding on-site generation) and it is nonrivalrous because one person being protected from collapse does not preclude another person’s being protected. 243 Joskow, op. cit.
82
building codes. Tools for eliciting demand response include time-based rates and incentive-based programs. Time-based rates include time-of-use pricing (i.e., a peak price and an off-peak price), critical peak pricing (i.e., similar to time-of-use rates, but with a critical peak component invoked during system emergencies or periods of high wholesale prices), and real-time pricing (e.g., Georgia Power's RTP tariff). Incentive-based demand response programs include interruptible rates, air-conditioner cycling, and independent system operator emergency demand response programs. By influencing demand, energy efficiency and demand response programs can affect pricing in the short term and in the long term by affecting the amount of generation and transmission needed as well as the composition (i.e., composition of base load, mid-merit and peaking generation) of investment. For instance, programs that aim to reduce electricity consumption that is fairly constant – such as refrigerator efficiency programs – reduce the need for base-load plants. Similarly, programs that improve the efficiency of appliances that contribute to peaking load (i.e., air conditioners) can reduce demand for mid-merit generation. Demand response programs that curtail demand at peak times may resolve constraints that cause load pockets. Even when constraints persist, demand response can also serve to reduce prices in load pockets whether these high prices are the result of scarcity rents or market power. DSM also holds the potential to defer the need for new transmission enhancements. To date, energy efficiency has provided important benefits, but additional capability can be achieved. Demand response capability has been modest, between 3 and 7 percent in most regions.244 The use of energy efficiency and demand response is expected to increase significantly in the next few years, especially after advanced smart metering is installed.
244 Federal Energy Regulatory Commission, Staff Report on the Assessment of Demand Response and Advanced Metering (August 2006).
83

CHAPTER 4 COMPETITION IN RETAIL ELECTRIC POWER MARKETS
A. Introduction and Overview
This chapter examines the development of competition in retail electricity markets and discusses the status of competition in the 16 states and District of Columbia that currently allow customers to choose their electricity supplier.245 Although it has been almost a decade since states started implementing retail competition, residential customers in most of these states still have little choice among suppliers. In most of these states, few residential customers have a wide variety of alternative suppliers and pricing options. Commercial and industrial (C&I) customers have more choices and options, but in several states large industrial customers have become increasingly dissatisfied with retail prices. The lack of incentives for alternative suppliers and marketers to enter the market at the retail level has been a major impediment to market-based competition. Most states required the distribution utility to offer electricity at a regulated price as a backstop or default if the customer did not choose an alternative supplier or if the chosen supplier went out of business.246 States argued that this was needed to ensure universal access to affordable and reliable electricity. States often set the price for the regulated service at a discount below then-existing rates and capped the price for multi-year periods. In some states, these initial discounts sought to approximate anticipated benefits of competition for residential customers. Since then, wholesale prices have increased. More than any other policy, this requirement that distribution utilities offer service at low prices unwittingly impeded entry by alternative suppliers to serve retail customers. New entrants cannot compete against a below-market regulated price. States with prices regulated at below-market levels now face “rate shock.” On the one hand, rate caps for the regulated service most residential customers use expired or will expire within a few years, and states are faced with raising their regulated customer rates. These higher prices are particularly painful to customers that have limited ability to adjust consumption in response to price increases and also lack competitive supply options (other than possibly to install their own onsite generation). On the other hand, if states continue to require distribution utilities to offer 245 The Task Force adopts the convention of designating states as permitting retail competition on the basis of whether a state allows alternative suppliers to enter and obtain multiple, geographically dispersed customers. An even broader potential definition of retail competition would take into account policies that allow individual retail customers to provide some or all of their own generation needs (i.e., to make rather than buy electricity). Onsite generation is common in some industries in some sections of the country. Small onsite generation projects – often referred to as “Distributed Generation” or “Distributed Resources” projects – are gaining popularity as well. Many states that do not have retail choice in the conventional sense do have provisions for various forms of onsite generation and net metering. Another broader form of retail competition involves municipal utilities or cooperatives. NRECA comments (2). These entities can be carved out of existing private utility distribution areas, or can be added back into them if the municipality decides to do so (or if the cooperative disbands). The Otter Tail Power case, 410 U.S. 366 (1973), was decided on the basis of this form of retail competition. If these broader definitions of “retail competition” were used, all (or nearly all) states would be designated as retail competition states. 246 In this report, the Task Force refers to state-mandated and -regulated electrical service in states with consumer choice programs as POLR service. A broad range of terms is used in different states to denote this type of service. Some states have more than one form of mandated service or have changed the form of POLR service over time. In many states, POLR service originated as an element in arrangements to pay the stranded (i.e., non-recovered) costs of vertically integrated utilities – costs that may have become unrecoverable when the state adopted a retail customer choice approach.
84

regulated service at below-market rates, then retail entry – and thus competition – will not occur. Moreover, below-market rates put the distribution utility’s solvency at risk and do not provide appropriate incentives for conservation.247
This conundrum is further complicated by the fact that most distribution utilities offering regulated service no longer own generation assets. Most of the supply contracts that were part of the agreements under which they divested generating assets were set to expire at the end of a finite transition period.248 Many distribution utilities sold or transferred their generation assets to unregulated affiliates when retail competition began. If they offer regulated service, they must purchase supply in wholesale markets. Their former generation assets may be more expensive now than when they were divested. If the utility repurchases these assets at current prices, it is likely to have “sold low and bought high.” The competitiveness of wholesale prices directly affects retail prices,249 except where retail prices are set by regulation without regard to current wholesale prices. For example, retail prices usually will reflect imperfections in the wholesale market, such as some wholesale suppliers’ ability to exercise market power,250 problems in market design that increase wholesale suppliers’ costs, government subsidies to some suppliers for reasons other than addressing market failures, transmission discrimination that prevents low-cost suppliers from reaching customers, or restrictions that delay or prevent entry and diffusion of low-cost generation technologies. Distortions in wholesale prices that lead to distortions in retail prices can cause economic inefficiencies both in retail customers’ consumption patterns and in investment decisions. Ultimately these distortions can reduce consumer welfare and raise private and social costs of producing goods made with electricity as an input. This chapter addresses the status and impact of retail competition in seven states that the Task Force examined in detail: Illinois, Maryland, Massachusetts, New Jersey, New York, Pennsylvania, and Texas.251 These states represent the various approaches to retail competition.252 The chapter also discusses why it is difficult to determine whether retail prices 247 Debt rating agencies may downgrade the creditworthiness of utilities in states that require utilities to sell at prices below their costs. For example, Moody’s Investors Services reportedly has downgraded the creditworthiness of utilities in Maryland – in particular, Baltimore Gas & Electric, due to that firm’s inability to pass on increased input costs to consumers, which “leaves BGE in a weakened state that makes it vulnerable to further downgrades and even insolvency if it faces further energy price shocks or other costs that the legislature deems cannot be passed on to customers.” Patricia Hill, Maryland Utilities Designated Near Junk, WASH. TIMES (July 12, 2006), available at http://www.washingtontimes.com/functions/print.php?StoryID=20060711-103048-5690r. 248 In most retail customer choice states, supply contracts (vesting contracts) have been used to enable distribution utilities to offer POLR service at the capped price level after they have divested generating plants or transferred them to unregulated affiliates. The “rate shock” anticipated in these states is due in part to the lack of laddering in the vesting contracts beyond the end of the transition period, as defined in the legislation. There are two exceptions worth noting. In California, vesting agreements were de-emphasized in favor of procurement at spot market prices. In upstate New York, vesting agreements were longer term and continue to have a moderating effect on average procurement prices for POLR service. Public Utility Law Project of New York comments (2) at 36. 249 Several commenters emphasized the potential spillovers from problems at the wholesale level to the retail level, including NYPSC comments (2) at 3-4; APPA comments (2) at 4, 21-25; New York Companies comments (2) at 2, 4-5; Direct Energy comments (2) at 7; Alliance for Retail Energy Markets comments (2) at 3-4; Industrial Consumers comments (2) at 9-10, 21-22; Allegheny comments (2) at 15, 19. 250 Retail competition and options for onsite generation can provide opportunities for a customer to find alternative supply sources, including self-generation, if the customer’s present supplier tries to raise prices above the competitive level (i.e., attempts to exercise market power). 251 See Appendix D infra for each state profile. 252 Restructured states as of May 2006 include Connecticut, Delaware, Illinois, Maine, Maryland, Massachusetts, Michigan, New Hampshire, New Jersey, New York, Ohio, Oregon, Pennsylvania, Rhode Island, Texas, and Virginia, plus the District of Columbia. The states profiled in Appendix D display a range of conditions that are similar to the other states with retail competition. Virginia is similar to Pennsylvania in that its transition to retail competition evolved over a 10-year period. Maine and Rhode Island are similar to New York and Texas in that prices for
85
are higher or lower than they would have been absent the move to retail competition. Also included are several observations based on experiences of states that have implemented retail competition, with an emphasis on how states can minimize market distortions once rate caps expire. B. Background on Provision of Electric Service and the Emergence of Retail Competition For most of the 20th century, local distribution utilities typically offered electric service at rates that varied among customer classes (e.g., residential, commercial, and industrial). State regulatory bodies set these rates based on the utility’s costs. Locally elected boards oversaw the rates for customers of public power and cooperative utilities. For investor-owned systems, the regulated rate included an opportunity to earn an authorized rate of return on investments in utility plants needed to serve customers. Public power and cooperative systems operate under a nonprofit, cost-of-service structure. Their rates typically include a margin to cover unanticipated costs and support new investment. With minor variations, monopoly distribution utilities deliver electricity to retail customers.253 Industrial customers sometimes can choose from more options than can small business and residential customers for service and rate structures (e.g., “time-of-use” rates, which are lower when demand is lower during “off-peak” periods).254
Beginning in the early 1990s, several states with high electricity prices began to explore opening retail electric service to competition. As discussed in Chapter 1 and Figure 4-1, rates varied substantially among utilities, even within a single state. Some of the disparity was due to different natural resource endowments across regions, the most important of which are the hydroelectric resources in the Northwest and the abundant coal reserves in such states as Kentucky and Wyoming. Moreover, some states required utilities to enter into PURPA contracts at prices much higher than the utilities’ avoided costs. In addition to these rate disparities, some industrial customers contended that their rates subsidized lower rates for residential customers. “provider of last resort” (POLR) service have been adjusted regularly to reflect changes in wholesale prices. Delaware, the District of Columbia, Illinois, Michigan, New Hampshire, Ohio, and Rhode Island share the situation faced by Maryland, where the transition period of fixed prices for residential and small C&I POLR service will end in the near future. Massachusetts’s rate cap period ended recently. Many of the states poised to end the transition period are developing approaches to bring POLR prices for residential and small C&I customers up to market rates in stages rather than all at once. Several of these states also share Maryland’s and New Jersey’s interest in auctions for procuring POLR service supplies. Oregon’s situation differs from the other states in that only nonresidential customers can shop, and that shopping is limited to a short window of time each year. 253 Retail electric customers in 30 states continue to receive service almost exclusively under a traditional regulated monopoly utility service franchise. These states include 44 percent of all U.S. retail customers, accounting for 49 percent of electricity demand. 254 For example, Georgia law allows any new customers with loads of 900 kilowatts or more to make a one-time selection from among competing eligible electric suppliers. Southern comments.
86

Figure 4-1. U.S. Electric Power Industry, Average Retail Price of Electricity by State, 1995 Cents per kWh
AL5.5
AK10.2
AZ7.6
AR6.3
CA9.9
CO6.1 DE
6.9
DC7.1
FL7.0
GA6.6
HI11.3
ID4.1
IL7.7
IN5.2
IA6.0
KS6.6 KY
4.1
LA5.8
ME9.5
MD7.1
MA10.1
MI7.1MN
5.6
MO6.3
MT4.7
NE5.4
NV6.1
NH11.7
NM6.8
NY11.1
NC6.6
ND5.7
OH6.2
OK5.6
OR4.7
PA7.9
RI10.4
SD6.2
TN5.2
TX6.1
UT5.3
VT9.5
VA6.3
WA4.1
WV5.3
WI5.4WY
4.3
8 - <9 7 - <8 6 - <7 0 - <69 and above
U.S.Average
6.9
SC5.7
CT10.5NJ
10.4
MS6.0
Source: EIA, The Changing Structure of the Electric Power Industry, Figure 11 (Dec. 1996).
Retail competition allowed customers to choose their electric supplier or marketer, but their electricity would still be delivered by the local distribution utility.255 The idea was that customers could obtain electric service at lower prices if they could choose among suppliers. For example, they could buy from suppliers outside their local market, from new entrants into generation, or from power marketers, any of which might charge lower prices than the local distribution utility. The ability to choose among alternative suppliers was intended to reduce market power that local suppliers might otherwise have, so that customers might see lower prices from local suppliers. Also, it was thought that new suppliers might offer innovative price and other terms to purchase electricity that could improve the quality of service.
In 1996, California enacted a comprehensive electric restructuring plan to allow customers to choose their electricity supplier. To accommodate retail choice, California extensively restructured its electric power industry. The legislation:
(1) established an Independent System Operator (ISO) to operate the transmission grid throughout much of the state, so that all suppliers could access the transmission grid to serve their retail customers;
255 FERC and the states will continue to regulate the price for transmission and distribution services, and the local distribution utility will continue to deliver the electricity in most states, regardless of which generation supplier the customer chooses.
87

(2) established a separate wholesale trading market for electricity supply, so that utilities and alternative suppliers could purchase electricity to serve their retail customers;
(3) mandated an immediate 10 percent rate reduction for residential and small commercial customers that did not choose an alternative supplier;
(4) authorized utilities to collect stranded costs related to generation investments that were unlikely to be as valuable in a competitive retail environment; and
(5) implemented an extensive public benefits program funded by retail ratepayers.256 Other states also enacted comprehensive retail competition legislation: New Hampshire (May 1996), Rhode Island (August 1996), Pennsylvania (December 1996), Montana (April 1997), Oklahoma (May 1997), and Maine (May 1997). By January 2001, 22 states and the District of Columbia had adopted retail competition legislation. Regulatory commissions in four other states (including Arizona, which also enacted legislation) had issued orders requiring or endorsing retail choice for retail electric customers. Several states – primarily those with low-cost electricity generation, such as Alabama, Colorado, North Carolina, and Wisconsin – concluded that retail competition would not benefit their customers.257 For example, Colorado was concerned that limitations on transmission access and high concentration among generation suppliers would lead suppliers to exercise market power to the detriment of customers. These states opted to keep traditional utility service. States adopting retail competition plans generally did so to advance several goals, including:
lower electricity prices than under traditional regulation through access to lower-cost power in competitive wholesale markets where generators compete on price and performance;
better service and more options for customers through competition from new suppliers; innovation in generating technologies, grid management, use of information technology,
and new products and services for consumers; and improvements in the environment through displacement of dirtier, more expensive
generating plants with cleaner, cheaper natural-gas-fired and renewable generation. Under the restructured model, legislatures and regulators affirmed their support for making electricity available to all customers at reasonable rates, with continued safe and reliable service and consumer protections under regulatory oversight. Boxes 4-1 and 4-2 describe the Pennsylvania and New Jersey legislatures’ findings and the expected results of retail competition.
256 A.B. No. 1890, 1995-1996 Sess. (Cal. 1996) (enacted), available at http://www.leginfo.ca.gov/pub/95-96/bill/asm/ab_1851-1900/ab_1890_bill_960924_chaptered.pdf. 257 Wisconsin regulators apparently believed that retail competition might increase the cost of capital for new generation and transmission projects. PSC Wisconsin Comments (2) at 3.
88
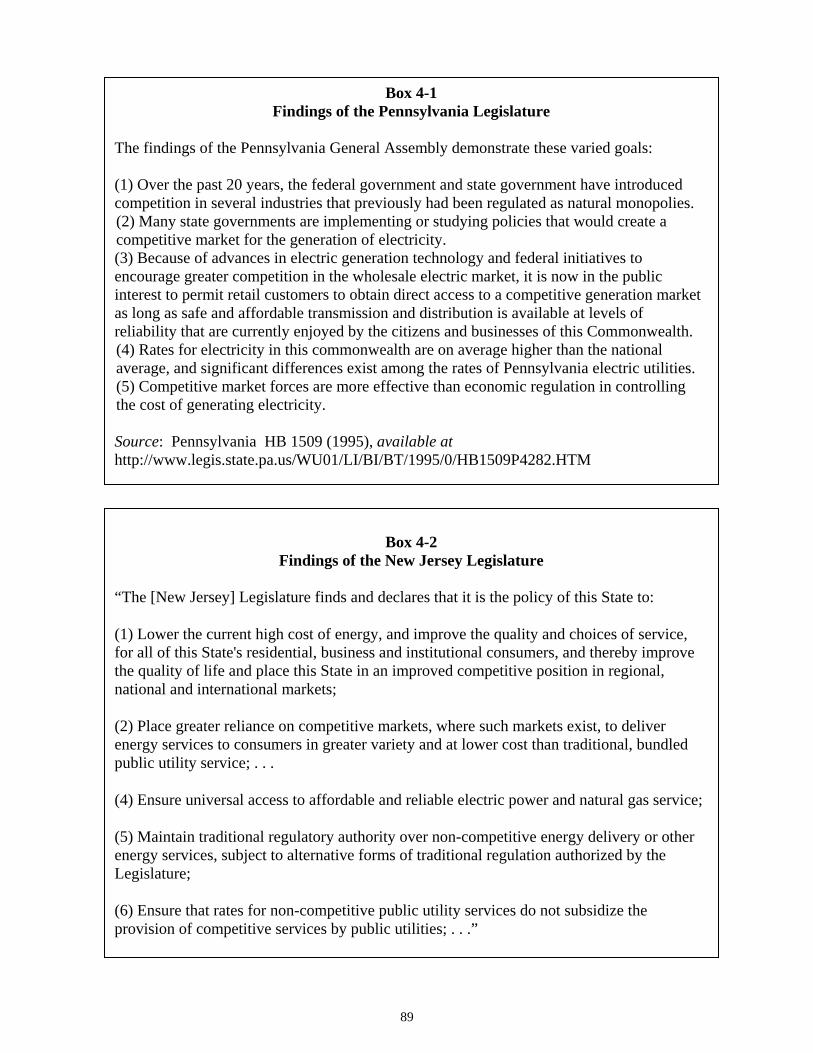
Box 4-1 Findings of the Pennsylvania Legislature
The findings of the Pennsylvania General Assembly demonstrate these varied goals: (1) Over the past 20 years, the federal government and state government have introduced competition in several industries that previously had been regulated as natural monopolies. (2) Many state governments are implementing or studying policies that would create a competitive market for the generation of electricity. (3) Because of advances in electric generation technology and federal initiatives to encourage greater competition in the wholesale electric market, it is now in the public interest to permit retail customers to obtain direct access to a competitive generation market as long as safe and affordable transmission and distribution is available at levels of reliability that are currently enjoyed by the citizens and businesses of this Commonwealth. (4) Rates for electricity in this commonwealth are on average higher than the national average, and significant differences exist among the rates of Pennsylvania electric utilities. (5) Competitive market forces are more effective than economic regulation in controlling the cost of generating electricity. Source: Pennsylvania HB 1509 (1995), available at http://www.legis.state.pa.us/WU01/LI/BI/BT/1995/0/HB1509P4282.HTM
(6) Ensure that rates for non-competitive public utility services do not subsidize the provision of competitive services by public utilities; . . .”
(5) Maintain traditional regulatory authority over non-competitive energy delivery or other energy services, subject to alternative forms of traditional regulation authorized by the Legislature;
(4) Ensure universal access to affordable and reliable electric power and natural gas service;
(2) Place greater reliance on competitive markets, where such markets exist, to deliver energy services to consumers in greater variety and at lower cost than traditional, bundled public utility service; . . .
(1) Lower the current high cost of energy, and improve the quality and choices of service, for all of this State's residential, business and institutional consumers, and thereby improve the quality of life and place this State in an improved competitive position in regional, national and international markets;
Box 4-2
Findings of the New Jersey Legislature
“The [New Jersey] Legislature finds and declares that it is the policy of this State to:
89

C. Meltdown and Retrenchment From late spring 2000 and into the spring of 2001, California experienced high natural gas prices, a strained transmission system, and generation shortages (due to hydro shortages and operating restrictions) that resulted in blackouts. Wholesale electricity prices soared during this time. Existing state law had capped residential “provider of last resort” (POLR) service rates at levels that were soon below the market price for wholesale electric power. After a large investor-owned utility declared bankruptcy because it was unable to increase its retail rates to cover high wholesale power prices, the state stepped in to buy electricity on behalf of two of the state’s three IOUs.258 California eventually suspended retail competition for most customers while it reconsidered how to assure adequate electric supplies and continuation of service at affordable rates in a competitive wholesale market environment. Although that suspension continues today, 12 percent of load in the state is supplied by alternative suppliers, some additional consumers remain eligible to switch to alternative suppliers, and new initiatives for municipal aggregation are being pursued.259 Box 4-3 describes California’s role in purchasing electricity and the all-time-high prices it paid, and continues to pay.
Box 4-3 California’s Electricity Purchases at All-Time-High Prices
In 2001, California spent over $10.7 billion to purchase electricity on the spot market to supply customer’s daily needs. The state also signed long-term contracts worth approximately $43 billion for10 years. These contracts represented about one-third of the three utilities’ requirements for the same period (2001–2011). Viewed with the benefit of perfect hindsight, the state entered these long-term contracts when prices were at an all-time high. Future prices hovered in the range of $350-$550 per MWh during the time California negotiated its long-term contracts, and in April future prices peaked at $750/MWh as the state finalized its last contract. By August 2001, future prices had dropped below $100. Thus, as of May 2006, the state is obligated to pay well over market prices for at least five more years. See Southern California Edison.
The California experience sent ripple effects throughout the Western region and prompted several states to defer or abandon efforts to implement retail competition. No new states have adopted retail competition since 2000, and some states – including Arkansas and New Mexico – repealed retail competition plans they previously had adopted. Other populous states, such as Illinois, New Jersey, New York, Pennsylvania, and Texas, moved ahead with retail competition. Some of these states ended, or are about to end, their POLR
258 See, e.g., Cal. Atty Gen. White Paper; Federal Energy Regulatory Commission, Final Report on Price Manipulation in Western Energy Markets: Fact Finding Investigation of Potential Manipulation of Electric and Natural Gas Prices (March 26, 2003) (Docket No. PA02-2-000); U.S. General Accounting Office, Restructured Electricity Markets, California Market Design Enabled Exercise of Market Power (June 2002), available at http://www.gao.gov/new.items/d02828.pdf. 259 CPUC comments; Alliance for Retail Energy Markets comments (2).
90

service rate caps and will soon purchase wholesale supplies for POLR service at market prices (although several of these states are developing approaches to slow the adjustment to market-based procurement). States such as New York and Texas, which have adjusted POLR prices to approximate market rates on an ongoing basis, do not face a potentially significant increase in POLR service prices. As shown in Figure 4-2, 16 states and the District of Columbia have restructured at least some electric utilities in their states and allow at least some retail customers to purchase electricity directly from competitive retail suppliers. Restructured states as of April 2006 include Connecticut, Delaware, Illinois, Maine, Maryland, Massachusetts, Michigan, New Hampshire, New Jersey, New York, Ohio, Oregon, Pennsylvania, Rhode Island, Texas, and Virginia, as well as the District of Columbia. Figure 4-2. United States Map Depicting States with Retail Competition, 2003
Restructuring Suspended
Restructuring Delayed
Restructuring Active
Restructuring Not Active
AL
AK
AZ AR
CA CO DE
FL
GA
HI
ID
IL IN
IA
KS KY
LA
ME
MD
MAMI
MN
MO
MT
NENV
NH
NM
NY
NC
ND
OH
OK
OR
PA
RISD
TN
TX
UT
VT
VA
WA
WV
WI
WY
SC
CTNJ
MS
DC
Source: EIA, available at http://www.eia.doe.gov/cneaf/electricity/chg_str/restructure.pdf D. Experience with Retail Competition
With the expected benefits of retail competition in mind, the Task Force examined seven states in depth. These “profiled states” – Illinois, Maryland, Massachusetts, New Jersey, New York, Pennsylvania, and Texas – represent the different approaches to retail competition. In most profiled states, competition has not developed as expected for all customer classes. In general, few alternative suppliers currently serve residential customers. Where there are multiple suppliers, prices have not decreased as expected, and the range of new options and services often is limited. Development of retail competition has been impeded to a considerable extent by the
91
fact that several states still have capped residential POLR rates. C&I customers generally have more choices in both suppliers and of customized services, than do residential customers.260 However, most large C&I customers do not have the option to take POLR service at discounted, regulated rates. Alternative suppliers may find C&I customers to be more attractive because the ratio of sales to marketing costs is often perceived to be higher for these customers. This section reviews the status of retail competition in the profiled states, with an emphasis on entry of new suppliers, migration of customers to alternative suppliers,261 and the difficulty of drawing conclusions about the effect of retail competition on prices due to the capped POLR service.262 It then discusses how regulated POLR service has distorted entry decisions by alternative suppliers. Lessons learned from the use of POLR that may assist states as they decide how to structure future POLR service are included. 1. States Have Allowed Distant Suppliers to Access Local Customers and Have Encouraged Distribution Utilities to Divest Generation Each profiled state adopted measures to encourage entry of new suppliers to compete with the incumbent utility. Each adopted policies to allow suppliers other than the local distribution utility to gain access to retail customers by requiring the utilities to join an ISO or an RTO. As discussed in Chapter 3, larger geographic markets for wholesale electricity enable retail suppliers and marketers to buy generation supplies from a wider range of local and distant sources (e.g., neighboring utilities with excess generation, independent power producers, cogenerators, etc.). Even if no new generation facilities are built, independent operation and management of the transmission grid increases retail customers’ choices and makes it more difficult for local generators to exercise market power. Some states, including Massachusetts, New Jersey, and New York, ordered or encouraged utilities to divest generation assets to independent power producers (IPP) to eliminate possible transmission discrimination or to secure accurate stranded cost valuations.263 Although these divestitures generally did not require a utility to sell its generation assets to more than one company to eliminate the potential for the exercise of market power, generating facilities frequently have been sold to more than one IPP.264 In other states, such as Illinois and 260 Many alternative suppliers reportedly have developed customized time-of-use and other forms of energy management contracts for large C&I customers. Wal-Mart comments at 10-11; Commercial End-Users comments at at 3; Direct Energy comments (2) at 3. 261 The degree to which customers switch to alternative suppliers sometimes is used to measure the extent of retail competition. States with retail customer choice usually report these switching statistics. This can be a useful measure when the greatest concern is that the POLR service provider is obstructing switching, or that certain features of regulation (including lack of information about the retail choice process and below-market pricing of POLR service) are discouraging entry and active consumer shopping for electricity service. Another way to gauge the success of retail competition policy is to survey consumers about their awareness of retail choices and perceptions of the difficulty of switching between suppliers. However, surveys are expensive and results are not available systematically. More generally, consumers can obtain the benefits of competition if existing competition, entry, or the threat of entry prevents incumbent suppliers from exercising market power manifested in the form of higher prices, lower product quality, or reduced innovation. In this sense, retail competition could be effective even without any switching to alternative suppliers. NASUCA comments (2). 262 There is no reason to believe, however, that retail competition in this market will not function as competition does in any market, by reducing quality-adjusted prices. 263 See infra Massachusetts, New Jersey, and New York profiles, Appendix D. See also Federal Trade Commission, Staff Report on Competition and Consumer Protection Perspectives on Electric Power Regulation Reform: Focus on Retail Competition, at 43 (2001), available at http://www.ftc.gov/reports/elec/electricityreport.pdf [hereinafter FTC Retail Competition Report]. 264 The prices of generation assets have been volatile since these divestitures occurred. Asset prices often are keyed not only to the cost of the fuel necessary to generate the electricity, but also to the location of the asset on the transmission grid.
92
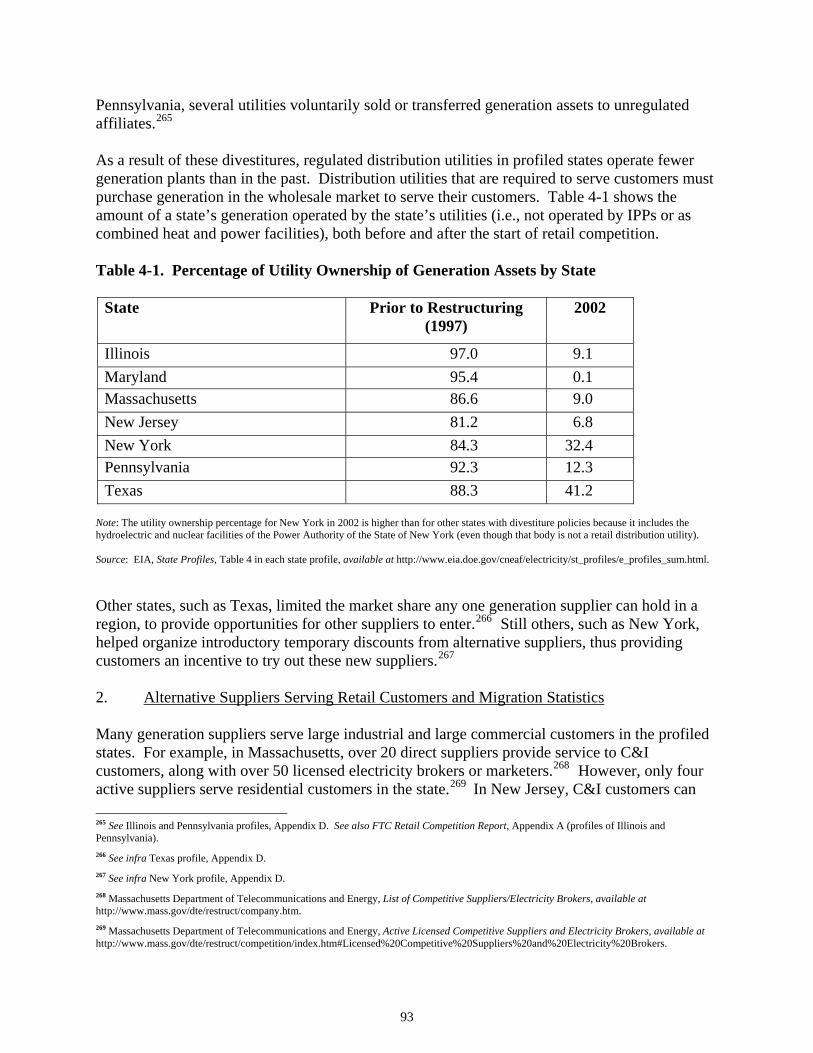
Pennsylvania, several utilities voluntarily sold or transferred generation assets to unregulated affiliates.265
As a result of these divestitures, regulated distribution utilities in profiled states operate fewer generation plants than in the past. Distribution utilities that are required to serve customers must purchase generation in the wholesale market to serve their customers. Table 4-1 shows the amount of a state’s generation operated by the state’s utilities (i.e., not operated by IPPs or as combined heat and power facilities), both before and after the start of retail competition. Table 4-1. Percentage of Utility Ownership of Generation Assets by State
State Prior to Restructuring (1997)
2002
Illinois 97.0 9.1 Maryland 95.4 0.1 Massachusetts 86.6 9.0 New Jersey 81.2 6.8 New York 84.3 32.4 Pennsylvania 92.3 12.3 Texas 88.3 41.2
Note: The utility ownership percentage for New York in 2002 is higher than for other states with divestiture policies because it includes the hydroelectric and nuclear facilities of the Power Authority of the State of New York (even though that body is not a retail distribution utility). Source: EIA, State Profiles, Table 4 in each state profile, available at http://www.eia.doe.gov/cneaf/electricity/st_profiles/e_profiles_sum.html. Other states, such as Texas, limited the market share any one generation supplier can hold in a region, to provide opportunities for other suppliers to enter.266 Still others, such as New York, helped organize introductory temporary discounts from alternative suppliers, thus providing customers an incentive to try out these new suppliers.267
2. Alternative Suppliers Serving Retail Customers and Migration Statistics Many generation suppliers serve large industrial and large commercial customers in the profiled states. For example, in Massachusetts, over 20 direct suppliers provide service to C&I customers, along with over 50 licensed electricity brokers or marketers.268 However, only four active suppliers serve residential customers in the state.269 In New Jersey, C&I customers can 265 See Illinois and Pennsylvania profiles, Appendix D. See also FTC Retail Competition Report, Appendix A (profiles of Illinois and Pennsylvania). 266 See infra Texas profile, Appendix D. 267 See infra New York profile, Appendix D. 268 Massachusetts Department of Telecommunications and Energy, List of Competitive Suppliers/Electricity Brokers, available at http://www.mass.gov/dte/restruct/company.htm. 269 Massachusetts Department of Telecommunications and Energy, Active Licensed Competitive Suppliers and Electricity Brokers, available at http://www.mass.gov/dte/restruct/competition/index.htm#Licensed%20Competitive%20Suppliers%20and%20Electricity%20Brokers.
93

choose among nearly 20 suppliers, but residential customers only have a choice of one or two competitive suppliers.270
Texas and New York have more options for residential customers. In Texas, residential customers can choose from approximately 15 suppliers.271 In New York, between six and nine suppliers offer services to residential customers in each service territory.272 With the notable exception of the Ohio municipal aggregation program described in Box 4-4, few if any suppliers have provided continuous service to residential customers in the other profiled states or in other retail competition states prior to the end of the respective transition periods.
Box 4-4 Customer Choice through Municipal Aggregation in Ohio
In New York, Texas, and most other states, retail customer switching occurs primarily through individual customer decisions to pick a specific alternative retail supplier. In Ohio, however, most switching activity has occurred through aggregations of customers seeking a supplier under the statewide “Community Choice” aggregation option. The Ohio retail competition law provides for municipal referendums to seek an alternative supplier and allows municipalities to work together to find an alternative supplier. The largest aggregation pool, the Northeast Ohio Public Energy Council, has 100 member communities and served approximately 500,000 residents at its peak. The Ohio program allows individual customers to opt out of the aggregation. In most other states, aggregation programs require customers to specifically opt in to participate. Participation rates generally are much higher in opt-out than in opt-in programs. (NOPEC recently had to contract for supply with an affiliate of the distribution utility after the original supplier withdrew from the market).
The percentage of residential customers switching from the POLR service to an alternative competitive supplier is greatest where there are more available generation suppliers. For example, in Massachusetts, 8.5 percent of residential customers had migrated to a competitive supplier as of December 2005.273 Approximately 41 percent of large C&I customers switched to alternative suppliers, representing 57.5 percent of the C&I load.274 In states with several 270 New Jersey Board of Public Utilities, List of Licensed Suppliers of Electric, available at http://www.bpu.state.nj.us/home/supplierlist.shtml. For example, in the Connectiv territory, there are 18 C&I suppliers and only one residential supplier. Eighteen suppliers serve C&I customers and one serves residential customers in the PSE&G service territory. 271 Texas Public Utility Commission, Texas Electric Choice Compare Offers from Your Local Electric Providers, available at http://www.powertochoose.org/default.asp. 272 New York State Public Service Commission, Competitive Electric and Gas Marketer Source Directory, available at http://www3.dps.state.ny.us/e/esco6.nsf/. The NYPSC reports that this range has moved to between 6 and 16 alternative suppliers, and the agency expects the number and variety of services offered by alternative suppliers to increase as New York State moves forward with retail competition. NYPSC comments (2). Some listed suppliers may not be actively marketing to residential customers. Public Utility Law Project of New York comments (2) at 41-42. 273 A substantial number of these switches are the result of community aggregations (principally the Cape Light Compact) rather than individual residential switches. Cape Light Compact comments (2) at 1-2. 274 See infra Massachusetts profile, Appendix D.
94

suppliers serving residential customers, higher percentages of residential customers switched to a new supplier (e.g., approximately 26 percent chose a new supplier in Texas).275 3. Retail Price Patterns by Type of Customer Figure 4-3 shows average revenues per kilowatt hour for all customer types in the profiled states against the national average for 1990-2005. The U.S. national average was generally flat at 8 cents per kWh during this period. Rates in New York, Massachusetts, and New Jersey generally have been higher than the national average, while those in Texas, Pennsylvania, Maryland, and Illinois have been lower. In 2004 and 2005, retail prices in all states began to increase. Figure 4-3. Average Revenues per kWh for Retail Customers, 1990-2005 Profiled States and National Average
Average Electric Revenues per kWh for All Customer Sectors 1990-2005
-
2.00
4.00
6.00
8.00
10.00
12.00
14.00
1990
1991
1992
1993
1994
1995
1996
1997
1998
1999
2000
2001
2002
2003
2004
2005
Cen
ts p
er k
Wh
USTexasNew YorkPennsylvaniaNew JerseyMassachusettsIllinoisMaryland
Source: EIA Form 861 data, and Monthly Electricity Report for average electric revenues per kWh all sectors, all retail providers. a. Residential and Commercial Customers It is difficult to draw conclusions about how competition has affected retail prices for residential customers in states in which a substantial share of such customers continues to take service under capped POLR rates (e.g., Maryland, Illinois, Pennsylvania, and Texas). Comparisons of regulated prices shed little light on price patterns resulting from retail competition. POLR prices have increased recently in states in which residential rate caps have expired. In New Jersey, residential rate caps on POLR service expired in the summer of 2003. Since then, 275 See infra Texas profile, Appendix D. There likely is a “chicken-or-egg” problem about whether more switching over time is attributable to a prior increase in suppliers or vice-versa (or whether both effects interact).
95
the state has conducted an internet auction to procure POLR supply of various contract lengths (one- and three-year contracts). The state holds annual auctions to replace suppliers with expiring contracts and to acquire additional supply. Rates for the generation portion of POLR service were flat in 2003 and 2004 after adjusting for deferred charges, but increased in 2005 and 2006, with rates increasing approximately 13 percent between 2005 and 2006.276
In Massachusetts, capped POLR rates expired in February 2005. Since then, customers who did not choose an alternative supplier still have been able to obtain POLR service. Massachusetts based the generation portion of its POLR service on the price of supply procured in wholesale markets through fixed-priced, short-term (three- or six-month) supply contracts. Rates for the generation portion of POLR service in the Boston Edison (north) territory increased from 7.5 to 12.7 cents per kWh from 2005 to 2006.277
b. Large Industrial Customers Examining large industrial customers that continue to use a fixed price POLR service also sheds little light on price patterns. A number of states have revised their POLR policies for large customers. Their POLR price for generation is a pass-through of the hourly wholesale price for electricity plus a fixed administrative fee. For example, Maryland, New Jersey, and New York have adopted this type of POLR pricing for large industrial customers.278 Many customers have switched to alternative suppliers in these states. Large industrial customers described how their rates have increased since the beginning of retail competition.279 Some commenters suggested that the Task Force should compare prices of a utility operating in a state that did not implement retail competition against prices of the same utility in a state that implemented retail competition.280
The difficulty with this comparison is that many factors unrelated to retail competition may simultaneously influence prices. For example, one state may have reduced cross-subsidies among customer classes while other states increased them. As a result, a price comparison between two states for a class of customers would conflate competition and cross-subsidization effects. Transmission congestion also may affect access to different generators (with low or high prices), so that comparing two states as if they were in the same physical location would be misleading. The timing of rate adjustments may differ between states, so that a single snapshot of rates would show a lower price in one state at one point in time, but a lower price in the other state at a different point in time – even if the net present values of typical bills in the two states were identical over a long observation period. Finally, some states may defer recovery of costs, whereas other states choose not to. Thus, without accounting for these and other factors, a
276 See infra New Jersey profile, Appendix D. See also Kenneth Rose, 2003 Performance of Electric Power Markets (Aug. 29, 2003), at II-19 (review conducted for the Virginia State Corporation Commission). 277 See infra Massachusetts profile, Appendix D. 278 Although the POLR service price is based on the hourly wholesale price of electricity, customers in Maryland and New Jersey who purchase this service are unaware of the price until they consume the power or until they are billed. Galen Barbose, Charles Goldman, and Bernie Neenan, The Role of Demand Response in Default Service Pricing, 19:3 ELEC. J. 64 (Apr. 2006) [hereinafter Barbose et al.]. 279 See, e.g., ELCON comments; Portland Cement comments; Alliance of State Leaders comments; Alcoa comments. 280 Portland Cement comments; Lehigh Cement comments.
96
simple price comparison between two states may not reveal whether retail competition has benefited customers. At this point the Task Force does not have sufficient data to provide a definitive explanation of price differences between states.281
4. Results of Efforts to Bring Accurate Price Signals into Retail Electric Power Markets There is mixed evidence concerning the degree to which retail competition has resulted in efficient price signals to customers. Residential POLR service rate caps have not increased customer exposure to time-based rates.282 In contrast, real-time pricing is the POLR service available to the largest customers in New Jersey, Maryland, and New York.283 The shift to real-time pricing has been eased by technical advances in metering that have increased the sophistication (and decreased the prices) of meters that record the volume of consumption in each small block of time.284
Commenters argue that POLR rate structure can significantly affect customer response to price, especially among larger customers. A broad spectrum of utilities, state regulators, and ISOs argue that variable rates permit customers to react to price changes by enabling them to see clearly how much they can save.285 The experience of the largest customers in National Grid USA’s New York area suggests that customers using real-time pricing demonstrate price sensitivity.286
In states with traditional cost-based regulation, utilities have used various incentives to induce customers to reduce consumption when demand is high or transmission is congested (e.g., hot summer days). In other instances, such as in New York State, ISOs have successfully implemented demand response programs available to retail customers. In some instances, retail competition has discouraged these traditional types of programs, particularly when distributing utilities are no longer responsible for POLR service.287 When distribution utilities are required to maintain a portfolio of resources to meet POLR loads, they may no longer value these types of programs as a resource to ensure reliable and efficient grid operation. Shifting the responsibility of grid operation and reliability to regional organizations such as ISOs/RTOs further decreases distribution utilities’ interest in these products. 281 See infra Appendix C for reference to some price comparisons by other parties. 282 Rates for residential POLR service in the Consolidated Edison distribution areas in New York State, however, are reported to vary by month rather than being averaged over longer periods of time. Public Utility Law Project of New York comments (2) at 35-36. 283 For discussion of the exposure to hourly prices among the entire class of the largest C&I customers, rather than just the customers still taking POLR service, see Barbose et al.; Hopper, et al. The authors report that although most customers switch away from POLR service when it is an hourly price, they often select offers from alternative suppliers that contain elements of hourly pricing. Further, they report that the proportion of customers accepting hourly price aspects in their supply contracts – over 90 percent – is far higher when the price is set on the day-ahead spot market. The authors believe that the higher participation rates in hourly pricing under this circumstance are due to the early warning that customers get in the day-ahead market and the customers’ consequently greater ability to respond to these pricing signals. 284 Direct Energy comments (2) at 7; Mercatus Center comments at 2; CP Consulting comments at 2. Results from trial programs using advanced meters for residential customers indicate that residential demand for air conditioning is more price sensitive than other uses, particularly if the response is automated. Robert Earle and Ahmad Faruqui, Toward a New Paradigm for Valuing Demand Response, 19:4 ELEC. J. 21 (May 2006). 285 Constellation comments; Pepco comments; Southern comments; EEI comments; IURC comments; NYPSC comments; ISO-NE comments. 286 National Grid comments. 287 For example, Pepco stopped actively supporting its air-conditioner direct load control program when it divested its generation assets.
97
5. Retail Competition in Rural America Many rural areas are served by small non-profit electric cooperative and public power utilities. They were among the last to be electrified and the most costly to serve. Customers are scattered over large geographic areas, with residential and small loads predominating. Although electric distribution cooperative service areas have been opened to competition under some state plans, no state has required municipal and/or public power utilities to implement retail competition. Eight states with retail competition – Arizona, Delaware, Maine, Maryland, Michigan, New Hampshire, Pennsylvania, and Virginia – required cooperatives to implement retail competition in their service territories. With the exception of Pennsylvania, state public utility commissions regulated electric cooperatives’ retail rates and approved their competition plans. Pennsylvania left the design and implementation of retail competition to the individual distribution cooperatives. The Pennsylvania Public Utility Commission is responsible for licensing competitive retail providers in cooperative service territories. Cooperative retail competition plans have been fully implemented in Delaware, Maine, New Hampshire, Pennsylvania, and Virginia. Some aspects of cooperative retail competition plans are still in administrative or judicial proceedings in Arizona and Michigan. Michigan has allowed electric cooperatives to offer retail competition to a portion of their very large C&I customers, but has deferred extending competition to other customers. Other states – including Illinois, Montana, New Jersey, Ohio, and Texas – allow electric cooperatives to opt into retail competition on a vote of their boards or membership. None of these states regulates cooperatives’ rates or services. They leave the design and implementation of retail competition to the individual cooperative. The state licenses competitive providers, but providers must enter into agreements with the cooperative to begin enrolling retail customers. A handful of individual cooperatives in Montana and Texas elected to provide retail competition options for their members. It is difficult to track the progress of retail competition in rural areas because most states do not make switching data available or maintain up-to-date information on active suppliers in cooperative service territories. Nevertheless, the Task Force determined that there were few alternative competitive providers, if any, for residential customers of rural systems open to retail competition. No competitive providers were enrolling customers in cooperative systems in Arizona, Maine, Maryland, New Hampshire, Pennsylvania, or Virginia in May 2006. In Delaware and Montana, competitive providers had been licensed to serve cooperative customers, but it is unclear whether any is currently enrolling customers. Licensed provider and switching information for Texas cooperatives is not yet available. E. POLR Service Price Significantly Affects Entry of New Suppliers Each profiled state required local distribution utilities to offer a POLR service for customers who do not select an alternative generation provider or whose supplier has exited the market. The price that the distribution utility charges for regulated POLR service is usually “fixed” for an extended period – that is, it does not vary with increases or decreases in wholesale prices.
98

Generation accounts for the most significant portion of the POLR service price. This component constitutes the amount that the customer avoids paying to the distribution utility by choosing (and paying) an alternative provider. Many states denote this as the “price to beat” or the “shopping credit.” Commenters say that the price of POLR service is the most significant factor affecting whether new suppliers will enter the market and compete to serve customers.288 The POLR price is the price against which new suppliers, including unregulated affiliates of the distribution utility, must compete if they are to attract customers.289 The frequency with which the POLR service price changes, among other features of POLR service, can affect the competitive dynamics between different suppliers. 1. Contrasting Visions of POLR Service The comments revealed two visions of how POLR service should function in the long term.290 In the first vision, POLR is a long-term option for customers. Under this view, POLR service closely approximates traditional utility service, but in a market place with other sources of supply. Under this vision, POLR service often features prices that are fixed over extended periods. Government-regulated POLR service competes head-to-head with private, for-profit retail suppliers.291 (An analogy would be the U.S. Postal Service providing parcel postage service in competition with for-profit package delivery services by United Parcel Service, DHL, and FedEx). Alternative suppliers may grow as they find additional approaches to attract customers, but POLR service will likely retain a substantial portion of sales, particularly to residential customers. This type of POLR service serves as a yardstick against which alternative suppliers compete. Most states have adopted this vision of POLR service.292
288 In addition to the policies surrounding POLR service discussed above, the comments identified other factors that depress or delay entry into retail markets. For example, the Pennsylvania Consumer Advocate identified several factors that depressed retail entry by suppliers to serve residential customers, including “the acquisition costs associated with marketing programs to reach residential customers, the costs of serving such customers once acquired, and the rising prices for generation supply service in the wholesale market.” PA Consumer Advocate comments at 3. The Maine Office of Public Advocate echoed these factors and also identified the “miscalculation by some suppliers as to the risks and rewards for retail electricity competition.” Maine Public Advocate comments at 3. The Industrial Consumers observed that retail markets are not fully competitive because of insufficient generation divestitures that left suppliers with market power. ELCON comments at 2. Another factor identified by Industrial Consumers is the inability of alternative suppliers to gain access to necessary transmission services to serve their customers. ELCON comments at 6. Others customers suggested that the lack of uniform rules throughout every service territory hinders entry for suppliers. Wal-Mart comments at 13. Other commenters argued that alternative suppliers need access to customer use data from utilities to be able to market to prospective customers. Constellation comments at 43. Still others argued for no minimum stay requirements at POLR and constrained shopping windows, which can dampen entry. RESA comments at 30-31; Strategic comments at 10; Wal-Mart comments at 13. The lack of entry in most states makes it difficult for the Task Force to evaluate which additional factors are the most important. 289 There is one potential exception: a supplier that offers a substantially different product – for example, “green” power from wind turbines – may be able to charge a higher price and still attract customers. 290 Although state utility regulators often require that POLR service be provided or procured by the incumbent distribution utility, the task of providing or procuring POLR service could be carried out by other entities. New York Companies comments (2). For example, it could be assigned to one or more alternative suppliers, awarded through a competitive bidding process, or assumed directly by the state utility regulator (as in Maine). In any case, the firm assigned to provide or procure POLR service may be exposed to the risk that this responsibility will be unprofitable because costs and demand are volatile or because state utility regulators impose costs on the provider of POLR service (such as switching incentives) during the transition to retail customer choice. This risk can create financial difficulties for the distribution utility or another entity with this responsibility. New York Companies comments (2). 291 See, e.g., Illinois Commerce Commission comments; PPL comments; PA Office Consumer Advocate comments. 292 See, e.g., PA Office Consumer Advocate comments; NASUCA comments.
99

In the second vision, POLR is a barebones, temporary service consisting of retail access to wholesale supply, primarily for customers that are between suppliers. In this vision, alternative suppliers serve the bulk of retail customers. They compete primarily against each other with a variety of price and service offerings designed to attract different types of customers. This type of POLR service acts as a stopgap source of supply that ensures electric service is not interrupted when an alternative supplier leaves the market or is no longer willing to serve particular customers. Wholesale spot market prices, or prices that vary with each billing cycle, may be acceptable as the price for POLR service.293 (A supply arrangement comparable to this version of POLR service is the high-risk pool for automobile insurance operated in several states).294 Texas and Massachusetts are current examples of this vision of POLR service, as is Georgia in its design for retail natural gas sales.295
Some profiled states incorporated aspects of both visions of POLR service for different types of customers. For example, New Jersey adopted the first approach for residential customers and the second approach for large C&I customers.296 Large C&I customers are generally expected to be well-informed buyers with wide energy procurement experience. Accordingly, some states determined they are more likely to quickly obtain the benefits of retail competition without additional help from state regulators in the form of fixed POLR prices. 2. Key POLR Service Design Decisions The profiled states took different approaches to designing their POLR service offerings. Key design decisions involved pricing of the POLR, duration of the POLR obligation, and how to acquire POLR supply. Each of these can affect entry conditions that alternative suppliers face. This section describes each of the decisions. a. Pricing of POLR Service The profiled states generally set the POLR price at the regulated price for electric power prevailing before the onset of retail competition, less a discount. Discounts usually persist over a specified multi-year period. Assuming that competition generally lowers prices, one rationale for the discounts was to provide a proxy for the effects of competition on customers less able to quickly obtain such savings for themselves. The Illinois POLR service discount, for example, was developed to bring local prices into line with regional prices. When retail competition began, Illinois customers in areas with relatively low prices before customer choice did not receive discounts below the previously regulated rates. In contrast, customers in the 293 See, e.g., RESA comments; Wal-Mart comments; National Energy comments; SUEZ comments. 294 Most states have a mechanism by which high-risk drivers can obtain insurance. Often insurers in a state are assigned a portion of the pool of high-risk drivers based on each firm’s share of drivers outside the pool. AIPSO manages many of the pools and maintains links with individual state programs at https://www.aipso.com/adc/DesktopDefault.aspx?tabindex=0&tabid=1. Similar plans are available in many states for individuals with prior health conditions who are seeking health insurance coverage. See COMMUNICATING FOR AGRICULTURE AND THE SELF-EMPLOYED, COMPREHENSIVE HEALTH INSURANCE OF HIGH-RISK INDIVIDUALS (19th ed. 2005). 295 Texas will end its “price to beat” system in 2007 (See infra Texas profile, Appendix D). Massachusetts ended its rate-capped POLR service in February 2005 (See infra Massachusetts profile, Appendix D). In the Atlanta Gas Light distribution territory, the distribution utility petitioned the Georgia Public Service Commission to withdraw from retail sales. In Georgia, under the amended Natural Gas Competition and Deregulation Act of 1997, a customer who does not choose an alternative supplier is randomly assigned an alternative supplier. Discussion and documentation about the Georgia natural gas retail competition program are available at http://www.psc.state.ga.us/gas/ngdereg.asp. 296 See infra New Jersey profile, Appendix D.
100
Commonwealth Edison territory – the area with the highest cost-based rates – received 20 percent discounts to bring retail POLR prices there into line with the regional average bundled service prices prevalent prior to the restructuring legislation.297
b. The Extent and Timing of Pass-Through of Fuel Cost Changes States also have considered the extent to which they should adjust the regulated POLR price to allow for changes in the cost of fuel to generate electricity. Some states separated fuel costs from other cost components, because fuel costs have been more volatile than other input prices. (Fuel costs are the largest variable cost component and can be calculated for each type of generation unit on the basis of public information.) These factors also suggest that a generation firm has little control over its fuel costs once it has invested in generation. For example, Texas instituted twice-yearly adjustments in the POLR service (price to beat) price calculations. By adjusting POLR prices for changes in fuel costs, Texas regulators have prevented the POLR price from slipping too far away from competitive price levels, thus maintaining the POLR price as a closer proxy for the competitive price.298 If retail prices fall too far below wholesale prices, the POLR supplier may have financial difficulties, and alternative suppliers will be unlikely to enter or remain as active retailers.299
c. POLR Price and the Shopping Credit When a retail customer picks an alternative supplier, the distribution utility with a POLR obligation avoids the costs of procuring generation supply for that customer. The distribution utility therefore “credits” the customer’s bill so that the customer pays the alternative supplier (rather than the utility) for the electricity supplied.300 This avoided charge – the “shopping credit” – equals the regulated POLR service price. States have used two approaches to determine the level of the shopping credit. One view is that the shopping credit equals the avoided cost or the proportion of POLR procurement costs attributable to a departing customer. Maine, for example, estimated avoided costs on this basis, with no additional estimated avoided costs.301 This approach results in a lower shopping credit and lower total POLR price. An alternative perspective is that the distribution utility also avoids “adders” (costs that are in addition to avoided procurement costs), including marketing and administrative costs.302 This view results in a higher shopping credit and higher total POLR price, creating “headroom” for
297 See infra Illinois profile, Appendix D. 298 See infra Texas profile, Appendix D. In contrast, a state with long lags in fuel cost adjustments would have retail prices well below market rates during periods of increasing fuel prices, and prices well above market rates during periods of declining fuel prices. A single snapshot comparison of prices would be misleading in these circumstances. 299 See discussion infra of the California energy crisis, in which one of the state’s utilities declared bankruptcy because, among other reasons, capped POLR rates were substantially below wholesale prices. 300 The distribution utility continues to charge the customer a delivery charge (a “wires” charge) to cover the transmission and distribution expense. 301 Thomas L. Welch, Chairman, Maine Public Utilities Commission, UtiliPoint PowerHitters interview (Jan. 24, 2003), available at http://mainegov-images.informe.org/mpuc/staying_informed/about_mpuc/commissioners/ph-welch.pdf. 302 See Kenneth Rose, Electric Restructuring Issues for Residential and Small Business Customers, National Regulatory Research Institute Report NRRI 00-10 (June 2000), available at http://www.nrri.ohio-state.edu/dspace/bitstream/2068/610/1/00-10.pdf, for a discussion of adders and their relationship to wholesale prices and headroom for entrants in Pennsylvania and other states.
101

potential entrants. In Pennsylvania, the POLR shopping credit included several other elements, such as avoided marketing and administrative costs.303 Some observers attributed Pennsylvania’s early high volume of switching to the additional avoidable costs included in its shopping credit calculations.304
d. The Multi-Year Period for POLR Service States that implemented retail competition also determined how long POLR service should continue at a discount from prior regulated prices. This period generally corresponded to the distribution utility’s collection of stranded generation and other costs. In a competitive retail environment, utilities no longer were assured they could recover costs of all of their state-approved generation investments. Most states faced claims of stranded costs associated with generation facilities that were unlikely to earn enough revenues to recover fixed costs once customers could seek out alternative, lower-priced retail suppliers. States allowed utilities to recover stranded costs through charges on distribution services that cannot be bypassed.305
Each state that authorized the collection of stranded costs had to determine these costs and the duration of the collection period. These decisions fundamentally altered the electric power industry and were at the center of some of the most contentious issues state regulators faced. Some states (for example, Maine and New York) required some or all generation to be sold to obtain a market-based determination of the level of stranded costs.306 In other states, such as Illinois, utilities voluntarily divested generation assets. As noted above, the result of these divestitures is that generation no longer is primarily in the hands of regulated distribution utilities.307
e. Procurement for POLR Service Because most distribution utilities no longer own generation to satisfy all of their POLR obligations, they took different approaches to acquire generation supply. For example, New Jersey utilities that offer residential POLR service acquire generation supply through three overlapping three-year contracts, with each contract covering approximately one-third of the projected load.308 This “laddering” of supply contracts reduces the volatility of retail electricity prices but does not assure that the prices paid by POLR service consumers are competitive in the short term.309 Other states used different ways to hedge the volatility in short-term energy prices. For example, New York distribution utilities have long-term supply contracts with the purchasers of their generation assets (vesting contracts) based on pre-divestiture average generation prices.310
303 Id. 304 Over time, the shopping credit in Pennsylvania faded in significance as the competitive rates increased relative to POLR service prices due to fuel cost increases. See the pattern of customer switching in the Pennsylvania profile in Appendix D infra. 305 FTC Retail Competition Report, State Profiles, Appendix A. 306 See infra New York profile, Appendix D; FTC Retail Competition Report, Appendix A (profile of New York). 307 See infra Illinois profile, Appendix D. 308 See infra New Jersey profile, Appendix D. 309 See, e.g., Maine Public Advocate comments. 310 See infra New York profile, Appendix D.
102

F. Observations on How POLR Service Policies Affect Competition One of the most contentious issues state regulators currently face is how to price POLR service once rate caps expire. This situation is especially vexing for those states that had stranded cost recovery periods during which fixed POLR prices were substantially lower than wholesale prices. Rate caps expire this year in Delaware, Illinois, Maryland, Ohio, and Rhode Island, and customers in those states that did not choose an alternative supplier face potentially substantial price increases. Rapid increases in fuel prices in recent years – leading to increases in wholesale prices – have made it difficult fully to discern best practices regarding retail competition. The price increases interacted dramatically with POLR service rate caps, clouding the experiences most states have had with other retail competition issues. As a result, the range of experience regarding other aspects of retail competition is narrow, primarily limited to what has occurred in New York, Texas (within ERCOT), the Duquesne distribution area within Pennsylvania, Maine, Massachusetts (recently), and the large C&I customers in New Jersey, Illinois, and Maryland. Because each state faces different electricity supply and demand conditions, it is not possible to recommend a single approach for all states considering retail customer choice. Nonetheless, given these limitations, the Task Force offers the following observations on what appears to work well (and not to work well) in retail customer choice programs.
Minimum POLR Service: POLR service (or an equivalent provision) to serve customers of a supplier that has left the market, while the customer obtains another supplier, is the least intrusive form of POLR service, yet it is consistent with concerns about potentially life-threatening effects of unanticipated loss of electric service.
Treatment of Different Customer Risk Preferences: POLR service that goes beyond
short-term access to the wholesale spot market involves providing a bundle of services that electricity marketers also can provide. States that embrace a more expansive version of POLR service should recognize that this step may hamper the development of alternative suppliers. The economic rationale for taking this step usually is limited to trying to correct some identifiable and substantial market imperfections. If a state adopts a more expansive version of POLR service, it should periodically review the rationale for continuing it.
POLR Service Price Caps: It is difficult to establish a POLR service price cap that will
not distort retail electricity markets and the associated development of effective competition. The best practice is to make frequent adjustments to the cap (at least so as to reflect changes in fuel costs), or to abandon the cap altogether and use an objective, competitive process to procure supply.
Treatment of Different Customer Classes: Large customers are logical pioneers for
retail choice because of their familiarity with energy procurement processes and because they are comfortable with decisions to adjust input use based on input prices. For smaller, less sophisticated customers, including residential customers, issues of
103
awareness and access to comparative pricing information should be addressed as retail customer choice is introduced.
Switching Costs: Switching is important for retail electricity competition to work.
States should strive to avoid rules that make switching more expensive or slower than is necessary to avoid unauthorized switching (slamming).
Consumer Education: Becoming an informed and responsive consumer in an
unfamiliar market requires that the customer be informed that he or she has choices and be provided with information about how to compare available choices and how to switch suppliers (including any constraints on switching). Texas maintains a well-organized website that appears to work well for residential price comparisons. New York’s program to encourage customers to try out alternative suppliers that agree to offer a temporary discount appears to educate many residential customers effectively about the ease of switching, without subsidizing alternative suppliers.
Customer Aggregation: Customer aggregation is an approach that can reduce per-
customer search and switching costs and thus generally can help to develop retail competition. Opt-out customer aggregations may be worth considering because they can minimize transaction costs without limiting customer choice.
Entry: Entry is a key concept in retail electricity competition. States should attempt to
avoid rules that make entry more expensive or slower than is required to avoid fraudulent marketing activities. Areas to consider include registration fees and delays, costs and delays in interacting with the distribution utility (metering, billing, treatment of receivables), security deposits for suppliers, rules regarding disconnecting retail customers for non-payment, and exit penalties.
1. POLR Service Price to Approximate the Market Price
The POLR service price must closely approximate a competitive market price if it is to provide economically efficient incentives for consumption and supply decisions and thereby maximize welfare. This price will vary over time as supply and demand change.311 If the POLR service 311 Because the marginal cost of supplying electricity varies over the course of the day and season and because fuel costs sometimes are volatile, efficient retail prices for electricity are more volatile than the prices that customers are used to paying under traditional regulation. Electricity prices under traditional regulation typically reflect average costs for electricity and risk management over extended periods. In a retail choice environment, alternative suppliers can offer a variety of risk management (hedging) levels that range from full, immediate pass-through of wholesale spot market prices to fixed rates for extended periods. For a discussion of how much hedging is required to eliminate portions of volatility, see Severin Borenstein, Customer Risk from Real-Time Retail Electricity Pricing: Bill Volatility and Hedgability, (June 6, 2006) (University of California Energy Institute CSEM Working Paper 155), available at http://www.ucei.berkeley.edu/PDF/csemwp155.pdf. It is important to note that these bundles of electricity and risk management also can constitute efficient retail prices, although they contain a cost component associated with the risk management services. If POLR service prices become more volatile, a customer who prefers less risk will have incentives to search for an alternative supplier that offers a price/risk tradeoff – slightly higher prices but less volatility.
Alternative suppliers will have incentives to offer preferable price/risk alternatives to gain customers. Retail customers can also consider whether onsite generation or other forms of upstream vertical integration offer a preferable price/risk combination.
In general, so long as customers are served by alternative suppliers or upstream vertical integration is an option, the POLR price is only one component of the average market price.
In a traditional regulatory setting, utilities sometimes offer customers a discount if they agree to have their service interrupted during peak demand periods. Removing restrictions to interruptible service rates would allow more customers to improve the match between their risk preferences and their electric service. Industrial Coalitions comments (2) at 25.
104
price does not closely match the competitive price, it will distort consumption and investment decisions312 leading to an inferior allocation of resources.313 Competitive market prices align consumers’ willingness to pay for a service with the marginal cost of providing it (where, in the long run, the marginal cost includes a competitive rate of return on investments). This alignment leads to the most economically efficient allocation of resources.314
Experience within the profiled states shows that it is not easy to approximate the competitive price. Not only does the competitive price change when prices of inputs change, but the price also acts as an investment signal for new generation. The short-term competitive price for the electric generation component can move quickly and dramatically. Over the past several years, the initial fixed discounts for POLR service have resulted in below-market prices or occasionally above market prices, but never at the short-term market price for long.315 When POLR prices are below competitive levels, even efficient alternative suppliers cannot profit by entering or continuing to serve retail customers.316 Firms with the POLR obligation can become financially distressed, as they did in California during its energy crisis.317
Fuel prices are responsible for a substantial percentage of the change in the market price. A POLR service should adjust the retail electricity price for changes in the prices of fuels used by generators (at the margin). This is more efficient than using a fixed price as a proxy for the market price. Moreover, a POLR price that is adjusted only infrequently to incorporate underlying fuel price changes will usually be either above or below the competitive market price.318 A fixed or infrequently updated price creates incentives for customers to move back and forth from POLR service to alternative suppliers, based on which offers a lower rate. This repeated switching may create additional costs for both POLR and alternative suppliers. It also can reduce the certainty about procurement quantities which suppliers need to make long-term supply arrangements. Including other identifiable cost components that fluctuate widely in POLR service price adjustments will increase the likelihood that the POLR service price will be a reasonable proxy for the competitive price. 2. Lack of Market-Based Pricing Distorts Development of Competitive Retail Markets A second issue arises when below-market POLR service prices persist during a period of rising fuel prices and correspondingly increasing wholesale supply prices. In these circumstances,
312 Some commenters observed that cost averaging, cost deferrals, inaccurate cost allocations, double counting of costs, and price caps all can distort consumption and investment that result in loss of consumer welfare. Strategic Energy comments (2) at 6; Constellation comments (2) at 8. 313 The electricity industry has traditionally provided discounts or other forms of assistance to low-income families. States may need to examine whether the level of this assistance should be increased in response to price increases or greater price volatility. National Association of State Utility Consumer Advocates (2). Similarly, firms whose competitors are in areas with stable or declining prices or diminishing price volatility could face financial distress, just as if they experienced other types of increased or more volatile input costs relative to their rivals. Firms with electricity-intensive production processes are likely to be particularly sensitive to increased prices or price volatility. Alcoa comments (2); Industrial Coalitions comments (2) at 26. 314 This statement would need to be qualified to the extent there is market power and to the extent there are unpriced externalities such as pollution. 315 See, e.g., Wal-Mart comments; WPS comments; Illinois Commerce Commission comments; PPL comments; RESA comments. 316 See, e.g., Wal-Mart comments; RESA comments. 317 See, e.g., EEI comments. 318 See, e.g., RESA comments.
105
customers are likely to experience a shock when POLR service prices are adjusted to reflect prevailing wholesale prices. This can create public pressure to continue the fixed POLR rates at below-market levels. For example, some jurisdictions have considered a gradual phase-in of the price increase to bring POLR prices to the market level. The shortfall between the market POLR price and the price that customers actually pay is usually deferred and collected later from the POLR provider’s customers. Although this approach reduces rate shock, it is likely to distort retail electricity markets. First, a phase-in of the price increase continues to send inaccurate price signals and undermines incentives to reduce consumption. Second, it prevents entry of alternative suppliers by keeping the POLR rate below market levels for additional years. Third, it results in higher prices in future years as the deferred revenues are recovered, so that customers who purchase electricity later are unfairly penalized (overcharged). Fourth, if surcharges to pay for deferred revenues are not designed carefully, the charges can disrupt existing competition by forcing customers with alternative suppliers to pay for part of the deferred revenues. Fifth, if wholesale prices decline, customers will choose alternative suppliers, and this migration will create a stranded cost problem as the POLR provider loses customers it had counted on to pay the higher prices. Moreover, if the state prevents the stranded cost problem by imposing large exit fees, POLR service customers will be locked in to the POLR provider, so that competition may not develop even after POLR service prices rise to market levels. Finally, continued POLR service price caps in an environment of increasing wholesale prices can endanger the financial viability of the distribution utility. 3. Different POLR Services Designed for Different Classes of Customers Some states have different POLR service designs for different customer classes. POLR service prices offered to large C&I customers generally entail less discounting from regulated rates or competitive market-based procurement and have been based on wholesale spot market prices. Large C&I customers generally have a good understanding of price risk and of the means and costs required to reduce that risk. In addition, suppliers often can customize service offerings to the unique needs of these large customers.319 With their larger loads, large C&I customers also may be better equipped to respond to efficient price signals than other classes of customers. The result of this price response may be to improve system reliability and dissipate market power in peak demand periods.320
Large C&I customers have engaged in more switching to competitive providers in states that have implemented this division between POLR service for large C&I customers and for residential and small C&I customers.321 Many alternative suppliers reportedly have developed
319 See, e.g., Wal-Mart comments at 10-11; Commercial End-Users comments. 320 In Case 03-E-0641, the New York State Public Service Commission required New York utilities to file tariffs for mandatory real-time pricing (RTP) for large C&I customers. The order observed that “average energy pricing reduces customers’ awareness of the relationship between their usage and the actual cost of electricity, and obscures opportunities to save on electric bills that would become apparent if RTP were used to reveal varying price signals.” It further notes that “if a sufficient number of customers reduced load in response to RTP, besides benefiting themselves, the reduction in peak period usage would ameliorate extremes in electricity costs for all other customers.” 321 See infra New Jersey profile, Appendix D; RESA comments.
106

customized time-of-use contracts for large C&I customers.322 Moreover, the profiled states show that a substantial number of suppliers actively serve large C&I customers. Box 4-5 describes Oregon’s unique sign-up period for its nonresidential customers.
Box 4-5 Oregon’s Annual Window for Switching for Nonresidential Customers
Oregon has a unique process by which nonresidential customers of the two large investor-owned distribution utilities in Oregon can switch to an alternative supplier. Nonresidential customers must make their selections during a limited annual window. The window must extend at least five days in duration, but usually a month is allowed. In addition to picking the alternative supplier, the largest customers must select a contract duration. One option specifies a minimum duration of five years, with an annual renewal after that. As of 2005, alternative suppliers were anticipated to serve about 10 percent of load in one distribution area and about 2.1 percent in the other. One utility offered choice beginning in 2003, while the other began customer choice in 2005. Detailed descriptions are available at http://www.oregon.gov/PUC/electric_restruc/indices/ORDArpt12-04.pdf.
It is not necessary to expose all customers to time-based prices to introduce price-responsiveness into retail markets.323 As a first step, customers who are the most price-sensitive could be exposed to time-based rates. Niagara Mohawk in upstate New York took this approach for its largest customers, as did Maryland and New Jersey. California is considering setting real-time pricing as the default rate for medium-sized and larger C&I customers. Another means to introduce price responsiveness is to provide customers with voluntary time-based rate programs, along with assistance in equipment purchases or financing. For example, the New York State Public Service Commission requires voluntary time-of-use pricing for residential customers, and the Illinois Legislature requires that residential customers be offered real-time pricing as a voluntary tariff. Ideally, competition provides incentives for suppliers to offer customers the mix of products and services that matches their potentially diverse preferences. 4. Use of Auctions to Procure POLR Service As discussed above, New Jersey has used an auction process to procure POLR supply for both residential and C&I customers. Illinois proposed a similar auction for when its rate caps expire. Auctions may bring retail customers the benefit of competition in wholesale markets as suppliers compete to supply load. However, as discussed in Chapter 3, if there is a load pocket, an auction is unlikely to help this process, resulting in fewer benefits of competition.
322 See, e.g., New York Companies comments; Alliance for Retail Energy Markets comments; Constellation comments; PPL comments; RESA comments; NYPSC comments; Direct Energy comments; Reliant comments; PA Office Consumer Advocate comments; Wal-Mart comments; Commercial End-Users comments. 323 Steven Braithwait and Ahmad Faruqui, The Choice Not to Buy: Energy Savings and Policy Alternatives for Demand Response, PUB. UTILS. FORTNIGHTLY (Mar. 15, 2001).
107
5. Consumer Awareness of Customer Choice and Engendering Interest in Alternative Suppliers Experience with restructuring in other industries indicates that consumer switching from a traditional supplier to a new one can be a slow process. It took 15 years before AT&T lost half of its long-distance service customers to alternative suppliers.324 One reason retail electric competition could be slow to develop is that expected gains from learning more about market choices may be too small to make the learning worthwhile,325 particularly for residential customers with small loads.326
Pricing of POLR service and helping consumers compute the “shopping credit” may encourage more rapid development of retail competition by motivating residential consumers to search for market choices. Some states that have low “shopping credits” have had little retail entry. Some states with retail competition have had substantial consumer education programs, including websites with orientation materials and price comparisons.327 These initiatives help promote learning about market alternatives. New York is encouraging retail competition by helping organize temporary discounts from alternative suppliers and ordering distribution utilities to make these discounts known to customers who contact the utility.328 These efforts have increased residential switching and reduced prices, at least for the short term. Experience indicates that once residential customers switch to alternative suppliers, they seldom return to POLR service even after the temporary discounts expire.329
324 James Zolnierek, Katie Rangos, and James Eisner, Industry Analysis Division, Common Carrier Burerau, Federal Communications Commission, Long Distance Market Shares, Second Quarter 1998, at 19-20 (Sept. 1998), available at http://www.fcc.gov/Bureaus/Common_Carrier/Reports/FCC-State_Link/IAD/mksh2q98.pdf; Thomas L. Welch, Chairman, Maine Public Utilities Commission, UtiliPoint PowerHitters interview (Jan. 24, 2003) available at http://mainegov-images.informe.org/mpuc/staying_informed/about_mpuc/commissioners/ph-welch.pdf. 325 Economists refer to this phenomenon as “rational ignorance.” Clemson University, The Theory of Rational Ignorance (The Community Leaders’ Letter, Economic Brief No. 29), available at http://www.strom.clemson.edu/teams/ced/econ/8-3No29.pdf. 326 Joskow, Interim Assessment. 327 See, e.g., ELCON comments; Progress Energy comments; Constellation comments; Pepco comments; PA Office Consumer Advocate comments. 328 In Case 05-M-0858, the New York State Public Service Commission adopted the “PowerSwitch” alternative supplier referral program (first developed by Orange & Rockland) as the model for all utilities in the state. 329 New York State Consumer Protection Board, Comment to the New York State Public Service Commission, Case 05-M-0334, Orange & Rockland Utilities, Inc., Retail Access Plan, at 5 (May 2, 2005). The Consumer Protection Board indicated that retail customers who have participated in “PowerSwitch” are returning to POLR service at a rate of less than 0.1 percent per month. The Board applauded PowerSwitch because it is completely voluntary and provides assured initial savings to consumers.
108
APPENDIX A LIST OF COMMENTERS WHO RESPONDED TO TASK FORCE NOTICES
REQUESTING COMMENTS* * Two notices were published in the Federal Register as FERC Docket Number AD05-17-000: (1) Notice Requesting Comments on Wholesale and Retail Electricity Competition, issued on October 13, 2005, and (2) Notice Requesting Comments on Draft Report to Congress on Competition in the Wholesale and Retail Markets for Electric Energy, issued on June 5, 2006. The actual comments can be found at FERC.gov The following parties filed comments in response to the notice issued October 13, 2005: Alcoa, Inc. (Alcoa) Allegheny Energy Companies (Allegheny) Alliance for Retail Energy Markets Ameren Services Company (Ameren) American Antitrust Institute (AAI) American Public Power Association (APPA) Association of Large Distribution Cooperatives (Large Distribution Cooperatives) BlueStar Energy Services, Inc. (BlueStar) BP Energy Company (BP Energy) California Independent System Operator Corporation (CAISO) California Public Utilities Commission (CPUC) Cape Light Compact Carnegie Mellon Electricity Industry Center (Carnegie Mellon) CenterPoint Energy Houston Electric, LLC (CenterPoint) Los Angeles Department of Water and Power (LADWP) 7-Eleven, Inc, Big Lots Stores, Inc., Crescent Real Estate Equities, Federated Department Stores, Hines, JC Penney, Wal-Mart Stores, Inc. (collectively, Commercial End-Users) COMPETE, Electric Power Supply Association (EPSA), Alliance for Retail Choice (ARC)
109

Connecticut Department of Public Utility Control (Connecticut DPUC) Consolidated Edison Company of New York, Inc. and Orange and Rockland Utilities, Inc. (together, New York Companies) Constellation Energy Group, Inc. (Constellation) Council of Industrial Boiler Owners (CIBO) Demand Response and Advanced Metering Coalition (DRAM Coalition) Direct Energy Services, LLC (Direct Energy) Dominion Resources Services, Inc. (Dominion) Duke Energy Corporation (Duke) Duquesne Light Company (Duquesne) Edison Electric Institute (EEI) Electric Power Supply Association (EPSA) Electricity Consumers Resource Council (ELCON) and American Chemistry Council, American Iron and Steel Institute, Coalition of Midwest Transmission Customers, PJM Industrial Customer Coalition, Illinois Industrial Energy Consumers, Industrial Energy Users - Ohio, and Multiple Intervenors (collectively, Industrial Consumers) EnerNOC, Inc. (EnerNOC) Exelon Corporation (Exelon) Governor of the State of Rhode Island Idaho Public Utilities Commission (Idaho PUC) Illinois Commerce Commission Independent Power Producers of New York, Inc. (IPP NY) Indiana Utility Regulatory Commission (IURC)
110
Industrial Consumers: Portland Cement Association, American Forest and Paper Association, American Iron and Steel Institute, California Large Energy Consumers Association, Coalition of Midwest Transmission Customers, National Lime Association, PJM Industrial Customer Coalition ISO New England Inc. (ISO-NE or ISO New England) ISO/RTO Council Large Public Power Council (LPPC) Lehigh Cement Company (Lehigh) Maine Office of Public Advocate (Maine Public Advocate) Midwest Independent Transmission System Operator Inc. (Midwest ISO or MISO) Midwest Stand-Alone Transmission Companies Mike Holly; Sorgo Fuels, Inc. Mirant Corporation (Mirant) Missouri Public Service Commission (Missouri State Commission) National Association of Regulatory Utility Commissioners (NARUC) National Association of State Utility Consumer Advocates (NASUCA) National Energy Marketers Association (National Energy) National Grid USA (National Grid) National Rural Electric Cooperative Association (NRECA) New Mexico Attorney General New York Independent System Operator, Inc. (NYISO or New York ISO) New York State Department of Public Service (NYPSC or New York PSC) New York State Electric & Gas Corporation (New York G&E) and Rochester Gas & Electric Corporation (Rochester G&E) North Carolina Utilities Commission, Public Staff - North Carolina Utilities Commission, and the Attorney General of the State of North Carolina (collectively, North Carolina Agencies)
111

Northeast Utilities NUCOR Corporation, Blue Ridge Power Agency, and the East Texas Electric Cooperative (collectively, Large Power Buyers) Orlando Utilities Commission (Orlando Utilities) Pennsylvania Office of Consumer Advocate (PA Consumer Advocate) Pepco Holdings, Inc. (Pepco) PJM Interconnection, LLC (PJM) PNM Resources, Inc. (PNM) PPL Companies (PPL) Progress Energy, Inc. and South Carolina Public Service Authority (together, Progress and Santee Cooper) Public Utilities Commission of Ohio Reliant Energy Inc. (Reliant) Retail Energy Supply Association (RESA) South Carolina Electric and Gas Company (South Carolina E&G) Southern California Edison Company (SoCal Edison) Southern Companies (Southern) Southwest Transmission Dependent Utility Group (Southwest Transmission) Steel Manufacturers Association (Steel Manufacturers) Strategic Energy, LLC (Strategic Energy) SUEZ Energy North America (SUEZ) The Alliance of State Leaders Protecting Electricity Consumers (Alliance of State Leaders) Transmission Access Policy Study Group (TAPS) Transmission Agency of Northern California (TANC)
112
Virginia State Corporation Commission Wal-Mart Stores, Inc. (Wal-Mart) WPS Resources Corporation (WPS) Xcel Energy Services, Inc. (Xcel)
The following parties filed comments in response to the notice issued June 5, 2006: Alcoa, Inc. (Alcoa) Allegheny Power and Allegheny Energy Supply Company, LLC (together, Allegheny) Alliance for Retail Energy Markets Alliance of State Leaders Protecting Electricity Consumers American Public Power Association (APPA) Attorney General of California Attorney General of New Mexico California Department of Water Resources; State Water Project Cape Light Compact City of Seattle; City Light Department Coalition of Midwest Transmission Customer, NEPOOL Industrial Customer Coalition, PJM Industrial Customer Coalition, Industrial Energy Users-Ohio, Industrial Energy Consumers of Pennsylvania, and West Virginia Energy Users Group (collectively, Industrial Coalitions) Community Power Alliance COMPETE, Electric Power Supply Association (EPSA), Alliance for Retail Choice (ARC) Consolidated Edison Company of New York, Inc. and Orange and Rockland Utilities, Inc. (together, New York Companies) Constellation Energy Group, Inc. (Constellation) CP Consulting Direct Energy Services, LLC (Direct Energy)
113

Duquesne Light Company (Duquesne) Edison Electric Institute (EEI) and the Alliance of Energy Suppliers Electric Power Supply Association (EPSA), Independent Power Producers of New York (IPP NY), Independent Energy Producers of Maine (IEPM) Electricity Consumers Resource Council (ELCON) and American Iron and Steel Institute, Association of Businesses Advocating Tariff Equity, Coalition of Midwest Transmission Customers, PJM Industrial Customer Coalition, Industrial Energy Users – Ohio, Multiple Intervenors, and Wisconsin Industrial Energy Group, Inc. (collectively, Industrial Consumers) Industrial Consumers: Portland Cement Association, American Forest and Paper Association, American Iron and Steel Institute, California Large Energy Consumers Association, Coalition of Midwest Transmission Customers, National Lime Association, PJM Industrial Customer Coalition ISO New England Inc. (ISO New England) ISO/RTO Council Mercatus Center; George Mason University (Mercatus Center) Midwest Independent Transmission System Operator, Inc. (MISO) Midwest Stand-Alone Transmission Companies Mike Holly; Sorgo Fuels, Inc. National Association of State Utility Consumer Advocates (NASUCA) National Grid USA (National Grid) National Rural Electric Cooperative Association (NRECA) New York State Electric & Gas Corporation (New York G&E) and Rochester Gas & Electric Corporation (Rochester G&E) OMB Professionals, Inc. Pacific Gas & Electric Company (PG&E) PJM Interconnection, LLC (PJM) Portland Cement Association (Portland Cement)
114

PPL Companies (PPL) Progress Energy, Inc. and South Carolina Public Service Authority (together, Progress and Santee Cooper) Public Service Commission of New York (PSC New York) Public Service Commission of Wisconsin (PSC Wisconsin) Public Utility Law Project of New York Public Utilities Commission of Texas Reliant Energy Inc. (Reliant) Strategic Energy, LLC (Strategic Energy) SUEZ Energy North America (SUEZ) Transmission Access Policy Study Group (TAPS) William D. Steinmeier Wisconsin Power & Light, Madison Gas & Electric Company, Wisconsin Electric Power Company, Wisconsin Public Power Incorporated, and WPS Resources Corporation (collectively, Wisconsin Load Serving Entities).
115
APPENDIX B TASK FORCE MEETINGS WITH OUTSIDE PARTIES
American Public Power Association – October 27, 2005 ArcLight Capital Partners LLC– November 9, 2005 Compete Coalition – October 27, 2005 Edison Electric Institute – October 26, 2005 Electric Power Supply Association – October 27, 2005 Electricity Consumers Resource Council – October 26, 2005 Fitch Ratings – November 9, 2005 Lehman Brothers – November 9, 2005 Merrill Lynch Commodities, Inc. – November 9, 2005 Moody’s Investors Service – November 9, 2005 National Association of Regulatory Utility Commissioners – October 27, 2005 National Association of State Energy Officials – October 27, 2005 National Governors Association – October 26, 2005 National Rural Electric Cooperative Association – October 26, 2005 Public Utility Law Project – October 27, 2005 Standard & Poor’s – November 9, 2005 SUEZ Energy North America – December 8, 2005
116
APPENDIX C AN ANNOTATED BIBLIOGRAPHY OF QUANTITATIVE COST BENEFIT
ASSESSMENTS OF ELECTRIC INDUSTRY RESTRUCTURING PROPOSALS Commenters on the section 1815 study highlighted a wide variety of cost-benefit studies that seek to evaluate the electric power industry. Both proponents and opponents of electric industry restructuring have armed themselves with these types of analyses to support their respective positions. It can be challenging to understand these studies’ sometimes contradictory results. The Task Force reviewed roughly 30 cost-benefit analyses330 in an attempt to better understand what they reveal. Based on this review, together with a review of the recent DOE Report (J. Eto, B. Lesieutre, and D. Hale, A Review of Recent RTO Benefit-Cost Studies: Toward More Comprehensive Assessments of FERC Electricity Restructuring Policies (December 2005) [hereinafter Eto]), the Task Force has made the following observations: 1) Many of the existing studies address only the benefits of restructuring proposals. To the extent studies overlook the costs associated with institutional changes, they can provide an incomplete picture of impacts, and their results should be juxtaposed to cost estimates. ( See Appendix C: RTO West Benefits and Costs, Economic Assessment of RTO Policy, and Putting Competitive Power Markets to the Test The Benefits of Competition in America’s Electric Grid: Cost Savings and Operating Efficiencies). 2) The benefits associated with some of the most significant motivations behind restructuring – the maintenance of system reliability and the facilitation of lowest-cost electricity production (via incentives for innovation and low-cost construction) - are very difficult to quantify using current technology and are often left out of benefit assessments. “It is important that technically limited studies not be interpreted to suggest that impacts that they do not analyze are not significant.” Eto at 21. 3) Existing methods and models used to estimate benefits are limited in what they can measure. Many of these models also employ simplistic and often misleading assumptions about market behavior. Improving the models used to derive quantitative benefits is technically difficult – significant improvements would involve marrying the complexity of adequately modeling a 10,000+ bus transmission/generation system to the complexity of modeling realistic human behavior in markets. The capabilities of existing models are likely to be fairly static until computer technology advances enough to accommodate the memory needs associated with this complex modeling task.
330 This review focuses on original studies – responses and critiques to these studies are listed under the “Alternate Views” table category.
117

4) Modeling energy transmission and markets necessarily requires making a great deal of assumptions given the significant limitations in data needed to "feed" these models. Thus, outputs of RTO modeling attempts vary widely based on the assumptions made by the parties doing the modeling – assumptions as to transmission configurations, weather, imports/exports, market behaviors, generation costs, etc. (See Appendix C: Study of Costs, Benefits and Alternatives to Grid West, versus The Estimated Benefits of Grid West). 5) Another limitation of the studies is that they often only estimate the benefits to society as a whole. Determining the distribution of benefits and costs - who wins and who loses, or who wins the most - is an important piece of the decision making puzzle. Unfortunately, it is much more difficult to measure the distribution of benefits than it is total social costs. Some efforts have been made in this direction with estimates of the end-use price impacts that restructuring has had or might have and with estimates of benefits that individual participants in electricity markets might accrue (See Appendix C: Beyond the Crossroads, the Future Direction of Power Industry Restructuring and Competition Has Not Lowered Electricity Prices). 6) Characteristics of the best restructuring cost-benefit studies, given existing technology/data, include:
• Provision of clear and precise descriptions of assumptions, data sources, methods and technical detail.
• Where econometric models are used, study write-ups should provide regression methods and equations, goodness of fit measures, and results of any tests done to detect analytical flaws.
• An attempt to address all potential costs and benefits. • An effort to address the distribution of impacts.
118

STUDIES OF BENEFITS IN THE US Beyond the Crossroads: The Future Direction of Power Industry Restructuring Region US Report Date 2005 Sponsor Cambridge Energy Research Associates Author/Contractor Cambridge Energy Research Associates Model/Method CERA constructs average counterfactual prices as an econometric
function of fuel prices and return on the rate base, for residential and industrial customers in four geographic territories based on 1992-1197 data.
Scope of Inquiry Real price impacts on consumers of electric industry restructuring (study also addresses other restructuring policy issues on a non-quantitative basis)
Period Studied 1997-2004 Conclusion U.S. residential electric consumers paid about $34 billion less for the
electricity they consumed over the past seven years than they would have paid if traditional regulation had continued. Regional distribution of these benefits: NE $ 8 billion Midwest: $ 8 billion South: $24 billion West: -$7 billion
Alternate Views • APPA thinks figures are inflated: http://www.appanet.org/newsletters/washingtonreportdetail.cfm?ItemNumber=14977&sn.ItemNumber=0
• Comments to Electric Energy Market Competition Task Force by NRECA, November 18, 2005
• H. Spinner, A Response to Two Recent Studies that Purport to Calculate Electric Utility Restructuring Benefits Captured by Consumers, ELECTRICITY JOURNAL, Volume 19, No. 1 (January/February 2006) at 42-47.
Electricity Markets: Consumers Could Benefit from Demand Programs, but Challenges Remain Region US Report Date August, 2004 Sponsor Report to the Chairman, Committee on Governmental Affairs, U.S. Senate Author/Contractor US GAO Model/Method Reviewed the literature, analyzed industry and participant data, and
conducted interviews with state and federal officials (in FERC, the DOE , and the GSA), industry experts, representatives from utilities, and customers
Scope of Inquiry Examines the current and potential role for demand-response programs.
119
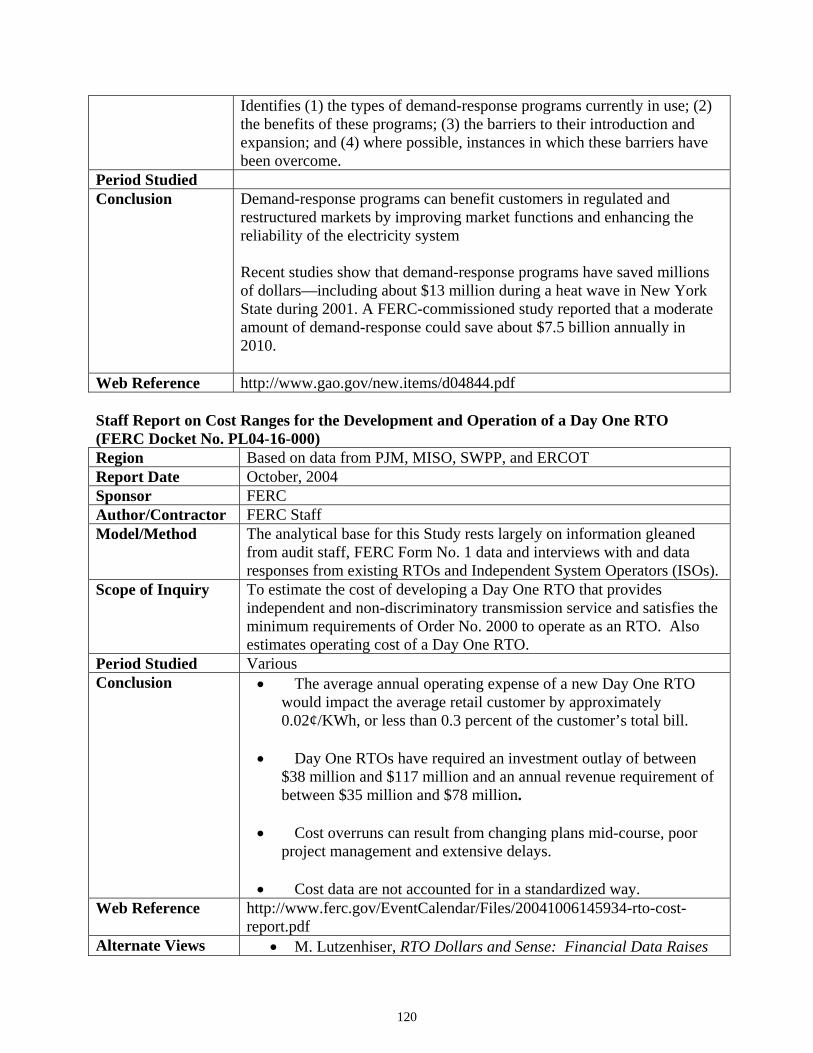
Identifies (1) the types of demand-response programs currently in use; (2) the benefits of these programs; (3) the barriers to their introduction and expansion; and (4) where possible, instances in which these barriers have been overcome.
Period Studied Conclusion Demand-response programs can benefit customers in regulated and
restructured markets by improving market functions and enhancing the reliability of the electricity system Recent studies show that demand-response programs have saved millions of dollars—including about $13 million during a heat wave in New York State during 2001. A FERC-commissioned study reported that a moderate amount of demand-response could save about $7.5 billion annually in 2010.
Web Reference http://www.gao.gov/new.items/d04844.pdf Staff Report on Cost Ranges for the Development and Operation of a Day One RTO (FERC Docket No. PL04-16-000) Region Based on data from PJM, MISO, SWPP, and ERCOT Report Date October, 2004 Sponsor FERC Author/Contractor FERC Staff Model/Method The analytical base for this Study rests largely on information gleaned
from audit staff, FERC Form No. 1 data and interviews with and data responses from existing RTOs and Independent System Operators (ISOs).
Scope of Inquiry To estimate the cost of developing a Day One RTO that provides independent and non-discriminatory transmission service and satisfies the minimum requirements of Order No. 2000 to operate as an RTO. Also estimates operating cost of a Day One RTO.
Period Studied Various Conclusion • The average annual operating expense of a new Day One RTO
would impact the average retail customer by approximately 0.02¢/KWh, or less than 0.3 percent of the customer’s total bill.
• Day One RTOs have required an investment outlay of between $38 million and $117 million and an annual revenue requirement of between $35 million and $78 million.
• Cost overruns can result from changing plans mid-course, poor project management and extensive delays.
• Cost data are not accounted for in a standardized way.
Web Reference http://www.ferc.gov/EventCalendar/Files/20041006145934-rto-cost-report.pdf
Alternate Views • M. Lutzenhiser, RTO Dollars and Sense: Financial Data Raises
120
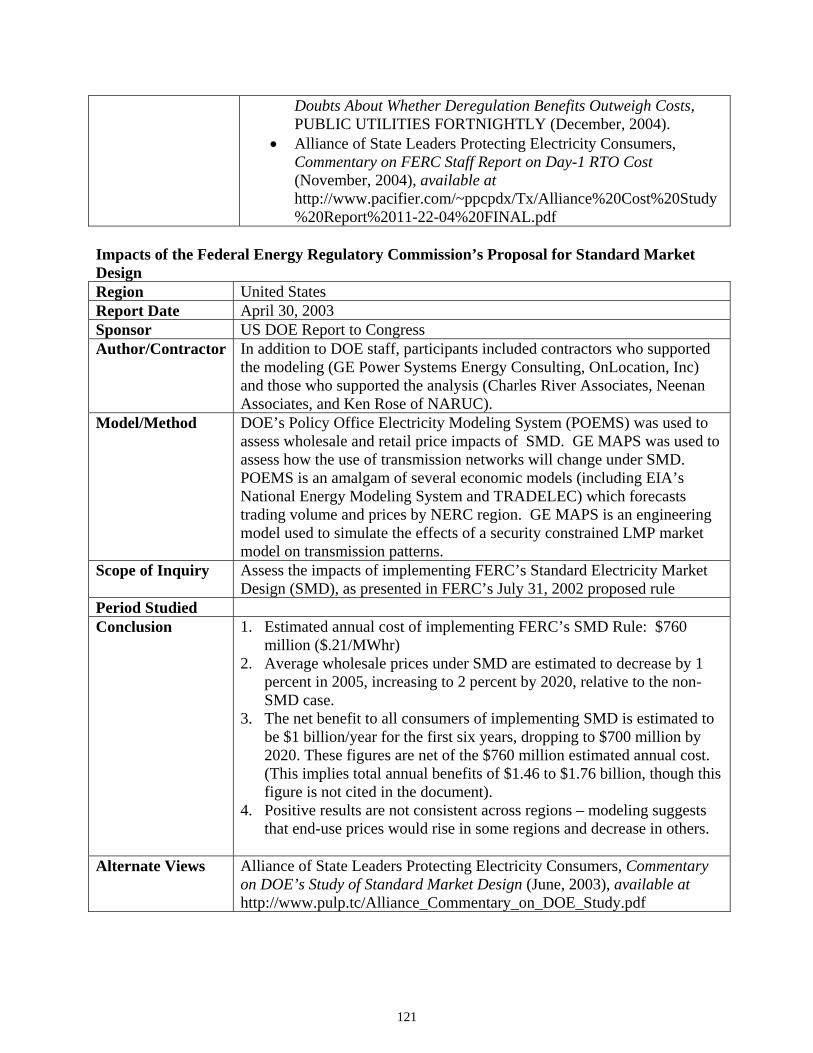
Doubts About Whether Deregulation Benefits Outweigh Costs, PUBLIC UTILITIES FORTNIGHTLY (December, 2004).
• Alliance of State Leaders Protecting Electricity Consumers, Commentary on FERC Staff Report on Day-1 RTO Cost (November, 2004), available at http://www.pacifier.com/~ppcpdx/Tx/Alliance%20Cost%20Study%20Report%2011-22-04%20FINAL.pdf
Impacts of the Federal Energy Regulatory Commission’s Proposal for Standard Market Design Region United States Report Date April 30, 2003 Sponsor US DOE Report to Congress Author/Contractor In addition to DOE staff, participants included contractors who supported
the modeling (GE Power Systems Energy Consulting, OnLocation, Inc) and those who supported the analysis (Charles River Associates, Neenan Associates, and Ken Rose of NARUC).
Model/Method DOE’s Policy Office Electricity Modeling System (POEMS) was used to assess wholesale and retail price impacts of SMD. GE MAPS was used to assess how the use of transmission networks will change under SMD. POEMS is an amalgam of several economic models (including EIA’s National Energy Modeling System and TRADELEC) which forecasts trading volume and prices by NERC region. GE MAPS is an engineering model used to simulate the effects of a security constrained LMP market model on transmission patterns.
Scope of Inquiry Assess the impacts of implementing FERC’s Standard Electricity Market Design (SMD), as presented in FERC’s July 31, 2002 proposed rule
Period Studied Conclusion 1. Estimated annual cost of implementing FERC’s SMD Rule: $760
million ($.21/MWhr) 2. Average wholesale prices under SMD are estimated to decrease by 1
percent in 2005, increasing to 2 percent by 2020, relative to the non-SMD case.
3. The net benefit to all consumers of implementing SMD is estimated to be $1 billion/year for the first six years, dropping to $700 million by 2020. These figures are net of the $760 million estimated annual cost. (This implies total annual benefits of $1.46 to $1.76 billion, though this figure is not cited in the document).
4. Positive results are not consistent across regions – modeling suggests that end-use prices would rise in some regions and decrease in others.
Alternate Views Alliance of State Leaders Protecting Electricity Consumers, Commentary
on DOE’s Study of Standard Market Design (June, 2003), available at http://www.pulp.tc/Alliance_Commentary_on_DOE_Study.pdf
121
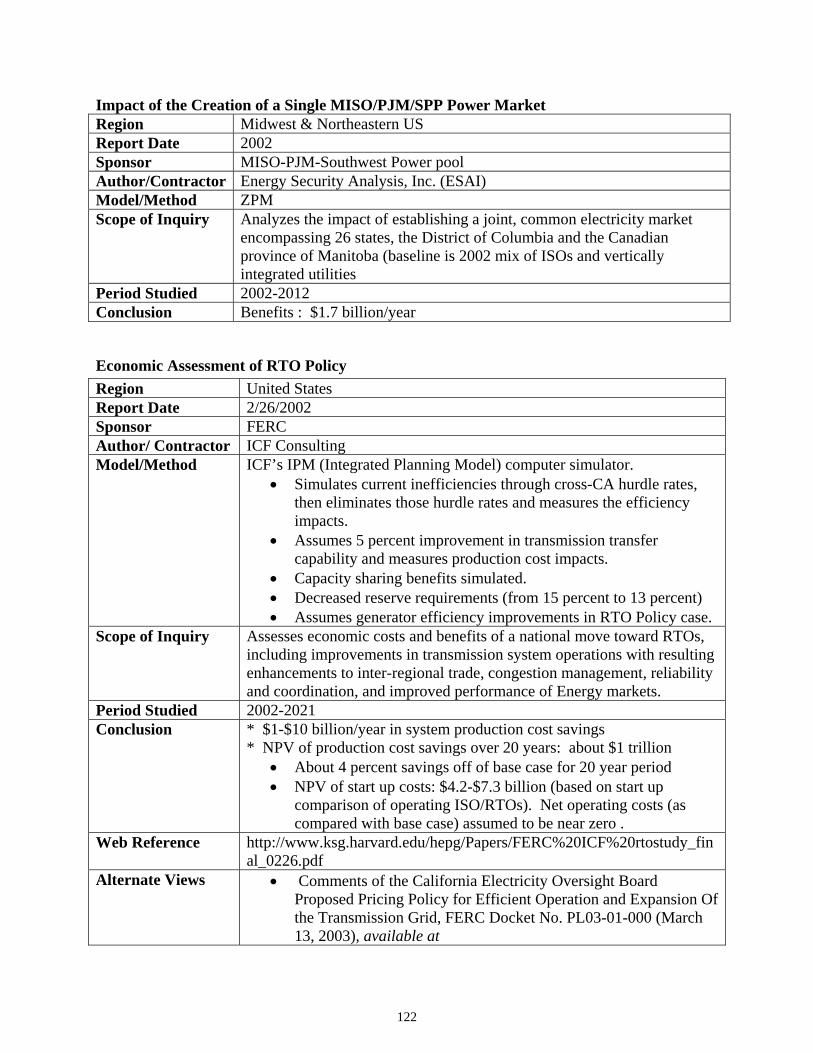
Impact of the Creation of a Single MISO/PJM/SPP Power Market Region Midwest & Northeastern US Report Date 2002 Sponsor MISO-PJM-Southwest Power pool Author/Contractor Energy Security Analysis, Inc. (ESAI) Model/Method ZPM Scope of Inquiry Analyzes the impact of establishing a joint, common electricity market
encompassing 26 states, the District of Columbia and the Canadian province of Manitoba (baseline is 2002 mix of ISOs and vertically integrated utilities
Period Studied 2002-2012 Conclusion Benefits : $1.7 billion/year
Economic Assessment of RTO Policy Region United States Report Date 2/26/2002 Sponsor FERC Author/ Contractor ICF Consulting Model/Method ICF’s IPM (Integrated Planning Model) computer simulator.
• Simulates current inefficiencies through cross-CA hurdle rates, then eliminates those hurdle rates and measures the efficiency impacts.
• Assumes 5 percent improvement in transmission transfer capability and measures production cost impacts.
• Capacity sharing benefits simulated. • Decreased reserve requirements (from 15 percent to 13 percent) • Assumes generator efficiency improvements in RTO Policy case.
Scope of Inquiry Assesses economic costs and benefits of a national move toward RTOs, including improvements in transmission system operations with resulting enhancements to inter-regional trade, congestion management, reliability and coordination, and improved performance of Energy markets.
Period Studied 2002-2021 Conclusion * $1-$10 billion/year in system production cost savings
* NPV of production cost savings over 20 years: about $1 trillion • About 4 percent savings off of base case for 20 year period • NPV of start up costs: $4.2-$7.3 billion (based on start up
comparison of operating ISO/RTOs). Net operating costs (as compared with base case) assumed to be near zero .
Web Reference http://www.ksg.harvard.edu/hepg/Papers/FERC%20ICF%20rtostudy_final_0226.pdf
Alternate Views • Comments of the California Electricity Oversight Board Proposed Pricing Policy for Efficient Operation and Expansion Of the Transmission Grid, FERC Docket No. PL03-01-000 (March 13, 2003), available at
122

http://www.eob.ca.gov/attachments/PL03-1-000Comments.doc • Comments of the New England Conference of Public Utilities
Commissioners on Electricity Market Design and Structure, FERC Docket No. RM01-12-000.
• Comment of the Staff of the Bureaus of Economics and Competition and the Office of the General Counsel of the Federal Trade Commission on Electricity Market Design and Structure, FERC Docket No. RM01-12-000, http://www.ftc.gov/be/v020014.pdf
123

STUDIES OF BENEFITS IN THE MIDWEST An RPM Case Study: Higher Costs for Consumers, Windfall Profits for Exelon Region PJM / Northern Illinois Report Date October 18, 2005 Sponsor Illinois Citizens utility Board Author/Contractor Synapse Energy Economics / Ezra Hausman, Paul Peterson, David
White, and Bruce Biewald Model/Method Comparison of baseline capacity revenues (derived from historical
market data) with proposed RPM PJM price Scope of Inquiry Determine potential wealth transfer effects of proposed Reliability
Pricing Model (RPM) by examining capacity revenues that might accrue to Exelon’s Nuclear facilities in Northern Illinois if RPM is implemented.
Period Studied June 2004 – June 2005 Conclusion At the target RPM price, Exelon’s nuclear plants in northern Illinois
stand to gain almost $390 million in additional capacity revenues, compared to the 2004 capacity market price, at ratepayers’ expense. At the maximum RPM price, these plants would receive a $1.2 billion increase in capacity revenues. At PJM’s target price, RPM would amount to a rate increase for PJM ratepayers as a whole of over $5 billion every year, paid mostly to existing base load generation.
Web Reference http://www.synapse-energy.com/Downloads/SynapseReport.2005-10.IL-CUB.RPM-Study--Higher-Costs-Windfall-Profits-for-Exelon.04-20.pdf
The Benefits and Costs of Wisconsin Utilities Participating in Midwest ISO Energy Markets Region Wisconsin Report Date March 26, 2004 Sponsor MISO Author/Contractor Science Applications International Corporation Model/Method Production Cost/ Power Flow Modeling: PROMOD IV Scope of Inquiry Evaluates proposed financial transmission right allocations and overall
impact of market participation on Wisconsin consumers. Period Studied 2005 Calendar Year Conclusion Wisconsin and Michigan Upper Peninsula customers to save $51 million
annually in wholesale power costs, net of costs of participating in markets. Web Reference http://www.midwestmarket.org/publish/Document/573257_ffe0fcee0f_-
7f570a531528/_.pdf?action=download&_property=Attachment Alternate Views See comments of Wisconsin Load Serving Entities to Draft EPAct 2005
Section 1815 Report on Competition – FERC Docket AD05-17 – 6/26/06
124
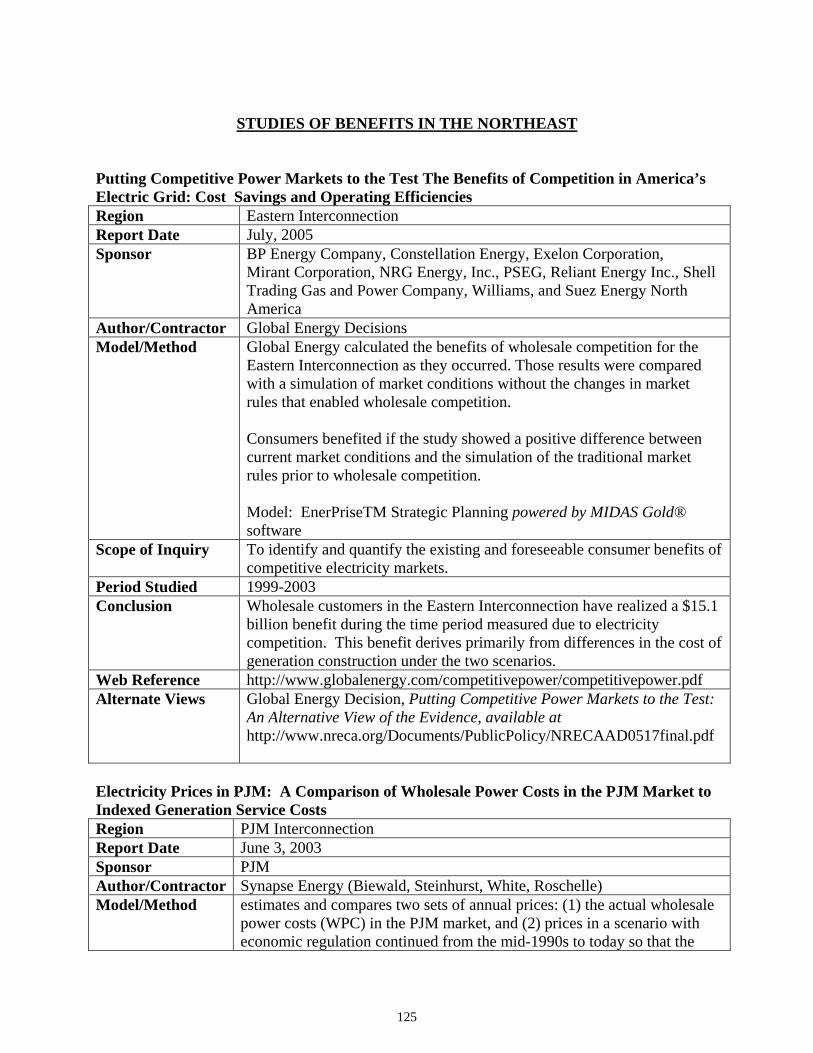
STUDIES OF BENEFITS IN THE NORTHEAST
Putting Competitive Power Markets to the Test The Benefits of Competition in America’s Electric Grid: Cost Savings and Operating Efficiencies Region Eastern Interconnection Report Date July, 2005 Sponsor BP Energy Company, Constellation Energy, Exelon Corporation,
Mirant Corporation, NRG Energy, Inc., PSEG, Reliant Energy Inc., Shell Trading Gas and Power Company, Williams, and Suez Energy North America
Author/Contractor Global Energy Decisions Model/Method Global Energy calculated the benefits of wholesale competition for the
Eastern Interconnection as they occurred. Those results were compared with a simulation of market conditions without the changes in market rules that enabled wholesale competition. Consumers benefited if the study showed a positive difference between current market conditions and the simulation of the traditional market rules prior to wholesale competition. Model: EnerPriseTM Strategic Planning powered by MIDAS Gold® software
Scope of Inquiry To identify and quantify the existing and foreseeable consumer benefits of competitive electricity markets.
Period Studied 1999-2003 Conclusion Wholesale customers in the Eastern Interconnection have realized a $15.1
billion benefit during the time period measured due to electricity competition. This benefit derives primarily from differences in the cost of generation construction under the two scenarios.
Web Reference http://www.globalenergy.com/competitivepower/competitivepower.pdf Alternate Views Global Energy Decision, Putting Competitive Power Markets to the Test:
An Alternative View of the Evidence, available at http://www.nreca.org/Documents/PublicPolicy/NRECAAD0517final.pdf
Electricity Prices in PJM: A Comparison of Wholesale Power Costs in the PJM Market to Indexed Generation Service Costs Region PJM Interconnection Report Date June 3, 2003 Sponsor PJM Author/Contractor Synapse Energy (Biewald, Steinhurst, White, Roschelle) Model/Method estimates and compares two sets of annual prices: (1) the actual wholesale
power costs (WPC) in the PJM market, and (2) prices in a scenario with economic regulation continued from the mid-1990s to today so that the
125

generation service costs (GSC) are the unbundled generation portion of the pre-restructuring cost-of-service rates
Scope of Inquiry To illuminate the effect of restructuring on prices in the PJM interconnection.
Period Studied 1999-2003 Conclusion while PJM deregulated costs fluctuate year-to-year, on average, the
wholesale power costs over the five year period 1999 to 2004 have been lower than the indexed generation service costs.
Web Reference http://www.pjm.com/documents/downloads/reports/synapse-report-pjm-electricity-prices.pdf
Erecting Sandcastles From Numbers: The CAEM Study of Restructuring Electricity Markets Region PJM Report Date Dec. 3, 2003 Sponsor NRECA Author/Contractor Christiansen Associates (Moray, Kirsch, Braithwait, Eakin) Model/Method Analysis of CAEM study assumptions/ inputs Scope of Inquiry To review and critique the Center for Advancement of Energy Markets’
(CAEM) study entitled Estimating the Benefits of Restructuring Electricity Markets: An Application to the PJM Region (Sept. 22, 2003) (hereinafter CAEM Study).
Period Studied 1997-2002 Conclusion The CAEM Study’s quantitative results fail to demonstrate any
relationship between these price changes and the economic effects of restructuring.
Web Reference http://www.ksg.harvard.edu/hepg/Papers/Christensen.crit.restruct.mkts.in.pjm.03-Dec.03.pdf
Alternate Views See below: Estimating the Benefits of Restructuring Electricity Markets: An Application to the PJM Region, available at http://www.caem.org/website/pdf/PJM.pdf
126
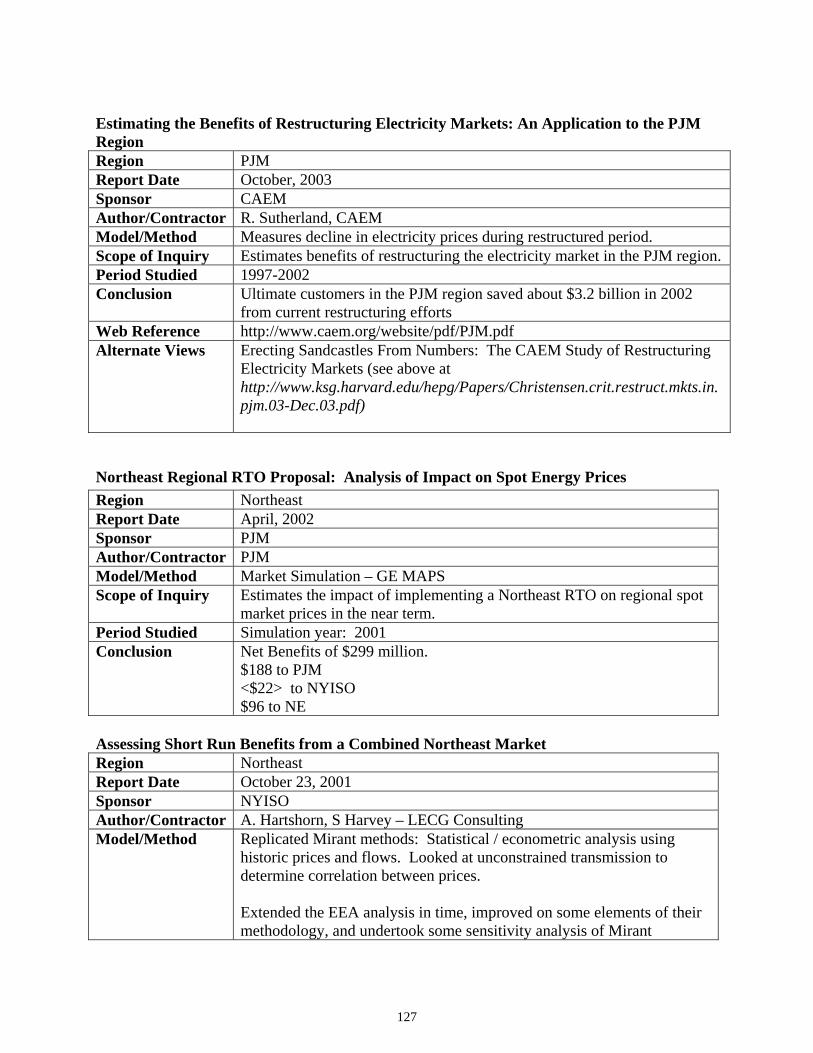
Estimating the Benefits of Restructuring Electricity Markets: An Application to the PJM Region Region PJM Report Date October, 2003 Sponsor CAEM Author/Contractor R. Sutherland, CAEM Model/Method Measures decline in electricity prices during restructured period. Scope of Inquiry Estimates benefits of restructuring the electricity market in the PJM region. Period Studied 1997-2002 Conclusion Ultimate customers in the PJM region saved about $3.2 billion in 2002
from current restructuring efforts Web Reference http://www.caem.org/website/pdf/PJM.pdf Alternate Views Erecting Sandcastles From Numbers: The CAEM Study of Restructuring
Electricity Markets (see above at http://www.ksg.harvard.edu/hepg/Papers/Christensen.crit.restruct.mkts.in.pjm.03-Dec.03.pdf)
Northeast Regional RTO Proposal: Analysis of Impact on Spot Energy Prices Region Northeast Report Date April, 2002 Sponsor PJM Author/Contractor PJM Model/Method Market Simulation – GE MAPS Scope of Inquiry Estimates the impact of implementing a Northeast RTO on regional spot
market prices in the near term. Period Studied Simulation year: 2001 Conclusion Net Benefits of $299 million.
$188 to PJM <$22> to NYISO $96 to NE
Assessing Short Run Benefits from a Combined Northeast Market Region Northeast Report Date October 23, 2001 Sponsor NYISO Author/Contractor A. Hartshorn, S Harvey – LECG Consulting Model/Method Replicated Mirant methods: Statistical / econometric analysis using
historic prices and flows. Looked at unconstrained transmission to determine correlation between prices. Extended the EEA analysis in time, improved on some elements of their methodology, and undertook some sensitivity analysis of Mirant
127
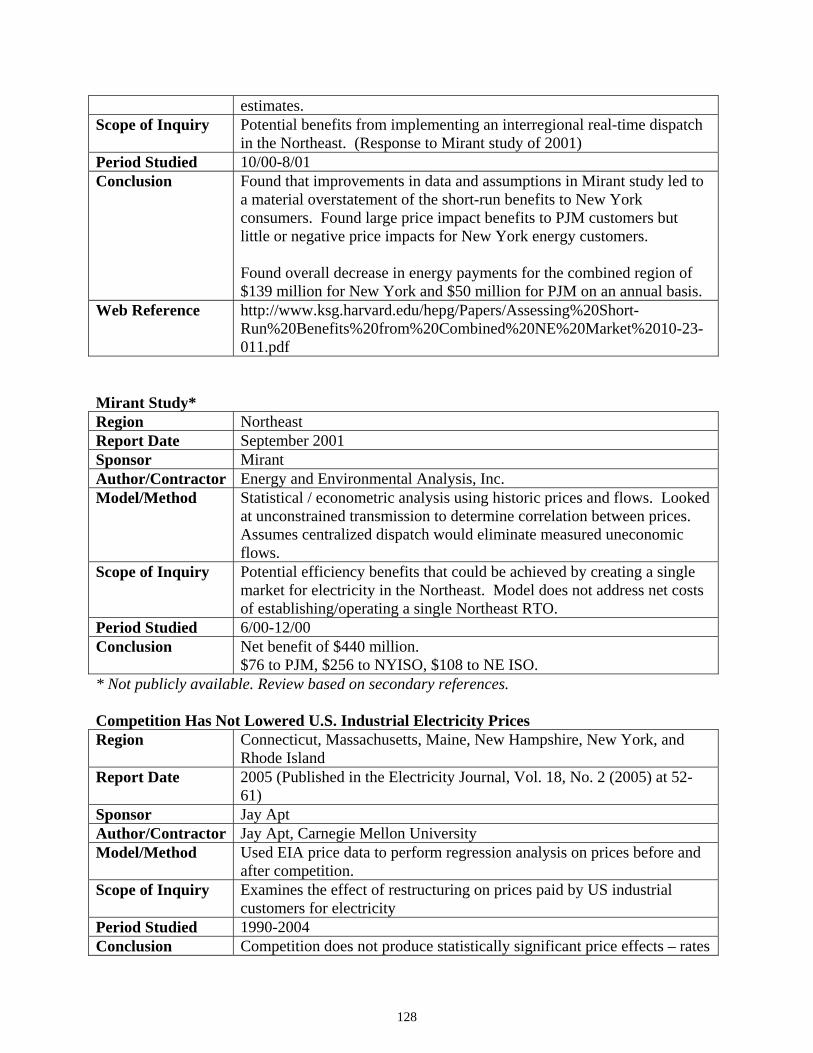
estimates. Scope of Inquiry Potential benefits from implementing an interregional real-time dispatch
in the Northeast. (Response to Mirant study of 2001) Period Studied 10/00-8/01 Conclusion Found that improvements in data and assumptions in Mirant study led to
a material overstatement of the short-run benefits to New York consumers. Found large price impact benefits to PJM customers but little or negative price impacts for New York energy customers. Found overall decrease in energy payments for the combined region of $139 million for New York and $50 million for PJM on an annual basis.
Web Reference http://www.ksg.harvard.edu/hepg/Papers/Assessing%20Short-Run%20Benefits%20from%20Combined%20NE%20Market%2010-23-011.pdf
Mirant Study* Region Northeast Report Date September 2001 Sponsor Mirant Author/Contractor Energy and Environmental Analysis, Inc. Model/Method Statistical / econometric analysis using historic prices and flows. Looked
at unconstrained transmission to determine correlation between prices. Assumes centralized dispatch would eliminate measured uneconomic flows.
Scope of Inquiry Potential efficiency benefits that could be achieved by creating a single market for electricity in the Northeast. Model does not address net costs of establishing/operating a single Northeast RTO.
Period Studied 6/00-12/00 Conclusion Net benefit of $440 million.
$76 to PJM, $256 to NYISO, $108 to NE ISO. * Not publicly available. Review based on secondary references. Competition Has Not Lowered U.S. Industrial Electricity Prices Region Connecticut, Massachusetts, Maine, New Hampshire, New York, and
Rhode Island Report Date 2005 (Published in the Electricity Journal, Vol. 18, No. 2 (2005) at 52-
61) Sponsor Jay Apt Author/Contractor Jay Apt, Carnegie Mellon University Model/Method Used EIA price data to perform regression analysis on prices before and
after competition. Scope of Inquiry Examines the effect of restructuring on prices paid by US industrial
customers for electricity Period Studied 1990-2004 Conclusion Competition does not produce statistically significant price effects – rates
128
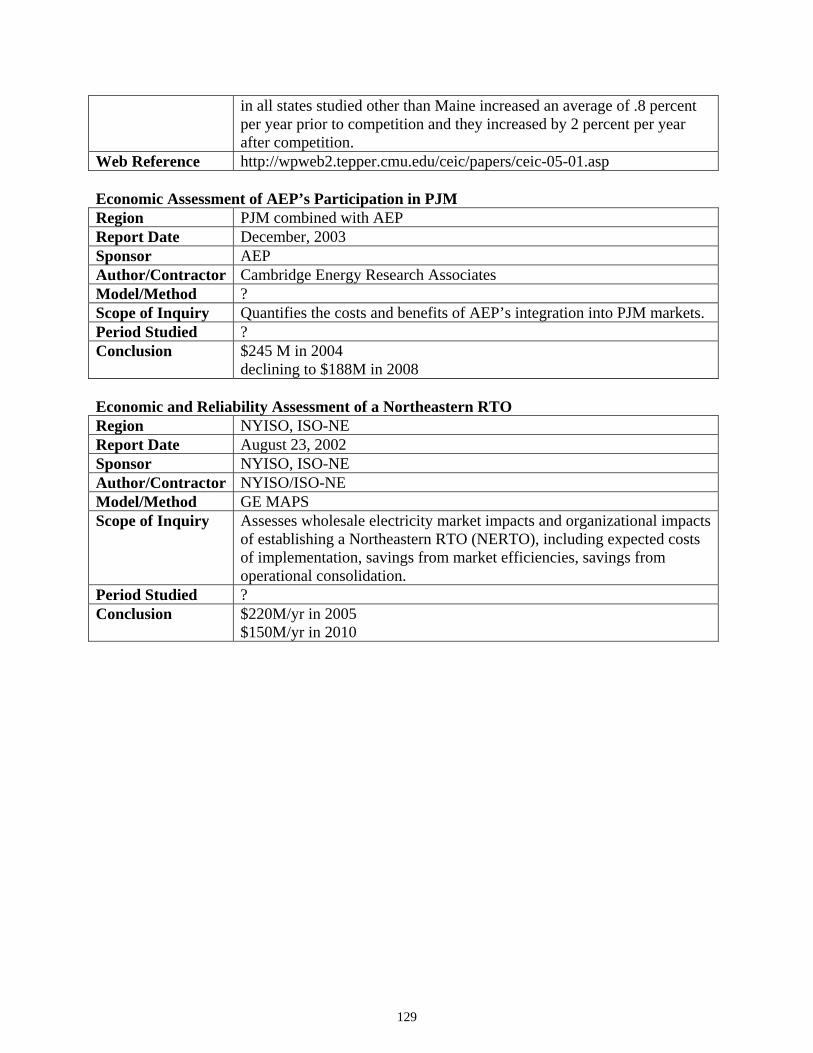
in all states studied other than Maine increased an average of .8 percent per year prior to competition and they increased by 2 percent per year after competition.
Web Reference http://wpweb2.tepper.cmu.edu/ceic/papers/ceic-05-01.asp Economic Assessment of AEP’s Participation in PJM Region PJM combined with AEP Report Date December, 2003 Sponsor AEP Author/Contractor Cambridge Energy Research Associates Model/Method ? Scope of Inquiry Quantifies the costs and benefits of AEP’s integration into PJM markets. Period Studied ? Conclusion $245 M in 2004
declining to $188M in 2008 Economic and Reliability Assessment of a Northeastern RTO Region NYISO, ISO-NE Report Date August 23, 2002 Sponsor NYISO, ISO-NE Author/Contractor NYISO/ISO-NE Model/Method GE MAPS Scope of Inquiry Assesses wholesale electricity market impacts and organizational impacts
of establishing a Northeastern RTO (NERTO), including expected costs of implementation, savings from market efficiencies, savings from operational consolidation.
Period Studied ? Conclusion $220M/yr in 2005
$150M/yr in 2010
129

STUDIES OF BENEFITS IN THE NORTHWEST Bonneville Power Administration Grid West Benefit Assessment for Decision Point 2 Region Northwest US Report Date August 4, 2005 Sponsor Bonneville Power Administration Author/Contractor
Internal Bonneville Power Administration staff report
Model/Method
Partially based on modeling conducted by Grid West (see “Estimated Benefits of Grid West”) – Power World model used to derive benefits of control area consolidation and economic redispatch. Other analytical methods used to determine value of common regulation, reliability improvements, economic reserve markets, increased transmission usage, (measured in Gridview model), etc.
Scope of Inquiry
Potential benefits of adopting proposed Grid West design as compared with status quo.
Period Studied
Various – primarily examined 1 year historical period.
Conclusion Reliability Benefits: $27 - $62 million annually Increased Transmission Capacity: $9 to $15 million annually Regulating Reserve benefits: $5-$8 million annually Redispatch Efficiencies: $41-$56 million annually Contingency Reserve Market Efficiencies: $20 to $30 million/year De-pancaking of transmission rate efficiencies: $4-$10 million TOTAL: $106 to $108 million
Web Reference
http://www.bpa.gov/corporate/business/restructuring/Docs/2005/benefit%20assessment/BPA_Grid_West_Benefit_Assessment.pdf
The Estimated Benefits of Grid West Region Pacific Northwest Report Date July, 2005 Sponsor Grid West Regional Representatives Group Author/Contractor Grid West Risk Reward Workgroup Model/Method PowerWorld, Gridview, miscellaneous spreadsheet analyses, surveys Scope of Inquiry Estimate the benefits related to Grid West formation Period Studied Various Conclusion Results presented as a menu:
• The capacity cost savings associated with Grid West-managed
contingency reserves range from $20 million to $73 million per year.
• The estimated capacity cost savings associated with Grid West reducing the amount of regulating reserves range from $5 million to
130

$26 million per year • The estimated production cost savings associated with Grid West-
managed real-time energy balancing redispatch range from $41 million to $385 million per year
• The estimated annualized value to the region of avoiding cascading disturbances ranges from $27 million to $83 million per year.
• Avoiding momentary (less than 5 minutes) or sustained events (longer than 5 minutes but shorter than 12 hours) related to non-cascading transmission events has an estimated annualized value to the region ranging from $17 million to $203 million per year
• The estimated increase in production costs from the existing practice of charging multiple or pancaked rates ranges from $4 million to $61 million per year.
• The estimated reduction in production costs from more efficient prescheduled interchange facilitated by the RCS ranges from $18 million to $52 million per year.
• The estimated savings associated with energy conservation, non-wires expansion, and demand-side measures facilitated by Grid West range from $1 million to $61 million per year.
Study of Costs Benefits and Alternatives To Grid West Region Northwestern US Report Date October 15, 2004 Sponsor Snohomish PUD Author/Contractor Henwood Energy & Margot Lutzenhiser of the Public Power Council Model/Method Benefits: MarketSym used to estimate the short term dispatch benefits
associated with rate de-pancaking and more liquid operating reserve markets Costs: Applies apply the average cost/MWh of operating PJM, NYISO, ISO NE, CAISO and ERCOT to Grid West’s projected annual demand.
Scope of Inquiry Study the costs, benefits and alternatives to forming Grid West Period Studied 2004 Conclusion Gross annual benefits to the region of $78 million
Grid West Annual costs of $200 million. Net Benefits of <122 million>
Web Reference http://www.snopud.com/content/external/documents/gridwest/henwood_gridwestfinal.pdf
RTO West Benefit/Cost Study Region Northwestern US Report Date March 11, 2002 Sponsor RTO West Author/Contractor Tabors Caramanis and Associates
131

Model/Method GE MAPS Scope of Inquiry This study looked at the impacts that removing pancaked transmission
rates and sharing reserves would have on the cost of generation in the Northwest.
Period Studied 2004 Conclusion • The net benefits of eliminating transmission rate pancakes and
sharing reserves would be $305 million/year in the RTO West footprint, and $410 million for all of RTO West.
• 40 percent of this benefit can be attributed to the elimination of rate pancaking, 60 percent to reserves sharing.
RTO West Potential Benefits and Costs Region Northwest Report Date October 23, 2000 Sponsor RTO West Author/Contractor RTO West Benefits/Cost Team Model/Method Aurora for production cost modeling, spreadsheet analyses for others Scope of Inquiry Identify and quantify benefits and costs to the regional electric power
system that would occur as a result of implementing RTO West Period Studied Various Conclusion • Inconclusive production cost savings
• Regulating reserve savings of $28 million annually over the RTO footprint.
• Reliability benefits of anywhere from $33 million to $328 million annually
• RTO Annual Costs of $63-$76 million • Misc. qualitative benefits
132
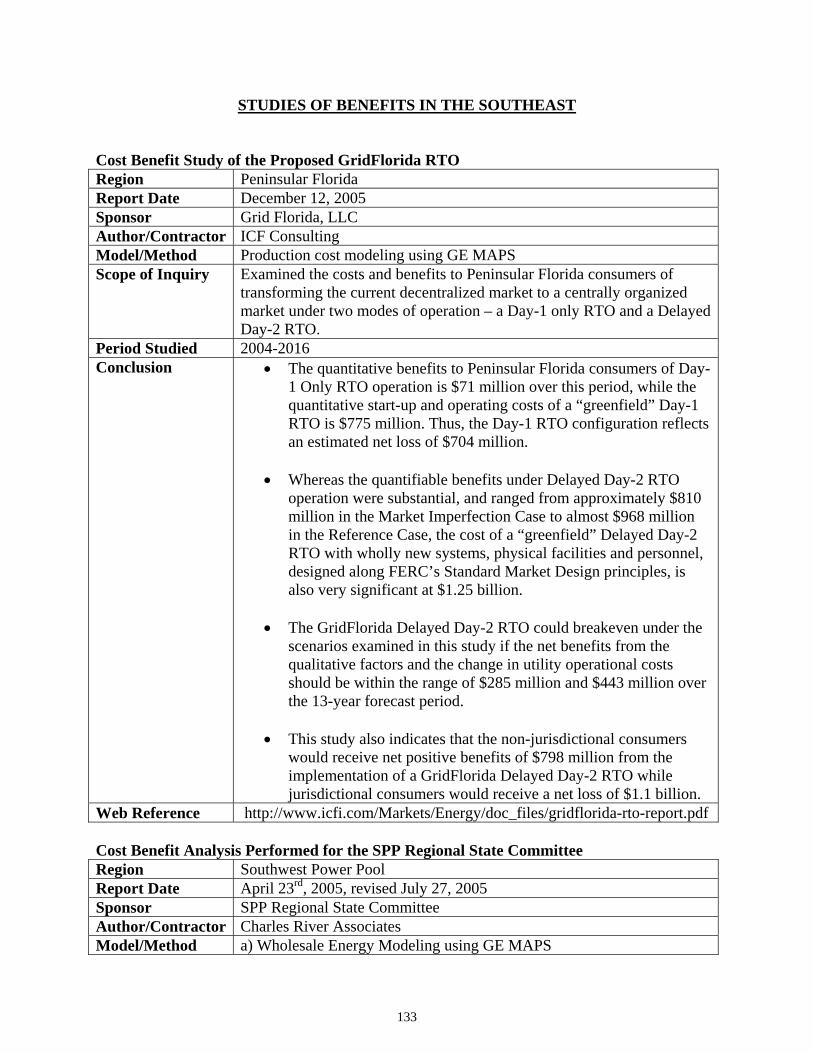
STUDIES OF BENEFITS IN THE SOUTHEAST Cost Benefit Study of the Proposed GridFlorida RTO Region Peninsular Florida Report Date December 12, 2005 Sponsor Grid Florida, LLC Author/Contractor ICF Consulting Model/Method Production cost modeling using GE MAPS Scope of Inquiry Examined the costs and benefits to Peninsular Florida consumers of
transforming the current decentralized market to a centrally organized market under two modes of operation – a Day-1 only RTO and a Delayed Day-2 RTO.
Period Studied 2004-2016 Conclusion • The quantitative benefits to Peninsular Florida consumers of Day-
1 Only RTO operation is $71 million over this period, while the quantitative start-up and operating costs of a “greenfield” Day-1 RTO is $775 million. Thus, the Day-1 RTO configuration reflects an estimated net loss of $704 million.
• Whereas the quantifiable benefits under Delayed Day-2 RTO
operation were substantial, and ranged from approximately $810 million in the Market Imperfection Case to almost $968 million in the Reference Case, the cost of a “greenfield” Delayed Day-2 RTO with wholly new systems, physical facilities and personnel, designed along FERC’s Standard Market Design principles, is also very significant at $1.25 billion.
• The GridFlorida Delayed Day-2 RTO could breakeven under the
scenarios examined in this study if the net benefits from the qualitative factors and the change in utility operational costs should be within the range of $285 million and $443 million over the 13-year forecast period.
• This study also indicates that the non-jurisdictional consumers
would receive net positive benefits of $798 million from the implementation of a GridFlorida Delayed Day-2 RTO while jurisdictional consumers would receive a net loss of $1.1 billion.
Web Reference http://www.icfi.com/Markets/Energy/doc_files/gridflorida-rto-report.pdf Cost Benefit Analysis Performed for the SPP Regional State Committee Region Southwest Power Pool Report Date April 23rd, 2005, revised July 27, 2005 Sponsor SPP Regional State Committee Author/Contractor Charles River Associates Model/Method a) Wholesale Energy Modeling using GE MAPS
133
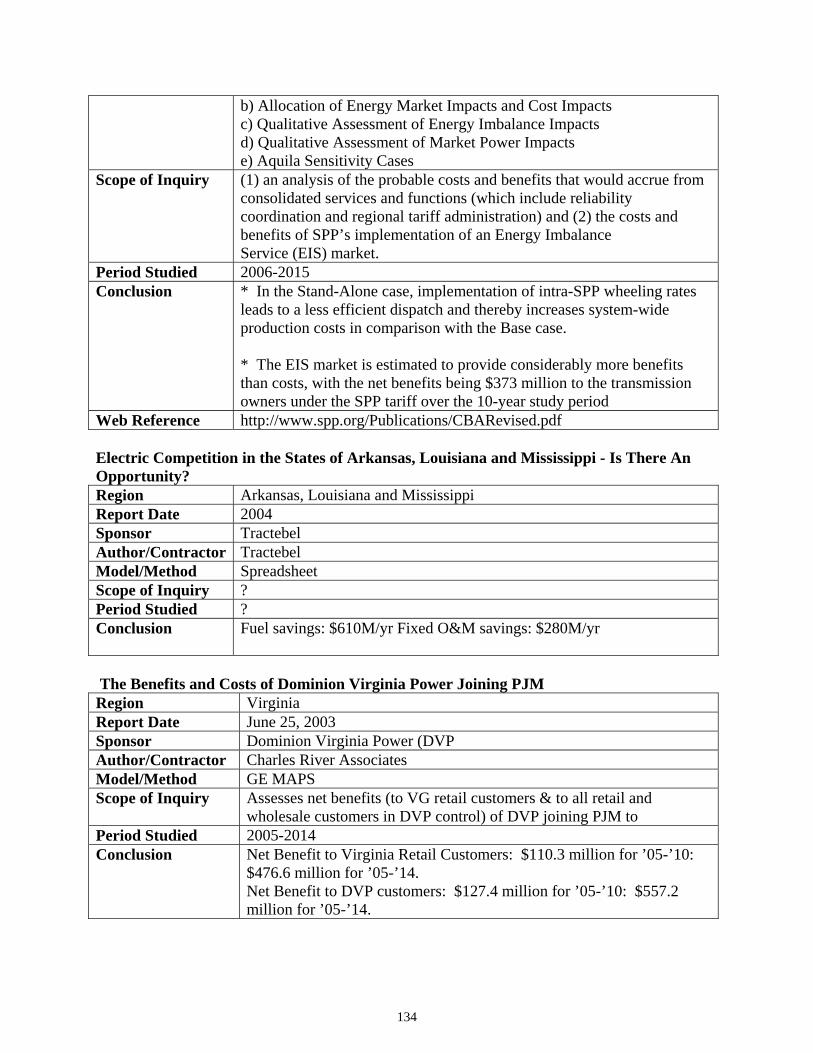
b) Allocation of Energy Market Impacts and Cost Impacts c) Qualitative Assessment of Energy Imbalance Impacts d) Qualitative Assessment of Market Power Impacts e) Aquila Sensitivity Cases
Scope of Inquiry (1) an analysis of the probable costs and benefits that would accrue from consolidated services and functions (which include reliability coordination and regional tariff administration) and (2) the costs and benefits of SPP’s implementation of an Energy Imbalance Service (EIS) market.
Period Studied 2006-2015 Conclusion * In the Stand-Alone case, implementation of intra-SPP wheeling rates
leads to a less efficient dispatch and thereby increases system-wide production costs in comparison with the Base case. * The EIS market is estimated to provide considerably more benefits than costs, with the net benefits being $373 million to the transmission owners under the SPP tariff over the 10-year study period
Web Reference http://www.spp.org/Publications/CBARevised.pdf Electric Competition in the States of Arkansas, Louisiana and Mississippi - Is There An Opportunity? Region Arkansas, Louisiana and Mississippi Report Date 2004 Sponsor Tractebel Author/Contractor Tractebel Model/Method Spreadsheet Scope of Inquiry ? Period Studied ? Conclusion Fuel savings: $610M/yr Fixed O&M savings: $280M/yr
The Benefits and Costs of Dominion Virginia Power Joining PJM Region Virginia Report Date June 25, 2003 Sponsor Dominion Virginia Power (DVP Author/Contractor Charles River Associates Model/Method GE MAPS Scope of Inquiry Assesses net benefits (to VG retail customers & to all retail and
wholesale customers in DVP control) of DVP joining PJM to Period Studied 2005-2014 Conclusion Net Benefit to Virginia Retail Customers: $110.3 million for ’05-’10:
$476.6 million for ’05-’14. Net Benefit to DVP customers: $127.4 million for ’05-’10: $557.2 million for ’05-’14.
134
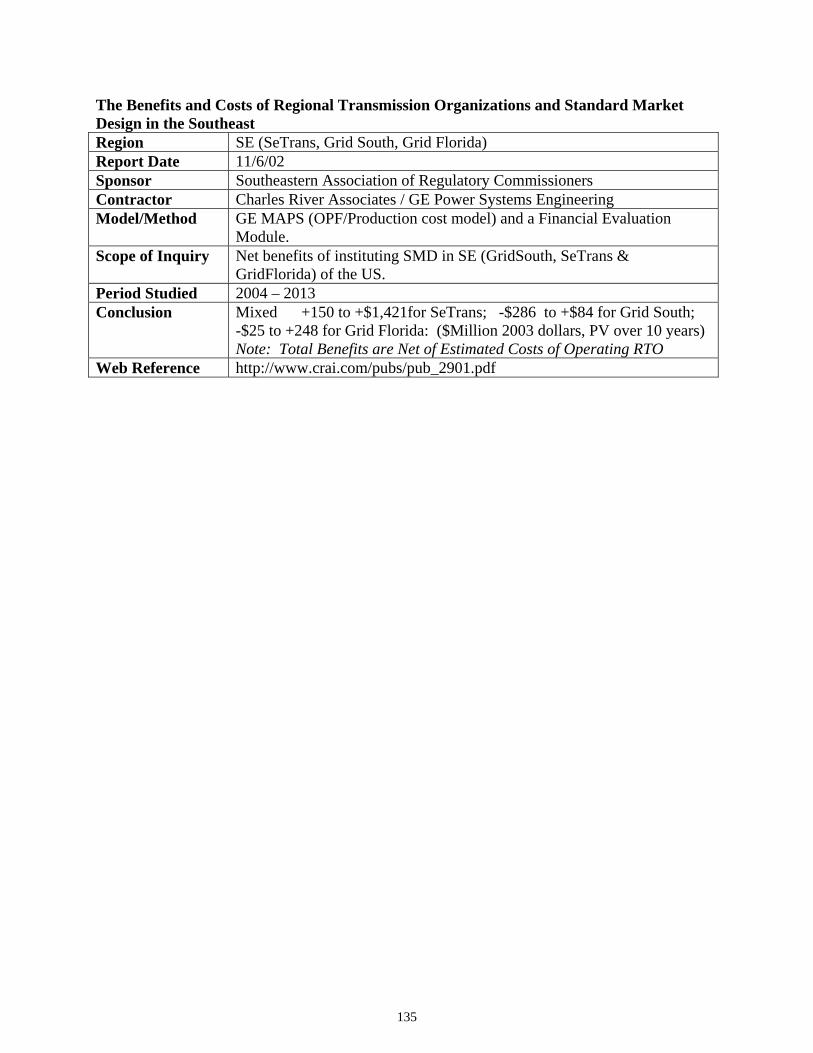
The Benefits and Costs of Regional Transmission Organizations and Standard Market Design in the Southeast Region SE (SeTrans, Grid South, Grid Florida) Report Date 11/6/02 Sponsor Southeastern Association of Regulatory Commissioners Contractor Charles River Associates / GE Power Systems Engineering Model/Method GE MAPS (OPF/Production cost model) and a Financial Evaluation
Module. Scope of Inquiry Net benefits of instituting SMD in SE (GridSouth, SeTrans &
GridFlorida) of the US. Period Studied 2004 – 2013 Conclusion Mixed +150 to +$1,421for SeTrans; -$286 to +$84 for Grid South;
-$25 to +248 for Grid Florida: ($Million 2003 dollars, PV over 10 years) Note: Total Benefits are Net of Estimated Costs of Operating RTO
Web Reference http://www.crai.com/pubs/pub_2901.pdf
135
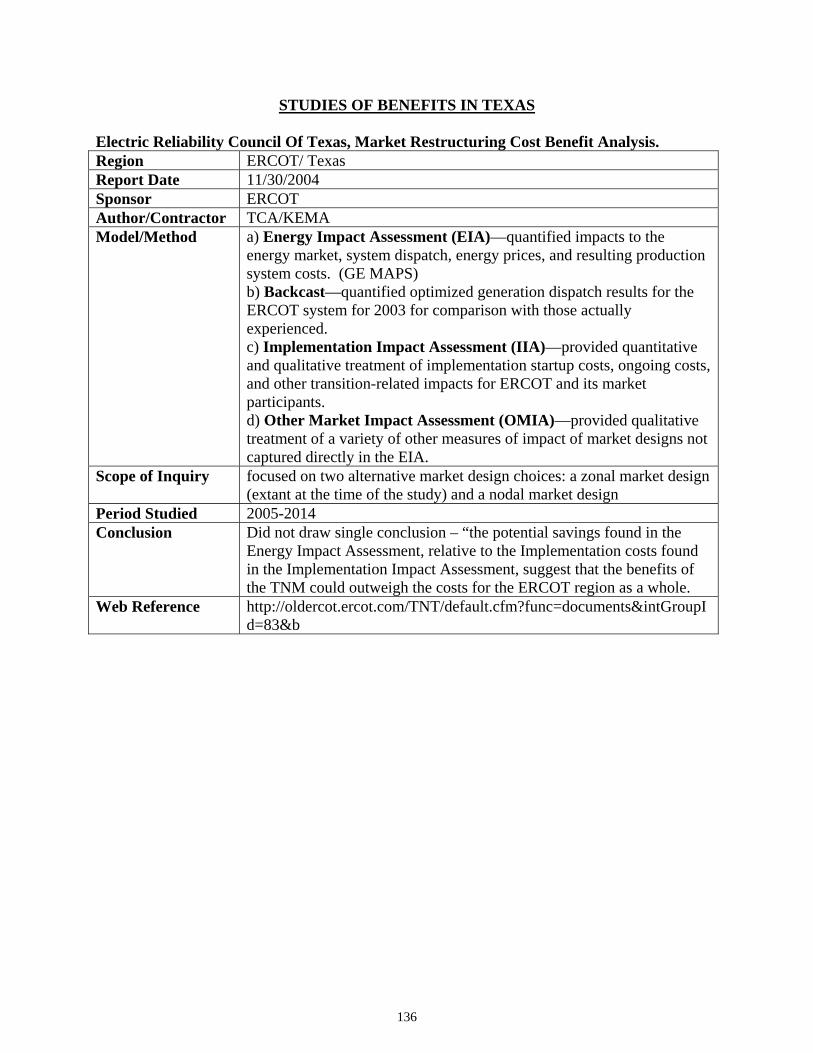
STUDIES OF BENEFITS IN TEXAS Electric Reliability Council Of Texas, Market Restructuring Cost Benefit Analysis. Region ERCOT/ Texas Report Date 11/30/2004 Sponsor ERCOT Author/Contractor TCA/KEMA Model/Method a) Energy Impact Assessment (EIA)—quantified impacts to the
energy market, system dispatch, energy prices, and resulting production system costs. (GE MAPS) b) Backcast—quantified optimized generation dispatch results for the ERCOT system for 2003 for comparison with those actually experienced. c) Implementation Impact Assessment (IIA)—provided quantitative and qualitative treatment of implementation startup costs, ongoing costs, and other transition-related impacts for ERCOT and its market participants. d) Other Market Impact Assessment (OMIA)—provided qualitative treatment of a variety of other measures of impact of market designs not captured directly in the EIA.
Scope of Inquiry focused on two alternative market design choices: a zonal market design (extant at the time of the study) and a nodal market design
Period Studied 2005-2014 Conclusion Did not draw single conclusion – “the potential savings found in the
Energy Impact Assessment, relative to the Implementation costs found in the Implementation Impact Assessment, suggest that the benefits of the TNM could outweigh the costs for the ERCOT region as a whole.
Web Reference http://oldercot.ercot.com/TNT/default.cfm?func=documents&intGroupId=83&b
136

APPENDIX D STATE RETAIL COMPETITION PROFILES331
Illinois: Overview of Retail Competition Plan and Market Response Administrator and Start Date: Customer choice in Illinois began in December 1997 with the enactment of the Electric Service Customer Choice and Rate Relief Act of 1997 (HB 362). HB 362 required a phase-in of retail competition, with larger customers able to choose an alternate generation supplier earlier in the transition. Specifically, customers eligible to choose their electric supplier as of October 1, 1999, included industrial and commercial customers with a demand of greater than 4 MW,332 commercial customers with businesses at ten or more sites with an aggregate coincident peak demand of 9.5 MWs or greater, and non-residential customers accounting for one-third of the remaining electricity use of their customer class. All other non-residential customers were allowed to choose a supplier as of December 31, 2000, and all residential customers as of May 1, 2002.333 The mandatory transition period ends January 1, 2007.334
The Illinois Commerce Commission (ICC) oversees the transition to competition in the electric industry. On January 24, 2006, the ICC approved proposals from Commonwealth Edison, the Ameren companies, Central Illinois Public Service, Central Illinois Light Company and Illinois Power, to procure generation (for retail customers who do not switch to an alternative retail supplier) through a joint competitive reverse auction process. In order to reduce price increases after the transition period ends, the utilities have offered to phase in price increases at the end of the transition period for residential customers. Services Open to Competition: Generation and metering services: The ICC promulgated rules that permit non-residential customers to choose a meter service provider other than the distribution utility. The ICC permitted Commonwealth Edison to designate customers with a demand exceeding 3 MW as a competitive customer class.335 No other classes of customers have been declared competitive to date. Competitive services are defined as those services provided under special contract, not provided under tariff, and any tariffed service that the ICC decides is competitive. A service is declared competitive only if it is offered by a provider other than the utility or its affiliate, to a defined customer group or area, at a competitive price, if the utility is likely to or has lost business to the competitor, and if there is adequate transmission system capacity.336
331 Information in this appendix is derived in large part from – and updates information contained in the FTC Retail Competition Report. Because economic circumstances and state laws and regulations change, regulatory authorities in each state and market participants should be consulted for more detailed and up-to-date information on state retail choice programs. 332 Average monthly maximum electrical demand on the electric utility’s system during the 6 months equals the customer’s highest monthly maximum demands in the 12 months ending June 30, 1999. 333 220 ILL. COMP. STAT. 5/16-104 (West 2001). 334 S.B. 2081 (Ill. 2002) (extending the transition period from January 1, 2005, to January 1, 2007). 335 Commonwealth Edison Company, Illinois Commerce Commission, Docket No. 02-0479 (March 28, 2003), available at http://eweb.icc.state.il.us/e-docket/reports/view_file.asp?intIdfile=83392&strc=bd. 336 220 ILL. COMP. STAT. 5/16-113.
137

Consumer Options: Consumers have two options for service:
(1) They may either remain with the utility as a bundled customer (i.e., receiving generation, transmission and distribution services); or (2) They may choose to become a delivery services customer (i.e., they only take distribution and transmission services from the utility). Delivery services customers may purchase generation services from another electric utility, from a competitive supplier, or from their own utility using the power purchase option (PPO).337
The PPO is a transitional option that is provided by distribution utilities as long as they are recovering stranded costs from customers (see Recovery of Stranded Costs/Transition Costs). Under PPO service, a non-residential delivery services customer (such as an industrial customer) can purchase electric power from the utility at a price that reflects wholesale costs. These customers may then assign the power purchased under the PPO to an alternative supplier. Under this option, the suppliers to whom customers have assigned PPO rights are, in effect, purchasing electricity from the utility and selling it to their customers. Alternative Suppliers Licensed to Provide Service: All suppliers wishing to provide competitive supply service must have a certificate of service authority. In order to receive certification, a supplier must show technical, financial, and managerial capability.338 A competitive supplier is required to maintain a license or permit bond in the amount of $30,000 if the supplier intends to serve only non-residential customers with maximum demand greater than 1 MW; $150,000 if the supplier intends to serve non-residential customers with annual electric consumption greater than 15,000 kWh; or $300,000 if the supplier wishes to be certified to serve all eligible retail customers. In general, retail competition is much more active in the Commonwealth Edison territory than elsewhere in the state. In 2005, the number of active suppliers in each distribution utility’s territory ranged from zero for MidAmerican, to nine for ComEd.339 Over the 2000 to 2005 period, the number of suppliers increased in the AmerenCIPS service territory from 3 to 4. An alternative supplier entered the AmerenCILCO area for the first time in 2003 and the only alternative supplier left the MidAmerican area in 2001. The retailers have focused only on non-residential customers.
337 Id. at 5/16-110. 338 Id. at 5/16-115. 339 Illinois Commerce Commission, Competition in Illinois Retail Electric Markets in 2005, Table 2 (May 2006), available at http://www.icc.illinois.gov/docs/en/060524garpt16120b.pdf.
138
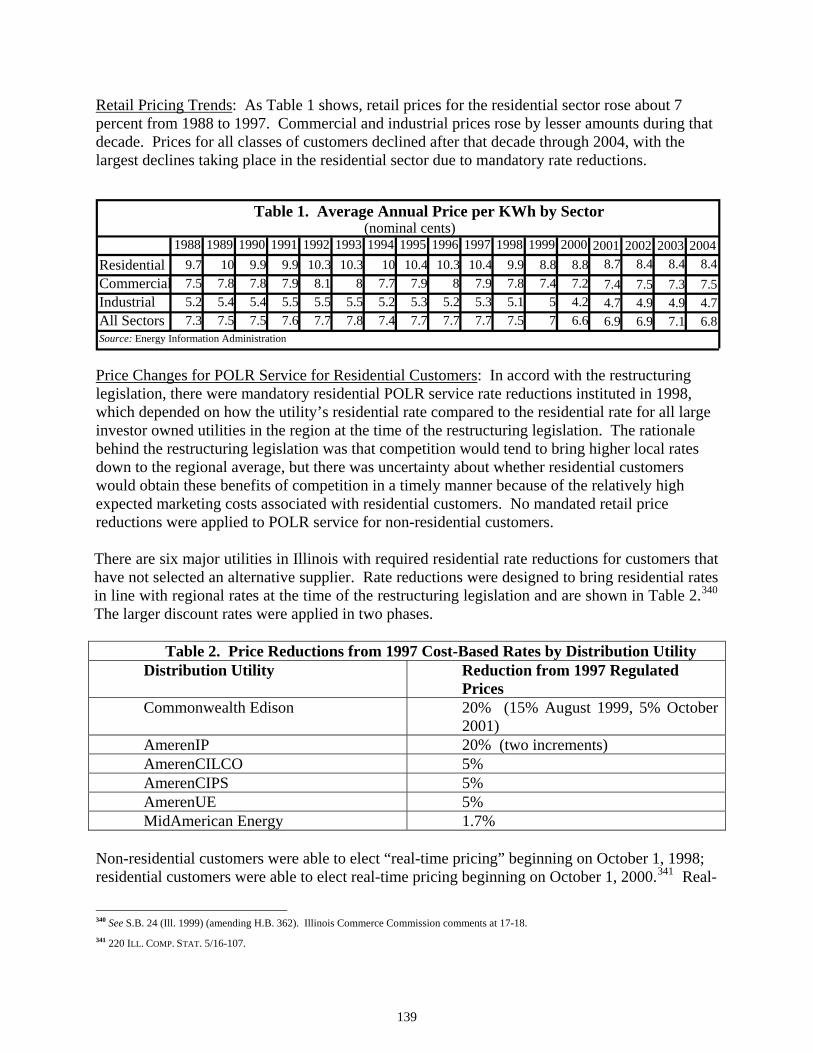
Retail Pricing Trends: As Table 1 shows, retail prices for the residential sector rose about 7 percent from 1988 to 1997. Commercial and industrial prices rose by lesser amounts during that decade. Prices for all classes of customers declined after that decade through 2004, with the largest declines taking place in the residential sector due to mandatory rate reductions.
1988 1989 1990 1991 1992 1993 1994 1995 1996 1997 1998 1999 2000 2001 2002 2003 2004Residential 9.7 10 9.9 9.9 10.3 10.3 10 10.4 10.3 10.4 9.9 8.8 8.8 8.7 8.4 8.4 8.4Commercial 7.5 7.8 7.8 7.9 8.1 8 7.7 7.9 8 7.9 7.8 7.4 7.2 7.4 7.5 7.3 7.5Industrial 5.2 5.4 5.4 5.5 5.5 5.5 5.2 5.3 5.2 5.3 5.1 5 4.2 4.7 4.9 4.9 4.7All Sectors 7.3 7.5 7.5 7.6 7.7 7.8 7.4 7.7 7.7 7.7 7.5 7 6.6 6.9 6.9 7.1 6.8
Table 1. Average Annual Price per KWh by Sector (nominal cents)
Source: Energy Information Administration
Price Changes for POLR Service for Residential Customers: In accord with the restructuring legislation, there were mandatory residential POLR service rate reductions instituted in 1998, which depended on how the utility’s residential rate compared to the residential rate for all large investor owned utilities in the region at the time of the restructuring legislation. The rationale behind the restructuring legislation was that competition would tend to bring higher local rates down to the regional average, but there was uncertainty about whether residential customers would obtain these benefits of competition in a timely manner because of the relatively high expected marketing costs associated with residential customers. No mandated retail price reductions were applied to POLR service for non-residential customers. There are six major utilities in Illinois with required residential rate reductions for customers that have not selected an alternative supplier. Rate reductions were designed to bring residential rates in line with regional rates at the time of the restructuring legislation and are shown in Table 2.340 The larger discount rates were applied in two phases.
Table 2. Price Reductions from 1997 Cost-Based Rates by Distribution Utility
Distribution Utility Reduction from 1997 Regulated Prices
Commonwealth Edison 20% (15% August 1999, 5% October 2001)
AmerenIP 20% (two increments) AmerenCILCO 5% AmerenCIPS 5% AmerenUE 5% MidAmerican Energy 1.7%
Non-residential customers were able to elect “real-time pricing” beginning on October 1, 1998; residential customers were able to elect real-time pricing beginning on October 1, 2000.341 Real-
340 See S.B. 24 (Ill. 1999) (amending H.B. 362). Illinois Commerce Commission comments at 17-18. 341 220 ILL. COMP. STAT. 5/16-107.
139
time pricing is defined as pricing which varies hour by hour for non-residential customers, and on a periodic basis during the day for residential customers.342 The largest residential real-time pricing effort is a pilot program involving 1,500 customers in the Commonwealth Edison territory operated by the Community Energy Cooperative.343 Some non-residential customers may also have real-time pricing or other time of use rates, but statistics are unavailable. POLR Service Provider: Utilities must provide traditional, bundled service for those customers who choose not to shop for a competitive supplier.344 The POLR (standard offer) price is the price for bundled service (i.e., service including generation, transmission, and delivery), which was set by the utility’s last rate proceeding, less the amount of any rate reduction required in the restructuring law. This rate is frozen until January 1, 2007. Recovery of Stranded Costs/Transition Costs: Utilities collect stranded costs from both POLR service customers as part of the rates and through a separate charge from retail customers with an alternative supplier.345
Switching Restrictions and Minimum Stay Requirements: Customers purchasing power from an alternate supplier are allowed to return to the utility after paying an administrative fee. A utility may require a returning customer with usage less than 15,000 kWh annually to stay with the utility for two years.346
Switching Activity: The degree to which customers have switched to delivery service from bundled service varies greatly between distribution franchise territories and classes of customers. Table 2 provides the switching statistics for the largest utility franchise areas, separated by customer type, as of November 2005. As Table 3 indicates, the vast majority of switching activity is centered on the Commonwealth Edison distribution territory (which also has the largest load in the state). Lower levels of switching have taken place in the AmerenCILCO and AmerenIP areas, and there has been very little switching outside of these three areas.
342 Id. at 5/16-102. 343 Robert Lieberman (ICC Commissioner), Ruminations on Demand Response – a View from Chicago (Oct. 28, 2005), available at http://www.raabassociates.org/Articles/Lieberman_10.28.05.ppt#299. 344 220 ILL. COMP. STAT. at 5/16-103. 345 Id. at 5/16-108. 346 See 220 ILL. COMP. STAT. 5/16/-103(d).
140

Table 3. Illinois Switching to Alternative Suppliers as of November 30, 2005
% of Customers and (% of Load) Firm and Usage In million kWh Residential Small C&I Large C&I Total AmerenCILCO 461
0.0% (0.0%)
0.0% (0.1%)
2.2% (33.3%)
0.0% (15.4%)
AmerenCIPS 952
0.0% (0.0%)
0.2% (0.8%)
7.1% (4.1%)
0.0% (2.2%)
AmerenIP 1,496
0.0% (0.0%)
0.8% (8.9%)
29.8% (41.7%)
0.1% (23.2%)
AmerenUE 265
0.0% (0.0%)
0.0% (0.0%)
2.5% (0.2%)
0.0% (0.1%)
ComEd 91,508
0.0% (0.0%)
6.0% (36.6%)
73.9% (58.3%)
0.6% (32.8%)
MidAmerican 139
0.0% (0.0%)
0.0% (0.0%)
0.0% (0.0%)
0.0% (0.0%)
Source: Illinois Commerce Commission Table 4 shows the patterns of switching for the 2003 to 2006 period. Residential switching has remained dormant over the whole period while large non-residential customers have switched much of their load to alternative suppliers. Small non-residential customers have been slower in switching to alternative suppliers and the load served declined slightly in 2006, but the share of alternative suppliers continue to be well above the levels in 2003.
Table 4. Illinois Retail Aggregate Customer Migration Statistics, 2003 to January 2006 % of Customers and (% of Load) Served by Alternative Suppliers
2003 2004 January 2005 January 2006 Residential 0.0%
(0.0%) 0.0%
(0.0%) 0.0%
(0.0%) 0.0%
(0.0%) Small C&I 3.8%
(30.2%) 4.4%
(31.5%) 5.7%
(38.4%) 5.9%)
(36.7%) Large C&I 58.6%
(54.6%) 64.1%
(56.6%) 73.0%
(58.3%) 71.9%
(58.7%) Note: The 2003 and 2004 figures are annual aggregates while the 2005 and 2006 figures are for the month of January. The 2005 and 2006 figures are estimated from the statistics for the Commonwealth Edison territory. Load in Commonwealth Edison accounts for approximately 96.5 percent of the load of IOUs. To be conservative, it was assumed that there was no switching outside of Commonwealth Edison, hence the Commonwealth Edison statistics for 2005 and 2006 were reduced by 3.5 percent to create the proxy for the state-wide value. Source: Illinois Commerce Commission
141

Public Benefits Programs: The restructuring act establishes three public benefits funds which are slated to expire at the end of 2006. Table 5 contains information about the public benefits program in Illinois.
Table 5. Illinois Public Benefits Programs* Research &
Development Energy
Efficiency Low
Income Renewable
Energy Total
Million $ 3.0 75.0 5.0 83.0 Mills/kWh 0.03 0.60 0.04 0.67 % revenue 0.03% 0.87% 0.06% 0.96%
Admin. DCEO DCEO DCEO Note: Trust Funds are administered by the Illinois Department of Commerce and Economic Opportunity (DCEO). Source: American Council for an Energy-Efficient Economy, Summary Table of Public Benefit Programs and Electric Utility Restructuring (December 2005) available at http://www.aceee.org/briefs/mktabl.htm. * In December 1997, PA 9D-551 was signed. It provided funding for EE, RE, LI (although EE and RE are at low levels) using non-bypassable, flat monthly charges on customer bills. (mills/kWh) equiv. includes $ from gas & elect. Also one-time ComEd $250 million Clean Energy Trust Fund approved by legislature in May, 1999 (not in table).
Separation of Generation and Transmission: Illinois did not require divestiture or functional separation. Thus, utilities may engage in both competitive and non-competitive services without forming a separate affiliate. All of the major utilities in Illinois chose to transfer generation assets to affiliates with the exception of Commonwealth Edison, which divested its fossil fuel generation plants. State RTO Involvement: The restructuring legislation required Illinois utilities with transmission assets to join an RTO or ISO. Illinois utilities have joined either the Mid-West ISO or PJM West. Commonwealth Edison, for example, joined PJM West. The Ameren utilities joined the Mid-West ISO. MidAmerican has not joined an ISO, although it has received FERC authorization to engage an independent transmission operator. Generation Capability:347 Prior to the restructuring legislation (1997), utilities operated 97 percent of the generation capability in Illinois. By 2002, that figure dropped to 9.1 percent. The difference reflected the transfers and sales of generation assets to utility-affiliated entities and entry or expansion by independent power producers. Between 1997 and 2002, generation output in the state increased from 135 million MWhs to 188 million MWhs, a nearly 40 percent increase. During the 1993 to 1997 period, output in the state had shrunk by more than 5 percent . Use of Customer Information: No customer-specific information can be given to a supplier without customer authorization.348
Standardized Labeling:349 “The 1997 Illinois restructuring law includes provisions for disclosing 347 U.S. Department of Energy, Energy Information Administration, Illinois State Profile, Table 4, available at http://www.eia.doe.gov/cneaf/electricity/st_profiles/illinois.pdf. 348 220 ILL. COMP. STAT. at 5/16-122. 349 Department of Energy, Energy Information Administration, Disclosure Policies, available at http://www.eere.energy.gov/greenpower/markets/disclosure.shtml?print.
142

fuel mix and emissions by retail electricity suppliers. Final rules issued by the Illinois Commerce Commission (ICC) require retail suppliers to provide a bill insert to customers each quarter with a table and pie chart representing the sources of electricity used in the previous year, beginning in January 1999. Suppliers must also provide a table showing total emissions of carbon dioxide, nitrogen oxides, and sulfur dioxide, as well as the amount of high- and low-level nuclear waste attributable to the sources of electricity.”
Renewable Energy Portfolio Standard: On July 19, 2005, the ICC adopted a voluntary renewable portfolio standard target for bundled retail load starting at 3 percent in 2007 and rising by one percent each year until it reaches 8 percent in 2013.350 The ICC’s resolution also includes targeted reductions in future load growth. Maryland: Overview of Retail Competition Plan and Market Response Administrator and Start Date: The Maryland General Assembly enacted the Maryland Electric Customer Choice and Competition Act (SB 300) on April 8, 1999. The Act allowed for a three-year phase-in approach to electric competition, but the Maryland Public Services Commission (PSC) allowed the utilities to start electric competition all at once for all customers on July 1, 2000. The PSC oversees the customer choice program.351
Services Open to Competition: Generation, billing, and metering. Consumer Options: Customers may choose to remain with the distribution utility at PSC regulated prices until the end of the transition period; they may choose a competitive supplier; or they may choose to be aggregated with other customers. The transition period ended for most consumers in Maryland as of July 2006. In other areas, the period ends in 2008. Alternative Suppliers Licensed to Provide Service: All alternative suppliers must be licensed by the PSC, and must show proof of technical and managerial competence, compliance with FERC requirements, and compliance with state and federal environmental laws.352 A supplier must also give proof of financial integrity,353 and the PSC assesses each competitive supplier’s application for a license on a case-by-case basis to determine whether a letter of guarantee, bond, or letter of credit is needed, and in what amount.354 Registered suppliers and registered suppliers seeking additional customers are available on the Maryland PSC’s website. There are numerous registered and active suppliers for C&I customers. For residential customers, there are numerous registered suppliers but only two suppliers in three of the four major utility territories and none in the Allegheny Power territory before the end of the transition period. Pricing Trends: As Table 6 shows, prices rose throughout the early 1990s for all sectors, then 350 Illinois Commerce Commission Resolution, Response to Governor’s Sustainable Energy Plan for the State of Illinois, Case No. 05-0437 (July 19, 2005), available at http://eweb.icc.state.il.us/e-docket/reports/view_file.asp?intIdFile=148072&strC=bd. 351 MD. CODE ANN., PUB. UTIL. COS., §'7-509 (2000). 352 Id. at § 7-507(b). 353 Id. at § 7-507(c). 354 Maryland Public Service Commission, Supplier Authorization Procedures (Mar. 17, 2000), available at http://www.psc.state.md.us/psc/electric/supplierauthorization.htm.
143

declined until 2002. Prices rose in 2003 and 2004. With the end of the transition period for most residential and small C&I customers in the state, POLR service is scheduled to be priced at market rates. Procurement contracts for POLR service starting in July 2006 are scheduled to result in price increases above existing POLR rates. For example, the scheduled price increase for customers in the BG&E distribution territory is reported to be 72 percent.355 Because of concerns about the size of the expected price increase, a number of alternative proposals were developed to break the increase into smaller steps. Legislation just prior to the end of the transition period included deferrals of revenues and dismissal of the members of the PSC. At the time of this writing, litigation regarding the latter provision is taking place.356
1988 1989 1990 1991 1992 1993 1994 1995 1996 1997 1998 1999 2000 2001 2002 2003 2004Residential 6.7 6.9 7.2 7.9 8.0 8.2 8.4 8.4 8.3 8.3 8.4 8.4 8.0 7.7 7.7 7.7 7.8Commercial 6.5 6.6 6.7 7.0 7.1 7.2 7.2 6.9 6.8 6.9 6.8 6.8 6.6 6.4 6.3 7.0 7.6Industrial 4.4 4.7 5.1 5.5 5.4 5.5 5.3 4.2 4.2 4.2 4.1 4.3 4.1 4.4 4.0 4.9 6.0All Sectors 5.8 6.0 6.3 6.8 6.8 7.0 7.0 7.1 7.0 7.0 7.0 7.0 6.8 6.6 6.2 6.5 7.2
Table 6. Maryland Average Annual Price per KWh by Sector(nominal cents)
Source: Energy Information Administration
Price Changes for POLR (or Regulated) Service: Individual distribution utility plans vary, but a cap for all distribution utilities was put into effect through 2004 and then extended for two to four years. During the initial four years, distribution utilities were required to decrease prices 3-7.5 percent.357 During this period, if the distribution utility’s POLR price increased, transition charges decreased by a corresponding amount, so that standard offer customers did not have an overall price increase.358
POLR Service Provider: The distribution utilities provide POLR service in their respective territories until the end of the transition period (or longer if the PSC extends the period). A distribution utility can procure the electricity for its POLR customers from any supplier, including an affiliate. Individual utility settlements require the utility to be the POLR service provider for the entire rate cap/freeze period (which varies in length per utility) unless the Commission orders otherwise. POLR service rates and the respective terms were set in the individual utility settlements and have been in effect for the entire rate cap/freeze period. Recovery of Stranded Costs/Transition Costs: Distribution utilities were given an opportunity to recover all prudently incurred and verifiable net transition costs, subject to full mitigation.359 Transition costs eligible for recovery include those that would be recoverable under rate-of-return regulation, but are not recoverable in a restructured electric market and costs that result
355 Andrew Green, Legislators Not Close on Rates, BALT. SUN (Apr. 4, 2006). 356 Patrice Hill, Maryland Utilities Designated Near Junk, WASH. TIMES (July 12, 2006), available at http://www.washingtontimes.com/functions/print.php?StoryID=20060711-103048-5690r. 357 MD. CODE ANN., PUB. UTIL. COS., § 7-505(d) (2000). 358 Maryland Public Service Commission, Maryland Electric Choice FAQ, available at www.psc.state.md.us/psc/electric/FAQ/overall.htm. 359 MD. CODE ANN., PUB. UTIL. COS., § 7-513 (2000).
144
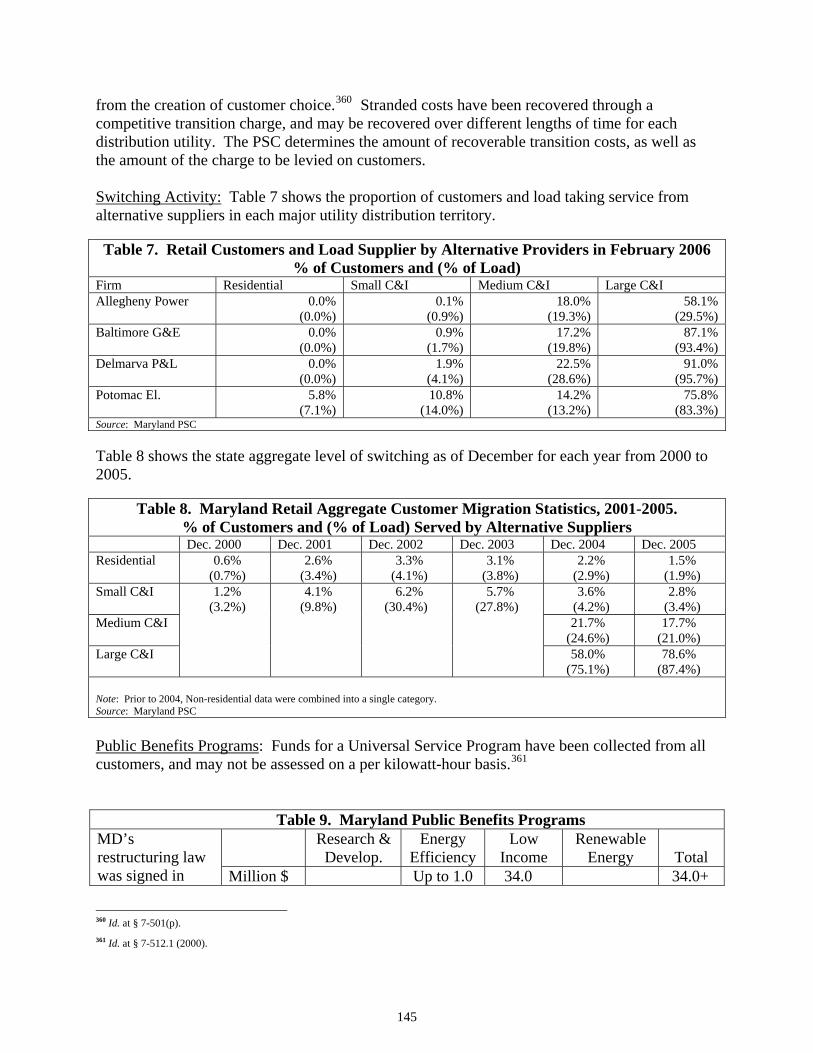
from the creation of customer choice.360 Stranded costs have been recovered through a competitive transition charge, and may be recovered over different lengths of time for each distribution utility. The PSC determines the amount of recoverable transition costs, as well as the amount of the charge to be levied on customers. Switching Activity: Table 7 shows the proportion of customers and load taking service from alternative suppliers in each major utility distribution territory. Table 7. Retail Customers and Load Supplier by Alternative Providers in February 2006
% of Customers and (% of Load) Firm Residential Small C&I Medium C&I Large C&I Allegheny Power 0.0%
(0.0%) 0.1%
(0.9%) 18.0%
(19.3%) 58.1%
(29.5%) Baltimore G&E 0.0%
(0.0%) 0.9%
(1.7%) 17.2%
(19.8%) 87.1%
(93.4%) Delmarva P&L 0.0%
(0.0%) 1.9%
(4.1%) 22.5%
(28.6%) 91.0%
(95.7%) Potomac El. 5.8%
(7.1%) 10.8%
(14.0%) 14.2%
(13.2%) 75.8%
(83.3%) Source: Maryland PSC Table 8 shows the state aggregate level of switching as of December for each year from 2000 to 2005.
Table 8. Maryland Retail Aggregate Customer Migration Statistics, 2001-2005. % of Customers and (% of Load) Served by Alternative Suppliers
Dec. 2000 Dec. 2001 Dec. 2002 Dec. 2003 Dec. 2004 Dec. 2005 Residential 0.6%
(0.7%) 2.6%
(3.4%) 3.3%
(4.1%) 3.1%
(3.8%) 2.2%
(2.9%) 1.5%
(1.9%) Small C&I 3.6%
(4.2%) 2.8%
(3.4%) Medium C&I 21.7%
(24.6%) 17.7%
(21.0%) Large C&I
1.2% (3.2%)
4.1% (9.8%)
6.2% (30.4%)
5.7% (27.8%)
58.0% (75.1%)
78.6% (87.4%)
Note: Prior to 2004, Non-residential data were combined into a single category. Source: Maryland PSC Public Benefits Programs: Funds for a Universal Service Program have been collected from all customers, and may not be assessed on a per kilowatt-hour basis.361
Table 9. Maryland Public Benefits Programs Research &
Develop. Energy
Efficiency Low
Income Renewable
Energy Total MD’s restructuring law was signed in Million $ Up to 1.0 34.0 34.0+
360 Id. at § 7-501(p). 361 Id. at § 7-512.1 (2000).
145
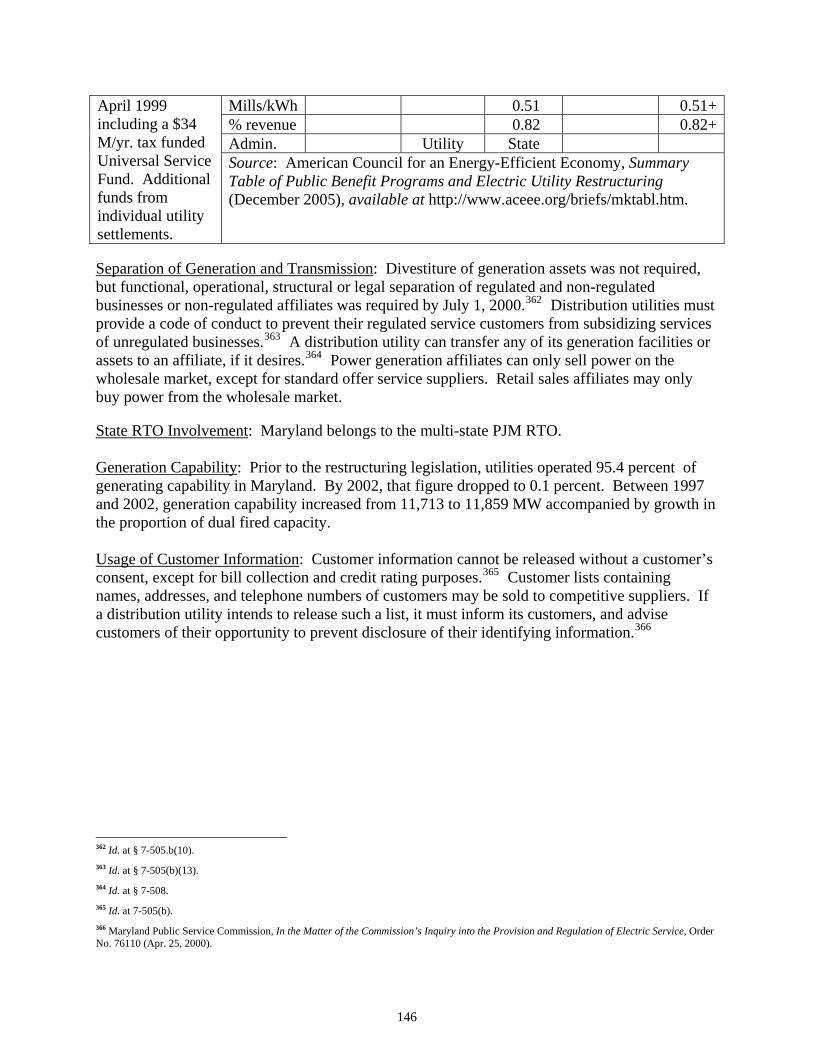
Mills/kWh 0.51 0.51+% revenue 0.82 0.82+Admin. Utility State
April 1999 including a $34 M/yr. tax funded Universal Service Fund. Additional funds from individual utility settlements.
Source: American Council for an Energy-Efficient Economy, Summary Table of Public Benefit Programs and Electric Utility Restructuring (December 2005), available at http://www.aceee.org/briefs/mktabl.htm.
Separation of Generation and Transmission: Divestiture of generation assets was not required, but functional, operational, structural or legal separation of regulated and non-regulated businesses or non-regulated affiliates was required by July 1, 2000.362 Distribution utilities must provide a code of conduct to prevent their regulated service customers from subsidizing services of unregulated businesses.363 A distribution utility can transfer any of its generation facilities or assets to an affiliate, if it desires.364 Power generation affiliates can only sell power on the wholesale market, except for standard offer service suppliers. Retail sales affiliates may only buy power from the wholesale market. State RTO Involvement: Maryland belongs to the multi-state PJM RTO. Generation Capability: Prior to the restructuring legislation, utilities operated 95.4 percent of generating capability in Maryland. By 2002, that figure dropped to 0.1 percent. Between 1997 and 2002, generation capability increased from 11,713 to 11,859 MW accompanied by growth in the proportion of dual fired capacity. Usage of Customer Information: Customer information cannot be released without a customer’s consent, except for bill collection and credit rating purposes.365 Customer lists containing names, addresses, and telephone numbers of customers may be sold to competitive suppliers. If a distribution utility intends to release such a list, it must inform its customers, and advise customers of their opportunity to prevent disclosure of their identifying information.366
362 Id. at § 7-505.b(10). 363 Id. at § 7-505(b)(13). 364 Id. at § 7-508. 365 Id. at 7-505(b). 366 Maryland Public Service Commission, In the Matter of the Commission’s Inquiry into the Provision and Regulation of Electric Service, Order No. 76110 (Apr. 25, 2000).
146
Standardized Labeling:
• Content: Distribution utilities and competitive suppliers must provide customers with a uniform set of information on fuel mix and emissions. When actual data is unavailable, a regional average may be used. Labels have to include comparison of emissions and fuel mix to the regional average when information is available.367
• Timing: Labels must be provided to customers every six months.368
Renewable Energy Portfolio Standard: Maryland enacted a renewable energy portfolio standard in 2004. The standard gradually increases to 7.5 percent in 2019. A separate standard of 2.5 percent including hydroelectric and waste-to-heat generation applies throughout the period. Massachusetts: Overview of Retail Competition Plan and Market Response Administrator and Start Date: Electricity Restructuring in Massachusetts was initiated and is administered by the Department of Telecommunications and Energy (DTE). Retail competition began March 1, 1998, in accordance with the restructuring legislation enacted November 25, 1997. Services Open to Competition: Generation only. Metering and billing are provided by the distribution utility. Consumer Options: During the transition to competition, consumers had three types of choices to obtain their electricity supply: a) standard offer service, b) service through an aggregator, or c) service from a competitive supplier. If a supplier was unable to provide services, consumers then received a “default” service. Unlike most states that provided POLR service, Massachusetts named its POLR service as standard offer service, and developed another regulated price for those customers for which their supplier no longer provided service (default service). The transition ended in February 2005, at which time standard offer service was discontinued for all customers. Currently, customers who have not chosen a competitive supplier receive default service from the distribution utility that procures generation services from wholesale suppliers. All retail customers are eligible for default service at any time, and may remain on default service indefinitely. Customers can also select an alternative supplier or be part of a group of customers served by an aggregator. For purposes of this summary, default service will be referred to as a type of POLR service. Alternative Suppliers Licensed to Provide Service: All alternative suppliers must be licensed to provide service to customers in Massachusetts.369 Licensing regulations require a supplier to show technical and financial capability.370 Massachusetts maintains a roster of registered competitive electricity suppliers including brokers and direct competitive suppliers. The roster 367 Maryland Public Service Commission, In the Matter of the Commission’s Inquiry into the Provision and Regulation of Electric Service, Order No. 76241 (June 15, 2000). See section below on advertising restrictions for supplier requirements to disclose pricing information to customers. 368 MD. CODE ANN., PUB. UTIL. COS., § 7-505(b) (2000). 369 MASS. GEN. LAWS ch. 164, § 1F(1) (2001). 370 220 MASS. CODE REGS. 11.05(2) (2001).
147

in February 2006 included 30 direct suppliers and twice as many brokers.371 Ten of the suppliers offered service to residential customers as did a comparable number of brokers. Pricing Trends: As Table 10 shows, prices for the residential and commercial sectors for the 1988 to 2004 period rose intermittently before peaking in 1997 and then declined before peaking again in 2001. Prices for the industrial sector rose intermittently in the 1990s and also peaked in 2001.
Table 10. Massachusetts Average Annual Price per KWh by Sector (nominal cents)
198
8 1989 199
0 1991 1992 1993 199
4 1995 199
6 1997 199
8 1999 2000
2001
2002 2003
2004
Residential 8.5 9.1 9.7 10.4 10.6 11.0 11.1 11.3 11.3 11.6 10.6 10.1 10.8 12.5 10.9 11.7 11.75 Commercial 7.7 8.1 8.6 9.2 9.3 9.7 9.8 9.9 9.9 10.3 9.4 8.9 9.0
11.6 10.0 10.5 11.0
Industrial 6.8 7.3 7.9 8.5 8.6 8.7 8.5 8.4 8.4 8.8 8.2 7.7 8.1 9.4 8.3 9.1 8.5 All Sectors 7.8 8.3 8.8 9.5 9.7 10.0 10.0 10.1 10.1 10.5 9.6 9.1 9.5 11.6 10.1 10.6 10.8 Source: Energy Information Administration
Price Changes for Standard Offer Service: Massachusetts set a minimum 10 percent reduction of the entire bill for all customers receiving standard offer service during the transition period. On September 1, 1999, the reduction increased to at least 15 percent, in order to adjust for inflation. These rate reductions applied to all distribution utilities.372 Distribution utilities were authorized to use securitization to meet the second rate reduction effective September 1, 1999.373 Standard Offer Service Provider: Standard offer service was provided until February 2005 for customers who had not chosen a competitive supplier during the transition period. It was offered by the distribution utility, at rates which were set in advance, but subject to some adjustments.374
POLR (default service) is offered currently to customers who are not receiving service from a competitive supplier or aggregator. Former standard offer customers were offered POLR service at the end of the transition. The price for POLR service is based on the price of procuring it in the wholesale markets through fixed price short-term (three or six months) supply contracts. Distribution companies must procure electricity for default generation service through competitive bidding, although the DTE also may authorize a competitive supplier to provide POLR service.375
POLR service prices cover the energy portion of the total bill. Distribution rates, taxes, and fees are additional. POLR service prices follow wholesale prices. The default prices applicable to
371 Massachusetts Department of Telecommunications and Energy, Massachusetts Competitive Electricity Suppliers (February 14, 2006). The current listing of active suppliers for each distribution territory is accessible at http://www.mass.gov/dte/restruct/competition/index.htm#licensed%20competitive%20Suppliers%20and%20electricity%20brokers (under “Generation Service Information.”) 372 MASS. GEN. LAWS ch. 164, § 1B(b) (2001). 373 Id. at § 1G(c)(2). 374 Id. at § 1B(b). 375 Id. at § 1B(d).
148

January of each year for the northern portion of the Boston Edison distribution area (Table 11) illustrate the pattern.
Table 11. Default Prices Applicable in January by Year, Boston Edison (north) 1999 2000 2001 2002 2003 2004 2005 2006 Residential 3.7 4.5 7.0 6.4 5.0 6.5 7.5 12.7 Commercial 3.7 4.5 7.0 6.6 5.2 6.6 7.3 12.3 Industrial 3.7 4.5 7.0 6.5 5.1 6.6 9.0 18.1 DTE, Fixed Default Service Prices in cents/kWh Recovery of Stranded Costs/Transition Costs: The restructuring legislation provided for the recovery of stranded costs through a non-bypassable charge to all customers.376 This charge was capped by the DTE, and the DTE determined, on a case-by-case basis, the time period for recovery.377
Switching Restrictions and Minimum Stay Requirements: Customers can switch to or from POLR (default/basic) service.378
Switching Activity: Table 12 shows the proportion of customers and load taking service from alternative suppliers in each utility distribution territory. In the Commonwealth territory, switching by residential customers is much higher than in any other area of the state. Much of this residential switching is attributable to community aggregations, principally the Cape Light Compact.379
Table 12. Retail Customers and Load Supplied by Alternative Providers in January 2006
% of Customers and (% of Load) Firm and load in
MWh Residential Small C&I Medium C&I Large C&I Boston Edison
1,498,476 0.3%
(0.6%) 2.0%
(3.5%) 7.9%
(13.6%) 34.0%
(50.0%) Cambridge
154,540 0.2%
(0.3%) 6.7%
(13.5%) 8.4%
(12.4%) 33.6%
(52.6%) Commonwealth
403,108 54.2%
(51.8%) 55.0%
(57.5%) 44.3%
(46.2%) 65.6%
(70.5%) Fitchburg
47,256 0.0%
(0.0%) 3.8%
(2.9%) 4.8%
15.5% 72.7%
(86.6%) Mass. Electric
1,995,096 2.1%
(2.4%) 7.4%
(12.2%) 31.1%
(29.3%) 58.1%
(66.2%) Nantucket
12,547 0.2%
(1.3%) 4.4%
(6.6%) 23.6%
(29.3%) 50.0%
(53.2%) Western Mass.
0.5%
(0.7%) 6.6%
(11.9%) 32.4%
(36.8%) 60.2%
(76.3%) Source: Mass. Department of Telecommunications and Energy
376 Id. at § 1G(a). 377 Id. at § 1G(e). 378 David L. O’Connor (Commissioner, Mass. Division of Energy Resources), Retail Competition: Managing a Difficult Transition (Apr. 6, 2001), at 6, available at http://www.nga.org/Files/ppt/ElecOconnor.ppt. 379 Cape Light Compact comments.
149
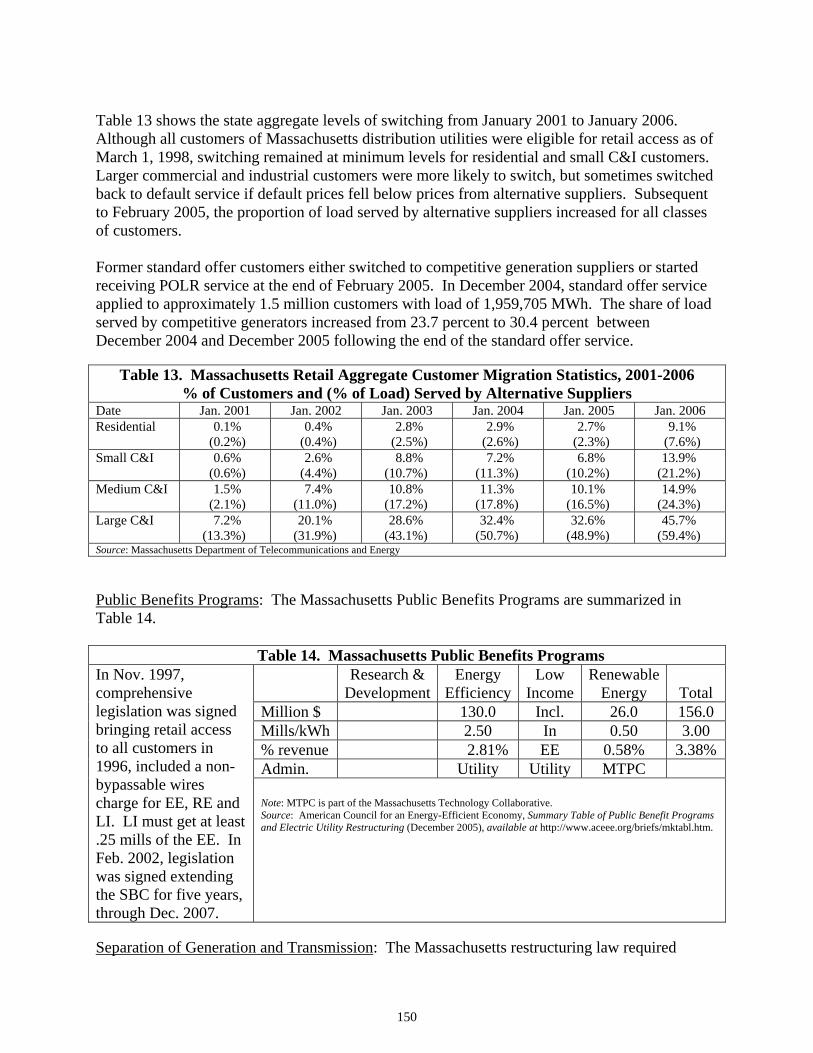
Table 13 shows the state aggregate levels of switching from January 2001 to January 2006. Although all customers of Massachusetts distribution utilities were eligible for retail access as of March 1, 1998, switching remained at minimum levels for residential and small C&I customers. Larger commercial and industrial customers were more likely to switch, but sometimes switched back to default service if default prices fell below prices from alternative suppliers. Subsequent to February 2005, the proportion of load served by alternative suppliers increased for all classes of customers. Former standard offer customers either switched to competitive generation suppliers or started receiving POLR service at the end of February 2005. In December 2004, standard offer service applied to approximately 1.5 million customers with load of 1,959,705 MWh. The share of load served by competitive generators increased from 23.7 percent to 30.4 percent between December 2004 and December 2005 following the end of the standard offer service.
Table 13. Massachusetts Retail Aggregate Customer Migration Statistics, 2001-2006 % of Customers and (% of Load) Served by Alternative Suppliers
Date Jan. 2001 Jan. 2002 Jan. 2003 Jan. 2004 Jan. 2005 Jan. 2006 Residential
0.1% (0.2%)
0.4% (0.4%)
2.8% (2.5%)
2.9% (2.6%)
2.7% (2.3%)
9.1% (7.6%)
Small C&I
0.6% (0.6%)
2.6% (4.4%)
8.8% (10.7%)
7.2% (11.3%)
6.8% (10.2%)
13.9% (21.2%)
Medium C&I 1.5% (2.1%)
7.4% (11.0%)
10.8% (17.2%)
11.3% (17.8%)
10.1% (16.5%)
14.9% (24.3%)
Large C&I
7.2% (13.3%)
20.1% (31.9%)
28.6% (43.1%)
32.4% (50.7%)
32.6% (48.9%)
45.7% (59.4%)
Source: Massachusetts Department of Telecommunications and Energy Public Benefits Programs: The Massachusetts Public Benefits Programs are summarized in Table 14.
Table 14. Massachusetts Public Benefits Programs
Research & Development
Energy Efficiency
Low Income
Renewable Energy Total
Million $ 130.0 Incl. 26.0 156.0 Mills/kWh 2.50 In 0.50 3.00 % revenue 2.81% EE 0.58% 3.38% Admin. Utility Utility MTPC
In Nov. 1997, comprehensive legislation was signed bringing retail access to all customers in 1996, included a non-bypassable wires charge for EE, RE and LI. LI must get at least .25 mills of the EE. In Feb. 2002, legislation was signed extending the SBC for five years, through Dec. 2007.
Note: MTPC is part of the Massachusetts Technology Collaborative. Source: American Council for an Energy-Efficient Economy, Summary Table of Public Benefit Programs and Electric Utility Restructuring (December 2005), available at http://www.aceee.org/briefs/mktabl.htm.
Separation of Generation and Transmission: The Massachusetts restructuring law required
150
distribution utilities to divest their generation facilities (either by sale or by transfer to an affiliated company), if they sought to recover stranded costs.380 If a distribution utility opted to transfer its generation assets to an affiliate, the two companies had to be strictly separated,381 and distribution utilities were not be permitted to sell electricity at retail except to provide their customers with standard offer service (which has now ended).382 Almost all of the distribution companies divested their assets to only one company. State RTO Involvement: Massachusetts distribution utilities are within the footprint of the Independent System Operator of New England. Established in 1997, ISO-NE is responsible for managing energy markets and operating the transmission system in New England. Generation Capability:383 Prior to the restructuring legislation, utilities operated 86.6 percent of generating capability in Massachusetts. By 2002, that figure dropped to 9.0 percent with 91 percent of generation belonging to independent power producers. Between 1997 and 2002, generation capability increased from 11,328 MWs to 12,159 MWs. Most of the new capacity uses natural gas.384
Usage of Customer Information: The distribution utility cannot release proprietary customer information to the affiliate without written consent of the customer. Historical usage information will be provided to a supplier who has received customer authorization to initiate service.385
Standardized Labeling:386 “In February 1998, the Massachusetts Department of Telecommunications and Energy (DTE) issued final rules (220 CMR 11.06) requiring electric retailers to provide customers with a standard disclosure label containing information on price, fuel mix, emissions, and labor characteristics of generating sources on a quarterly basis, beginning September 1, 1998. Suppliers must also issue notices in all advertisements stating that disclosure labels are available upon request. Supply mix information must be based on market settlement data or equivalent data provided by the ISO available for the most recent one-year period. Data on carbon dioxide, nitrogen oxides, and sulfur dioxide emissions must be presented in a format comparing them to the regional average. Electricity providers are also required to report the percentage of power generated from sources that have union contracts with their employees and the percentage generated from sources that use replacement labor during labor disputes. Suppliers must submit a report to the DTE annually containing "statements of verification by the ISO or an independent auditor." Massachusetts is working with other New England states to develop a Generation Information System that will supply data for implementing the disclosure requirement.” 380 MASS. GEN. LAWS ch. 164, § 1A(b)(2) (2001). 381 Id. at § 1A(c). 382 Id. at § 1A(b)(1). 383 U.S. Department of Energy, Energy Information Administration, Massachusetts State Profile, Table 4, available at http://www.eia.doe.gov/cneaf/electricity/st_profiles/massachusetts.pdf. 384 U.S. Department of Energy, Energy Information Administration, State Electricity Profiles 2002, Massachusetts Electric Power Industry Generating Capability by Primary Energy Sources, 1993, 1997, and 2002. 385 220 MASS. CODE REGS. 11.04(12). 386 U.S. Department of Energy, Energy Information Administration, Disclosure Policies, available at http://www.eere.energy.gov/greenpower/markets/disclosure.shtml?print.
151

Renewable Energy Portfolio Standard: Massachusetts enacted a minimum renewable energy portfolio standard on April 26, 2002. The standard started at 1 percent in 2003 and increases to 4 percent in 2009 in one half percent increments. After 2009, the standard is scheduled to increase in 1 percent increments at least through 2014.387
New Jersey: Overview of Retail Competition Plan and Market Response Administrator and Start Date: The New Jersey Electric Discount and Energy Competition Act provided for retail choice to begin August 1, 1999, but the New Jersey Board of Public Utilities (BPU) delayed the start date to November 14, 1999, to give utilities more time to modify their computer systems to interact with competitive retail suppliers in order to ease customer switching. Services Open to Competition: Generation is open to competition. Work on a policy to permit competition for other customer services, such as metering and billing, was suspended on June 23, 2004, for a minimum of two years.388 Consumer Options: New Jersey consumers can pick their own alternative supplier or join an aggregation of customers to contract with an alternative supplier. Customers received a “shopping credit” on their electric bill if they choose an alternative supplier. The shopping credit was also known as the “price to compare” and was the amount on a customer’s bill that was credited to the customer if he chose an alternate supplier and did not receive basic generation service from the distribution utility.389
Customers that are not served by an alternative supplier receive Basic Generation Service (BGS), which is procured through periodic auctions. Large industrial customers with BGS are charged hourly prices that track wholesale spot market prices. BGS for other customer classes is laddered on a three year cycle. Alternative Suppliers Licensed to Provide Service: New Jersey licensing standards provide that before receiving a license, new suppliers must show financial integrity and maintain a surety bond of $250,000 for an initial license. For a renewed license, suppliers have to maintain a bond at a level determined by the BPU.390 Competitive suppliers must renew their licenses annually. The BPU website provides lists of alternative suppliers serving residential, commercial and industrial retail customers. As of February 2006, active alternative suppliers for residential customers range from 3 in the JCP&L territory, to 1 each in the Conectiv and PSE&G territories. None offer service to residential customers in the Rockland territory. For C&I customers, there are 6 active suppliers in the Rockland territory and 19 or 20 in each of the other territories. 387 225 Mass. Code Regs. 14.00. 388 New Jersey Board of Public Utilities, In the Matter of the Electric Discount and Energy Competition Act of 1999 Customers Account Services Proceeding: Consolidated Billing, Customer Data Card, & Competitive Metering. Energy Consultant: Amendment to Customer Usage Information Process (June 23, 2004), available at http://www.state.nj.us/bpu/wwwroot/energy/EX99090676_20040624.pdf. 389 N.J. STAT. ANN. § 48:3-51.3 (2001). 390 New Jersey Board of Public Utilities, Interim Licensing and Registration Standards § 4.e, available at www.state.nj.us/bpu/wwwroot/energy/licensstands.pdf.
152
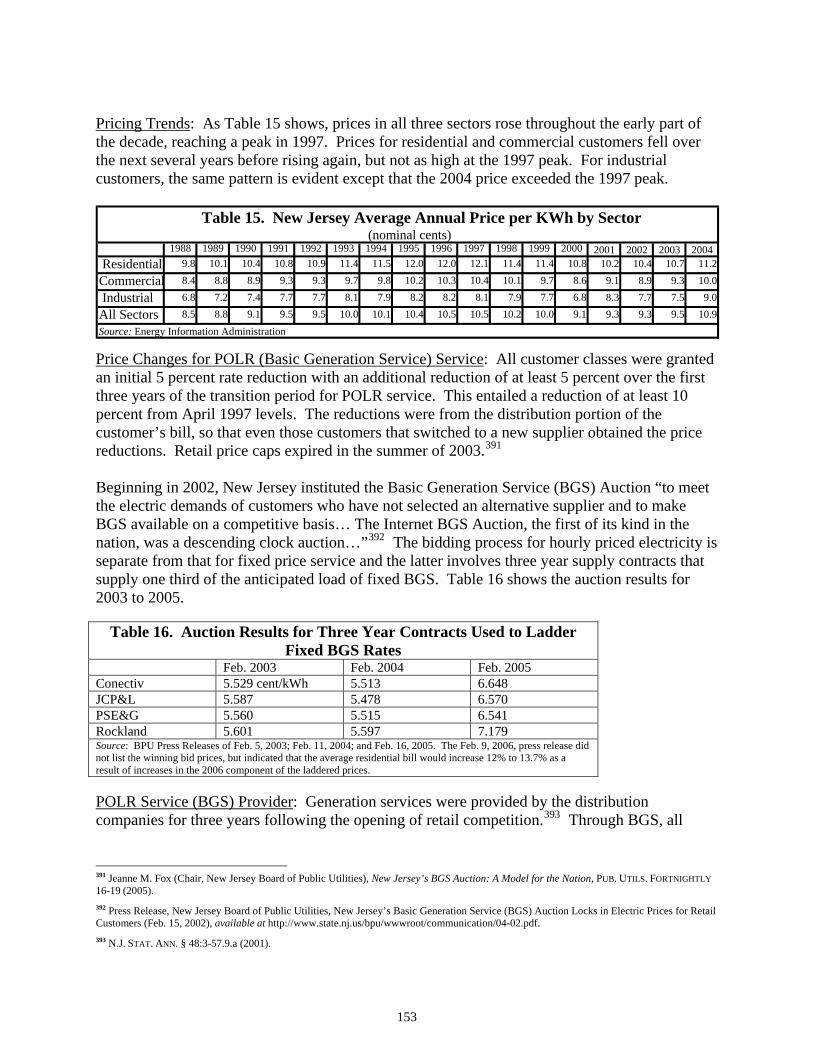
Pricing Trends: As Table 15 shows, prices in all three sectors rose throughout the early part of the decade, reaching a peak in 1997. Prices for residential and commercial customers fell over the next several years before rising again, but not as high at the 1997 peak. For industrial customers, the same pattern is evident except that the 2004 price exceeded the 1997 peak.
1988 1989 1990 1991 1992 1993 1994 1995 1996 1997 1998 1999 2000 2001 2002 2003 2004 Residential 9.8 10.1 10.4 10.8 10.9 11.4 11.5 12.0 12.0 12.1 11.4 11.4 10.8 10.2 10.4 10.7 11.2
Commercial 8.4 8.8 8.9 9.3 9.3 9.7 9.8 10.2 10.3 10.4 10.1 9.7 8.6 9.1 8.9 9.3 10.0
Industrial 6.8 7.2 7.4 7.7 7.7 8.1 7.9 8.2 8.2 8.1 7.9 7.7 6.8 8.3 7.7 7.5 9.0
All Sectors 8.5 8.8 9.1 9.5 9.5 10.0 10.1 10.4 10.5 10.5 10.2 10.0 9.1 9.3 9.3 9.5 10.9
Table 15. New Jersey Average Annual Price per KWh by Sector (nominal cents)
Source: Energy Information Administration
Price Changes for POLR (Basic Generation Service) Service: All customer classes were granted an initial 5 percent rate reduction with an additional reduction of at least 5 percent over the first three years of the transition period for POLR service. This entailed a reduction of at least 10 percent from April 1997 levels. The reductions were from the distribution portion of the customer’s bill, so that even those customers that switched to a new supplier obtained the price reductions. Retail price caps expired in the summer of 2003.391 Beginning in 2002, New Jersey instituted the Basic Generation Service (BGS) Auction “to meet the electric demands of customers who have not selected an alternative supplier and to make BGS available on a competitive basis… The Internet BGS Auction, the first of its kind in the nation, was a descending clock auction…”392 The bidding process for hourly priced electricity is separate from that for fixed price service and the latter involves three year supply contracts that supply one third of the anticipated load of fixed BGS. Table 16 shows the auction results for 2003 to 2005.
Table 16. Auction Results for Three Year Contracts Used to Ladder Fixed BGS Rates
Feb. 2003 Feb. 2004 Feb. 2005 Conectiv 5.529 cent/kWh 5.513 6.648 JCP&L 5.587 5.478 6.570 PSE&G 5.560 5.515 6.541 Rockland 5.601 5.597 7.179 Source: BPU Press Releases of Feb. 5, 2003; Feb. 11, 2004; and Feb. 16, 2005. The Feb. 9, 2006, press release did not list the winning bid prices, but indicated that the average residential bill would increase 12% to 13.7% as a result of increases in the 2006 component of the laddered prices. POLR Service (BGS) Provider: Generation services were provided by the distribution companies for three years following the opening of retail competition.393 Through BGS, all
391 Jeanne M. Fox (Chair, New Jersey Board of Public Utilities), New Jersey’s BGS Auction: A Model for the Nation, PUB. UTILS. FORTNIGHTLY 16-19 (2005). 392 Press Release, New Jersey Board of Public Utilities, New Jersey’s Basic Generation Service (BGS) Auction Locks in Electric Prices for Retail Customers (Feb. 15, 2002), available at http://www.state.nj.us/bpu/wwwroot/communication/04-02.pdf. 393 N.J. STAT. ANN. § 48:3-57.9.a (2001).
153

customer classes are eligible for generation service overseen by the BPU.394 Non-residential customers who return to BGS are generally required to remain with that service for one year.395 The auction system for procuring BGS has been in place since 2002, although rate caps applied until mid-2003. Recovery of Stranded Costs/Transition Costs: The BPU determined the recoverable amount of stranded costs, and distribution utilities recovered most stranded costs over a maximum of 8 years, through a market transition charge (MTC).396 All customers were be assessed this charge, except for off-grid customers who are exempt from exit fees. Switching Restrictions and Minimum Stay Requirements: Customers can switch suppliers or return to their distribution company at any time, in accordance with the terms and conditions of their service agreement with their supplier or distribution company. A customer may not be charged a fee for switching suppliers. Switching Activity: The Table 17 provides the switching statistics for large C&I customers in the major distribution territories as of December 2005.
Table 17. Customer Switching by Distribution Utility (December 2005) % of Customers and (% of Load) Served by Alternative Suppliers
Combined Residential and Non-Residential
Fixed Rate Residential Fixed Rate
Non-Residential Fixed Rate
Large C&I Hourly
Conectiv
0.0% (12.4%)
0.0% 0.3% 87.2% (95.7%)
JCP&L 0.1% (11.6%)
0.0% 0.4% 62.7% (87.7%)
PSE&G
0.1% (15.3%)
0.0% 0.7% 64.0% (84.0%)
Rockland 0.0% (4.4%)
0.0% 0.3% 55.0% (70.3%)
Note: New Jersey does not report separate residential and small C&I load of alternative suppliers. Source: New Jersey BPU and Restructuring Today (January 27, 2006), p. 3. The number of residential customers served by alternative suppliers is and has remained very low with the peak of less than 6 percent in the Conectiv (Atlantic) distribution area in December 2000.397 As of December 2005, less than 1,000 residential customers had alternative suppliers in the entire state.398 As with the residential sector, the number of small C&I customers served by alternative suppliers peaked in December 2000 with 8.6 percent of customers and 16.3 percent of load for this class of customer served by alternative suppliers.399 As of December 2005, less 394 Id. at § 48:3-51.3. 395 FTC Retail Competition Report at A80 (citing comments received from the New Jersey Division of the Ratepayer Advocate). 396 N.J. STAT. ANN. § 48:3-61.13.i. 397 FTC Retail Competition Report at A78 -A80. 398 New Jersey Board of Public Utilities, New Jersey Electric Statistics (Dec. 2005). 399 FTC Retail Competition Report at A78-A80.
154
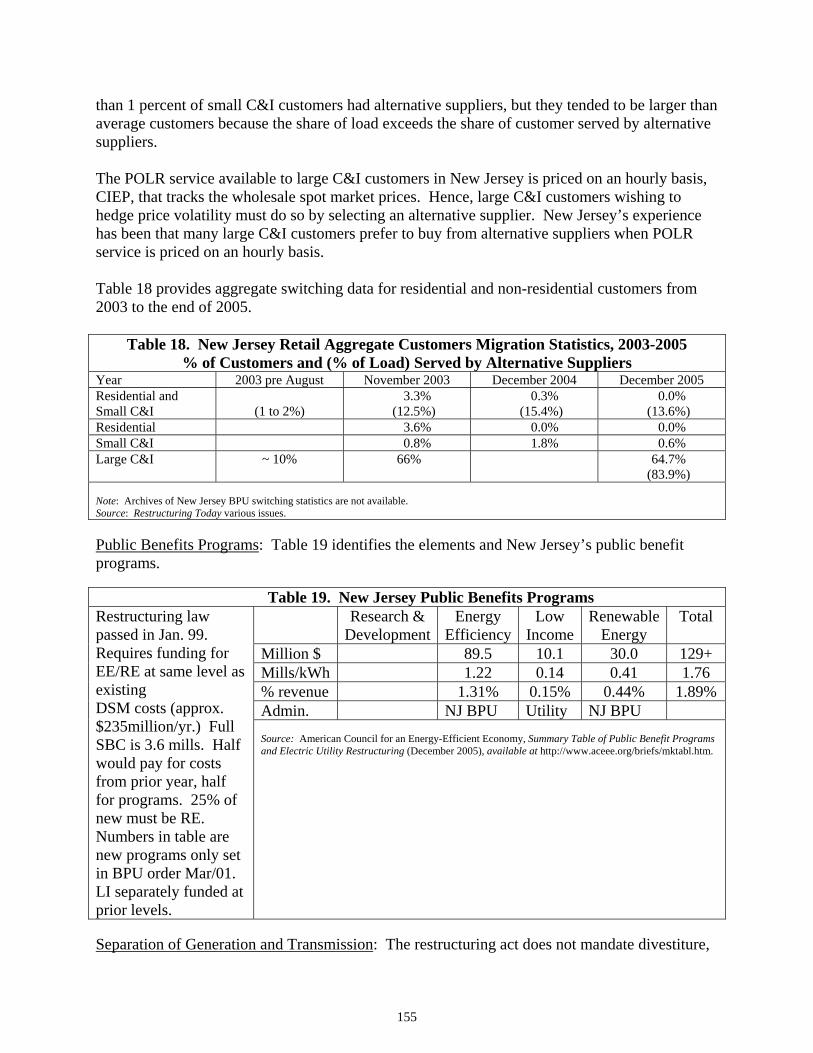
than 1 percent of small C&I customers had alternative suppliers, but they tended to be larger than average customers because the share of load exceeds the share of customer served by alternative suppliers. The POLR service available to large C&I customers in New Jersey is priced on an hourly basis, CIEP, that tracks the wholesale spot market prices. Hence, large C&I customers wishing to hedge price volatility must do so by selecting an alternative supplier. New Jersey’s experience has been that many large C&I customers prefer to buy from alternative suppliers when POLR service is priced on an hourly basis. Table 18 provides aggregate switching data for residential and non-residential customers from 2003 to the end of 2005.
Table 18. New Jersey Retail Aggregate Customers Migration Statistics, 2003-2005 % of Customers and (% of Load) Served by Alternative Suppliers
Year 2003 pre August November 2003 December 2004 December 2005 Residential and Small C&I
(1 to 2%)
3.3% (12.5%)
0.3% (15.4%)
0.0% (13.6%)
Residential 3.6% 0.0% 0.0% Small C&I 0.8% 1.8% 0.6% Large C&I ~ 10% 66% 64.7%
(83.9%) Note: Archives of New Jersey BPU switching statistics are not available. Source: Restructuring Today various issues. Public Benefits Programs: Table 19 identifies the elements and New Jersey’s public benefit programs.
Table 19. New Jersey Public Benefits Programs Research &
DevelopmentEnergy
EfficiencyLow
Income Renewable
Energy Total
Million $ 89.5 10.1 30.0 129+ Mills/kWh 1.22 0.14 0.41 1.76 % revenue 1.31% 0.15% 0.44% 1.89% Admin. NJ BPU Utility NJ BPU
Restructuring law passed in Jan. 99. Requires funding for EE/RE at same level as existing DSM costs (approx. $235million/yr.) Full SBC is 3.6 mills. Half would pay for costs from prior year, half for programs. 25% of new must be RE. Numbers in table are new programs only set in BPU order Mar/01. LI separately funded at prior levels.
Source: American Council for an Energy-Efficient Economy, Summary Table of Public Benefit Programs and Electric Utility Restructuring (December 2005), available at http://www.aceee.org/briefs/mktabl.htm.
Separation of Generation and Transmission: The restructuring act does not mandate divestiture,
155
though the BPU may require a distribution utility to functionally separate its generation assets to the distribution utility’s holding company or a related competitive business segment if there are market concentration concerns.400 Electric distribution utilities had three options: divestiture, structural separation or functional separation. Of the four major distribution utilities in New Jersey, two divested nearly all of their generation, one divested most (but not all) of its generation, and the fourth transferred its generation assets to an unregulated affiliate.401 In August 2000, PSE&G transferred approximately 10,200 MW of its electric generating facilities to PSEG Power, LLC, an unregulated power generation affiliate. The BPU approved the sale of Rockland Utility’s generation assets to Southern Energy Affiliates in June 1999.402
State RTO Involvement: New Jersey is within the multi-state PJM region, an RTO that includes Pennsylvania, New Jersey, Maryland, Delaware, the District of Columbia, and parts of Virginia. In recent years, the PJM RTO has significantly expanded its geographic scope to the West and South of its original footprint. The PJM region is responsible for the operation of the region’s wholesale electric market. Generation Capability:403 Prior to the restructuring legislation, utilities operated 81.2 percent of the generation capability in New Jersey. By 2002, that figure dropped to 6.8 percent after divestitures, transfers, and entry of new generators. Between 1997 and 2002, generation capability in the state increased from 16,855 MWs to 18,384 MWs, an increase of 9.1 percent . Nearly all of the increase was in dual fueled generators built by IPPs. During the 1993 to 1997 period, generating capability had increased by less than 3 percent . Usage of Customer Information: Neither power suppliers nor distribution companies can disclose proprietary information, including historical payment and energy usage information without the written consent of the customer. Any third party who receives such information can only use it in order to provide continued electric service to the customer.404 Standardized Labeling:405 “The New Jersey Board of Public Utilities (BPU) adopted an interim disclosure rule on July 26, 1999, in accordance with the state's restructuring law. The rule requires electricity suppliers to provide consumers with a uniform disclosure label containing information on fuel mix, carbon dioxide, sulfur dioxide, and nitrogen oxides emissions, as well as energy-efficiency efforts twice a year, effective August 1, 1999. Air pollutant emissions must be compared to the regional average. Suppliers should use data from the most recent 12-month period with a 3-month lag, unless such data are unavailable (as in the case of a new market
400 N.J. STAT. ANN. at § 48:3-59.11.a. 401 FTC Retail Competition Report at A80 (citing comments received from the New Jersey Division of the Ratepayer Advocate). 402 New Jersey Board of Public Utilities, Summary Order Including Protective Order in Docket No. EM99030195, Petition of Rockland Electric Company for Approval of the Sale of Orange and Rockland Utilities, Inc.’s Generating Assets and Certain related Property, a Transition Power Sales Agreement, and a Protective Order (June 24, 1999), available at http://www.state.nj.us/bpu/wwwroot/energy/recodivestord.pdf. 403 U.S. Department of Energy, Energy Information Administration, New Jersey State Profile, Table 4, available at http://www.eia.doe.gov/cneaf/electricity/st_profiles/new_jersey.pdf. 404 N.J. STAT. ANN. § 48:3-85.36.b. 405 U.S. Department of Energy, Energy Information Administration, Disclosure Policies, available at http://www.eere.energy.gov/greenpower/markets/disclosure.shtml?print.
156
entrant). Information must be provided for each product offered and verified by an independent auditor.” Renewable Energy Portfolio Standard: The New Jersey Board of Public Utilities adopted renewable energy portfolio standards on February 1, 2005. The standard starts at 3.25 percent for 2005 and rises to 6.5 percent by 2009. On August 31, 2005, the BPU authorized specific standards for two classes of renewable energy sources in addition to continuation of the existing solar requirements. New York: Overview of Retail Competition Plan and Market Response Administrator and Start Date: Restructuring in New York State has taken place through orders of the New York State Public Service Commission (NYPSC), rather than through legislative initiatives. Because the PSC phased in restructuring through PSC-approved utility restructuring plans over a three year period, each utility had a different timetable to transition to retail competition. In 2004, the NYPSC identified a number of “best practices” and ordered distribution utilities to submit plans to foster the development of retail competition.406 Subsequently, the NYPSC adopted statewide guidelines, based on the program developed by Orange and Rockland (O&R).407 Under the guidelines, the distribution utility notifies any customers who contact the utility that they may try an alternative supplier for a two-month period without any penalty for leaving or returning to POLR service after the trial period. Alternative suppliers participating in the program offer a one-time 7 percent discount for the trial period. Customers can either pick an alternative supplier or have one randomly assigned and customers are can return to POLR service or to another alternative supplier at the end of the trial period. As the table on retail switching indicates below, switching levels in the O&R distribution territory are higher than in other territories. On September 23, 2005, the PSC determined that the pace of development of real-time pricing was insufficient to moderate the effects of rising fuel costs.408 To speed the development of real-time pricing, the PSC ordered that existing real-time pricing programs in some distribution territories be expanded to include all territories and that POLR service for large C&I customers be tied to real-time pricing. Services Open to Competition: Generation, metering and billing. Distribution companies were required to file unbundled metering tariffs and calculate a “backout” credit for customers who choose a different meter service provider. The PSC’s competitive metering and meter reading rules allow customers who choose a competitive supplier and customers who remain with the distribution utility to choose competitive metering services. Customers who choose competitive 406 New York Public Service Commission, Statement of Policy on Further Steps toward Competition in Retail Energy Markets (Aug. 25, 2004) (Case No. 00-M-0504). 407 New York Public Service Commission, Order Adopting ESCO Referral Program Guidelines and Approving an ESCO Referral Program Subject to Modifications (Dec. 22, 2005) (Case No. 05-M-0858, et al.); NYPSC comments at 17. 408 New York Public Service Commission, Order Instituting Further Proceedings and Requiring the Filing of Draft Tariffs (Sept. 23, 2005) (Case No. 03-E-0641).
157
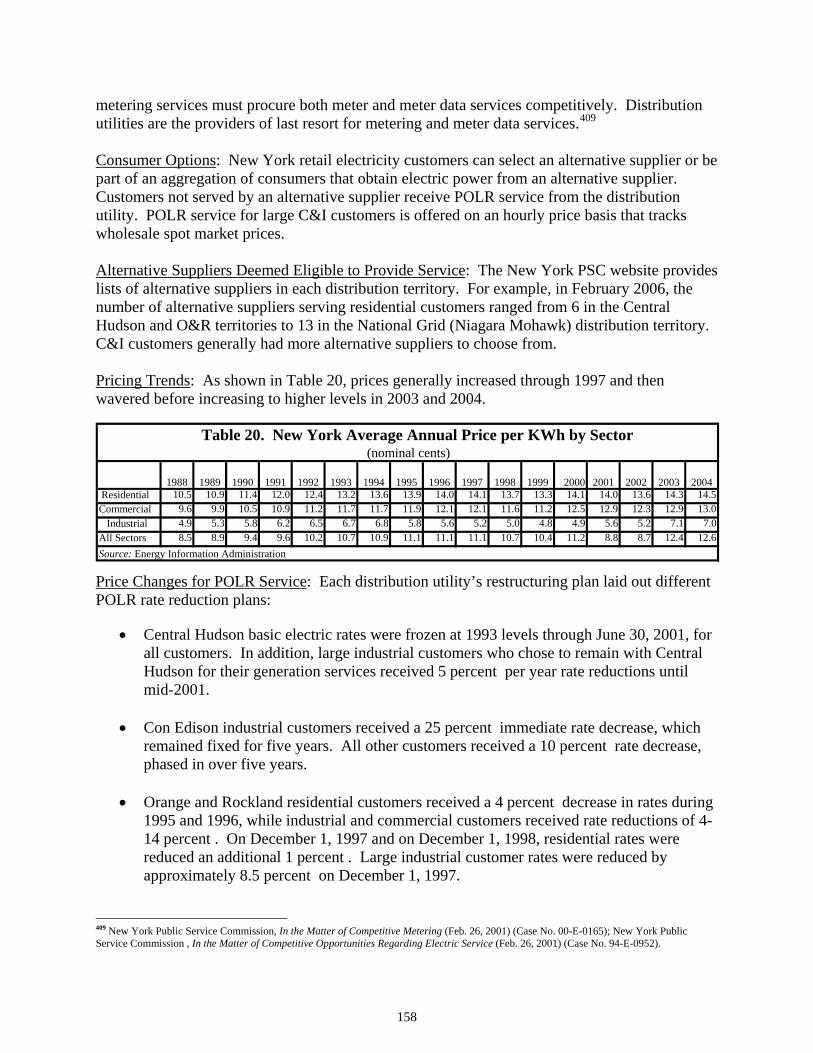
metering services must procure both meter and meter data services competitively. Distribution utilities are the providers of last resort for metering and meter data services.409
Consumer Options: New York retail electricity customers can select an alternative supplier or be part of an aggregation of consumers that obtain electric power from an alternative supplier. Customers not served by an alternative supplier receive POLR service from the distribution utility. POLR service for large C&I customers is offered on an hourly price basis that tracks wholesale spot market prices. Alternative Suppliers Deemed Eligible to Provide Service: The New York PSC website provides lists of alternative suppliers in each distribution territory. For example, in February 2006, the number of alternative suppliers serving residential customers ranged from 6 in the Central Hudson and O&R territories to 13 in the National Grid (Niagara Mohawk) distribution territory. C&I customers generally had more alternative suppliers to choose from. Pricing Trends: As shown in Table 20, prices generally increased through 1997 and then wavered before increasing to higher levels in 2003 and 2004.
Residential 10.5 10.9 11.4 12.0 12.4 13.2 13.6 13.9 14.0 14.1 13.7 13.3 14.1 14.0 13.6 14.3 14.5Commercial 9.6 9.9 10.5 10.9 11.2 11.7 11.7 11.9 12.1 12.1 11.6 11.2 12.5 12.9 12.3 12.9 13.0 Industrial 4.9 5.3 5.8 6.2 6.5 6.7 6.8 5.8 5.6 5.2 5.0 4.8 4.9 5.6 5.2 7.1 7.0All Sectors 8.5 8.9 9.4 9.6 10.2 10.7 10.9 11.1 11.1 11.1 10.7 10.4 11.2 8.8 8.7 12.4 12.6
2003 2004
Source: Energy Information Administration
1999 2000 2001 2002 1995 1996 1997 1998
Table 20. New York Average Annual Price per KWh by Sector (nominal cents)
1988 1989 1990 1991 1992 1993 1994
Price Changes for POLR Service: Each distribution utility’s restructuring plan laid out different POLR rate reduction plans:
• Central Hudson basic electric rates were frozen at 1993 levels through June 30, 2001, for all customers. In addition, large industrial customers who chose to remain with Central Hudson for their generation services received 5 percent per year rate reductions until mid-2001.
• Con Edison industrial customers received a 25 percent immediate rate decrease, which
remained fixed for five years. All other customers received a 10 percent rate decrease, phased in over five years.
• Orange and Rockland residential customers received a 4 percent decrease in rates during
1995 and 1996, while industrial and commercial customers received rate reductions of 4-14 percent . On December 1, 1997 and on December 1, 1998, residential rates were reduced an additional 1 percent . Large industrial customer rates were reduced by approximately 8.5 percent on December 1, 1997.
409 New York Public Service Commission, In the Matter of Competitive Metering (Feb. 26, 2001) (Case No. 00-E-0165); New York Public Service Commission , In the Matter of Competitive Opportunities Regarding Electric Service (Feb. 26, 2001) (Case No. 94-E-0952).
158

• Rochester Gas and Electric residential and small commercial customers received a 7.5 percent rate decrease. Other commercial and most industrial customers received an 8 percent decrease. Large industrial customers received an 11.2 percent decrease. All decreases are being phased in over 5 years.
• New York State Electric and Gas industrial and large commercial customers (greater than
500 kW capacity) received a 5 percent per year rate decrease, for five years. Residential and small commercial and industrial customers have had their rates frozen at current levels for two years, bills reduced 1 percent in the third year of the plan, and a total decrease of 5 percent by the fifth year of the plan. Industrial and commercial customers who are not eligible for the 5 percent decrease received financial incentives for load growth to encourage business expansion.
• National Grid (Niagara Mohawk) customers received an overall rate decrease of an
average of 4.3 percent . Residential and commercial customers were to have a 3.2 percent decrease phased in over three years. Industrial customers were to have decreases of approximately 13 percent . In addition, Niagara Mohawk rates for electricity and delivery were set until September 1, 2001. In 2001 and 2002, Niagara Mohawk was allowed to request limited rate increases for distribution services, and prices for some of the electricity sold to all customers will fluctuate with changes in market prices.
POLR Service Provider: The distribution companies provide regulated POLR service for customers who do not choose a competitive supplier or who return to POLR service.410
Recovery of Stranded Costs/Transition Costs: Distribution utilities recover stranded costs (net of proceeds from selling generation assets) through a non-bypassable distribution charge. Distribution utilities were required to use creative means to reduce the amount of stranded costs before they are considered for recovery. Stranded cost calculations and timing of recovery were determined on a case-by-case basis for each distribution utility.411
Switching Restrictions and Minimum Stay Requirements: The NY PSC is currently implementing a number of policies designed to encourage consumers to try alternative suppliers.412 One of these, known at “ESCO Referral Programs,” places limits on the ability of alternative suppliers to levy charges against departing customers.413 Switching Activity: The switching statistics for December 2005 in each distribution territory appear in the Table 21.
410 New York Public Service Commission, Opinion and Order Regarding Competitive Opportunities for Electric Service (May 20, 1996) (Opinion No. 96-12). 411 Id. 412 New York Public Service Commission, Staff Report on the State of Competitive Energy Markets: Progress to Date and Future Opportunities (Mar. 2, 2006) (Electric and Natural Gas Retail Markets sections I to III). 413 NYPSC comments at 18.
159
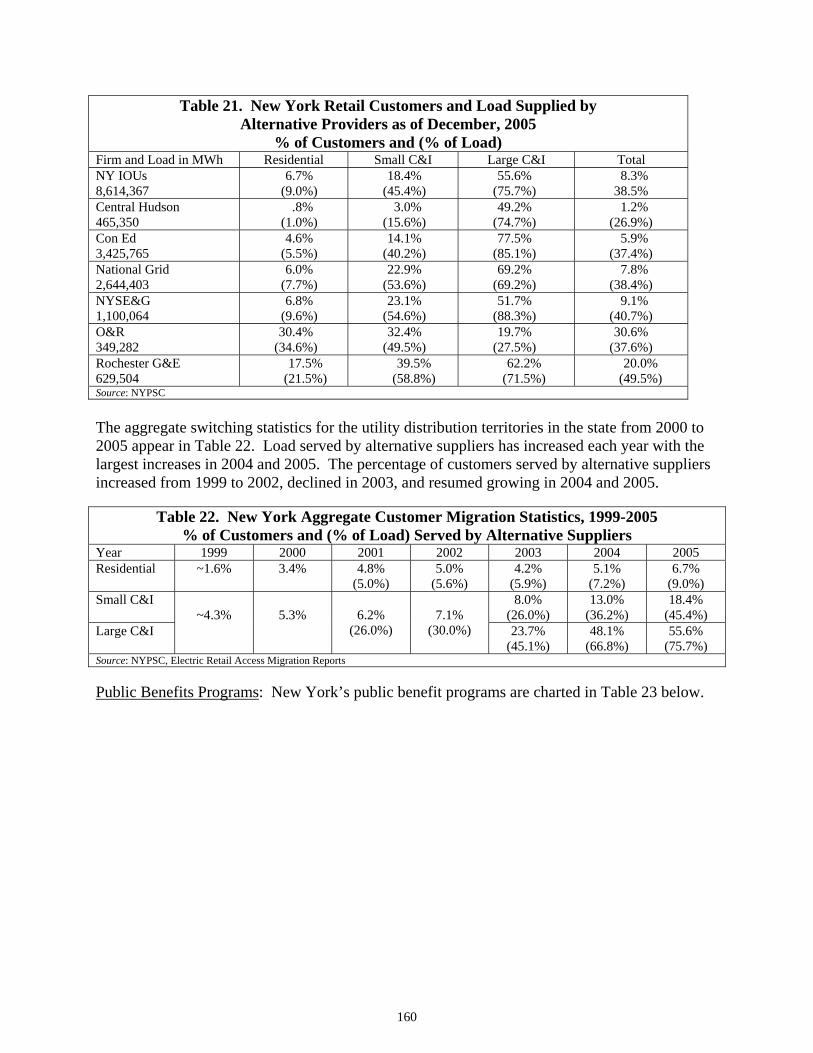
Table 21. New York Retail Customers and Load Supplied by Alternative Providers as of December, 2005
% of Customers and (% of Load) Firm and Load in MWh Residential Small C&I Large C&I Total NY IOUs 8,614,367
6.7% (9.0%)
18.4% (45.4%)
55.6% (75.7%)
8.3% 38.5%
Central Hudson 465,350
.8% (1.0%)
3.0% (15.6%)
49.2% (74.7%)
1.2% (26.9%)
Con Ed 3,425,765
4.6% (5.5%)
14.1% (40.2%)
77.5% (85.1%)
5.9% (37.4%)
National Grid 2,644,403
6.0% (7.7%)
22.9% (53.6%)
69.2% (69.2%)
7.8% (38.4%)
NYSE&G 1,100,064
6.8% (9.6%)
23.1% (54.6%)
51.7% (88.3%)
9.1% (40.7%)
O&R 349,282
30.4% (34.6%)
32.4% (49.5%)
19.7% (27.5%)
30.6% (37.6%)
Rochester G&E 629,504
17.5% (21.5%)
39.5% (58.8%)
62.2% (71.5%)
20.0% (49.5%)
Source: NYPSC
The aggregate switching statistics for the utility distribution territories in the state from 2000 to 2005 appear in Table 22. Load served by alternative suppliers has increased each year with the largest increases in 2004 and 2005. The percentage of customers served by alternative suppliers increased from 1999 to 2002, declined in 2003, and resumed growing in 2004 and 2005.
Table 22. New York Aggregate Customer Migration Statistics, 1999-2005 % of Customers and (% of Load) Served by Alternative Suppliers
Year 1999 2000 2001 2002 2003 2004 2005 Residential ~1.6% 3.4%
4.8%
(5.0%) 5.0%
(5.6%) 4.2%
(5.9%) 5.1%
(7.2%) 6.7%
(9.0%) Small C&I 8.0%
(26.0%) 13.0%
(36.2%) 18.4%
(45.4%) Large C&I
~4.3%
5.3%
6.2%
(26.0%)
7.1%
(30.0%) 23.7% (45.1%)
48.1% (66.8%)
55.6% (75.7%)
Source: NYPSC, Electric Retail Access Migration Reports Public Benefits Programs: New York’s public benefit programs are charted in Table 23 below.
160

Table 23. New York Public Benefits Programs Research &
Development Energy
Efficiency Low
Income Renewable
Energy Total
Million $ 26.0 87.0 22.0 150.0 Mills/kWh 0.26 0.83 0.21 1.42 % revenue 0.20% 0.69% 0.17% 1.18%Admin. NYSERDA NYSERDA NYSERDA
In May95, the PSC issued Order 96-12 requiring all IOUs to file restructuring plans. A July98 Order set $78 million/year for an SBC, administered by NYSERDA. In Jan01 the PSC raised the SBC to $150 million/yr and extended it for 5 years. (Table shows allocation minus 10% held open.) R&D incl. $14 million/yr for RE. Table does not include $100 million/yr EE by Power Authorities
Notes: The administrator is the New York State Energy Research and Development Authority, supervised by the PSC. On December 14, 2005, the PSC ordered that the System Benefit Charge be increased to $175 M annually and that the program be extended for five years. NYPSC, System Benefits Charge (Mar. 2, 2006), available at http://www.dps.state.ny.us/SBCIII_Amended_Plan_3-2-06.pdf. Source: American Council for an Energy-Efficient Economy, Summary Table of Public Benefit Programs and Electric Utility Restructuring (December 2005) available at http://www.aceee.org/briefs/mktabl.htm.
Separation of Generation and Transmission: The PSC encouraged total divestiture of generation, and it instructed distribution utilities to separate generation and energy service functions from transmission and distribution systems.414 Each distribution utility company’s restructuring agreement established different requirements for separation of generation and transmission.415
State RTO Involvement: New York distribution utilities belong to the New York ISO, formed in 1998. The New York ISO exercises operational control over most of New York’s transmission systems, administers the ISO transmission tariff, and operates the New York Open Access Same Time Information System (OASIS).416
Generation Capability:417 Prior to the restructuring regulations, utilities in New York operated 84.3 percent of the generation capability in the state. By 2002, that figure dropped to 32.4 percent. The difference reflected mandatory divestitures of generation to independent generation firms and entry or expansion of independent power producers. Between 1997 and 2002,
414 New York Public Service Commission , Opinion and Order Regarding Competitive Opportunities for Electric Service (May 20, 1996) (Opinion No. 96-12). 415 New York Public Service Commission , PSC Rate and Restructuring Plan Fact Sheets, available at www.dps.state.ny.us/energyarch.htm#facts. 416 New York Independent System Operator, Inc., Frequently Asked Questions, available at www.nyiso.com/public/services/customer_relations/faqs/index.jsp. 417 U.S. Department of Energy, Energy Information Administration, New York State Profile, Table 4, available at http://www.eia.doe.gov/cneaf/electricity/st_profiles/new_york.pdf.
161
generation capability in the state increased from 35,576 MWs to 36,041 MWs. In the previous 5-year period, generation capability had decreased. Dual fueled generation increased as a proportion of generation from 34.1 percent to 39.5 percent. Use of Customer Information: Historical customer data will be provided by distribution companies to customers or their authorized designees. All historical data that a competitive supplier receives from the distribution company must be kept confidential, unless authorized for release by the customer. A distribution company cannot disclose customer information to competitive suppliers if the customer has notified the distribution company in writing that he does not authorize release. Thereafter, customer information can only be released to a competitive supplier with the customer’s written authorization.418
Standardized Labeling:419 On December 15, 1998, the New York Public Service Commission (PSC) issued an order requiring electric suppliers to use a standardized label to provide information to customers regarding the environmental impacts of electricity products semi-annually. Suppliers must disclose fuel mix compared to a statewide average and emissions of sulfur dioxide, nitrogen oxides, and carbon dioxide. Fuel source and emissions information are calculated by the Department of Public Service (DPS) and provided to retail suppliers quarterly. Calculations are based on a rolling annual average with data supplied from the Independent System Operator and the EIA and verified by the DPS. The most recent reports of each load serving entity (2004) are available at http://www3.dps.state.ny.us/e/energylabel.nsf/ViewCat?ReadForm&View=LabelInfo&Cat=January+2004+-+December+2004&Count=80. Renewable Energy Portfolio Standard: The New York PSC adopted a renewable energy portfolio standard on September 24, 2004. The policy calls for an increase in renewable energy used in the state from the then current level of 19 percent (mostly hydro) to 25 percent by 2013. Pennsylvania: Overview of Retail Competition Plan and Market Response Administrator and Start Date: The Electricity Generation Customer Choice and Competition Act was enacted on December 3, 1996. The Pennsylvania Electric Choice Pilot Program began in the fall of 1997, with 230,000 customers participating. These customers were able to begin shopping for their electric generation supplier beginning September 1, 1998. By January 2, 2000, electric choice was fully implemented in nearly all of Pennsylvania.420 Retail competition is administered by the Pennsylvania Public Utility Commission (PUC). Services Open to Competition: Generation. Generally the distribution company provides metering and billing services, although there are some areas in Pennsylvania in which the
418 New York Public Service Commission , Uniform Retail Access Business Practices, Appendix A, Customer Information (Apr. 14, 1999), at www.dps.state.ny.us/doc5743_appendix_a.pdf (Case No. 98-M-1343). For information on the acceptance of uniform retail access business practices in New York, see www.dps.state.ny.us/ubr.htm. 419 U.S. Department of Energy, Energy Information Administration, Disclosure Policies, available at http://www.eere.energy.gov/greenpower/markets/disclosure.shtml?print. 420 Pennsylvania Public Utility Commission, Pennsylvania Electric Choice, Q&A, available at http://www.puc.state.pa.us/utilitychoice.
162
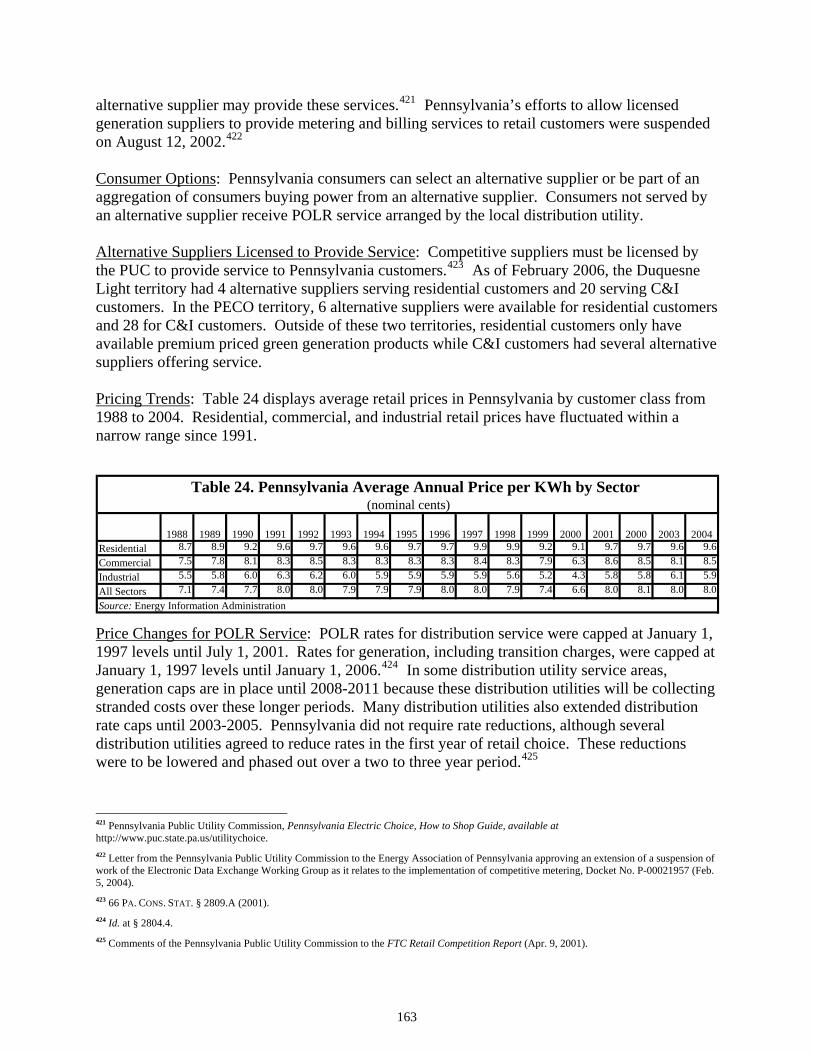
alternative supplier may provide these services.421 Pennsylvania’s efforts to allow licensed generation suppliers to provide metering and billing services to retail customers were suspended on August 12, 2002.422
Consumer Options: Pennsylvania consumers can select an alternative supplier or be part of an aggregation of consumers buying power from an alternative supplier. Consumers not served by an alternative supplier receive POLR service arranged by the local distribution utility. Alternative Suppliers Licensed to Provide Service: Competitive suppliers must be licensed by the PUC to provide service to Pennsylvania customers.423 As of February 2006, the Duquesne Light territory had 4 alternative suppliers serving residential customers and 20 serving C&I customers. In the PECO territory, 6 alternative suppliers were available for residential customers and 28 for C&I customers. Outside of these two territories, residential customers only have available premium priced green generation products while C&I customers had several alternative suppliers offering service. Pricing Trends: Table 24 displays average retail prices in Pennsylvania by customer class from 1988 to 2004. Residential, commercial, and industrial retail prices have fluctuated within a narrow range since 1991.
Residential 8.7 8.9 9.2 9.6 9.7 9.6 9.6 9.7 9.7 9.9 9.9 9.2 9.1 9.7 9.7 9.6 9.6Commercial 7.5 7.8 8.1 8.3 8.5 8.3 8.3 8.3 8.3 8.4 8.3 7.9 6.3 8.6 8.5 8.1 8.5Industrial 5.5 5.8 6.0 6.3 6.2 6.0 5.9 5.9 5.9 5.9 5.6 5.2 4.3 5.8 5.8 6.1 5.9All Sectors 7.1 7.4 7.7 8.0 8.0 7.9 7.9 7.9 8.0 8.0 7.9 7.4 6.6 8.0 8.1 8.0 8.0
2003 2004
Source: Energy Information Administration
1999 2000 2001 2000 1995 1996 1997 1998
Table 24. Pennsylvania Average Annual Price per KWh by Sector (nominal cents)
1988 1989 1990 1991 1992 1993 1994
Price Changes for POLR Service: POLR rates for distribution service were capped at January 1, 1997 levels until July 1, 2001. Rates for generation, including transition charges, were capped at January 1, 1997 levels until January 1, 2006.424 In some distribution utility service areas, generation caps are in place until 2008-2011 because these distribution utilities will be collecting stranded costs over these longer periods. Many distribution utilities also extended distribution rate caps until 2003-2005. Pennsylvania did not require rate reductions, although several distribution utilities agreed to reduce rates in the first year of retail choice. These reductions were to be lowered and phased out over a two to three year period.425
421 Pennsylvania Public Utility Commission, Pennsylvania Electric Choice, How to Shop Guide, available at http://www.puc.state.pa.us/utilitychoice. 422 Letter from the Pennsylvania Public Utility Commission to the Energy Association of Pennsylvania approving an extension of a suspension of work of the Electronic Data Exchange Working Group as it relates to the implementation of competitive metering, Docket No. P-00021957 (Feb. 5, 2004). 423 66 PA. CONS. STAT. § 2809.A (2001). 424 Id. at § 2804.4. 425 Comments of the Pennsylvania Public Utility Commission to the FTC Retail Competition Report (Apr. 9, 2001).
163

Overall rate reductions, Table 25 for the first year ranged from 2.5 percent to 8 percent for the major utilities operating in Pennsylvania:426
Table 25. First Year Rate Reductions by Distribution
Utility Distribution Utility First Year Rate Reductions APS 2.5% MetEd 2.5% PECO 8.0% Penelec 3.0% PPL 4.0% Shopping credit rates are the rates that a customer pays for generation if he receives generation service from the utility rather than from a competitive supplier. Shopping credit rates increased over time, but fuel cost increases have been greater and the base rates are not adjusted under the Pennsylvania settlements with distribution utilities. This has resulted in the declining market shares for alternative suppliers and the exit of alternative suppliers. POLR Service Provider: The distribution company provides POLR service for customers who do not choose a competitive supplier, for those who are unable to obtain service from a competitive supplier, or for customers whose suppliers do not deliver service. Distribution utilities must offer standard offer service as long as the distribution utility is collecting transition charges or until 100 percent of its customers have electric choice.427 In June 2000, the PUC issued a change in the provision of POLR service, in order to prevent “gaming” of the system by customers who were returning to their distribution utility. During the summer, market prices rose, while POLR rates remained stable, below market rates. This caused customers to be either returned to POLR service by their suppliers or to return themselves to POLR service. Many distribution utilities require customers to remain with the distribution utility for a 12-month period after switching back to the POLR provider. Competitive POLR Service: Some distribution utilities have arranged for competitive bidding to supply the generation services portion of POLR service for customers who do not affirmatively choose an alternative supplier. This option is known as Competitive Default Service (CDS). The PUC approved additional consumer protections for the initial phase-in of CDS, including bidder qualifications, established creditworthiness, and bond limits. The PUC also reviewed the CDS annually to ensure that it is still benefited consumers.428 The largest CDS effort took place in the PECO territory. PECO awarded a contract for 20 percent of its POLR service customers to The New Power Company. Additionally, 50,000 PECO customers were assigned to Green Mountain Energy, Inc. PECO customers assigned to the CDS provider received a two-percent discount on the shopping credit (the capped generation service rate). The CDS provider also provided no less than two percent of its supply from renewable resources and increased the use of renewable resources by one-half of a percent annually.429 Due to concerns that POLR prices 426 Ahmed Kaloko (Chief Economist, Pennsylvania Public Utility Commission), Power 99–California & Pennsylvania Retail Market Development. 427 66 PA. CONS. STAT. § 2807.E (2001). 428 Id. 429 Id.
164

were insufficient to cover procurement costs, the CDS suppliers withdrew from this service. No alternative suppliers have been willing to supply on these terms at present. On December 10, 2005, the PUC decided to reopen POLR service issues for comment in preparation for the end of the transition period in distribution areas in addition to Duquesne.430
Recovery of Stranded Costs/Transition Costs: Stranded costs have been administratively determined by the PUC on a case-by-case basis. Utilities were not required to establish market-based valuation by selling generation assets. Stranded costs are fully recoverable through a non-bypassable charge to all consumers, collectible for up to nine years, unless the PUC orders an alternative payment period.431 Table 26 shows each utility’s allowable stranded costs recovery and the seven to 10 year recovery periods to collect there costs from customers.
Table 26. Transition/Stranded Costs: Company Allowable Stranded Cost Recovery Length of Recovery Allegheny Power $670 million 10 years Duquesne Light $1,331 million 7 years GPU Energy (Met Ed.) $975 million 10 years GPU Energy (Penelec) $858 million 8 years PECO $5,024 million 8 ½ years Pennsylvania Power and Light $2,864 million 9 years Pennsylvania Power Company $234 million 9 years UGI Utilities $32.5 million West Penn Power Company $524 million 7 years Source: Company Restructuring Orders and Tables
Switching Restrictions and Minimum Stay Requirements: Customers can switch suppliers at any time, although they are advised to check their supply agreement for any penalties which may apply for early termination of a supply contract. If a customer leaves POLR service and then returns, some POLR service providers require a minimum stay of 12 months.432
Switching Activity: At this point in time, retail switching activities are largely limited to the Duquesne Light distribution territory and to a lesser degree the PECO territory, as shown in Table 27.
Table 27. Pennsylvania Retail Customers and Load Supplied by Alternative Providers as of January 1, 2006
% of Customers and (% of Load) Firm and Load in MWh Residential Small C&I Large C&I Total Allegheny Power 0.0%
(0.0%) 0.0%
(0.0%) 0.0%
(0.0%) 0.0%
(0.0%)
430 The order is available at http://www.puc.state.pa.us/PcDocs/578097.doc. 431 66 PA. CONS. STAT. § 2808.A, B (2001). 432 Pennsylvania Public Utility Commission, Electric Choice Frequently Asked Questions (Are there any penalties for changing suppliers?), available at http://www.puc.state.pa.us/utilitychoice/faq.aspx?ut=ec#4.
165
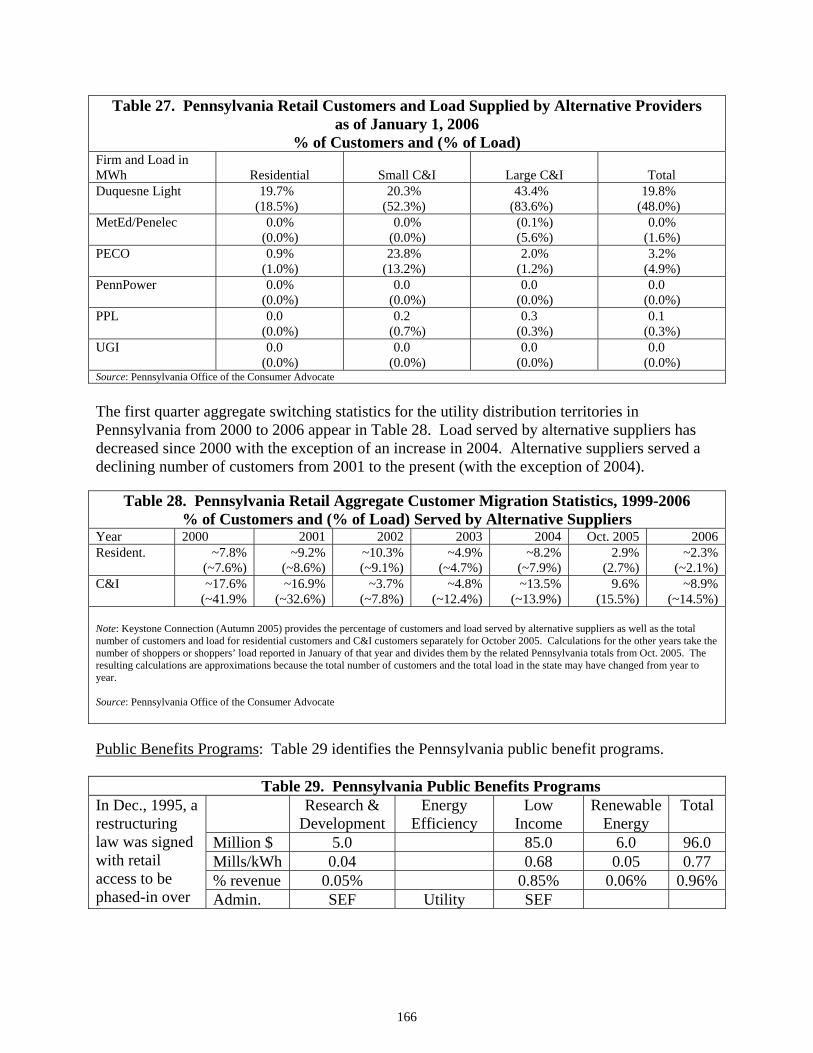
Table 27. Pennsylvania Retail Customers and Load Supplied by Alternative Providers as of January 1, 2006
% of Customers and (% of Load) Firm and Load in MWh Residential Small C&I Large C&I Total Duquesne Light
19.7% (18.5%)
20.3% (52.3%)
43.4% (83.6%)
19.8% (48.0%)
MetEd/Penelec 0.0% (0.0%)
0.0% (0.0%)
(0.1%) (5.6%)
0.0% (1.6%)
PECO 0.9% (1.0%)
23.8% (13.2%)
2.0% (1.2%)
3.2% (4.9%)
PennPower 0.0% (0.0%)
0.0 (0.0%)
0.0 (0.0%)
0.0 (0.0%)
PPL 0.0 (0.0%)
0.2 (0.7%)
0.3 (0.3%)
0.1 (0.3%)
UGI 0.0 (0.0%)
0.0 (0.0%)
0.0 (0.0%)
0.0 (0.0%)
Source: Pennsylvania Office of the Consumer Advocate
The first quarter aggregate switching statistics for the utility distribution territories in Pennsylvania from 2000 to 2006 appear in Table 28. Load served by alternative suppliers has decreased since 2000 with the exception of an increase in 2004. Alternative suppliers served a declining number of customers from 2001 to the present (with the exception of 2004).
Table 28. Pennsylvania Retail Aggregate Customer Migration Statistics, 1999-2006 % of Customers and (% of Load) Served by Alternative Suppliers
Year 2000 2001 2002 2003 2004 Oct. 2005 2006 Resident. ~7.8%
(~7.6%) ~9.2%
(~8.6%) ~10.3% (~9.1%)
~4.9% (~4.7%)
~8.2% (~7.9%)
2.9% (2.7%)
~2.3% (~2.1%)
C&I ~17.6% (~41.9%
~16.9% (~32.6%)
~3.7% (~7.8%)
~4.8% (~12.4%)
~13.5% (~13.9%)
9.6% (15.5%)
~8.9% (~14.5%)
Note: Keystone Connection (Autumn 2005) provides the percentage of customers and load served by alternative suppliers as well as the total number of customers and load for residential customers and C&I customers separately for October 2005. Calculations for the other years take the number of shoppers or shoppers’ load reported in January of that year and divides them by the related Pennsylvania totals from Oct. 2005. The resulting calculations are approximations because the total number of customers and the total load in the state may have changed from year to year. Source: Pennsylvania Office of the Consumer Advocate Public Benefits Programs: Table 29 identifies the Pennsylvania public benefit programs.
Table 29. Pennsylvania Public Benefits Programs Research &
Development Energy
Efficiency Low
Income Renewable
Energy Total
Million $ 5.0 85.0 6.0 96.0 Mills/kWh 0.04 0.68 0.05 0.77 % revenue 0.05% 0.85% 0.06% 0.96%
In Dec., 1995, a restructuring law was signed with retail access to be phased-in over Admin. SEF Utility SEF
166
2 yrs starting in Jan99. The restructuring law resulted in PUC-approved restructuring settlement agreements for each electric company. Each settlement agreement created a system benefits fund for LI programs and a Sustainable Energy Fund (except for Duquesne).
Note: Administrators are Sustainable Energy Funds in each area of the state. Source: American Council for an Energy-Efficient Economy, Summary Table of Public Benefit Programs and Electric Utility Restructuring (December 2005) available at http://www.aceee.org/briefs/mktabl.htm.
Separation of Generation and Transmission: Generation must be separated from transmission and distribution, but distribution utilities are not required to divest facilities or reorganize corporate structure.433 However, several utilities voluntarily divested generation assets either to independent companies or to unregulated affiliates. State RTO Involvement: The restructuring legislation directs the PUC to encourage interstate power pools to enhance competition and to complement restructuring. Much of Pennsylvania belongs to the PJM RTO. In order to meet electric load in the PJM region, PJM coordinates with member companies and uses bilateral contracts and the spot market to secure power.434 In March 2001, Allegheny Power and PJM filed with FERC a request to expand PJM by forming PJM-West.435
Generation Capability:436 Prior to the restructuring legislation, utilities in Pennsylvania operated 92.3 percent of generation capability in the state. By 2002, that figure dropped to 12.3 percent, despite the lack of a requirement for generation divestitures or transfers. The difference reflected voluntary divestitures to independent generators and transfers of generation to affiliates as well as expansion and entry of independent power producers. Between 1997 and 2002, generation capability in the state increase from 36,650 MWs to 39,783 MWs. Most of increase consisted of dual fueled generation. 433 66 PA. CONS. STAT. § 2804.5 (2001). 434 Pennsylvania Public Utility Commission, Bureau of Conservation, Economics, and Energy Planning, Electric Power Outlook for Pennsylvania:1999-2004 (July 2000). 435 Press Release, PJM Interconnection, LLC, Allegheny Power and PJM File with FERC to Create PJM West (Mar. 15, 2001), available at www.pjm.com/contributions/news-releases/2001/20010315-ap-pjm-file-with-ferc.pdf. 436 U.S. Department of Energy, Energy Information Administration, Pennsylvania State Profile, Table 4, available at http://www.eia.doe.gov/cneaf/electricity/st_profiles/pennsylvania.pdf.
167

Use of Customer Information: A customer can restrict the disclosure of his telephone number and his historical billing data. A distribution utility or supplier who intends to supply a third-party with this information must provide a customer with the means of restricting the release of this information, either through a signed form, orally, or electronically.437 Customer information cannot be given preferentially by a distribution utility to its affiliate.438 During the initial phase -in period of electric restructuring, a customer’s name, address, telephone number, rate class, account number and load data were given to competitive suppliers as a result of the customer’s enrollment into the electric choice program. The customer had the option of restricting the release of his telephone number and load data to suppliers. After this initial phase-in period, to assure that customers retain the ability to restrict disclosure of certain information to suppliers, the PUC directed distribution utilities to send forms to customers to give them the opportunity to restrict the release of load data, or of all information (name, address, rate class, and account number). Telephone numbers would not be released to suppliers under any circumstances.439
Standardized Labeling:440 The Pennsylvania Public Utility Commission (PUC) issued final rules in April 1998 requiring retail electricity suppliers to "respond to reasonable requests made by consumers for information concerning generation energy sources." Suppliers must respond to such requests "by informing consumers that this information is included in the annual licensing report and that this report exists at the Commission." Requests for information on energy efficiency must be handled in a similar manner. Suppliers must verify fuel mix data through an independent auditor and submit this information in an annual report to the Commission. Suppliers that market electricity as "having special characteristics" such as being environmentally friendly, must have information available to substantiate their claims. Renewable Energy: Pennsylvania enacted a renewable portfolio standard through Act 213 in December 2004. The standard includes a gradual increase in generation from renewables to 18 percent over 15 years. Qualified renewables are divided into two groups: traditional (solar, wind, hydro, geothermal, biomass, and coal-mine methane) and other (waste coal, distributed generation, demand-side management, large-scale hydro, municipal waste, wood processing waste, and integrated combined coal gasification). Separate standards are set for the two groups– -8 percent and 10 percent respectively. Texas: Overview of Retail Competition Plan and Market Response Administrator and Start Date: The Texas restructuring bill was signed June 18, 1999. The Public Utility Commission of Texas (PUC) administers the transition to retail competition, which began with a pilot program on June 1, 2001. Retail competition for all customer classes within ERCOT began January 1, 2002.441 Competition is not open as yet in areas outside of ERCOT
437 52 PA. CONST. STAT. § 54.8 (2001). 438 Id. at § 54.122.2. 439 Comments of the Pennsylvania Utility Commission to the FTC Retail Competition Report (Apr. 9, 2001). 440 U.S. Department of Energy, Energy Information Administration, Disclosure Policies, available at http://www.eere.energy.gov/greenpower/markets/disclosure.shtml?print. 441 TEX. UTIL. CODE ANN. § 39.102 (2001).
168
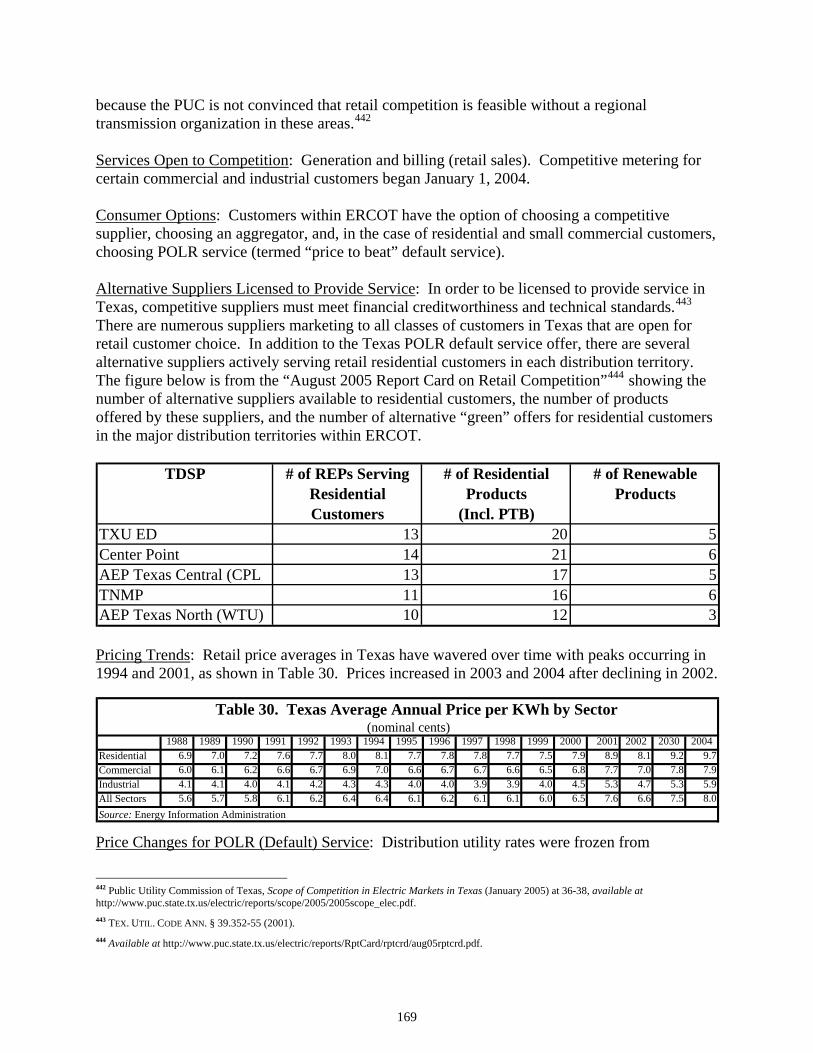
because the PUC is not convinced that retail competition is feasible without a regional transmission organization in these areas.442 Services Open to Competition: Generation and billing (retail sales). Competitive metering for certain commercial and industrial customers began January 1, 2004. Consumer Options: Customers within ERCOT have the option of choosing a competitive supplier, choosing an aggregator, and, in the case of residential and small commercial customers, choosing POLR service (termed “price to beat” default service). Alternative Suppliers Licensed to Provide Service: In order to be licensed to provide service in Texas, competitive suppliers must meet financial creditworthiness and technical standards.443 There are numerous suppliers marketing to all classes of customers in Texas that are open for retail customer choice. In addition to the Texas POLR default service offer, there are several alternative suppliers actively serving retail residential customers in each distribution territory. The figure below is from the “August 2005 Report Card on Retail Competition”444 showing the number of alternative suppliers available to residential customers, the number of products offered by these suppliers, and the number of alternative “green” offers for residential customers in the major distribution territories within ERCOT.
TDSP # of REPs Serving Residential Customers
# of Residential Products
(Incl. PTB)
# of Renewable Products
TXU ED 13 20 5Center Point 14 21 6AEP Texas Central (CPL 13 17 5TNMP 11 16 6AEP Texas North (WTU) 10 12 3 Pricing Trends: Retail price averages in Texas have wavered over time with peaks occurring in 1994 and 2001, as shown in Table 30. Prices increased in 2003 and 2004 after declining in 2002.
1988 1989 1990 1991 1992 1993 1994 1995 1996 1997 1998 1999 2000 2001 2002 2030 2004Residential 6.9 7.0 7.2 7.6 7.7 8.0 8.1 7.7 7.8 7.8 7.7 7.5 7.9 8.9 8.1 9.2 9.7Commercial 6.0 6.1 6.2 6.6 6.7 6.9 7.0 6.6 6.7 6.7 6.6 6.5 6.8 7.7 7.0 7.8 7.9Industrial 4.1 4.1 4.0 4.1 4.2 4.3 4.3 4.0 4.0 3.9 3.9 4.0 4.5 5.3 4.7 5.3 5.9All Sectors 5.6 5.7 5.8 6.1 6.2 6.4 6.4 6.1 6.2 6.1 6.1 6.0 6.5 7.6 6.6 7.5 8.0Source: Energy Information Administration
Table 30. Texas Average Annual Price per KWh by Sector (nominal cents)
Price Changes for POLR (Default) Service: Distribution utility rates were frozen from
442 Public Utility Commission of Texas, Scope of Competition in Electric Markets in Texas (January 2005) at 36-38, available at http://www.puc.state.tx.us/electric/reports/scope/2005/2005scope_elec.pdf. 443 TEX. UTIL. CODE ANN. § 39.352-55 (2001). 444 Available at http://www.puc.state.tx.us/electric/reports/RptCard/rptcrd/aug05rptcrd.pdf.
169

September 1, 1999, levels until January 1, 2002.445 On January 1, 2002, rates for residential and small commercial customers were reduced approximately 6 percent from January 1, 1999, levels. The January 1, 2002, reduced rate is called the “price to beat.”446 It is subject to adjustment twice per year, to reflect changes in fuel costs. Because Texas primarily relies on natural gas fueled generation, the increases in natural gas prices have resulted in substantial increases in the “price to beat.” POLR (default) service is available from the distribution utility’s competitive retail affiliate until January 1, 2007. Prior to January 1, 2005, affiliates of distribution utilities could offer services other than POLR (default) service only if at least 40 percent of residential or small commercial customers chose a competitive supplier not affiliated with the local distribution utility. Since January 1, 2005, affiliates of distribution utilities have been allowed to offer any service they wish in addition to POLR (default) service. The Texas PUC provides information on the price to beat and on alternative supplier’s prices in each distribution territory. The information includes a comparison of each alternative supplier’s price to the POLR (default) price for different levels of consumption. Table 31 shows the POLR (default) price and the range of offers from alternative suppliers for a consumer using 1000 kWh or 2000 kWh. The premium price is generally for a 100 percent wind generation product.
Table 31. Texas POLR Service Price Compared to Alternative Suppliers 1000 kWh Consumption (January 2006)
POLR Price (cents/kWh)
For 1000 kWh
Lowest Alternative % discount
Highest Alternative % premium
POLR Price (cents/kWh)
For 2000 kWh
Lowest Alternative % discount
Highest Alternative % premium
West Texas Utilities
19.06 19% 4% 18.95
TXU-SESCO 14.62 8% 10% 13.97 11% 8% Texas-NM Power
14.48 8% 10% 14.77 11% 6%
Central Power
17.67 18% 6% 17.48 20% 6%
Centerpoint Energy
16.04 15% 9% 15.89 17% 8%
Source: Texas PUC, Retail Electric Service Rate Comparisons (January 2006 bill comparison)
The PUC also has produced an aggregate comparison between the price to beat, the average offer of alternative suppliers, and the lowest offer of alternative suppliers. The figure below, from the PUC report to the 79th Texas Legislature, illustrates these comparisons.447
445 Tex. Util. Code Ann. at § 39.052. 446 Id. at § 39.202. 447 Public Utility Commission of Texas, Scope of Competition in Electric Markets in Texas (January 2005), available at http://www.puc.state.tx.us/electric/reports/scope/2005/2005scope_elec.pdf.
170
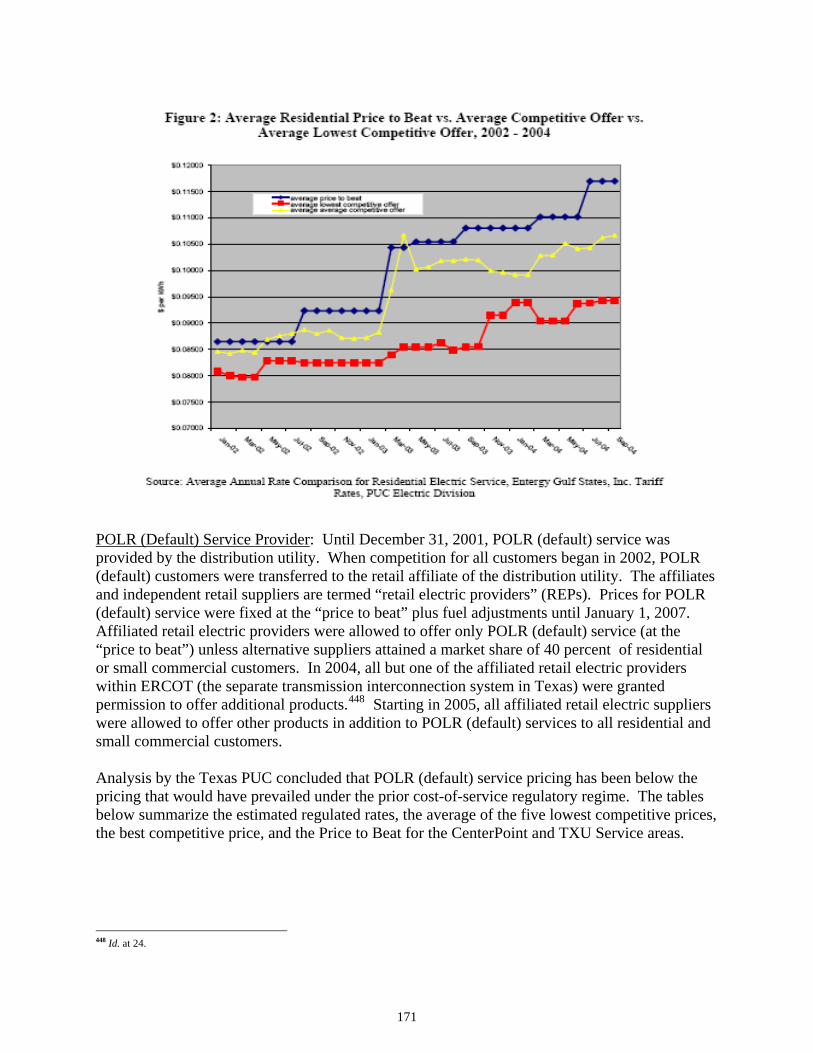
POLR (Default) Service Provider: Until December 31, 2001, POLR (default) service was provided by the distribution utility. When competition for all customers began in 2002, POLR (default) customers were transferred to the retail affiliate of the distribution utility. The affiliates and independent retail suppliers are termed “retail electric providers” (REPs). Prices for POLR (default) service were fixed at the “price to beat” plus fuel adjustments until January 1, 2007. Affiliated retail electric providers were allowed to offer only POLR (default) service (at the “price to beat”) unless alternative suppliers attained a market share of 40 percent of residential or small commercial customers. In 2004, all but one of the affiliated retail electric providers within ERCOT (the separate transmission interconnection system in Texas) were granted permission to offer additional products.448 Starting in 2005, all affiliated retail electric suppliers were allowed to offer other products in addition to POLR (default) services to all residential and small commercial customers. Analysis by the Texas PUC concluded that POLR (default) service pricing has been below the pricing that would have prevailed under the prior cost-of-service regulatory regime. The tables below summarize the estimated regulated rates, the average of the five lowest competitive prices, the best competitive price, and the Price to Beat for the CenterPoint and TXU Service areas.
448 Id. at 24.
171
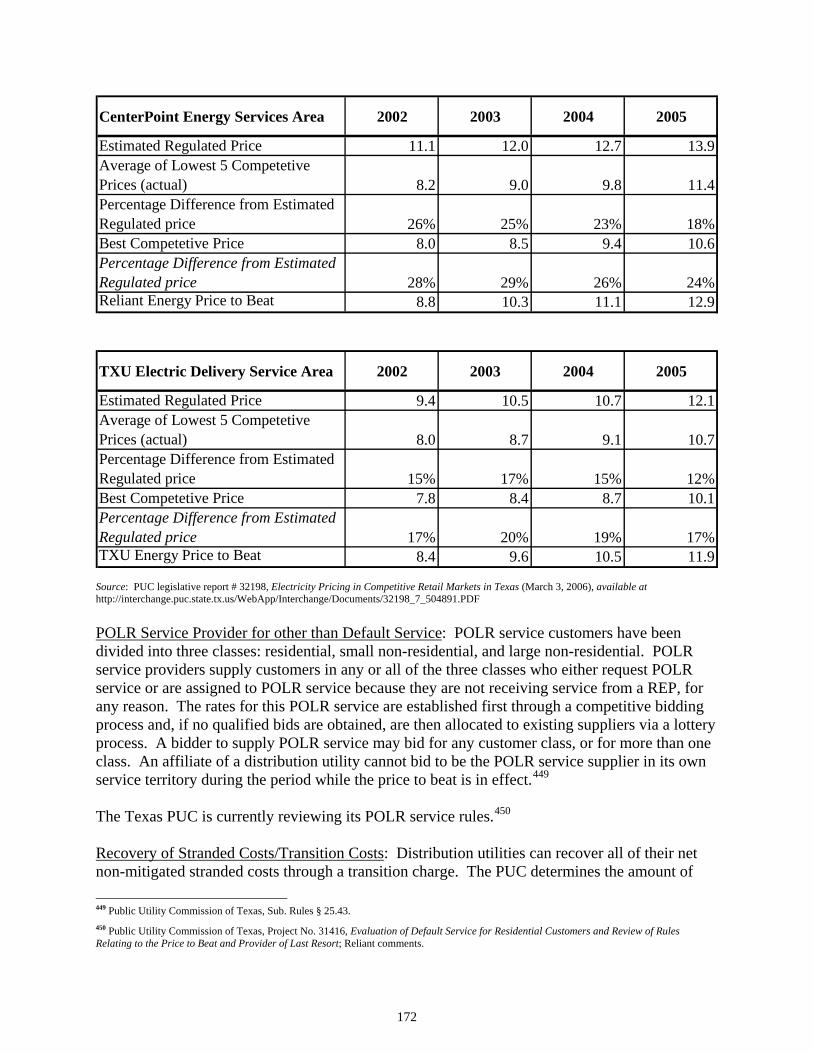
CenterPoint Energy Services Area 2002 2003 2004 2005
Estimated Regulated Price 11.1 12.0 12.7 1Average of Lowest 5 Competetive Prices (actual) 8.2 9.0 9.8 11.4Percentage Difference from Estimated Regulated price 26% 25% 23% 18%Best Competetive Price 8.0 8.5 9.4 10.6Percentage Difference from Estimated Regulated price 28% 29% 26% 24%Reliant Energy Price to Beat 8.8 10.3 11.1 1
3.9
2.9
TXU Electric Delivery Service Area 2002 2003 2004 2005
Estimated Regulated Price 9.4 10.5 10.7 1Average of Lowest 5 Competetive Prices (actual) 8.0 8.7 9.1 10.7Percentage Difference from Estimated Regulated price 15% 17% 15% 12%Best Competetive Price 7.8 8.4 8.7 10.1Percentage Difference from Estimated Regulated price 17% 20% 19% 17%TXU Energy Price to Beat 8.4 9.6 10.5 11.9
2.1
Source: PUC legislative report # 32198, Electricity Pricing in Competitive Retail Markets in Texas (March 3, 2006), available at http://interchange.puc.state.tx.us/WebApp/Interchange/Documents/32198_7_504891.PDF POLR Service Provider for other than Default Service: POLR service customers have been divided into three classes: residential, small non-residential, and large non-residential. POLR service providers supply customers in any or all of the three classes who either request POLR service or are assigned to POLR service because they are not receiving service from a REP, for any reason. The rates for this POLR service are established first through a competitive bidding process and, if no qualified bids are obtained, are then allocated to existing suppliers via a lottery process. A bidder to supply POLR service may bid for any customer class, or for more than one class. An affiliate of a distribution utility cannot bid to be the POLR service supplier in its own service territory during the period while the price to beat is in effect.449
The Texas PUC is currently reviewing its POLR service rules.450
Recovery of Stranded Costs/Transition Costs: Distribution utilities can recover all of their net non-mitigated stranded costs through a transition charge. The PUC determines the amount of 449 Public Utility Commission of Texas, Sub. Rules § 25.43. 450 Public Utility Commission of Texas, Project No. 31416, Evaluation of Default Service for Residential Customers and Review of Rules Relating to the Price to Beat and Provider of Last Resort; Reliant comments.
172

stranded costs eligible for recovery, which includes uneconomic generation related assets, and purchased power contracts. Switching Restrictions and Minimum Stay Requirements Process: A customer can switch suppliers at any time subject to the terms of his contract with the competitive supplier. There are no switching fees unless a customer requests a special meter reading.451
Switching Activity: Retail customers have been migrating to alternative suppliers in all of the distribution territories with the highest switching rates in the AEP Central and North areas, as shown in Table 32.
Table 32: Retail Customers and Load Supplied by Alternative Providers as of January 1, 2006
% of Customers and (% of Load) Firm and Load in MWh Residential Small C&I Total TXU 26.3%
(26.2%) 30.7%
(64.7%) 26.4%
(50.4%) Centerpoint 26.8%
(27.3%) 34.5%
(60.7%) 27.5%
(47.8%) AEP Texas Central 27.0%
(31.3%) 45.8%
(81.4%) 29.4%
(63.8%) AEP Texas North 33.2%
(39.3%) 34.0%
(78.7%) 31.9%
(64.9%) Texas NM Power 25.8%
(29.9%) 35.0%
(66.8%) 26.4%
(56.0%) Note: Texas does not provide separate distribution area statistics for large C&I customers. Source: Texas Public Utility Commission Retail customers have switched to alternative suppliers in increasing numbers and with an increasing proportion of load, as shown in Table 33.
Table 33. Texas Retail Aggregate Customer Migration Statistics, 2002-2005 % of Customers and (% of Load)
Year 2002 2003 2004 2005 Residential 7.4%
(7.3%) 14.1%
(15.0%) 19.9%
(21.0%) 26.7%
(27.5%) Small C&I 11.5%
(33.0%) 19.0%
(44.1%) 26.7%
(55.5%) 34.2%
(65.1%) Large C&I 19%
(54%) 35%
(60%) 42% (69%
53% (68%)
Note: The large C&I figures are for December 2002, December 2003, September 2004, and June 2005. The Residential and Small C&I figures are all from January except the 2005 figure which is from September. Source: Texas Public Utility Commission
451 Public Utility Commission of Texas, Texas Electric Choice, Electricity Information-FAQ’s, available at http://www.powertochoose.org/yourrights/q_changing.asp.
173

Public Benefits Programs: The Texas public benefit programs are presented in Table 34.
Table 34. Texas Public Benefits Programs Research &
DevelopmentEnergy
EfficiencyLow
Income Renewable
Energy Total
Million $ 80.0 166.2 246.2 Mills/kWh 0.28 0.58 0.83 % revenue 0.43% 0.89% 1.28% Admin. Utility PUCT
Restructuring Law signed in June 1999. Requires utilities to administer EE programs to achieve saving equivalent to 10% of annual load growth by 2004. PUC has established rates and procedures. Est. total annual cost is %80 million in 2003. Also a 10% LI rate discount & small SBC for customer educ. and LI assistance. Total LI is set at statutory maximum of .65 mills/kWh.452
Source: American Council for an Energy-Efficient Economy, Summary Table of Public Benefit Programs and Electric Utility Restructuring (December 2005), available at http://www.aceee.org/briefs/mktabl.htm.
Separation of Generation and Transmission: By January 1, 2002, utilities were required to separate their business activities into three units: a wholesale electric power generation company, a retail electricity company (REP), and a transmission and distribution company. This separation could take place either through the sale of assets to a third party, or by the creation of separate non-affiliated companies or separate affiliated companies owned by a common holding company.453 After the beginning of retail competition, a distribution utility may not sell electricity or participate in the market for electricity except to procure electricity to serve its own needs.454 Wholesale electric power generation companies that are affiliated with a distribution utility are required to auction off 15 percent of their installed generation capacity,455 and no wholesale generator can own more than 20 percent of the installed capacity that can be sold in a region.456 Before 2005, REP affiliates of transmission and distribution utilities could not offer competitive rates to residential and small commercial customers in the territory of the distribution utility, except as the POLR (default) service provider, until 40 percent of the residential or small business load in the territory is buying electricity from competitive
452 Although the System Benefit Funds are being collected, the Legislature did not appropriate any fund for a low-income discount or for customer education in the 2005 session. Some REPs are continuing to offer low-income discounts and other benefits to these customers on a voluntary basis. Funding will be reconsidered in the 2007 legislative session; Reliant comments. 453 Tex. Util. Code Ann. at § 39.051. 454 Id. at § 39.105. 455 Id. at § 39.153. 456 Id. at § 39.154.
174

suppliers.457 The transmission system for most of Texas is operated independently from the owners of the transmission assets by ERCOT under PUC supervision. State RTO Involvement: Most of Texas (approximately 85 percent) is in the ERCOT interconnection.458 ERCOT began operations as an independent system operator in 1996. It is regulated by the Texas PUC rather than by FERC.459 Transmission operations of distribution utilities outside of ERCOT are regulated by FERC. Generation Capability:460 Prior to the restructuring legislation, utilities operated 88.3 percent of generation capability in Texas. By 2002, that figure dropped to 41.2 percent, as divestitures, transfers to affiliates, and entry and expansion of independent generators took place. Between 1997 and 2002, generation capability in the state increased from 73,454 MWs to 94,488 MWs, an increase of 28.6 percent . Much of the growth in generation was fueled by natural gas. The share of generation capability fueled by natural gas increased from 21.4 percent to 38.5 percent . Natural gas fueled generation more than doubled during the period. Use of Customer Information: When the retail market opened to competition, distribution utilities were required to include customer name, address, and usage information on a list of eligible customers given to competitive suppliers.461
Standardized Labeling:462 “On December 7, 2000, the Texas Public Utility Commission (PUC) issued rules requiring retail electric providers to use an Electricity Facts Label to disclose information twice a year on fuel mix and environmental impacts to their retail and small residential customers, in accordance with the state's restructuring law. The label must also be included in promotional material soliciting new customers. Fuel mix data must be compared to the state average, with energy generated from renewable resources to be listed under a single category. Emissions of carbon dioxide, sulfur dioxide, nitrogen oxides, and particulates, as well as the amount of nuclear waste generated, must be presented relative to the statewide average. According to rules adopted in August 2001, the Commission is developing a "generator scorecard" database with data on fuel mix and environmental impacts by generator to facilitate implementation of the disclosure requirements. The label is to be updated each year. Retail providers can also opt to purchase and retire "renewable energy credits" from generators to meet their disclosure requirements. Providers can project their fuel mix and emissions data for new products or products offered during the first year of competition. Any product marketed as "renewable" must include the renewable fuel mix percentage, unless it is supplied exclusively from renewable sources. Products marketed as "green" may contain some natural gas fuels along 457 Public Utility Commission of Texas, Electric Competition-Fostering Competition, available at www.choiceenergyservices.com/residential/pdf/Competition.pdf. 458 ERCOT is not electrically synchronized with the Eastern or Western Interconnects. 459 Electric Reliability Council of Texas, The Market Guide: A Guide to How the Electric Reliability Council of Texas (ERCOT) Facilitates the Competitive Power Market (Feb. 22, 2001). 460 U.S. Department of Energy, Energy Information Administration, Texas State Profile, Table 4, available at http://www.eia.doe.gov/cneaf/electricity/st_profiles/texas.pdf. 461 Reliant comments; Public Utility Commission of Texas, Consumer Protections in a Competitive Electric Market, available at http://www.powertochoose.org/publications/consumer_brochure.pdf. 462 U.S. Department of Energy, Energy Information Administration, Disclosure Policies, available at http://www.eere.energy.gov/greenpower/markets/disclosure.shtml?print.
175

with renewable fuels if it can be shown that the natural gas was produced in Texas.”463
Renewable Energy Portfolio Standard: Texas adopted a renewable energy portfolio standard on February 24, 2004. The standard establishes yearly new generation from renewables levels through 2019, rather than percentage requirements. The levels are 850 MW in 2004 and 2005, 1400 MW in 2006 and 2007, and 2000 MW in 2009 through 2019. In 2005, the RPS requirements were expanded to a total of 5,000 MW by 2015. Additional non-mandatory targets for renewables were established at the same time, along with a process that will allow the PUC to prioritize transmission development to facilitate delivery of energy from renewable sources.464
The original electric restructuring bill included many environmental protections, including that 50 percent of new generating capacity must come from natural gas, and that a percentage of electricity sold in Texas must come from renewable resources. The bill requires 50 percent reductions in nitrous oxide emissions and 25 percent reduction in sulfur dioxide emissions from power plants that were grandfathered when air permits were introduced under the Federal Clean Air Act. There reductions must be achieved by 2003 by retrofitting or shutting down the grandfathered units. In addition, distribution utilities that upgrade older generation facilities to meet emissions standards may recover the costs from retrofitting as stranded costs.465 The PUC has adopted a renewable energy credit trading program to encourage cost-effective new renewable generation facilities.
463 The consumer brochure on electricity offer labeling is available at http://www.powertochoose.org/publications/efl_brochure.pdf. 464 Reliant comments. 465 Public Utility Commission of Texas, Electric Restructuring to Improve Air Quality, available at www.puc.state.tx.us/nrelease/2000/082400.cfm.
176
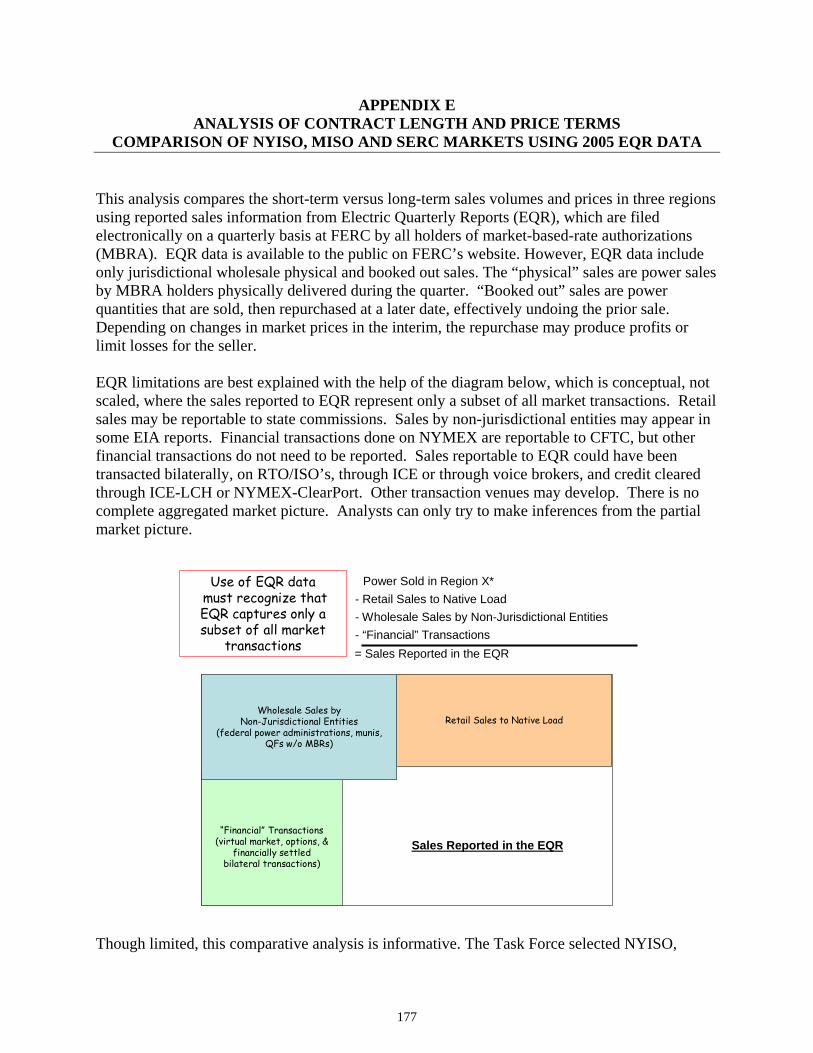
APPENDIX E ANALYSIS OF CONTRACT LENGTH AND PRICE TERMS
COMPARISON OF NYISO, MISO AND SERC MARKETS USING 2005 EQR DATA This analysis compares the short-term versus long-term sales volumes and prices in three regions using reported sales information from Electric Quarterly Reports (EQR), which are filed electronically on a quarterly basis at FERC by all holders of market-based-rate authorizations (MBRA). EQR data is available to the public on FERC’s website. However, EQR data include only jurisdictional wholesale physical and booked out sales. The “physical” sales are power sales by MBRA holders physically delivered during the quarter. “Booked out” sales are power quantities that are sold, then repurchased at a later date, effectively undoing the prior sale. Depending on changes in market prices in the interim, the repurchase may produce profits or limit losses for the seller. EQR limitations are best explained with the help of the diagram below, which is conceptual, not scaled, where the sales reported to EQR represent only a subset of all market transactions. Retail sales may be reportable to state commissions. Sales by non-jurisdictional entities may appear in some EIA reports. Financial transactions done on NYMEX are reportable to CFTC, but other financial transactions do not need to be reported. Sales reportable to EQR could have been transacted bilaterally, on RTO/ISO’s, through ICE or through voice brokers, and credit cleared through ICE-LCH or NYMEX-ClearPort. Other transaction venues may develop. There is no complete aggregated market picture. Analysts can only try to make inferences from the partial market picture.
Retail Sales to Native Load
“Financial” Transactions(virtual market, options, &
financially settledbilateral transactions)
Sales Reported in the EQR
Wholesale Sales byNon-Jurisdictional Entities
(federal power administrations, munis, QFs w/o MBRs)
Power Sold in Region X*- Retail Sales to Native Load- Wholesale Sales by Non-Jurisdictional Entities- “Financial” Transactions= Sales Reported in the EQR
Use of EQR data must recognize that EQR captures only a subset of all market
transactions
Though limited, this comparative analysis is informative. The Task Force selected NYISO,
177
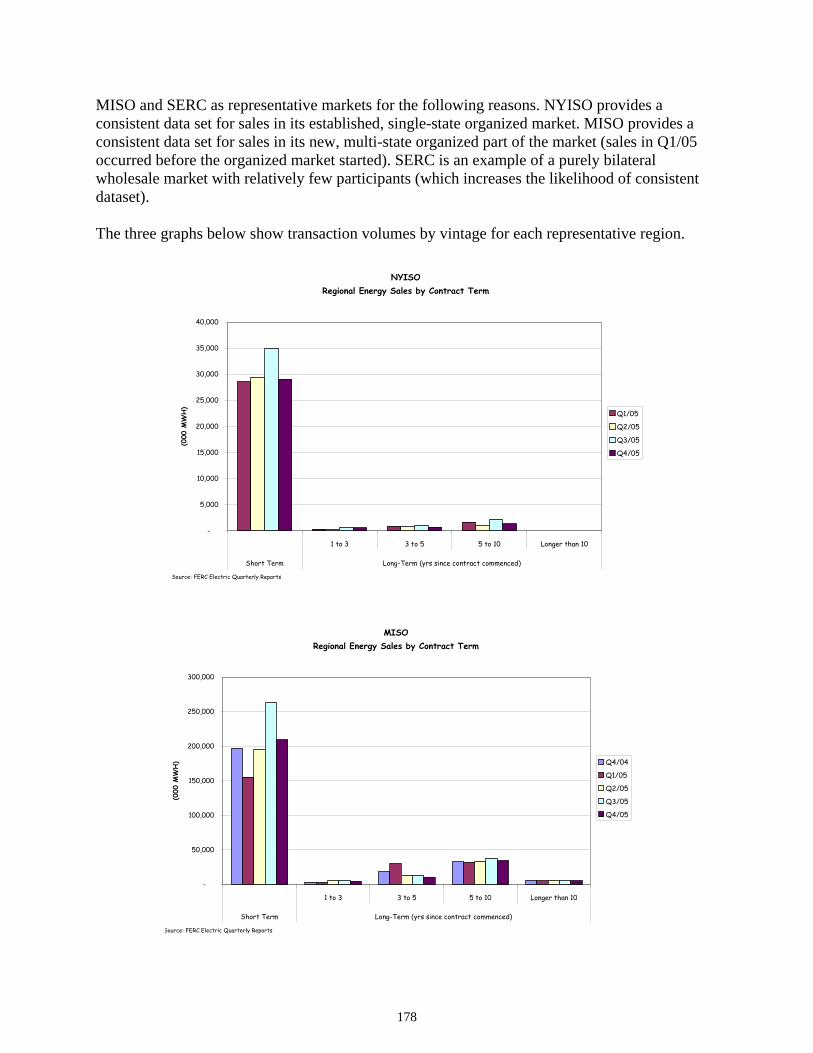
MISO and SERC as representative markets for the following reasons. NYISO provides a consistent data set for sales in its established, single-state organized market. MISO provides a consistent data set for sales in its new, multi-state organized part of the market (sales in Q1/05 occurred before the organized market started). SERC is an example of a purely bilateral wholesale market with relatively few participants (which increases the likelihood of consistent dataset). The three graphs below show transaction volumes by vintage for each representative region.
NYISORegional Energy Sales by Contract Term
-
5,000
10,000
15,000
20,000
25,000
30,000
35,000
40,000
1 to 3 3 to 5 5 to 10 Longer than 10
Short Term Long-Term (yrs since contract commenced)
(000
MW
H)
Q1/05
Q2/05
Q3/05
Q4/05
Source: FERC Electric Quarterly Reports
MISORegional Energy Sales by Contract Term
-
50,000
100,000
150,000
200,000
250,000
300,000
1 to 3 3 to 5 5 to 10 Longer than 10
Short Term Long-Term (yrs since contract commenced)
(000
MW
H) Q4/04
Q1/05
Q2/05
Q3/05
Q4/05
Source: FERC Electric Quarterly Reports
178

SERC
Regional Energy Sales by Contract Term
-
5,000
10,000
15,000
20,000
25,000
30,000
35,000
40,000
45,000
50,000
1 to 3 3 to 5 5 to 10 Longer than 10
Short Term Long-Term (yrs since contract commenced)
(000
MW
H)
Q1/05
Q2/05
Q3/05
Q4/05
Source: FERC Electric Quarterly Reports As noted earlier, EQR consists of sales transactions for power delivered during each quarter. Short term transactions are defined as transactions under contracts of one year or less or sales into organized markets, such transactions include bilateral sales as well as sales to NYISO and MISO. Long-term transactions occur under contracts lasting more than a year. For example, a contract initiated four years ago and still delivering power would be grouped under the 3 to 5 year vintage. A contract initiated 11 years ago would be grouped under the Longer than 10 years vintage. While there is a field in the EQR form for termination date, it is often not relevant in this context because many contracts are either evergreen, effective until cancelled or master agreements (with no time limits) with attachments for term-limited transactions. Major observations on the reported volumes are:
a higher percentage of sales were short term in organized markets (91 percent in NYISO, 77 percent in MISO, 60 percent in SERC);
relatively few contracts were older than 10 years (0 percent in NYISO, 2 percent in MISO, 16 percent in SERC);
quarterly variation in quantities occurred primarily in sales under short term contracts. Organized exchange markets like NYISO and MISO are designed to produce efficient and reliable daily or real-time spot market prices, with heavy reliance on bilateral financial and physical transactions to fill longer term needs between parties who would then settle these bilateral transactions using organized market spot prices as “index price.” The high visibility of the spot markets, along with non-reportable financial transactions would naturally lead to a high percentage of short term transactions using EQR numbers in organized markets such as NYISO and MISO. The trend towards capacity or reliability pricing products in organized markets (e.g., RPM in PJM) also suggests that that organized markets may not rely on short term markets alone to give long-term price signal for investment.
179

The higher proportion of long-term contracts at SERC may suggest more effective long-term price signals than at non-organized markets. However, many of these long-term contracts are legacy contracts entered into before competitive markets were introduced. Some of these contracts are pegged to index prices that are formed with few reported transactions and therefore questionable liquidity. The following graphs show the price patterns by contract vintage in 2005.
MISORegional Energy Price by Contract Term
-
10.00
20.00
30.00
40.00
50.00
60.00
70.00
1 to 3 3 to 5 5 to 10 Longer than 10
Short Term Long-Term (yrs since contract commenced)
($/M
WH) Q1/05
Q2/05
Q3/05
Q4/05
Source: FERC Electric Quarterly Reports SERC
Regional Energy Price by Contract Term
-
10.00
20.00
30.00
40.00
50.00
60.00
70.00
80.00
1 to 3 3 to 5 5 to 10 Longer than 10
Short Term Long-Term (yrs since contract commenced)
($/M
WH) Q1/05
Q2/05
Q3/05
Q4/05
Source: FERC Electric Quarterly Reports
180

This analysis shows that prices under long-term contracts were somewhat lower than short-term prices in MISO and SERC, but not in NYISO. The short-term price changes are reflected in sales under long-term contracts. These changes may occur because some long-term contracts use indexed prices (i.e., short term published reference prices). It is difficult to draw definite conclusions on prices with only a quarter’s worth of data. Furthermore, organized markets are evolving and will include capacity markets that could provide stronger price signals for long-term investment.
181
APPENDIX F A BIBLIOGRAPHY OF PRIMARY INFORMATION
ON ELECTRIC INDUSTRY RESTRUCTURING IN THE U.S. The process of understanding the ins and outs of restructuring markets for electricity and transmission in the U.S. has been running full bore since the early 1990s. Accordingly, a large number of documents have been published intending to explain the basic engineering, economic and regulatory theories that support restructuring ideas. The intended audience of these studies has been various – from state regulators and legislators, to academics, public power managers, and the general public. The Task Force members have not attempted to generate another primer on restructuring as part of its competition study. Instead, the Task Force refers the interested reader to a variety of sources that will allow him/her to learn more about the subjects that are of the most interest. Some of these sources are older and contain slightly outdated references – but their theoretical arguments remain applicable to current debates. NOTE: Inclusion of articles does not indicate the Task Force’s endorsement of the theories presented. General Restructuring Information Documents Available on the Web: American Public Power Association, Restructuring at the Crossroads, FERC Electric Policy Reconsidered, (December 2004), available at http://www.appanet.org/files/PDFs/APPAWhitePaperRestructuringatCrossroads1204.pdf Matthew Brown and Richard P. Sedano, A Comprehensive View U.S. Electric Restructuring with Policy Options for the Future, National Council on Electricity Policy (2003), available at http://www.ncouncil.org/pdfs/restruc.pdf Matthew Brown and Richard P. Sedano, Electricity Transmission, A Primer, National Council on Electricity Policy (June 2004), available at http://www.ncouncil.org/pdfs/primer.pdf U.S. Department of Energy, Energy Information Administration, The Changing Structure of the Electric Power Industry 2000: An Update (October, 2000), available at http://www.eia.doe.gov/cneaf/electricity/chg_stru_update/ William W. Hogan, Competitive Electricity Market Design: A Wholesale Primer (December, 1998) (working paper), available at http://stoft.com/metaPage/lib/Hogan-1998-Primer.pdf William W. Hogan, Market Design and Electricity Restructuring (November 1, 2005) (presentation at the Association of Power Exchanges 2005 Annual Conference in Orlando FL), available at http://ksghome.harvard.edu/~whogan/hogan_apex_110105.pdf
182
Paul L. Joskow, Markets for Power in the United States: An Interim Assessment, ENERGY J. (forthcoming 2006), available at http://stoft.com/metaPage/lib/Joskow-2006-power-market-assessment.pdf Paul L. Joskow, Restructuring, Competition, and Regulatory Reform in the U.S. Electricity Sector, J. ECON. PERSPECTIVES 11(3), at119-38. On-Line Libraries of Electric Industry Restructuring Documents: Harvard Electricity Policy Group http://www.ksg.harvard.edu/hepg/papers.htm Center for the Study of Energy Markets (CSEM) at the University of California Energy Institute (UCEI) at UC Berkeley: http://www.ucei.berkeley.edu/pubs-csemwp.html Stephen Stoft Website Library: http://stoft.com/p/S2.html Carnegie Mellon Electric Industry Center (CEIC): http://wpweb2.tepper.cmu.edu/ceic/publications.htm Books
RICHARD F. HIRSH, POWER LOSS: THE ORIGINS OF DEREGULATION AND RESTRUCTURING IN THE AMERICAN ELECTRIC UTILITY SYSTEM (MIT Press 1999).
SALLY HUNT, MAKING COMPETITION WORK IN ELECTRICITY (Wiley Publishing 2002).
STEVEN STOFT, POWER SYSTEM ECONOMICS: DESIGNING MARKETS FOR ELECTRICITY (IEEE Press, Wiley-Interscience 2002).
183

APPENDIX G CREDIT RATINGS* OF MAJOR AMERICAN
ELECTRIC GENERATION COMPANIES** AS OF JULY 24, 2006
Name Credit Rating Sales ($bil)
Profits ($bil)
Assets ($bil)
Market Value ($bil)
AES Corp. B+ 10.64 0.56 29.65 11.33 Allegheny Energy Inc BB+ 3.04 0.07 8.56 5.82 Alliant Energy Corp. no rating 3.28 -0.01 7.78 3.87 Ameren Corp. A- 6.78 0.63 18.16 10.33 American Electric Power Co., Inc. BBB 11.9 0.81 36.17 14.36 Atmos Energy Corp. BBB 5.89 0.15 6.62 2.13 CALPINE Corp. D 9.23 -0.24 27.09 0.13 CenterPoint Energy, Inc. BBB- 9.72 0.22 17.12 4.02 Cinergy Corp. BBB 5.41 0.49 17.2 8.75 CMS Energy Corp. B+ 6.41 -0.08 16.02 3.1 Consolidated Edison A 11.69 0.73 24.85 11.26 Constellation Energy BBB+ 17.13 0.63 21.47 10.48 Dominion Resources Inc BBB+ 18.04 1.04 52.58 25.59 DTE Energy Co. BBB 9.02 0.54 23.36 7.7 Duke Energy Corp. BBB 16.75 1.83 54.59 26.3 Edison International BB 11.2 1.24 35.51 14.45 Energy East Corp. BBB 5.3 0.26 11.45 3.7 Entergy-Koch BBB- 10.11 0.92 29.97 15.04 Exelon Corp. BBB+ 15.36 0.97 42.39 38.06 FirstEnergy Corp. BBB- 11.99 0.89 31.84 16.85 FPL Group, Inc. A 11.85 0.89 33 16.56 KeySpan Corp. A- 7.66 0.4 13.81 7.11 Kinder Morgan, Inc. BBB 1.59 0.55 17.38 11.34 MDU Resources Group, Inc. A- 3.46 0.28 4.42 4.23 Mirant Group B+ 3.7 NA 12.88 7.38 NiSource Inc. BBB 7.89 0.31 17.96 5.6 Northeast Utilities BBB 7.4 -0.25 12.57 3 NRG Energy Inc B 2.36 0.11 7.8 3.76 NStar A- 3.24 0.2 7.65 3.14 OGE Energy A 6.98 0.17 5.72 2.6 Pepco Holdings, Inc. BBB 7.73 0.32 14.22 4.5 Pacific Gas & Electric BBB 11.7 0.92 34.07 13.02 Pinnacle West Capital Corp. BBB- 2.99 0.18 12.07 4.05 PPL Corp. BBB 6.22 0.69 18.04 12.09 Progress Energy Inc BBB- 10.11 0.7 27.07 11.14 Public Service Enterprise Group, Inc. BBB 12.43 0.68 29.82 17.43
184
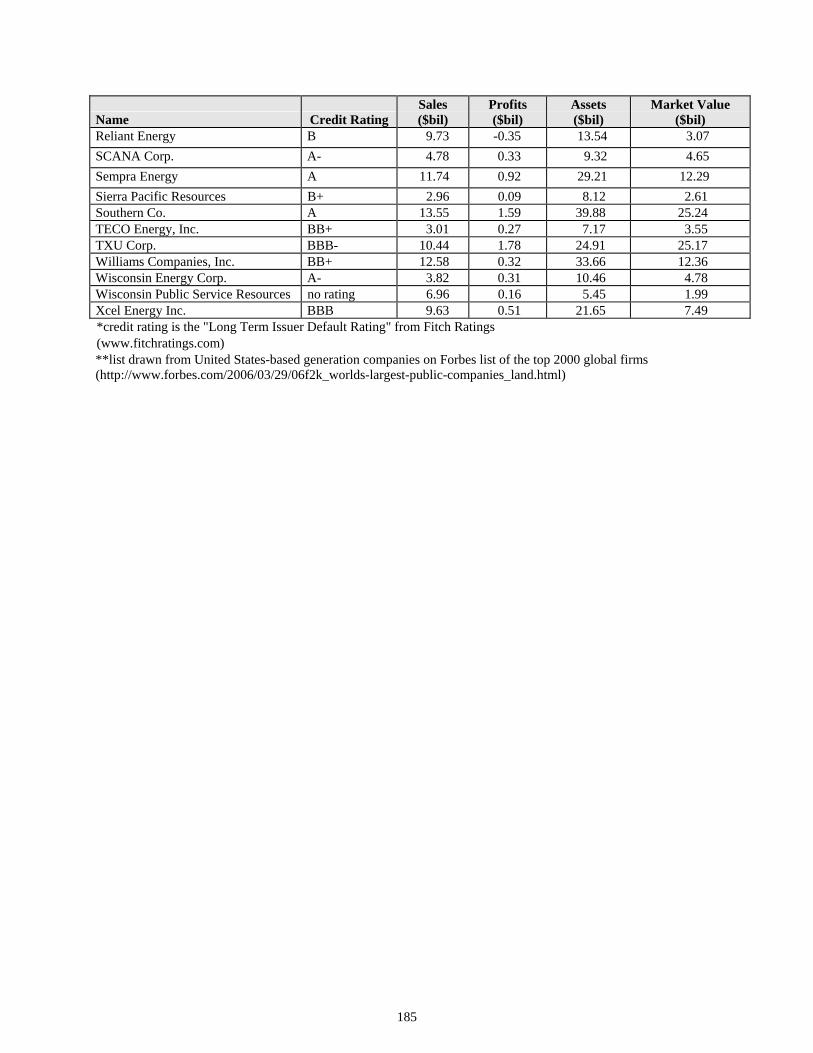
Name Credit Rating Sales ($bil)
Profits ($bil)
Assets Market Value ($bil) ($bil)
Reliant Energy B 9.73 -0.35 13.54 3.07 SCANA Corp. A- 4.78 0.33 9.32 4.65 Sempra Energy A 11.74 0.92 29.21 12.29 Sierra Pacific Resources B+ 2.96 0.09 8.12 2.61 Southern Co. A 13.55 1.59 39.88 25.24 TECO Energy, Inc. BB+ 3.01 0.27 7.17 3.55 TXU Corp. BBB- 10.44 1.78 24.91 25.17 Williams Companies, Inc. BB+ 12.58 0.32 33.66 12.36 Wisconsin Energy Corp. A- 3.82 0.31 10.46 4.78 Wisconsin Public Service Resources no rating 6.96 0.16 5.45 1.99 Xcel Energy Inc. BBB 9.63 0.51 21.65 7.49 *credit rating is the "Long Term Issuer Default Rating" from Fitch Ratings (www.fitchratings.com) **list drawn from United States-based generation companies on Forbes list of the top 2000 global firms (http://www.forbes.com/2006/03/29/06f2k_worlds-largest-public-companies_land.html)
185