report to city council · 2018-03-05 · legal analysis ... the plain language of the initiative...
TRANSCRIPT
REPORT TO CITY COUNCIL
ON A BALLOT INITIATIVE TITLED “AN INITIATIVE TO REQUIRE VOTER APPROVAL
ON CERTAIN DEVELOPMENT PROJECTS”
Prepared Pursuant to Election Code §9212 and at the Request of the City Council
April 5, 2016
ATTACHMENT 3

TABLE OF CONTENTS
I. Introduction ..................................................................................................... 1
A. Request for an Impact Report Related to “An Initiative To Require Voter Approval on Certain Development Projects” .......................................................................................... 1
B. Report Organization ............................................................................................................. 1
II. Legal Analysis ................................................................................................... 2
A. The Applicability of the Initiative to the General Plan Update ............................................ 2
B. Triggers, Impacts and Exceptions ........................................................................................ 6
III. Planning Analysis ........................................................................................... 11
A. Comparative Growth Measures ......................................................................................... 11
B. Inventory of Entitled Projects ............................................................................................ 12
C. Timing Implications of the Initiative on Major Changes in Allowable Land Uses.............. 17
IV. Comparison to A Sample of Voter Initiatives ................................................. 18
A. Comparison of Newport Beach Measure S to the Proposed Initiative ............................. 18
B. Summaries of Other Similar Initiatives .............................................................................. 22
V. Financial Analysis ........................................................................................... 24
A. Impact of Voter-Approval Requirements .......................................................................... 24
B. Financial Feasibility of Revitalization and Major New Development ................................ 27
C. Fiscal and Economic Impact ............................................................................................... 30
ATTACHMENTS
Attachment I Land Use and Trips Analysis
Attachment II Map of Major Changes in Land Use 2007 - 2015
Attachment III Summaries of California Growth Management Initiatives
Attachment IV Case Study Analysis
Exhibit A Property Sales Data
Exhibit B Pro Forma Analysis: Apartment Development
Attachment V Fiscal & Economic Impact Analysis
Exhibit A Harbor Mixed-Use Overlay
Exhibit B Residential Incentive – Harbor
Exhibit C Residential Incentive – Newport
Exhibit D LA Times Site
Exhibit E SoBECA
Exhibit F Segerstrom Home Ranch Site
Exhibit G Sakioka Site – Lot 2
Exhibit H Fairview Site

Election Code Section 9212 Report Page 1 An Initiative to Require Voter Approval on Certain Development Projects
I. INTRODUCTION
A. Request for an Impact Report Related to “An Initiative To Require Voter Approval on Certain Development Projects”
On June 29, 2015, a petition was submitted to the City Clerk of the City of Costa Mesa (the “City”) that was titled, “An Initiative To Require Voter Approval On Certain Development Projects” (the “Initiative”). The date of publication of the notice of intention to circulate the Initiative petition was July 17, 2015. A Ballot Title & Summary of the Petition was prepared by the City Attorney pursuant to Section 9203 of the Elections Code. A Certificate as to Verification of Signatures on Petition has been received by the City from the Registrar of Voters of the County of Orange.
On March 15, 2016, the City Clerk, acting in the capacity of the elections official, certified to the City Council the sufficiency of the petition. The City Council directed City staff and Keyser Marston Associates, Inc. (“KMA”) to prepare a report pursuant to Section 9212 of the Elections Code to be presented at the regularly scheduled City Council meeting of April 5, 2016. The information contained in this report (the “Section 9212 Report”) is responsive to the information requested by the City Council at the March 15, 2016 City Council meeting, and is consistent with Election Code Section 9212.
B. Report Organization
The following Section 9212 Report is intended to provide the City Council with an evaluation of the impact the terms of the Initiative could potentially have on future development in Costa Mesa. This Section 9212 Report is organized as follows:
1. A legal analysis of the applicability of the Initiative to the General Plan Update and an analysis of the Initiative’s triggers and exceptions;
2. An analysis of the Planning issues associated with the Initiative;
3. A survey of California growth management initiatives; and
4. The impact on the City’s General Fund and economic development opportunties.
Election Code Section 9212 Report Page 2 An Initiative to Require Voter Approval on Certain Development Projects
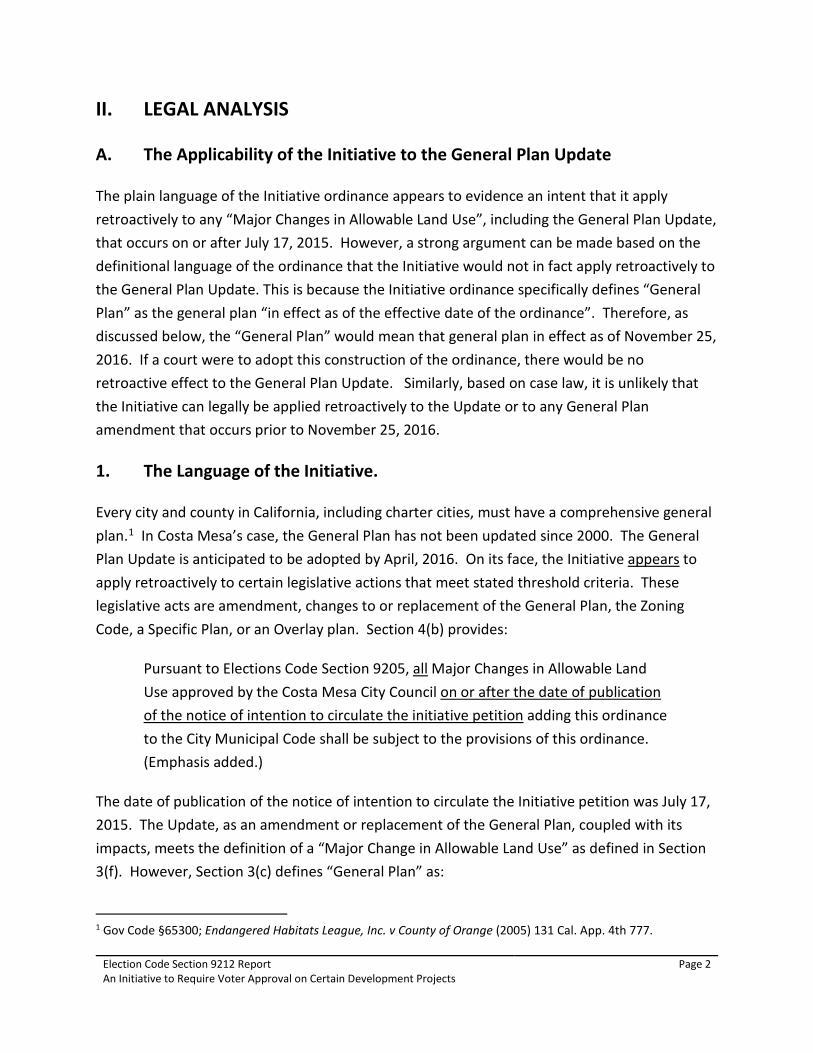
II. LEGAL ANALYSIS
A. The Applicability of the Initiative to the General Plan Update
The plain language of the Initiative ordinance appears to evidence an intent that it apply retroactively to any “Major Changes in Allowable Land Use”, including the General Plan Update, that occurs on or after July 17, 2015. However, a strong argument can be made based on the definitional language of the ordinance that the Initiative would not in fact apply retroactively to the General Plan Update. This is because the Initiative ordinance specifically defines “General Plan” as the general plan “in effect as of the effective date of the ordinance”. Therefore, as discussed below, the “General Plan” would mean that general plan in effect as of November 25, 2016. If a court were to adopt this construction of the ordinance, there would be no retroactive effect to the General Plan Update. Similarly, based on case law, it is unlikely that the Initiative can legally be applied retroactively to the Update or to any General Plan amendment that occurs prior to November 25, 2016.
1. The Language of the Initiative.
Every city and county in California, including charter cities, must have a comprehensive general plan.1 In Costa Mesa’s case, the General Plan has not been updated since 2000. The General Plan Update is anticipated to be adopted by April, 2016. On its face, the Initiative appears to apply retroactively to certain legislative actions that meet stated threshold criteria. These legislative acts are amendment, changes to or replacement of the General Plan, the Zoning Code, a Specific Plan, or an Overlay plan. Section 4(b) provides:
Pursuant to Elections Code Section 9205, all Major Changes in Allowable Land Use approved by the Costa Mesa City Council on or after the date of publication of the notice of intention to circulate the initiative petition adding this ordinance to the City Municipal Code shall be subject to the provisions of this ordinance. (Emphasis added.)
The date of publication of the notice of intention to circulate the Initiative petition was July 17, 2015. The Update, as an amendment or replacement of the General Plan, coupled with its impacts, meets the definition of a “Major Change in Allowable Land Use” as defined in Section 3(f). However, Section 3(c) defines “General Plan” as:
1 Gov Code §65300; Endangered Habitats League, Inc. v County of Orange (2005) 131 Cal. App. 4th 777.

Election Code Section 9212 Report Page 3 An Initiative to Require Voter Approval on Certain Development Projects
“General Plan” means the General Plan of the City of Costa Mesa in effect as of the effective date [sic] of this ordinance, or as may be amended pursuant to this ordinance. (Emphasis added.)
This definition is in contrast to the definition of a “Specific Plan” in Section 3(l):
“Specific Plan” means any existing Specific Plan” in effect as of January 1, 2015 or any Specific Plan as may be amended pursuant to this ordinance or any new Specific Plans which shall be approved by both the Costa Mesa City Council as well as the voters of Costa Mesa pursuant to this ordinance. (Emphasis added.)
The ordinance defines “Effective Date” [sic] in Section 4(a):
This ordinance shall be binding and effective as of the earliest date allowed by law (the “Effective Date”)… (Emphasis added).
Pursuant to Elections Code section 9217, an ordinance adopted by initiative takes effect 10 days after the election is declared by the city council.2 For the upcoming general election, the earliest date the Initiative ordinance could take effect is November 25, 2016. Thus, the “effective date” and “earliest date allowed by law” for purposes of the General Plan would appear to be November 25, 2016. Therefore, by definition, the “General Plan” would mean whatever general plan is in effect as of November 25, 2016.
This interpretation of the “earliest date allowed by law” is consistent with case law regarding general plans discussed below – as well as with the “Exceptions” language of Section 7(c) that provides “[t]he provisions of this ordinance shall not apply to the extent that they would violate state or federal law.”
The Update’s Land Use Element’s amended Land Use Plan includes certain future legislative actions, such as zone changes and specific plan amendments, as discussed in Section V of this report. As discussed above, the Initiative is unlikely to apply retroactively to the General Plan Update. However, the future legislative actions contemplated by the Update – to the extent they meet the stated thresholds – would, based on the terms of the ordinance, be subject to the Initiative.
2 “If a majority of the voters voting on a proposed ordinance vote in its favor, the ordinance shall become a valid and binding ordinance of the city. The ordinance shall be considered as adopted upon the date that the vote is declared by the legislative body, and shall go into effect 10 days after that date…” Elec Code § 9217 (in part).

Election Code Section 9212 Report Page 4 An Initiative to Require Voter Approval on Certain Development Projects
2. The Case Law.
A general plan, as a legislative act, is subject to both amendment by initiative3 and the referendum power of the voters.4 This power has been specifically held to be applicable to general law cities.5 California Supreme Court decisions have held that both adoption and amendment of general plans are subject to referenda and the initiative process. 6, 7 Amendment by initiative must comply with the substantive requirements for a general plan.8 Courts have generally rejected the argument that submission of a general plan to the voters could potentially frustrate the fundamental objectives of planning law by failing to keep the general plan current.9
As a general proposition, a statute or ordinance may apply retroactively, if the legislative intent to do so is clearly apparent.10 Generally, such a law is invalid only if it encroaches on vested rights or impairs the obligations of contract.11 However, the California Supreme Court’s decision in Lesher Communications, Inc. v. City of Walnut Creek12 and the reasoning therein suggests that subjecting a general plan to retroactive approval or disapproval by an initiative ordinance is improper:
We cannot at once accept the function of a general plan as a "constitution," or perhaps more accurately a charter for future development, and the proposition that it can be amended without notice to the electorate that such amendment is the purpose of an initiative. Implied amendments or repeals by implication are disfavored in any case *** and the doctrine may not be applied here. The
3 See DeVita v. Napa (1995) 9 Cal.4th 763; 8 Witkin Sum. Cal. Law Const Law § 1017 (10th 2010). 4 See O'Loane v. O'Rourke (1965) 231 Cal.App.2d 774, 784; Yost v. Thomas (1984) 36 Cal.3d 561, 570 (discussing the Coastal Act). 5 O'Loane v. O'Rourke (1965) 231 Cal.App.2d 774, 783 (general law city); see also Committee of Seven Thousand v. Superior Court (1988) 45 Cal.3d 491, 504 (discussing O’Loane). 6 Yost v. Thomas (1984) 36 Cal.3d 561; Committee of Seven Thousand v. Superior Court (1988) 45 Cal.3d 491; see also Citizens for Planning Responsibly v. County of San Luis Obispo (2009) 176 Cal.App.4th 357, 367 (discussing cases). 7 The precise issue of whether or not the housing element of the general plan, as opposed to the land use element, is subject to the initiative process has not yet been addressed by the Supreme Court. See DeVita v. Napa (1995) 9 C.4th 763, at fn. 11; see also San Mateo County Coastal Landowners' Assn. v. County of San Mateo (1995) 38 Cal.App.4th 523, 543 (discussing DeVita). 8 66 Ops. Cal. Atty. Gen. 258, 259. 9 See DeVita v. County of Napa (1995) 9 Cal.4th 763, 792. 10 Tevis v. San Francisco (1954) 43 Cal.2d 190, 195. 11 O'Connor v. Superior Court (1979) 90 Cal.App.3d 107, 114; Rosenblatt v. California State Board of Pharmacy (1945) 69 Cal.App.2d 69, 72. 12 Lesher Communications, Inc. v. City of Walnut Creek (1990) 52 Cal.3d 531.

Election Code Section 9212 Report Page 5 An Initiative to Require Voter Approval on Certain Development Projects
Planning and Zoning Law itself precludes consideration of a zoning ordinance which conflicts with a general plan as a pro tanto repeal or implied amendment of the general plan. The general plan stands. A zoning ordinance that is inconsistent with the general plan is invalid when passed *** and one that was originally consistent but has become inconsistent must be brought into conformity with the general plan. *** The Planning and Zoning Law does not contemplate that general plans will be amended to conform to zoning ordinances. The tail does not wag the dog. The general plan is the charter to which the ordinance must conform.13
The initiative ordinance at issue in Lesher is not identical to the Initiative here. Nonetheless, the longstanding rule that a zoning ordinance cannot amend the general plan is applicable, as is the rule that a zoning ordinance that conflicts with a general plan is invalid at the time it is passed.14
If the Update is adopted in April, 2016, as scheduled, it then becomes the General Plan to which the Zoning Code must conform. The City and property owners are entitled to rely upon this General Plan to guide future development. Such reliance is arguably impossible if elements of the General Plan as adopted and in effect as of April, 2016, would subject to a mandatory vote of the people starting in November 2016 – which vote itself might not take place until 2018.15 Further, an uncertainty could result as to which general plan would control. In theory, any plan or permit approvals that were issued consistent with the General Plan as updated in April, 2016 could become inconsistent in November, 2018. As discussed in Section IV of this report, none of the previous 24 growth management initiatives summarized in Exhibit III of this report appear to provide for retroactive application. Not surprisingly, the precise legal issue presented here – whether an initiative ordinance can apply retroactively to a general plan amendment that occurred prior to the effective date of the initiative ordinance – has not been directly addressed by the California appellate courts. However, under Lesher, a strong argument can be made that such a vote to undo the Update would act as an impermissible amendment to the General Plan by zoning ordinance.
13 Id. at 540-541 (internal citations omitted). 14 Id. at 544; see also deBottari v. City Council (1985) 171 Cal.App.3d 1204, 1212; Sierra Club v. Board of Supervisors (1981) 126 Cal.App.3d 698, 704. 15 See Section 5(c).

Election Code Section 9212 Report Page 6 An Initiative to Require Voter Approval on Certain Development Projects
B. Triggers, Impacts and Exceptions
1. Actions that “Trigger” the Initiative
The actions that “trigger” the application of the Initiative to a specific project under Section 3(f) are a “Major Change in Allowable Land Use” – which is defined as any “proposed amendment, change or replacement” of:
• the General Plan,• the Zoning Ordinance [Title 13 of the CMMC],• a Specific Plan, or• an Overlay Plan,
that meet the “conditions” specified in Section 3(f)(1) through (6).
The Initiative requires that the proposed amendments, changes, or replacements of the General Plan, Zoning Ordinance, a Specific Plan or an Overlay Plan, be submitted to the voters only after the “City Council has first approved the change pursuant to all state and local laws applicable to the approval of land use changes by the legislative body.”16 Amendments, changes, or replacements of the General Plan, Zoning Ordinance, Specific Plan or Overlay Plan are generally considered legislative acts which may be voted on by the electorate.17 This is in contrast to administrative acts, such as conditional use permits or variances, which may not be subject to a vote of the electorate.18
The “conditions” of Section 3(f), that, when combined with one of enumerated legislative acts, include:
(1) a proposed change that would “significantly increase traffic, density or intensity of us above the As Built Conditions” as defined in Section 3(k);
(2) a proposed change that would “change a public use to a private use”, including a change of use on:
16 See Section 5(a). 17 See W. W. Dean & Assocs. v. City of S. San Francisco (1987) 190 Cal.App.3d 1368, 1374-1375; Yost v. Thomas (1984) 36 Cal.3d 561, 570; Arnel Development Co. v. City of Costa Mesa (1980) 28 Cal.3d 511, 516. 18 See id.

Election Code Section 9212 Report Page 7 An Initiative to Require Voter Approval on Certain Development Projects
(i) “land designated for a public use or a public right of way”, provided however, “that the abandonment of a public right of way that is no longer needed” in conformity with certain state law and local requirements for such disposition;
(3) land designated as utility right-of-way; (4) land donated, bequeathed or otherwise granted to Costa Mesa; (5) land used or designated for Costa Mesa school property; or (6) land owned, controlled or managed by Costa Mesa; [sic.].
However, apparent inconsistencies in the definition of “Major Change in Allowable Land Use” include the above “uses” at Section 3(f)(3)-(6) that may have been intended to be exempt, similar to subsection (2)(i)’s exception for abandonment of public rights-of-way. For example, affirmatively listing “land used or designated for Costa Mesa school property” as a condition that is subject to the Initiative is in apparent conflict with the “exception” from the Initiative at Section 7 for “public schools” (see Paragraph B.2., below). As written, by not designating (3)-(6) as a sub-set of 3(f)(2), such as (ii)-(iv), and/or including a modifier such as “change of use on” as in Section 3(f)(2) dealing with “land designated for public use”, the following are “conditions” that are automatically included in the definition without any predicate action as in (1) or (2):
(3) land designated as utility right-of-way; (4) land donated, bequeathed or otherwise granted to Costa Mesa; (5) land used or designated for Costa Mesa school property; or (6) land owned, controlled or managed by Costa Mesa; [sic.]
Therefore, under the language of the Initiative, a literal interpretation would be that if a project involves one of the proposed legislative changes (such as amendment to the general plan) and land enumerated in (3), (4), (5) or (6) (such as land owned by the City), then this action would be subject to the Initiative – whether or not it met any of the threshold increases of Section 3(k) (i.e., generating 200 additional average daily trips). If the Initiative passes, this inconsistency could only be clarified by a voter approved amendment to the ordinance.
2. Exceptions
Certain stated exceptions to the ordinance are listed in Section 7. They include exceptions for, or make the ordinance inapplicable to:
a. a Major Change in Allowable Land Use that is “limited to allowing the development of a public school or hospital”;

Election Code Section 9212 Report Page 8 An Initiative to Require Voter Approval on Certain Development Projects
b. a project that has acquired “vested rights” prior to the “effective date” of the ordinance (presumably, November 25, 2016);
c. “to the extent that they would violate state of federal laws”;
d. a prohibition against applying the ordinance “in a manner that would result in an unconstitutional taking of private property”;
e. “to affordable housing proposals required by state or federal law”;
f. “to a Major Change in Allowable land use of property with legal non-conforming residential units that meets specified conditions.
The “public school” and “hospital” exception.
School Districts may exempt themselves, under certain circumstances, from a city’s zoning ordinance, except where the use is for non-classroom facilities.19 Absent this express exemption, the Initiative could apply to development of non-classroom facilities, if such development included one of the enumerated legislative changes and met the threshold criteria. Because of this express exemption, the Initiative does not apply to development of a public school – which would include any school within the Newport Mesa Unified School District. This exemption would also apply to charter schools, which, unlike school districts, do not have the option of exempting themselves from a local zoning ordinance.20 This exemption also applies to development of “hospitals”, which, unlike public schools, do not normally have an ability to exempt themselves from the City’s zoning ordinance.
Vested Rights Exception.
A statute or ordinance may apply retroactively, if the legislative intent to do so is clearly apparent.21 Generally, such a law is invalid only if it encroaches on vested rights or impairs the obligations of contract.22 As discussed previously in this report, the earliest date the Initiative
19 See Gov Code § 53094; City of Santa Cruz v. Santa Cruz Sch. Bd. of Educ. (1989) 210 Cal.App.3d 1. 20 “Notwithstanding any other provision of this article, no school district may render a city or county ordinance inapplicable to a charter school facility pursuant to this article, unless the facility is physically located within the geographical jurisdiction of that school district.” Gov Code § 53097.3. 21 Tevis v. San Francisco (1954) 43 Cal.2d 190, 195. 22 O'Connor v. Superior Court (1979) 90 Cal.App.3d 107, 114; Rosenblatt v. California State Board of Pharmacy (1945) 69 Cal.App.2d 69, 72.

Election Code Section 9212 Report Page 9 An Initiative to Require Voter Approval on Certain Development Projects
would take effect is November 25, 2016.23 Depending upon where in the process certain projects lie, the adoption of the Initiative could nonetheless prevent those projects going forward depending upon whether the developer has obtained a vested right to proceed with the project. A vested right to develop occurs fairly late in the development process. In Avco Community Developers v. South Coast Regional Commission24, the California Supreme Court held that a developer does not acquire a vested right to a project until building permits are issued, substantial work has been completed and the developer has incurred substantial liability in reliance on the permit. It appears that with Avco in mind, the Initiative authorizes completion of projects that have “vested” before the “effective date” of the ordinance25 – at the earliest, November 25, 2016.
In addition, some developers and cities have circumvented application of an initiative to existing projects by entering into a development agreement that freezes zoning regulations in place at the time the agreement. 26 Whether a development agreement will apply to an initiative generally depends on the language of the agreement itself.27 In one instance, a project was able to go forward, in spite of a newly adopted initiative that would require voter approval because a vesting tentative tract map had been approved.28 In response, some initiative proponents have thwarted issuance of building permits by seeking a temporary injunction that would not be lifted until after the initiative’s effective date.29
Violation of State or Federal Law & Taking of Private Property.
These appear to be a “catch all” exemptions. It is axiomatic that the Initiative could not legally be applied in a manner that would violate state or federal law. However, in practice, these exceptions may prove difficult to administer.
23 The 2016 general election will be held on November 8, 2016. With the election results declared at the following City Council meeting of November 15, 2016 and effective date 10 days thereafter. 24 Avco Community Developers v. South Coast Regional Commission (1976) 17 Cal. 3d 785. 25 Section 7(b) provides, “This ordinance shall not preclude completion of a site-specific development that depends on a Major Change in Allowable Land Use approved before the effective date of this ordinance, if before such date, the holder of any permit or other entitlement for use for such development has lawfully and in good faith acquired a vested right, under state law, to carry out the development to completion.” 26 See Pardee Construction Co. v. City of Camarillo (1984) 37 Cal.3d 465, 466 (Pardee involved a stipulated judgement rather than a development agreement, but is generally regarded as instructive on the issue on whether an agreement will exempt development from an initiative’s reach). 27 See id. 28 This was a lower court decision that was not appealed - Davidon Homes v. City of Pleasant Hill, No. 297988, slip op. (Contra Costa Co. Sup. Ct., Sept. 23. 1987). 29 Simac Design, Inc. v. Alciati (1979) 92 Cal.App.3d 146, 150).

Election Code Section 9212 Report Page 10 An Initiative to Require Voter Approval on Certain Development Projects
Affordable Housing Proposals.
In the past decade, the City has not processed an affordable housing project that applied the density bonus provisions pursuant to state law 30, and there are no pending applications for new affordable housing projects. Staff is not aware of any affordable housing proposals involving density bonuses within Costa Mesa, nor any that are required by “state or federal law”. However, the broad language “affordable housing” and “required by state or federal law” – without definition – precludes a detailed analysis of this exception.
Major Change in Allowable Land Use of Property with Legal Non-Conforming Residential Units
In the last decade, the City has not processed a major development site consisting of 40 dwelling units or more that involved demolition of existing non-conforming residential units. For purposes of the Initiative, the consideration of trip generation associated with “as-built” conditions would include the trips allocated to the existing non-conforming units.
30 Gov Code §§65915 – 65918.

Election Code Section 9212 Report Page 11 An Initiative to Require Voter Approval on Certain Development Projects
III. PLANNING ANALYSIS
A. Comparative Growth Measures
For the purposes of this analysis, the following land use change measures were evaluated:
1. The amount of development that currently exists in Costa Mesa;
2. The amount of development allowed by the current General Plan; and
3. The amount of development allowed by the General Plan Update.
The results of this comparative analysis are detailed in Attachment I, and summarized in the following table:
Land Use Existing
Conditions Current
General Plan General Plan
Update
Residential 31 DUs 42,263 48,859 51,894
Office 32 TSF 7,224 8,932 10,787
Commercial TSF 9,741 11,977 11,939
Light Industrial TSF 13,087 13,108 12,704
Lodging Rooms 4,149 4,349 3,023
Auto Dealership TSF 491 491 491
Public, Religious & Cultural TSF 1,273 1,519 1,519
Health Care Facilities Beds 920 920 570
Educational Facilities Students 37,965 39,351 39,351
Uses Measured by the Acre 1,543 1,459 1,537
Storage (TSF) TSF 1,171 877 530
31 DUs = Dwelling Units. 32 TSF = Thousands of Square Feet.
Election Code Section 9212 Report Page 12 An Initiative to Require Voter Approval on Certain Development Projects
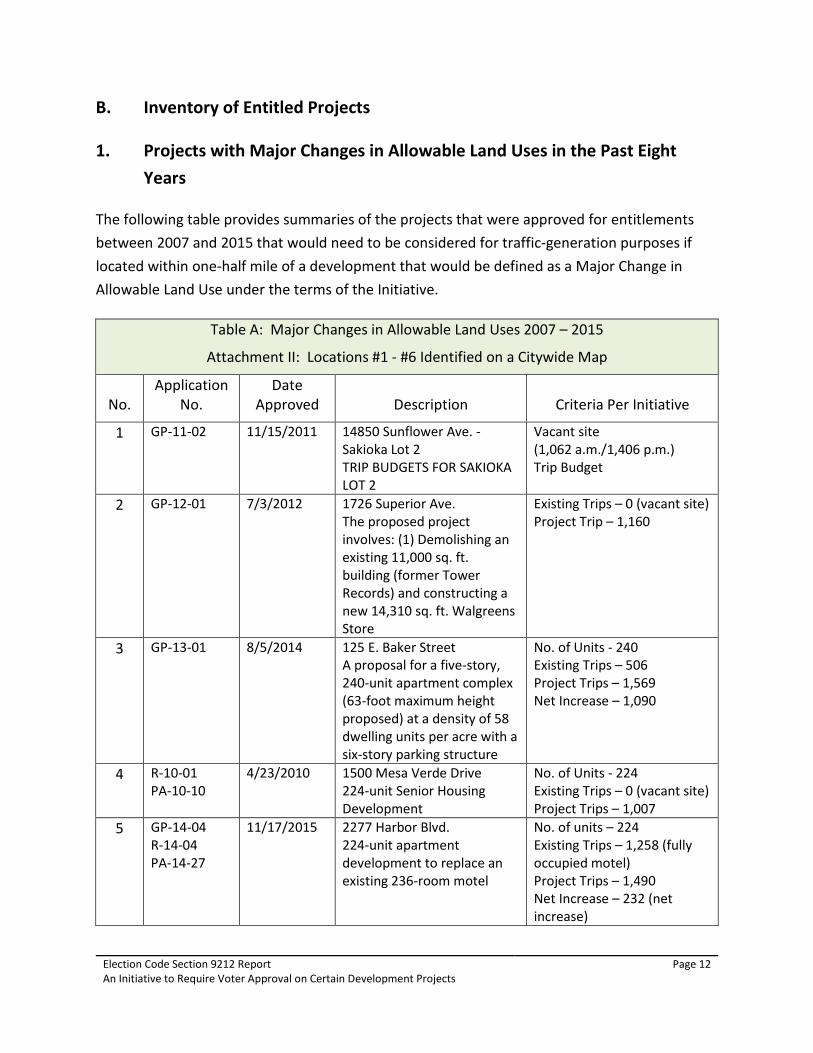
B. Inventory of Entitled Projects
1. Projects with Major Changes in Allowable Land Uses in the Past Eight Years
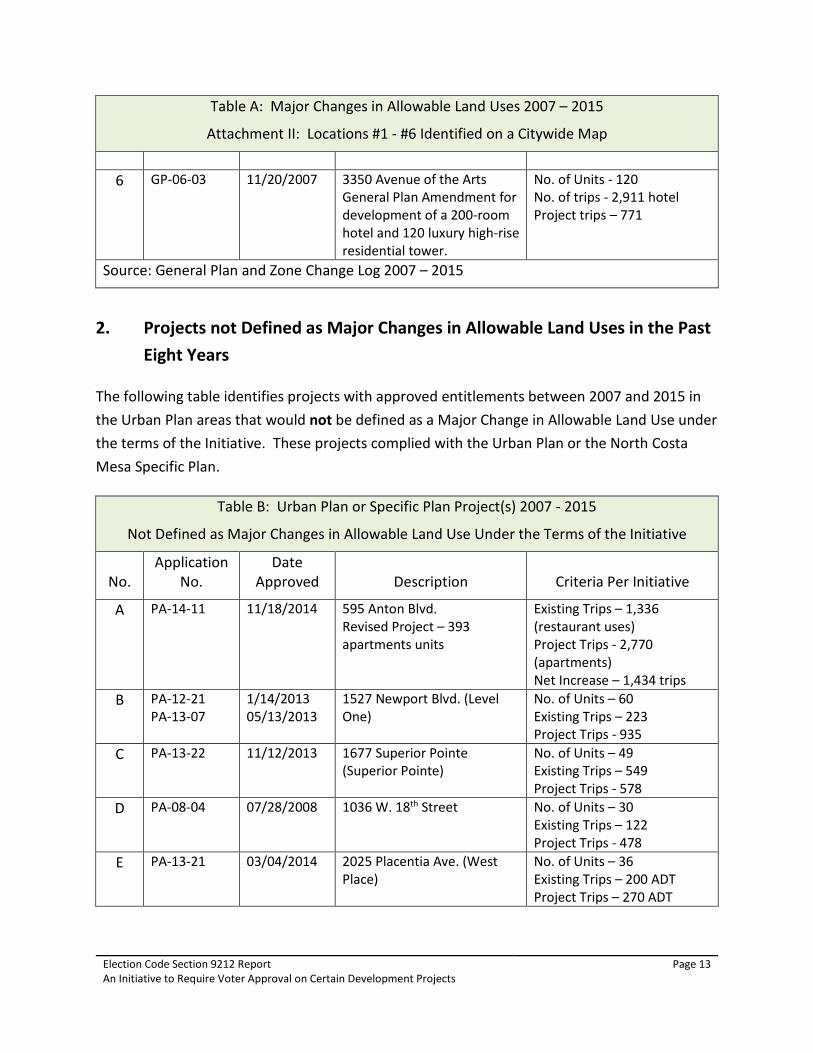
The following table provides summaries of the projects that were approved for entitlements between 2007 and 2015 that would need to be considered for traffic-generation purposes if located within one-half mile of a development that would be defined as a Major Change in Allowable Land Use under the terms of the Initiative.
Table A: Major Changes in Allowable Land Uses 2007 – 2015
Attachment II: Locations #1 - #6 Identified on a Citywide Map
No. Application
No. Date
Approved Description Criteria Per Initiative
1 GP-11-02 11/15/2011 14850 Sunflower Ave. - Sakioka Lot 2 TRIP BUDGETS FOR SAKIOKA LOT 2
Vacant site (1,062 a.m./1,406 p.m.) Trip Budget
2 GP-12-01 7/3/2012 1726 Superior Ave. The proposed project involves: (1) Demolishing an existing 11,000 sq. ft. building (former Tower Records) and constructing a new 14,310 sq. ft. Walgreens Store
Existing Trips – 0 (vacant site) Project Trip – 1,160
3 GP-13-01 8/5/2014 125 E. Baker Street A proposal for a five-story, 240-unit apartment complex (63-foot maximum height proposed) at a density of 58 dwelling units per acre with a six-story parking structure
No. of Units - 240 Existing Trips – 506 Project Trips – 1,569 Net Increase – 1,090
4 R-10-01 PA-10-10
4/23/2010 1500 Mesa Verde Drive 224-unit Senior Housing Development
No. of Units - 224 Existing Trips – 0 (vacant site) Project Trips – 1,007
5 GP-14-04 R-14-04 PA-14-27
11/17/2015 2277 Harbor Blvd. 224-unit apartment development to replace an existing 236-room motel
No. of units – 224 Existing Trips – 1,258 (fully occupied motel) Project Trips – 1,490 Net Increase – 232 (net increase)
Election Code Section 9212 Report Page 13 An Initiative to Require Voter Approval on Certain Development Projects
Table A: Major Changes in Allowable Land Uses 2007 – 2015
Attachment II: Locations #1 - #6 Identified on a Citywide Map
6 GP-06-03 11/20/2007 3350 Avenue of the Arts
General Plan Amendment for development of a 200-room hotel and 120 luxury high-rise residential tower.
No. of Units - 120 No. of trips - 2,911 hotel Project trips – 771
Source: General Plan and Zone Change Log 2007 – 2015
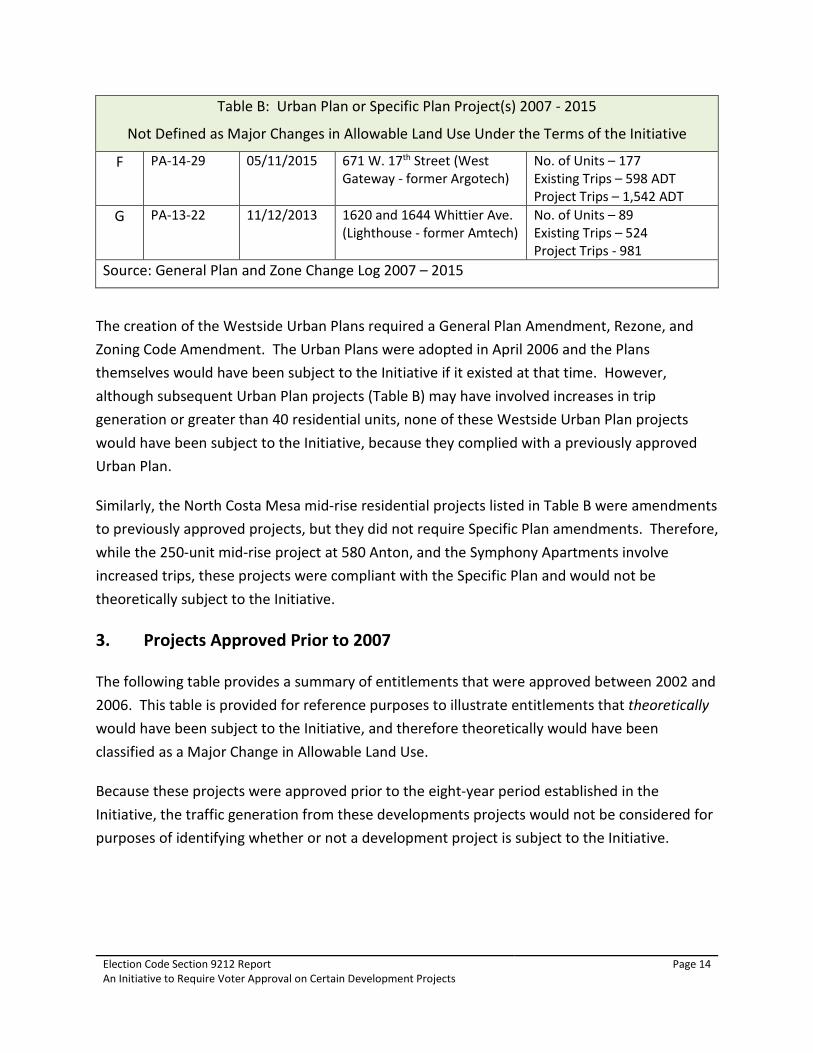
2. Projects not Defined as Major Changes in Allowable Land Uses in the Past Eight Years
The following table identifies projects with approved entitlements between 2007 and 2015 in the Urban Plan areas that would not be defined as a Major Change in Allowable Land Use under the terms of the Initiative. These projects complied with the Urban Plan or the North Costa Mesa Specific Plan.
Table B: Urban Plan or Specific Plan Project(s) 2007 - 2015
Not Defined as Major Changes in Allowable Land Use Under the Terms of the Initiative
No. Application
No. Date
Approved Description Criteria Per Initiative
A PA-14-11 11/18/2014 595 Anton Blvd. Revised Project – 393 apartments units
Existing Trips – 1,336 (restaurant uses) Project Trips - 2,770 (apartments) Net Increase – 1,434 trips
B PA-12-21 PA-13-07
1/14/2013 05/13/2013
1527 Newport Blvd. (Level One)
No. of Units – 60 Existing Trips – 223 Project Trips - 935
C PA-13-22 11/12/2013 1677 Superior Pointe (Superior Pointe)
No. of Units – 49 Existing Trips – 549 Project Trips - 578
D PA-08-04 07/28/2008 1036 W. 18th Street No. of Units – 30 Existing Trips – 122 Project Trips - 478
E PA-13-21 03/04/2014 2025 Placentia Ave. (West Place)
No. of Units – 36 Existing Trips – 200 ADT Project Trips – 270 ADT
Election Code Section 9212 Report Page 14 An Initiative to Require Voter Approval on Certain Development Projects
Table B: Urban Plan or Specific Plan Project(s) 2007 - 2015
Not Defined as Major Changes in Allowable Land Use Under the Terms of the Initiative
F PA-14-29 05/11/2015 671 W. 17th Street (West Gateway - former Argotech)
No. of Units – 177 Existing Trips – 598 ADT Project Trips – 1,542 ADT
G PA-13-22 11/12/2013 1620 and 1644 Whittier Ave. (Lighthouse - former Amtech)
No. of Units – 89 Existing Trips – 524 Project Trips - 981
Source: General Plan and Zone Change Log 2007 – 2015
The creation of the Westside Urban Plans required a General Plan Amendment, Rezone, and Zoning Code Amendment. The Urban Plans were adopted in April 2006 and the Plans themselves would have been subject to the Initiative if it existed at that time. However, although subsequent Urban Plan projects (Table B) may have involved increases in trip generation or greater than 40 residential units, none of these Westside Urban Plan projects would have been subject to the Initiative, because they complied with a previously approved Urban Plan.
Similarly, the North Costa Mesa mid-rise residential projects listed in Table B were amendments to previously approved projects, but they did not require Specific Plan amendments. Therefore, while the 250-unit mid-rise project at 580 Anton, and the Symphony Apartments involve increased trips, these projects were compliant with the Specific Plan and would not be theoretically subject to the Initiative.
3. Projects Approved Prior to 2007
The following table provides a summary of entitlements that were approved between 2002 and 2006. This table is provided for reference purposes to illustrate entitlements that theoretically would have been subject to the Initiative, and therefore theoretically would have been classified as a Major Change in Allowable Land Use.
Because these projects were approved prior to the eight-year period established in the Initiative, the traffic generation from these developments projects would not be considered for purposes of identifying whether or not a development project is subject to the Initiative.

Election Code Section 9212 Report Page 15 An Initiative to Require Voter Approval on Certain Development Projects
Table C:
Examples of Major Changes in Allowable Land Uses Approved Prior to 2007
No. Application
No. Date
Approved Description Criteria Per Initiative
A GP-02-04 01/20/04 1901 Newport Blvd. Create site specific FAR and site specific density (145 unit condominium development)
No. of trips – 842 No. of dwellings – 145
B GP-02-06 R-02-03
10/18/04 1626-1640 Newport Blvd General Plan Amendment for a site specific FAR of 0.40 for a moderate traffic use in the General Commercial land use designation (76,500 SF medical building)
No. of trips (186 a.m. / 281 p.m.)
C GP-04-01 R-04-01
05/17/04
330 - 340 W. Bay Street General Plan Amendment from General Commercial to Medium Density Residential (44 Dwelling Units)
Existing condition – 570 ADT No. of trips – 421 (44 units) Net Increase – (-149)
D GP-04-02 R-04-02
08/02/04 1695 Superior Ave & 635 W. 17th Street General Plan Amendment from Light Industry to Neighborhood Commercial (10,945 SF commercial building)
Net increase compared to GP – 298 Add 10,945 SF of commercial
E GP-06-02 2006 GPA to allow High Rise Residential projects in the Cultural Arts Center, Urban Center Commercial, and High Density Residential land use designations. (described below)
No. of dwellings - 1269
F GP-05-08 (GP-06-02)
2006 675 Anton Blvd. General Plan Amendment for 180-unit residential high-rise development at Pacific Arts Plaza in place of 67,450 SF office building
No. of dwellings – 180 No. of trips – 346 (net increase)
G GP-05-09 (GP-06-02)
2006 605 Town Center Dr. Development of 80 residential units atop of 14,000 SF of museum and ancillary commercial uses.
No. of trips – 484 (net increase) No. of dwellings – 80

Election Code Section 9212 Report Page 16 An Initiative to Require Voter Approval on Certain Development Projects
Table C:
Examples of Major Changes in Allowable Land Uses Approved Prior to 2007
H GP-05-10 (GP-06-02)
2006 3400 Bristol Street General Plan Amendment to allow addition of a high-rise residential units in conjunction with a multi-story 200-room hotel with 220,000 SF at 3400 Bristol Street and a 21-story tower of 336,525 SF at 3420 Bristol Street
No. of trips – 525 (net increase) No. of dwellings - 275
I GP-05-13 (GP-06-02)
2006 595 Anton Blvd. Site specific density to allow 484 units Revised Project – 393 Apartments
No. of trips – 1,336 (restaurant uses) No. of trips for apartments – 2,770 Net Increase – 1,434 trips
J GP-05-07 (GP-06-02)
2006 580 Anton Blvd. Site specific density to allow 250 units
No. of dwelling units – 250 No. of trips – 45 (net increase)
K R-04-03 02/23/2004 3333 Hyland Ave. South Coast Collection Demolition of 307,000 SF state Farm Building and construction of 312,540 SF for furniture, retail and food uses.
No. of trips - 3,254 Daily (net increase)
4. Senior Center Affordable Housing Project
The 2008-2014 Housing Element described a potential affordable housing project at the Costa Mesa Senior Center at 695 West 19th Street. The Costa Mesa Senior Center was built by the City in 1991. This 2.7-acre site has a General Commercial land use designation and is zoned C1 (Local Business District).
The Center is currently overseen by the City’s Parks & Community Services Department. The Center’s mission is to maximize the quality of life among the older adult population of Costa Mesa and surrounding communities through provision of senior programs.

Election Code Section 9212 Report Page 17 An Initiative to Require Voter Approval on Certain Development Projects
The City had considered (in concept only) a high-density residential development on the existing Senior Center parking lot. This 1.4-acre area could have potentially accommodated a residential low-rise building for seniors and/or families above a parking structure. The proposed project (in concept) involved a 150-unit residential development at a density of 107 - dwelling units per acre. Fifty percent (50%) of the units were earmarked as affordable to very-low/low income households, for a total of 75 affordable units.
This proposed conceptual senior/family housing project was located in the 19 West Urban Plan area, which established a mixed-use development overlay zone. In this case, the mixed uses involved the Senior Center (institutional use) and housing (residential use). Due to the location of the site in the Urban Plan area, a General Plan amendment or rezone would not have been required for this proposed project.
C. Timing Implications of the Initiative on Major Changes in Allowable Land Uses
Following is the City’s processing timelines for projects involving major development proposals that require a General Plan Amendment, Rezone, Zoning Code Amendment, or Specific Plan Amendment:
• For projects requiring an Initial Study/Mitigated Negative Declaration: Eight (8) to 10 months
• For projects requiring an Environmental Impact Report: 12 to 18 months
If these Major Changes in Allowable Land Uses are subject to the Initiative, following are the timing implications after the project is approved by the City Council:
• Project must be considered at the next General Election, which occurs every two years. • Project may be considered by Special Election, which may occur anytime during the
year. However, an approximately a six-month lead time for placement on ballot may be required for special elections.

Election Code Section 9212 Report Page 18 An Initiative to Require Voter Approval on Certain Development Projects
IV. COMPARISON TO A SAMPLE OF VOTER INITIATIVES
At the March 15, 2016 City Council meeting, a member of the public identified 44 growth management initiatives that have been approved by the voters in California communities over the past 43 years. Summaries of the initiatives’ characteristics are presented in Attachment III.33 It is important to note that the effective date for each of the surveyed initiatives fell after the vote of the people was certified. None of these initiatives have a stated effective date that is retroactive to an earlier point in time.
After reviewing the identified initiatives, it is KMA’s opinion that only four of the initiatives are truly pertinent to the analysis of the proposed Costa Mesa Initiative. Of particular interest is Measure S (Greenlight) in the City of Newport Beach, which was approved by the voters in November 2000. A comparison of Newport Beach Measure S to the proposed Initiative follows, and summaries of the other three pertinent initiatives are presented in the following sections of this report.
A. Comparison of Newport Beach Measure S to the Proposed Initiative
The proposed Initiative has been likened to Measure S, which was approved by the Newport Beach voters on November 7, 2000, and is codified in the Section 423 of the Newport Beach City Charter. The specific comparison is that Measure S requires voter approval on general plan amendments for certain types of projects. However, there are a number of differences between Measure S and the proposed Initiative that are worth noting. To that end, the salient characteristics of Measure S and the proposed Initiative are compared in the following multi-page table:
Newport Beach: Measure S Proposed Initiative
Form of Government Charter City General Law City
Effective Date December 15, 2000 - 38 days after the election.
July 17, 2015 – 16 months before the election.
Voter approval required for Major Amendments to identified Planning documents
General Plan General Plan, Zoning Code, Specific Plans, and Overlay Plans
33 Twenty (20) of the identified initiatives related to the establishment of Urban Growth Boundaries. Given the lack of relevance to the proposed Initiative, summaries were only provided for the other 24 identified initiatives.

Election Code Section 9212 Report Page 19 An Initiative to Require Voter Approval on Certain Development Projects
Newport Beach: Measure S Proposed Initiative
Major Amendments are defined as any of the following:
Trips:
Measurement Measured against the trip estimate for the maximum amount of floor area or dwelling units allowed by the General Plan.
Measured against “as built” conditions.
Threshold Increase of more than 100 trips in the morning peak hour or more than 100 trips in the evening peak hour.
Increase of over 200 average trips per day, or
Increase in the volume/capacity of an intersection based on specified Levels of Service (LOS) measures, or
Increase in the Intersection Capacity Utilization from less than .9 to greater than .9; or
Change in the LOS at any intersection or corridor from better than “D” to worse than “D”.
Residential Development Increase of 100 dwelling units.
Increase of 40 dwelling units.
Non-Residential Development Increase of 40,000 square feet of gross building area.
Increase of 10,000 square feet of area.
Changes that required discretionary approval on sites within the Neighborhood
Definition of Neighborhood Statistical Areas as defined in the Land Use Element of the General Plan.
½ mile of the proposed development site.

Election Code Section 9212 Report Page 20 An Initiative to Require Voter Approval on Certain Development Projects
Newport Beach: Measure S Proposed Initiative
Definition of Changes Increases created by the proposed project plus 80% of the increases related to other amendments affecting the same Neighborhood. Excludes projects that were approved by the voters.
Increases created by the proposed project and 100% of the increases created by projects that received minor changes that would not by themselves require voter approval.
Time Period Preceding 10 years Preceding eight years
Other instances that a vote is required
None identified Land designated as a utility right-of-way under specified circumstances.
Land is donated, bequeathed or otherwise granted to the City.
Land used or designated for Costa Mesa school property.
Land owned, controlled or managed by the City.
Planning Commission and City Council Approval
Any required CEQA documentation must be prepared and certified.
Any required CEQA documentation must be prepared and certified.
City Council must decide any discretionary land use approval or permit for the proposed Amendment.
City Council must approve the Amendment pursuant to all state and local laws applicable to the approval of the proposed land use changes.

Election Code Section 9212 Report Page 21 An Initiative to Require Voter Approval on Certain Development Projects
Newport Beach: Measure S Proposed Initiative
Election Timing At a noticed public hearing tied to the approval of the Amendment, the City Council must schedule an election. The election may be held at the next regular municipal election, or at a special election if the City and the proponent have entered into a written agreement to share the costs.
The election may be set for the first regular municipal election following City Council approval of the Amendment, or at a special election if the cost is borne solely by the proponent.
Initiative related requirements for receipt of a Certificate of Occupancy
None stated All traffic impacts must be mitigated, the City must have received payment of the then current trip fees, and an enforceable agreement must have been executed that specifies any other mitigation measures.
As indicated in the preceding table, the similarities between the two growth management measures include the fact that voter approval is required for general plan amendments that generate a certain number of increased car trips, adding a certain number of dwelling units and adding non-residential floor area. However, the Initiative proposed in Costa Mesa is more expansive than Newport Beach Measure S in the following key ways:
1. The Initiative also applies to the General Plan, Zoning Ordinances, Specific Plans and Overlay plans. Measure S only applies to modifications to the General Plan.
2. The Initiative applies to residential projects with an increase of 40 units versus Measure S at 100 units.
3. The Initiative applies to an increase of 10,000 square feet for non-residential projects versus Measure S at 40,000 square feet.

Election Code Section 9212 Report Page 22 An Initiative to Require Voter Approval on Certain Development Projects
4. The Initiative sets the maximum increase in trips at 200 average daily traffic versus Measure S, which sets the maximum at 100 additional morning or evening peak period trips. The Initiative also applies several Level of Service and volume/capacity tests.
5. The Initiative applies voter-approval requirements to projects where General Plan, Zoning Ordinance or Specific Plan amendments have been adopted, but the projects have not vested.
6. The Initiative prohibits issuance of a Certificate of Occupancy until impacts have been mitigated.
B. Summaries of Other Similar Initiatives
1. City of Redondo Beach – Measure DD - 2008
Measure DD was approved by the voters on November 4, 2008. Measure DD went into effect on December 16, 2008.
Measure DD is codified in City Charter Section 27. Measure DD requires voter approval for any “Major Change in Allowable Land Use” to the general plan, including its local coastal element and the City’s zoning ordinance. “Significant Increase” is defined as any project that requires a general plan amendment that increases traffic by more than 150 trips during the peak hours in the morning or evening; the density increase generated by the project produces more than 25 dwelling units; or 40,000 square feet of commercial area. In addition, Measure DD calculations must be applied to the cumulative amount of development, that required an amendment to the general plan, that occurred within the same neighborhood within the preceding eight years. Neighborhood is defined as all properties located either entirely or partially within 1,000 feet of any parcel or lot that is subject to a proposed change in allowable land use.
2. City of Encinitas – Proposition A – 2013
Proposition A was approved by the voters on June 18, 2013. The initiative became effective on July 21, 2013.
Proposition A requires vote approval when publicly or privately initiated “Major Amendments” are proposed to a “Planning Policy Document”. Planning Policy Documents are defined as the Land Use Element and Land Use Policy Maps of the General Plan; the Zoning Code and Zoning Map; and specific plan or development agreement. Major Amendments are defined as:

Election Code Section 9212 Report Page 23 An Initiative to Require Voter Approval on Certain Development Projects
1. Increases in the number of dwelling units on a residential lot;
2. Increases in the number of separate parcels that may be created from an existing parcel;
3. Changes in identified zone types;
4. Changes from residential land use to non-residential land use;
5. Increases in the maximum height of development and how height is measured;
6. Increases in the maximum allowable commercial or retail square footage on a parcel; and
7. An action that repeals any Planning Policy Document.
Proposition A imposes a citywide height limit of two stories or 30 feet for all buildings and structures, except for medical complex development projects and specified buildings with a public high school on a minimum 10-acre site. Proposition A also preserves agricultural lands and open space.
3. City of Escondido – Proposition S – 1998
Proposition S requires a public vote for any general plan amendment or the creation of any new Specific Plan Area if it involves an increase in the residential density; a change, alteration or increase in the general plan’s residential land use categories; and a change of the land use designation of any property from residential to industrial or commercial use. Proposition S essentially asked the voters to affirm the general plan in place as of 1997, and to subject any significant land use changes to a vote of the people.

Election Code Section 9212 Report Page 24 An Initiative to Require Voter Approval on Certain Development Projects
V. FINANCIAL ANALYSIS
A. Impact of Voter-Approval Requirements
The Initiative imposes voter-approval requirements on a wide range of developments that are anticipated to occur under the auspices of the General Plan Update. The City’s Planning Department staff has concluded that the implementation of the General Plan Update will require properties to be rezoned, and/or modifications will need to be made to existing specific plans. It is possible that these implementing actions will trigger the Initiative requirements for voter approval.
The voter-approval requirement adds a significant component of uncertainty in the development process that can discourage investment in new major development projects, and in the recycling of underutilized or blighted properties. This is particularly relevant to the following components of the General Plan Update:
1. The Harbor Boulevard and Newport Boulevard Residential Incentive Areas, and the Harbor Mixed-Use Overlay;
2. The LA Times site, which is located at the intersection of Harbor Boulevard and South Coast Drive;
3. The SoBECA area, which includes a land use redesignation that allows residential units to be constructed;
4. The Segerstrom Home Ranch and Sakioka Site – Lot 2 in the North Costa Mesa Specific Plan Area; and
5. The redevelopment of the Fairview Developmental Center.
The development process is fraught with several levels of risk, but in general developers seek out development opportunities in which the entitlement process is well defined and uncertainty is minimized. The imposition of a voter-approval requirement has the following key impacts:
1. It increases the inherent risk that a project will not be approved;
2. It requires developers to make a substantial investment of capital prior to placing the proposed project in front of the voters; and

Election Code Section 9212 Report Page 25 An Initiative to Require Voter Approval on Certain Development Projects
3. It prolongs the development process, which increases the carrying costs incurred by the proposed project.
Measuring the impacts created by voter-approval requirements is a hotly debated issue. To date, very little empirical research on this topic has been undertaken. However, there is some anecdotal evidence of the impacts created by the growth management initiatives that KMA reviewed. The results are summarized in the following sections of this report.
1. Impacts Generated by Surveyed Initiatives
City of Newport Beach – Measure S
Measure S was placed into effect in December 2000. In 2001, Koll Development proposed an office tower, and in 2004 a five-star hotel was proposed on the Balboa Peninsula. Both projects required voter approval, and both projects were defeated at the ballot box. Subsequently, the Irvine Company withdrew a proposed expansion to Newport Center and Pacific Life withdrew an office expansion project. No projects that require a vote have been proposed since 2004.
On July 25, 2006, the City Council adopted a comprehensive update to the general plan. This update reduced the allowable non-residential development by 449,499 square feet, increased the allowable residential development by 1,166 dwelling units, and reduced peak hour trips by 1,121 in the morning and 958 in the evening. It was determined that this general plan update was subject to voter approval, and it was placed on the ballot as Measure V. A competing measure that was called Measure X (Greenlight II) was placed on the ballot as well. In the election, which was held on November 7, 2006, Measure X failed and Measure V passed by a 54% to 46% margin.
City of Redondo Beach – Proposition DD
Proposition DD was placed into effect in December 2008. In November 2010, the City placed Measure G on the ballot. Measure G was a proposed change to the Redondo Beach Local Coastal Plan (LCP) and the Zoning Ordinance for the Coastal Plan. The amendment also called for major changes in existing policies and development standards. The modifications to the LCP and the Zoning Ordinance allowed for 400,000 square feet of development in the harbor area; 540,000 square feet of development along Catalina Avenue, and the continuation of the AES power plant and the addition of a desalination plant.

Election Code Section 9212 Report Page 26 An Initiative to Require Voter Approval on Certain Development Projects
Measure G was approved by the voters in November 2010. In October 2012, the City Council selected a developer to undertake the development of a large-scale mixed-use project at King Harbor. In February 2016, a citizens group commenced a signature drive to place an initiative on the ballot to impose stricter limits on development than were imposed by Measure G.
City of Escondido – Proposition S
After the initiative passed in 1998, the City attempted to identify property owners that wished to change their land use designation. Initially, 16 property owners submitted proposals to modify their land use designation. Eight developers subsequently withdrew from the process, and chose to develop under the existing land use designation for their property. The other eight property owners proceeded through the process and received City Council approval. These projects included increasing the number of residential units on four properties from 146 units to 284 units; three properties called for changing residential land to light industrial; and one changed residential to commercial use. Each of the eight ballot measures failed. This had a chilling effect on property owners applying for land use designation changes.
In May 2012, the City Council approved an update to the general plan, which was the first comprehensive update since 1990. Proposition S requires that amendments to defined components of the general plan can only occur after a vote of the people if the proposed changes increase residential density, change the general plan land use categories, or change certain residential designations to commercial or industrial designations. The general plan update was placed on the November 2012 ballot as Proposition N, and it passed 53% to 47%.
City of Encinitas – Proposition S
Proposition S went into effect in July 2013. It is too early to determine what impact the voter-approval requirements will have on future development. However, it should be noted that the major residential developments that have been proposed since Proposition S was enacted have applied for the state density bonus.
2. Conclusions – Impact of Voter-Approval Requirements
A review of the available scholarly literature indicates that there is consistent evidence that imposing voter-approval requirements on proposed development creates a negative impact on development opportunities. This impact is caused by the combination of the increased uncertainty involved in the development approval process, the additional costs incurred during the process, and by the fact that voters rarely approve projects that are put forward for a vote.

Election Code Section 9212 Report Page 27 An Initiative to Require Voter Approval on Certain Development Projects
It is interesting to note that the general plan updates that KMA reviewed achieved voter approval. However, this finding should be considered in the context that in both Newport Beach and Redondo Beach, citizen groups placed competing initiatives on the ballot to impose even stricter development controls than were imposed by the initial growth management initiatives.
B. Financial Feasibility of Revitalization and Major New Development
1. Revitalization
Harbor Boulevard and Newport Boulevard Overlay Areas
The General Plan Update includes Overlays along Harbor Boulevard and Newport Boulevard that encourage the recycling of underutilized and blighted properties. The Harbor Mixed-Use Overlay allows residential development to be included in mixed-use projects at a density of up to 20-units per acre. The Residential Incentive areas on Harbor Boulevard and Newport Boulevard allow for residential development at up to 40-units per acre. These Overlay areas were created to expand development opportunities on properties that are not developed to their full potential, or that are improved with outdated buildings and underperforming uses.
Surveys of Costa Mesa property sales are presented in Attachment IV – Exhibit A. As can be seen in Exhibit A, the weighted average cost of vacant land is $57 per square foot of land area. Comparatively, the weighted average cost of improved retail properties is $111 per square foot of land area. This difference is attributable to the value associated with the existing improvements.
The key constraint associated with the private market recycling properties along commercial boulevards is the premium costs associated with purchasing improved properties. Unless a new development project can support a land value that is higher than the combined value of the land and existing improvements, there is no financial incentive for a developer to recycle improved properties. As a result, over time, the boulevards become characterized by functionally obsolete buildings and marginal businesses.
The ability to develop residential units on the boulevards materially increases the land value that can be supported. KMA prepared a conceptual pro forma analysis to provide an order-of-magnitude estimate of residential density that would be required to support the values for improved commercial parcels. As shown in Attachment IV – Exhibit B, the required density level is in the range of 54 units per acre.

Election Code Section 9212 Report Page 28 An Initiative to Require Voter Approval on Certain Development Projects
It is clear that the residential development anticipated in these Overlay areas will exceed the 40-unit trigger established by the Initiative. Given the premium costs associated with acquiring improved properties, if development in these Overlay areas require voter approval, the potential for achieving recycling of existing underutilized and blighted properties will be severely constrained.
LA Times Overlay Area
The General Plan Update calls for the LA Times site to be converted from a General Plan designation of Industrial Park, to an Overlay that allows for office and retail development. As will be discussed in the Fiscal and Economic Impact section of this report, the intensification of the land use is anticipated to generate substantially greater General Fund revenues and economic development benefits than can be generated by the existing manufacturing uses.
The land uses allowed by the proposed Overlay generate as much as 655,000 square feet of office and retail space. This is 281,000 square feet more space than the 374,000 square feet of manufacturing space that is currently located on the property, which triggers the commercial intensity trigger. Even if the project size was reduced to 374,000 square feet, the intensification of the uses would trigger the trip count limit applied in the Initiative. Therefore, if the development envisioned in the General Plan Update requires voter approval, it can be safely assumed that the existing manufacturing uses will remain in place throughout the foreseeable future.
SoBECA Overlay
The current General Plan designation for the SoBECA area is General Commercial and Light Industrial. The SoBECA Overlay allows for up to a total of 450 residential units to be developed at a maximum density of 40-units per acre. The addition of high density residential development is intended to further the goal of creating an innovative, eclectic and unique mix of uses in the SoBECA area. The residential population base is anticipated to provide additional support for the local incubator-type businesses that are already located in the area.
Given the site characteristics in the SoBECA area, it is anticipated that mixed-use development will not be large scale. If the inclusion of residential development triggers a voter-approval requirement, it is unlikely that the types of developers that will be attracted to the area will have the risk profile or the financial capacity to go through an entitlement process that includes a vote of the people. Instead, it should be anticipated that development will be focused on a mix of uses that do not trigger the Initiative’s voter-approval requirements.

Election Code Section 9212 Report Page 29 An Initiative to Require Voter Approval on Certain Development Projects
2. Development of Vacant Land
Costa Mesa is currently 99% built out. The two largest remaining vacant parcels in Costa Mesa are the Segerstrom Home Ranch site and Sakioka Site – Lot 2. Both of these properties are located in the North Costa Mesa Specific Plan area.
Segerstrom Home Ranch Site
Under the requirements imposed by the North Costa Mesa Specific Plan, the property can be developed with approximately 759,000 square feet of office and office-related uses. However, in 2016, the City created a specific site floor area ratio (FAR) that increased the allowable development intensity to .64:1. This allows for up to 1.2 million square feet of building area. The site specific FAR allowance explicitly prohibits the inclusion of residential development on the property. In addition, the maximum intensity is limited by the trip budget that was set at 1,860 during the morning peak, and 1,788 during the evening peak.
It is clear that the Segerstrom Home Ranch development will be a major economic driver in Costa Mesa. It is difficult to assess how the property owner will proceed if it is ultimately determined that the FAR allowance provided in 2016 is subject to the voter-approval requirements imposed by the Initiative.
Sakioka Site – Lot 2
The scope of development allowed for the Sakioka Site – Lot 2 is defined in a Development Agreement that identifies the maximum building area, FAR, trip budget and allowable uses. However, the allowable development intensity is dictated by the trip budget that was established by the North Costa Mesa Specific Plan.
The General Plan Update’s land use recommendation for the property is for 660 residential units, which includes a 25% state density bonus.34 In return for this density bonus, the project must include an affordable housing component that comports with state law. The currently proposed land use requires an amendment to the North Costa Mesa Specific Plan. If this triggers a voter-approval requirement, it is unclear what actions the property owner will take in regard to the development of the site.
34 The North Costa Mesa Specific Plan was adopted in 1994. At that time the state density bonus was set at 25%. In 2005, the state modified the statute to provide a sliding scale of bonus density tied to the percentage of affordable units that are provided.

Election Code Section 9212 Report Page 30 An Initiative to Require Voter Approval on Certain Development Projects
3. Fairview Developmental Center
The current General Plan Designation for the Fairview property is Public/Institutional. In February 2016, the State of California Department of Development Services initiated a process that will lead to the closure of the Fairview Developmental Center. As part of that process, the State and the City devised a proposed new land use designation for the property.
The proposed land use designation is called Multi-Use Center General Plan. The mix of uses identified in the General Plan Update consist of 500 residential units, 25.6 acres of park and open space, and 51.6 acres of Institutional & Recreation Uses. However, the land use designation, and corresponding Zoning District, will require a Master Plan for any future development projects, whether or not the property continues to be owned by the State or the property is sold to a private entity.
If the Initiative passes, it is possible that the future development of the Fairview site will be subject to voter approval. This adds a significant amount of entitlement risk, and potential delays in the development process, for this 102.5-acre property. This could also delay the creation of the park, open space and recreation uses identified in the General Plan Update.
C. Fiscal and Economic Impact
In a draft report dated February 26, 2016, the Natelson Dale Group evaluated the fiscal impacts generated by the buildout under the General Plan Update. As part of that draft report, the Natelson Dale Group identified the assumptions and calculation methodology that was applied to estimate the fiscal impacts associated with the land uses included in the General Plan Update.
Based on the assumptions and calculation methodology applied in the draft Natelson Dale Group fiscal impact report, KMA prepared fiscal impact analyses for the Overlay areas and sites described in the preceding section of this report. In addition, KMA prepared economic impact analyses for the Overlay area and sites using the following data sources:
1. The Regional Input-Output Modeling System (RIMS II) for Orange County (2007/2013); and
2. The California Employment Development Department Occupational Employment Statistics Survey, May 2015.

Election Code Section 9212 Report Page 31 An Initiative to Require Voter Approval on Certain Development Projects
The KMA analyses are detailed in Attachment V – Exhibits A – H, and the results are summarized in the following tables:
1. Residential Overlay Areas
Harbor Mixed-Use Overlay SoBECA
Current General Plan
General Plan Update
Current General Plan
General Plan Update
Scope of Development
Residential Units 13 491 450
Retail Square Feet 337,500 321,000 147,300
Industrial Square Feet 458,600
Population (FTE’s) 35 195 1,390 305 1,125
Net Annual Fiscal Impact 36 $1,390,000 $1,792,000 $696,400 $441,900
Change from Current General Plan $402,000 ($254,500)
Direct & Indirect Economic Impact
Change in Jobs (9) (487)
Change in Earnings ($364,000) ($16,508,000)
Residential Incentive - Harbor Residential Incentive - Newport
Current General Plan
General Plan Update
Current General Plan
General Plan Update
Scope of Development
Residential Units 84 1,063 237 1,210
Retail Square Feet 356,800 178,400 582,200 291,100
Population (FTE’s) 381 2,744 872 3,165
Net Annual Fiscal Impact $157,000 $1,772,000 $2,609,000 $2,376,000
Change from Current General Plan $1,615,000 ($233,800)
Direct & Indirect Economic Impact
Change in Jobs (102) (165)
Change in Earnings ($3,869,000) ($6,327,000)
35 FTE = Full-Time Equivalent. 36 Net Annual Fiscal Impact = Estimated General Fund Revenues minus General Fund Expenditures.

Election Code Section 9212 Report Page 32 An Initiative to Require Voter Approval on Certain Development Projects
As can be seen in the preceding tables, the General Plan Update development scopes all generate net annual General Fund revenues. Moreover, in both the Harbor Boulevard Mixed-Use Overlay and the Residential Incentive – Harbor areas, the net annual General Fund revenues are higher for the General Plan Update than the estimates for the current General Plan.
As would be expected, the replacement of commercial development with residential development has a negative impact on the jobs and earnings generated by development in Costa Mesa. This reduction ranges from nine to 165 jobs, and from $364,500 to $6.3 million in earnings. However, the policy decision was made to provide the opportunity for residential development on the boulevards in order to ameliorate the existing underutilized and blighted properties.
2. LA Times Site (Overlay Area)
LA Times Site
Current General Plan
General Plan Update
Scope of Development
Residential Units
Retail Square Feet 165,800
Office Square Feet 458,600
Industrial Square Feet 374,000
Population (FTE’s) 299 417
Net Annual Fiscal Impact $66,700 $698,400
Change from Current General Plan $631,700
Direct & Indirect Economic Impact
Change in Jobs 156
Change in Earnings $40,026,000
The General Plan Update calls for the existing industrial land use to be replaced by retail and office development. This modification results in an increase in net General Fund revenues that is estimated at $631,700 per year. In addition, the modification is projected to generate 156 additional jobs and over $40 million in additional earnings.

Election Code Section 9212 Report Page 33 An Initiative to Require Voter Approval on Certain Development Projects
3. Vacant Sites
Segerstrom Home Ranch
Sakioka Site – Lot 2
Fairview
Scope of Development
Residential Units 660 500
Retail Square Feet
Office Square Feet 1,200,000
Population (FTE’s) 883 1,650 1,383
Net Annual Fiscal Impact $56,700 $601,000 $576,400
Change from Current General Plan
Direct & Indirect Economic Impact
Increase in Jobs 1,516 0 0
Increase in Earnings $139,781,000 $0 $0
As shown in the preceding table, the large-scale office development on the Segerstrom Home Ranch site dis not projected to generate a significant amount of net annual General Fund revenues. This is attributable to the fact that the primary General Fund revenue source is the share of the property tax received by the City. To generate significantly greater General Fund revenues, the project would need to include retail and/or hotel space.
The Sakioka Site – Lot 2 and the Fairview site are both designated to be developed with residential uses. As can be seen in the table, both sites are anticipated to generate positive net annual General Fund revenues, ranging from $576,400 to $601,000 per year. Given the lack of commercial development on both sites, no increase in jobs or increase in earnings are projected for the sites.
4. Conclusion – Fiscal and Economic Impact Analyses
The results of the fiscal impact analyses indicate that the focus areas in the General Plan Update are all projected to generate net positive annual General Fund revenues to the City. In addition, the Overlay areas and sites that include commercial uses are projected to increase the number of jobs and the earnings generated by workers in Costa Mesa.

ATTACHMENT I
LAND USE AND TRIPS ANALYSISELECTION CODE 9212 REPORT
COSTA MESA, CALIFORNIA

Source: City of Costa MesaPrepared by: Keyser Marston Associates, Inc.File name: CM 9212_3 30 16; GP Use Comp
ATTACHMENT I
LAND USE CHANGESELECTION CODE 9212 REPORTCOSTA MESA, CALIFORNIA
Land UseUnit of
MeasurementExisting
ConditionsCurrent General
Plan AmountUpdated General
Plan Amount
I. ResidentialLow Density Residential DU 14,210 14,788 14,791Medium Density Residential DU 4,370 4,791 4,992High Density Residential DU 23,593 28,830 31,661Age Qualified Housing DU 450 450 450
Total Residential 42,623 48,859 51,894Increase/(Decrease) from Current General Plan Amount 3,035
II. OfficeGeneral Office TSF 7,112 8,820 10,675Medical Office TSF 112 112 112
Total Office 7,224 8,932 10,787Increase/(Decrease) from Current General Plan Amount 1,855
III. CommercialGeneral Commercial TSF 5,601 7,337 7,299Regional Commercial TSF 4,140 4,640 4,640
Total Commercial 9,741 11,977 11,939Increase/(Decrease) from Current General Plan Amount (38)
IV. Light Industrial TSF 13,087 13,108 12,704Increase/(Decrease) from Current General Plan Amount (404)
V. LodgingHotel Room 1,877 2,077 2,077Motel Room 2,272 2,272 946
Total Lodging 4,149 4,349 3,023Increase/(Decrease) from Current General Plan Amount (1,326)
VI. Auto Dealership TSF 491 491 491Increase/(Decrease) from Current General Plan Amount 0
VII. Public, Religious & Cultural UsesCity Hall TSF 133 133 133Performance Theater TSF 585 691 691Religious Facility TSF 555 555 555Museum TSF 140 140
Total Public, Religious & Cultural Uses 1,273 1,519 1,519Increase/(Decrease) from Current General Plan Amount 0
VIII. Health Care FacilitiesConvalescent Care Bed 448 448 448Hospital Bed 472 472 122
Total Health Care Facilities 920 920 570Increase/(Decrease) from Current General Plan Amount (350)

Source: City of Costa MesaPrepared by: Keyser Marston Associates, Inc.File name: CM 9212_3 30 16; GP Use Comp
ATTACHMENT I
LAND USE CHANGESELECTION CODE 9212 REPORTCOSTA MESA, CALIFORNIA
Land UseUnit of
MeasurementExisting
ConditionsCurrent General
Plan AmountUpdated General
Plan Amount
IX. Educational FacilitiesElementary/Middle School Student 7,385 8,067 8,067High School Student 4,590 4,998 4,998College/University Student 25,990 26,286 26,286
Total Educational Facilities 37,965 39,351 39,351Increase/(Decrease) from Current General Plan Amount 0
X. Uses Measured by the AcreGolf Course Acre 535 535 535Public Facility Acre 176 176 228Fairgrounds Acre 150 150 150Passive Park Acre 592 592 618Agriculture Acre 72 0 0Vacant Acre 18 6 6
Total Uses Measured by the Acre 1,543 1,459 1,537Increase/(Decrease) from Current General Plan Amount 78
XI. Storage TSF 1,171 877 530Increase/(Decrease) from Current General Plan Amount (347)
AbbreviationsDU - Dwelling UnitTSF - Thousands of Square Feet

Source: City of Costa MesaPrepared by: Keyser Marston Associates, Inc.File name: CM 9212_3 30 16; GP Traffic Comp
ATTACHMENT I - TABLE 2
TRIP GENERATIONELECTION CODE 9212 REPORTCOSTA MESA, CALIFORNIA
Existing Conditions
Current General Plan Amount
Updated General Plan Amount
I. Trip Generation (Daily) 1,018,790 1,229,125 1,244,140
II. Increase/(Decrease) from Current General Plan Amount 15,015
III. Percentage Change from Current General Plan Amount 1.2%

ATTACHMENT II
MAP OF MAJOR CHANGES IN LAND USES 2007 - 2015ELECTION CODE 9212 REPORT
COSTA MESA, CALIFORNIA

City of Huntington
Beach
City of Newport
Beach
City ofNewport
Beach
JohnWayneAirport
City of Santa Ana
Har
bor
Blv
d.
19th St.
Irvine
Ave
.
Baker St.
Fairv
iew
Rd.
Adams Ave.
17th St.
Plac
entia
Ave
.
Ma i
n S
t .
Bear
St.
Fair Dr.
Victoria St.
Sunflower Ave.
Newpo
rt B
lvd.
Red H
ill Av
e.
Ellis Ave.
Segerstrom Ave.
Talbert Ave.
Wilson St.
Gisler Ave.
22nd St.
South Coast Dr.
Flow
er S
t .
Supe
rior
Ave.
Anton Blvd.
Campu
s Dr.
Garfield Ave.
16th St.
Arlington Dr.
Del Mar Ave.
15th St.
MacArthur Blvd.
Bris
tol
S t.
Broo
k hur
st S
t.
Irvine
Ave
.
Tusti
n Av
e.
Orang
e Ave
.Sa
nta A
na A
ve.
Talbert Regional
Park
FairviewPark
Orange CoastCollege
OC Fair &Event Center
SouthCoastPlaza
UpperNewport
Bay
Pacific Ocean
City Boundaries
Costa Mesa City Boundary
Costa Mesa Sphere of Influence 0 2,000 4,000 6,000 8,0001,000Feet
Source: City of Costa Mesa, 2015.
4
3
2
1
5
6

ATTACHMENT III
SUMMARIES OF CALIFORNIA GROWTH MANAGEMENT INITIATIVES ELECTION CODE 9212 REPORT
COSTA MESA, CALIFORNIA

Election Code 9212 Report Page 2 Summaries of California Growth Management Initiatives
CITY OF ALAMEDA - MEASURE A – 1973
Measure A prohibited multiple dwelling units to be constructed anywhere in the City of Alameda. Measure A was amended in April 1986 to allow multifamily units that were destroyed by fire or other disaster to be replaced. Measure A was amended in 1991 to establish a minimum residential lot size of 2,000 square feet. In July 2011, the City Council adopted an ordinance to create new zoning districts that allow for the development of multifamily homes. This was enacted so that the City of Alameda could obtain a certified Housing Element.
COUNTY OF ALAMEDA – MEASURE D – 1980
Measure D was approved by the voters in November 2000.
Measure D created a urban growth boundary around the cities of Pleasanton, Dublin and Livermore. Under Measure D, the County may not approve urban development outside the Urban Growth Boundary, or to subdivide farmland into parcels smaller than 100 acres. This requirement was also imposed on the valley between Castro Valley and Pleasanton Ridge. Any change to the changes in policies called for in Measure D require a countywide vote of the people.
CITY OF APPLE VALLEY – MEASURE N – 1999
Measure N was approved by the voters in November 1999. The Measure became effective January 1, 2000.
Measure N required the City to readopt the goals and policies of the 1991 Land Use Element; to readopt the land use designations and land use map included in the 1998 Land Use Element; and to prohibit any change to the two-unit per acre density and 18,000 square foot minimum lot size for properties zoned F-SF (Single Family Residential). Any changes to these requirements require a vote of the people. The initiative requirements remain in place until January 21, 2021.

Election Code 9212 Report Page 3 Summaries of California Growth Management Initiatives
CITY OF DUBLIN – MEASURE M – 2000
Measure M required a Resolution to be adopted to amend the City of Dublin General Plan to establish an Urban Limit Line in the Western Extended Planning Area for a 30-year period. Measure M prohibited residential development on preserved open space located in the Dublin Hills. Any change to the Urban Limit Line requires a vote of the people.
CITY OF ENCINITAS – PROPOSITION A – 2013
Proposition A was approved by the voters on June 18, 2013. The initiative became effective on July 21, 2013.
Proposition A requires a vote of the people when publicly or privately initiated “Major Amendments” are proposed to a “Planning Policy Document”. Planning Policy Documents are defined as the Land Use Element and Land Use Policy Maps of the General Plan; the Zoning Code and Zoning Map; and specific plan or development agreement. Major Amendments are defined as:
1. Increases in the number of dwelling units on a residential lot;
2. Increases in the number of separate parcels that may be created from an existing parcel;
3. Changes in identified zone types;
4. Changes from residential land use to non-residential land use;
5. Increases in the maximum height of development and how height is measured;
6. Increases in the maximum allowable commercial or retail square footage on a parcel; and
7. An action that repeals any Planning Policy Document.
Proposition A imposes a citywide height limit of two stories or 30 feet for all buildings and structures, except for medical complex development projects and specified building with a public high school on a minimum 10-acre site. Proposition A also preserves agricultural lands and open space.

Election Code 9212 Report Page 4 Summaries of California Growth Management Initiatives
CITY OF ESCONDIDO – PROPOSITION S – 1998
Proposition S requires a public vote for any General Plan Amendment or the creation of any new Specific Plan Area if it involves an increase in the residential density; a change, alteration or increase in the General Plan’s residential land use categories; and a change of the land use designation of any property from residential to industrial or commercial use. Proposition S essentially asked the voters to affirm the General Plan in place as of 1997, and to require any significant land use changes to a vote of the people.
After the initiative passed, the City attempted to identify property owners that wished to change their land use designation. Initially, 16 property owners submitted proposals to modify their land use designation. Eight developers subsequently withdrew from the process, and chose to develop under the existing land use designation for their property. The other eight property owners proceeded through the process and received City Council approval. These projects included increasing the number of residential units on four properties from 146 units to 284 units; three properties called for changing residential land to light industrial; and one changed residential to commercial use. Each of the eight ballot measures failed. This had a chilling effect on property owners applying for land use designation changes.
In May 2012, the City Council approved an update to the general plan, which was the first comprehensive update since 1990. Proposition S requires that amendments to defined components of the general plan can only occur after a vote of the people if the proposed changes increase residential density, change the general plan land use categories, or change certain residential designations to commercial or industrial designations. Proposition N was placed on the November 2012 ballot , and it passed with a margin of 53% to 47%.
CITY OF HALF MOON BAY – MEASURE D – 1999
In 1991 Measure A established a “Residential Dwelling Unit Building Permit Allocation System” that limited population growth to 3% per year. In 1999 Measure D was adopted to reduce the allowable annual population growth to 1% plus an additional .5% for residential development in an area designated as the downtown. The allocation of units must comport with a defined allocation system.

Election Code 9212 Report Page 5 Summaries of California Growth Management Initiatives
CITY OF LOMA LINDA – MEASURE V – 2006
Measure V limits development in the South Hills by limiting development to single-family homes in clusters. No commercial recreational developments are allowed on the hills’ northern slopes. Residential units cannot exceed 35 feet in height and must be on lots that are at least 7,200 square feet. Measure V resulted in a new Growth Management Element of the General Plan, which can only be modified with a vote of the people.
CITY OF LOS ANGELES – MEASURE U – 1996
Proposition U reduced by 50% the allowable density on commercial and industrial properties throughout Los Angeles, with the exception of Downtown. The focus of the initiative was to eliminate the potential for large, high intensity buildings to be constructed adjacent to residential neighborhoods.
CITY OF MARINA – MEASURE E – 2000
In 2000, Measure E established an Urban Growth Boundary. Measure E focused growth on the property that had formerly been occupied by Fort Ord. Measure E was designed to prevent urban sprawl.
CITY OF MORGAN HILL – MEASURE A – 2009
Since 1977, the City of Morgan Hill has used a Residential Development Control System (RDCS), which is meant to ensure that new development can be served by existing infrastructure and public services. Some components of the RCDS were established through a voter approved ballot initiative. In 2009, the voters passed an initiative that provided an exemption to the RDCS. This exemption allows up to 500 residential allotments for the 20-block area designated by the Downtown Specific Plan.
CITY OF NEWPORT BEACH – MEASURE S – 2000
Measure S was approved by the voters on November 7, 2000. The Measure became effective on December 15, 2000.
Measure S is codified in City Charter Section 423. Measure S requires voter approval for any “Major Amendment” to the General Plan. Major Amendment is defined as any project that requires a General Plan amendment that increases traffic by more than 100 trips during the

Election Code 9212 Report Page 6 Summaries of California Growth Management Initiatives
peak hours in the morning or evening; 100 dwelling units; or 40,000 square feet of commercial area. In addition, Measure S calculations must be applied to the cumulative amount of development, that required an amendment to the General Plan, that has occurred within defined Statistical Areas. This is measured by taking the proposed project plus 80% of the increase associated with projects with amendments that were processed over the previous 10 years. Projects that were subject to votes of the people are excluded from the calculations.
Koll Development proposed an office tower in 2001, and in 2004 a five-star hotel was proposed on the Balboa Peninsula. Both projects required a vote of the people, and both projects were defeated at the ballot box. Subsequently, the Irvine Company withdrew a proposed expansion to Newport Center and Pacific Life withdrew an office expansion project. No projects that require a vote have been proposed since 2004.
On July 25, 2006, the City Council adopted a comprehensive update to the General Plan. This update reduced the allowable non-residential development by 449,499 square feet, increased the allowable residential development by 1,166 dwelling units, and reduced peak hour trips by 1,121 in the morning and 958 in the evening. It was determined that this General Plan update was subject to a vote of the people, and it was placed on the ballot as Measure V. A competing measure that was called Measure X (Greenlight II) was placed on the ballot as well. In the election, which was held on November 7, 2006, Measure X failed and Measure V passed by a 54% to 46% margin.
CITY OF PLEASANTON – MEASURE PP – 2008
Measure PP prohibits residential units to be constructed on slopes of 25% or greater, or within 100 vertical feet of a ridgeline. Housing developments with 10 or fewer units are exempt from the Measure PP requirements. After January 1, 2007, properties cannot be subdivided in any way to become exempt from this requirement.
CITY OF RANCHO MIRAGE – MEASURE N – 2006
The City Council placed Measure N on the ballot. The Measure clarifies a 1994 ballot measure that limits most new structures to a maximum of 20 feet or one story. The clarification states that the maximum is both one story and 20 feet, with identified exceptions for larger lots and commercial development.

Election Code 9212 Report Page 7 Summaries of California Growth Management Initiatives
CITY OF REDLANDS – MEASURE U – 1997
Measure U was approved by the voters on November 4, 1997, certified on December 2, 1997, and became effective on December 12, 1997. Measure U added a section to the City’s General Plan called “Principles of Managed Development”. This section included the following requirements:
1. Development projects must pay 100% of their pro rata share of the cost of infrastructure and services needs generated by the project.
2. Every project that requires a General Plan Amendment, Zoning Amendment, Subdivision Map; Specific Plan, or for projects larger than 5,000 square feet, a Conditional Use Permit, is required to submit a socio-economic analysis and cost-benefit analysis. Project approval is dependent on the study finding that the project will not create unmitigated physical blight or overburden City services, and that the City benefits out weigh the costs. With a 4/5 vote, the City Council can approve a development project that does not meet the socio-economic test if they find that the benefits to the City outweigh the negative socio-economic effects that may result.
3. Development within the City’s planning area and sphere of influence must conform to the development standards imposed within the City.
4. The density standards imposed on residential development cannot be increased, and no new residential land use classification can be added without a vote of the people. No transfer of development rights is permitted with the exception of single-family residential, which can be transferred to create or preserve agricultural, open space, school or park uses.
5. Agricultural land is to be preserved to the greatest extent possible consistent with Proposition R and Measure N that were passed in 1978 and 1987, respectively.
6. Development in San Timoteo must preserve the area in as natural a state as possible.
7. Limitations on traffic levels of service, noise levels and the size of billboards are imposed.
Exemptions to the requirements are provided to the following:
1. Any project that had a vested right prior to the Effective Date of Measure U;
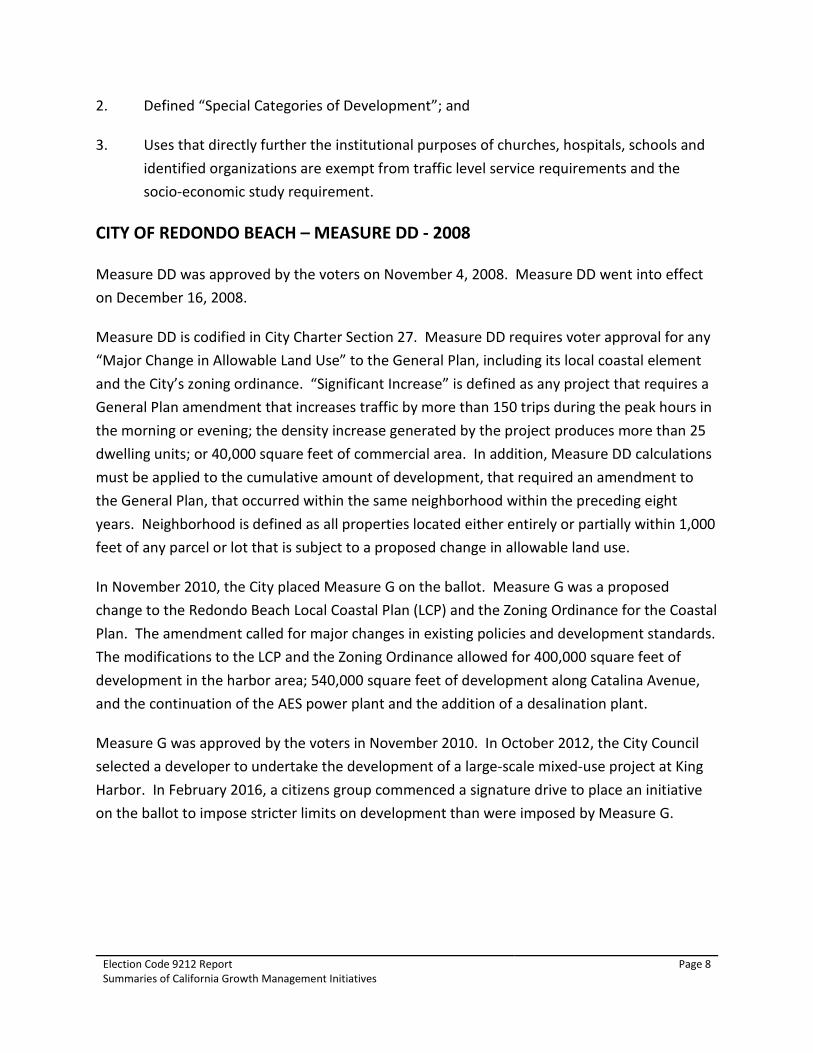
Election Code 9212 Report Page 8 Summaries of California Growth Management Initiatives
2. Defined “Special Categories of Development”; and
3. Uses that directly further the institutional purposes of churches, hospitals, schools and identified organizations are exempt from traffic level service requirements and the socio-economic study requirement.
CITY OF REDONDO BEACH – MEASURE DD - 2008
Measure DD was approved by the voters on November 4, 2008. Measure DD went into effect on December 16, 2008.
Measure DD is codified in City Charter Section 27. Measure DD requires voter approval for any “Major Change in Allowable Land Use” to the General Plan, including its local coastal element and the City’s zoning ordinance. “Significant Increase” is defined as any project that requires a General Plan amendment that increases traffic by more than 150 trips during the peak hours in the morning or evening; the density increase generated by the project produces more than 25 dwelling units; or 40,000 square feet of commercial area. In addition, Measure DD calculations must be applied to the cumulative amount of development, that required an amendment to the General Plan, that occurred within the same neighborhood within the preceding eight years. Neighborhood is defined as all properties located either entirely or partially within 1,000 feet of any parcel or lot that is subject to a proposed change in allowable land use.
In November 2010, the City placed Measure G on the ballot. Measure G was a proposed change to the Redondo Beach Local Coastal Plan (LCP) and the Zoning Ordinance for the Coastal Plan. The amendment called for major changes in existing policies and development standards. The modifications to the LCP and the Zoning Ordinance allowed for 400,000 square feet of development in the harbor area; 540,000 square feet of development along Catalina Avenue, and the continuation of the AES power plant and the addition of a desalination plant.
Measure G was approved by the voters in November 2010. In October 2012, the City Council selected a developer to undertake the development of a large-scale mixed-use project at King Harbor. In February 2016, a citizens group commenced a signature drive to place an initiative on the ballot to impose stricter limits on development than were imposed by Measure G.
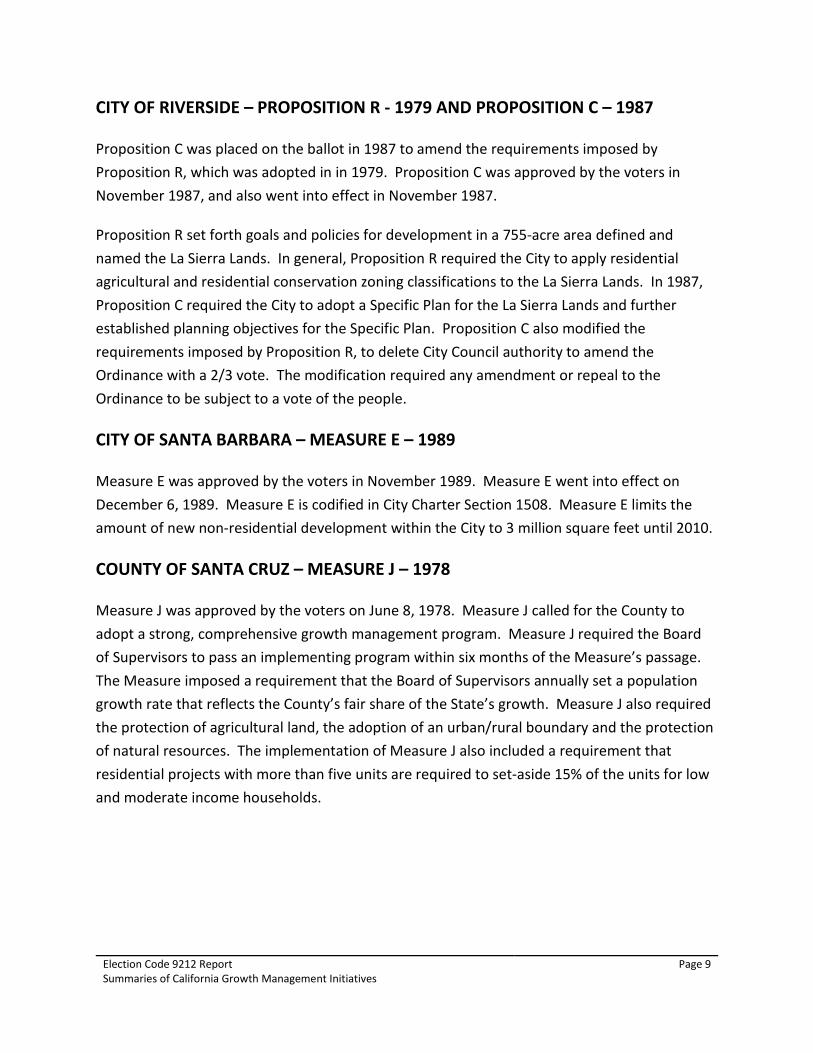
Election Code 9212 Report Page 9 Summaries of California Growth Management Initiatives
CITY OF RIVERSIDE – PROPOSITION R - 1979 AND PROPOSITION C – 1987
Proposition C was placed on the ballot in 1987 to amend the requirements imposed by Proposition R, which was adopted in in 1979. Proposition C was approved by the voters in November 1987, and also went into effect in November 1987.
Proposition R set forth goals and policies for development in a 755-acre area defined and named the La Sierra Lands. In general, Proposition R required the City to apply residential agricultural and residential conservation zoning classifications to the La Sierra Lands. In 1987, Proposition C required the City to adopt a Specific Plan for the La Sierra Lands and further established planning objectives for the Specific Plan. Proposition C also modified the requirements imposed by Proposition R, to delete City Council authority to amend the Ordinance with a 2/3 vote. The modification required any amendment or repeal to the Ordinance to be subject to a vote of the people.
CITY OF SANTA BARBARA – MEASURE E – 1989
Measure E was approved by the voters in November 1989. Measure E went into effect on December 6, 1989. Measure E is codified in City Charter Section 1508. Measure E limits the amount of new non-residential development within the City to 3 million square feet until 2010.
COUNTY OF SANTA CRUZ – MEASURE J – 1978
Measure J was approved by the voters on June 8, 1978. Measure J called for the County to adopt a strong, comprehensive growth management program. Measure J required the Board of Supervisors to pass an implementing program within six months of the Measure’s passage. The Measure imposed a requirement that the Board of Supervisors annually set a population growth rate that reflects the County’s fair share of the State’s growth. Measure J also required the protection of agricultural land, the adoption of an urban/rural boundary and the protection of natural resources. The implementation of Measure J also included a requirement that residential projects with more than five units are required to set-aside 15% of the units for low and moderate income households.

Election Code 9212 Report Page 10 Summaries of California Growth Management Initiatives
CITY OF SANTA PAULA – MEASURE L 2006
Measure L-6 was approved by the voters on November 7, 2006.
Measure L-6 resulted in an amendment to the Land use Element of the City’s General Plan to subject the following to a vote of the people:
1. Through December 31, 2025, to allow the Land Use Element to be amended to either increase the residential or commercial density, or to intensify land use; and
2. When a development or land use designation on land that either includes 81 or more contiguous acres, or is contiguous to other land for which the City Council had amended the Land Use Element at any time during the preceding five consecutive years when the cumulative acreage exceeds 81 acres.
CITY OF SIERRA MADRE – MEASURE V – 2007
Measure V was approved by the voters on April 17, 2007, and went into effect on April 18, 2007.
Measure V limits projects, in the 30-acre downtown core, to two stories and 30 feet in height. Measure V limits residential development to 13 units per acre before consideration of the density bonus allowed by California Government Code Sections 65915-65918. Any proposed project that exceeds the defined limits requires voter approval.
CITY OF SIMI VALLEY – MEASURE N – 2012
Measure N was approved by the voters on November 6, 2012. Measure N extended the “Managed Growth Plan” that regulates population growth by setting the maximum number of residential building permits that can be issued at 292 units per year. Measure N is a successor to two similar measures that were adopted in 1996 and 1986.
In general, the Managed Growth Plan cannot be amended or repealed without a vote of the people. However, there is a procedure that allows for a 4/5 vote of the City Council following a review by the Neighborhood Councils and the Planning Commission.

Election Code 9212 Report Page 11 Summaries of California Growth Management Initiatives
CITY OF SAN DIEGO – PROPOSITION A – 1985
Proposition A was approved by the voters in November 1985.
Proposition A requires a vote of the people before either of the following can occur:
1. The land use designation for any property cannot be changed from “future urbanizing” in the Progress Guide and General Plan to any other land use designation; and
2. The provisions restricting development in the “Future Urbanizing Area” cannot be amended.
Future Urbanizing Area is one of three planning areas designated by the City’s General Plan and Progress Guide. The Future Urbanizing Area consist of regions that are reserved fro agricultural uses and open space. These areas accounted for most of the City’s useable, undeveloped land.
During the 10 years following the passage of Proposition A, three measures to approve development were placed on the ballot, and one of these measures passed. Between 1996 and 1998, nine developments were placed on the ballot and seven passed. Since 1998, no developments have been placed on the ballot.
The Future Urbanizing Area designation is an interim designation designed to prevent premature development. The General Plan anticipated that over time the Future Urbanizing Area designation would be shifted to the planned urbanizing tier to accommodate the demand for growth. In 1992, the City adopted the North City Future Urbanizing Area Framework Plan. In 1994, a public vote approved a phase shift to precede completion of subarea plans to move to the planned urbanizing tier. This Plan recognized the impact uncertainty about future land use intensity and location have on sizing and financing an urban level of facilities and services.
COUNTY OF VENTURA – SOAR INITIATIVE – 1998
The County SOAR (Save Open-Space and Agricultural Resources) initiative was enacted on November 3, 1998. The initiative requires countywide voter approval before the Ventura County Board of Supervisors can rezone for development any unincorporated land designated under the County General Plan as open space, agricultural or rural. Voter approval is also needed for changes to a General Plan goals or policies related to those land-use designations. The SOAR regulations expire at the end of 2020. However, a campaign has commenced signature collection for an initiative to place an extension of the SOAR through 2050.

ATTACHMENT IV
ELECTION CODE 9212 REPORTCOSTA MESA, CALIFORNIA
CASE STUDY ANALYSISAPARTMENT DEVELOPMENT

Prepared by: Keyser Marston Associates, Inc.File name: CM 9212_3 30 16; Sales Comps
PROPERTY SALES DATA
ATTACHMENT IV : EXHIBIT A
CASE STUDY ANALYSIS

Prepared by: Keyser Marston Associates, Inc.File name: CM 9212_3 30 16; Sales Comps
ATTACHMENT IV : EXHIBIT A
CASE STUDY ANALYSISPROPERTY SALES DATAELECTION CODE 9212 REPORTCOSTA MESA, CALIFORNIA
I. Vacant Land Sales
Land Use Address Sale Date Land Area (SF) Sales PricePrice Per SF
Land
Commercial 2026 Placentia Ave 10/31/2014 33,106 $2,500,000 $76Commercial 125 E. Baker St 9/17/2014 182,952 $12,300,000 $67Industrial 1239 Victoria St 8/31/2015 75,446 $5,500,000 $73Industrial 3370 Harbor Blvd 8/10/2015 174,240 $6,300,000 $36Industrial 2025 Placentia Ave 4/8/2014 40,293 $2,024,000 $50Residential 2880 Mesa Verde Dr E 7/1/2015 90,169 $4,150,000 $46Residential 2015 Anaheim Ave 6/5/2014 61,855 $5,000,000 $81
$57
II. Improved Retail Property Sales
Building Type Address Sale Date Land Area (SF) Sales PricePrice Per SF
Land Year Built Rentable AreaPrice/SF
Rentable Area
Fast Food 2101 Harbor Blvd 1/14/2016 8,773 $895,000 $102 1967 840 $1,065Auto Repair 2076 Placentia Ave 10/28/2015 17,145 $1,775,000 $104 1969 6,900 $257Freestanding Retail 1603 Superior Ave 9/8/2015 16,640 $1,775,000 $107 1647 9,500 $187Auto Repair 322 E. 17th St 6/30/2015 10,751 $2,500,000 $233 1969 3,500 $714Retail Storefront 2330-2334 Newport Blvd 6/23/2015 9,017 $1,295,000 $144 1956 3,790 $342Freestanding Retail 840 W. 19th St 6/19/2015 8,712 $760,000 $87 1967 825 $921Freestanding Retail 124 E. 17th St 6/2/2015 8,712 $1,550,000 $178 1961 2,340 $662Auto Repair 3007-3013 Enterprise St 5/14/2015 30,827 $2,840,000 $92 1963 9,412 $302Freestanding Retail 3089 Bristol St 5/12/2015 56,628 $6,150,000 $109 1969 40,000 $154Auto Repair 1343 Logan Ave 5/12/2015 30,540 $1,875,000 $61 1960 12,020 $156Freestanding Retail 2710 Harbor Blvd 4/15/2015 30,056 $3,850,000 $128 1972 11,136 $346
Weighted Average $111 $252
Source: Costar 3/2016
Weighted Average
Note: Sales data from 3/22/2014 - 3/22/2016; Sales covering the City of Costa Mesa; Multi-property sales, non-arms length transactions, and transactions without a sales price were excluded.

Prepared by: Keyser Marston Associates, Inc.File name: CM 9212_3 30 16; PF_CS Page 9 of 65
ATTACHMENT IV: EXHIBIT B
CASE STUDY ANALYSIS
PRO FORMA ANALYSIS: APARTMENT DEVELOPMENT

Prepared by: Keyser Marston Associates, Inc.File name: CM 9212_3 30 16; PF_CS Page 10 of 65
ATTACHMENT IV: EXHIBIT B - TABLE 1
ESTIMATED CONSTRUCTION COSTSCASE STUDY ANALYSISAPARTMENT DEVELOPMENTELECTION CODE 9212 REPORTCOSTA MESA, CALIFORNIA
I. Direct CostsOn-Site Costs 180,774 Sf $7.00 /Sf of Land $1,265,000Structured Parking 500 Spaces $15,000 /Space 7,500,000Residential Building Costs 228,275 Sf of GBA $100 /Sf 22,828,000Contractor/DC Contingency Allowance 14.0% Other Direct Costs 4,423,000
Total Direct Costs $36,016,000
II. Indirect CostsArch, Engineering & Consulting 8.0% Direct Costs $2,881,000Public Permits & Fees 1 225 Units $15,000 /Unit 3,375,000Taxes, Legal & Accounting 2.0% Direct Costs 720,000Insurance 225 Units $2,500 /Unit 563,000Marketing / Leasing 225 Units $500 /Unit 113,000Developer Fee 5.0% Direct Costs 1,801,000Soft Cost Contingency Allowance 5.0% Other Indirect Costs 473,000
Total Indirect Costs $9,926,000
III. Financing CostsInterest During Construction
Land 2 18,452,000 Cost 7.0% Interest 1,937,000Construction 3 $52,512,000 Cost 7.0% Interest 3,308,000
Loan Origination Fees 4 $66,234,000 Loan 2.00 Points 1,325,000
Total Financing Costs $6,570,000
IV. Total Construction Cost 228,275 Sf of GBA $230 /Sf $52,512,000
1
2
3
4
Based on typical residential public permits and fees costs.Assumes an 18 month construction period and a 100% average outstanding balance.Assumes an 18 month construction period and a 60% average outstanding balance.Based on a 70% loan to value ratio. The value is calculated based on a 4.5% capitalization rate.

Prepared by: Keyser Marston Associates, Inc.File name: CM 9212_3 30 16; PF_CS Page 11 of 65
ATTACHMENT IV: EXHIBIT B - TABLE 2
STABILIZED NET OPERATING INCOMECASE STUDY ANALYSISAPARTMENT DEVELOPMENTELECTION CODE 9212 REPORTCOSTA MESA, CALIFORNIA
I. Rental Income 1
1 Bdrm/1 Bath 140 Units @ $2,250 /Month $3,780,0002 Bdrm/2 Bath 85 Units @ $3,025 /Month 3,085,500
Laundry/Miscellaneous Income 225 Units @ $15 /Month 40,500
Gross Income $6,906,000(Less) Vacancy & Collection Allowance 5.0% Gross Income (345,300)
Residential Effective Gross Income $6,560,700
II. Operating ExpensesGeneral Operating Expenses 225 Units @ $4,000 /Unit $900,000Property Management 5% Residential Effective Gross Income 328,000Property Taxes 2 225 Units @ $4,627 /Unit 1,041,000Reserves Deposits 225 Units @ $150 /Unit 33,800
Total Operating Expenses 225 Units @ ($8,777) /Unit ($2,302,800)
IV. Stabilized Net Operating Income $4,257,900
1
2Rents range from $2.75 to $3.00/Sf of GLA.Based on a 4.5% capitalization rate and a 1.1% property tax rate.

Prepared by: Keyser Marston Associates, Inc.File name: CM 9212_3 30 16; PF_CS Page 12 of 65
ATTACHMENT IV: EXHIBIT B - TABLE 3
ESTIMATED LAND VALUECASE STUDY ANALYSISAPARTMENT DEVELOPMENTELECTION CODE 9212 REPORTCOSTA MESA, CALIFORNIA
I. Supportable Private InvestmentStabilized Net Operating Income $4,257,900Threshold Return on Cost 6.0%
Total Supportable Private Investment $70,965,000
II. Total Construction Cost $52,512,000
III. Estimated Land Value 180,774 Sf of Land $102 /Sf of Land $18,453,000
See ATTACHMENT IV: EXHIBIT B - TABLE 1
See ATTACHMENT IV: EXHIBIT B - TABLE 2

ATTACHMENT V
FISCAL & ECONOMIC IMPACT ANALYSISELECTION CODE 9212 REPORT
COSTA MESA, CALIFORNIA

Prepared by: Keyser Marston Associates, Inc.File name: CM 9212_3 30 16; Harbor MU_Base
ATTACHMENT V: EXHIBIT A-1
HARBOR MIXED-USE OVERLAY: CURRENT GENERAL PLAN
FISCAL & ECONOMIC IMPACT ANALYSIS

Prepared by: Keyser Marston Associates, Inc.File name: CM 9212_3 30 16; Harbor MU_Base
ATTACHMENT V: EXHIBIT A-1 - TABLE 1
POPULATION ESTIMATES (FULL-TIME EQUIVALENTS)HARBOR MIXED-USE OVERLAY: CURRENT GENERAL PLANFISCAL & ECONOMIC IMPACT ANALYSISELECTION CODE 9212 REPORTCOSTA MESA, CALIFORNIA
I. Residential PopulationNumber of Units 13Average Number of Persons Per Unit 2.50
Total Residential Population 33
II. Employment Population
A. General RetailGross Building Area 337,500Estimated Square Feet Per Employee 1 500
Estimated Number of Employees 675Employment Based Resident Equivalent 24%
Estimated General Retail Employees 162
B. OfficeGross Building AreaEstimated Square Feet Per Employee 2 326
Estimated Number of Employees 0Employment Based Resident Equivalent 24%
Estimated Office Employees 0
Total Employment Population 162
III. Visitor Population (Motel Guests)Number of RoomsVisitors Per Room 1.75Average Occupancy Rate 40%
Estimated Number of Visitors 0Visitor Conversion to Resident Equivalent 75%
Total Visitor Population (Motel Guests) 0
IV. Total Population (Full-Time Equivalents) 195
1 General Plan measures against net leasable area - 10% discount from gross floor area.2 General Plan measures against the gross floor area minus an 8% vacancy rate.

Prepared by: Keyser Marston Associates, Inc.File name: CM 9212_3 30 16; Harbor MU_Base
ATTACHMENT V: EXHIBIT A-1 - TABLE 2
ANNUAL GENERAL FUND REVENUESHARBOR MIXED-USE OVERLAY: CURRENT GENERAL PLANFISCAL & ECONOMIC IMPACT ANALYSISELECTION CODE 9212 REPORTCOSTA MESA, CALIFORNIA
I. Property Tax RevenueAssessed Value
Residential 13 Units $675,000 /Unit $8,775,000General Retail 337,500 Sq. Ft. $200 /Sq. Ft. 67,500,000Office 0 Sq. Ft. $150 /Sq. Ft. 0Motels 0 Rooms $50,000 /Room 0
Total Assessed Value $76,275,000
Property Tax Rate 1.25%
Total Property Tax Revenue $953,400City Share of Property Tax Revenue 14.65%
Total Property Tax Revenue $139,700
II. Sales Tax RevenueTaxable Sales
Taxable Sales Generated by Residents 1 13 Units $11,879 /Unit $154,400General Commercial 337,500 Sq. Ft. $400 /Sq. Ft. 135,000,000
Total Taxable Sales $135,154,400
Sales Tax Rate 1.0%
Total Sales Tax Revenue $1,351,500
III. Transient Occupancy Tax RevenueRoom Sales Revenue 2 0 Rooms $12,775 /Room $0Transient Occupancy Rate 8.0%
Total Transient Occupancy Tax Revenue $0
IV. Other RevenuesElectric Franchise Fee 195 R+E+V $9.57 /Person $1,900Cable Television Franchise Fee 33 Residents $11.74 /Person 400Gas Franchise Fee 195 R+E+V $1.88 /Person 400Solid Waste Hauler Franchise Fee 195 R+E+V $14.63 /Person 2,900Business License 162 Employees $10.80 /Person 1,700Licenses and Permits 33 Residents $1.26 /Person 0Fines & Forfeitures 195 R+E+V $8.95 /Person 1,700Fees and Charges 33 Residents $18.30 /Person 600Other Government Agencies 33 Residents $9.44 /Person 300
Total Other Revenues $9,900
V. Total Annual General Fund Revenues $1,501,100
1
2 Based on an average daily room rate of $50.00 and an average occupancy rate of 40%.
Average household income is estimated based on the $675,000 for new High Density Residentialand 35% of income spent on housing expenses. Assumes that 30% of income is spent on retail goods; 70% of those sales are taxable; and 45% of the sales occur in existing Costa Mesa establishments.

Prepared by: Keyser Marston Associates, Inc.File name: CM 9212_3 30 16; Harbor MU_Base
ATTACHMENT V: EXHIBIT A-1 - TABLE 3
ANNUAL GENERAL FUND EXPENDITURES, NET FISCAL IMPACT & ECONOMIC IMPACTHARBOR MIXED-USE OVERLAY: CURRENT GENERAL PLANFISCAL & ECONOMIC IMPACT ANALYSISELECTION CODE 9212 REPORTCOSTA MESA, CALIFORNIA
I. Annual ExpendituresPolice 195 R+E+V $305.75 /Person $59,600Fire 28.79 Incidents $3,145 /Incident 90,500Parks 33 Residents $8.46 /Person 300Development Services 195 R+E+V $19.28 /Person 3,800Public Services 195 R+E+V $83.27 /Person 16,200Administrative Overhead 32.68% Other General Fund Expenditures 55,700
Total Annual Expenditures $110,800
II. Net Fiscal ImpactTotal Annual General Fund Revenues $1,501,100(Less) Total Annual Expenditures ($110,800)
Net Fiscal Impact $1,390,300
III. Economic Impact 1
A. Direct & Indirect Increase in JobsGeneral Retail 162 Direct Jobs 1.1917 Multiplier 193Office 0 Direct Jobs 1.7165 Multiplier 0
Total Direct & Indirect Increase in Jobs 193
B. Direct & Indirect Increase in Earnings 2
General Retail $33,000 Average Salary 1.3794 Multiplier $7,374,400Office $89,400 Average Salary 1.7707 Multiplier 0
Total Direct & Indirect Increase in Earnings $7,374,400
1 Source for multipliers: Regional Input-Output Modeling System (RIMS II) - RIMS II Multipliers for Orange County (2007/2013).2 Source for salaries: California Employment Development Department Occupational Employment Statistics Survey, May 2015. Direct & Indirect
Increase in Earnings estimated by multiplying the Direct Jobs times the Average Salary and the applicable Multiplier.

Prepared by: Keyser Marston Associates, Inc.File name: CM 9212_3 30 16; Harbor MU_Proposed
ATTACHMENT V: EXHIBIT A-2
HARBOR MIXED-USE OVERLAY: GENERAL PLAN UPDATE
FISCAL & ECONOMIC IMPACT ANALYSIS

Prepared by: Keyser Marston Associates, Inc.File name: CM 9212_3 30 16; Harbor MU_Proposed
ATTACHMENT V: EXHIBIT A-2 - TABLE 1
POPULATION ESTIMATES (FULL-TIME EQUIVALENTS)HARBOR MIXED-USE OVERLAY: GENERAL PLAN UPDATEFISCAL & ECONOMIC IMPACT ANALYSISELECTION CODE 9212 REPORTCOSTA MESA, CALIFORNIA
I. Residential PopulationNumber of Units 491Average Number of Persons Per Unit 2.50
Total Residential Population 1,228
II. Employment Population
A. General RetailGross Building Area 321,000Estimated Square Feet Per Employee 1 500
Estimated Number of Employees 642Employment Based Resident Equivalent 24%
Estimated General Retail Employees 154
B. OfficeGross Building AreaEstimated Square Feet Per Employee 2 326
Estimated Number of Employees 0Employment Based Resident Equivalent 24%
Estimated Office Employees 0
Total Employment Population 154
III. Visitor Population (Motel Guests)Number of RoomsVisitors Per Room 1.75Average Occupancy Rate 40%
Estimated Number of Visitors 0Visitor Conversion to Resident Equivalent 75%
Total Visitor Population (Motel Guests) 0
IV. Total Population (Full-Time Equivalents) 1,382
1 General Plan measures against net leasable area - 10% discount from gross floor area.2 General Plan measures against the gross floor area minus an 8% vacancy rate.

Prepared by: Keyser Marston Associates, Inc.File name: CM 9212_3 30 16; Harbor MU_Proposed
ATTACHMENT V: EXHIBIT A-2 - TABLE 2
ANNUAL GENERAL FUND REVENUESHARBOR MIXED-USE OVERLAY: GENERAL PLAN UPDATEFISCAL & ECONOMIC IMPACT ANALYSISELECTION CODE 9212 REPORTCOSTA MESA, CALIFORNIA
I. Property Tax RevenueAssessed Value
Residential 491 Units $675,000 /Unit $331,425,000General Retail 321,000 Sq. Ft. $200 /Sq. Ft. 64,200,000Office 0 Sq. Ft. $150 /Sq. Ft. 0Motels 0 Rooms $50,000 /Room 0
Total Assessed Value $395,625,000
Property Tax Rate 1.25%
Total Property Tax Revenue $4,945,300City Share of Property Tax Revenue 14.65%
Total Property Tax Revenue $724,700
II. Sales Tax RevenueTaxable Sales
Taxable Sales Generated by Residents 1 491 Units $11,879 /Unit $5,832,800General Commercial 321,000 Sq. Ft. $400 /Sq. Ft. 128,400,000
Total Taxable Sales $134,232,800
Sales Tax Rate 1.0%
Total Sales Tax Revenue $1,342,300
III. Transient Occupancy Tax RevenueRoom Sales Revenue 2 0 Rooms $12,775 /Room $0Transient Occupancy Rate 8.0%
Total Transient Occupancy Tax Revenue $0
IV. Other RevenuesElectric Franchise Fee 1,382 R+E+V $9.57 /Person $13,200Cable Television Franchise Fee 1,228 Residents $11.74 /Person 14,400Gas Franchise Fee 1,382 R+E+V $1.88 /Person 2,600Solid Waste Hauler Franchise Fee 1,382 R+E+V $14.63 /Person 20,200Business License 154 Employees $10.80 /Person 1,700Licenses and Permits 1,228 Residents $1.26 /Person 1,500Fines & Forfeitures 1,382 R+E+V $8.95 /Person 12,400Fees and Charges 1,228 Residents $18.30 /Person 22,500Other Government Agencies 1,228 Residents $9.44 /Person 11,600
Total Other Revenues $100,100
V. Total Annual General Fund Revenues $2,167,100
1
2 Based on an average daily room rate of $50.00 and an average occupancy rate of 40%.
Average household income is estimated based on the $675,000 for new High Density Residentialand 35% of income spent on housing expenses. Assumes that 30% of income is spent on retail goods; 70% of those sales are taxable; and 45% of the sales occur in existing Costa Mesa establishments.

Prepared by: Keyser Marston Associates, Inc.File name: CM 9212_3 30 16; Harbor MU_Proposed
ATTACHMENT V: EXHIBIT A-2 - TABLE 3
ANNUAL GENERAL FUND EXPENDITURES, NET FISCAL IMPACT & ECONOMIC IMPACTHARBOR MIXED-USE OVERLAY: GENERAL PLAN UPDATEFISCAL & ECONOMIC IMPACT ANALYSISELECTION CODE 9212 REPORTCOSTA MESA, CALIFORNIA
I. Annual ExpendituresPolice 1,382 R+E+V $305.75 /Person $422,500Fire 70.79 Incidents $3,145 /Incident 222,600Parks 1,228 Residents $8.46 /Person 10,400Development Services 1,382 R+E+V $19.28 /Person 26,600Public Services 1,382 R+E+V $83.27 /Person 115,100Administrative Overhead 32.68% Other General Fund Expenditures 260,500
Total Annual Expenditures $374,700
II. Net Fiscal ImpactTotal Annual General Fund Revenues $2,167,100(Less) Total Annual Expenditures ($374,700)
Net Fiscal Impact $1,792,400
III. Economic Impact 1
A. Direct & Indirect Increase in JobsGeneral Retail 154 Direct Jobs 1.1917 Multiplier 184Office 0 Direct Jobs 1.7165 Multiplier 0
Total Direct & Indirect Increase in Jobs 184
B. Direct & Indirect Increase in Earnings 2
General Retail $33,000 Average Salary 1.3794 Multiplier $7,010,200Office $89,400 Average Salary 1.7707 Multiplier 0
Total Direct & Indirect Increase in Earnings $7,010,200
1 Source for multipliers: Regional Input-Output Modeling System (RIMS II) - RIMS II Multipliers for Orange County (2007/2013).2 Source for salaries: California Employment Development Department Occupational Employment Statistics Survey, May 2015. Direct & Indirect
Increase in Earnings estimated by multiplying the Direct Jobs times the Average Salary and the applicable Multiplier.

Prepared by: Keyser Marston Associates, Inc.File name: CM 9212_3 30 16; Res Inc_H_Base
ATTACHMENT V: EXHIBIT B-1
RESIDENTIAL INCENTIVE - HARBOR: CURRENT GENERAL PLAN
FISCAL & ECONOMIC IMPACT ANALYSIS

Prepared by: Keyser Marston Associates, Inc.File name: CM 9212_3 30 16; Res Inc_H_Base
ATTACHMENT V: EXHIBIT B-1 - TABLE 1
POPULATION ESTIMATES (FULL-TIME EQUIVALENTS)RESIDENTIAL INCENTIVE - HARBOR: CURRENT GENERAL PLANFISCAL & ECONOMIC IMPACT ANALYSISELECTION CODE 9212 REPORTCOSTA MESA, CALIFORNIA
I. Residential PopulationNumber of Units 84Average Number of Persons Per Unit 2.50
Total Residential Population 210
II. Employment Population
A. General RetailGross Building Area 356,800Estimated Square Feet Per Employee 1 500
Estimated Number of Employees 714Employment Based Resident Equivalent 24%
Estimated General Retail Employees 171
B. OfficeGross Building AreaEstimated Square Feet Per Employee 2 326
Estimated Number of Employees 0Employment Based Resident Equivalent 24%
Estimated Office Employees 0
Total Employment Population 171
III. Visitor Population (Motel Guests)Number of RoomsVisitors Per Room 1.75Average Occupancy Rate 40%
Estimated Number of Visitors 0Visitor Conversion to Resident Equivalent 75%
Total Visitor Population (Motel Guests) 0
IV. Total Population (Full-Time Equivalents) 381
1 General Plan measures against net leasable area - 10% discount from gross floor area.2 General Plan measures against the gross floor area minus an 8% vacancy rate.

Prepared by: Keyser Marston Associates, Inc.File name: CM 9212_3 30 16; Res Inc_H_Base
ATTACHMENT V: EXHIBIT B-1 - TABLE 2
ANNUAL GENERAL FUND REVENUESRESIDENTIAL INCENTIVE - HARBOR: CURRENT GENERAL PLANFISCAL & ECONOMIC IMPACT ANALYSISELECTION CODE 9212 REPORTCOSTA MESA, CALIFORNIA
I. Property Tax RevenueAssessed Value
Residential 84 Units $675,000 /Unit $56,700,000General Retail 356,800 Sq. Ft. $200 /Sq. Ft. 71,360,000Office 0 Sq. Ft. $150 /Sq. Ft. 0Motels 0 Rooms $50,000 /Room 0
Total Assessed Value $128,060,000
Property Tax Rate 1.25%
Total Property Tax Revenue $1,600,800City Share of Property Tax Revenue 14.65%
Total Property Tax Revenue $234,600
II. Sales Tax RevenueTaxable Sales
Taxable Sales Generated by Residents 1 84 Units $11,879 /Unit $997,900General Commercial 356,800 Sq. Ft. $400 /Sq. Ft. 142,720,000
Total Taxable Sales $143,717,900
Sales Tax Rate 1.0%
Total Sales Tax Revenue $1,437,200
III. Transient Occupancy Tax RevenueRoom Sales Revenue 2 0 Rooms $12,775 /Room $0Transient Occupancy Rate 8.0%
Total Transient Occupancy Tax Revenue $0
IV. Other RevenuesElectric Franchise Fee 381 R+E+V $9.57 /Person $3,600Cable Television Franchise Fee 210 Residents $11.74 /Person 2,500Gas Franchise Fee 381 R+E+V $1.88 /Person 700Solid Waste Hauler Franchise Fee 381 R+E+V $14.63 /Person 5,600Business License 171 Employees $10.80 /Person 1,800Licenses and Permits 210 Residents $1.26 /Person 300Fines & Forfeitures 381 R+E+V $8.95 /Person 3,400Fees and Charges 210 Residents $18.30 /Person 3,800Other Government Agencies 210 Residents $9.44 /Person 2,000
Total Other Revenues $23,700
V. Total Annual General Fund Revenues $1,695,500
1
2 Based on an average daily room rate of $50.00 and an average occupancy rate of 40%.
Average household income is estimated based on the $675,000 for new High Density Residentialand 35% of income spent on housing expenses. Assumes that 30% of income is spent on retail goods; 70% of those sales are taxable; and 45% of the sales occur in existing Costa Mesa establishments.

Prepared by: Keyser Marston Associates, Inc.File name: CM 9212_3 30 16; Res Inc_H_Base
ATTACHMENT V: EXHIBIT B-1 - TABLE 3
ANNUAL GENERAL FUND EXPENDITURES, NET FISCAL IMPACT & ECONOMIC IMPACTRESIDENTIAL INCENTIVE - HARBOR: CURRENT GENERAL PLANFISCAL & ECONOMIC IMPACT ANALYSISELECTION CODE 9212 REPORTCOSTA MESA, CALIFORNIA
I. Annual ExpendituresPolice 381 R+E+V $305.75 /Person $116,500Fire 36.81 Incidents $3,145 /Incident 115,800Parks 210 Residents $8.46 /Person 1,800Development Services 381 R+E+V $19.28 /Person 7,300Public Services 381 R+E+V $83.27 /Person 31,700Administrative Overhead 32.68% Other General Fund Expenditures 89,200
Total Annual Expenditures $156,600
II. Net Fiscal ImpactTotal Annual General Fund Revenues $1,695,500(Less) Total Annual Expenditures ($156,600)
Net Fiscal Impact $1,538,900
III. Economic Impact 1
A. Direct & Indirect Increase in JobsGeneral Retail 171 Direct Jobs 1.1917 Multiplier 204Office 0 Direct Jobs 1.7165 Multiplier 0
Total Direct & Indirect Increase in Jobs 204
B. Direct & Indirect Increase in Earnings 2
General Retail $33,000 Average Salary 1.3794 Multiplier $7,784,100Office $89,400 Average Salary 1.7707 Multiplier 0
Total Direct & Indirect Increase in Earnings $7,784,100
1 Source for multipliers: Regional Input-Output Modeling System (RIMS II) - RIMS II Multipliers for Orange County (2007/2013).2 Source for salaries: California Employment Development Department Occupational Employment Statistics Survey, May 2015. Direct & Indirect
Increase in Earnings estimated by multiplying the Direct Jobs times the Average Salary and the applicable Multiplier.

Prepared by: Keyser Marston Associates, Inc.File name: CM 9212_3 30 16; Res Inc_H_Proposed
ATTACHMENT V: EXHIBIT B-2
RESIDENTIAL INCENTIVE - HARBOR: GENERAL PLAN UPDATE
FISCAL & ECONOMIC IMPACT ANALYSIS

Prepared by: Keyser Marston Associates, Inc.File name: CM 9212_3 30 16; Res Inc_H_Proposed
ATTACHMENT V: EXHIBIT B-2 - TABLE 1
POPULATION ESTIMATES (FULL-TIME EQUIVALENTS)RESIDENTIAL INCENTIVE - HARBOR: GENERAL PLAN UPDATEFISCAL & ECONOMIC IMPACT ANALYSISELECTION CODE 9212 REPORTCOSTA MESA, CALIFORNIA
I. Residential PopulationNumber of Units 1,063Average Number of Persons Per Unit 2.50
Total Residential Population 2,658
II. Employment Population
A. General RetailGross Building Area 178,400Estimated Square Feet Per Employee 1 500
Estimated Number of Employees 357Employment Based Resident Equivalent 24%
Estimated General Retail Employees 86
B. OfficeGross Building AreaEstimated Square Feet Per Employee 2 326
Estimated Number of Employees 0Employment Based Resident Equivalent 24%
Estimated Office Employees 0
Total Employment Population 86
III. Visitor Population (Motel Guests)Number of RoomsVisitors Per Room 1.75Average Occupancy Rate 40%
Estimated Number of Visitors 0Visitor Conversion to Resident Equivalent 75%
Total Visitor Population (Motel Guests) 0
IV. Total Population (Full-Time Equivalents) 2,744
1 General Plan measures against net leasable area - 10% discount from gross floor area.2 General Plan measures against the gross floor area minus an 8% vacancy rate.

Prepared by: Keyser Marston Associates, Inc.File name: CM 9212_3 30 16; Res Inc_H_Proposed
ATTACHMENT V: EXHIBIT B-2 - TABLE 2
ANNUAL GENERAL FUND REVENUESRESIDENTIAL INCENTIVE - HARBOR: GENERAL PLAN UPDATEFISCAL & ECONOMIC IMPACT ANALYSISELECTION CODE 9212 REPORTCOSTA MESA, CALIFORNIA
I. Property Tax RevenueAssessed Value
Residential 1,063 Units $675,000 /Unit $717,525,000General Retail 178,400 Sq. Ft. $200 /Sq. Ft. 35,680,000Office 0 Sq. Ft. $150 /Sq. Ft. 0Motels 0 Rooms $50,000 /Room 0
Total Assessed Value $753,205,000
Property Tax Rate 1.25%
Total Property Tax Revenue $9,415,100City Share of Property Tax Revenue 14.65%
Total Property Tax Revenue $1,379,700
II. Sales Tax RevenueTaxable Sales
Taxable Sales Generated by Residents 1 1,063 Units $11,879 /Unit $12,627,800General Commercial 178,400 Sq. Ft. $400 /Sq. Ft. 71,360,000
Total Taxable Sales $83,987,800
Sales Tax Rate 1.0%
Total Sales Tax Revenue $839,900
III. Transient Occupancy Tax RevenueRoom Sales Revenue 2 0 Rooms $12,775 /Room $0Transient Occupancy Rate 8.0%
Total Transient Occupancy Tax Revenue $0
IV. Other RevenuesElectric Franchise Fee 2,744 R+E+V $9.57 /Person $26,300Cable Television Franchise Fee 2,658 Residents $11.74 /Person 31,200Gas Franchise Fee 2,744 R+E+V $1.88 /Person 5,200Solid Waste Hauler Franchise Fee 2,744 R+E+V $14.63 /Person 40,100Business License 86 Employees $10.80 /Person 900Licenses and Permits 2,658 Residents $1.26 /Person 3,300Fines & Forfeitures 2,744 R+E+V $8.95 /Person 24,600Fees and Charges 2,658 Residents $18.30 /Person 48,600Other Government Agencies 2,658 Residents $9.44 /Person 25,100
Total Other Revenues $205,300
V. Total Annual General Fund Revenues $2,424,900
1
2 Based on an average daily room rate of $50.00 and an average occupancy rate of 40%.
Average household income is estimated based on the $675,000 for new High Density Residentialand 35% of income spent on housing expenses. Assumes that 30% of income is spent on retail goods; 70% of those sales are taxable; and 45% of the sales occur in existing Costa Mesa establishments.

Prepared by: Keyser Marston Associates, Inc.File name: CM 9212_3 30 16; Res Inc_H_Proposed
ATTACHMENT V: EXHIBIT B-2 - TABLE 3
ANNUAL GENERAL FUND EXPENDITURES, NET FISCAL IMPACT & ECONOMIC IMPACTRESIDENTIAL INCENTIVE - HARBOR: GENERAL PLAN UPDATEFISCAL & ECONOMIC IMPACT ANALYSISELECTION CODE 9212 REPORTCOSTA MESA, CALIFORNIA
I. Annual ExpendituresPolice 2,744 R+E+V $305.75 /Person $839,000Fire 111.01 Incidents $3,145 /Incident 349,100Parks 2,658 Residents $8.46 /Person 22,500Development Services 2,744 R+E+V $19.28 /Person 52,900Public Services 2,744 R+E+V $83.27 /Person 228,500Administrative Overhead 32.68% Other General Fund Expenditures 487,600
Total Annual Expenditures $653,000
II. Net Fiscal ImpactTotal Annual General Fund Revenues $2,424,900(Less) Total Annual Expenditures ($653,000)
Net Fiscal Impact $1,771,900
III. Economic Impact 1
A. Direct & Indirect Increase in JobsGeneral Retail 86 Direct Jobs 1.1917 Multiplier 102Office 0 Direct Jobs 1.7165 Multiplier 0
Total Direct & Indirect Increase in Jobs 102
B. Direct & Indirect Increase in Earnings 2
General Retail $33,000 Average Salary 1.3794 Multiplier $3,914,800Office $89,400 Average Salary 1.7707 Multiplier 0
Total Direct & Indirect Increase in Earnings $3,914,800
1 Source for multipliers: Regional Input-Output Modeling System (RIMS II) - RIMS II Multipliers for Orange County (2007/2013).2 Source for salaries: California Employment Development Department Occupational Employment Statistics Survey, May 2015. Direct & Indirect
Increase in Earnings estimated by multiplying the Direct Jobs times the Average Salary and the applicable Multiplier.
Prepared by: Keyser Marston Associates, Inc.File name: CM 9212_3 30 16; Res Inc_N_Base
ATTACHMENT V: EXHIBIT C-1
RESIDENTIAL INCENTIVE - NEWPORT: CURRENT GENERAL PLAN
FISCAL & ECONOMIC IMPACT ANALYSIS

Prepared by: Keyser Marston Associates, Inc.File name: CM 9212_3 30 16; Res Inc_N_Base
ATTACHMENT V: EXHIBIT C-1 - TABLE 1
POPULATION ESTIMATES (FULL-TIME EQUIVALENTS)RESIDENTIAL INCENTIVE - NEWPORT: CURRENT GENERAL PLANFISCAL & ECONOMIC IMPACT ANALYSISELECTION CODE 9212 REPORTCOSTA MESA, CALIFORNIA
I. Residential PopulationNumber of Units 237Average Number of Persons Per Unit 2.50
Total Residential Population 593
II. Employment Population
A. General RetailGross Building Area 582,200Estimated Square Feet Per Employee 1 500
Estimated Number of Employees 1,164Employment Based Resident Equivalent 24%
Estimated General Retail Employees 279
B. OfficeGross Building AreaEstimated Square Feet Per Employee 2 326
Estimated Number of Employees 0Employment Based Resident Equivalent 24%
Estimated Office Employees 0
Total Employment Population 279
III. Visitor Population (Motel Guests)Number of RoomsVisitors Per Room 1.75Average Occupancy Rate 40%
Estimated Number of Visitors 0Visitor Conversion to Resident Equivalent 75%
Total Visitor Population (Motel Guests) 0
IV. Total Population (Full-Time Equivalents) 872
1 General Plan measures against net leasable area - 10% discount from gross floor area.2 General Plan measures against the gross floor area minus an 8% vacancy rate.

Prepared by: Keyser Marston Associates, Inc.File name: CM 9212_3 30 16; Res Inc_N_Base
ATTACHMENT V: EXHIBIT C-1 - TABLE 2
ANNUAL GENERAL FUND REVENUESRESIDENTIAL INCENTIVE - NEWPORT: CURRENT GENERAL PLANFISCAL & ECONOMIC IMPACT ANALYSISELECTION CODE 9212 REPORTCOSTA MESA, CALIFORNIA
I. Property Tax RevenueAssessed Value
Residential 237 Units $675,000 /Unit $159,975,000General Retail 582,200 Sq. Ft. $200 /Sq. Ft. 116,440,000Office 0 Sq. Ft. $150 /Sq. Ft. 0Motels 0 Rooms $50,000 /Room 0
Total Assessed Value $276,415,000
Property Tax Rate 1.25%
Total Property Tax Revenue $3,455,200City Share of Property Tax Revenue 14.65%
Total Property Tax Revenue $506,300
II. Sales Tax RevenueTaxable Sales
Taxable Sales Generated by Residents 1 237 Units $11,879 /Unit $2,815,400General Commercial 582,200 Sq. Ft. $400 /Sq. Ft. 232,880,000
Total Taxable Sales $235,695,400
Sales Tax Rate 1.0%
Total Sales Tax Revenue $2,357,000
III. Transient Occupancy Tax RevenueRoom Sales Revenue 2 0 Rooms $12,775 /Room $0Transient Occupancy Rate 8.0%
Total Transient Occupancy Tax Revenue $0
IV. Other RevenuesElectric Franchise Fee 872 R+E+V $9.57 /Person $8,300Cable Television Franchise Fee 593 Residents $11.74 /Person 7,000Gas Franchise Fee 872 R+E+V $1.88 /Person 1,600Solid Waste Hauler Franchise Fee 872 R+E+V $14.63 /Person 12,800Business License 279 Employees $10.80 /Person 3,000Licenses and Permits 593 Residents $1.26 /Person 700Fines & Forfeitures 872 R+E+V $8.95 /Person 7,800Fees and Charges 593 Residents $18.30 /Person 10,900Other Government Agencies 593 Residents $9.44 /Person 5,600
Total Other Revenues $57,700
V. Total Annual General Fund Revenues $2,921,000
1
2 Based on an average daily room rate of $50.00 and an average occupancy rate of 40%.
Average household income is estimated based on the $675,000 for new High Density Residentialand 35% of income spent on housing expenses. Assumes that 30% of income is spent on retail goods; 70% of those sales are taxable; and 45% of the sales occur in existing Costa Mesa establishments.

Prepared by: Keyser Marston Associates, Inc.File name: CM 9212_3 30 16; Res Inc_N_Base
ATTACHMENT V: EXHIBIT C-1 - TABLE 3
ANNUAL GENERAL FUND EXPENDITURES, NET FISCAL IMPACT & ECONOMIC IMPACTRESIDENTIAL INCENTIVE - NEWPORT: CURRENT GENERAL PLANFISCAL & ECONOMIC IMPACT ANALYSISELECTION CODE 9212 REPORTCOSTA MESA, CALIFORNIA
I. Annual ExpendituresPolice 872 R+E+V $305.75 /Person $266,600Fire 69.12 Incidents $3,145 /Incident 217,400Parks 593 Residents $8.46 /Person 5,000Development Services 872 R+E+V $19.28 /Person 16,800Public Services 872 R+E+V $83.27 /Person 72,600Administrative Overhead 32.68% Other General Fund Expenditures 189,000
Total Annual Expenditures $311,800
II. Net Fiscal ImpactTotal Annual General Fund Revenues $2,921,000(Less) Total Annual Expenditures ($311,800)
Net Fiscal Impact $2,609,200
III. Economic Impact 1
A. Direct & Indirect Increase in JobsGeneral Retail 279 Direct Jobs 1.1917 Multiplier 332Office 0 Direct Jobs 1.7165 Multiplier 0
Total Direct & Indirect Increase in Jobs 332
B. Direct & Indirect Increase in Earnings 2
General Retail $33,000 Average Salary 1.3794 Multiplier $12,700,400Office $89,400 Average Salary 1.7707 Multiplier 0
Total Direct & Indirect Increase in Earnings $12,700,400
1 Source for multipliers: Regional Input-Output Modeling System (RIMS II) - RIMS II Multipliers for Orange County (2007/2013).2 Source for salaries: California Employment Development Department Occupational Employment Statistics Survey, May 2015. Direct & Indirect
Increase in Earnings estimated by multiplying the Direct Jobs times the Average Salary and the applicable Multiplier.

Prepared by: Keyser Marston Associates, Inc.File name: CM 9212_3 30 16; Res Inc_N_Proposed
ATTACHMENT V: EXHIBIT C-2
LA TIMES SITE: GENERAL PLAN UPDATE
FISCAL & ECONOMIC IMPACT ANALYSIS

Prepared by: Keyser Marston Associates, Inc.File name: CM 9212_3 30 16; Res Inc_N_Proposed
ATTACHMENT V: EXHIBIT C-2 - TABLE 1
POPULATION ESTIMATES (FULL-TIME EQUIVALENTS)LA TIMES SITE: GENERAL PLAN UPDATEFISCAL & ECONOMIC IMPACT ANALYSISELECTION CODE 9212 REPORTCOSTA MESA, CALIFORNIA
I. Residential PopulationNumber of Units 1,210Average Number of Persons Per Unit 2.50
Total Residential Population 3,025
II. Employment Population
A. General RetailGross Building Area 291,100Estimated Square Feet Per Employee 1 500
Estimated Number of Employees 582Employment Based Resident Equivalent 24%
Estimated General Retail Employees 140
B. OfficeGross Building AreaEstimated Square Feet Per Employee 2 326
Estimated Number of Employees 0Employment Based Resident Equivalent 24%
Estimated Office Employees 0
Total Employment Population 140
III. Visitor Population (Motel Guests)Number of RoomsVisitors Per Room 1.75Average Occupancy Rate 40%
Estimated Number of Visitors 0Visitor Conversion to Resident Equivalent 75%
Total Visitor Population (Motel Guests) 0
IV. Total Population (Full-Time Equivalents) 3,165
1 General Plan measures against net leasable area - 10% discount from gross floor area.2 General Plan measures against the gross floor area minus an 8% vacancy rate.

Prepared by: Keyser Marston Associates, Inc.File name: CM 9212_3 30 16; Res Inc_N_Proposed
ATTACHMENT V: EXHIBIT C-2 - TABLE 2
ANNUAL GENERAL FUND REVENUESLA TIMES SITE: GENERAL PLAN UPDATEFISCAL & ECONOMIC IMPACT ANALYSISELECTION CODE 9212 REPORTCOSTA MESA, CALIFORNIA
I. Property Tax RevenueAssessed Value
Residential 1,210 Units $675,000 /Unit $816,750,000General Retail 291,100 Sq. Ft. $200 /Sq. Ft. 58,220,000Office 0 Sq. Ft. $150 /Sq. Ft. 0Motels 0 Rooms $50,000 /Room 0
Total Assessed Value $874,970,000
Property Tax Rate 1.25%
Total Property Tax Revenue $10,937,100City Share of Property Tax Revenue 14.65%
Total Property Tax Revenue $1,602,700
II. Sales Tax RevenueTaxable Sales
Taxable Sales Generated by Residents 1 1,210 Units $11,879 /Unit $14,374,100General Commercial 291,100 Sq. Ft. $400 /Sq. Ft. 116,440,000
Total Taxable Sales $130,814,100
Sales Tax Rate 1.0%
Total Sales Tax Revenue $1,308,100
III. Transient Occupancy Tax RevenueRoom Sales Revenue 2 0 Rooms $12,775 /Room $0Transient Occupancy Rate 8.0%
Total Transient Occupancy Tax Revenue $0
IV. Other RevenuesElectric Franchise Fee 3,165 R+E+V $9.57 /Person $30,300Cable Television Franchise Fee 3,025 Residents $11.74 /Person 35,500Gas Franchise Fee 3,165 R+E+V $1.88 /Person 6,000Solid Waste Hauler Franchise Fee 3,165 R+E+V $14.63 /Person 46,300Business License 140 Employees $10.80 /Person 1,500Licenses and Permits 3,025 Residents $1.26 /Person 3,800Fines & Forfeitures 3,165 R+E+V $8.95 /Person 28,300Fees and Charges 3,025 Residents $18.30 /Person 55,400Other Government Agencies 3,025 Residents $9.44 /Person 28,600
Total Other Revenues $235,700
V. Total Annual General Fund Revenues $3,146,500
1
2 Based on an average daily room rate of $50.00 and an average occupancy rate of 40%.
Average household income is estimated based on the $675,000 for new High Density Residentialand 35% of income spent on housing expenses. Assumes that 30% of income is spent on retail goods; 70% of those sales are taxable; and 45% of the sales occur in existing Costa Mesa establishments.

Prepared by: Keyser Marston Associates, Inc.File name: CM 9212_3 30 16; Res Inc_N_Proposed
ATTACHMENT V: EXHIBIT C-2 - TABLE 3
ANNUAL GENERAL FUND EXPENDITURES, NET FISCAL IMPACT & ECONOMIC IMPACTLA TIMES SITE: GENERAL PLAN UPDATEFISCAL & ECONOMIC IMPACT ANALYSISELECTION CODE 9212 REPORTCOSTA MESA, CALIFORNIA
I. Annual ExpendituresPolice 3,165 R+E+V $305.75 /Person $967,700Fire 133.56 Incidents $3,145 /Incident 420,000Parks 3,025 Residents $8.46 /Person 25,600Development Services 3,165 R+E+V $19.28 /Person 61,000Public Services 3,165 R+E+V $83.27 /Person 263,500Administrative Overhead 32.68% Other General Fund Expenditures 567,900
Total Annual Expenditures $770,100
II. Net Fiscal ImpactTotal Annual General Fund Revenues $3,146,500(Less) Total Annual Expenditures ($770,100)
Net Fiscal Impact $2,376,400
III. Economic Impact 1
A. Direct & Indirect Increase in JobsGeneral Retail 140 Direct Jobs 1.1917 Multiplier 167Office 0 Direct Jobs 1.7165 Multiplier 0
Total Direct & Indirect Increase in Jobs 167
B. Direct & Indirect Increase in Earnings 2
General Retail $33,000 Average Salary 1.3794 Multiplier $6,372,900Office $89,400 Average Salary 1.7707 Multiplier 0
Total Direct & Indirect Increase in Earnings $6,372,900
1 Source for multipliers: Regional Input-Output Modeling System (RIMS II) - RIMS II Multipliers for Orange County (2007/2013).2 Source for salaries: California Employment Development Department Occupational Employment Statistics Survey, May 2015. Direct & Indirect
Increase in Earnings estimated by multiplying the Direct Jobs times the Average Salary and the applicable Multiplier.
Prepared by: Keyser Marston Associates, Inc.File name: CM 9212_3 30 16; LA Times_Base
ATTACHMENT V: EXHIBIT D-1
LA TIMES SITE: CURRENT GENERAL PLAN
FISCAL & ECONOMIC IMPACT ANALYSIS

Prepared by: Keyser Marston Associates, Inc.File name: CM 9212_3 30 16; LA Times_Base
ATTACHMENT V: EXHIBIT D-1 - TABLE 1
POPULATION ESTIMATES (FULL-TIME EQUIVALENTS)LA TIMES SITE: CURRENT GENERAL PLANFISCAL & ECONOMIC IMPACT ANALYSISELECTION CODE 9212 REPORTCOSTA MESA, CALIFORNIA
I. Residential PopulationNumber of UnitsAverage Number of Persons Per Unit
Total Residential Population 0
II. Employment Population
A. General RetailGross Building AreaEstimated Square Feet Per Employee 1 500
Estimated Number of Employees 0Employment Based Resident Equivalent 24%
Estimated General Retail Employees 0
B. ManufacturingGross Building Area 374,000Estimated Square Feet Per Employee 2 300
Estimated Number of Employees 1,247Employment Based Resident Equivalent 24%
Estimated Manufacturing Employees 299
Total Employment Population 299
III. Visitor Population (Motel Guests)Number of RoomsVisitors Per Room 1.75Average Occupancy Rate 40%
Estimated Number of Visitors 0Visitor Conversion to Resident Equivalent 75%
Total Visitor Population (Motel Guests) 0
IV. Total Population (Full-Time Equivalents) 299
1 General Plan measures against net leasable area - 10% discount from gross floor area.2 General Plan measures against the gross floor area minus an 8% vacancy rate.

Prepared by: Keyser Marston Associates, Inc.File name: CM 9212_3 30 16; LA Times_Base
ATTACHMENT V: EXHIBIT D-1 - TABLE 2
ANNUAL GENERAL FUND REVENUESLA TIMES SITE: CURRENT GENERAL PLANFISCAL & ECONOMIC IMPACT ANALYSISELECTION CODE 9212 REPORTCOSTA MESA, CALIFORNIA
I. Property Tax RevenueAssessed Value
Residential 0 Units /Unit $0General Retail 0 Sq. Ft. $200 /Sq. Ft. 0Office 374,000 Sq. Ft. $150 /Sq. Ft. 56,100,000Motels 0 Rooms $50,000 /Room 0
Total Assessed Value $56,100,000
Property Tax Rate 1.25%
Total Property Tax Revenue $701,300City Share of Property Tax Revenue 14.65%
Total Property Tax Revenue $102,800
II. Sales Tax RevenueTaxable Sales
Taxable Sales Generated by Residents 1 0 Units /Unit $0General Commercial 0 Sq. Ft. $400 /Sq. Ft. 0
Total Taxable Sales $0
Sales Tax Rate 1.0%
Total Sales Tax Revenue $0
III. Transient Occupancy Tax RevenueRoom Sales Revenue 2 0 Rooms $12,775 /Room $0Transient Occupancy Rate 8.0%
Total Transient Occupancy Tax Revenue $0
IV. Other RevenuesElectric Franchise Fee 299 R+E+V $9.57 /Person $2,900Cable Television Franchise Fee 0 Residents $11.74 /Person 0Gas Franchise Fee 299 R+E+V $1.88 /Person 600Solid Waste Hauler Franchise Fee 299 R+E+V $14.63 /Person 4,400Business License 299 Employees $10.80 /Person 3,200Licenses and Permits 0 Residents $1.26 /Person 0Fines & Forfeitures 299 R+E+V $8.95 /Person 2,700Fees and Charges 0 Residents $18.30 /Person 0Other Government Agencies 0 Residents $9.44 /Person 0
Total Other Revenues $13,800
V. Total Annual General Fund Revenues $116,600
1
2 Based on an average daily room rate of $50.00 and an average occupancy rate of 40%.
Average household income is estimated based on the $675,000 for new High Density Residentialand 35% of income spent on housing expenses. Assumes that 30% of income is spent on retail goods; 70% of those sales are taxable; and 45% of the sales occur in existing Costa Mesa establishments.

Prepared by: Keyser Marston Associates, Inc.File name: CM 9212_3 30 16; LA Times_Base
ATTACHMENT V: EXHIBIT D-1 - TABLE 3
ANNUAL GENERAL FUND EXPENDITURES, NET FISCAL IMPACT & ECONOMIC IMPACTLA TIMES SITE: CURRENT GENERAL PLANFISCAL & ECONOMIC IMPACT ANALYSISELECTION CODE 9212 REPORTCOSTA MESA, CALIFORNIA
I. Annual ExpendituresPolice 299 R+E+V $305.75 /Person $91,400Fire 6.10 Incidents $3,145 /Incident 19,200Parks 0 Residents $8.46 /Person 0Development Services 299 R+E+V $19.28 /Person 5,800Public Services 299 R+E+V $83.27 /Person 24,900Administrative Overhead 32.68% Other General Fund Expenditures 46,200
Total Annual Expenditures $49,900
II. Net Fiscal ImpactTotal Annual General Fund Revenues $116,600(Less) Total Annual Expenditures ($49,900)
Net Fiscal Impact $66,700
III. Economic Impact 1
A. Direct & Indirect Increase in JobsGeneral Retail 0 Direct Jobs 1.1917 Multiplier 0Manufacturing 299 Direct Jobs 1.7286 Multiplier 517
Total Direct & Indirect Increase in Jobs 517
B. Direct & Indirect Increase in Earnings 2
General Retail $33,000 Average Salary 1.3794 Multiplier $0Manufacturing $34,100 Average Salary 1.6638 Multiplier 16,963,800
Total Direct & Indirect Increase in Earnings $16,963,800
1 Source for multipliers: Regional Input-Output Modeling System (RIMS II) - RIMS II Multipliers for Orange County (2007/2013).2 Source for salaries: California Employment Development Department Occupational Employment Statistics Survey, May 2015. Direct & Indirect
Increase in Earnings estimated by multiplying the Direct Jobs times the Average Salary and the applicable Multiplier.

Prepared by: Keyser Marston Associates, Inc.File name: CM 9212_3 30 16; LA Times_Proposed
ATTACHMENT V: EXHIBIT D-2
LA TIMES SITE: GENERAL PLAN UPDATE
FISCAL & ECONOMIC IMPACT ANALYSIS
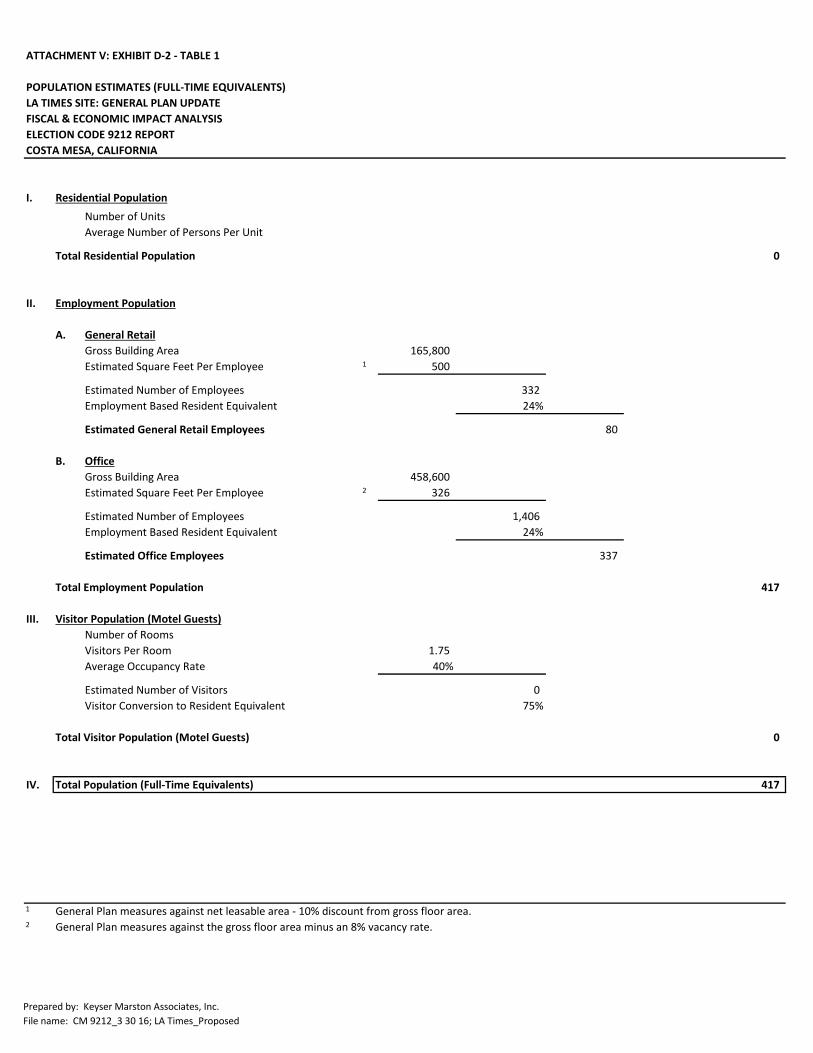
Prepared by: Keyser Marston Associates, Inc.File name: CM 9212_3 30 16; LA Times_Proposed
ATTACHMENT V: EXHIBIT D-2 - TABLE 1
POPULATION ESTIMATES (FULL-TIME EQUIVALENTS)LA TIMES SITE: GENERAL PLAN UPDATEFISCAL & ECONOMIC IMPACT ANALYSISELECTION CODE 9212 REPORTCOSTA MESA, CALIFORNIA
I. Residential PopulationNumber of UnitsAverage Number of Persons Per Unit
Total Residential Population 0
II. Employment Population
A. General RetailGross Building Area 165,800Estimated Square Feet Per Employee 1 500
Estimated Number of Employees 332Employment Based Resident Equivalent 24%
Estimated General Retail Employees 80
B. OfficeGross Building Area 458,600Estimated Square Feet Per Employee 2 326
Estimated Number of Employees 1,406Employment Based Resident Equivalent 24%
Estimated Office Employees 337
Total Employment Population 417
III. Visitor Population (Motel Guests)Number of RoomsVisitors Per Room 1.75Average Occupancy Rate 40%
Estimated Number of Visitors 0Visitor Conversion to Resident Equivalent 75%
Total Visitor Population (Motel Guests) 0
IV. Total Population (Full-Time Equivalents) 417
1 General Plan measures against net leasable area - 10% discount from gross floor area.2 General Plan measures against the gross floor area minus an 8% vacancy rate.

Prepared by: Keyser Marston Associates, Inc.File name: CM 9212_3 30 16; LA Times_Proposed
ATTACHMENT V: EXHIBIT D-2 - TABLE 2
ANNUAL GENERAL FUND REVENUESLA TIMES SITE: GENERAL PLAN UPDATEFISCAL & ECONOMIC IMPACT ANALYSISELECTION CODE 9212 REPORTCOSTA MESA, CALIFORNIA
I. Property Tax RevenueAssessed Value
Residential 0 Units /Unit $0General Retail 165,800 Sq. Ft. $200 /Sq. Ft. 33,160,000Office 458,600 Sq. Ft. $150 /Sq. Ft. 68,790,000Motels 0 Rooms $50,000 /Room 0
Total Assessed Value $101,950,000
Property Tax Rate 1.25%
Total Property Tax Revenue $1,274,400City Share of Property Tax Revenue 14.65%
Total Property Tax Revenue $186,700
II. Sales Tax RevenueTaxable Sales
Taxable Sales Generated by Residents 1 0 Units /Unit $0General Commercial 165,800 Sq. Ft. $400 /Sq. Ft. 66,320,000
Total Taxable Sales $66,320,000
Sales Tax Rate 1.0%
Total Sales Tax Revenue $663,200
III. Transient Occupancy Tax RevenueRoom Sales Revenue 2 0 Rooms $12,775 /Room $0Transient Occupancy Rate 8.0%
Total Transient Occupancy Tax Revenue $0
IV. Other RevenuesElectric Franchise Fee 417 R+E+V $9.57 /Person $4,000Cable Television Franchise Fee 0 Residents $11.74 /Person 0Gas Franchise Fee 417 R+E+V $1.88 /Person 800Solid Waste Hauler Franchise Fee 417 R+E+V $14.63 /Person 6,100Business License 417 Employees $10.80 /Person 4,500Licenses and Permits 0 Residents $1.26 /Person 0Fines & Forfeitures 417 R+E+V $8.95 /Person 3,700Fees and Charges 0 Residents $18.30 /Person 0Other Government Agencies 0 Residents $9.44 /Person 0
Total Other Revenues $19,100
V. Total Annual General Fund Revenues $869,000
1
2 Based on an average daily room rate of $50.00 and an average occupancy rate of 40%.
Average household income is estimated based on the $675,000 for new High Density Residentialand 35% of income spent on housing expenses. Assumes that 30% of income is spent on retail goods; 70% of those sales are taxable; and 45% of the sales occur in existing Costa Mesa establishments.

Prepared by: Keyser Marston Associates, Inc.File name: CM 9212_3 30 16; LA Times_Proposed
ATTACHMENT V: EXHIBIT D-2 - TABLE 3
ANNUAL GENERAL FUND EXPENDITURES, NET FISCAL IMPACT & ECONOMIC IMPACTLA TIMES SITE: GENERAL PLAN UPDATEFISCAL & ECONOMIC IMPACT ANALYSISELECTION CODE 9212 REPORTCOSTA MESA, CALIFORNIA
I. Annual ExpendituresPolice 417 R+E+V $305.75 /Person $127,500Fire 40.67 Incidents $3,145 /Incident 127,900Parks 0 Residents $8.46 /Person 0Development Services 417 R+E+V $19.28 /Person 8,000Public Services 417 R+E+V $83.27 /Person 34,700Administrative Overhead 32.68% Other General Fund Expenditures 97,400
Total Annual Expenditures $170,600
II. Net Fiscal ImpactTotal Annual General Fund Revenues $869,000(Less) Total Annual Expenditures ($170,600)
Net Fiscal Impact $698,400
III. Economic Impact 1
A. Direct & Indirect Increase in JobsGeneral Retail 80 Direct Jobs 1.1917 Multiplier 95Office 337 Direct Jobs 1.7165 Multiplier 578
Total Direct & Indirect Increase in Jobs 673
B. Direct & Indirect Increase in Earnings 2
General Retail $33,000 Average Salary 1.3794 Multiplier $3,641,700Office $89,400 Average Salary 1.7707 Multiplier 53,348,000
Total Direct & Indirect Increase in Earnings $56,989,700
1 Source for multipliers: Regional Input-Output Modeling System (RIMS II) - RIMS II Multipliers for Orange County (2007/2013).2 Source for salaries: California Employment Development Department Occupational Employment Statistics Survey, May 2015. Direct & Indirect
Increase in Earnings estimated by multiplying the Direct Jobs times the Average Salary and the applicable Multiplier.

Prepared by: Keyser Marston Associates, Inc.File name: CM 9212_3 30 16; SOBECA_Base
ATTACHMENT V: EXHIBIT E-1
SOBECA: CURRENT GENERAL PLAN
FISCAL & ECONOMIC IMPACT ANALYSIS

Prepared by: Keyser Marston Associates, Inc.File name: CM 9212_3 30 16; SOBECA_Base
ATTACHMENT V: EXHIBIT E-1 - TABLE 1
POPULATION ESTIMATES (FULL-TIME EQUIVALENTS)SOBECA: CURRENT GENERAL PLANFISCAL & ECONOMIC IMPACT ANALYSISELECTION CODE 9212 REPORTCOSTA MESA, CALIFORNIA
I. Residential PopulationNumber of UnitsAverage Number of Persons Per Unit
Total Residential Population 0
II. Employment Population
A. General RetailGross Building Area 147,300Estimated Square Feet Per Employee 1 500
Estimated Number of Employees 295Employment Based Resident Equivalent 24%
Estimated General Retail Employees 71
B. Light IndustryGross Building Area 458,600Estimated Square Feet Per Employee 2 470
Estimated Number of Employees 976Employment Based Resident Equivalent 24%
Estimated Light Industry Employees 234
Total Employment Population 305
III. Visitor Population (Motel Guests)Number of RoomsVisitors Per Room 1.75Average Occupancy Rate 40%
Estimated Number of Visitors 0Visitor Conversion to Resident Equivalent 75%
Total Visitor Population (Motel Guests) 0
IV. Total Population (Full-Time Equivalents) 305
1 General Plan measures against net leasable area - 10% discount from gross floor area.2 General Plan measures against the gross floor area minus an 8% vacancy rate.

Prepared by: Keyser Marston Associates, Inc.File name: CM 9212_3 30 16; SOBECA_Base
ATTACHMENT V: EXHIBIT E-1 - TABLE 2
ANNUAL GENERAL FUND REVENUESSOBECA: CURRENT GENERAL PLANFISCAL & ECONOMIC IMPACT ANALYSISELECTION CODE 9212 REPORTCOSTA MESA, CALIFORNIA
I. Property Tax RevenueAssessed Value
Residential 0 Units /Unit $0General Retail 147,300 Sq. Ft. $200 /Sq. Ft. 29,460,000Office 458,600 Sq. Ft. $150 /Sq. Ft. 68,790,000Motels 0 Rooms $50,000 /Room 0
Total Assessed Value $98,250,000
Property Tax Rate 1.25%
Total Property Tax Revenue $1,228,100City Share of Property Tax Revenue 14.65%
Total Property Tax Revenue $180,000
II. Sales Tax RevenueTaxable Sales
Taxable Sales Generated by Residents 1 0 Units /Unit $0General Commercial 147,300 Sq. Ft. $400 /Sq. Ft. 58,920,000
Total Taxable Sales $58,920,000
Sales Tax Rate 1.0%
Total Sales Tax Revenue $589,200
III. Transient Occupancy Tax RevenueRoom Sales Revenue 2 0 Rooms $12,775 /Room $0Transient Occupancy Rate 8.0%
Total Transient Occupancy Tax Revenue $0
IV. Other RevenuesElectric Franchise Fee 305 R+E+V $9.57 /Person $2,900Cable Television Franchise Fee 0 Residents $11.74 /Person 0Gas Franchise Fee 305 R+E+V $1.88 /Person 600Solid Waste Hauler Franchise Fee 305 R+E+V $14.63 /Person 4,500Business License 305 Employees $10.80 /Person 3,300Licenses and Permits 0 Residents $1.26 /Person 0Fines & Forfeitures 305 R+E+V $8.95 /Person 2,700Fees and Charges 0 Residents $18.30 /Person 0Other Government Agencies 0 Residents $9.44 /Person 0
Total Other Revenues $14,000
V. Total Annual General Fund Revenues $783,200
1
2 Based on an average daily room rate of $50.00 and an average occupancy rate of 40%.
Average household income is estimated based on the $675,000 for new High Density Residentialand 35% of income spent on housing expenses. Assumes that 30% of income is spent on retail goods; 70% of those sales are taxable; and 45% of the sales occur in existing Costa Mesa establishments.

Prepared by: Keyser Marston Associates, Inc.File name: CM 9212_3 30 16; SOBECA_Base
ATTACHMENT V: EXHIBIT E-1 - TABLE 3
ANNUAL GENERAL FUND EXPENDITURES, NET FISCAL IMPACT & ECONOMIC IMPACTSOBECA: CURRENT GENERAL PLANFISCAL & ECONOMIC IMPACT ANALYSISELECTION CODE 9212 REPORTCOSTA MESA, CALIFORNIA
I. Annual ExpendituresPolice 305 R+E+V $305.75 /Person $93,300Fire 17.65 Incidents $3,145 /Incident 55,500Parks 0 Residents $8.46 /Person 0Development Services 305 R+E+V $19.28 /Person 5,900Public Services 305 R+E+V $83.27 /Person 25,400Administrative Overhead 32.68% Other General Fund Expenditures 58,900
Total Annual Expenditures $86,800
II. Net Fiscal ImpactTotal Annual General Fund Revenues $783,200(Less) Total Annual Expenditures ($86,800)
Net Fiscal Impact $696,400
III. Economic Impact 1
A. Direct & Indirect Increase in JobsGeneral Retail 71 Direct Jobs 1.1917 Multiplier 85Light Industry 234 Direct Jobs 1.7165 Multiplier 402
Total Direct & Indirect Increase in Jobs 487
B. Direct & Indirect Increase in Earnings 2
General Retail $33,000 Average Salary 1.3794 Multiplier $3,232,000Light Industry $34,100 Average Salary 1.6638 Multiplier 13,276,000
Total Direct & Indirect Increase in Earnings $16,508,000
1 Source for multipliers: Regional Input-Output Modeling System (RIMS II) - RIMS II Multipliers for Orange County (2007/2013).2 Source for salaries: California Employment Development Department Occupational Employment Statistics Survey, May 2015. Direct & Indirect
Increase in Earnings estimated by multiplying the Direct Jobs times the Average Salary and the applicable Multiplier.
Prepared by: Keyser Marston Associates, Inc.File name: CM 9212_3 30 16; SOBECA_Proposed
ATTACHMENT V: EXHIBIT E-2
SOBECA: GENERAL PLAN UPDATE
FISCAL & ECONOMIC IMPACT ANALYSIS

Prepared by: Keyser Marston Associates, Inc.File name: CM 9212_3 30 16; SOBECA_Proposed
ATTACHMENT V: EXHIBIT E-2 - TABLE 1
POPULATION ESTIMATES (FULL-TIME EQUIVALENTS)SOBECA: GENERAL PLAN UPDATEFISCAL & ECONOMIC IMPACT ANALYSISELECTION CODE 9212 REPORTCOSTA MESA, CALIFORNIA
I. Residential PopulationNumber of Units 450Average Number of Persons Per Unit 2.50
Total Residential Population 1,125
II. Employment Population
A. General RetailGross Building AreaEstimated Square Feet Per Employee 1 500
Estimated Number of Employees 0Employment Based Resident Equivalent 24%
Estimated General Retail Employees 0
B. OfficeGross Building AreaEstimated Square Feet Per Employee 2 326
Estimated Number of Employees 0Employment Based Resident Equivalent 24%
Estimated Office Employees 0
Total Employment Population 0
III. Visitor Population (Motel Guests)Number of RoomsVisitors Per Room 1.75Average Occupancy Rate 40%
Estimated Number of Visitors 0Visitor Conversion to Resident Equivalent 75%
Total Visitor Population (Motel Guests) 0
IV. Total Population (Full-Time Equivalents) 1,125
1 General Plan measures against net leasable area - 10% discount from gross floor area.2 General Plan measures against the gross floor area minus an 8% vacancy rate.

Prepared by: Keyser Marston Associates, Inc.File name: CM 9212_3 30 16; SOBECA_Proposed
ATTACHMENT V: EXHIBIT E-2 - TABLE 2
ANNUAL GENERAL FUND REVENUESSOBECA: GENERAL PLAN UPDATEFISCAL & ECONOMIC IMPACT ANALYSISELECTION CODE 9212 REPORTCOSTA MESA, CALIFORNIA
I. Property Tax RevenueAssessed Value
Residential 450 Units $675,000 /Unit $303,750,000General Retail 0 Sq. Ft. $200 /Sq. Ft. 0Office 0 Sq. Ft. $150 /Sq. Ft. 0Motels 0 Rooms $50,000 /Room 0
Total Assessed Value $303,750,000
Property Tax Rate 1.25%
Total Property Tax Revenue $3,796,900City Share of Property Tax Revenue 14.65%
Total Property Tax Revenue $556,400
II. Sales Tax RevenueTaxable Sales
Taxable Sales Generated by Residents 1 450 Units $11,879 /Unit $5,345,700General Commercial 0 Sq. Ft. $400 /Sq. Ft. 0
Total Taxable Sales $5,345,700
Sales Tax Rate 1.0%
Total Sales Tax Revenue $53,500
III. Transient Occupancy Tax RevenueRoom Sales Revenue 2 0 Rooms $12,775 /Room $0Transient Occupancy Rate 8.0%
Total Transient Occupancy Tax Revenue $0
IV. Other RevenuesElectric Franchise Fee 1,125 R+E+V $9.57 /Person $10,800Cable Television Franchise Fee 1,125 Residents $11.74 /Person 13,200Gas Franchise Fee 1,125 R+E+V $1.88 /Person 2,100Solid Waste Hauler Franchise Fee 1,125 R+E+V $14.63 /Person 16,500Business License 0 Employees $10.80 /Person 0Licenses and Permits 1,125 Residents $1.26 /Person 1,400Fines & Forfeitures 1,125 R+E+V $8.95 /Person 10,100Fees and Charges 1,125 Residents $18.30 /Person 20,600Other Government Agencies 1,125 Residents $9.44 /Person 10,600
Total Other Revenues $85,300
V. Total Annual General Fund Revenues $695,200
1
2 Based on an average daily room rate of $50.00 and an average occupancy rate of 40%.
Average household income is estimated based on the $675,000 for new High Density Residentialand 35% of income spent on housing expenses. Assumes that 30% of income is spent on retail goods; 70% of those sales are taxable; and 45% of the sales occur in existing Costa Mesa establishments.
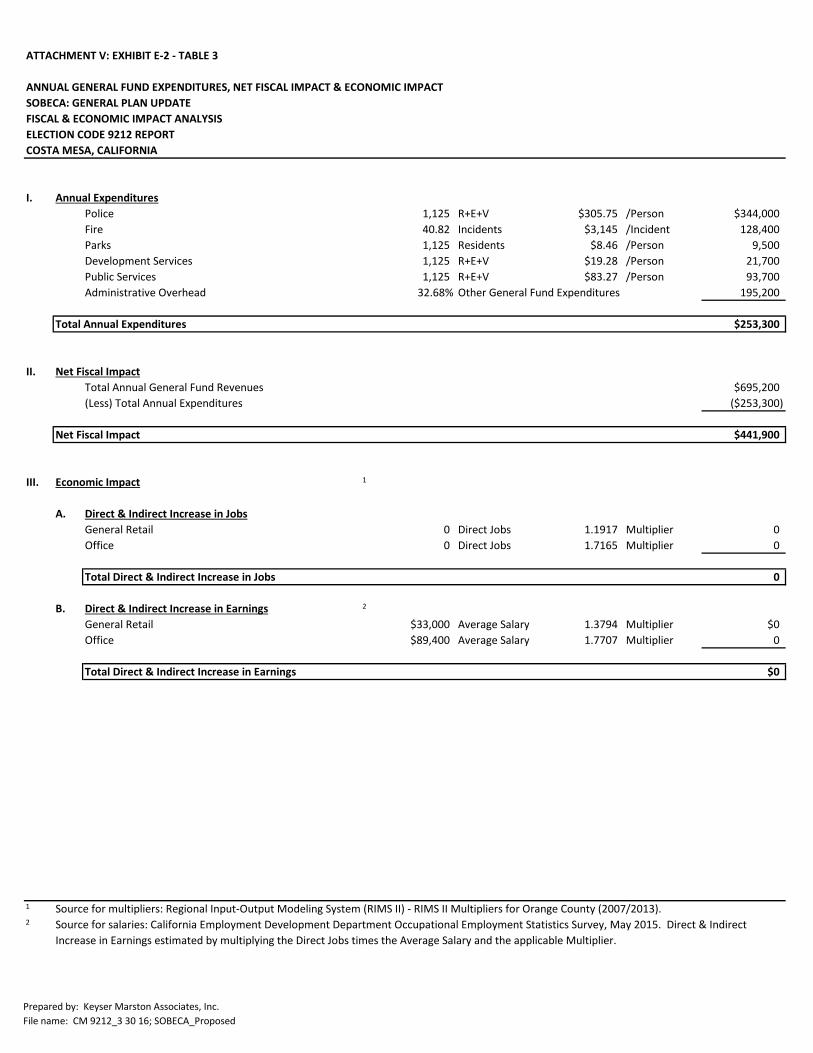
Prepared by: Keyser Marston Associates, Inc.File name: CM 9212_3 30 16; SOBECA_Proposed
ATTACHMENT V: EXHIBIT E-2 - TABLE 3
ANNUAL GENERAL FUND EXPENDITURES, NET FISCAL IMPACT & ECONOMIC IMPACTSOBECA: GENERAL PLAN UPDATEFISCAL & ECONOMIC IMPACT ANALYSISELECTION CODE 9212 REPORTCOSTA MESA, CALIFORNIA
I. Annual ExpendituresPolice 1,125 R+E+V $305.75 /Person $344,000Fire 40.82 Incidents $3,145 /Incident 128,400Parks 1,125 Residents $8.46 /Person 9,500Development Services 1,125 R+E+V $19.28 /Person 21,700Public Services 1,125 R+E+V $83.27 /Person 93,700Administrative Overhead 32.68% Other General Fund Expenditures 195,200
Total Annual Expenditures $253,300
II. Net Fiscal ImpactTotal Annual General Fund Revenues $695,200(Less) Total Annual Expenditures ($253,300)
Net Fiscal Impact $441,900
III. Economic Impact 1
A. Direct & Indirect Increase in JobsGeneral Retail 0 Direct Jobs 1.1917 Multiplier 0Office 0 Direct Jobs 1.7165 Multiplier 0
Total Direct & Indirect Increase in Jobs 0
B. Direct & Indirect Increase in Earnings 2
General Retail $33,000 Average Salary 1.3794 Multiplier $0Office $89,400 Average Salary 1.7707 Multiplier 0
Total Direct & Indirect Increase in Earnings $0
1 Source for multipliers: Regional Input-Output Modeling System (RIMS II) - RIMS II Multipliers for Orange County (2007/2013).2 Source for salaries: California Employment Development Department Occupational Employment Statistics Survey, May 2015. Direct & Indirect
Increase in Earnings estimated by multiplying the Direct Jobs times the Average Salary and the applicable Multiplier.

Prepared by: Keyser Marston Associates, Inc.File name: CM 9212_3 30 16; Home Ranch
ATTACHMENT V: EXHIBIT F
SEGERSTROM HOME RANCH
FISCAL & ECONOMIC IMPACT ANALYSIS

Prepared by: Keyser Marston Associates, Inc.File name: CM 9212_3 30 16; Home Ranch
ATTACHMENT V: EXHIBIT F - TABLE 1
POPULATION ESTIMATES (FULL-TIME EQUIVALENTS)SEGERSTROM HOME RANCHFISCAL & ECONOMIC IMPACT ANALYSISELECTION CODE 9212 REPORTCOSTA MESA, CALIFORNIA
I. Residential PopulationNumber of UnitsAverage Number of Persons Per Unit
Total Residential Population 0
II. Employment Population
A. General RetailGross Building AreaEstimated Square Feet Per Employee 1 500
Estimated Number of Employees 0Employment Based Resident Equivalent 24%
Estimated General Retail Employees 0
B. OfficeGross Building Area 1,200,000Estimated Square Feet Per Employee 2 326
Estimated Number of Employees 3,680Employment Based Resident Equivalent 24%
Estimated Office Employees 883
Total Employment Population 883
III. Visitor Population (Motel Guests)Number of Rooms 0Visitors Per Room 1.75Average Occupancy Rate 40%
Estimated Number of Visitors 0Visitor Conversion to Resident Equivalent 75%
Total Visitor Population (Motel Guests) 0
IV. Total Population (Full-Time Equivalents) 883
1 General Plan measures against net leasable area - 10% discount from gross floor area.2 General Plan measures against the gross floor area minus an 8% vacancy rate.

Prepared by: Keyser Marston Associates, Inc.File name: CM 9212_3 30 16; Home Ranch
ATTACHMENT V: EXHIBIT F - TABLE 2
ANNUAL GENERAL FUND REVENUESSEGERSTROM HOME RANCHFISCAL & ECONOMIC IMPACT ANALYSISELECTION CODE 9212 REPORTCOSTA MESA, CALIFORNIA
I. Property Tax RevenueAssessed Value
Residential 0 Units /Unit $0General Retail 0 Sq. Ft. $200 /Sq. Ft. 0Office 1,200,000 Sq. Ft. $150 /Sq. Ft. 180,000,000Motels 0 Rooms $50,000 /Room 0
Total Assessed Value $180,000,000
Property Tax Rate 1.25%
Total Property Tax Revenue $2,250,000City Share of Property Tax Revenue 14.65%
Total Property Tax Revenue $329,700
II. Sales Tax RevenueTaxable Sales
Taxable Sales Generated by Residents 1 0 Units /Unit $0General Commercial 0 Sq. Ft. $400 /Sq. Ft. 0
Total Taxable Sales $0
Sales Tax Rate 1.0%
Total Sales Tax Revenue $0
III. Transient Occupancy Tax RevenueRoom Sales Revenue 2 0 Rooms $12,775 /Room $0Transient Occupancy Rate 8.0%
Total Transient Occupancy Tax Revenue $0
IV. Other RevenuesElectric Franchise Fee 883 R+E+V $9.57 /Person $8,500Cable Television Franchise Fee 0 Residents $11.74 /Person 0Gas Franchise Fee 883 R+E+V $1.88 /Person 1,700Solid Waste Hauler Franchise Fee 883 R+E+V $14.63 /Person 12,900Business License 883 Employees $10.80 /Person 9,500Licenses and Permits 0 Residents $1.26 /Person 0Fines & Forfeitures 883 R+E+V $8.95 /Person 7,900Fees and Charges 0 Residents $18.30 /Person 0Other Government Agencies 0 Residents $9.44 /Person 0
Total Other Revenues $40,500
V. Total Annual General Fund Revenues $370,200
1
2 Based on an average daily room rate of $50.00 and an average occupancy rate of 40%.
Average household income is estimated based on the $675,000 for new High Density Residentialand 35% of income spent on housing expenses. Assumes that 30% of income is spent on retail goods; 70% of those sales are taxable; and 45% of the sales occur in existing Costa Mesa establishments.

Prepared by: Keyser Marston Associates, Inc.File name: CM 9212_3 30 16; Home Ranch
ATTACHMENT V: EXHIBIT F - TABLE 3
ANNUAL GENERAL FUND EXPENDITURES, NET FISCAL IMPACT & ECONOMIC IMPACTSEGERSTROM HOME RANCHFISCAL & ECONOMIC IMPACT ANALYSISELECTION CODE 9212 REPORTCOSTA MESA, CALIFORNIA
I. Annual ExpendituresPolice 883 R+E+V $305.75 /Person $270,000Fire 70.92 Incidents $3,145 /Incident 223,000Parks 0 Residents $8.46 /Person 0Development Services 883 R+E+V $19.28 /Person 17,000Public Services 883 R+E+V $83.27 /Person 73,500Administrative Overhead 32.68% Other General Fund Expenditures 190,700
Total Annual Expenditures $313,500
II. Net Fiscal ImpactTotal Annual General Fund Revenues $370,200(Less) Total Annual Expenditures ($313,500)
Net Fiscal Impact $56,700
III. Economic Impact 1
A. Direct & Indirect Increase in JobsGeneral Retail 0 Direct Jobs 1.1917 Multiplier 0Office 883 Direct Jobs 1.7165 Multiplier 1,516
Total Direct & Indirect Increase in Jobs 1,516
B. Direct & Indirect Increase in Earnings 2
General Retail $33,000 Average Salary 1.3794 Multiplier $0Office $89,400 Average Salary 1.7707 Multiplier 139,781,200
Total Direct & Indirect Increase in Earnings $139,781,200
1 Source for multipliers: Regional Input-Output Modeling System (RIMS II) - RIMS II Multipliers for Orange County (2007/2013).2 Source for salaries: California Employment Development Department Occupational Employment Statistics Survey, May 2015. Direct & Indirect
Increase in Earnings estimated by multiplying the Direct Jobs times the Average Salary and the applicable Multiplier.

Prepared by: Keyser Marston Associates, Inc.File name: CM 9212_3 30 16; Sakioka #2
ATTACHMENT V: EXHIBIT G
SAKIOKA SITE - LOT 2
FISCAL & ECONOMIC IMPACT ANALYSIS

Prepared by: Keyser Marston Associates, Inc.File name: CM 9212_3 30 16; Sakioka #2
ATTACHMENT V: EXHIBIT G - TABLE 1
POPULATION ESTIMATES (FULL-TIME EQUIVALENTS)SAKIOKA SITE - LOT 2FISCAL & ECONOMIC IMPACT ANALYSISELECTION CODE 9212 REPORTCOSTA MESA, CALIFORNIA
I. Residential PopulationNumber of Units 660Average Number of Persons Per Unit 2.50
Total Residential Population 1,650
II. Employment Population
A. General RetailGross Building AreaEstimated Square Feet Per Employee 1 500
Estimated Number of Employees 0Employment Based Resident Equivalent 24%
Estimated General Retail Employees 0
B. OfficeGross Building AreaEstimated Square Feet Per Employee 2 326
Estimated Number of Employees 0Employment Based Resident Equivalent 24%
Estimated Office Employees 0
Total Employment Population 0
III. Visitor Population (Motel Guests)Number of RoomsVisitors Per Room 1.75Average Occupancy Rate 40%
Estimated Number of Visitors 0Visitor Conversion to Resident Equivalent 75%
Total Visitor Population (Motel Guests) 0
IV. Total Population (Full-Time Equivalents) 1,650
1 General Plan measures against net leasable area - 10% discount from gross floor area.2 General Plan measures against the gross floor area minus an 8% vacancy rate.
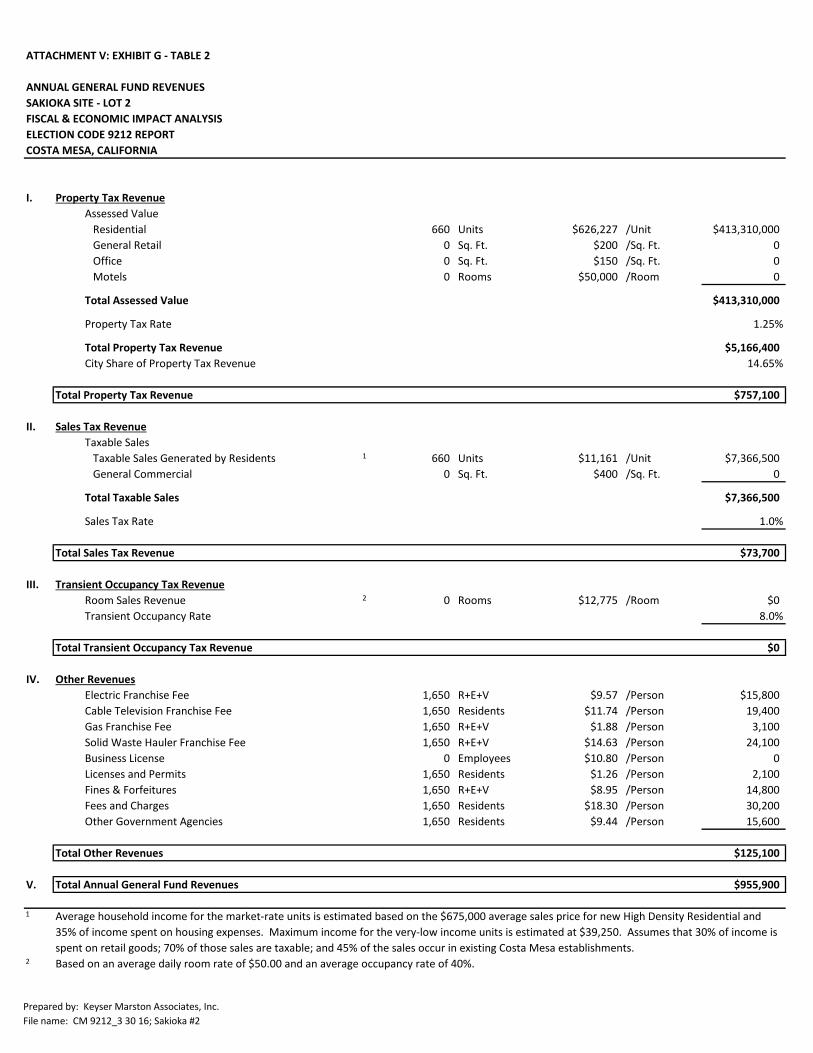
Prepared by: Keyser Marston Associates, Inc.File name: CM 9212_3 30 16; Sakioka #2
ATTACHMENT V: EXHIBIT G - TABLE 2
ANNUAL GENERAL FUND REVENUESSAKIOKA SITE - LOT 2FISCAL & ECONOMIC IMPACT ANALYSISELECTION CODE 9212 REPORTCOSTA MESA, CALIFORNIA
I. Property Tax RevenueAssessed Value
Residential 660 Units $626,227 /Unit $413,310,000General Retail 0 Sq. Ft. $200 /Sq. Ft. 0Office 0 Sq. Ft. $150 /Sq. Ft. 0Motels 0 Rooms $50,000 /Room 0
Total Assessed Value $413,310,000
Property Tax Rate 1.25%
Total Property Tax Revenue $5,166,400City Share of Property Tax Revenue 14.65%
Total Property Tax Revenue $757,100
II. Sales Tax RevenueTaxable Sales
Taxable Sales Generated by Residents 1 660 Units $11,161 /Unit $7,366,500General Commercial 0 Sq. Ft. $400 /Sq. Ft. 0
Total Taxable Sales $7,366,500
Sales Tax Rate 1.0%
Total Sales Tax Revenue $73,700
III. Transient Occupancy Tax RevenueRoom Sales Revenue 2 0 Rooms $12,775 /Room $0Transient Occupancy Rate 8.0%
Total Transient Occupancy Tax Revenue $0
IV. Other RevenuesElectric Franchise Fee 1,650 R+E+V $9.57 /Person $15,800Cable Television Franchise Fee 1,650 Residents $11.74 /Person 19,400Gas Franchise Fee 1,650 R+E+V $1.88 /Person 3,100Solid Waste Hauler Franchise Fee 1,650 R+E+V $14.63 /Person 24,100Business License 0 Employees $10.80 /Person 0Licenses and Permits 1,650 Residents $1.26 /Person 2,100Fines & Forfeitures 1,650 R+E+V $8.95 /Person 14,800Fees and Charges 1,650 Residents $18.30 /Person 30,200Other Government Agencies 1,650 Residents $9.44 /Person 15,600
Total Other Revenues $125,100
V. Total Annual General Fund Revenues $955,900
1
2 Based on an average daily room rate of $50.00 and an average occupancy rate of 40%.
Average household income for the market-rate units is estimated based on the $675,000 average sales price for new High Density Residential and 35% of income spent on housing expenses. Maximum income for the very-low income units is estimated at $39,250. Assumes that 30% of income is spent on retail goods; 70% of those sales are taxable; and 45% of the sales occur in existing Costa Mesa establishments.

Prepared by: Keyser Marston Associates, Inc.File name: CM 9212_3 30 16; Sakioka #2
ATTACHMENT V: EXHIBIT G - TABLE 3
ANNUAL GENERAL FUND EXPENDITURES, NET FISCAL IMPACT & ECONOMIC IMPACTSAKIOKA SITE - LOT 2FISCAL & ECONOMIC IMPACT ANALYSISELECTION CODE 9212 REPORTCOSTA MESA, CALIFORNIA
I. Annual ExpendituresPolice 1,650 R+E+V $305.75 /Person $504,500Fire 54.60 Incidents $3,145 /Incident 171,700Parks 1,650 Residents $8.46 /Person 14,000Development Services 1,650 R+E+V $19.28 /Person 31,800Public Services 1,650 R+E+V $83.27 /Person 137,400Administrative Overhead 32.68% Other General Fund Expenditures 280,900
Total Annual Expenditures $354,900
II. Net Fiscal ImpactTotal Annual General Fund Revenues $955,900(Less) Total Annual Expenditures ($354,900)
Net Fiscal Impact $601,000
III. Economic Impact 1
A. Direct & Indirect Increase in JobsGeneral Retail 0 Direct Jobs 1.1917 Multiplier 0Office 0 Direct Jobs 1.7165 Multiplier 0
Total Direct & Indirect Increase in Jobs 0
B. Direct & Indirect Increase in Earnings 2
General Retail $33,000 Average Salary 1.3794 Multiplier $0Office $89,400 Average Salary 1.7707 Multiplier 0
Total Direct & Indirect Increase in Earnings $0
1 Source for multipliers: Regional Input-Output Modeling System (RIMS II) - RIMS II Multipliers for Orange County (2007/2013).2 Source for salaries: California Employment Development Department Occupational Employment Statistics Survey, May 2015. Direct & Indirect
Increase in Earnings estimated by multiplying the Direct Jobs times the Average Salary and the applicable Multiplier.

Prepared by: Keyser Marston Associates, Inc.File name: CM 9212_3 30 16; Fairview
ATTACHMENT V: EXHIBIT H
FAIRVIEW SITE
FISCAL & ECONOMIC IMPACT ANALYSIS

Prepared by: Keyser Marston Associates, Inc.File name: CM 9212_3 30 16; Fairview
ATTACHMENT V: EXHIBIT H - TABLE 1
POPULATION ESTIMATES (FULL-TIME EQUIVALENTS)FAIRVIEW SITEFISCAL & ECONOMIC IMPACT ANALYSISELECTION CODE 9212 REPORTCOSTA MESA, CALIFORNIA
I. Residential PopulationNumber of Units 500Average Number of Persons Per Unit 2.77
Total Residential Population 1,383
II. Employment Population
A. General RetailGross Building AreaEstimated Square Feet Per Employee 1 500
Estimated Number of Employees 0Employment Based Resident Equivalent 24%
Estimated General Retail Employees 0
B. OfficeGross Building AreaEstimated Square Feet Per Employee 2 326
Estimated Number of Employees 0Employment Based Resident Equivalent 24%
Estimated Office Employees 0
Total Employment Population 0
III. Visitor Population (Motel Guests)Number of RoomsVisitors Per Room 1.75Average Occupancy Rate 40%
Estimated Number of Visitors 0Visitor Conversion to Resident Equivalent 75%
Total Visitor Population (Motel Guests) 0
IV. Total Population (Full-Time Equivalents) 1,383
1 General Plan measures against net leasable area - 10% discount from gross floor area.2 General Plan measures against the gross floor area minus an 8% vacancy rate.

Prepared by: Keyser Marston Associates, Inc.File name: CM 9212_3 30 16; Fairview
ATTACHMENT V: EXHIBIT H - TABLE 2
ANNUAL GENERAL FUND REVENUESFAIRVIEW SITEFISCAL & ECONOMIC IMPACT ANALYSISELECTION CODE 9212 REPORTCOSTA MESA, CALIFORNIA
I. Property Tax RevenueAssessed Value
Residential 500 Units $765,000 /Unit $382,500,000General Retail 0 Sq. Ft. $200 /Sq. Ft. 0Office 0 Sq. Ft. $150 /Sq. Ft. 0Motels 0 Rooms $50,000 /Room 0
Total Assessed Value $382,500,000
Property Tax Rate 1.25%
Total Property Tax Revenue $4,781,300City Share of Property Tax Revenue 14.65%
Total Property Tax Revenue $700,600
II. Sales Tax RevenueTaxable Sales
Taxable Sales Generated by Residents 1 500 Units $13,463 /Unit $6,731,700General Commercial 0 Sq. Ft. $400 /Sq. Ft. 0
Total Taxable Sales $6,731,700
Sales Tax Rate 1.0%
Total Sales Tax Revenue $67,300
III. Transient Occupancy Tax RevenueRoom Sales Revenue 2 0 Rooms $12,775 /Room $0Transient Occupancy Rate 8.0%
Total Transient Occupancy Tax Revenue $0
IV. Other RevenuesElectric Franchise Fee 1,383 R+E+V $9.57 /Person $13,200Cable Television Franchise Fee 1,383 Residents $11.74 /Person 16,200Gas Franchise Fee 1,383 R+E+V $1.88 /Person 2,600Solid Waste Hauler Franchise Fee 1,383 R+E+V $14.63 /Person 20,200Business License 0 Employees $10.80 /Person 0Licenses and Permits 1,383 Residents $1.26 /Person 1,700Fines & Forfeitures 1,383 R+E+V $8.95 /Person 12,400Fees and Charges 1,383 Residents $18.30 /Person 25,300Other Government Agencies 1,383 Residents $9.44 /Person 13,100
Total Other Revenues $104,700
V. Total Annual General Fund Revenues $872,600
1
2 Based on an average daily room rate of $50.00 and an average occupancy rate of 40%.
Average household income is estimated based on the $900,000 average sales price for new Medium Density Residential and $675,000 for new High Density Residential; and 35% of income spent on housing expenses. Assumes that 30% of income is spent on retail goods; 70% of those sales are taxable; and 45% of the sales occur in existing Costa Mesa establishments.

Prepared by: Keyser Marston Associates, Inc.File name: CM 9212_3 30 16; Fairview
ATTACHMENT V: EXHIBIT H - TABLE 3
ANNUAL GENERAL FUND EXPENDITURES, NET FISCAL IMPACT & ECONOMIC IMPACTFAIRVIEW SITEFISCAL & ECONOMIC IMPACT ANALYSISELECTION CODE 9212 REPORTCOSTA MESA, CALIFORNIA
I. Annual ExpendituresPolice 1,383 R+E+V $305.75 /Person $422,900Fire 45.35 Incidents $3,145 /Incident 142,600Parks 1,383 Residents $8.46 /Person 11,700Development Services 1,383 R+E+V $19.28 /Person 26,700Public Services 1,383 R+E+V $83.27 /Person 115,200Administrative Overhead 32.68% Other General Fund Expenditures 235,000
Total Annual Expenditures $296,200
II. Net Fiscal ImpactTotal Annual General Fund Revenues $872,600(Less) Total Annual Expenditures ($296,200)
Net Fiscal Impact $576,400
III. Economic Impact 1
A. Direct & Indirect Increase in JobsGeneral Retail 0 Direct Jobs 1.1917 Multiplier 0Office 0 Direct Jobs 1.7165 Multiplier 0
Total Direct & Indirect Increase in Jobs 0
B. Direct & Indirect Increase in Earnings 2
General Retail $33,000 Average Salary 1.3794 Multiplier $0Office $89,400 Average Salary 1.7707 Multiplier 0
Total Direct & Indirect Increase in Earnings $0
1 Source for multipliers: Regional Input-Output Modeling System (RIMS II) - RIMS II Multipliers for Orange County (2007/2013).2 Source for salaries: California Employment Development Department Occupational Employment Statistics Survey, May 2015. Direct & Indirect
Increase in Earnings estimated by multiplying the Direct Jobs times the Average Salary and the applicable Multiplier.