report title treasury management activity …wolverhampton.moderngov.co.uk/documents/s6286/treasury...
TRANSCRIPT

This report is PUBLIC [NOT PROTECTIVELY MARKED]
Report Pages Page 1 of 25
Agenda Item No: 7
Cabinet (Resources) Panel 9 December 2014
Report title Treasury Management Activity Monitoring - Mid
Year Review 2014/15
Decision designation RED
Cabinet member with lead responsibility
Councillor Andrew Johnson Resources
Key decision Yes
In forward plan Yes
Wards affected All
Accountable director Keith Ireland, Managing Director
Sarah Norman, Community
Tim Johnson, Education and Enterprise
Originating service Strategic Finance
Accountable employee(s) Mark Taylor
Tel
Assistant Director Finance
01902 556609
Report to be/has been
considered by
Strategic Executive Board 6 November 2014
Recommendations for approval:
That Cabinet (Resources) Panel recommends to Council:
1. That it approves:
(a) The revised upper limits for treasury management indicator (TMI) 2 - upper and
lower limits to the maturity structure of its borrowing (paragraph 3.4).
(b) The revised Annual Minimum Revenue Provision (MRP) Statement for 2014/15,
the new method of calculating MRP being on an annuity basis set out in appendix
G.

This report is PUBLIC [NOT PROTECTIVELY MARKED]
Report Pages Page 2 of 25
2. That it notes the contents of the report, and particularly that:
(a) A mid-year review of the Treasury Management Strategy Statement has been
undertaken and the Council has operated within the limits and requirements
approved in March 2014 except for temporarily exceeding TMI 2 - upper and lower
limits to the maturity structure of its borrowing until revised limits are approved by
Council (recommendation one of this report) in order to generate savings by taking
advantage of exceptionally low short term interest rates.
(b) Savings of £4.4 million for the General Fund and £6.0 million for the Housing
Revenue Account are forecast from treasury management activities in 2014/15.
(c) Some of the credit ratings currently used in the Council‟s Annual Investment
Strategy approved by Council in March 2014 will need to be amended in light of
regulatory changes in the financial sector.

This report is PUBLIC [NOT PROTECTIVELY MARKED]
Report Pages Page 3 of 25
1.0 Purpose
1.1 This report provides a monitoring and progress report on Treasury Management Activity
for the second quarter of 2014/15 as part of the mid-year review, in line with the
Prudential Indicators approved by Council in March 2014.
2.0 Background
2.1 The treasury management activities of the Council are underpinned by The Chartered
Institute of Public Finance and Accountancy‟s (CIPFA) Code of Practice on Treasury
Management 2011. The primary requirements of the Code are the:
Creation and maintenance of a Treasury Management Policy Statement which sets
out the policies and objectives of the council‟s treasury management activities.
Creation and maintenance of Treasury Management Practices which set out the
manner in which the Council will seek to achieve those policies and objectives.
Receipt by Cabinet / Council of an annual strategy report for the year ahead, a mid-
year review report and an annual review report of the previous year.
Delegation by the Council of responsibilities for implementing and monitoring
treasury management policies and practices and for the execution and administration
of treasury management decisions.
Nomination of the Confident, Capable Council Scrutiny Panel to be responsible for
ensuring effective scrutiny of the treasury management strategy and policies.
2.2 Treasury management in this context is defined as:
“The management of the local authority‟s cash flows, its banking, money market and
capital market transactions; the effective control of the risks associated with those
activities; and the pursuit of optimum performance consistent with those risks.”
2.3 The system of controls on local authority capital investment has been in place since 1
April 2004. This replaced the previous complex regulatory framework governing local
authority capital expenditure. The current system is one based largely on self-regulation
by local authorities themselves. At its heart is CIPFA's Prudential Code for Capital
Finance.
2.4 Cabinet (Resources) Panel receives quarterly reports throughout the year to monitor
performance against the strategy and Prudential Indicators that have previously been
approved by Council.
2.5 The Council continues to use Capita Asset Services, previously known as Sector
Treasury Services Limited, as its treasury management advisors throughout 2014/15.
Capita provides market data and intelligence on which the Council can make decisions
This report is PUBLIC [NOT PROTECTIVELY MARKED]
Report Pages Page 4 of 25
regarding all aspects of treasury management activities and in particular, managing the
risks associated with investing surplus cash. This service contract expires 31 December
2014 and is therefore undergoing a re-tendering exercise.
3.0 2014/15 Forecast Outturn
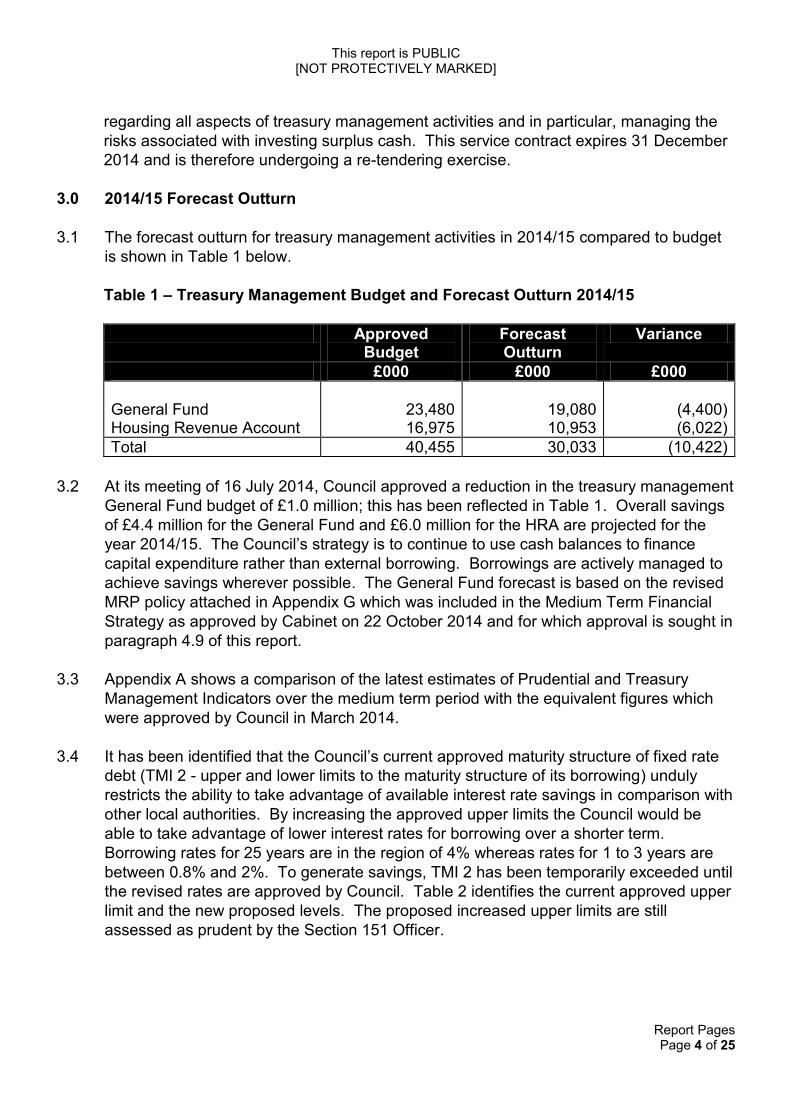
3.1 The forecast outturn for treasury management activities in 2014/15 compared to budget
is shown in Table 1 below.
Table 1 – Treasury Management Budget and Forecast Outturn 2014/15
Approved Budget
Forecast Outturn
Variance
£000 £000 £000
General Fund Housing Revenue Account
23,480 16,975
19,080 10,953
(4,400)
(6,022)
Total 40,455 30,033 (10,422)
3.2 At its meeting of 16 July 2014, Council approved a reduction in the treasury management
General Fund budget of £1.0 million; this has been reflected in Table 1. Overall savings
of £4.4 million for the General Fund and £6.0 million for the HRA are projected for the
year 2014/15. The Council‟s strategy is to continue to use cash balances to finance
capital expenditure rather than external borrowing. Borrowings are actively managed to
achieve savings wherever possible. The General Fund forecast is based on the revised
MRP policy attached in Appendix G which was included in the Medium Term Financial
Strategy as approved by Cabinet on 22 October 2014 and for which approval is sought in
paragraph 4.9 of this report.
3.3 Appendix A shows a comparison of the latest estimates of Prudential and Treasury
Management Indicators over the medium term period with the equivalent figures which
were approved by Council in March 2014.
3.4 It has been identified that the Council‟s current approved maturity structure of fixed rate
debt (TMI 2 - upper and lower limits to the maturity structure of its borrowing) unduly
restricts the ability to take advantage of available interest rate savings in comparison with
other local authorities. By increasing the approved upper limits the Council would be
able to take advantage of lower interest rates for borrowing over a shorter term.
Borrowing rates for 25 years are in the region of 4% whereas rates for 1 to 3 years are
between 0.8% and 2%. To generate savings, TMI 2 has been temporarily exceeded until
the revised rates are approved by Council. Table 2 identifies the current approved upper
limit and the new proposed levels. The proposed increased upper limits are still
assessed as prudent by the Section 151 Officer.

This report is PUBLIC [NOT PROTECTIVELY MARKED]
Report Pages Page 5 of 25
Table 2 – Upper Limits to the Maturity Structure of Fixed Rate Debt
Approved Upper
Limit
Proposed Upper
Limit
Under 12 months 10% 25%
12 months and within 24 months 15% 25%
24 months and within 5 years 20% 40%
5 years and within 10 years 20% 50%
10 years and above 90% 90%
4.0 Borrowing Forecast for 2014/15
4.1 The Council‟s need to borrow and the rates available continue to be monitored in order to
achieve optimum results. The Council‟s medium term forecast is regularly updated to
reflect actual borrowing that takes place along with any revisions to future anticipated
borrowing.
4.2 Table 3 shows the average rate of interest payable in 2013/14 and forecast for 2014/15.
Table 3 - Average Interest Rate Payable in 2013/14 and 2014/15
2013/14 Actual 2014/15 Forecast
Average Interest Rate Payable
3.97%
3.74%
4.3 The average rate of interest payable by the Council is estimated to fall from 3.97% to
3.74% for 2014/15.
4.4 Each year it is necessary to raise new loans to finance capital expenditure and to replace
existing maturing debt. The Council's policy is to prioritise the use of capital receipts to
finance capital expenditure. Balances which are set aside to meet credit liabilities (i.e. to
repay debt) are used to reduce the external borrowing requirement. Decisions to take
borrowing will be made by the Assistant Director Finance when it is judged that rates are
likely to be at their lowest levels, and probably about to rise according to market
indications, and only when an inflow of funds is required to meet imminent cash flow
commitments. This will keep overall surplus cash balances to a minimum, in line with the
current strategy. Appendix B shows the maturity profile of external borrowing.
4.5 Any short term savings made by avoiding new long term external borrowing in 2014/15
and thereafter, will also need to be weighed against the potential for incurring additional
long term extra costs by delaying unavoidable new external borrowing until later years,
when Public Works Loan Board (PWLB) long term rates are forecast to be significantly
higher. Appendix C includes the Capita commentary for quarter two 2014/15 and
forecasts that interest rates for both short and long term borrowing will increase up to
March 2015. The Assistant Director Finance will continue to keep actual and forecast
rates under close review.

This report is PUBLIC [NOT PROTECTIVELY MARKED]
Report Pages Page 6 of 25
4.6 In March 2014, Council approved a net borrowing requirement for 2014/15 of £168.3
million. The forecast net borrowing requirement for 2014/15 is £153.2 million, as shown
in appendix F. PWLB borrowing of £23.0 million has been taken out during quarter two,
and £10.0 million of temporary borrowing was repaid. £30.0 million of existing borrowing
is due to be repaid in quarter four. Appendix D shows a detailed breakdown of new
loans and repayments made throughout the year.
4.7 Appendix E shows a graphical summary of current borrowing by type; fixed and variable
as at 30 September 2014.
4.8 Appendix F shows details for the disclosure for certainty rate, which will enable the
Council to submit a return for 2014/15 and thereby secure access to discounted
borrowing at 0.20% below normal PWLB rates.
4.9 In March 2014 Council approved the Annual Minimum Revenue Provision (MRP)
Statement setting out the method used to calculate MRP for 2014/15 onwards. A review
of this statement has identified potential savings that could be generated by switching to
an annuity method. This was reported to Councillors at Cabinet on 22 October 2014 as
part of the Budget and Medium Term Financial Strategy report. Appendix G shows the
proposed new statement requiring approval. In the opinion of the Assistant Director
Finance (Section 151 Officer) the methodology set out in the statement will generate an
amount of MRP that is prudent; this has been agreed by the Council‟s external auditors.
5.0 Investment Forecast for 2014/15
5.1 The approach during the year is to continue to use cash balances to finance capital
expenditure so as to keep cash balances low.
5.2 Table 4 shows the total amount of surplus funds invested as at 30 June 2014 and 30
September 2014.
Table 4 – Total Amounts Invested 2014/15
30 June 2014 £000
30 September 2014 £000
Business Reserve Accounts Money Market Funds
19,994 34,820
7 15,815
54,814 15,822
Average cash balance for the year to date
59,979 46,301
5.3 Money Market Funds and Business Reserve Accounts are the main investments used as
these have high credit ratings and instant access. This is based on the Council‟s low
appetite for risk.

This report is PUBLIC [NOT PROTECTIVELY MARKED]
Report Pages Page 7 of 25
5.4 The Council‟s cash flow balances have reduced during the second quarter of the current
financial year, moving between a low of £12.9 million up to a maximum of £50.0 million
and have averaged £31.6 million for the quarter.
5.5 Table 5 shows the budgeted average rate of interest receivable in 2014/15 and the
forecast for the year.
Table 5 – Average Interest Rate Receivable in 2014/15
2014/15 Budget 2014/15 Forecast
Average Interest Rate Receivable
0.50%
0.43%
5.6 This reduction is due to the significantly reduced interest rates currently available and
anticipated throughout the year.
5.7 The Council will avoid locking into longer term deals while investment rates are at
historically low levels. Investment rates are expected to continue to be below long term
borrowing rates, in which case, the Council can minimise its overall net treasury costs in
the short term by continuing to avoid new external borrowing and by using internal cash
balances to finance new capital expenditure or to replace maturing external debt (this is
referred to as internal borrowing).
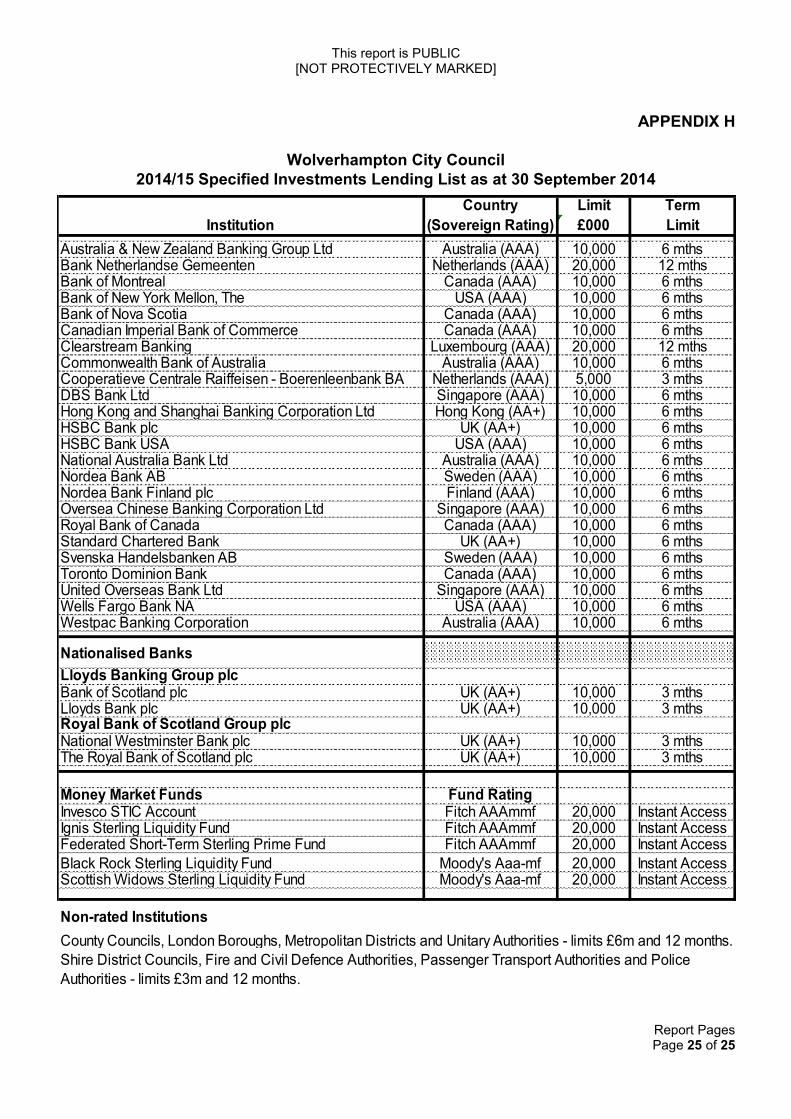
5.8 The Council manages its investments in-house and invests only in the institutions listed
in the Council‟s approved lending list, which is reviewed each time a counterparty is
subject to a credit rating amendment. The Council‟s strategy allows for investments for a
range of periods from overnight to five years, depending on the Council‟s cash flows, its
interest rate view and the interest rates on offer. However, in order to maintain sufficient
liquidity whilst total investment levels are relatively low, most investments have been
placed for shorter durations.
5.9 The approved Treasury Management Code of Practice sets out the criteria to be used for
creating and managing approved counterparty lists and limits. As a result of any
changes to credit criteria, the Assistant Director Finance is authorised to make changes
to the list of approved counterparties. In the event that any of these counterparties fall
below the council‟s minimum lending criteria, activity in that account will temporarily
cease and any balance withdrawn immediately. Appendix H shows the Council‟s current
specified investments lending list
5.10 In quarter two 2014/2015 the Assistant Director Finance has not been required to use his
discretion to temporarily exceed any upper limits with approved counter-parties.
5.11 The Annual Investment Strategy (AIS) approved by Council in March 2014 details the
criteria the Council will use when making investment decisions. Data provided by Capita
as part of its credit methodology supports the AIS. Due to regulatory changes ratings
information will be changed and therefore Capita will be revising the ratings information

This report is PUBLIC [NOT PROTECTIVELY MARKED]
Report Pages Page 8 of 25
supplied to the Council. This will have no direct impact upon the risk of individual
investments however as the previous ratings information was utilised in the Council‟s AIS
this will have to be revised to incorporate the new ratings information. There is some
uncertainty when these changes will come into force; however, when they do the
Council‟s AIS will be amended by Assistant Director Finance under delegations approved
in March 2014; it is not expected to impact on the Council‟s investments.
6.0 Financial Implications
6.1 The financial implications are discussed in the body of this report.
[SH/31102014/F]
7.0 Legal implications
7.1 Treasury Management relates to the management of the Council‟s cash flow, borrowing
and cash investments. This involves seeking the best rates of interest for borrowing,
earning interest on investments, whilst managing risk in making financial decisions and
adopting proper accounting practice.
7.2 The area is heavily regulated. The Local Government and Housing Act 1989 regulates
the operation of the Housing Revenue Account. The „CIPFA Code of Practice for
Treasury Management in the Public Services‟, contains Treasury Management indicators
and advice on Treasury Management Strategy. Investment strategy is regulated by
„DCLG Guidance on Local Government Investments‟ issued initially in 2004 and re-
issued in 2010. Part 2 of this Guidance is statutory guidance.
[TS/12112014/I]
8.0 Equalities implications
8.1 This report has no equality implications.
9.0 Environmental implications
9.1 This report has no environmental implications.
10.0 Human resources implications
10.1 This report has no human resources implications.
11.0 Corporate landlord implications
11.1 This report has no corporate landlord implications.

This report is PUBLIC [NOT PROTECTIVELY MARKED]
Report Pages Page 9 of 25
12.0 Schedule of background papers
Treasury Management Strategy 2014/15, Report to Cabinet, 25 February 2014
Treasury Management – Annual Report 2013/14 and Activity Monitoring Quarter One
2014/15, Report to Cabinet, 23 July 2014
2015/16 Budget and Medium Term Financial Strategy 2015/16 – 2018/19, Report to
Cabinet, 22 October 2014
13.0 Schedule of Appendices
App Title Page
A Prudential and Treasury Management Indicators 10
B Maturity rate profile 14
C Capita commentary Q2 2014/15 15
D Borrowing and Repayments 19
E Borrowing by type graphical summary 20
F Certainty rate disclosure 21
G Annual Minimum Revenue Provision (MRP) Statement 22
H Lending list 25
APPENDIX A
Prudential Indicators (PI)
2014/15 2015/16 2016/17 2014/15 2015/16 2016/17
Forecast Forecast Forecast Forecast Forecast Forecast
General Fund 10.3% 14.0% 15.6% 9.8% 13.5% 16.3%
HRA 12.3% 12.1% 12.6% 11.1% 10.6% 12.6%
2014/15 2015/16 2016/17 2014/15 2015/16 2016/17
Forecast Forecast Forecast Forecast Forecast Forecast
£ £ £ £ £ £
For Band D council tax
Implications of the Capital Programme for Year 201.41 236.60 243.92 157.70 228.25 248.59
Financial Year Impact 201.41 236.60 243.92 157.70 228.25 248.59
For average weekly housing rents
Implications of the Capital Programme for Year 4.65 5.34 6.13 3.28 6.32 7.52
Financial Year Impact 4.65 5.34 6.13 3.28 6.32 7.52
For Band D council tax
Implications of the Capital Programme for Year 2.02 (7.64) (15.44) (6.36) 7.14 23.11
Marginal Impact to Quarter One 2.02 (7.64) (15.44) (6.36) 7.14 23.11
For average weekly housing rents
Implications of the Capital Programme for Year - - - (0.82) (0.04) (0.04)
Marginal Impact to Quarter One - - - (0.82) (0.04) (0.04)
2014/15 2015/16 2016/17 2014/15 2015/16 2016/17
Forecast Forecast Forecast Forecast Forecast Forecast
£000 £000 £000 £000 £000 £000
General Fund 111,799 36,889 18,290 122,692 57,035 29,195
HRA 57,928 30,477 33,228 74,935 62,040 38,233
169,727 67,366 51,518 197,627 119,075 67,428
Approved by Council 5 March 2014 As at 30 September 2014
Full details of capital expenditure plans and funding can be found in the Capital Quarter Two Monitoring 2014/15 report.
Debt and Treasury Management - Prudential and Treasury Management Indicators
PI 1 - Estimates and Actual ratio of financing costs to net revenue stream.
This represents the cost of financing capital expenditure as a % of net revenue for both the General Fund and HRA.
Approved by Council 5 March 2014 As at 30 September 2014
PI 2 - Estimates of the incremental impact of capital investment decisions on the council tax and housing rents.
The council could consider different options for its capital investment programme in relation to their different impact on the council tax and
housing rents. Negatives reflect a reduction in total capital expenditure.
Approved by Council 5 March 2014 As at 30 September 2014
PI 3 - Estimates and actual capital expenditure.
PI for Affordability - These indicators are used to ensure the total capital investment of the council is within a sustainable limit and the
impact of these decisions are considered with regard to acceptable council tax and housing rent levels.

This report is PUBLIC [NOT PROTECTIVELY MARKED]
Report Pages Page 10 of 25
APPENDIX A
Prudential Indicators (PI)
2014/15 2015/16 2016/17 2014/15 2015/16 2016/17
Forecast Forecast Forecast Forecast Forecast Forecast
General Fund 10.3% 14.0% 15.6% 8.0% 11.6% 14.4%
HRA 12.3% 12.1% 12.6% 11.1% 10.6% 12.6%
2014/15 2015/16 2016/17 2014/15 2015/16 2016/17
Forecast Forecast Forecast Forecast Forecast Forecast
£ £ £ £ £ £
For Band D council tax
Implications of the Capital Programme for Year 201.41 236.60 243.92 157.70 228.25 248.59
Financial Year Impact 201.41 236.60 243.92 157.70 228.25 248.59
For average weekly housing rents
Implications of the Capital Programme for Year 4.65 5.34 6.13 3.28 6.32 7.52
Financial Year Impact 4.65 5.34 6.13 3.28 6.32 7.52
For Band D council tax
Implications of the Capital Programme for Year 2.02 (7.64) (15.44) (6.36) 7.14 23.11
Marginal Impact to Quarter One 2.02 (7.64) (15.44) (6.36) 7.14 23.11
For average weekly housing rents
Implications of the Capital Programme for Year - - - (0.82) (0.04) (0.04)
Marginal Impact to Quarter One - - - (0.82) (0.04) (0.04)
2014/15 2015/16 2016/17 2014/15 2015/16 2016/17
Forecast Forecast Forecast Forecast Forecast Forecast
£000 £000 £000 £000 £000 £000
General Fund 111,799 36,889 18,290 122,692 57,035 29,195
HRA 57,928 30,477 33,228 74,935 62,040 38,233
169,727 67,366 51,518 197,627 119,075 67,428
Approved by Council 5 March 2014 As at 30 September 2014
Full details of capital expenditure plans and funding can be found in the Capital Quarter Two Monitoring 2014/15 report.
Debt and Treasury Management - Prudential and Treasury Management Indicators
PI 1 - Estimates and Actual ratio of financing costs to net revenue stream.
This represents the cost of financing capital expenditure as a % of net revenue for both the General Fund and HRA.
Approved by Council 5 March 2014 As at 30 September 2014
PI 2 - Estimates of the incremental impact of capital investment decisions on the council tax and housing rents.
The council could consider different options for its capital investment programme in relation to their different impact on the council tax and
housing rents. Negatives reflect a reduction in total capital expenditure.
Approved by Council 5 March 2014 As at 30 September 2014
PI 3 - Estimates and actual capital expenditure.
PI for Affordability - These indicators are used to ensure the total capital investment of the council is within a sustainable limit and the
impact of these decisions are considered with regard to acceptable council tax and housing rent levels.

This report is PUBLIC [NOT PROTECTIVELY MARKED]
Report Pages Page 11 of 25
APPENDIX A
2014/15 2015/16 2016/17 2014/15 2015/16 2016/17
Forecast Forecast Forecast Forecast Forecast Forecast
£000 £000 £000 £000 £000 £000
General Fund 570,638 573,285 556,896 558,031 589,136 586,333
HRA 352,603 347,163 340,438 328,864 352,234 349,975
923,241 920,448 897,334 886,895 941,370 936,308
Borrowing
Other Long Term Liabilities
Total Authorised Limit
Forecast External Debt As at 30 September 2014
Variance (Under) / Over Authorised Limit
Borrowing
Other Long Term Liabilities
Total
Forecast External Debt As at 30 September 2014
Variance (Under) / Over Operational Boundary Limit
Approved by Council 5 March 2014
2016/17
Limit
£000
916,319
96,145
1,012,464
2015/16
999,753
2014/15
Limit
£000
870,926
100,057
970,983
(204,921) (152,748)
This is based on the same estimates as the authorised limit but directly reflects the Assistant Director Finance's estimate of the most
likely, prudent but not worst case scenario, without the additional headroom included.
Debt and Treasury Management - Prudential and Treasury Management Indicators
PI 4 - Estimates and actual capital financing requirement General Fund and HRA.
The capital financing requirement measures the authority's underlying need to borrow for a capital purpose.
Approved by Council 5 March 2014 As at 30 September 2014
PI 5 - Authorised limit for external debt.
These limits apply to the total external debt gross of investments and separately identify borrowing from other long term liabilities such as
finance leases including Private Finance Initiatives (PFI).
PI 6 - Operational boundary for external debt.
Approved by Council 5 March 2014
919,984
96,145
(143,061)
2016/17
Limit
£000
1,016,129
873,068
(160,432)
2014/15
Limit
£000
896,862
109,740
1,006,602
766,062
(240,540)
1,007,437
847,005
2015/16
Limit
£000
909,345
98,092
Limit
£000
901,661
98,092
(139,396)
766,062 847,005 873,068

This report is PUBLIC [NOT PROTECTIVELY MARKED]
Report Pages Page 12 of 25
APPENDIX A
2014/15 2015/16 2016/17 2014/15 2015/16 2016/17
Forecast Forecast Forecast Forecast Forecast Forecast
£000 £000 £000 £000 £000 £000
HRA Debt Limit 356,770 356,770 356,770 356,770 356,770 356,770
HRA Capital Financing Requirement 352,603 347,163 340,438 328,864 352,234 349,975
Headroom 4,167 9,607 16,332 27,906 4,536 6,795
2014/15 2015/16 2016/17 2014/15 2015/16 2016/17
Forecast Forecast Forecast Forecast Forecast Forecast
£000 £000 £000 £000 £000 £000
Forecast Capital Financing Requirement at end of
Second Year 920,448 923,241 920,448 941,371 941,371 941,371
Gross Debt 804,343 833,112 845,824 766,062 847,005 873,068
Capital Financing Requirement Greater than Gross
Debt Yes Yes Yes Yes Yes Yes
PI 9 - Has the local authority adopted the CIPFA Treasury Management in the Public Services: Code of Practice. Yes
Debt and Treasury Management - Prudential and Treasury Management Indicators
PI 8a - Gross debt and the capital financing requirement.
"In order to ensure that over the medium term debt will only be for a capital purpose, the local authority should ensure that debt does not,
except in the short term, exceed the total of capital financing requirement in the preceding year plus the estimates of any additional capital
financing requirement for the current and next two financial years". This replaced PI 8 net debt and the capital financing requirement from
2013/14 onwards.
Approved by Council 5 March 2014 As at 30 September 2014
PI for Prudence - Ensuring that external debt is sustainable and compliance with good professional practice are essential features of
prudence.
PI 7 - HRA limit on indebtedness.
This maximum debt limit has been set by Government as part of the self-financing regime and is compared to the HRA capital financing
requirement.
Approved by Council 5 March 2014 As at 30 September 2014

This report is PUBLIC [NOT PROTECTIVELY MARKED]
Report Pages Page 13 of 25
APPENDIX A
Treasury Management Indicators (TMI)
2014/15 2015/16 2016/17 2014/15 2015/16 2016/17
Limit Limit Limit Forecast Forecast Forecast
Upper limit for fixed rate 100% 100% 100% 84% 86% 87%
Upper limit for variable rate 20% 20% 20% 16% 14% 13%
Upper 2014/15
Limit ForecastBorrowing
Under 12 months 10% 20.56%
12 months and within 24 months 15% 4.77%
24 months and within 5 years 20% 13.10%
5 years and within 10 years 20% 3.10%
10 years and above 90% 58.46%
2014/15 2015/16 2016/17 2014/15 2015/16 2016/17
Limit Limit Limit Forecast Forecast Forecast
£000 £000 £000 £000 £000 £000
Upper limit for more than 364 days 35,000 35,000 35,000 35,000 35,000 35,000
This details the maximum amount which can be invested for up to 5 years (as per paragraph 1.5 of the Annual
Investment Strategy).
Approved by Council 5 March 2014 As at 30 September 2014
0%
0%
50%
40%
50%
90%
Lower
Limit
0%
0%
TMI 3 - Upper limits to the total of principal sums invested longer than 364 days.
Proposed
UpperLimit
25%
25%
Approved by Council 5 March 2014 As at 30 September 2014
TMI 1 - Upper limits on fixed interest and variable interest exposures.
These relate to the levels of net outstanding principal sums exposed to fixed and variable interest rates.
Approved by Council 5 March 2014 As at 30 September 2014
TMI 2 - Upper and lower limits to the maturity structure of its borrowing.
These limits relate to the % of fixed rate debt maturing.
Debt and Treasury Management - Prudential and Treasury Management Indicators

This report is PUBLIC [NOT PROTECTIVELY MARKED]
Report Pages Page 14 of 25
APPENDIX B
This report is PUBLIC [NOT PROTECTIVELY MARKED]
Report Pages Page 15 of 25
APPENDIX C
Economic Background
The following economic background has been provided by the Council‟s Treasury Advisors,
Capita.
U.K.
After strong UK GDP quarterly growth of 0.7%, 0.8% and 0.7% in quarters 2, 3 and 4
respectively in 2013, (2013 annual rate 2.7%), and 0.7% in Q1, 0.9% in Q2 and a first estimate
of 0.7% in Q3 2014 (annual rate 3.1% in Q3), it appears very likely that strong growth will
continue through 2014 and into 2015 as forward surveys for the services and construction
sectors, are very encouraging and business investment is also strongly recovering. The
manufacturing sector has also been encouraging though the latest figures indicate a weakening
in the future trend rate of growth. However, for this recovery to become more balanced and
sustainable in the longer term, the recovery needs to move away from dependence on
consumer expenditure and the housing market to exporting, and particularly of manufactured
goods, both of which need to substantially improve on their recent lacklustre performance. This
overall strong growth has resulted in unemployment falling much faster through the initial
threshold of 7%, set by the Monetary Policy Committee (MPC) last August, before it said it
would consider any increases in Bank Rate. The MPC has, therefore, subsequently broadened
its forward guidance by adopting five qualitative principles and looking at a much wider range of
about eighteen indicators in order to form a view on how much slack there is in the economy
and how quickly slack is being used up. The MPC is particularly concerned that the current
squeeze on the disposable incomes of consumers should be reversed by wage inflation rising
back above the level of inflation in order to ensure that the recovery will be sustainable. There
also needs to be a major improvement in labour productivity, which has languished at dismal
levels since 2008, to support increases in pay rates. Most economic forecasters are expecting
growth to peak in 2014 and then to ease off a little, though still remaining strong, in 2015 and
2016. Unemployment is therefore expected to keep on its downward trend and this is likely to
eventually feed through into a return to significant increases in pay rates at some point during
the next three years. However, just how much those future increases in pay rates will
counteract the depressive effect of increases in Bank Rate on consumer confidence, the rate of
growth in consumer expenditure and the buoyancy of the housing market, are areas that will
need to be kept under regular review.
Also encouraging has been the sharp fall in inflation (CPI), reaching 1.2% in September, the
lowest rate since 2009. Forward indications are that inflation is likely to fall further in 2014 to
possibly 1%. Overall, markets are expecting that the MPC will be cautious in raising Bank Rate
as it will want to protect heavily indebted consumers from too early an increase in Bank Rate at
a time when inflationary pressures are also weak. A first increase in Bank Rate is therefore
expected in Q2 2015 and they expect increases after that to be at a slow pace to lower levels
than prevailed before 2008 as increases in Bank Rate will have a much bigger effect on heavily
indebted consumers than they did before 2008.
The return to strong growth has also helped lower forecasts for the increase in Government
debt by £73bn over the next five years, as announced in the 2013 Autumn Statement, and by

This report is PUBLIC [NOT PROTECTIVELY MARKED]
Report Pages Page 16 of 25
APPENDIX C
an additional £24bn, as announced in the March 2014 Budget - which also forecast a return to a
significant budget surplus, (of £5bn), in 2018-19. However, monthly public sector deficit figures
have disappointed so far in 2014/15.
U.S.
In September, the Federal Reserve continued with its monthly $10bn reductions in asset
purchases, which started in December 2013. Asset purchases have now fallen from $85bn to
$15bn and are expected to stop on 29th October 2014, providing the economic outlook remains
strong. First quarter GDP figures for the US were depressed by exceptionally bad winter
weather, but growth rebounded very strongly in Q2 to 4.6% (annualised).
The U.S. faces similar debt problems to those of the UK, but thanks to reasonable growth, cuts
in government expenditure and tax rises, the annual government deficit has been halved from
its peak without appearing to do too much damage to growth, although the weak labour force
participation rate remains a matter of key concern for the Federal Reserve when considering the
amount of slack in the economy and monetary policy decisions.
Eurozone
The Eurozone is facing an increasing threat from weak or negative growth and from deflation.
In September, the inflation rate fell further, to reach a low of 0.3%. However, this is an average
for all EZ countries and includes some countries with negative rates of inflation. Accordingly,
the ECB took some rather limited action in June to loosen monetary policy in order to promote
growth. In September it took further action to cut its benchmark rate to only 0.05%, its deposit
rate to -0.2% and to start a programme of purchases of corporate debt. However, it has not
embarked yet on full quantitative easing (purchase of sovereign debt).
Concern in financial markets for the Eurozone subsided considerably during 2013. However,
sovereign debt difficulties have not gone away and major issues could return in respect of any
countries that do not dynamically address fundamental issues of low growth, international
uncompetitiveness and the need for overdue reforms of the economy, (as Ireland has done). It
is, therefore, possible over the next few years that levels of government debt to GDP ratios
could continue to rise for some countries. This could mean that sovereign debt concerns have
not disappeared but, rather, have only been postponed.
China and Japan
Japan is causing considerable concern as the increase in sales tax in April has suppressed
consumer expenditure and growth. In Q2 growth was -1.8% q/q and -7.1% over the previous
year. The Government is hoping that this is a temporary blip.
As for China, Government action in 2014 to stimulate the economy appeared to be putting the
target of 7.5% growth within achievable reach but recent data has raised fresh concerns. There
are also major concerns as to the creditworthiness of much bank lending to corporates and local
government during the post 2008 credit expansion period and whether the bursting of a bubble
in housing prices is drawing nearer.

This report is PUBLIC [NOT PROTECTIVELY MARKED]
Report Pages Page 17 of 25
APPENDIX C
Interest Rate Forecast
The Council‟s treasury advisor, Capita Asset Services, has provided the following forecast:
Capita Asset Services undertook a review of its interest rate forecasts on 24 October. During
September and October, a further rise in geopolitical concerns, principally over Ukraine but also
over the Middle East, plus fears around Ebola and an accumulation of dismal growth news in
most of the ten largest economies of the world and also on the growing risk of deflation in the
Eurozone, had sparked a flight from equities into safe havens like gilts and depressed PWLB
rates. However, there is much volatility in rates as news ebbs and flows in negative or positive
ways. This latest forecast includes a first increase in Bank Rate in quarter 2 of 2015.
Our PWLB forecasts are based around a balance of risks. However, there are potential upside
risks, especially for longer term PWLB rates, as follows: -
• A further surge in investor confidence that robust world economic growth is firmly
expected, causing a flow of funds out of bonds and into equities.
• UK inflation being significantly higher than in the wider EU and US, causing an
increase in the inflation premium inherent to gilt yields.
Downside risks currently include:
• The situation over Ukraine poses a major threat to EZ and world growth if it was to
deteriorate into economic warfare between the West and Russia where Russia
resorted to using its control over gas supplies to Europe.
• Fears generated by the potential impact of Ebola around the world
• UK strong economic growth is currently mainly dependent on consumer spending and
the potentially unsustainable boom in the housing market. The boost from these
sources is likely to fade after 2014.

This report is PUBLIC [NOT PROTECTIVELY MARKED]
Report Pages Page 18 of 25
APPENDIX C
• A weak rebalancing of UK growth to exporting and business investment causing a weakening of overall economic growth beyond 2014.
• Weak growth or recession in the UK‟s main trading partner - the EU, inhibiting
economic recovery in the UK.
• A return to weak economic growth in the US, UK and China causing major
disappointment in investor and market expectations.
• A resurgence of the Eurozone sovereign debt crisis caused by ongoing deterioration in
government debt to GDP ratios to the point where financial markets lose confidence in
the financial viability of one or more countries and in the ability of the ECB and
Eurozone governments to deal with the potential size of the crisis.
• Recapitalisation of European banks requiring more government financial support.
• Lack of support by populaces in Eurozone countries for austerity programmes,
especially in countries with very high unemployment rates e.g. Greece and Spain,
which face huge challenges in engineering economic growth to correct their budget
deficits on a sustainable basis.
• Italy: the political situation has improved but it remains to be seen whether the new
government is able to deliver the austerity programme required and a programme of
overdue reforms. Italy has the third highest government debt mountain in the world.
• France: after being elected on an anti austerity platform, President Hollande has
embraced a €50bn programme of public sector cuts over the next three years.
However, there could be major obstacles in implementing this programme. Major
overdue reforms of employment practices and an increase in competiveness are also
urgently required to lift the economy out of stagnation.
• Monetary policy action failing to stimulate sustainable growth in western economies,
especially the Eurozone and Japan.
• Heightened political risks in the Middle East and East Asia could trigger safe haven
flows back into bonds.
• There are also increasing concerns at the reluctance of western central banks to raise
interest rates significantly for some years, plus the huge QE measures which remain in
place (and may be added to by the ECB in the near future). This has created
potentially unstable flows of liquidity searching for yield and, therefore, heightened the
potential for an increase in risks in order to get higher returns. This is a return to a
similar environment to the one which led to the 2008 financial crisis.

This report is PUBLIC [NOT PROTECTIVELY MARKED]
Report Pages Page 19 of 25
Borrowing and Repayments in 2014/15
Maturity
DateAmount Length
Interest
Rate
Full Year
Interest
£000 £000
2014/15 Borrowing
PWLB Fixed Maturity years
503341 30/09/2017 23,000 3 2.05% 472
23,000 2.05% 472
2014/15 Repayments
Temporary Loans days
Caerphilly BC 02/05/2014 5,000 86 0.35% 4
Portsmouth City Council 29/08/2014 6,000 182 0.43% 13
Derbyshire CC Super. Fund 29/08/2014 4,000 182 0.45% 9
15,000 0.41% 26
APPENDIX D

This report is PUBLIC [NOT PROTECTIVELY MARKED]
Report Pages Page 20 of 25
Fixed 82%
Variable 18%
Borrowing by Type
APPENDIX E
Borrowing: Graphical Summary
As at 30 September 2014

This report is PUBLIC [NOT PROTECTIVELY MARKED]
Report Pages Page 21 of 25
Certainty Rate
2014/15 2015/16 2016/17 2014/15 2015/16 2016/17
Forecast Forecast Forecast Forecast Forecast Forecast
£000 £000 £000 £000 £000 £000
Net Borrowing Requirement:
Borrowing to Finance approved
Capital Expenditure 103,742 30,735 14,658 104,440 82,851 27,949
Existing Maturity Loans to be
Replaced During the Year 90,000 76,605 86,605 70,200 114,605 76,605
Less:
Minimum Revenue Provision for
Debt Repayment (13,646) (17,394) (19,020) (7,690) (11,125) (13,637)
Voluntary Debt Repayment (11,804) (14,169) (16,805) (13,711) (15,343) (17,488)
(25,450) (31,563) (35,825) (21,401) (26,468) (31,125)
Loans Replaced Less Debt Repayment 64,550 45,042 50,780 48,799 88,137 45,480
Net Advance Requirement 168,292 75,777 65,438 153,239 170,988 73,429
This table details the information that is required to enable the Council to submit a return for 2014/15.
As at 25 February 2014 As at 30 September 2014
APPENDIX F
Disclosure for Certainty Rate

This report is PUBLIC [NOT PROTECTIVELY MARKED]
Report Pages Page 22 of 25
APPENDIX G
Annual MRP Statement 2014/15
Minimum Revenue Provision – an introduction
1. What is Minimum Revenue Provision?
Capital expenditure is generally expenditure on assets which have a life expectancy of more
than one year e.g. buildings, vehicles, machinery etc. In accordance with proper practice, the
financing of such expenditure is spread over several years in order to try to match the years
over which such assets benefit the local community through their useful life. The manner of
spreading these costs is through an annual charge known as Minimum Revenue Provision
(MRP), which is determined by the Council under guidance.
2. Statutory duty
The Local Authorities (Capital Finance and Accounting) (England) Regulations 2003 (as
amended by Statutory Instrument 2008 no. 414 s4) lay down that:
“A local authority shall determine for the current financial year an amount of minimum revenue
provision that it considers to be prudent.”
3. Government guidance
Along with the above duty, the Government issued guidance which came into force on 31 March
2008 which requires that a Statement on the Council‟s policy for its annual MRP should be
submitted to the full Council for approval before the start of the financial year to which the
provision will relate.
The Council is legally obliged to “have regard” to the guidance, which is intended to enable a
more flexible approach to assessing the amount of annual provision than was required under
the previous statutory requirements. Although it is up to each Council to determine for itself
how to calculate its MRP, the guidance suggests four methodologies, with an overriding
recommendation that the Council should make prudent provision to redeem its debt liability over
a period which is reasonably commensurate with that over which the capital expenditure is
estimated to provide benefits. The requirement to „have regard‟ to the guidance therefore
means that:
1. Although four main options are recommended in the guidance, there is no
intention to be prescriptive by making these the only methods of charge under
which a local authority may consider its MRP to be prudent.
2. It is the responsibility of each authority to decide upon the most appropriate
method of making a prudent provision, after having had regard to the guidance.

This report is PUBLIC [NOT PROTECTIVELY MARKED]
Report Pages Page 23 of 25
APPENDIX G
4. Timing
This statement shall take effect from 1 April 2014 and shall take precedence over any
statements previously approved.
5. Calculation
MRP shall be calculated by adding together the amount calculated using the method as stated
below and any amount calculated under adjustment 1 below.
Method
To be used for all capital expenditure taking into account only capital expenditure and financing
decisions, and the classification of fixed assets, reflected in the Council‟s accounts for the
preceding year.
With the variations set out below, MRP will be calculated, on an individual fixed asset basis
(unless they are land or community assets (no depreciation) or where it is capitalised under
statute/direction (equal pay, refcus etc.) when one grouped “asset” is created for MRP
calculation purposes for each category for individual years), in accordance with the annuity
method whereby MRP for each year will be the amount presumed to be the principal element of
the equal amounts that would be payable each year in respect of a loan at the specified rate of
interest that would reduce the outstanding principal amount to zero at the end of the estimated
useful life.
The specified rate of interest will be the average interest rate of the Council‟s debt as at the end
of the year preceding the first year in which the annuity rate is to be applied. Where the interest
rate on debt is variable the rate to be used in calculating the average shall be the interest rate
on the debt at 31 March of the year for which the average is being calculated.
MRP will thus be calculated in accordance with the following formula:
PPMT (A,B,C,D-E) + F
Where
PPMT is the PPMT financial function in Microsoft Excel 2010
A is the specified interest rate
B is the number of years (including the current year) for which MRP has been charged on
an annuity basis
C is the useful economic life of the asset as at the start of the year for which MRP is first
charged on an annuity basis
D is the total need to borrow for capital purposes (resulting from capital expenditure)
E is the aggregate value of any anticipated future capital receipts that are an integral part
of the capital scheme in question.
F is an amount determined by Cabinet (Resources) Panel.

This report is PUBLIC [NOT PROTECTIVELY MARKED]
Report Pages Page 24 of 25
APPENDIX G
C shall be equal to the useful life of the fixed asset in question, as estimated by the
Council. For assets with a useful life of more than 99 years, C shall equal 99. C shall not
be varied for changes in the useful life of the asset unless the Council considers that
special circumstances apply that would mean that a change would result in MRP being
more reasonably calculated on a prudent basis; for example the useful life of a particular
asset (as assessed for depreciation purposes) could change so dramatically that
continued use of the option would no longer be supportable as prudent. For example, a
property could be sold only a short time into its originally estimated useful life.
E shall be reviewed each year on performing the calculation, and amended if necessary.
The cumulative total of F, taken across all past and current years, shall never be less
than zero.
The Method shall be varied in the following circumstances:
(a) For non-operational assets, for which no charge will be made.
(b) For expenditure on fixed assets that are not or would not be classed as fixed
assets of the Council in accordance with proper accounting practice, for which C
shall initially be equal to the estimated remaining useful life of the fixed asset in
question.
(c) For expenditure capitalised under direction, for which C shall initially equal 20, and
shall not be reviewed or amended.
This report is PUBLIC [NOT PROTECTIVELY MARKED]
Report Pages Page 25 of 25
Country Limit Term
Institution (Sovereign Rating) £000 Limit
Australia & New Zealand Banking Group Ltd Australia (AAA) 10,000 6 mthsBank Netherlandse Gemeenten Netherlands (AAA) 20,000 12 mthsBank of Montreal Canada (AAA) 10,000 6 mthsBank of New York Mellon, The USA (AAA) 10,000 6 mthsBank of Nova Scotia Canada (AAA) 10,000 6 mthsCanadian Imperial Bank of Commerce Canada (AAA) 10,000 6 mthsClearstream Banking Luxembourg (AAA) 20,000 12 mthsCommonwealth Bank of Australia Australia (AAA) 10,000 6 mthsCooperatieve Centrale Raiffeisen - Boerenleenbank BA Netherlands (AAA) 5,000 3 mthsDBS Bank Ltd Singapore (AAA) 10,000 6 mthsHong Kong and Shanghai Banking Corporation Ltd Hong Kong (AA+) 10,000 6 mthsHSBC Bank plc UK (AA+) 10,000 6 mthsHSBC Bank USA USA (AAA) 10,000 6 mthsNational Australia Bank Ltd Australia (AAA) 10,000 6 mthsNordea Bank AB Sweden (AAA) 10,000 6 mthsNordea Bank Finland plc Finland (AAA) 10,000 6 mthsOversea Chinese Banking Corporation Ltd Singapore (AAA) 10,000 6 mthsRoyal Bank of Canada Canada (AAA) 10,000 6 mthsStandard Chartered Bank UK (AA+) 10,000 6 mthsSvenska Handelsbanken AB Sweden (AAA) 10,000 6 mthsToronto Dominion Bank Canada (AAA) 10,000 6 mthsUnited Overseas Bank Ltd Singapore (AAA) 10,000 6 mthsWells Fargo Bank NA USA (AAA) 10,000 6 mthsWestpac Banking Corporation Australia (AAA) 10,000 6 mths
Nationalised Banks
Lloyds Banking Group plcBank of Scotland plc UK (AA+) 10,000 3 mthsLloyds Bank plc UK (AA+) 10,000 3 mthsRoyal Bank of Scotland Group plcNational Westminster Bank plc UK (AA+) 10,000 3 mthsThe Royal Bank of Scotland plc UK (AA+) 10,000 3 mths
Money Market Funds Fund RatingInvesco STIC Account Fitch AAAmmf 20,000 Instant AccessIgnis Sterling Liquidity Fund Fitch AAAmmf 20,000 Instant AccessFederated Short-Term Sterling Prime Fund Fitch AAAmmf 20,000 Instant Access
Black Rock Sterling Liquidity Fund Moody's Aaa-mf 20,000 Instant AccessScottish Widows Sterling Liquidity Fund Moody's Aaa-mf 20,000 Instant Access
Non-rated Institutions
County Councils, London Boroughs, Metropolitan Districts and Unitary Authorities - limits £6m and 12 months.
Shire District Councils, Fire and Civil Defence Authorities, Passenger Transport Authorities and Police
Authorities - limits £3m and 12 months.
APPENDIX H
Wolverhampton City Council
2014/15 Specified Investments Lending List as at 30 September 2014