report title: the economic impact of oil and gas … library/research/coal...table 3 employment in...
TRANSCRIPT

Report Title The Economic Impact of Oil and Gas Extraction in New Mexico Type of Report Technical Report Reporting Period Start Date October 1 2008 Reporting Period End Date September 30 2009 Principal Authors James Peach Leo Delgado and C Meghan Starbuck Date Issued September 2009 DOE Award Number DE-NT0004397 Name and Address of Submitting Organization Arrowhead Center New Mexico State University PO Box 30001 MSC 3CQ Las Cruces NM 88003-8001
Pump Jack near Hobbs New Mexico Photo by James Peach
2
DISCLAIMER This report was prepared as an account of work sponsored by an agency of the United States Government Neither the United States Government nor any agency thereof nor any of their employees makes any warranty express or implied or assumes any legal liability or responsibility for the accuracy completeness or usefulness of any information apparatus product or process disclosed or represents that its use would not infringe privately owned rights Reference herein to any specific commercial product process or service by trade name trademark manufacturer or otherwise does not constitute or imply its endorsement recommendation or favoring by the United States Government or any agency thereof The views and opinions of authors expressed herein do not necessarily state or reflect those of the United States Government or any agency thereof
3
Abstract The economic impact of oil and gas extraction in New Mexico is examined in this report The analysis is based on economic multipliers derived from an input-output model of the New Mexico economy The direct indirect and induced impacts of oil and gas extraction in New Mexico are presented in terms of output value added employment and labor income for calendar year 2008 Tax rental and royalty income to the State of New Mexico are also presented Historical oil and gas production reserves and price data are also presented and discussed
4
Table of Contents
Table of Tables 5
Table of Figures 5
Executive Summary 6
Introduction 7
Oil Production 8
World Oil Production 9
US Oil Production 10
New Mexico Oil Production 11
Oil Prices 12
Natural Gas Production 14
World Gas Production 14
US Natural Gas Production 15
New Mexico Gas Production 16
US Natural Gas Prices 17
New Mexico Natural Gas Prices 19
Employment in the New Mexico Oil and Gas Industry 19
Rotary Drilling Rigs 20
Refineries 21
Number of Wells 21
Number of Operators 22
Economic Impact of the Oil and Gas Industry in New Mexico 22
Tax Impacts of Oil and Gas Extraction in New Mexico 27
New Mexico Tax Revenue from Oil and Gas Extraction 29
Limitations of the Analysis 31
Summary and Conclusions 31
Works Cited 32
Acknowledgements 37
Appendix A Data Sources and Issues 38
Sources 38
Oil Data Issues 38
5
Natural Gas Data Issues 39
Appendix B Data Tables and Sources for Figures 40
Appendix C A Brief Review of Input-Output Analysis 66
Table of Tables
Table 1 Drilling Rig Count Data for New Mexico 2008-2009 21 Table 2 New Mexico Oil and Gas Production Price and Market Value 2007 and 2008 23 Table 3 Employment in New Mexicos Oil and Gas Industry 2007 and 2008 24 Table 4 Employment and Labor Income Impacts of New Mexico Oil and Gas Activities 24 Table 5 Detailed Employment Impacts from Oil and Gas Industry in New Mexico 25 Table 6 Distribution of Oil and Gas Tax Revenues 28 Table 7 Distributions from the Land Grant Permanent Fund 29 Table 8 Oil and Gas Contributions to General Fund 30 Table 9 Indirect Taxes Derived from Oil and Gas Production in New Mexico 31
Table of Figures
Figure 1 Map of New Mexico Oil Producing Counties 7 Figure 2 US Real GDP per Capita 9 Figure 3 World Oil Production 10 Figure 4 Oil Producing Nations 10 Figure 5 US Annual Production by Decade 11 Figure 6 NM Oil Production by Decade 12 Figure 7 US Crude Oil Prices 12 Figure 8 Weekly Crude Oil Price 2005-2009 13 Figure 9 World Gas Production 15 Figure 10 Natural Gas Producing Nations 15 Figure 11 US Gas Production by Decade 16 Figure 12 NM Gas Production 17 Figure 13 Natural Gas Prices 18 Figure 14 Henry Hub Spot Price 18 Figure 15 Natural Gas Prices USNM 19 Figure 16 NM Employment Oil and Gas Extraction 20
6
Executive Summary
In 2007 New Mexico had an estimated 34 of US crude oil reserves (735 million barrels) 73 of the US reserves of dry natural gas (17245 trillion cubic feet) and 92 of the nations reserve of natural gas liquids (844 million barrels) New Mexico is also home to significant coal reserves with an estimated 483 million short tons of recoverable coal in 2007 (EIA State Energy Profiles) Crude oil production in New Mexico represented 29 of the US total supply in February 2009 with 4517 million barrels produced and annual oil production in New Mexico was 59403 million barrels in 2008 Natural gas production in New Mexico was 77 of the US supply in 2007 with a total of 1544 trillion cubic feet (EIA State Energy Profiles) New Mexico has three crude oil refineries Navajo Refining (Artesia NM) Western Refining SW Inc (Bloomfield NM) and Western Refining SW Inc (Gallup) The total refining capacity in the state is 132600 barrels per calendar day as of January 2009 This refining capacity is 08 of the US total New Mexico has numerous major pipelines for crude oil petroleum product liquefied natural gases and interstate natural gas pipelines and the Blanco Hub for natural gas (EIA State Energy Profiles) New Mexico consumes an average of 352 million BTU per capita (2006) which ranks New Mexico 21st in the nation for energy use In 2006 EIA estimated that New Mexico consumed 683 trillion BTUs compared with the 2650 trillion BTUs of energy production for that year making New Mexico a net energy exporter New Mexico has a total population of 1984356 which is 065 of the US population but produced 37 of the nations energy in 2006 (EIA State Energy Profiles US Census Quick Facts) The direct employment of 15904 in the oil and gas industry generates $12 billion in labor income which is equivalent to $77653 per job The total employment associated with the industry (direct indirect and induced employment impacts) is 41718 jobs which was 51 percent of New Mexicorsquos total private sector employment in 2008
The oil and gas industry also contribute important revenues to the State General Fund The largest sources of oil and gas revenue are from Federal Minerals Leasing ($5642 million in FY 2008) the oil and gas school tax ($5578 million in FY 2008) and State Land Office Royalties ($4599 million in FY 2008) Payments from these three revenue sources generated more than $158 billion dollars for the General Fund in 2008 The total direct state revenues associated with the oil and gas industry was more than $186 billion in FY2008 Indirect revenues associated with the industry generated an additional $191 million dollars for New Mexicans
The oil and gas industry provides an important source of economic activity and employment in a state with large geographical areas with low levels of economic opportunities This report examines the economic impact on labor income and employment of the extraction of oil and natural gas in New Mexico
7
Introduction
New Mexico is a rural state rich in natural resources The state is a net exporter of many resource based commodities including timber oil natural gas electricity coal onions pecans beef peanuts and dairy products The character of the state is defined by the rich natural resources which contribute important economic benefits that range from extractive industries to tourism and agriculture A sparsely populated state the New Mexico economy is heavily dependent upon natural resource based industries New Mexico has a total land area of 121355 square miles and a total surface water area of only 233 square miles The US Census Bureau estimated the New Mexico population at 1984356 in 2008 which is 065 of the US population This population is concentrated in the middle Rio Grande valley in the Albuquerque and Santa Fe areas where nearly one-third of the population of the state lives (See Figure 1) New Mexico has a population density of 15 people per square mile compared to 796 for the US as a whole In New Mexico Bernalillo County (Albuquerque) has a population density of 4774 per square mile and Harding County (in the northeastern corner) has a population density of only 04 people per square mile As a point of comparison New York County (NY) has a population density of 66940 people per square mile As the population density of 04 per square mile in Harding County highlights the rural nature of New Mexico is a defining feature of the state Even the most densely populated county in the state has only 071 the population density of New York County (US Census Population Housing Units Area and Density 2000) The rural area of the state and the vast unpopulated land areas have strongly contributed to the development of New Mexico as an energy producing state The geology of the area provided the deposition of the fossil resources and the open land areas that are not arable and do not have significant population centers have allowed New Mexico to be a source of fossil fuel production since the late 1800s Energy production in New Mexico is concentrated in the Permian and San Juan Basins which are in eastern and northern New Mexico (see Map 1) where during the late Cretaceous period a vast inland sea covered the area The primary oil and natural gas producing counties are Eddy Lea McKinley Rio Arriba Roosevelt Sandoval San Juan Chaves and Colfax (See Figure 1) Union Harding and Quay counties produce CO2 and Helium products
Figure 1 Map of New Mexico Oil Producing Counties
8
Of the energy producing counties in New Mexico the population density is very low Lea County (a large oil producing county) has a total population of 55511 and a density of only 126 people per square mile San Juan County (a large natural gas producing county) in northern New Mexico has a population of 113801 and a density of 206 people per square mile Roosevelt County (oil production) has a population density of only 74 and Union County which produces CO2 and Helium has a population density of only 11 people per square mile (US Census Population Housing Units Area and Density 2000 Census) The economic contribution to the state is disproportionate to the population base of those counties and this is an important aspect of the economic impacts of the oil and gas industry in New Mexico The impact of oil and natural gas extraction on the New Mexico economy is discussed in this report The report is organized as follows (1) production of oil and natural gas (2) prices of oil and gas (3) employment in the New Mexico oil and gas industry (4) economic impacts of the industry in the state (5) tax impacts (6) conclusions and appendices and references For the figures in the report the full citation with hyperlink is provided in Appendix B as well as the complete data table that was used to generate the figure
Oil Production
Oil and natural gas have been important drivers of economic growth and fuel the modern industrial world The main fossil fuels in use since the late 1800s are coal and crude oil with natural gas CO2 helium and coal bed methane becoming increasingly important components of fossil based resource extraction The industrial age would not have been possible without coal and crude oil to run industrial machinery heat and illuminate businesses and homes as well as run the transportation infrastructure that makes large-scale commerce possible Crude oil products are used in the transportation sector and it is estimated that more than 4000 different plastics fertilizers and other industrial chemicals are derived from crude oil Some of the key products derived from crude oil are gasoline diesel kerosene JP8 naphtha liquefied petroleum gas fuel oil lubricants asphalt insecticides fertilizer ethylene propylene butadiene benzene ammonia methanol plastics polyester synthetic rubbers detergents and perfumes (OPEC 2009 IEA 2009) Each barrel of oil is converted in the following major products 1911 gallons of gasoline 1096 gallons of distillate fuel oil 382 gallons of Kerosene type Jet Fuel 218 gallons of petroleum coke 185 gallons of still gas 176 gallons of residual fuel oil 172 gallons of liquefied refinerypetroleum gas 122 gallons of asphalt and road oil and 55 gallons of other oils for feed stocks (EIA 2008 Petroleum Products) The modern petroleum age began in the 1850s In the 1850s whale oil was a major commodity that was used for illumination and was an early source of industrial energy lubricants and useful by-products Perfumes candles lubricants and other materials were derived from whale oil (mostly sperm whales) Whale oil production was centered in New England and production peaked at 18 million gallons of oil in 1845 (Starbuck 1876) The uncertain supply and volatile prices of whale oil provided an opportunity for the development of the petroleum industry The initial use of crude oil was for the production of kerosene to replace the erratic whale oil supply Prior to 1859 oil was collected from natural seeps and these only produced small quantities of oil per day In 1859 in Titusville PA the first commercial oil well was drilled by Edwin Drake This is noted by many as the watershed moment for the oil industry and ushered in the dramatic industrial application of this new economic input (Maugeri 2006 pp 1-6) For
9
more information on the history of the petroleum industry please refer to Adelman (1995) Maugeri (2006) and Parra (2004) The need for a steady supply of affordable oil material was already present in the 1700s at the beginning of the industrial revolution and increased dramatically along with economic output and activity The compound annual growth rate of real gross domestic product between 1900 and 2008 was 335 Gross Domestic Product (GDP) per person went from less than $5000 to more than $46000 in 2008 in real (2008) terms (Peach 2009)
Figure 2 US Real GDP per Capita
An important component of the rise in US GDP per capita in the 20th century was the dramatic increase in the use of fossil energy to drive the industrial machinery Oil and gas production is linked to exploration and drilling which is in turn driven by market forces both domestically and around the world The following sections provide historical data for the production of oil and gas both at a world scale and in New Mexico This information in addition to the brief socio-economic material above provide context for the discussion of impacts from the industry in New Mexico and help provide points of comparison for the issues presented in this report
World Oil Production
In 1857 crude oil production was estimated at approximately 2000 barrels of oil per year mostly used to create the first generation of kerosene for illumination By 1859 when Edwin Drake drilled the first modern-type oil well production was estimated at 4000 barrels per year In 1860 production jumped to 508000 barrels and by 1865 production had risen to 2716000 barrels of oil worldwide (American Petroleum Institute 1971 pp 556-557 US Department of Energy 1984 pp 4 EIA International Supply Tables) In 1900 worldwide production had risen to 1491 million barrels of oil per year and by the start of World War I in 1914 production had climbed to 4075 million barrels per year By the start of World War II in 1939 world oil production reached 21 billion barrels The post WWII era saw the growth of oil production from 25 billion barrels per year in 1945 to more than 11 billion barrels in 1965 By 2008 worldwide oil production was 312 billion barrels of oil Figure 3 presents the production of oil in
10
thousands of barrels per year between 1857 and 2008 (American Petroleum Institute 1971 pp 556-557 US Department of Energy 1984 pp 4 EIA International Supply Tables)
Figure 3 World Oil Production
Figure 4 Oil Producing Nations
The five largest oil producers worldwide are (1) Saudi Arabia (2) Russia (3) the United States (4) Iran and (5) China In 2007 as Figure 4 depicts Saudi Arabia produced more than 374 billion barrels of oil and the US produced more than 308 billion barrels of oil (825 of the Saudi Arabian total) The five largest producing countries produced 4326 of the world supply of crude oil (EIA World Regions Production 2009)
US Oil Production
Figure 5 shows the average annual production in the US by decade Production in the 1880s averaged more than 104 million barrels annually and by 1980s the average annual production was more than 32
-
5000000
10000000
15000000
20000000
25000000
30000000
35000000
1857
1863
1869
1875
1881
1887
1893
1899
1905
1911
1917
1923
1929
1935
1941
1947
1953
1959
1965
1971
1977
1983
1989
1995
2001
2007
World Oil Production 1857-2008 (Thousands of Barrels)
World Crude Oil
3743002
3606413
3088732
1473331
1428741
- 500000 1000000 1500000 2000000 2500000 3000000 3500000 4000000
Saudi Arabia
Russia
United States
Iran
China
2007 Oil Production in Major Producing Nations (Thousands of Barrels)
Crude Oil Production
11
billion barrels Since the 1980s domestic production of oil has been declining and by the 2000s production was only slightly more than the 1960s average annual production value (EIA Oil Production 2009) However US crude oil production was 3088 billion barrels of oil in 2007 The 2007 value was below the 1990 and 1980 levels but significantly above the 2000 value There are competing theories as to the reason for the production profile over time in the US Numerous factors have all contributed to the decline including regulatory changes international price competition and changing international dynamics A good source for more information is Maugeri (2006)
Figure 5 US Annual Production by Decade
New Mexico Oil Production
Data on the production of crude oil in New Mexico goes back to 1924 Production increased from 98000 barrels in 1924 to 1666000 barrels in 1926 but then declined to 1226000 in 1927 and 943000 barrels in 1928 In 1929 production increased to 1830000 barrels per year and by 1930 production increased to 10189000 barrels Production increased again in 1931 but then declined briefly in 1932 before increasing again in 1933 Production in New Mexico grew between 1933 and 1937 followed by a small decline in 1938 Oil production was erratic in the 1940s varying between 391 million and 479 million over the decade with a general upward trend Production rose steadily from 1951 through 1961 reaching an annual production of 1125 million barrels of oil in 1961 Production in the 1960s was generally increasing reaching a peak of 1293 barrels in 1969 (American Petroleum Institute 1959 pp 40-41 American Petroleum Institute 1961 pp 34 EIA NM Oil Production 2009 EIA Historical NM Oil Production 2009) Beginning in 1970 New Mexico oil production began a long decline falling to 7964 million barrels in 1979 Production declined 383 in 10 years There was a short period of increase in 1982 and 1983 and then state production fell again Production remained between 65 and 72 million barrels in the 1990s and then fell to only 59403000 barrels by 2008 Production in 2008 was approximately the level of production in 1952 a sharp decline from the peaks reached in the 1960s New Mexico oil production has decreased faster than in the US as a whole Production in New Mexico has fallen by 54 since the peak of 1969 while US production has declined by 446 since the peak in 1985 and by more than 53 since 1969 American Petroleum Institute 1959 pp 40-41 American Petroleum Institute 1961 pp 34 EIA NM Oil Production 2009 EIA Historical NM Oil Production 2009)
500 2770 10416 27295 53517 122832281863
712016
1019559
1664255
2439090
2958923
32331973110048
2449063
0
500000
1000000
1500000
2000000
2500000
3000000
3500000
1860 1870 1880 1890 1900 1910 1920 1930 1940 1950 1960 1970 1980 1990 2000
Average Annual Oil Production in the United States by Decade 1860-2000 (Thousand Barrels)
Average US Production of Crude Oil
12
Figure 6 NM Oil Production by Decade
Figure 6 shows the average annual production by decade for New Mexico between 1924 and 2008 The peak production of the 1960s followed by the significant decline is clearly visible with average production in the 2000s below that of the 1950s
Oil Prices
Production of oil is linked to the price of oil and the overall economic conditions that determine the demand for oil both domestically and internationally Using West Texas Intermediate (WTI) as the reference price the real price for oil (2008 dollars) between 1929-2008 for the US is presented in Figure 7
Figure 7 US Crude Oil Prices
In 1929 the real price (WTI) of a barrel of oil in the US was $849 This was at the height of the pre-depression period in the US economy and prices fell steeply over the next several years as the Great
13
Depression created a strong deflationary period and the country experienced sharp production declines (Figure 7) and declining prices By 1931 the price of a barrel of oil (in 2008 dollars) had declined to $462 which was a decline of more than 45 in only two years Prices then recovered somewhat in 1932 and 1933 before spiking to $1242 per barrel in 1934 In the 1950s-1960s prices entered a long period of stability with a small upward trend as the US entered into the post-war boom years Prices rose (in real terms) from $973 per barrel in 1946 to $1373 in 1969 In 1973 the price of a barrel of oil was $1489 In 1974 the price had increased to $3659 per barrel Prices declined steeply in the 1980s ranging from a high of $8470 in 1980 to a low of $2583 in 1988 The 1990s saw further declines in price with the decade starting with a per barrel price of $3680 per barrel to a low of $1830 per barrel in 1998 Beginning in 2000 oil prices began an upward trend rising to $3719 per barrel in 2000 falling slightly between 2001-2002 before climbing to $3576 per barrel in 2003 A period of rapid increase began in 2004 with prices rising from $4642 in 2004 to an annual average of $9967 per barrel in 2008 The peak price (weekly average price in real 2008 dollars) recorded in 2008 was in July at $12527 per barrel (US Department of Energy 1984 pp 100 US Federal Reserve 2009 EIA Historical Prices 2009 EIA Petroleum Prices 2009) Maugeri (2006) provides a good history of petroleum its production adoption and prices from the 1850s and 2000s By August2008 prices had fallen to $10893 per barrel a decline of 13 in one month The collapse of oil prices between August 2008 and December 2008 coincided with the financial and economic crisis that swept through world economies in full force between September 2008 and December 2008 By December 2008 the price of oil had fallen to $3593 per barrel --a decline of 71 in only five months Prices have recovered from the December 2008 low and have been trading in a range (weekly prices) between $50 and $65 per barrel since April 2009 Figure 8 shows weekly real price data between January 2005 and July 2009
Figure 8 Weekly Crude Oil Price 2005-2009
The production and price of oil over time has varied substantially in the United States As prices rise investment in exploration and alternative technologies rise and conversely when prices decline this investment and exploration declines The economic activity associated with the oil industry also rises and falls with the price and this has significant implications for the communities that are involved in the
14
domestic production of oil Areas like New Mexico Texas Oklahoma and Alaska are tied closely to the world energy market and the scars of the boom-bust cycle are evident in the economic performance of these communities over time and in the physical infrastructure of the areas Anyone who has traveled through the oil producing areas of New Mexico Texas and Oklahoma can see the growth of the communities between the 1960s-1980s (with some stagnation in the 1970s) and the exodus of population and income during the bust of the 1980s and 1990s and the renewed activity resulting from the price increase of the 2000s The rise and fall of the industry is physically written in the architecture and economic infrastructure of the oil producing counties in the US
Natural Gas Production
Natural gas is used around the world for heating cooking industrial manufacturing power generation and as a source for important industrial chemicals Of the 3338 trillion tons of natural gas available in the US in 2008 1940 trillion cubic feet were from natural gas wells 665 trillion cubic feet were from crude oil wells 396 trillion cubic feet were from imported sources and 337 trillion cubic feet were withdrawn from storage (EIA 2008 Annual Energy Review) In 2008 the US imported 396 trillion cubic feet of natural gas Residential consumption accounted for 487 trillion cubic feet 312 trillion cubic feet were used for commercial purposes 794 trillion cubic feet were used in industrial uses and 666 trillion cubic feet were used in electric power generation Natural gas production occurs in the same areas as crude oil and many of the geologic formations that yield crude oil also yield natural gas This section will describe the worldwide and New Mexico production of natural gas
World Gas Production
The worldwide production of natural gas has risen steadily since the 1980s The Energy Information Administration provides annual world natural gas production since 1980 In 1980 production of natural gas (worldwide) was more than 5337 trillion cubic feet Production rose gradually during the 1980s and by 1989 production of natural gas worldwide was 72157 trillion cubic feet annually Production at the start of the 1990s was 7378 trillion cubic feet and by the end of the 1990s production had risen to 8508 trillion cubic feet By 2007 production of natural gas worldwide had reached 10597 trillion cubic feet (EIA International Gas Production 2008) Figure 9 shows the production of natural gas worldwide between 1980-2007 (billions of cubic feet)
15
Figure 9 World Gas Production
The largest producer of natural gas is Russia with 23064 trillion cubic feet produced in 2007 The United States is the worlds second largest producer with 1908 trillion cubic feet of natural gas followed by Canada at 633 trillion Iran at 395 trillion cubic feet and Norway with 327 trillion cubic feet of production in 2007 Figure 10 shows the major producing nations in 2007 (EIA 2008 Gas Producing Nations)
Figure 10 Natural Gas Producing Nations
US Natural Gas Production
The first reliable statistics regarding natural gas production in the US begin in 1900 with 128 billion cubic feet of marketed production By 1910 production had risen to 509 billion cubic feet and by 1920 the value was 812 billion cubic feet annually There was a decline in US production between 1921 and 1922 with production falling to 674 billion in 1921 before recovering in 1923 By 1923 annual marketed production climbed above 1 trillion cubic feet to 123 trillion By 1930 production had climbed to almost 2 trillion cubic feet a year with declines between 1931-1933 related to the worldwide Great Depression
16
In 1934 production began climbing and by 1935 was just shy of the level reached in 1930 In 1936 marketed production exceeded 2 trillion cubic feet annually at 222 trillion cubic feet Production rose steadily throughout the 1940s-1960s and by 1970 had reached an annual production level of 2192 trillion cubic feet US natural gas production peaked in 1974 at 21600 trillion cubic feet of annual marketed production By 1980 production had declined to the level produced in 1969The lowest levels of US natural gas production occurred in 1983 with only 1688 trillion cubic feet of annual marketed production Levels recovered slightly and began to rise slowly between 1987 and 1999 reaching an annual production of 1980 trillion cubic feet in 1999 Production in the 2000s ranged between 1892 trillion cubic feet (2005) and 21442 trillion cubic feet in 2008 Figure 11 shows the US average annual marketed production by decade between 1900-2007 (EIA 2009 US Gas Production)
Figure 11 US Gas Production by Decade
New Mexico Gas Production
New Mexico produced 2793 billion cubic feet of natural gas in 1935 Production in New Mexico climbed steadily from 1935 to 1958 reaching 76144 billion cubic feet by 1958 There were small declines in 1959 and 1961 with production climbed between 1962 and 1968 with production rising above 1 trillion cubic feet annually 1969-1970 showed small declines as well but then there was steady growth in NM production between 1971 and 1974 By 1974 production was 1244 trillion cubic feet but then began a long decline By 1980 production had fallen to 114 trillion cubic feet and by 1988 production had fallen to below a trillion cubic feet per year at only 7026 billion cubic feet Production then began to rise in New Mexico and by 1991 production had again risen to above 1 trillion cubic feet annually Production levels generally increased in New Mexico between 1991 and 2007 with production ranging between 103 trillion and 1695 trillion cubic feet Figure 12 shows the NM production between 1935 and 2008 (API 1971 pp 102-107 EIA 2008 Historical NM Gas Production)
128000 300900 640200 1201400 20271593944829
9213623
16163329
2117252818148139
19348048
0
5000000
10000000
15000000
20000000
25000000
1900 1910 1920 1930 1940 1950 1960 1970 1980 1990 2000
Average Annual Natural Gas Production in the United States by Decade 1900-2000 (Million Cubic Feet)
Average US Production of Natural Gas
17
Figure 12 NM Gas Production
US Natural Gas Prices
This study uses the price of natural gas as reported by the Energy Information Administration Figure 13 provides both the Henry Hub price and the wellhead price for the US between 1929 and 2008 Henry Hub prices are only available beginning in 1990 In 1929 a thousand cubic feet of natural gas cost $084 in real (2008) US dollars Prices fell during the 1930s reaching a low of $047 per thousand cubic feet in 1947 By the 1950s prices began to rise reaching $076 per thousand cubic feet in 1959 Prices rose in the 1960s ranging from $078 to $089 per thousand cubic feet (real dollars) Prices fell between 1970 and 1972 falling to $077 per thousand cubic feet before beginning a sharp increase in prices beginning in 1974 A thousand cubic feet of natural gas cost $085 in 1973 and by 1974 the price had risen to $106 In 1975 the price was $142 and by 1976 the price had climbed to $177 per thousand cubic feet Prices continued to rise throughout the 1970s climbing to $292 per thousand cubic feet by the end of the decade Prices continued to rise sharply in the first half of the 1980s reaching a high of $486 per thousand cubic feet in 1983 Prices then began a long period of decline falling to a low of $249 per thousand cubic feet in 1998 Starting in 1999 prices began a general period of increase rising from $249 per thousand cubic feet in 1999 to $450 in 2000 and $478 in 2001 Prices declined briefly in 2002 before rising dramatically between 2003 and 2005 The price of a thousand cubic feet of natural gas rose to $794 in 2005 and then declined briefly in 2006-2007 before spiking to $807 per thousand cubic feet in 2008 Figure 13 shows the real price of natural gas per thousand cubic feet between 1929-2008 (EIA 2009 Henry Hub Spot Prices EIA 2009 Natural Gas Wellhead Prices BEA 2009 Implicit Price Deflators)
18
Figure 13 Natural Gas Prices
In 2008 and 2009 natural gas prices have been highly volatile (Figure 14) The Henry Hub price per mcf averaged $1307in August 2008 but had decreased to $599 in December 2008 In 2009 the Henry Hub price continued to decline averaging only $323 per mcf in August Natural gas price volatility has a major impact on state tax revenue in New Mexico
Figure 14 Henry Hub Spot Price
0020406080
100120140
2008
2008
2008
2008
2008
2008
2008
2008
2008
2008
2008
2008
2009
2009
2009
2009
2009
2009
2009
2009
Jan FebMarAprMayJun Jul AugSep OctNovDec Jan FebMarAprMayJun Jul Aug
Henry Hub Spot Price$ per MCF
Henry Hub Spot Price
19
New Mexico Natural Gas Prices
The price of natural gas produced in New Mexico is similar to the national history provided in the previous section For New Mexico the historic price series begins in 1967 with the real price of natural gas at the NM wellhead $067 per thousand cubic feet in real terms By 1977 the New Mexico wellhead price had risen to $232 per thousand cubic feet with 1974 being the first year the price rose above $100 per thousand cubic feet Between 1977-1983 prices rose from less than $250 per thousand cubic feet to more than $500 per thousand cubic feet before the price began to fall starting in 1984 By 1987 the price had dropped to $287 in real terms per thousand cubic feet and by 1991 the price had fallen to $199 per thousand cubic feet Prices ranged between $168 and $264 per thousand cubic feet between 1991 and 2000 Prices rose in 2000-2001 to $465 per thousand cubic feet in 2001 declined in 2002 to $315 and began rising in 2003 By 2005 the New Mexico wellhead price rose to $748 per thousand cubic feet The Price was slightly lower in 2006 at $648 and rose in 2007 to $703 per thousand cubic feet New Mexico wellhead price was unavailable for 2008 and 2009 at the time of report completion Figure 15 shows the real (2008 dollars) wellhead price for New Mexico and the US between 1967 and 2007 (EIA 2009 NM Natural Gas Prices BEA 2009 Implicit Price Deflators)
Figure 15 Natural Gas Prices USNM
Employment in the New Mexico Oil and Gas Industry
The oil and gas industry in New Mexico is an important source of employment and has contributed significant benefits to the state Figure 16 shows the employment in oil and gas extraction in New Mexico from 1969 to 2007 In 1969 there were a reported 9436 full and part time jobs in the oil and gas extraction industry in New Mexico By 1972 employment in the industry had fallen to 8417 full time jobs before employment recovered between 1973 and 1975 Employment rose between 1977 and 1981 reaching a peak of 18628 Employment in the industry began to fall and reached 13756 by 1989 Between 1989 and 2000 employment was relatively stable rising and falling in the range between 12657 and 15501 Between 2001 and 2007 employment in the sector was generally rising and by 2007 BEA reported 20003 jobs in oil and gas extraction and support activities (Bureau of Economic Analysis Table SA25) These employment values are based on US Bureau of Economic Analysis information found
20
in the State Annual reports (Series 25) which reports 4-Digit SIC codes from 1969-2000 and for 2001-2007 the data is based on NAICS codes
Figure 16 NM Employment Oil and Gas Extraction
In New Mexico the average wage for employment in New Mexico was $1803 per hour (2008) with an annual average wage of $37490 Derrick operators in the oil and gas industry had an average hourly rate of $2209 and an annual wage of $45950 Rotary drill operators for oil and gas had an average $2462 per hour with an average annual wage of $51220 Service Unit operators in the oil and gas industry had an average wage of $2289 and an annual wage of $47620 In 2008 there were 1360 derrick operators 840 rotary drill operators and 1520 service unit operators in New Mexico For these three occupations associated with oil and gas extraction an average of $177899200 in wages were generated in 2008 (Bureau of Labor Statistics 2009) Wages in the oil and gas sector are on average 22 higher than the average wage for New Mexico These jobs are also not associated with high levels of education and are an important source of well paying jobs in the rural and sparsely populated areas of the state
Rotary Drilling Rigs
As of 2008 there are 1879 rotary drilling rigs in the United States Three hundred and seventy nine of these rigs where dedicated to oil production while the remaining 1491 rigs were dedicated to gas production (EIA 2009) New Mexico rig counts have decreased by more than 50 between June 2008 and June 2009 (Table 1) The decrease in New Mexico rig counts closely follows the national pattern and reflects the dramatic decrease in oil and gas prices between June 2008 and June 2009 Rig counts are an important indicator of future production capacity but new wells in New Mexico represent only a tiny fraction of total operable wells
8000
10000
12000
14000
16000
18000
20000
22000
1969
1972
1975
1978
1981
1985
1989
1992
1995
1998
2001
3004
2007
Oil and Natural Gas Extraction Industry Employment in New Mexico 1969-2007
Total Employment
21
Table 1 Drilling Rig Count Data for New Mexico 2008-2009
Category June 2008 June 2009 Gas 41 16 Oil 38 19 Vertical 66 25 Directional 6 8 Horizontal 6 2 Depth lt 5000 feet 8 4 Depth 5000-10000 feet 43 22 Depth 10000-15000 feet 27 9 Depth 15000-20000 feet 1 0 Depth gt20000 feet 0 0
Total 78 35 Source Baker Hughes Inc State Energy Profiles US Energy Information Administration State Energy Profiles New Mexico September 3 2009 httptontoeiadoegovstatestate_energy_profilescfmsid=NM (accessed September 11 2009)
Refineries
In addition to the oil drilling and gas extraction industry in the state New Mexico has 3 refineries which convert extracted raw materials into end-use products Navajo Refinery in Artesia is a subsidiary of Holly Corporation In addition to Navajo Refinery in Artesia Western Refining Southwestern has two refineries one Bloomfield NM and the other in Gallup NM According to the EIArsquos US Ranking of US Refineries the Navajo Refinery is ranked number 66 out of the 150 US operable capacity refineries Navajo Refinery is the 70th largest refinery in the US Refining capacity at the Navajo Refinery is currently at 95000 barrels of crude oil per day The Western Refining Southwestern in Gallup is ranked number 118 with an operable capacity of 20800 barrels per day The Western Refining Southwestern in Bloomfield is ranked 121 with an operable capacity of 16800 barrels per day (EIA 2008 Basic Petroleum Statistics Ranking US Refineries) The economic impact of refineries will be discussed in a separate report
Number of Wells
The number of wells operating in the state has steadily increased over the last decade In 2006 there were 51658 oil and gas wells operating in the state In 2006 the majority of these wells were devoted to gas 36202 while 15456 were oil producing wells In 2008 the number of producing oil wells was 20609 a substantial increase from the 2006 number The 2007 figure was not disclosed by EIA In 2007 the number of producing natural gas wells was 42644 also a large increase from the 2006 number The 2008 value was not disclosed by EIA (EIA 2008 Oil and Gas Wells)
22
Number of Operators
There are approximately 265 operators in New Mexicorsquos oil and gas industry (NMEMNRD 2009) These operations include petroleum and gas production drilling and service companies While scattered across the country the majority of these firms are headquartered in New Mexico and Southwest Texas mainly in the counties encompassing the Permian and San Juan production basins
Economic Impact of the Oil and Gas Industry in New Mexico
This section provides estimates of the economic impact of oil and gas extraction industries in New Mexico during calendar year 2008 Impact estimates are provided for both employment and labor income A separate section contains estimates of the fiscal impacts of oil and gas extraction in New Mexico Direct indirect induced and total impact effects are presented for both employment and labor income Direct effects are the result of changes in the industries to which a final demand change was made Indirect effects are the changes in inter-industry purchases as they respond to the new demands of the directly affected industries Induced effects typically reflect changes in spending from households as income increases or decreases due to the changes in production The total effect is simply the sum of the direct indirect and induced effects
The impacts were calculated using IMPLAN PRO version 20 software IMPLAN (Pro Version 20) is economic modeling software developed by the Minnesota IMPLAN Group (httpimplancom) to conduct economic impact analysis The IMPLAN model is based on the national input-output model produced by the US Department of Commerce Bureau of Economic Analysis Models for local areas (states and counties) are customized versions of the national model using commonly accepted techniques of regional analysis The models are often used to evaluate changes in energy demands new projects (eg construction) or the establishment of a new firm in a local area The IMPLAN models were originally developed for the US Forest Service in the late 1970s and early 1980s The current vendor (MIG Inc) was a technology transfer product of the original Forest Service work Additional information on the IMPLAN modeling approach can be found in Peach and Starbuck 2009
Energy prices in 2008 were highly volatile In 2008 the marketed value of New Mexico oil and natural gas production reported to the New Mexico Taxation and Revenue Department was $191 billion (Table 1) Natural gas accounted for slightly more than two-thirds (671 percent) of total market value New Mexico was the fourth largest producer of marketed natural gas in the US and accounted for 69 percent of total production (EIA 2009 Natural Gas Withdrawals and Production)
New Mexicorsquos 622 million barrels of oil production in 2008 accounted for 34 percent of total US production and the state ranked sixth among oil producing states (Table 2 and EIA 2009 Crude Oil Production) 1
1 The New Mexico crude oil production figure of 622 million barrels is from the New Mexico Taxation and Revenue Department (NMTRD) (See Table 2) and differs from the EIA figure of 594 million barrels The NMTRD figure is used for consistency with reported fiscal impacts and makes little difference in terms of the NM percent of national production
New Mexicorsquos oil and gas production during the last two years has not been highly
23
sensitive to price changes As shown in Table 2 the average price received for New Mexico oil increased nearly fifty percent (485 percent) between 2007 and 2008 while production increased by only 33 percent ndashfrom 60198 thousand barrels to 62214 thousand barrels During the same period natural gas prices increased by 301 percent (from $701 to $912) while natural gas production declined slightly from 1464 trillion cubic feet to 1403 trillion cubic feet
Table 2 New Mexico Oil and Gas Production Price and Market Value 2007 and 2008
New Mexico Oil and Natural Gas Production Price and Market Value 2007 and 2008
Oil Quantity Units
2007 Volume 60198 1000s of barrels 2008 Volume 62214 1000s of barrels 2007 Price $6781 $ per barrel 2008 price $10071 $ per barrel
Natural Gas Quantity Units
2007 Volume 1464 Trillion Cubic Feet 2008 Volume 1403 Trillion Cubic Feet 2007 Price $701 $ per 1000 Cubic Feet 2008 price $912 $ per 1000 Cubic Feet
Market Value Quantity Units
2007 Oil $408180 Millions of $ 2007 Natural Gas $1027580 Millions of $ 2007 Oil and Natural Gas $1435760 Millions of $ 2008 Oil $626570 Millions of $ 2008 Natural Gas $1280350 Millions of $ 2008 Oil and Natural Gas $1906920 Millions of $
Source New Mexico Department of Taxation and Revenue ONGARD System Downloaded August 1 2009
While prices received for New Mexico oil and natural gas increased substantially between 2007 and 2008 employment in oil and gas extraction industries increased by only 54 percent While prices have been highly volatile employment and activity in the sector has been relatively stable Table 3 provides the employment values for the three sectors of the oil and gas industry (oil and gas extraction drilling oil and gas wells and support activities for oil and gas extraction) As can be seen in Table 3 the support activities for oil and gas extraction comprise the largest portion of employment related to the oil and gas industry in New Mexico
24
Table 3 Employment in New Mexicos Oil and Gas Industry 2007 and 2008
Employment in New Mexicorsquos Oil and Gas Industry 2007 and 2008
NAICS CODE 2007 2008
Oil and gas extraction 21111 3864 4310 Drilling oil and gas wells 213111 2526 2664 Support Activities for Oil and Gas Extraction 213112 8703 8930
Total Oil and Gas Employment 15093 15904
Source US Bureau of Labor Statics Quarterly Census of Employment and Wages
Estimates of the output value added employment and labor income impacts of oil and gas extraction in New Mexico in 2008 are presented in Table 3 and Table 4 The direct employment figure in Table 4 is the 2008 total for oil and gas extraction oil and gas wells and support activities for oil and gas from the Bureau of Labor Statistics and presented earlier in Table 3 Direct employment generates $12 billion in labor income or $77653 per job The indirect and induced employment impacts are estimates calculated using IMPLAN software The total employment impact is 41718 jobs ndash 51 percent of New Mexicorsquos total private sector employment in 2008
Table 4 Employment and Labor Income Impacts of New Mexico Oil and Gas Activities
2008 New Mexico Economic Impacts of Oil and Gas Extraction Drilling and Support Activities
Direct Indirect Induced Total
Output $19069 $2071 $1218 $22359 Value Added $10289 $984 $671 $11944 Employment (jobs) 15904 14178 11636 41718 Labor Income $1235 $655 $366 $2256 Labor income per job $77653 $49148 $31454 $54077
Millions of 2008 Dollars
Source Author Calculations using IMPLAN Pro Version 20
Table 5 provides the detailed employment impacts associated with the total production value of oil and natural gas extraction in New Mexico using the same direct employment impact as above
25
Table 5 Detailed Employment Impacts from the Oil and Gas Industry in New Mexico
Detailed 2008 Employment Impact of Oil and Gas Extraction Drilling and Support Activities in New Mexico by Industry Sector(100 Largest Total Employment Impacts)
Rank Industry Sector Direct Indirect Induced Total
1 29 Support activities for oil and gas 8930 346 3 9279
2 20 Extraction of oil and gas 4310 212 50 4572
3 28 Drilling oil and gas wells 2664 0 0 2664
4 39 Maint amp repair construct of nonresident struc 0 1676 85 1762
5 413 Food services and drinking places 0 478 1249 1727
6 369 Architectural- engineering- and related servi 0 1512 35 1546
7 360 Real estate establishments 0 704 624 1328
8 319 Wholesale trade businesses 0 769 402 1171
9 381 Management of companies and enterprises 0 855 50 905
10 382 Employment services 0 537 208 746
11 335 Transport by truck 0 540 116 656
12 354 Monetary authorities and depository credit in 0 465 180 645
13 394 Offices of physicians- dentists- and other he 0 0 638 638
14 367 Legal services 0 483 125 608
15 356 Securities- commodity contracts- investments- 0 457 114 571
16 397 Private hospitals 0 0 484 484
17 329 Retail Stores - General merchandise 0 47 388 435
18 388 Services to buildings and dwellings 0 289 109 398
19 324 Retail Stores - Food and beverage 0 41 339 380
20 425 Civic- social- professional- and similar orga 0 220 159 378
21 426 Private household operations 0 0 368 368
22 368 Accounting- tax preparation- bookkeeping- and 0 297 70 366
23 411 Hotels and motels- including casino hotels 0 201 121 322
24 320 Retail Stores - Motor vehicle and parts 0 41 281 321
25 398 Nursing and residential care facilities 0 0 315 315
26 331 Retail Nonstores - Direct and electronic sale 0 30 263 293
27 386 Business support services 0 231 51 283
28 400 Individual and family services 0 0 259 259
29 376 Scientific research and development services 0 232 25 257
30 395 Home health care services 0 0 255 255
31 365 Commercial and industrial machinery and equip 0 226 5 232
32 327 Retail Stores - Clothing and clothing accesso 0 21 209 229
33 414 Automotive repair and maintenance- except car 0 98 131 229
34 374 Management- scientific- and technical consult 0 192 37 228
35 323 Retail Stores - Building material and garden 0 19 173 191
36 399 Child day care services 0 0 180 180
37 403 Spectator sports companies 0 88 90 177
38 351 Telecommunications 0 92 80 172
26
39 432 Other state and local government enterprises 0 84 86 170
40 330 Retail Stores - Miscellaneous 0 19 145 165
41 355 Nondepository credit intermediation and relat 0 87 77 163
42 31 Electric power generation- transmission- and 0 105 52 157
43 371 Custom computer programming services 0 152 5 157
44 387 Investigation and security services 0 127 29 155
45 326 Retail Stores - Gasoline stations 0 14 141 155
46 325 Retail Stores - Health and personal care 0 17 135 153
47 396 Medical and diagnostic labs and outpatient an 0 0 147 147
48 409 Amusement parks- arcades- and gambling indust 0 0 134 135
49 357 Insurance carriers 0 39 89 129
50 328 Retail Stores - Sporting goods- hobby- book a 0 16 110 126
51 427 US Postal Service 0 72 53 125
52 393 Other private educational services 0 4 116 120
53 391 Private elementary and secondary schools 0 0 117 117
54 419 Personal care services 0 0 111 111
55 401 Community food- housing- and other relief ser 0 0 106 106
56 380 All other miscellaneous professional- scienti 0 89 16 105
57 321 Retail Stores - Furniture and home furnishing 0 24 78 102
58 336 Transit and ground passenger transportation 0 45 56 102
59 402 Performing arts companies 0 26 72 98
60 375 Environmental and other technical consulting 0 76 13 89
61 377 Advertising and related services 0 63 25 89
62 407 Fitness and recreational sports centers 0 29 60 88
63 10 All other crop farming 0 83 4 87
64 322 Retail Stores - Electronics and appliances 0 13 74 87
65 339 Couriers and messengers 0 58 27 85
66 372 Computer systems design services 0 73 11 84
67 341 Newspaper publishers 0 56 27 84
68 384 Office administrative services 0 60 23 83
69 410 Other amusement and recreation industries 0 23 56 80
70 392 Private junior colleges- colleges- universiti 0 1 78 80
71 19 Support activities for agriculture and forest 0 61 16 77
72 424 Grantmaking- giving- and social advocacy orga 0 0 75 75
73 390 Waste management and remediation services 0 51 23 74
74 333 Transport by rail 0 65 7 72
75 421 Dry-cleaning and laundry services 0 10 61 71
76 404 Promoters of performing arts and sports and 0 22 46 68
77 429 Other Federal Government enterprises 0 22 46 68
78 348 Radio and television broadcasting 0 45 20 65
79 366 Lessors of nonfinancial intangible assets 0 59 1 61
80 416 Electronic and precision equipment repair and 0 51 9 60
81 346 Motion picture and video industries 0 14 45 60
27
82 362 Automotive equipment rental and leasing 0 43 17 59
83 417 Commercial and industrial machinery and equip 0 44 14 59
84 422 Other personal services 0 4 49 53
85 338 Scenic and sightseeing transportation and sup 0 38 15 53
86 389 Other support services 0 36 16 52
87 118 Petroleum lubricating oil and grease manufact 0 47 1 48
88 206 Mining and oil and gas field machinery manufa 0 47 0 47
89 358 Insurance agencies- brokerages- and related a 0 16 29 45
90 430 Not unique commod (SampLG passenger transit) 0 20 25 44
91 32 Natural gas distribution 0 37 6 43
92 418 Personal and household goods repair and maint 0 27 15 41
93 383 Travel arrangement and reservation services 0 36 5 41
94 405 Independent artists- writers- and performers 0 23 18 40
95 363 General and consumer goods rental except vide 0 17 22 39
96 340 Warehousing and storage 0 20 19 39
97 195 Machine shops 0 34 1 35
98 415 Car washes 0 6 28 33
99 373 Other computer related services- including fa 0 28 5 33
100 370 Specialized design services 0 26 7 33
Sub Total (Industries Shown) 15904 13798 11181 40484
Grand Total (including industries not Shown) 15904 14178 11636 41718
Source Author Calculations using IMPLAN Pro Version 20
Tax Impacts of Oil and Gas Extraction in New Mexico
In addition to the labor income and employment impacts described above the oil and gas industry provides a critical source of revenue for the state Revenue from the industry is used to fund schools and hospitals throughout the state Table 6 provides a summary of the source and distribution of tax revenues royalties and interest earnings generated by the oil and gas industry in New Mexico The key revenue sources are the Oil and Gas Emergency School Tax Federal Mineral Leasing royalties and earnings on the Land Grant Permanent Fund and Severance Tax Permanent Fund Direct taxes on oil and gas also benefit the energy producing counties of Chaves Colfax Eddy Harding Lea McKinley Quay Rio Arriba Roosevelt Sandoval San Juan and Union (See Figure 1 and Table 6)
28
Table 6 Distribution of Oil and Gas Tax Revenues
Description of Distribution and Source of Oil and Gas Tax Revenues in New Mexico
Revenue Source Description Distribution Oil and Gas Emergency School Tax
Severance tax on oil gas helium carbon dioxide and other hydrocarbons
General Fund
Federal Mineral Leasing Money passed through to state from oil and gas extraction on Federal Land
General Fund
Land Grant Permanent Fund Royalties from mining and other activity on state trust land set aside at Statehood
State Investment Council invests funds Distributed to 21 trust land beneficiaries (public schools and hospitals) receive payments from the land use
Severance Tax Permanent Fund
Funded by taxes on extraction of oil and gas and small amounts of other minerals
Revenue is used to retire debt for government projects Half of the available revenue can be used for debt service on one-time spending for projects 45 can be spent on public school infrastructure
Direct Taxes on Oil and Gas Property Taxes Chaves Colfax Eddy Harding Lea McKinley Quay Rio Arriba Roosevelt Sandoval San Juan and Union Counties
Direct Taxes on Oil and Gas Property Taxes
Permanent and Land Grant Fund
One of the largest educational endowments in the world
$14 billion
Source NM Legislative Finance Committee Finance Facts Understanding State Financial Policy October 2008 Available at httplegisstatenmuslcslfclfcdocsfinance20facts20oil20and20gaspdf Accessed on August 2 2009
Table 7 provides the FY2008 distributions from the Land Grant Permanent Fund as reported by the New Mexico State Land Office Public schools throughout the state receive the majority of the funds (83) with more than $390 million contributed to the states public schools The remaining funds were distributed to the States universities specialized schools and hospitals
29
Table 7 Distributions from the Land Grant Permanent Fund
FY2008 Distributions from the Land Grant Permanent Fund
Beneficiary Permanent Fund Distribution
Public Schools 390483778 University of NM 7669251 UNM Saline Lands 30892 NM State University 2304928 Western NM University 134563 NM Highlands University 133665 Northern NM College 100771 Eastern NM University 423933
NM Institute of Mining and Technology 941740 NM Military Institute 16223003
School for the Blind and Visually Impaired 9690891 NM School for the Deaf 9718613 NM Boys School (CYFD) 31993 Miners Colfax Medical Center 5095214 Las Vegas Medical Center 1145646 Penitentiary of NM 9387741 Charitable Penal and Reform 4300682 Water Reservoirs 5331347 Rio Grande Improvements 1375646 Public Buildings 5473966
Total Distributions in FY08 469998263
Note The Resource Excise Tax Federal Mineral Leasing and Severance Tax Permanent Fund values include a small amount of revenue from coal and other minerals extracted in New Mexico An estimated value of 60 of the total Oil and Gas Contribution is deducted for these other minerals The State Land Office is responsible for reporting the rental and royalty payments for state lands used for resource extraction According to the FY2008 State Land Office Annual Report Oil and Gas accounted for 94 of the value of revenues for the Land Grant Permanent Fund Available at httpwwwnmstatelandsorguploadsARAR202008_webpdf Accessed on August 8 2009
New Mexico Tax Revenue from Oil and Gas Extraction
The oil and gas industry in New Mexico provides substantial revenue to the state According to the most recent ldquoConsensus Revenue Estimatesrdquo (August 14 2009) the oil and gas industry in New Mexico is expected to be responsible for 258 percent of FY 2009 General Fund Revenues The percentage of General Fund Revenues accounted for by the oil and gas industry is expected to decline from FY 2010 to FY 2014 due to falling projections of production and price variability
30
Direct revenues for Fiscal Years 2006 through 2008 are reported in Table 8 Final figures for FY 2009 (July 1 2008 through June 30 2009) have not yet been published but estimated oil and gas tax revenues are presented for FY 2009 For consistency with the impact analysis presented above FY2008 and FY2009 tax revenues have been averaged to produce an estimate for calendar year 2008 These figures will be updated and a revised report released as soon as possible
As can be seen in Table 8 the largest sources of oil and gas revenue are from Federal Minerals Leasing ($5642 million in FY 2008) the Oil and Gas School tax ($5578 million in FY 2008) and State Land Office Royalties ($4599 million in FY 2008)
Table 8 Oil and Gas Contributions to General Fund
Oil and Gas Contributions to the New Mexico General Fund 2006-2008 (Millions of Dollars)
State General Fund FY 2006 FY 2007 FY 2008 FY2009 CY 2008
Oil amp Gas Emergency School Tax 4832 4318 5577 370 4639 OampG Conservation Tax 226 195 271 184 228 Natural Gas Processors Tax 268 356 306 402 354 Federal Minerals leasing 5565 501 5642 507 5356 State Land Office 527 504 461 364 413
Total General Fund 114180 103830 122570 972 109890
Severance Tax Permanent Fund 1718 1709 1772 1913 1843 State Land Office Royalties 4053 3905 4599 4332 4466
Total State Revenues 171890 159970 186280 159650 172970
Estimated from New Mexico Consensus Revenue Forecasts August 14 2009 Average of Fiscal Years 2008 and 2009
Source New Mexico State Board of Finance General Revenue Estimates Fiscal Years 2006 through 2008
The Oil and Gas Emergency School Tax places a nominal tax rate on oil at 315 percent and natural gas at 40 percent The Oil and Gas Severance tax is 375 percent on both oil and gas The Conservation Tax is 019 percent for both oil and gas In addition ad valorem taxes are imposed in lieu of property taxes on reserves and lease equipment The ad valorem rates vary by locality and are not reported here
In addition to taxes paid by the oil and gas industry as previously described it is possible to provide rough estimates of indirect taxes paid by the oil and gas industry in the state Oil and gas extraction generates income for workers both directly and indirectly The estimated labor income in 2008 from direct indirect and induced employment due to oil and gas extraction in the state was $2256 billion Labor income includes proprietorrsquos income plus wages and salaries This income is also taxed From previous studies (Peach and Popp 2008 Film Study Peach and Starbuck 2009 Coal Study) estimates of effective tax rates as a percent of income were found to be reasonably stable between 2001 and 2007 Those effective tax rates are used here to estimate additional New Mexico tax revenue due to oil and gas extraction for the three taxes that provide nearly 80 percent of non-mineral tax revenue The Gross
31
Receipts Tax (GRT) the Personal Income Tax (PIT) and the Corporate Income Tax (CIT) accounted for 7896 percent of tax revenue between 2000 and 2007 (Peach and Popp 2008) Table 9 below contains estimates of these additional taxes Labor income and taxes are measured in millions of 2008 dollars The additional taxes estimated below totaled $1919 million in 2008 or approximately 33 percent of estimated FY 2009 revenue It should be noted that approximately 40 of GRT is given to municipalities and counties
Table 9 Indirect Taxes Derived from Oil and Gas Production in New Mexico
Indirect Taxes from the Oil and Gas Industry in New Mexico
Tax Tax Rate Labor Income Estimated Taxes
GRT 00538 $225600 $12140 PIT 00257 $225600 $5790 CIT 00056 $225600 $1260
Total 01083 $22560 $19190
Source Author Calculations on effective tax rates and IMPLAN impact results
Limitations of the Analysis
This analysis reports the impact of the market value of oil and gas production on employment and labor income in the state of New Mexico The labor income impact value is used to derive the indirect tax benefits that accrue to the State from annual oil and gas production This analysis does not examine the role of energy in the New Mexico economy or the environmental impacts associated with production This analysis does not address any regulatory issues or effects of changing regulation on future production
Summary and Conclusions
The oil and gas sector provides important economic benefits for New Mexicans In addition to providing domestic sources of energy the extraction and use of these resources creates significant economic activity More than 15000 were directly employed in the industry in 2008 (5 of New Mexico employment) and a market value of more than $19 billion the oil and gas industry is an important part of the New Mexican economy The industry generated an estimated total employment impact of more than 41000 jobs generated more than $12 billion in direct tax and royalty payments to the State General Fund in 2008 An additional $567 million in revenue was generated by the Permanent Funds associated with the oil and gas industry
Maintaining a healthy fossil fuel energy sector in the state is a critical bridge to the future energy portfolio that is required in a carbon-constrained world New Mexico provides an important source of domestic energy and this fossil energy production helps provide needed employment tax revenues and economic activity to the state
32
Works Cited
Adelman Morris Albert 1995 The Genie Out of the Bottle World Oil Since 1970 MIT Press Cambridge MA USA ISBN 0-262-01151-4 American Petroleum Institute (API) 1959 Petroleum Facts and Figures 1961 edition New York NY Crude Oil Production By States Pp34 American Petroleum Institute (API) 1959 Petroleum Facts and Figures Centennial Edition New York NY Crude Oil Production By States Pp 40-41 American Petroleum Institute (API) 1971 Petroleum Facts and Figures 1971 edition World Crude Oil Production By Countries Baltimore Maryland Pp 556-557 American Petroleum Institute (API) 1971 Petroleum Facts and Figures 1971 edition Gross and Marketed Production of Natural Gas By States Baltimore Maryland Pp 102-107 Berger BD and Anderson KE 1978 Modern Petroleum A Basic Primer of the Industry Petroleum Publishing Co Tulsa OK Hager D 1939 Fundamentals of the Petroleum Industry McGraw-Hill Book Company International Energy Agency (IEA) 2009 Petroleum Products httpwwwieaorgTextbasestatsdefssourcespetrolhtm Accessed July 26 2009 Lillywhite Jay and C Meghan Starbuck 2008 Economic Impacts of Oil and Gas Production in New Mexico Report Completed for Brothers and Co Maugeri Leonardo 2006 The Age of Oil The Mythology History and Future of the Worlds Most Controversial Resource Praeger Publishers Westport CT USA ISBN0-275-99008-7
New Mexico Department of Finance and Administration General Fund Revenue Estimates for FY 2007 FY2008 and FY2009 httpboardnmdfastatenmuscmskundertsboardnmdfastatenmusdocs193508769-12-13-2007-14-56-49pdf httpboardnmdfastatenmuscontentaspCustComKey=294288ampCategoryKey=294649amppn=PageampDomName=boardnmdfastatenmus Accessed August 2 2009
New Mexico Energy Minerals and Natural Resources Department (Oil conservation Division) 2009 Useful Information Operators httpwwwemnrdstatenmusOCDStatisticshtm Accessed September 11 2009
33
New Mexico Legislative Finance Committee Finance Facts Understanding State Financial Policy October 2008 Available at httplegisstatenmuslcslfclfcdocsfinance20facts20oil20and20gaspdf Accessed on August 2 2009
New Mexico State Land Office 2009 FY2008 State Land Office Annual Report httpwwwnmstatelandsorguploadsARAR202008_webpdf Accessed on August 8 2009
Organization of the Petroleum Exporting Countries (OPEC) 2009 OPEC FAQs on Oil httpwwwopecorglibraryFAQsCrudeOilq4htm Accessed July 26 2009 Parra Francisco 2004 Oil Politics A Modern History of Petroleum Palgrave Macmillan New York New York ISBN 1 86064 977 7 Peach James and C Meghan Starbuck 2009 The Economic Impact of Coal Mining in New Mexico Report completed for US Department of Energy National Energy Technology Laboratory Peach James 2009 US Real GDP per Capita 1900-2008 Available from Author Upon Request Solber C 1976 Oil Power MasonCharter Starbuck Alexander History of the American Whale Fishery From its Earliest Inception to the Year 1876 Digitized by Google Books as part of an archival project Available at wwwbooksgooglecom Accessed on July 13 2009 US Census Bureau 2009 Quick Facts httpquickfactscensusgovqfdstates35000html Accessed July 21 2009 US Census Bureau 2009 Table DP-3 Census 2000 SF3 Sample Data httpfactfindercensusgovservletQTTable_bmnamp_langenampqr_nameDEC_2000_SF3_U_DP3ampds_nameDEC_2000_SF3_Uampgeo_id04000US35 Accessed July 27 2009 US Census Bureau Population Housing Units Area and Density 2000 Census Summary File 1 (SF1) httpfactfindercensusgovservletGCTTable_bmyamp-ds_nameDEC_2000_SF1_Uamp-CONTEXTgctamp-mt_nameDEC_2000_SF1_U_GCTPH1_US9amp-redoLogfalseamp-_callergeoselectamp-geo_idamp-formatUS-25|US-25Samp-_langen Accessed July 26 2009 US Department of Commerce Bureau of Economic Analysis (BEA) 2009 National Economic Accounts Gross Domestic Product Interactive Tables Table 119 Implicit Price Deflators for Gross Domestic Product httpwwwbeagovnationalnipawebTableViewaspSelectedTable=13ampViewSeries=NOampJava=noampRequest3Place=Namp3Place=NampFromView=YESampFreq=YearampFirstYear=1929ampLastYear=2008amp3Place=NampAllYearsChk=YESampUpdate=UpdateampJavaBox=noMid Accessed on June 11 2009 US Department of Commerce Bureau of Economic Analysis 2009 Regional Economic Information System Table SA25 Total full-time and part-time employment by SIC industry httpwwwbeagovregionalspidefaultcfmselTable=SA25N Accessed on June 25 2009
34
US Department of Energy Energy Information Administration (EIA) World Regions Production httptontoeiadoegovcountryindexcfm Accessed on June 6 2004 US Department of Energy Energy Information Administration (EIA) Office of Energy Markets and End Use International Statistics Team 2008 International Supply Tables httpwwweiadoegovemeuinternationalRecentTotalOilSupplyBarrelsperDayxls Accessed on July02 2009 US Department of Energy Energy Information Administration (EIA) Office of Energy Markets and End Use International Statistics Team 2008 International Gas Production httptontoeiadoegovcfappsipdbprojectiedindex3cfmtid=3amppid=26ampaid=1ampcid=ampsyid=2004ampeyid=2008ampunit=BCF Access on July02 2009 US Department of Energy Energy Information Administration (EIA) Office of Energy Markets and End Use International Statistics Team 2008 Gas Producing Nations httptontoeiadoegovcfappsipdbprojectiedindex3cfmtid=3amppid=26ampaid=1ampcid=allampsyid=1980ampeyid=2008ampunit=BCF Access on July02 2009 US Department of Energy Energy Information Administration (EIA) 2009 Historical NM Production httptontoeiadoegovdnavpethistmcrfpnm1ahtm Accessed on July02 2009 US Department of Energy Energy Information Administration (EIA) 2009 Petroleum Prices httptontoeiadoegovdnavpetpet_pri_dfp1_k_ahtm Accessed June 11 2009 US Department of Energy Energy Information Administration (EIA) 2008 US Oil Production httptontoeiadoegovdnavpethistmcrfpus1ahtm Accessed on June 22 2009 US Department of Energy Energy Information Administration (EIA) 2008 State Energy Profiles httptontoeiadoegovstatestate_energy_profilescfmsidNM Accessed July 26 2009 US Department of Energy Energy Information Administration (EIA) 2009 Historical NM Natural Gas Prices httptontoeiadoegovdnavnghist_xlsN9050NM2axls Accessed June 24 2009 US Department of Energy Energy Information Administration (EIA) 2009 Uses of Petroleum httptontoeiadoegovdnavngng_pri_sum_a_epg0_fwa_dmcf_ahtm Accessed on June 11 2009 US Department of Energy Energy Information Administration (EIA) 2009 NM Production httpwwweiadoegovemeustatessep_prodP6P6_nmxls Accessed on July02 2009 Accessed on July 8 2009 US Department of Energy Energy Information Administration (EIA) 2009 Historical Prices Oil httptontoeiadoegovdnavpethist_xlsRWTCaxls US Department of Energy Energy Information Administration (EIA) 2009 Historical NM Gas Production httptontoeiadoegovdnavnghist_xlsN9050NM2axls Accessed on June 24 2009 US Department of Energy Energy Information Administration (EIA) 2009 Henry Hub Spot Prices httptontoeiadoegovcfappsSTEO_QuerysteotablescfmtableNumber=8ampperiodType=Annualampsta
35
rtYear=1990ampendYear=2008ampstartMonthChanged=falseampstartQuarterChanged=falseampendMonthChanged=falseampendQuarterChanged=falseampnoScroll=falseamploadAction=Apply+Changes Accessed on July 8 2009 US Department of Energy Energy Information Administration (EIA) 2009 Natural Gas Wellhead Prices httptontoeiadoegovdnavngng_pri_sum_a_epg0_fwa_dmcf_ahtm Accessed June 11 2009 US Department of Energy Energy Information Administration (EIA) 2009 NM Natural Gas Prices httptontoeiadoegovdnavngng_pri_sum_a_epg0_fwa_dmcf_ahtm Accessed June 11 2009 US Department of Energy Energy Information Administration (EIA) 2008 Annual Energy Review (AER) 2008 Natural Gas Flow 2008 (Diagram) httpwwweiadoegovemeuaerdiagram3html Accessed July 27 2009 US Department of Energy Energy Information Administration (EIA) 2009 Petroleum Products httpwwweiadoegovneicinfosheetspetroleumproductshtml Accessed July 16 2009 US Department of Energy Energy Information Administration (EIA) 2009 ldquoNatural Gas Withdrawals and Productionrdquo httptontoeiadoegovdnavngng_prod_sum_a_EPG0_VGM_mmcf_ahtm Accessed September 11 2009
US Department of Energy Energy Information Administration (EIA) 2009 ldquoCrude Oil Productionrdquo httptontoeiadoegovdnavpetpet_crd_crpdn_adc_mbbl_ahtm Accessed September 11 2009
US Department of Energy Energy Information Administration (EIA) 2009 State Energy Profiles New Mexico httptontoeiadoegovstatestate_energy_profilescfmsid=NM Accessed September 11 2009
US Department of Energy Information Administration (EIA) 2009ldquo Short Term Energy Outlook Sept 9 2009rdquo httptontoeiadoegovcfappsSTEO_QuerysteotablescfmtableNumber=16 Accessed September 22 2009
US Department of Energy Energy Information Administration (EIA) 2008 Basic Petroleum Statistics Ranking US Refineries httpwwweiadoegovneicrankingsrefinerieshtm Accessed September 11 2009
US Department of Energy Energy Information Administration (EIA) 2008 Oil and Gas Wells httptontoeiadoegovstateSEP_MoreReservescfm Accessed September 11 2009
US Department of Energy 1984 Twentieth Century Petroleum Statistics 40th edition World Crude Production Degolyer and Macnaughton Dallas TX Pp 4 US Department of Energy 1984 Twentieth Century Petroleum Statistics 40th edition Posted Price of Petroleum at Wells Degolyer and Macnaughton Dallas TX Pp 100
36
US Department of Energy Energy Information Administration (EIA) 2009 US Gas Production httpusasearchgovsearchv3aproject=firstgovampv3afile=viv_111940313aUETrHnampv3astate=root7crootampopener=full-windowampurl=http3a2f2ftontoeiadoegov2fdnav2fng2fhist_xls2fN9050US2axlsamprid=Ndoc0ampv3aframe=redirectamprsource=firstgov-msnampv3astate=28root297crootamprrank=0amph=25990c058b7f28377386fcc07f447d7camp Accessed June 22 2009 US Department of Labor Bureau of Labor Statistics Occupational Employment Statistics httpdatablsgovoesoccupationdo Accessed on July 26 2009 US Federal Reserve 2009 Economic Research Federal Bank of St Louis httpresearchstlouisfedorgfred2seriesOILPRICE Accessed on July 8 2009 Venn F Oil Diplomacy in the 20th Century 1986 Palgrave Macmillan Williamson HF A Daum RL Andreano 1959 The American Petroleum Industry The Age of Illumination 1859-1899
37
Acknowledgements
The authors would like to thank Hector Aguirre for his diligent efforts and assistance in the preparation of this report The authors would also like to thank Dr Anthony Popp and Dr Richard Adkission for their consultation on technical aspects of this report
38
Appendix A Data Sources and Issues
Sources
New Mexico Oil and Gas production and value (price) data were compiled from three different sources Oil production data is available from various sources The following three sources were used for this report 1 Petroleum Facts and Figures published by The American Petroleum Institute 2 Twentieth Century Petroleum Statistics 40th edition November 1984 Published by Degolyer and Macnaughton 3 Department of Energy Energy Information Administration wwweiagov 4 Energy Information Administration Short Term Energy Outlook Sept 9 2009 httptontoeiadoegovcfappsSTEO_QuerysteotablescfmtableNumber=16 5 Economic Research Federal Bank of St Louis httpresearchstlouisfedorgfred2seriesOILPRICE
Oil Data Issues
One of the issues was not the data availability but collecting the entire data set from one source Many of the sources did not have a complete set of data for all years considered For example Table B1 displays World Oil Production data from 1857-2008 No one source had all of the production data for all of the years The data was compiled from the three sources The years 1857-1917 (Petroleum Facts and Figures Centennial Edition 1971) years 1918-1983 (Twentieth Century Petroleum Statistics 40th edition) years 1984-2006 (Twentieth Century Petroleum Statistics 63rd edition) and lastly the years 2007-2008 (Energy Information Administration 2009) The data overlapped over these periods of time which allowed insuring the data was both consistent and accurate This can also be seen in Table B4 which displays New Mexico Crude Oil production for the years 1924-2008 A second issue was establishing which price reference to use The West Texas Intermediate (WTI) price was used and data collected from the three sources for the Years 1926 - 1972 (Twentieth Century Petroleum Statistics 40th edition) years 1973-1985 from the Economic Research Federal Bank of St Louis and lastly the years 1985-2008 from the United States Department of Energy Energy Information Administration (EIA) The WTI price has been a standard reference in New Mexico for setting the price of for many years Wellhead Price was also used this information was retrieved from the EIA This information is illustrated in Table B7 Table B8 illustrates the Real Crude Prices (2008 Dollars) in the United States by Type of Oil The 2008 implicit price deflator for GDP from the Bureau of Economic Analysis National Income and Product Accounts was used to adjust the nominal prices to real prices in 2000 dollars (Conversion factor = 22422 wwwbeagov)
39
Natural Gas Data Issues
Table B11 illustrates clearly the first issue encountered when researching World Natural gas production data The data is not available prior to 1980 from EIA This is because Natural Gas data was not gathered systematically worldwide until after the 1970s However in the US and in New Mexico Natural Gas production data is readily available beginning in the early 1900s Table B13 illustrates Natural Gas production by decade for the nation and Table B14 illustrates Natural Gas production for New Mexico from 1935-2008 Gathering data from the early 1900s for New Mexico presented the same issue as with the oil data Table B14 is composed of data from two sources as on source did not have all of the data Table B14 is broken down as follows 1935-1968 (Petroleum Facts and Figures 1971 Edition) and the years 1969-2008 (Energy Information Administration 2009) There was an overlap in-between the time periods which allowed for the conformation of data accuracy and consistency Data was collected from two sources for Natural Gas pricing the Henry Hub Spot price and Natural Gas Wellhead price Both sets of data are available from EIA Table B17 Nominal Natural Gas Prices by Gas Type in the United States illustrates both data sets It also illustrates difference in the availability of pricing data Price information for Wellhead price was available from 1922-2008 but the Henry Hub Spot price was not available past 1990 Tables B18 B19 and B20 are the Real Natural Gas prices for the US and New Mexico The 2008 implicit price deflator for GDP from the Bureau of Economic Analysis National Income and Product Accounts was used to adjust the nominal prices to real prices in 2000 dollars (Conversion factor = 22422 wwwbeagov)
40
Appendix B Data Tables and Sources for Figures Table B1 World Crude Oil Production 1857-2008
World Crude Oil Production 1857-2008 (Thousands of Barrels)
Year Crude Oil
Production Year Crude Oil
Production Year Crude Oil
Production 1857 200 1919 555875 1981 20566116
1858 400 1920 688884 1982 19584523
1859 700 1921 766002 1983 19490512
1860 50800 1922 858898 1984 19945536
1861 2131 1923 1015736 1985 19703492
1862 3092 1924 1014318 1986 20522809
1863 2763 1925 1068933 1987 20689688
1864 2304 1926 1096823 1988 21500890
1865 2716 1927 1262582 1989 21855067
1866 3899 1928 1324774 1990 22089439
1867 3709 1929 1485867 1991 21973043
1868 3990 1930 1410037 1992 22004685
1869 4696 1931 1372532 1993 21973796
1870 5799 1932 1309677 1994 22307130
1871 5730 1933 1442146 1995 22784686
1872 6877 1934 1522288 1996 23349797
1873 10838 1935 1654495 1997 24013767
1874 11933 1936 1791540 1998 24451124
1875 13152 1937 2039231 1999 24061914
1876 11051 1938 1998041 2000 25090080
1877 15754 1939 2086160 2001 24869314
1878 18417 1940 2149821 2002 24525375
1879 23601 1941 2220657 2003 25350226
1880 30018 1942 2093100 2004 26558439
1881 31993 1943 2256637 2005 26944551
1882 35865 1944 2592289 2006 27111487
1883 30255 1945 2594697 2007 30836798
1884 35969 1946 2745430 2008 31217895
1885 36765 1947 3022139 1886 47243 1948 3433225 1887 47807 1949 3404142 1888 52165 1950 3802995
Continued on Next Page
41
Table B-1 Continued from Previous Page
1889 61507 1951 4282730 1890 76633 1952 4504708 1891 81100 1953 4798055 1892 88739 1954 5016843 1893 92038 1955 5625883 1894 89337 1956 6124676 1895 103692 1957 6438444 1896 114199 1958 6607750 1897 121993 1959 7133238 1898 124979 1960 7674460 1899 131147 1961 8186213 1900 149137 1962 8881858 1901 167440 1963 9538346 1902 181809 1964 10309644 1903 194879 1965 11062515 1904 217948 1966 12021786 1905 215091 1967 12914340 1906 213263 1968 14146318 1907 263957 1969 15222511 1908 285287 1970 16718708 1909 298709 1971 17662793 1910 327763 1972 18600501 1911 344361 1973 20367981 1912 352443 1974 20537727 1913 385345 1975 19497604 1914 407544 1976 21191154 1915 432033 1977 21900695 1916 457500 1978 22158251 1917 502891 1979 22721365 1918 503515 1980 21950297
Sources (1) 1857-1917 (Petroleum Facts and Figures Centennial Edition 1971 p 556-557 World Crude Oil Production By Countries) (2) 1918-1983 (Twentieth Century Petroleum Statistics 40th edition p 4 World Crude Production) (3) 1984-2006 (Twentieth Century Petroleum Statistics 63rd edition p 4 World Crude Production) (4)
2007-2008 (Energy Information Administration 2009) Note The data in this table was used to produce Figure 1
42
Table B2 Oil Production in Major Producing Nations 2007
Oil Production in Major Producing Nations in 2007 (Thousands of Barrels)
1 Saudi Arabia 3743002 2 Russia 3606413 3 United States 3088732 4 Iran 1473331 5 China 1428741 6 Mexico 1278383 7 Canada 1249855 8 United Arab Emirates 1076558 9 Venezuela 975272 10 Kuwait 955586 11 Norway 936804 12 Nigeria 859439 13 Brazil 831776 14 Algeria 793915 15 Iraq 765730
Source Same as table B-1 Note The data in this table was used to produce Figure 3 and Figure 4
43
Table B3 Average Annual Oil Production in the United States by Decade 1860-2000
Average Annual Oil Production in the United States by Decade 1860-2000 (Thousand Barrels)
Decade Crude Oil Production
1860 500 1870 2770 1880 10416 1890 27295 1900 53517 1910 122832 1920 281863 1930 712016 1940 1019559 1950 1664255 1960 2439090 1970 2958923 1980 3233197 1990 3110048 2000 2449063
Source (Energy Information Administration 2009) Note The data in this table was used to produce Figure 5
44
Table B4 Crude Oil Production in New Mexico 1924-2008
Crude Oil Production in New Mexico 1924-2008 (Thousands of Barrels)
Year Crude Oil
Production Year Crude Oil
Production Year Crude Oil
Production
1924 98 1953 70441 1982 71024
1925 1060 1954 74820 1983 75169
1926 1666 1955 82958 1984 79336
1927 1226 1956 87893 1985 78530
1928 943 1957 94759 1986 75712
1929 1830 1958 98515 1987 72328
1930 10189 1959 105692 1988 71234
1931 15227 1960 107380 1989 68714
1932 12455 1961 112553 1990 67250
1933 14116 1962 109328 1991 70417
1934 16864 1963 109941 1992 69972
1935 20483 1964 113863 1993 68422
1936 27223 1965 119166 1994 65846
1937 38854 1966 124154 1995 64508
1938 35759 1967 126144 1996 64479
1939 37637 1968 128550 1997 69834
1940 39129 1969 129227 1998 72328
1941 39569 1970 128184 1999 64376
1942 31554 1971 118412 2000 67198
1943 38896 1972 110525 2001 68001
1944 39555 1973 100986 2002 67041
1945 37351 1974 98695 2003 66130
1946 36814 1975 95063 2004 64236
1947 40926 1976 92130 2005 60660
1948 47969 1977 87223 2006 59818
1949 47932 1978 83365 2007 58831
1950 47367 1979 79649 2008 59403
1951 52719 1980 75324 1952 58681 1981 71568
Sources (1) 1924-1958 (Petroleum Facts and Figures Centennial Edition 1959 p 40-41 Crude Oil Production by states) (2) 1959 (Petroleum Facts and Figures 1961 Edition p 34 Crude Oil Production by states) (3) 1960-2008
(Energy Information Administration 2009) Note The data in this table was used to produce Figure 5
45
Table B5 New Mexico Average Annual Crude Oil Production by Decade
New Mexico Average Annual Crude Oil Production by Decade
1924-1929 1137
1930-1939 22881
1940-1949 39970
1950-1959 77385
1960-1969 118031
1970-1979 99423
1980-1989 73894
1990-1999 67743
2000-2008 63480
Source Same as table B-4 Note The data in this table was used to produce Figure 6
46
Table B6 New Mexico Oil and Natural Gas Indusrty Extraction Employment 1969-2007
New Mexico Oil and Natural Gas Extraction Employment 1969-2007
Year Employment
Year Employment 1969 9436
1989 13756
1970 8893
1990 14068 1971 8860
1991 15501
1972 8417
1992 12657 1973 8771
1993 14295
1974 9715
1994 14372 1975 10285
1995 14460
1976 9624
1996 13119 1977 10643
1997 14024
1978 11256
1998 13698 1979 12311
1999 13008
1980 15116
2000 14425 1981 18628
2001 10883
1982 17710
2002 9840 1983 15747
2003 10466
1984 (D)
2004 11211 1985 16474
2005 12723
1986 (D)
2006 14313 1987 13625
2007 15093
1988 14722
Sources (1) 1969-2000 (Bureau of Economic Analysis 2009 Table SA25N) (2) 2001-2007 (Bureau of Labor Statistics 2009 Quarterly Census of Employment and Wages) Note The data in Table B 6 were used to
create Figure 16 (D) ldquoMeans a non-disclosed data figurerdquo
47
Table B7 Nominal Crude Prices by Oil Type in the United States 1929-2008
Nominal Crude Prices by Oil Type in the United States
Year West Texas
Intermediate Crude Oil Wellhead
1929 $083 $127 1930 $077 $119 1931 $039 $065 1932 $060 $087 1933 $044 $067 1934 $095 $100 1935 $075 $097 1936 $078 $109 1937 $087 $118 1938 $085 $113 1939 $075 $102 1940 $075 $102 1941 $086 $114 1942 $092 $119 1943 $092 $120 1944 $092 $121 1945 $092 $122 1946 $111 $141 1947 $163 $193 1948 $232 $260 1949 $232 $254 1950 $232 $251 1951 $232 $253 1952 $232 $253 1953 $246 $268 1954 $257 $278 1955 $257 $277 1956 $257 $279 1957 $282 $309 1958 $282 $301 1959 $267 $290 1960 $265 $288 1961 $265 $289 1962 $265 $290 1963 $265 $289 Continued on Next Page
48
Table B-7 Continued from Previous Page
Year West Texas
Intermediate Crude Oil Wellhead Year
West Texas Intermediate
Crude Oil Wellhead
1964 $265 $288 1995 $1843 $1462 1965 $265 $286 1996 $2212 $1846 1966 $278 $288 1997 $2061 $1723 1967 $280 $292 1998 $1442 $1087 1968 $280 $294 1999 $1934 $1556 1969 $293 $309 2000 $3038 $2672 1970 $297 $318 2001 $2598 $2184 1971 $322 $339 2002 $2618 $2251 1972 $325 $339 2003 $3108 $2756 1973 $387 $389 2004 $4151 $3677 1974 $1037 $687 2005 $5664 $5028 1975 $1116 $767 2006 $6605 $5969 1976 $1265 $819 2007 $7234 $6652 1977 $1430 $857 2008 $9967 $9404 1978 $1485 $900
1979 $2240 $1264 1980 $3738 $2159 1981 $3667 $3177 1982 $3364 $2852 1983 $3040 $2619 1984 $2928 $2588 1985 $2797 $2409 1986 $1505 $1251 1987 $1920 $1540 1988 $1597 $1258 1989 $1964 $1586 1990 $2453 $2003 1991 $2154 $1654 1992 $2058 $1599 1993 $1843 $1425 1994 $1720 $1319
Sources (1) [ldquoWest Texas Intermediate (WTI) Spot Pricesrdquo] 1929-1972 (Twentieth Century Petroleum Statistics 40th edition p 100 Posted Price per barrel of Petroleum at wells by grades) 1973-1985 (Economic Research Federal Bank of St Louis 2009) 1986-2008 (Energy Information Administration 2009) (2) [ldquoCrude Oil Wellhead
Pricesrdquo] 1929-2008 (Energy Information Administration 2009)
49
Table B8 Real Crude Prices (2008 Dollars) in the United States by Type of Oil
Table B-8 Real Crude Prices (2008 Dollars) in the United States by Type of Oil
Year West Texas
Intermediate Crude Oil Wellhead
1929 $849 $1298 1930 $817 $1263 1931 $462 $770 1932 $805 $1168 1933 $607 $924 1934 $1241 $1307 1935 $961 $1242 1936 $988 $1381 1937 $1056 $1433 1938 $1063 $1413 1939 $947 $1288 1940 $936 $1273 1941 $1006 $1334 1942 $999 $1292 1943 $948 $1236 1944 $926 $1218 1945 $902 $1196 1946 $972 $1234 1947 $1287 $1524 1948 $1734 $1943 1949 $1737 $1902 1950 $1718 $1859 1951 $1603 $1748 1952 $1576 $1719 1953 $1651 $1798 1954 $1708 $1848 1955 $1679 $1809 1956 $1622 $1761 1957 $1723 $1888 1958 $1684 $1798 1959 $1575 $1711 1960 $1542 $1676 1961 $1525 $1663 1962 $1504 $1646 1963 $1488 $1623
Continued on Next Page
50
Table B-8 Continued from Previous Page
Year West Texas
Intermediate Crude Oil Wellhead Year
West Texas Intermediate
Crude Oil Wellhead
1964 $1466 $1593 1995 $2450 $1943 1965 $1440 $1554 1996 $2885 $2408 1966 $1468 $1521 1997 $2644 $2211 1967 $1435 $1496 1998 $1830 $1379 1968 $1376 $1445 1999 $2419 $1946 1969 $1372 $1447 2000 $3719 $3271 1970 $1321 $1414 2001 $3106 $2611 1971 $1363 $1435 2002 $3076 $2645 1972 $1319 $1376 2003 $3576 $3171 1973 $1489 $1495 2004 $4642 $4112 1974 $3657 $2422 2005 $6134 $5446 1975 $3595 $2471 2006 $6930 $6263 1976 $3851 $2494 2007 $7391 $6797 1977 $4094 $2454 2008 $9967 $9404 1978 $3973 $2408
1979 $5536 $3123 1980 $8466 $4891 1981 $7593 $6579 1982 $6565 $5566 1983 $5706 $4917 1984 $5297 $4683 1985 $4912 $4230 1986 $2586 $2149 1987 $3211 $2576 1988 $2583 $2035 1989 $3061 $2472 1990 $3681 $3005 1991 $3123 $2398 1992 $2917 $2266 1993 $2553 $1974 1994 $2333 $1789
Source Same as Table B-7 and author calculations Real prices in 2000 dollars appearing in the original table converted to 2008 dollars Conversion factor = 22422 (the2008 implicit price deflator for GDP from Bureau of Economic Analysis National Income and Product Accounts Table 119 (wwwbeagov
accessed on June 11 2009 Note the data in Table B 8 were used to create Figure 7
51
Table B9 Nominal Crude Oil Prices in New Mexico and the United States 1978-2008
Nominal Crude Oil Prices in New Mexico and the United States 1978-2008 (Dollars per Barrel)
Year NM Price US Price 1978 $1017 $900 1979 $1433 $1264 1980 $2406 $2159 1981 $3504 $3177 1982 $3182 $2852 1983 $2926 $2619 1984 $2869 $2588 1985 $2684 $2409 1986 $1493 $1251 1987 $1757 $1540 1988 $1478 $1258 1989 $1786 $1586 1990 $2244 $2003 1991 $1935 $1654 1992 $1855 $1599 1993 $1644 $1425 1994 $1532 $1319 1995 $1674 $1462 1996 $2079 $1846 1997 $1902 $1723 1998 $1236 $1087 1999 $1746 $1556 2000 $2880 $2672 2001 $2372 $2184 2002 $2411 $2251 2003 $2952 $2756 2004 $3925 $3677 2005 $5284 $5028 2006 $6174 $5969 2007 $6894 $6652 2008 $9623 $9404
Source 1978-2008 (Energy Information Administration 2009)
52
Table B10 Real Crude Oil Prices (2008 Dollars) in New Mexico and the United States 1978-2008
Real Crude Oil Prices in New Mexico and the United States 1978-2008 (Dollars Per Barrel)
Year NM Price US Price 1978 $2722 $2409 1979 $3542 $3124 1980 $5452 $4893 1981 $7258 $6581 1982 $6212 $5568 1983 $5495 $4918 1984 $5193 $4684 1985 $4714 $4231 1986 $2566 $2150 1987 $2939 $2576 1988 $2391 $2035 1989 $2783 $2472 1990 $3367 $3005 1991 $2805 $2398 1992 $2629 $2266 1993 $2277 $1974 1994 $2078 $1789 1995 $2225 $1943 1996 $2711 $2407 1997 $2440 $2210 1998 $1568 $1379 1999 $2184 $1946 2000 $3525 $3271 2001 $2836 $2611 2002 $2833 $2645 2003 $3396 $3171 2004 $4389 $4112 2005 $5722 $5445 2006 $6477 $6262 2007 $7043 $6796 2008 $9623 $9404
Source Tables B-8 and B-9 New Mexico and United States real prices calculated by authors from original data sources
53
Table B11 World Natural Gas Production 1980-2007
World Natural Gas Production 1980-2007 (Billion Cubic Feet)
Year Natural Gas Production
1980 53375 1981 54737 1982 54563 1983 55145 1984 60027 1985 62298 1986 63578 1987 66585 1988 69847 1989 72158 1990 73788 1991 75014 1992 75108 1993 76505 1994 77068 1995 78105 1996 81849 1997 81697 1998 83189 1999 85083 2000 88396 2001 90133 2002 91904 2003 94929 2004 97595 2005 100641 2006 103974 2007 105968
Source (1) 1980-2007 (Energy Information Administration 2009) Note The data in this table was used to produce Figure 9
54
Table B12 Natural Gas Production in Major Producing Nations 2007
Natural Gas Production in Major Producing Nations in 2007 (Billion Cubic Feet)
1 Russia 21941 2 United States 20561 3 Canada 6037 4 Iran 4107 5 Norway 3503 6 Algeria 3048 7 Netherlands 3025 8 Saudi Arabia 2758 9 United Kingdom 2469
10 China 2685 11 Turkmenistan NA 12 Uzbekistan NA 13 Qatar 2719 14 Indonesia 2472 15 Mexico 2057
Source Same as table B-11 Note The data in this table was used to produce Figure 10
55
Table B13 Average Annual Natural Gas Production in the United States by Decade 1900-2000
Average Annual Natural Gas Production in the United States by Decade 1900-2000 (Million Cubic Feet)
Decade Natural Gas Production
1900 128000 1910 300900 1920 640200 1930 1201400 1940 2027159 1950 3944829 1960 9213623 1970 16163329 1980 21172528 1990 18148139 2000 19348048
Source (Energy Information Administration 2009) Note The data in this table was used to produce Figure 11
56
Table B14 Natural Gas Production in New Mexico 1935-2008
Natural Gas Production in New Mexico 1935-2008 (Million Cubic Feet)
Year Natural Gas Production Year
Natural Gas Production Year
Natural Gas Production
1935 27931 1964 873947 1993 1409429
1936 38153 1965 937205 1994 1557689
1937 46337 1966 998076 1995 1625837
1938 50706 1967 1067510 1996 1554087
1939 60284 1968 1164182 1997 1558633
1940 63990 1969 1138133 1998 1501098
1941 64655 1970 1138980 1999 1511671
1942 78164 1971 1167577 2000 1695295
1943 86500 1972 1216061 2001 1689125
1944 87831 1973 1218749 2002 1632080
1945 105696 1974 1244779 2003 1604015
1946 120596 1975 1217430 2004 1632539
1947 142740 1976 1230976 2005 1645166
1948 194749 1977 1202973 2006 1609223
1949 204961 1978 1174198 2007 1544830
1950 212909 1979 1181363 2008 1472599
1951 300169 1980 1148086 1952 359377 1981 1132066 1953 399086 1982 991178 1954 449346 1983 895279 1955 540664 1984 957366 1956 626340 1985 905272 1957 723004 1986 702614 1958 761446 1987 823773 1959 739660 1988 791819 1960 798928 1989 854615 1961 789662 1990 965104 1962 804612 1991 1038284
1963 808377 1992 1268863
Sources (1) 1935-1968 (Petroleum Facts and Figures 1971 Edition p 102-107 Gross and Marketed Production of Natural Gas by States) (2) 1969-2008 (Energy Information Administration 2009) Note The data in this table was
used to produce Figure 12
57
Table B15 New Mexico Average Annual Natural Gas Production by Decade
New Mexico Average Annual Natural Gas Production by Decade (Million Cubic Feet)
1935-1939 44682
1940-1949 114988
1950-1959 511200
1960-1969 938063
1970-1979 1199309
1980-1989 920207
1990-1999 1425999
2000-2007 1631534
Source Same as table B-14
Table B17 Nominal Natural Gas Prices by Gas Type in the United States 1922-2008
Nominal Natural Gas Prices by Gas Type in the United States (Dollars per Thousand Cubic Feet)
Year Henry Hub Spot Natural Gas Wellhead 1922
$011
1923
$010 1924
$009
1925
$009 1926
$010
1927
$009 1928
$009
1929
$008 1930
$008
1931
$007 1932
$006
1933
$006 1934
$006
1935
$006 1936
$006
1937
$005 1938
$005
1939
$005 1940
$005
58
1941
$005 1942
$005
1943
$005 1944
$005
1945
$005 1946
$005
1947
$006 1948
$007
1949
$006 1950
$007
1951
$007 1952
$008
1953
$009 1954
$010
1955
$010 1956
$011
Continued on Next Page
Table B-17 Continued from Previous Page
Year Henry Hub
Spot Natural Gas Wellhead Year
Henry Hub Spot
Natural Gas Wellhead
1957
011 1988
169 1958
012 1989
169
1959
013 1990
175 171 1960
014 1991
153 164
1961
015 1992
183 174 1962
016 1993
219 204
1963
016 1994
197 185 1964
015 1995
174 155
1965
016 1996
283 217 1966
016 1997
257 232
1967
016 1998
215 196 1968
016 1999
234 219
1969
017 2000
444 368 1970
017 2001
408 400
1971
018 2002
346 295 1972
019 2003
564 488
1973
022 2004
608 546 1974
030 2005
894 733
1975
044 2006
694 639 1976
058 2007
717 637
59
1977
079 2008
913 807 1978
091
1979
118 1980
159
1981
198 1982
246
1983
259 1984
266
1985
251 1986
194
1987
167
Sources (1) [ldquoHenry Hub Spot Pricesrdquo] 1990-2008 (Energy Information Administration 2009) (2) [ldquoNatural Gas Wellhead Pricesrdquo] 1922-2008 (Energy Information Administration 2009)
60
Table B18 Real Natural Gas Prices (2008 Dollars) in the United States by Type of Gas 1929-2008
Table B-18 Real Natural Gas Prices (2008 Dollars) in the United States by Type of Gas (Dollars per Thousand Cubic Feet)
Year Henry Hub Spot Natural Gas Wellhead
1929
$0008 1930
$0007
1931
$0006 1932
$0005
1933
$0004 1934
$0005
1935
$0005 1936
$0004
1937
$0004 1938
$0004
1939
$0004 1940
$0004
1941
$0004 1942
$0005
1943
$0005 1944
$0005
1945
$0005 1946
$0006
1947
$0008 1948
$0009
1949
$0008 1950
$0009
1951
$001 1952
$001
1953
$001 1954
$002
1955
$002 1956
$002
1957
$002 1958
$002
1959
$002 1960
$002
1961
$003 1962
$003
1963
$003
61
Continued on Next Page
Table B-18 Continued from Previous Page
Year Henry Hub
Spot Natural Gas
Wellhead Year Henry Hub
Spot Natural Gas
Wellhead
1964
$003 1995 $231 $116 1965
$003 1996 $369 $166
1966
$003 1997 $330 $181 1967
$003 1998 $273 $154
1968
$003 1999 $293 $175 1969
$004 2000 $544 $301
1970
$004 2001 $488 $335 1971
$004 2002 $407 $251
1972
$005 2003 $649 $424 1973
$006 2004 $680 $488
1974
$009 2005 $968 $677 1975
$014 2006 $728 $609
1976
$019 2007 $733 $623 1977
$028 2008 $913 $807
1978
$034 1979
$048
1980
$070 1981
$096
1982
$126 1983
$138
1984
$147 1985
$143
1986
$113 1987
$100
1988
$104 1989
$109
1990 $263 $114 1991 $222 $113 1992 $259 $123 1993 $303 $148 1994 $267 $137
Source Same as Table B-17 and author calculations Real prices in 2000 dollars appearing in the original table converted to 2008 dollars Conversion factor = 22422 (the2008 implicit price deflator for GDP from Bureau of Economic Analysis National Income and Product Accounts Table 119 (wwwbeagov
accessed on June 11 2009 Note the data in Table B 18 were used to create Figure 13
62
Table B19 Nominal Natural Gas Prices in New Mexico and the United States 1967-2008
Table B-19 Nominal Natural Gas Prices (2008 Dollars) in the United States by Type of Gas (Dollars per Thousand Cubic Feet)
Year NM Price US Price Year NM Price US Price
1967 $013 $016 1998 $176 $196 1968 $013 $016 1999 $211 $219 1969 $014 $017 2000 $343 $368 1970 $014 $017 2001 $389 $400 1971 $015 $018 2002 $268 $295 1972 $019 $019 2003 $456 $488 1973 $024 $022 2004 $497 $546 1974 $031 $030 2005 $691 $733 1975 $040 $044 2006 $618 $639 1976 $056 $058 2007 $688 $637 1977 $081 $079 2008
$807
1978 $099 $091 1979 $137 $118 1980 $176 $159 1981 $213 $198 1982 $247 $246 1983 $268 $259 1984 $271 $266 1985 $262 $251 1986 $187 $194 1987 $166 $167 1988 $170 $169 1989 $156 $169 1990 $169 $171 1991 $137 $164 1992 $160 $174 1993 $179 $204 1994 $158 $185 1995 $126 $155 1996 $167 $217 1997 $176 $232
Source (Energy Information Administration 2009)
63
Table B20 RealNatural Gas Prices (2008 Dollars) in New Mexico and the United States 1967-2008
Table B-20 Real Natural Gas Prices (2008 Dollars) in the United States by Type of Gas (Dollars per Thousand Cubic Feet)
Year NM Price US Price Year NM Price US Price
1967 $067 $082 1998 $224 $249 1968 $064 $081 1999 $264 $274 1969 $066 $078 2000 $420 $451 1970 $062 $076 2001 $465 $478 1971 $064 $076 2002 $315 $347 1972 $077 $077 2003 $524 $561 1973 $092 $085 2004 $556 $611 1974 $109 $106 2005 $748 $794 1975 $129 $142 2006 $649 $670 1976 $171 $177 2007 $703 $651 1977 $232 $226 2008
$807
1978 $265 $243 1979 $338 $292 1980 $399 $360 1981 $441 $410 1982 $482 $480 1983 $503 $486 1984 $490 $481 1985 $460 $441 1986 $321 $333 1987 $278 $279 1988 $275 $273 1989 $244 $264 1990 $253 $256 1991 $199 $238 1992 $227 $247 1993 $248 $283 1994 $214 $251 1995 $168 $205 1996 $217 $283 1997 $226 $298 Source Same as Table B-19 and author calculations Real prices in 2000 dollars appearing in the original
table converted to 2008 dollars Conversion factor = 22422 (the2008 implicit price deflator for GDP from Bureau of Economic Analysis National Income and Product Accounts Table 119 (wwwbeagov accessed on June 11 2009 Note the data in Table B 20 were used to create Figure 15
64
Table B21 State of New Mexico Annual Oil Rigs and Gas Well Count amp Production
State of New Mexico Annual Oil Rigs and Gas Well Count amp Production
Year Number Oil Wells
Oil Produced (thousand barrels)
Number Gas Wells
Natural Gas Produced (million cubic feet)
1951 41 52719 235 300169
1952 27 58681 546 359377
1953 49 70441 1011 399086
1954 48 74820 1339 449346
1955 58 82958 1662 540664
1956 153 87893 2241 626340
1957 372 94759 2909 723004
1958 454 98515 3618 761446
1959 674 105692 4019 739660
1960 663 107380 4454 798928
1961 673 112553 4877 789662
1962 698 109328 5317 804612
1963 740 109941 5618 808377
1964 708 113863 5860 873947
1965 710 119166 5844 937205
1966 686 124154 6249 998076
1967 668 126144 6563 1067510
1968 674 128550 6750 1164182
1969 661 129227 6982 1138133
1970 7164 128184 8852 1138980
1971 7345 118412 9816 1167577
1972 3651 110525 8430 1216061
1973 7323 100986 10445 1218749
1974 7950 98695 10901 1244779
1975 8119 95063 11521 1217430
1976 8474 92130 11855 1230976
1977 8689 87223 13236 1202973
1978 3348 83365 10984 1174198
1979 9257 79649 14992 1181363
1980 9810 75324 16096 1148086
1981 10276 71568 17457 1132066
1982 10744 71024 18632 991178
1983 11139 75169 19365 895279
65
1984 11744 79336 19857 957366
1985 12417 78530 20473 905272
1986 12479 75712 20861 702614
1987 11937 72328 21136 823773
1988 11893 71234 20390 791819
1989 12119 68714 21553 854615
1990 12456 67250 22086 965104
1991 12885 70417 22288 1038284
1992 13040 69972 22683 1268863
1993 13297 68422 22962 1409429
1994 13567 65846 23709 1557689
1995 13626 64508 24013 1625837
1996 13916 64479 24337 1554087
1997 14165 69834 24765 1558633
1998 13876 72328 25612 1501098
1999 13486 64376 26233 1511671
2000 14170 67198 27183 1695295
2001 14629 68001 28586 1689125
2002 14637 67041 29649 1632080
2003 14759 66130 31010 1604015
2004 14909 64236 32663 1632539
2005 15011 60660 34482 1645166
2006 15456 59818 36202 1609223
2007 ND 58831 42644 1544830
2008 20609 59403 ND ND
Source United States Department of Energy Energy Information Administration (EIA) Available from Web Page httptontoeiadoegovstateSEP_MoreReservescfm Retrieved 07-20-2009
66
Appendix C A Brief Review of Input-Output Analysis2
Input-Output analysis was initially developed by Wassily W Leontief in the 1930s Founded in general equilibrium analysis input-output analysis was initially used as a tool to model national economies but is currently used extensively to examine economic impacts to regional economies as well Input-output analysis quantifies the interrelationships between sectors of a complex economic system detailing the movement of dollars between producers and consumers of goods and services within an economy The approach uses structural coefficients that represent the relationship between inputs in the production process (factors of production) and the resulting outputs produced by each sector The interdependence between sectors is modeled using a set of linear equations that balance a sectorrsquos total input use to the sectorrsquos total output Assumptions commonly made in input-output analysis include (1) each sector produces homogeneous outputs (eg underlying product value differences within a sector are not considered rather the analysis examines total output and input usage in terms of dollar amounts) (2) linear production functions (factor substitution or economies of size are not considered) and (3) time is treated statically within the model and factors of production within the sectors are assumed to be fully used (Lillywhite and Starbuck 2008 Pg 27) Direct effects are estimates of dollar impacts to the economy resulting from production by businesses within the sector under consideration That is a particular sectorrsquos direct effect on the economy is the amount of money generated by the sector through sales of its products andor services Indirect effects are impacts to the economy as the result of industry businesses purchasing inputs from other industry sectors within the economy that is the production in other industries resulting from input demands generated by the primary industry Induced effects are the value of increased spending by households resulting from the increase in income that was generated through the direct and indirect effects discussed above (Lillywhite and Starbuck 2008 Pg 27-28)3
IMPLAN generates a large number of reports and information anytime an impact event is analyzed The values usually reported are the output value added labor income and employment generated by the event The following description is directly adapted from the IMPLAN website and user manual available at httpwwwimplancom The output values reported in IMPLAN is the industry output valued in dollars generated by the event being analyzed The output values reported in IMPLAN and their associated multipliers can be used to gauge the level of interdependence between the event sectors and the rest of the regional economy Large output values related to the direct output values (which are equivalent to a large multiplier) indicate a high level of interdependence between the industries and will result in a larger impact of that sector on the regional economy (IMPLAN 2008)
2 This review is taken from Lillywhite and Starbuck (2008) and was originally written by Jay Lillywhite PhD New Mexico State University Department of Agriculture and Home Economics 3 Estimation of induced effects requires the economic system be treated as a closed system so that consumers
are considered part of the production process In the IMPLAN software used for this analysis closing the system requires the use of the SAM (Social Accounting Matrix) multiplier
67
Value Added is comprised of four components Employee Compensation Proprietary Income Other Property Type Income and Indirect Business Taxes The employee compensation includes benefits such as health and life insurance retirement payments and non-cash payments in addition to wages and cash payments Proprietary income is defined as the income from self-employment as reported on Federal Tax Form 1040C and includes any and all payments for self-employment Indirect business taxes are excise and sales taxes paid by individuals to businesses These taxes are collected during the normal operation of the businesses impacted by the event being analyzed and do not include taxes on profit or income (IMPLAN 2008) The labor income values show the direct indirect and induced employee compensation plus proprietor income effects generated by the impact event (IMPLAN 2008) Employment is the total wage and salary and self employed jobs in a region In this study the employment values reflect the total jobs created which includes both full-time and part-time labor to generate a total full-time equivalent number of jobs which allows for fractional values to be reported (IMPLAN 2008)
- Table of Tables
- Table of Figures
- Executive Summary
- Introduction
- Oil Production
-
- World Oil Production
- US Oil Production
- New Mexico Oil Production
-
- Oil Prices
- Natural Gas Production
-
- World Gas Production
- US Natural Gas Production
- New Mexico Gas Production
- US Natural Gas Prices
- New Mexico Natural Gas Prices
-
- Employment in the New Mexico Oil and Gas Industry
- Rotary Drilling Rigs
- Refineries
- Number of Wells
- Number of Operators
- Economic Impact of the Oil and Gas Industry in New Mexico
- Tax Impacts of Oil and Gas Extraction in New Mexico
-
- New Mexico Tax Revenue from Oil and Gas Extraction
-
- Limitations of the Analysis
- Summary and Conclusions
- Works Cited
- Acknowledgements
- Appendix A Data Sources and Issues
-
- Sources
- Oil Data Issues
- Natural Gas Data Issues
-
- Appendix B Data Tables and Sources for Figures
- Appendix C A Brief Review of Input-Output Analysis1F
-
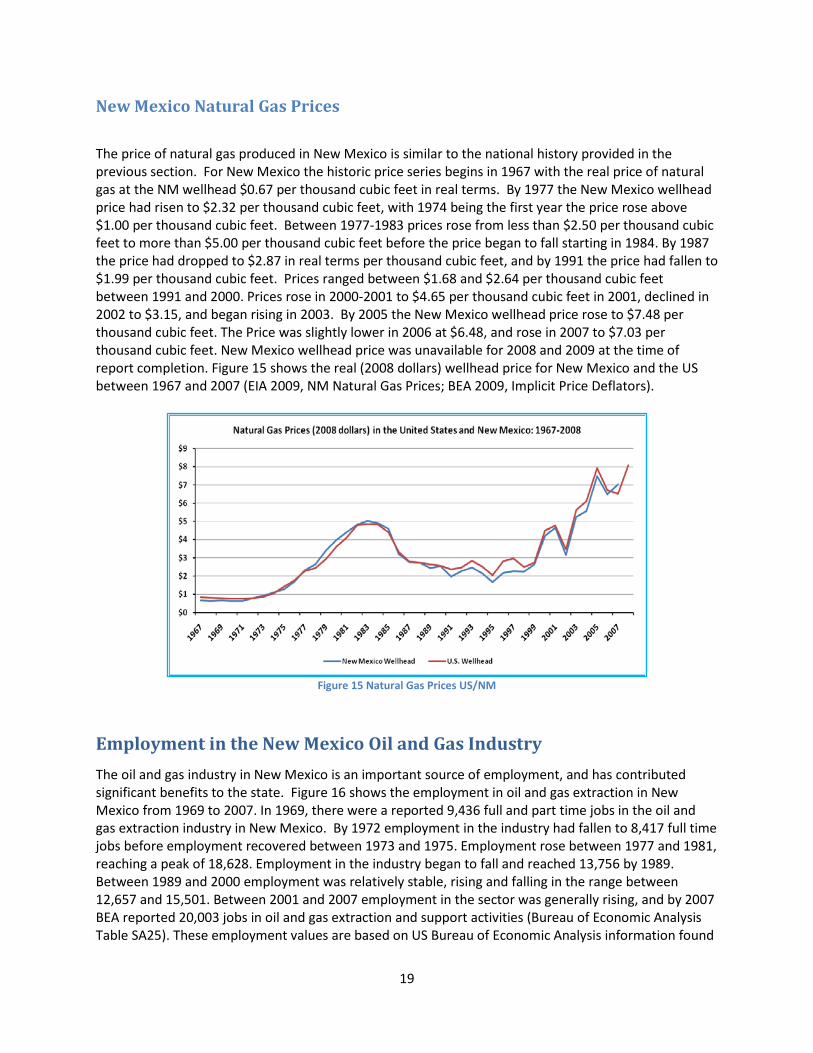