report supplement: length-specific probabilities of … · report supplement: length-specific...
TRANSCRIPT
ESLO2013-17.4
Report Supplement: Length-SpecificProbabilities of Screen Entrainment ofLarval Fishes Based on Head CapsuleMeasurements(Incorporating NFPP Site-Specific Estimates)
October 29, 2013
Prepared for:
Bechtel Power Corporation JUOTC Project
In support of:California State Water Resources Control BoardOnce-Through Cooling PolicyNuclear-Fueled Power Plant (NFPP) Special Studies
Prepared by:
141 Suburban Rd., Suite A2, San Luis Obispo, CA 93401805.541.0310, FAX: 805.541.0421
Environmental
Length-Specific Screen Entrainment Analysis
ESLO2013-017.4
Bechtel Power Screen Entrainment Analysis i
Table of Contents
Introduction................................................................................................................................1Methods......................................................................................................................................8
Entrainment Reduction Estimates........................................................................................8Calculation of Site-Specific Estimates for DCPP and SONGS .........................................11
Results......................................................................................................................................11Individual Taxa ..................................................................................................................11Extrapolated Population-Level Efficiency.........................................................................12Estimated Effectiveness at DCPP and SONGS .................................................................12
Conclusions..............................................................................................................................19References................................................................................................................................22
APPENDIX A: Regression Plots from Intake Screening Technology Support Studies
APPENDIX B: Estimated Proportions and Standard Errors of Larval Fish Taxa Entrained ThroughVarious Screen Slot Openings Based on Head Capsule Allometric Regressions on Notochord Lengths

Length-Specific Screen Entrainment Analysis
ESLO2013-017.4
Bechtel Power Screen Entrainment Analysis 1
IntroductionThe State policy on the use of ocean and estuarine waters for power plant cooling requires powerplants in California that utilize once-through cooling (OTC) to evaluate and significantly reduce,as achievable, losses of larval fishes and other planktonic organisms due to entrainment.1 One ofthe options under consideration at existing facilities is the use of fine-mesh screening systemsthat either use active ‘collect-and-transfer’ designs that collect the small organisms from theintake screens and return them alive to the source water body, or passive designs, such aswedgewire screens (WWS) that take advantage of induced currents to move organisms off andaway from the screens. Critical to the implementation of any fish protection technology is theneed for information that can be used in evaluating the feasibility and/or physical performance ofthe screens, including estimates of the potential reductions in entrainment for target organisms.
While laboratory (Amaral 2005) and field (Ehrler and Raifsnider 2000, Weisberg et al. 1987)studies have demonstrated that WWS have the potential to reduce entrainment of fish larvae,only preliminary testing has been completed at locations in California using species of fishesfound along the west coast. While all of these studies demonstrated reduction in entrainment,Weisberg et al. (1987), in testing WWS with slot sizes of 1, 2, and 3 mm (0.04, 0.08, and 0.12in.) were unable to detect any reductions in entrainment for smaller fish eggs and larvae, but diddetect significant reductions for larger larvae. Modeling studies on the potential effectiveness ofWWS at reducing entrainment of target species along the Hudson River have also beenconducted (Dey 2005), but the estimated relationships between length and screen exclusion forthe four screen slot widths evaluated were based on best professional judgment and not the actualmorphology of the larvae. The results from these and other studies have all concluded that theexclusion efficiency of WWS is highly dependent on the size of the organisms being potentiallyentrained.
This report presents the results of a modeling study on the potential effectiveness of WWS atreducing entrainment of fish larvae for several taxonomic groups of fishes that have beencollected in highest abundance during entrainment studies in California over the past 20 years.This study focuses on specific size classes of larvae as recommended by Weisberg et al. (1987)and is unique in using actual measurements of body morphology to estimate proportion of larvaeby length that could be susceptible to entrainment. The estimates of the proportion entrained ateach length are based on the length of the larvae and the corresponding width and depth of thehead capsule. Although most of the body parts of fish larvae are soft and easily compressible atearly stages of development when they are susceptible to entrainment, the head capsule hasharder cartilage and bone that resists compression. Therefore, the smallest dimension (width ordepth) of the head capsule can be used to model the minimum size larva that could pass throughrectangular fine-mesh screens or WWS slot openings.
1 http://www.waterboards.ca.gov/water_issues/programs/ocean/cwa316/

Length-Specific Screen Entrainment Analysis
ESLO2013-017.4
Bechtel Power Screen Entrainment Analysis 2
It is important to note that survival or viability of larvae that are not entrained, but becomeimpinged on the surface of the screen is not assessed in this report. Our analysis providesestimates of proportional entrainment for WWS slot openings of 0.75, 1.0, 2.0, 3.0, 4.0, and 6.0mm (0.03, 0.04, 0.08, 0.12, 0.16, and 0.24 in.) for each mm length class for larval fishes thatwere commonly collected from entrainment studies along the coast of California. The data werefrom entrainment studies that were included in Appendices E and F of the State Policy FinalSubstitute Environmental Document (California power plants once-through cooling entrainmentand impingement estimates).
The results of the length specific estimates of proportional entrainment are also used to estimatereductions in entrainment for the Diablo Canyon Power Plant (DCPP) near Avila Beach, and theSan Onofre Nuclear Generating Station2 (SONGS) in San Clemente. The estimates for DCCP aremore detailed as extensive data were available on both the taxonomic composition and the lengthdistributions of the larvae collected during the entrainment study at the plant.
Background on WWS TestingTesting of non-conventional screening systems, such as fine-mesh or WWS systems, at coastalintakes in California has been limited to pilot-scale studies related to desalination facilities, andsmall volume industrial and water system intakes. A list of installed systems for one of the majorWWS suppliers, Hendrick Screen Company, provides the range of facilities with WWS intakes.3
Most of the installations are in freshwater lakes and rivers, although there are intakes operatingwith WWS in San Francisco Bay.
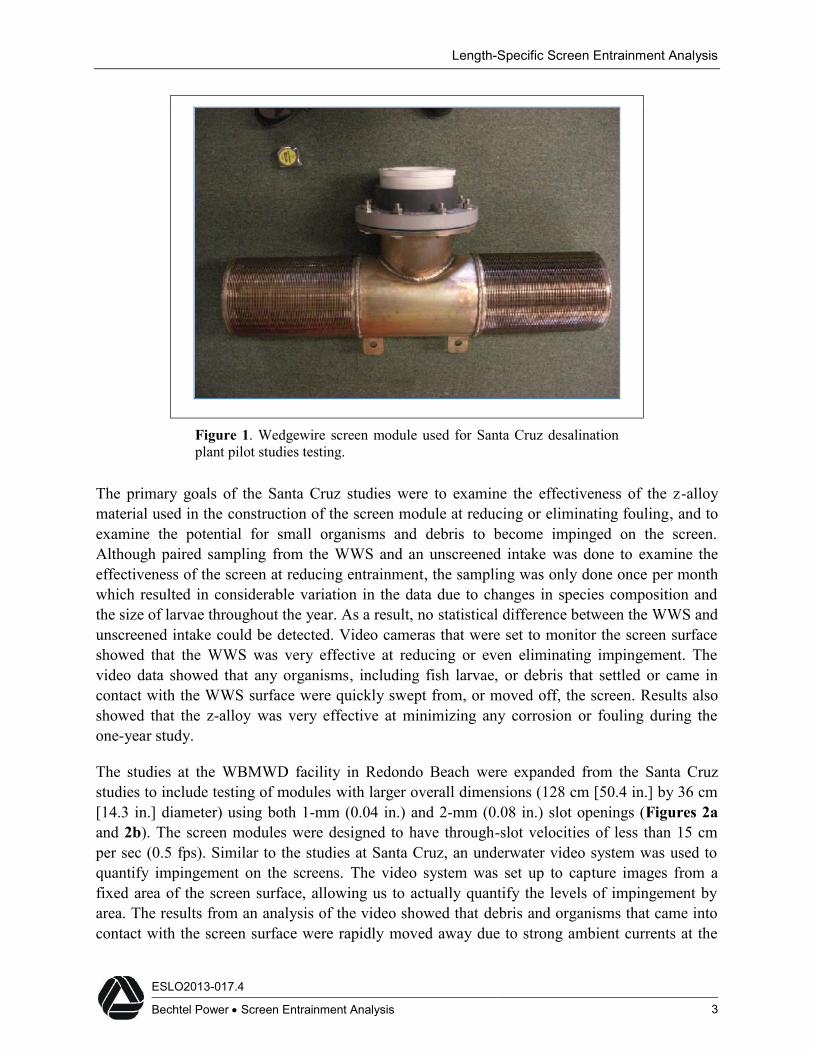
The only operational coastal (Pacific west coast) intake equipped with WWS at this time is apilot desalination plant constructed and operated by the West Basin Municipal Water District(WBMWD) in Redondo Beach. The pilot studies on the effectiveness of the WBMWD systemexpand on earlier pilot studies conducted in Santa Cruz for a planned desalination facility(Tenera 2010). The studies in Santa Cruz used a small WWS module supplied by HendrickScreen Company with a slot width opening of 2 mm (0.08 in.). The diameter of the screen was21.9 cm (8-5/8 in.), overall length was 88.9 cm (35 in.), and the outlet flange was 16.8 cm (6-5/8in.) diameter (Figure 1). The size of the module was designed to provide a through-slot velocityof less than 15 cm per second (0.5 feet per second [fps]). The module was attached to pier pilingsbelow the Santa Cruz Wharf at a depth of roughly 4.66.1 m (15–20 ft) depending on tidalheight.
2 As of June 2013 SONGS was no longer in operation and will be decommissioned without restarting.3 List available at http://www.hendrickscreenco.com/assets/docs/intakeinstall.xls
Length-Specific Screen Entrainment Analysis
ESLO2013-017.4
Bechtel Power Screen Entrainment Analysis 3
Figure 1. Wedgewire screen module used for Santa Cruz desalinationplant pilot studies testing.
The primary goals of the Santa Cruz studies were to examine the effectiveness of the z-alloymaterial used in the construction of the screen module at reducing or eliminating fouling, and toexamine the potential for small organisms and debris to become impinged on the screen.Although paired sampling from the WWS and an unscreened intake was done to examine theeffectiveness of the screen at reducing entrainment, the sampling was only done once per monthwhich resulted in considerable variation in the data due to changes in species composition andthe size of larvae throughout the year. As a result, no statistical difference between the WWS andunscreened intake could be detected. Video cameras that were set to monitor the screen surfaceshowed that the WWS was very effective at reducing or even eliminating impingement. Thevideo data showed that any organisms, including fish larvae, or debris that settled or came incontact with the WWS surface were quickly swept from, or moved off, the screen. Results alsoshowed that the z-alloy was very effective at minimizing any corrosion or fouling during theone-year study.
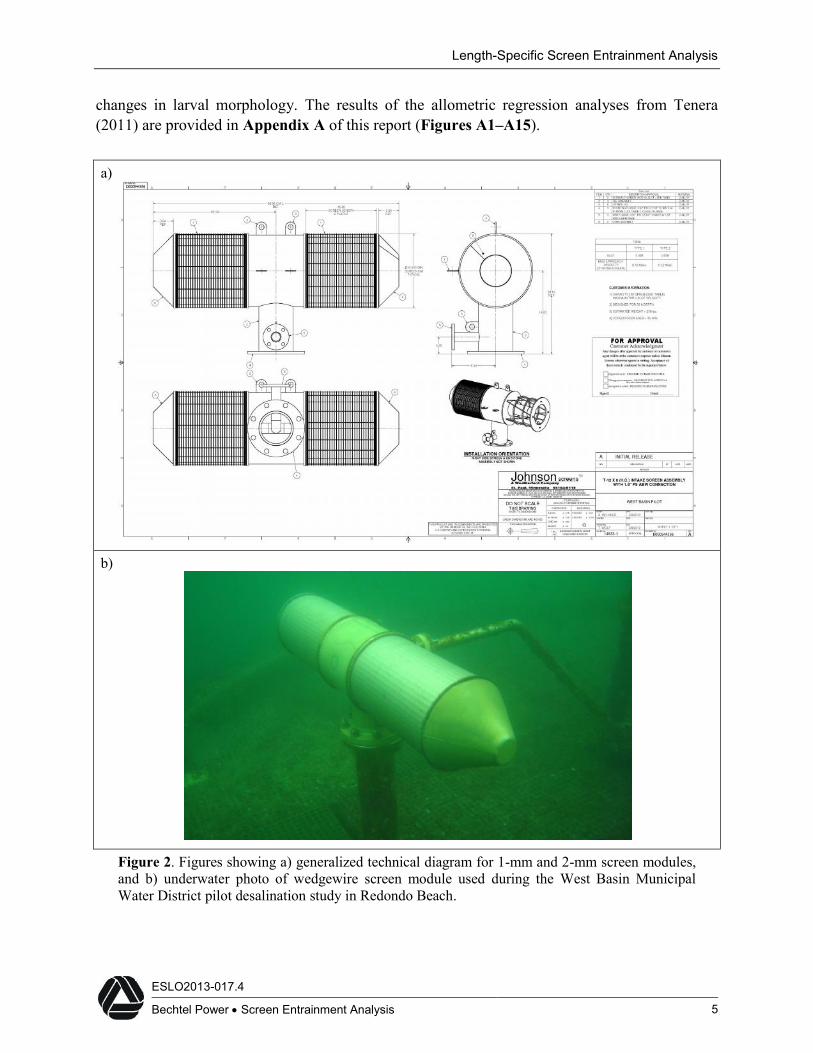
The studies at the WBMWD facility in Redondo Beach were expanded from the Santa Cruzstudies to include testing of modules with larger overall dimensions (128 cm [50.4 in.] by 36 cm[14.3 in.] diameter) using both 1-mm (0.04 in.) and 2-mm (0.08 in.) slot openings (Figures 2aand 2b). The screen modules were designed to have through-slot velocities of less than 15 cmper sec (0.5 fps). Similar to the studies at Santa Cruz, an underwater video system was used toquantify impingement on the screens. The video system was set up to capture images from afixed area of the screen surface, allowing us to actually quantify the levels of impingement byarea. The results from an analysis of the video showed that debris and organisms that came intocontact with the screen surface were rapidly moved away due to strong ambient currents at the
Length-Specific Screen Entrainment Analysis
ESLO2013-017.4
Bechtel Power Screen Entrainment Analysis 4
shallow depth (10.2 m [33.5 ft] MLLW) of the intakes. As a result, impingement was notobserved on the video footage. There were numerous observations of larval fish recorded by thevideo showing larvae swimming away from and along the screen surface. Although there werealso video data showing small larvae being entrained through the screen slots, there were no datashowing larvae trapped against the screen surface. The report on the results from these studies isstill being prepared (Tenera in prep).
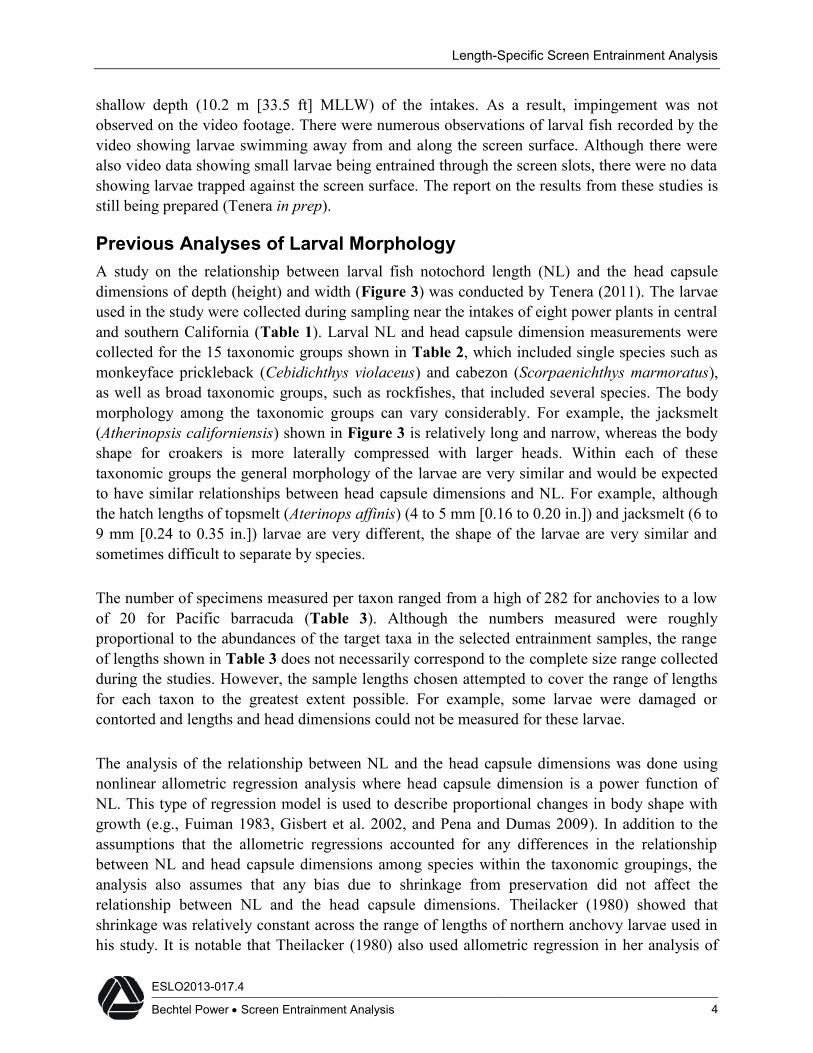
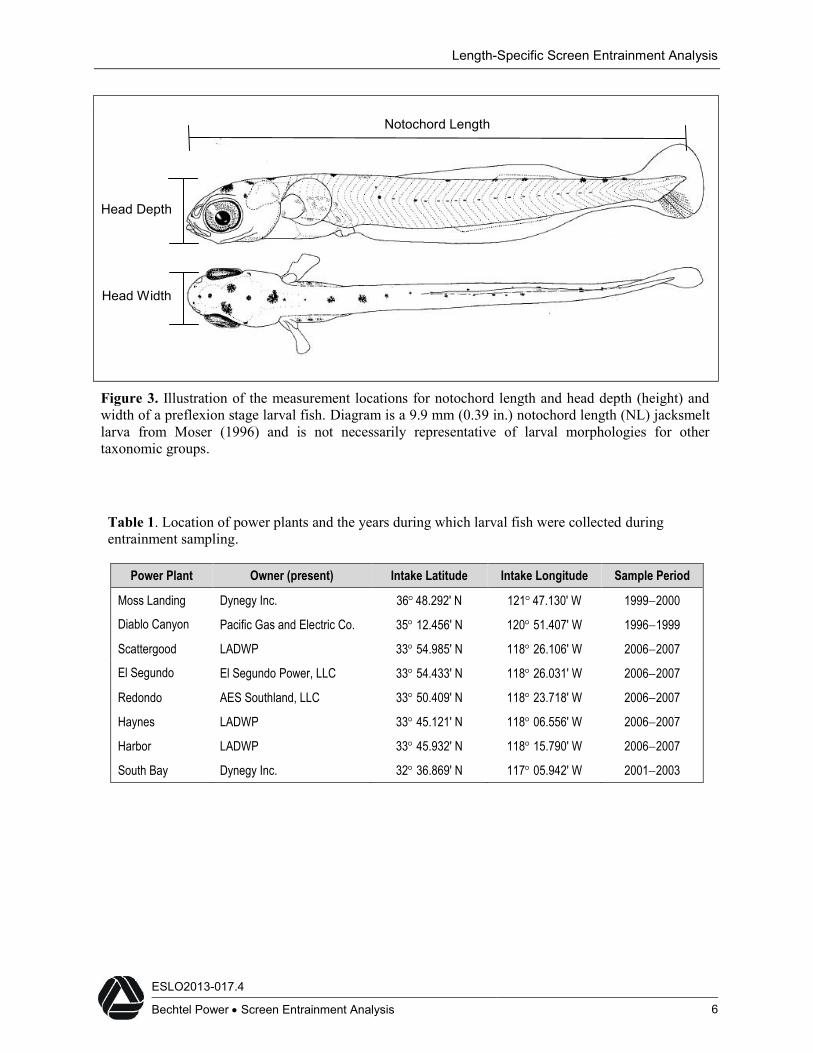
Previous Analyses of Larval MorphologyA study on the relationship between larval fish notochord length (NL) and the head capsuledimensions of depth (height) and width (Figure 3) was conducted by Tenera (2011). The larvaeused in the study were collected during sampling near the intakes of eight power plants in centraland southern California (Table 1). Larval NL and head capsule dimension measurements werecollected for the 15 taxonomic groups shown in Table 2, which included single species such asmonkeyface prickleback (Cebidichthys violaceus) and cabezon (Scorpaenichthys marmoratus),as well as broad taxonomic groups, such as rockfishes, that included several species. The bodymorphology among the taxonomic groups can vary considerably. For example, the jacksmelt(Atherinopsis californiensis) shown in Figure 3 is relatively long and narrow, whereas the bodyshape for croakers is more laterally compressed with larger heads. Within each of thesetaxonomic groups the general morphology of the larvae are very similar and would be expectedto have similar relationships between head capsule dimensions and NL. For example, althoughthe hatch lengths of topsmelt (Aterinops affinis) (4 to 5 mm [0.16 to 0.20 in.]) and jacksmelt (6 to9 mm [0.24 to 0.35 in.]) larvae are very different, the shape of the larvae are very similar andsometimes difficult to separate by species.
The number of specimens measured per taxon ranged from a high of 282 for anchovies to a lowof 20 for Pacific barracuda (Table 3). Although the numbers measured were roughlyproportional to the abundances of the target taxa in the selected entrainment samples, the rangeof lengths shown in Table 3 does not necessarily correspond to the complete size range collectedduring the studies. However, the sample lengths chosen attempted to cover the range of lengthsfor each taxon to the greatest extent possible. For example, some larvae were damaged orcontorted and lengths and head dimensions could not be measured for these larvae.
The analysis of the relationship between NL and the head capsule dimensions was done usingnonlinear allometric regression analysis where head capsule dimension is a power function ofNL. This type of regression model is used to describe proportional changes in body shape withgrowth (e.g., Fuiman 1983, Gisbert et al. 2002, and Pena and Dumas 2009). In addition to theassumptions that the allometric regressions accounted for any differences in the relationshipbetween NL and head capsule dimensions among species within the taxonomic groupings, theanalysis also assumes that any bias due to shrinkage from preservation did not affect therelationship between NL and the head capsule dimensions. Theilacker (1980) showed thatshrinkage was relatively constant across the range of lengths of northern anchovy larvae used inhis study. It is notable that Theilacker (1980) also used allometric regression in her analysis of
Length-Specific Screen Entrainment Analysis
ESLO2013-017.4
Bechtel Power Screen Entrainment Analysis 5
changes in larval morphology. The results of the allometric regression analyses from Tenera(2011) are provided in Appendix A of this report (Figures A1–A15).
a)
b)
Figure 2. Figures showing a) generalized technical diagram for 1-mm and 2-mm screen modules,and b) underwater photo of wedgewire screen module used during the West Basin MunicipalWater District pilot desalination study in Redondo Beach.
Length-Specific Screen Entrainment Analysis
ESLO2013-017.4
Bechtel Power Screen Entrainment Analysis 6
Figure 3. Illustration of the measurement locations for notochord length and head depth (height) andwidth of a preflexion stage larval fish. Diagram is a 9.9 mm (0.39 in.) notochord length (NL) jacksmeltlarva from Moser (1996) and is not necessarily representative of larval morphologies for othertaxonomic groups.
Table 1. Location of power plants and the years during which larval fish were collected duringentrainment sampling.
Power Plant Owner (present) Intake Latitude Intake Longitude Sample Period
Moss Landing Dynegy Inc. 36 48.292' N 121 47.130' W 19992000
Diablo Canyon Pacific Gas and Electric Co. 35 12.456' N 120 51.407' W 19961999
Scattergood LADWP 33 54.985' N 118 26.106' W 20062007
El Segundo El Segundo Power, LLC 33 54.433' N 118 26.031' W 20062007
Redondo AES Southland, LLC 33 50.409' N 118 23.718' W 20062007
Haynes LADWP 33 45.121' N 118 06.556' W 20062007
Harbor LADWP 33 45.932' N 118 15.790' W 20062007
South Bay Dynegy Inc. 32 36.869' N 117 05.942' W 20012003
Notochord Length
Head Depth
Head Width
Length-Specific Screen Entrainment Analysis
ESLO2013-017.4
Bechtel Power Screen Entrainment Analysis 7
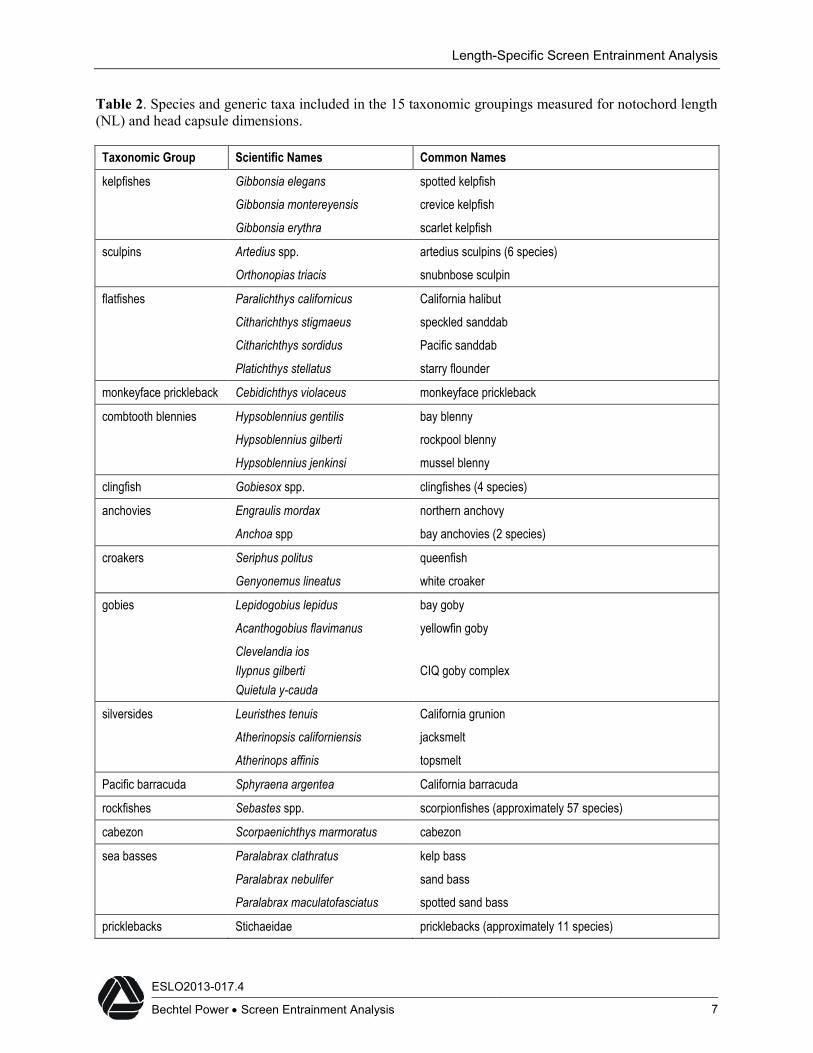
Table 2. Species and generic taxa included in the 15 taxonomic groupings measured for notochord length(NL) and head capsule dimensions.
Taxonomic Group Scientific Names Common Names
kelpfishes Gibbonsia elegans spotted kelpfish
Gibbonsia montereyensis crevice kelpfish
Gibbonsia erythra scarlet kelpfish
sculpins Artedius spp. artedius sculpins (6 species)
Orthonopias triacis snubnbose sculpin
flatfishes Paralichthys californicus California halibut
Citharichthys stigmaeus speckled sanddab
Citharichthys sordidus Pacific sanddab
Platichthys stellatus starry flounder
monkeyface prickleback Cebidichthys violaceus monkeyface prickleback
combtooth blennies Hypsoblennius gentilis bay blenny
Hypsoblennius gilberti rockpool blenny
Hypsoblennius jenkinsi mussel blenny
clingfish Gobiesox spp. clingfishes (4 species)
anchovies Engraulis mordax northern anchovy
Anchoa spp bay anchovies (2 species)
croakers Seriphus politus queenfish
Genyonemus lineatus white croaker
gobies Lepidogobius lepidus bay goby
Acanthogobius flavimanus yellowfin goby
Clevelandia iosIlypnus gilbertiQuietula y-cauda
CIQ goby complex
silversides Leuristhes tenuis California grunion
Atherinopsis californiensis jacksmelt
Atherinops affinis topsmelt
Pacific barracuda Sphyraena argentea California barracuda
rockfishes Sebastes spp. scorpionfishes (approximately 57 species)
cabezon Scorpaenichthys marmoratus cabezon
sea basses Paralabrax clathratus kelp bass
Paralabrax nebulifer sand bass
Paralabrax maculatofasciatus spotted sand bass
pricklebacks Stichaeidae pricklebacks (approximately 11 species)
Length-Specific Screen Entrainment Analysis
ESLO2013-017.4
Bechtel Power Screen Entrainment Analysis 8
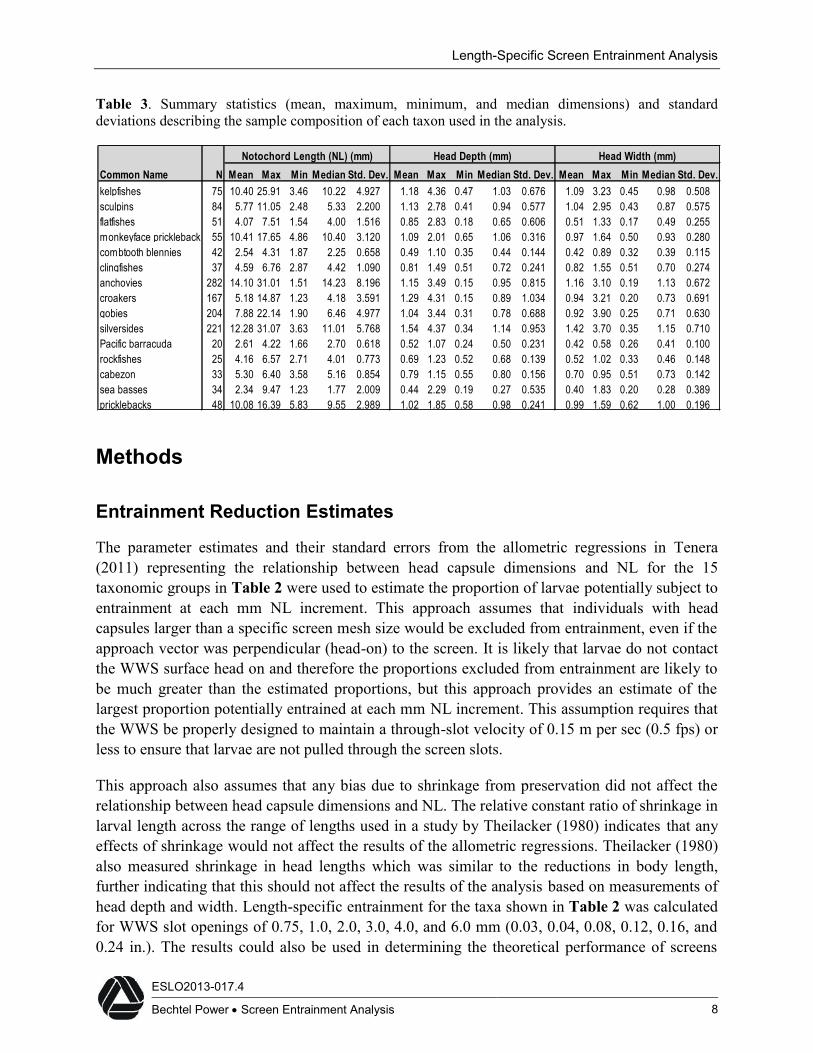
Table 3. Summary statistics (mean, maximum, minimum, and median dimensions) and standarddeviations describing the sample composition of each taxon used in the analysis.
Methods
Entrainment Reduction Estimates
The parameter estimates and their standard errors from the allometric regressions in Tenera(2011) representing the relationship between head capsule dimensions and NL for the 15taxonomic groups in Table 2 were used to estimate the proportion of larvae potentially subject toentrainment at each mm NL increment. This approach assumes that individuals with headcapsules larger than a specific screen mesh size would be excluded from entrainment, even if theapproach vector was perpendicular (head-on) to the screen. It is likely that larvae do not contactthe WWS surface head on and therefore the proportions excluded from entrainment are likely tobe much greater than the estimated proportions, but this approach provides an estimate of thelargest proportion potentially entrained at each mm NL increment. This assumption requires thatthe WWS be properly designed to maintain a through-slot velocity of 0.15 m per sec (0.5 fps) orless to ensure that larvae are not pulled through the screen slots.
This approach also assumes that any bias due to shrinkage from preservation did not affect therelationship between head capsule dimensions and NL. The relative constant ratio of shrinkage inlarval length across the range of lengths used in a study by Theilacker (1980) indicates that anyeffects of shrinkage would not affect the results of the allometric regressions. Theilacker (1980)also measured shrinkage in head lengths which was similar to the reductions in body length,further indicating that this should not affect the results of the analysis based on measurements ofhead depth and width. Length-specific entrainment for the taxa shown in Table 2 was calculatedfor WWS slot openings of 0.75, 1.0, 2.0, 3.0, 4.0, and 6.0 mm (0.03, 0.04, 0.08, 0.12, 0.16, and0.24 in.). The results could also be used in determining the theoretical performance of screens
Common Name N Mean Max Min Median Std. Dev. Mean Max Min Median Std. Dev. Mean Max Min Median Std. Dev.kelpfishes 75 10.40 25.91 3.46 10.22 4.927 1.18 4.36 0.47 1.03 0.676 1.09 3.23 0.45 0.98 0.508sculpins 84 5.77 11.05 2.48 5.33 2.200 1.13 2.78 0.41 0.94 0.577 1.04 2.95 0.43 0.87 0.575flatfishes 51 4.07 7.51 1.54 4.00 1.516 0.85 2.83 0.18 0.65 0.606 0.51 1.33 0.17 0.49 0.255monkeyface prickleback 55 10.41 17.65 4.86 10.40 3.120 1.09 2.01 0.65 1.06 0.316 0.97 1.64 0.50 0.93 0.280combtooth blennies 42 2.54 4.31 1.87 2.25 0.658 0.49 1.10 0.35 0.44 0.144 0.42 0.89 0.32 0.39 0.115clingfishes 37 4.59 6.76 2.87 4.42 1.090 0.81 1.49 0.51 0.72 0.241 0.82 1.55 0.51 0.70 0.274anchovies 282 14.10 31.01 1.51 14.23 8.196 1.15 3.49 0.15 0.95 0.815 1.16 3.10 0.19 1.13 0.672croakers 167 5.18 14.87 1.23 4.18 3.591 1.29 4.31 0.15 0.89 1.034 0.94 3.21 0.20 0.73 0.691gobies 204 7.88 22.14 1.90 6.46 4.977 1.04 3.44 0.31 0.78 0.688 0.92 3.90 0.25 0.71 0.630silversides 221 12.28 31.07 3.63 11.01 5.768 1.54 4.37 0.34 1.14 0.953 1.42 3.70 0.35 1.15 0.710Pacific barracuda 20 2.61 4.22 1.66 2.70 0.618 0.52 1.07 0.24 0.50 0.231 0.42 0.58 0.26 0.41 0.100rockfishes 25 4.16 6.57 2.71 4.01 0.773 0.69 1.23 0.52 0.68 0.139 0.52 1.02 0.33 0.46 0.148cabezon 33 5.30 6.40 3.58 5.16 0.854 0.79 1.15 0.55 0.80 0.156 0.70 0.95 0.51 0.73 0.142sea basses 34 2.34 9.47 1.23 1.77 2.009 0.44 2.29 0.19 0.27 0.535 0.40 1.83 0.20 0.28 0.389pricklebacks 48 10.08 16.39 5.83 9.55 2.989 1.02 1.85 0.58 0.98 0.241 0.99 1.59 0.62 1.00 0.196
Notochord Length (NL) (mm) Head Depth (mm) Head Width (mm)

Length-Specific Screen Entrainment Analysis
ESLO2013-017.4
Bechtel Power Screen Entrainment Analysis 9
with rectangular screen mesh, but would need to be adjusted to provide estimates for screenswith square mesh openings.
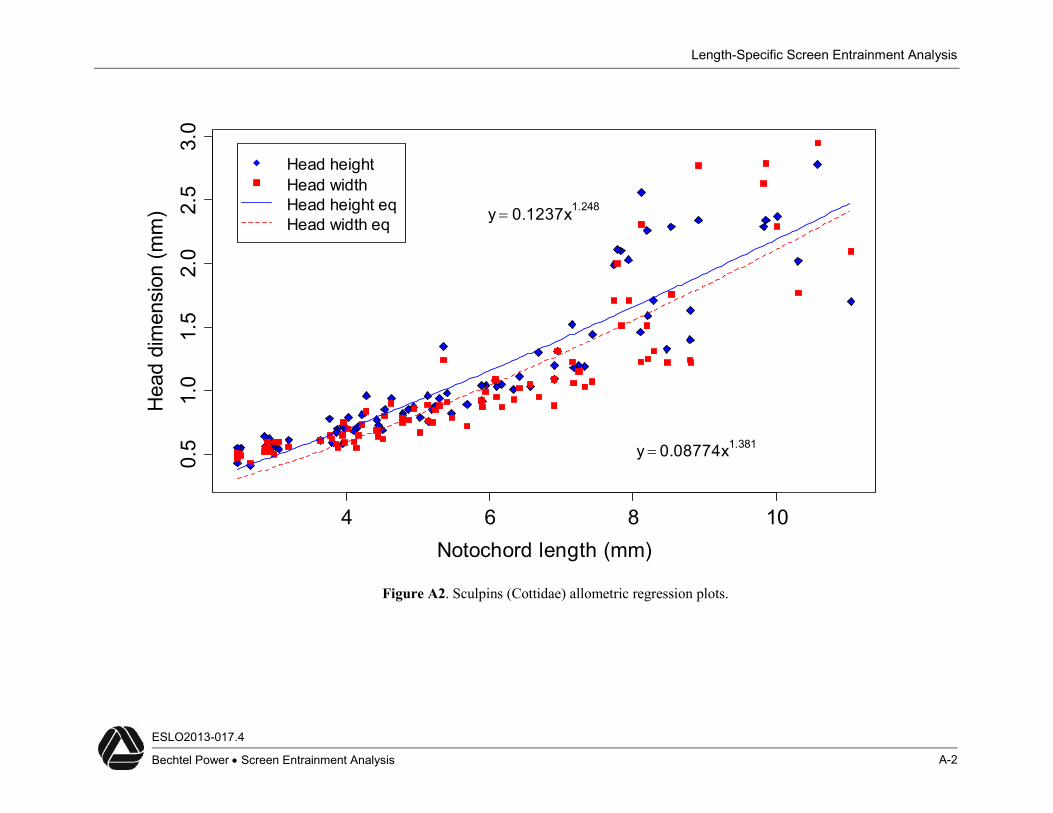
The proportion of larvae entrained at each mm NL increment for the six slot widths wereestimated using the variability (standard errors) around the estimated head capsule width anddepth at each mm NL using the allometric regressions from the analysis in Tenera (2011)(Table 4). To account for the effects of variation on head capsule dimension at each length,10,000 estimates of head width and head depth for each mm NL (from a minimum up to amaximum NL determined for the taxon) were computer-generated using the estimated standarderrors for each regression parameter. Errors were assumed to be normally distributed. For eachmm NL, the proportion of larvae potentially subject to entrainment was determined as theproportion of the 10,000 values that were less than the selected WWS slot size, with the finalestimate being the larger value of either the head width or the head depth. The 10,000 estimateswere calculated 1,000 times using randomly selected values within ±0.5 mm of each length.Although the summary statistics on the head capsule dimensions show that the average headdepth is greater than head width for all 15 taxa groups (Table 3), the multiple randomizationsprovided estimates that covered the wide range of variation in the regressions for some of thetaxa. For example, although the average head depth is slightly greater than the head width forsculpins (Table 3), the multiple randomizations accounted for the wide range of variation andoverlap among the values for head depth and width shown in the regression (Figure A2). Theaverage proportion and standard error were calculated from the 1,000 estimates calculated foreach mm NL increment.
The proportions were calculated over a range of larval lengths that approximately correspondedto the range that would be potentially entrainable. The minimum lengths for the taxa were basedon the smallest larvae measured from the studies (Table 3). The maximum was set at either 20 or25 mm NL depending on the fish taxon. While a few larvae larger than 20–25 mm were collectedduring the sampling, larger larvae have characteristics (e.g., presence of head and opercularspines) that would likely bias entrainment probabilities based only on larval head capsulemeasurements. Fishes at this size also have swimming abilities that may allow them to avoidentrainment, especially at reduced intake velocities that could be used at plants retrofitting withfine-mesh screens or WWS.
The proportional entrainment across the size range of entrainable larvae for a taxon can be usedto assess the effects on population mortality for a particular WWS slot dimension using thefollowing two simple assumptions: 1) linear growth over time, and 2) constant exponentialnatural mortality. These assumptions are reasonable because the time period being evaluated islikely to be very short. The time period may only be a few days for fishes that are only subject toentrainment over a narrow size range, but would likely never extend beyond one or two months.By assuming linear growth during this narrow time period, length becomes directly proportionalto age. As a larval cohort subsequently progresses through consecutive length classes it continuesto decrease in numbers over time due to natural mortality. Under these assumptions, each lengthclass (or age class), including the larvae susceptible to entrainment, results in an identical
Length-Specific Screen Entrainment Analysis
ESLO2013-017.4
Bechtel Power Screen Entrainment Analysis 10
number of fishes at a later time and size where they are not subject to entrainment. This isbecause the numbers at each length (or age) class G that survive are directly proportional to thereduced population size at some later time, Nt. where:= → →where S is survival over indicated time period, → are the numbers of length (age) classG surviving entrainment and is the initial cohort size.
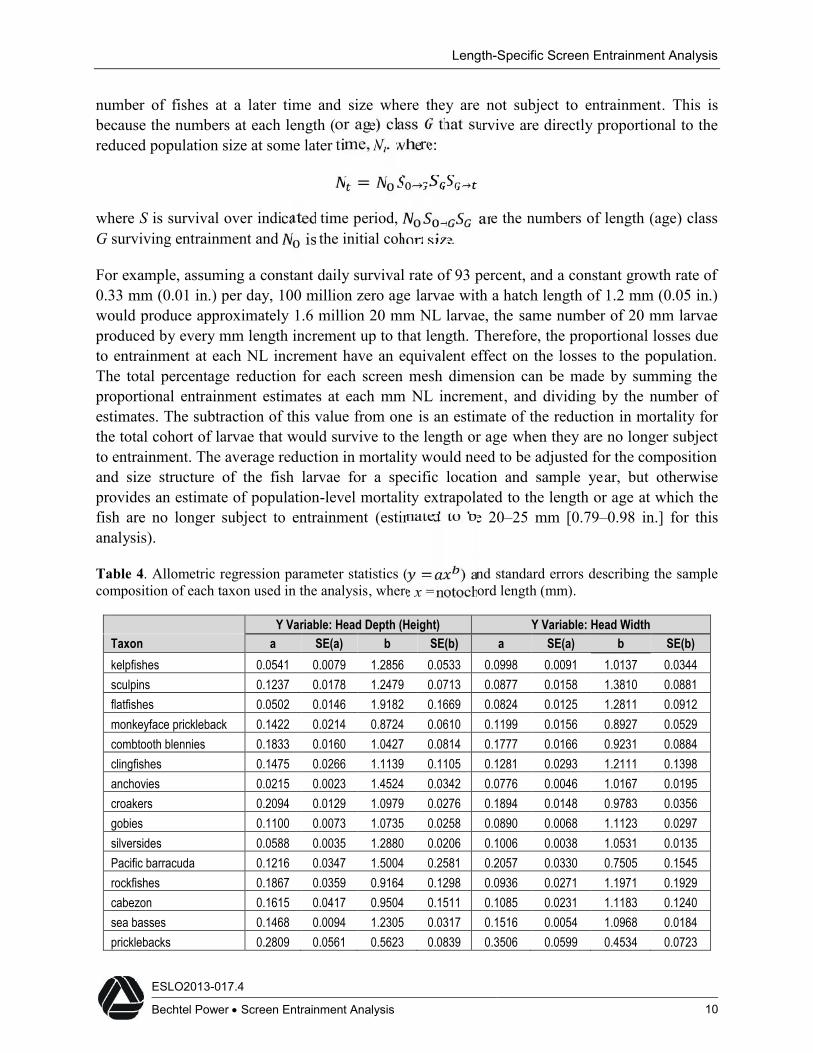
For example, assuming a constant daily survival rate of 93 percent, and a constant growth rate of0.33 mm (0.01 in.) per day, 100 million zero age larvae with a hatch length of 1.2 mm (0.05 in.)would produce approximately 1.6 million 20 mm NL larvae, the same number of 20 mm larvaeproduced by every mm length increment up to that length. Therefore, the proportional losses dueto entrainment at each NL increment have an equivalent effect on the losses to the population.The total percentage reduction for each screen mesh dimension can be made by summing theproportional entrainment estimates at each mm NL increment, and dividing by the number ofestimates. The subtraction of this value from one is an estimate of the reduction in mortality forthe total cohort of larvae that would survive to the length or age when they are no longer subjectto entrainment. The average reduction in mortality would need to be adjusted for the compositionand size structure of the fish larvae for a specific location and sample year, but otherwiseprovides an estimate of population-level mortality extrapolated to the length or age at which thefish are no longer subject to entrainment (estimated to be 20–25 mm [0.79–0.98 in.] for thisanalysis).
Table 4. Allometric regression parameter statistics ( = ) and standard errors describing the samplecomposition of each taxon used in the analysis, where x = notochord length (mm).
Y Variable: Head Depth (Height) Y Variable: Head WidthTaxon a SE(a) b SE(b) a SE(a) b SE(b)kelpfishes 0.0541 0.0079 1.2856 0.0533 0.0998 0.0091 1.0137 0.0344sculpins 0.1237 0.0178 1.2479 0.0713 0.0877 0.0158 1.3810 0.0881flatfishes 0.0502 0.0146 1.9182 0.1669 0.0824 0.0125 1.2811 0.0912monkeyface prickleback 0.1422 0.0214 0.8724 0.0610 0.1199 0.0156 0.8927 0.0529combtooth blennies 0.1833 0.0160 1.0427 0.0814 0.1777 0.0166 0.9231 0.0884clingfishes 0.1475 0.0266 1.1139 0.1105 0.1281 0.0293 1.2111 0.1398anchovies 0.0215 0.0023 1.4524 0.0342 0.0776 0.0046 1.0167 0.0195croakers 0.2094 0.0129 1.0979 0.0276 0.1894 0.0148 0.9783 0.0356gobies 0.1100 0.0073 1.0735 0.0258 0.0890 0.0068 1.1123 0.0297silversides 0.0588 0.0035 1.2880 0.0206 0.1006 0.0038 1.0531 0.0135Pacific barracuda 0.1216 0.0347 1.5004 0.2581 0.2057 0.0330 0.7505 0.1545rockfishes 0.1867 0.0359 0.9164 0.1298 0.0936 0.0271 1.1971 0.1929cabezon 0.1615 0.0417 0.9504 0.1511 0.1085 0.0231 1.1183 0.1240sea basses 0.1468 0.0094 1.2305 0.0317 0.1516 0.0054 1.0968 0.0184pricklebacks 0.2809 0.0561 0.5623 0.0839 0.3506 0.0599 0.4534 0.0723

Length-Specific Screen Entrainment Analysis
ESLO2013-017.4
Bechtel Power Screen Entrainment Analysis 11
Calculation of Site-Specific Estimates for DCPP and SONGS
The differences in the sampling frequency at DCPP and SONGS required that differentapproaches be taken when estimating the potential entrainment reductions resulting fromdifferent mesh or WWS slot openings at the two plants. The data for the analyses previouslydescribed were derived from larvae sampled from several sites over several years. This was doneto ensure that the estimates covered the full length range of entrainable larvae, since moststudies, including the study at SONGS, only sampled monthly or biweekly. An exception wasthe sampling for the entrainment studies at DCPP which started in October 1996 and continuedthrough June 1999 was conducted weekly at four stations in front of the intake structure. Thesampling also occurred every three hours resulting in the collection of over 4,600 planktonsamples. Many of the larvae collected from the entrainment samples were measured, resulting ina large number of NL measurements for certain taxa that are likely representative of thecomplete size ranges of larvae entrained at the plant. At DCPP, the large amount of data allowsfor a site-specific approach for calculating screening efficiency, whereas the estimates forSONGS should be based on the database derived from multiple sites. This difference inapproaches is also appropriate since the taxonomic composition of the data collected at SONGSwas similar to the data from other plants in southern California, whereas the composition atDCPP was different due to its location north of Point Conception in central California.
Even with the large sample sizes at DCPP, only the most abundant larvae were measured,therefore, detailed length-specific entrainment adjustments were only calculated for seven of theentrained taxonomic categories of fishes. For these seven taxa, the percentages of larvae at eachmm NL from the length frequency distribution of the larvae collected at DCPP were used withthe annual entrainment estimates for the same taxon to estimate the numbers entrained by lengthcategory. The estimates of the proportional entrainment for the six mesh or slot openings werethen used to determine the reductions in entrainment for each taxon. The estimated population-level reductions for these taxa, assuming constant growth and survival rates to the length or ageat which the fish are no longer subject to entrainment were adjusted for the range of sizes oflarvae collected.
Results
Individual Taxa
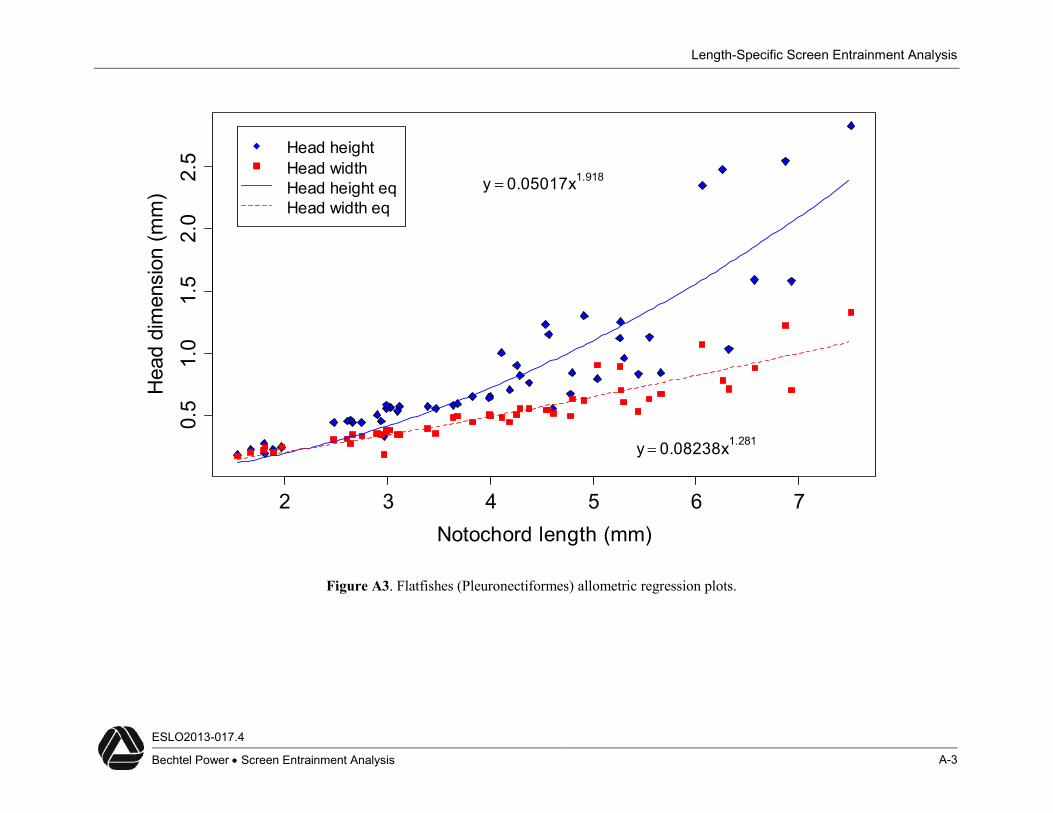
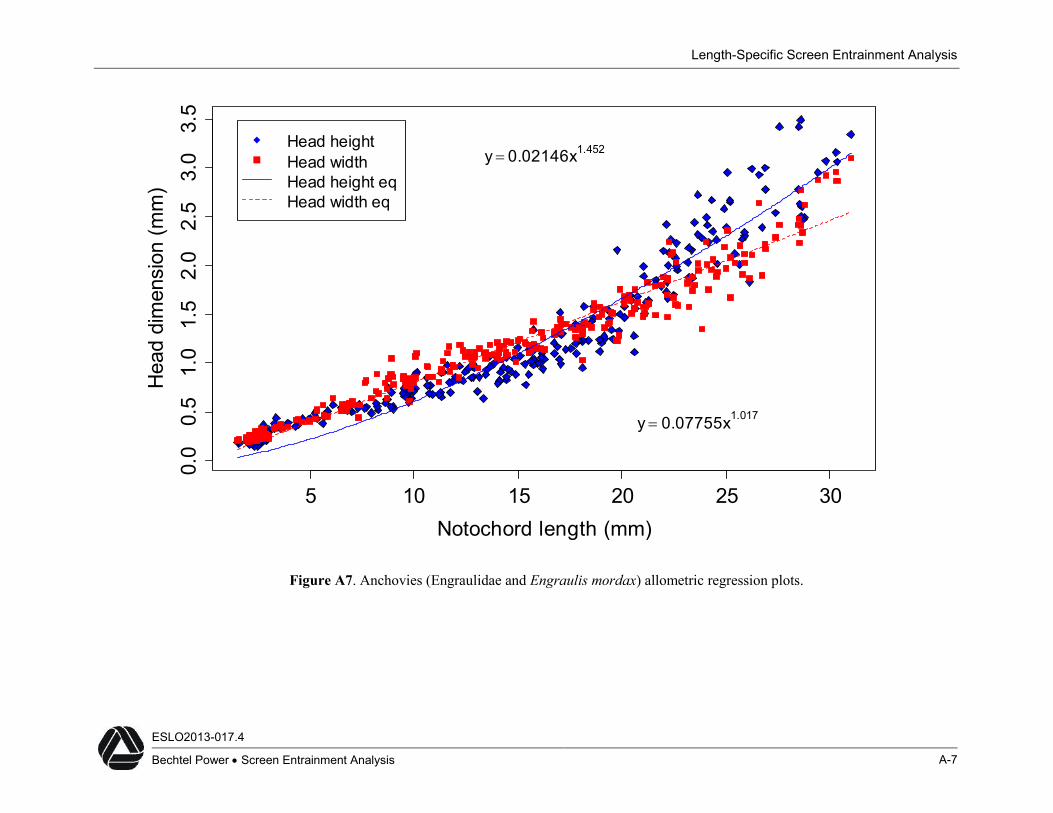
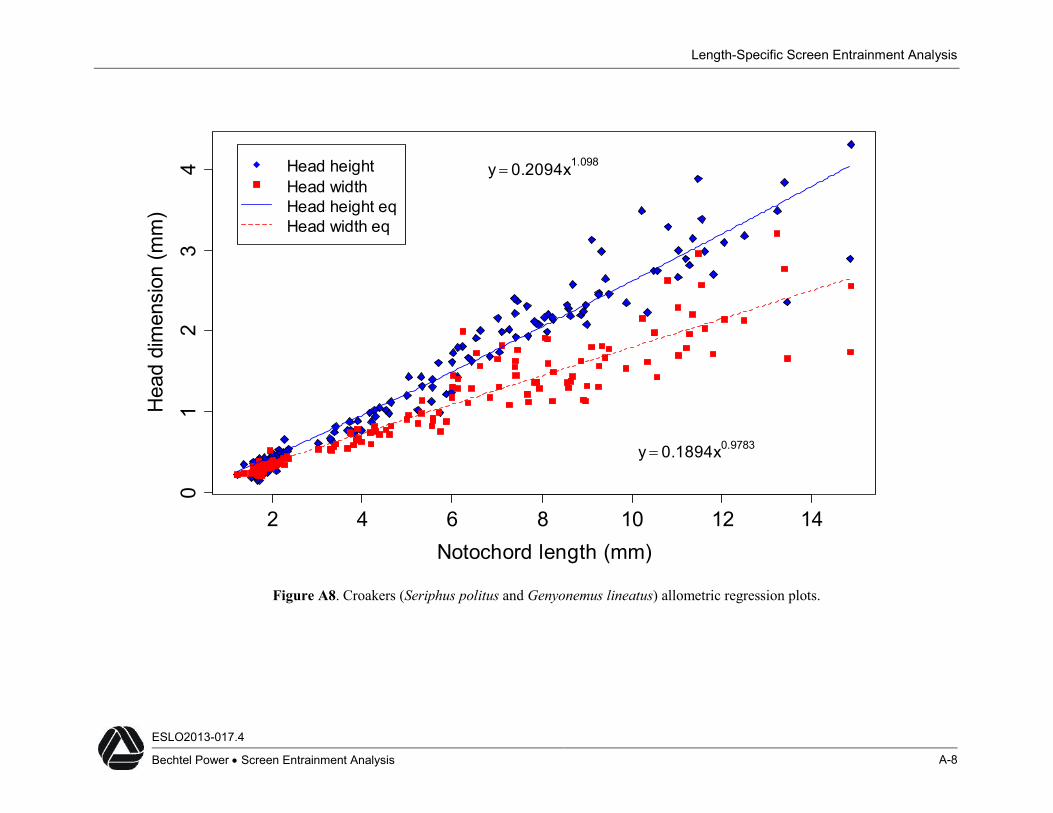
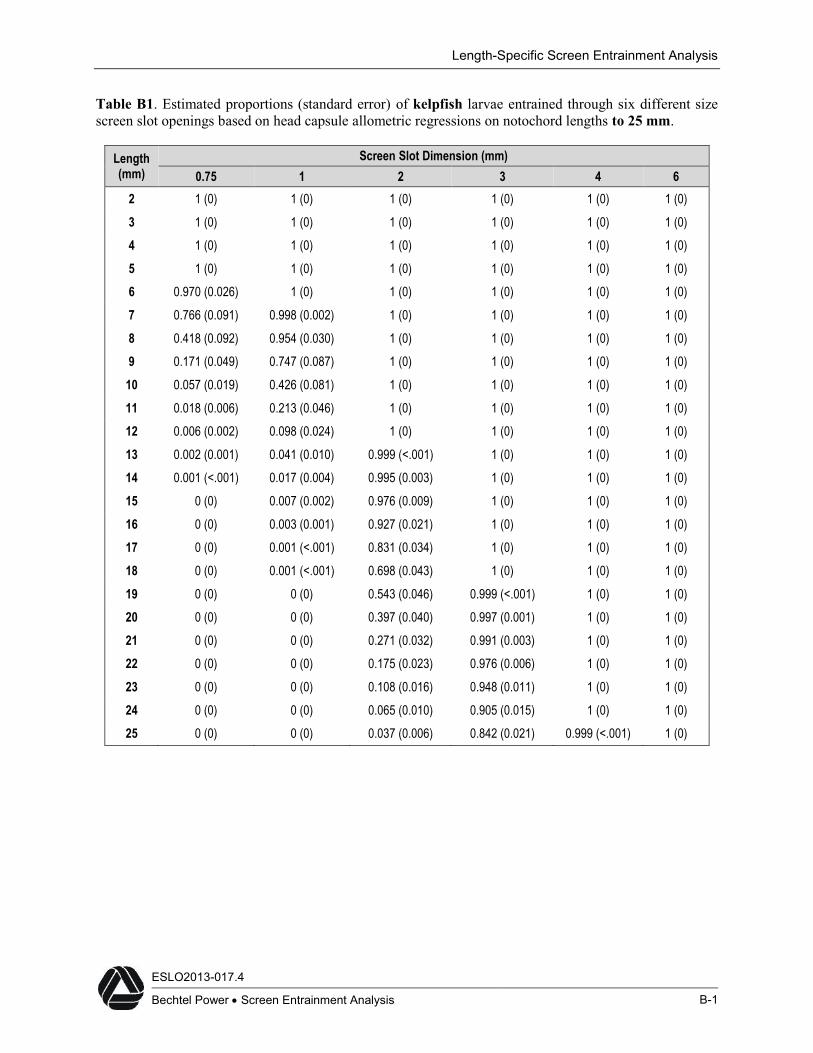
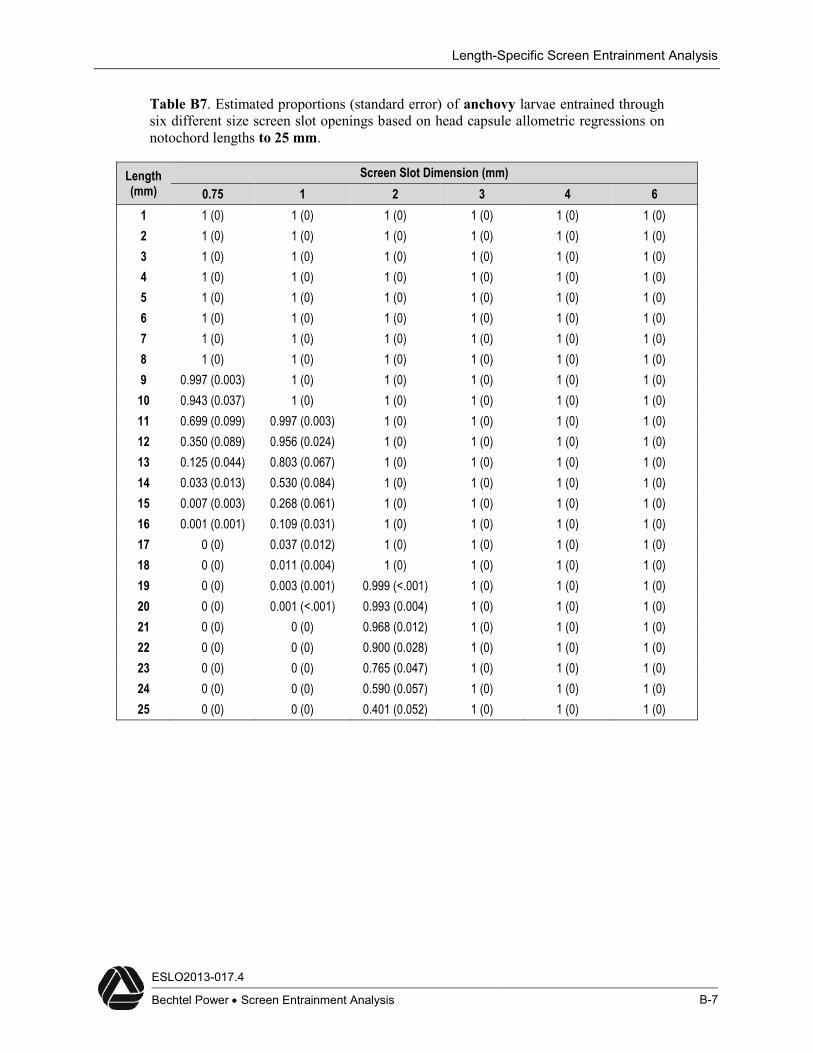
The statistics and parameters resulting from the allometric regressions of head capsuledimensions as a function of NL from Tenera (2011) shown in Table 4 (dispersion plots of thedata for each taxon from Tenera [2011] are shown in Appendix A) were used to calculate theproportional entrainment estimates through six WWS slot openings for the 15 larval taxa shownin Appendix B. The data used in the regressions (Table 3 and Figures A1–A15) encompassedthe entire length range of the estimates in Appendix B for taxa such as kelpfishes (Figure A1and Table B1), monkeyface pricklebacks (Figure A4 and Table B4), anchovies (Figure A7 andTable B7), croakers (Figure A8 and Table B8), and gobies (Figure A9 and Table B9), but
Length-Specific Screen Entrainment Analysis
ESLO2013-017.4
Bechtel Power Screen Entrainment Analysis 12
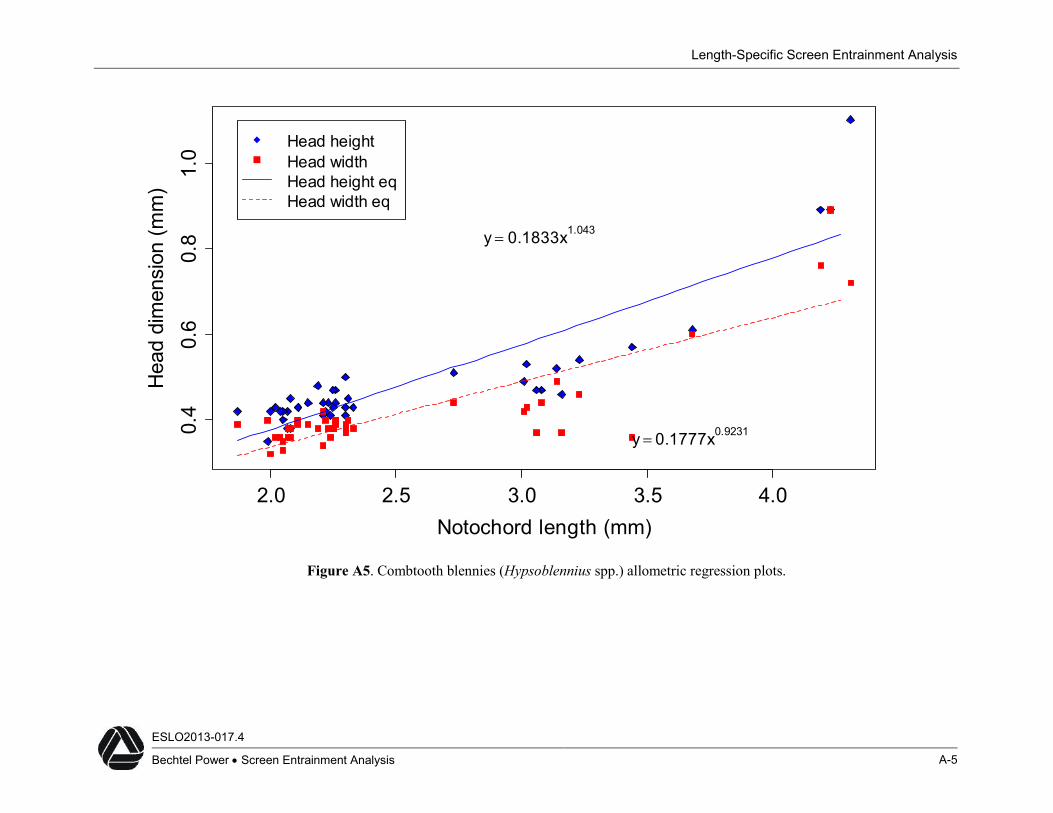
covered only a limited range of the estimates for other taxa such as combtooth blennies(Figure A5 and Table B5), clingfishes (Figure A6 and Table B6), rockfishes (Figure A12 andTable B12), and cabezon (Figure A13 and Table B13). The NL range measured for fishes suchas combtooth blennies does reflect actual entrainment results from several studies showing thatthe larvae for this taxonomic group are only collected when they are small, typically less than 5mm (0.20 in.). Therefore, any use of the estimated proportions entrained for larvae larger thanthe maximum value shown in Table 3 should consider the level of uncertainty associated withthese extrapolated values. This should not normally be a problem as the length ranges in Table 3are reflective of the length range of larvae collected from studies in California. Also, in practice,the estimated proportional entrainment at each mm NL increment would be applied to a set ofsite-specific data to obtain estimates for a particular plant as is done below for DCPP.
Extrapolated Population-Level Efficiency
The estimates of proportional entrainment at each mm NL increment for the six WWS slotopenings in Appendix B were used to estimate the reductions in mortality for the populationsurviving past the size when the larvae would be subject to entrainment (Table 5). The estimateswere extrapolated to the total population when the larvae are at a NL of 20 or 25 mm (0.79 or0.98 in); a size when the larvae are likely to not be susceptible to entrainment due to maturingmusculature and increased swimming ability. Although, population-level reductions in mortalitywere estimated based on a NL of 20 or 25 mm (0.79 or 0.98 in), the summary of the length dataon larvae from the entrainment studies indicates that larvae for many of the taxonomic groupsare not entrained at larger sizes (Table 3). As a result, the entrainment for larger larvae isessentially zero for these taxa. For example, if the results for combtooth blennies (Table B5)were adjusted based on the length distribution of the entrained larvae, the estimate of thepopulation-level effects of the smaller 0.75 and 1 mm (0.03 and 0.04 in.) WWS slot openingswould increase since all of the proportions past a size of 5 or 6 mm (0.20 or 0.24 in.) would notbe included in the calculations. Conversely, there would be no population-level benefits to theother larger slot openings as all of the larvae smaller than 6 mm (0.24 in.) are entrained. As aresult, it is important to adjust estimates of proportional entrainment based on the compositionand size structure of the fish larvae for a specific location and sample year to provide estimatesof population-level reductions in mortality, as is done for DCPP below.
Estimated Effectiveness at DCPP and SONGS
The results for the individual taxa in Appendix B were used to estimate reductions inentrainment for the six WWS slot sizes for each of the 15 taxa that were collected duringsampling at DCPP and SONGS, the two nuclear-fueled facilities in California. As mentionedpreviously, the methods used to estimate the reductions for the two facilities are different due tothe taxonomic composition and data available from the studies, and, therefore, are presentedseparately.
Length-Specific Screen Entrainment Analysis
ESLO2013-017.4
Bechtel Power Screen Entrainment Analysis 13
DCPPEntrainment sampling at DCPP was conducted from October 1996 through June 1999. Resultsfor the fishes analyzed for this study are from two consecutive 12-month periods, andemphasizes the considerable annual variation that can occur in composition and abundancebetween periods (Table 6). The difference between periods was likely attributable to theoccurrence of a major El Niño that started developing in late 1997 and extended into 1998,which affected reproduction and larval survival during the 1998 spawning season. The fishesanalyzed for this study accounted for approximately 72 and 69 percent, respectively, of the totalestimated larvae from the two periods (Table 6).
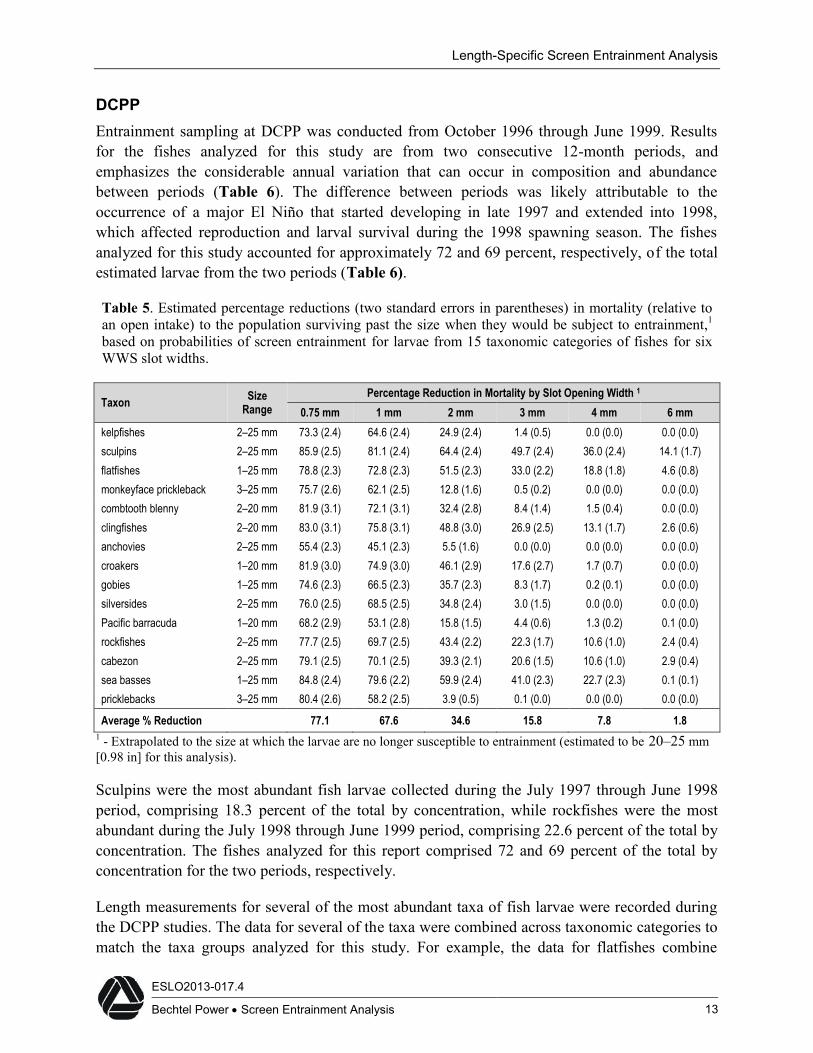
Table 5. Estimated percentage reductions (two standard errors in parentheses) in mortality (relative toan open intake) to the population surviving past the size when they would be subject to entrainment,1based on probabilities of screen entrainment for larvae from 15 taxonomic categories of fishes for sixWWS slot widths.
Taxon SizeRange
Percentage Reduction in Mortality by Slot Opening Width 1
0.75 mm 1 mm 2 mm 3 mm 4 mm 6 mmkelpfishes 2–25 mm 73.3 (2.4) 64.6 (2.4) 24.9 (2.4) 1.4 (0.5) 0.0 (0.0) 0.0 (0.0)sculpins 2–25 mm 85.9 (2.5) 81.1 (2.4) 64.4 (2.4) 49.7 (2.4) 36.0 (2.4) 14.1 (1.7)flatfishes 1–25 mm 78.8 (2.3) 72.8 (2.3) 51.5 (2.3) 33.0 (2.2) 18.8 (1.8) 4.6 (0.8)monkeyface prickleback 3–25 mm 75.7 (2.6) 62.1 (2.5) 12.8 (1.6) 0.5 (0.2) 0.0 (0.0) 0.0 (0.0)combtooth blenny 2–20 mm 81.9 (3.1) 72.1 (3.1) 32.4 (2.8) 8.4 (1.4) 1.5 (0.4) 0.0 (0.0)clingfishes 2–20 mm 83.0 (3.1) 75.8 (3.1) 48.8 (3.0) 26.9 (2.5) 13.1 (1.7) 2.6 (0.6)anchovies 2–25 mm 55.4 (2.3) 45.1 (2.3) 5.5 (1.6) 0.0 (0.0) 0.0 (0.0) 0.0 (0.0)croakers 1–20 mm 81.9 (3.0) 74.9 (3.0) 46.1 (2.9) 17.6 (2.7) 1.7 (0.7) 0.0 (0.0)gobies 1–25 mm 74.6 (2.3) 66.5 (2.3) 35.7 (2.3) 8.3 (1.7) 0.2 (0.1) 0.0 (0.0)silversides 2–25 mm 76.0 (2.5) 68.5 (2.5) 34.8 (2.4) 3.0 (1.5) 0.0 (0.0) 0.0 (0.0)Pacific barracuda 1–20 mm 68.2 (2.9) 53.1 (2.8) 15.8 (1.5) 4.4 (0.6) 1.3 (0.2) 0.1 (0.0)rockfishes 2–25 mm 77.7 (2.5) 69.7 (2.5) 43.4 (2.2) 22.3 (1.7) 10.6 (1.0) 2.4 (0.4)cabezon 2–25 mm 79.1 (2.5) 70.1 (2.5) 39.3 (2.1) 20.6 (1.5) 10.6 (1.0) 2.9 (0.4)sea basses 1–25 mm 84.8 (2.4) 79.6 (2.2) 59.9 (2.4) 41.0 (2.3) 22.7 (2.3) 0.1 (0.1)pricklebacks 3–25 mm 80.4 (2.6) 58.2 (2.5) 3.9 (0.5) 0.1 (0.0) 0.0 (0.0) 0.0 (0.0)
Average % Reduction 77.1 67.6 34.6 15.8 7.8 1.81 - Extrapolated to the size at which the larvae are no longer susceptible to entrainment (estimated to be 20–25 mm[0.98 in] for this analysis).
Sculpins were the most abundant fish larvae collected during the July 1997 through June 1998period, comprising 18.3 percent of the total by concentration, while rockfishes were the mostabundant during the July 1998 through June 1999 period, comprising 22.6 percent of the total byconcentration. The fishes analyzed for this report comprised 72 and 69 percent of the total byconcentration for the two periods, respectively.
Length measurements for several of the most abundant taxa of fish larvae were recorded duringthe DCPP studies. The data for several of the taxa were combined across taxonomic categories tomatch the taxa groups analyzed for this study. For example, the data for flatfishes combine

Length-Specific Screen Entrainment Analysis
ESLO2013-017.4
Bechtel Power Screen Entrainment Analysis 14
length measurements on species and generic groupings of sanddabs with California halibut,English sole, and family-level groups such as Pleuronectidae, and the data for rockfishes arecombined across species and species groupings that are distinguished based on larvalmorphology. The summary of the data in Table 7 shows that for all of the taxa except anchovies,almost all of the larvae (99th percentile) were much smaller than the range of lengths shown inAppendix Tables B1–B15. For example, the largest rockfish and cabezon larvae measured wereonly 10.2 (0.40 in.) and 8.4 mm (0.33 in.), respectively. The length frequency distribution of thelarvae for these taxa show that for sculpins, rockfishes, cabezon, and flatfishes, over 90% of thelarvae were 6 mm (0.24 in.) or less (Table 7).
Table 6. Average concentrations of fish larvae collected during entrainment sampling and annualentrainment estimates at DCPP for two year-long study periods: July 1997–June 1998 and July 1998–June 1999. The annual entrainment estimates were based on actual plant cooling water volumes duringthe periods.
1997–1998 1998–1999
Common Name
AverageConcentration(# / 1,000 m3)
Percent ofTotal
Concentration
Total AnnualEntrainment
Estimate
AverageConcentration(# / 1,000 m3)
Percent ofTotal
Concentration
Total AnnualEntrainment
Estimatesculpins 80.57 18.3% 281,090,063 55.17 18.9% 276,345,912rockfishes 65.27 14.8% 216,878,458 66.06 22.6% 374,596,029kelpfishes 36.88 8.4% 121,977,076 23.36 8.0% 90,774,143monkeyface prickleback 32.61 7.4% 118,960,221 24.30 8.3% 127,721,405northern anchovy 31.02 7.0% 106,375,289 1.27 0.4% 3,209,133gobies 22.45 5.1% 77,134,182 6.77 2.3% 22,413,173croakers 18.03 4.1% 67,033,233 4.89 1.7% 21,431,357flatfishes 12.11 2.8% 45,128,059 5.22 1.8% 19,245,735pricklebacks 9.52 2.2% 35,579,099 5.76 2.0% 33,382,111cabezon 3.90 0.9% 14,707,340 1.83 0.6% 9,189,686clingfishes 0.28 0.1% 989,753 1.13 0.4% 4,728,863combtooth blennies 2.03 0.5% 7,154,897 4.43 1.5% 10,673,514silversides 0.18 0.0% 482,917 0.08 0.0% 97,072sea basses 0.02 0.0% 64,552 0.00 0.0% -Subtotal 314.87 71.6% 1,093,555,139 200.24 68.6% 993,808,134Other Taxa (54 and 40) 125.19 28.4% 422,730,243 91.86 31.4% 292,431,756Total 440.06 1,516,285,382 292.10 1,286,239,890

Length-Specific Screen Entrainment Analysis
ESLO2013-017.4
Bechtel Power Screen Entrainment Analysis 15
Table 7. Summary of notochord length (NL) measurements for seven taxa of larval fishes collectedduring entrainment sampling at DCPP from October 1996 through June 1999.Only fishes up to 25 mm(0.98 in) NL length were included in the analysis.
Taxon N
MeanLength(mm)
StandardDeviation
Upper 95%Confidence
Interval(mm)
MinimumLength(mm)
MaximumLength(mm)
MedianLength(mm)
99thPercentile
Length(mm)
sculpins 10,173 3.5 0.7 3.5 1.6 11.8 3.3 6.1rockfishes 13,105 4.1 0.5 4.1 1.7 10.2 4.1 5.3kelpfishes 7,331 6.4 1.7 6.4 2.4 23.4 6.0 12.0monkeyface prickleback 5,909 7.3 1.2 7.4 2.8 24.6 7.0 12.0anchovies 2,527 6.0 4.9 6.1 1.6 25.4 3.7 23.4cabezon 1,537 4.8 0.5 4.8 2.3 8.4 4.7 6.1flatfishes 394 3.0 1.3 3.1 1.3 8.0 2.7 7.7
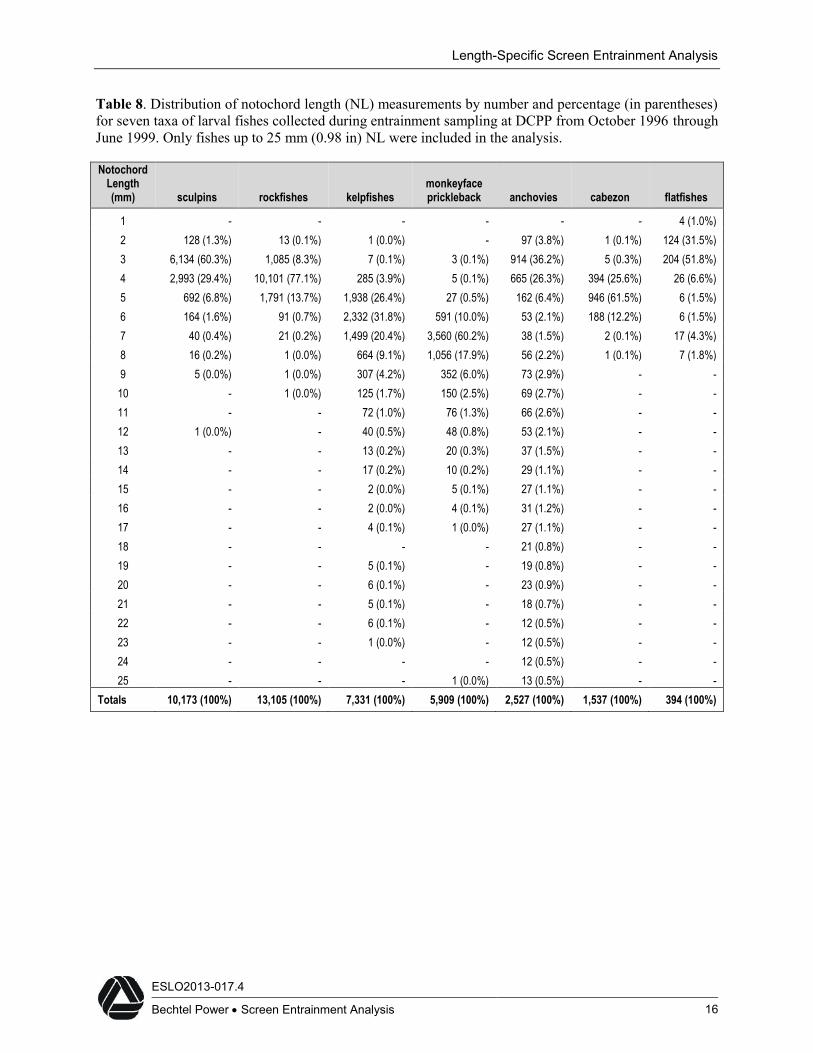
The estimated percentages of larvae for each mm NL increment (Table 8) were used to calculatethe entrainment for each length based on the total annual entrainment estimates for the twoperiods shown in Table 9. The estimates of proportional entrainment for the corresponding mmNL increments provided for the seven taxa in Appendix B were then used to calculate estimatesof entrainment for the six WWS slot openings, also shown in Table 9. The results show thatbased on the number of larvae excluded across all length categories there would be very littlereduction in total entrainment for all but the smallest slot widths relative to the total estimatedentrainment for the two periods.
The estimated entrainment reductions in Table 9 for total larvae across all size classes,incorporates the length frequency distribution of the larvae at DCPP. The estimated population-level reductions in entrainment mortality in Table 4 were calculated across all the NL incrementsup to the maximum lengths of 20 or 25 mm (0.79 or 0.98 in), and therefore, does not incorporatethe DCPP length frequency data showing that some fishes are not subject to entrainment at largersizes (Table 7). As a result, the effective population-level reductions for the six slot openingsbased on the length range of the larvae in Table 6 were used to recalculate the population-levelreductions shown in Table 10. While these estimates are larger than the reductions based on theactual reductions in entrainment by slot width in Table 9, they are less than the estimates inTable 4, which assumed entrainment occurred up to a NL of 20 or 25 mm (0.79 or 0.98 in). Theresults show very little benefit of screen or slot openings larger than 2 mm (0.08 in) for thesefishes. The results in Table 10 for anchovies are identical to the estimates in Table 4 because, asshown in Table 8, the larvae for that taxon were entrained across the same range of lengths usedin the generalized analysis.
Length-Specific Screen Entrainment Analysis
ESLO2013-017.4
Bechtel Power Screen Entrainment Analysis 16
Table 8. Distribution of notochord length (NL) measurements by number and percentage (in parentheses)for seven taxa of larval fishes collected during entrainment sampling at DCPP from October 1996 throughJune 1999. Only fishes up to 25 mm (0.98 in) NL were included in the analysis.
NotochordLength(mm) sculpins rockfishes kelpfishes
monkeyfaceprickleback anchovies cabezon flatfishes
1 - - - - - - 4 (1.0%)2 128 (1.3%) 13 (0.1%) 1 (0.0%) - 97 (3.8%) 1 (0.1%) 124 (31.5%)3 6,134 (60.3%) 1,085 (8.3%) 7 (0.1%) 3 (0.1%) 914 (36.2%) 5 (0.3%) 204 (51.8%)4 2,993 (29.4%) 10,101 (77.1%) 285 (3.9%) 5 (0.1%) 665 (26.3%) 394 (25.6%) 26 (6.6%)5 692 (6.8%) 1,791 (13.7%) 1,938 (26.4%) 27 (0.5%) 162 (6.4%) 946 (61.5%) 6 (1.5%)6 164 (1.6%) 91 (0.7%) 2,332 (31.8%) 591 (10.0%) 53 (2.1%) 188 (12.2%) 6 (1.5%)7 40 (0.4%) 21 (0.2%) 1,499 (20.4%) 3,560 (60.2%) 38 (1.5%) 2 (0.1%) 17 (4.3%)8 16 (0.2%) 1 (0.0%) 664 (9.1%) 1,056 (17.9%) 56 (2.2%) 1 (0.1%) 7 (1.8%)9 5 (0.0%) 1 (0.0%) 307 (4.2%) 352 (6.0%) 73 (2.9%) - -10 - 1 (0.0%) 125 (1.7%) 150 (2.5%) 69 (2.7%) - -11 - - 72 (1.0%) 76 (1.3%) 66 (2.6%) - -12 1 (0.0%) - 40 (0.5%) 48 (0.8%) 53 (2.1%) - -13 - - 13 (0.2%) 20 (0.3%) 37 (1.5%) - -14 - - 17 (0.2%) 10 (0.2%) 29 (1.1%) - -15 - - 2 (0.0%) 5 (0.1%) 27 (1.1%) - -16 - - 2 (0.0%) 4 (0.1%) 31 (1.2%) - -17 - - 4 (0.1%) 1 (0.0%) 27 (1.1%) - -18 - - - - 21 (0.8%) - -19 - - 5 (0.1%) - 19 (0.8%) - -20 - - 6 (0.1%) - 23 (0.9%) - -21 - - 5 (0.1%) - 18 (0.7%) - -22 - - 6 (0.1%) - 12 (0.5%) - -23 - - 1 (0.0%) - 12 (0.5%) - -24 - - - - 12 (0.5%) - -25 - - - 1 (0.0%) 13 (0.5%) - -
Totals 10,173 (100%) 13,105 (100%) 7,331 (100%) 5,909 (100%) 2,527 (100%) 1,537 (100%) 394 (100%)

Length-Specific Screen Entrainment Analysis
ESLO2013-017.4
Bechtel Power Screen Entrainment Analysis 17
Table 9. Estimated total entrainment for seven taxonomic categories of fishes at DCPP for two year-longtime periods: July 1997–June 1998 and July 1998–June 1999, and estimated annual entrainment andpercentage reductions in entrainment for six WWS slot widths.
Taxon Year
AnnualEntrainment
Estimate
Entrainmentwith 0.75mm Slot
Entrainmentwith 1.0 mm
Slot
Entrainmentwith 2.0 mm
Slot
Entrainmentwith 3.0 mm
Slot
Entrainmentwith 4.0 mm
Slot
Entrainmentwith 6.0 mm
Slot
sculpins97-98 281,090,063 250,963,525 272,928,200 280,905,488 281,077,740 281,088,820 281,090,06398-99 276,345,912 246,727,840 268,321,802 276,164,452 276,333,797 276,344,690 276,345,912
Percent Reduction 10.7 2.9 0.1 <0.1 <0.1 0.0
rockfishes97-98 216,878,458 184,049,464 207,640,578 216,852,906 216,877,448 216,878,392 216,878,45898-99 374,596,029 317,893,252 358,640,210 374,551,895 374,594,285 374,595,915 374,596,029
Percent Reduction 15.1 4.3 <0.1 <0.1 <0.1 0.1
kelpfishes97-98 121,977,076 99,498,869 116,388,842 121,704,903 121,972,683 121,977,076 121,977,07698-99 90,774,143 74,046,082 86,615,434 90,571,594 90,770,874 90,774,143 90,774,143
Percent Reduction 18.4 4.6 0.2 <0.1 0.0 0.0
monkeyfaceprickleback
97-98 118,960,221 75,512,079 112,810,990 118,940,270 118,959,255 118,960,201 118,960,22198-99 127,721,405 81,073,394 121,119,296 127,699,985 127,720,367 127,721,383 127,721,405
Percent Reduction 36.5 5.2 <0.1 <0.1 <0.1 0.0
anchovies97-98 106,375,289 92,329,457 96,839,651 105,639,334 106,375,289 106,375,289 106,375,28998-99 3,209,133 2,785,398 2,921,462 3,186,931 3,209,133 3,209,133 3,209,133
Percent Reduction 13.2 9.0 0.7 0.0 0.0 0.0
cabezon97-98 14,707,340 10,576,147 13,674,113 14,705,082 14,707,330 14,707,340 14,707,34098-99 9,189,686 6,608,365 8,544,088 9,188,275 9,189,680 9,189,686 9,189,686
Percent Reduction 28.1 7.0 <0.1 <0.1 0.0 0.0
flatfishes97-98 45,128,059 42,009,412 43,464,849 45,114,887 45,128,059 45,128,059 45,128,05998-99 19,245,735 17,915,728 18,536,427 19,240,118 19,245,735 19,245,735 19,245,735
Percent Reduction 6.9 3.7 <0.1 0.0 0.0 0.0Average Percent Reduction in
Entrainment 18.4 5.2 0.2 <0.1 <0.1 0.0

Length-Specific Screen Entrainment Analysis
ESLO2013-017.4
Bechtel Power Screen Entrainment Analysis 18
Table 10. Estimated percentage reductions (standard errors in parentheses) in mortality (relative to anopen intake) to the population surviving past the size when they would be subject to entrainment,1 basedon probabilities of screen entrainment for larvae from seven taxonomic categories of fishes measuredduring DCPP entrainment studies conducted October 1996 through June 1999. The mortality adjustedfrom the estimates in Table 4 was based on the length range of larvae measured from the studies, exceptfor anchovies and monkeyface pricklebacks.
Percentage Reduction in Mortality by Slot Opening Width 1
Taxon 0.75 mm 1 mm 2 mm 3 mm 4 mm 6 mmsculpins 69.2 (5.4) 58.7 (5.3) 24.3 (4.6) 5.5 (2.2) 0.5 (0.4) 0.0 (0.0)rockfishes 46.2 (5.7) 32.0 (5.0) 5.2 (1.7) 0.5 (0.2) 0.0 (0.0) 0.0 (0.0)kelpfishes 72.1 (2.5) 63.0 (2.5) 21.8 (2.4) 0.8 (0.3) 0.0 (0.0) 0.0 (0.0)monkeyface prickleback 2 62.8 (3.9) 42.2 (3.8) 0.9 (0.4) 0.0 (0.0) 0.0 (0.0) 0.0 (0.0)anchovies * 55.4 (2.3) 45.1 (2.3) 5.5 (1.6) 0.0 (0.0) 0.0 (0.0) 0.0 (0.0)cabezon 36.3 (7.2) 19.0 (5.5) 0.6 (0.4) 0.0 (0.0) 0.0 (0.0) 0.0 (0.0)flatfishes 34.1 (7.1) 17.7 (6.0) 0.2 (0.2) 0.0 (0.0) 0.0 (0.0) 0.0 (0.0)Average % Reduction 53.7 39.7 8.4 1.0 0.1 0.01 - Extrapolated to the size at which the larvae are no longer susceptible to entrainment (estimated to be 20–25 mm[0.98 in] for this analysis).2 – 25-mm monkeyface prickleback in Table 7 not included as the length distribution shows the data point as an outlier.* - percentage reductions are the same as the values in Table 4.
SONGSEntrainment sampling at SONGS occurred approximately monthly from March 2006 throughApril 2007. Although entrainment sampling was also done inside the plant, the results presentedhere were from samples collected at a location in the vicinity of the offshore intake. The taxa thatwere measured for length and head capsule dimensions comprised over 83 percent of the totallarvae collected from the offshore entrainment station (Table 11). Anchovies were the mostabundant fish larvae collected, comprising over 65 percent of the total. Since detailed data on thelength frequency distribution for each of the taxa were not available from the study, theestimated percentage reductions for the six WWS slot openings from Table 4 provide the bestestimates of potential screen effectiveness at SONGS.

Length-Specific Screen Entrainment Analysis
ESLO2013-017.4
Bechtel Power Screen Entrainment Analysis 19
Table 11. Concentrations of fish larvae collectedduring entrainment sampling at SONGS from March2006 through April 2007 for the fishes analyzed forthis report.
Common Name
EntrainmentConcentration
(#/1,000 m3)Percentof Total
anchovies 1,285.37 65.4croakers 157.70 8.0combtooth blenny 108.78 5.5flatfishes 23.26 1.2Pacific barracuda 22.05 1.1sea basses 15.68 0.8silversides 11.32 0.6kelpfishes 9.98 0.5gobies 3.74 0.2clingfishes 0.67 0.0sculpins 0.45 0.0Total for analyzed taxa 1,638.80 83.4Minimum of 27 other taxa 243.73 16.6Total 1,882.53 100.0
ConclusionsThe results from the head capsule analysis indicate that rectangular mesh or WWS slot openingslarger than about 3 mm (0.12 in.) will result in very little reduction in population-level mortality,especially for fishes that have been entrained in large numbers in southern California such asanchovies, croakers, and gobies. The results also show that the performance of screens will varyby location and also between years due to differences in the composition of entrained larvae andchanges to their abundances and proportions over time. For example, due to the generally smallersize of the larvae entrained at DCPP, the estimated reductions in entrainment for any mesh orWWS slot openings larger than about 1 mm (0.04 in.) was very small. Overall, the methodologypresented provides an initial means to evaluate, based on the morphology of the larvae, thepotential for screen technologies to reduce larval fish entrainment through exclusion.
The results of the generalized analysis of the fishes commonly subject to entrainmentsummarized in Table 5 provide estimates that could be used in a first order assessment of thepotential effectiveness of different rectangular mesh or WWS slot openings for plants such asSONGS where only limited data on the length frequency of entrainable larvae are available. Theanalysis of the DCPP data demonstrate the importance of having detailed site-specific data. TheDCPP results showed that the assumption that the screen would be effective across all lengthclasses up to the maximum lengths of 20 or 25 mm (0.79 or 0.98 in.), which was used incalculating the estimated population-level reductions in entrainment mortality presented inTable 5, was not valid for some of the most abundant fishes collected during entrainment

Length-Specific Screen Entrainment Analysis
ESLO2013-017.4
Bechtel Power Screen Entrainment Analysis 20
sampling. The absence of larger larvae for the fishes collected during entrainment sampling waslikely due to behavioral differences among species that likely occur following transformation ofthe larvae when they begin taking on adult morphological characteristics and, as a result, developincreased swimming abilities that allow them to better avoid entrainment. Results from a studyby Beldade et al. (2006) on the vertical distribution of fish larvae in a marine reserve area inPortugal showed that only small larvae occurred at the surface while the whole range of sizeswas present at the bottom. These results support the role of behavior and indicate that larvae forsome fishes may be completing the entire pelagic phase near the adult habitat. Although it istempting to generalize regarding behaviors of nearshore rocky reef fishes that result in the larvaemoving to the bottom at early stages of development to avoid transport long distances away fromtheir natal habitat, kelpfishes, which are part of the rocky reef fish assemblage were collectedduring entrainment sampling at DCPP across a large range of sizes (Table 8). Also flatfishes,which are associated with soft bottom habitat, had a length frequency distribution (Table 8)similar overall to fishes, other than kelpfishes, that form the rocky reef fish assemblage.Screening technologies using only smaller slot sizes would be effective at reducing entrainmentfor these fishes, but a shorter time of susceptibility likely results in very low population leveleffects of entrainment as larger larvae, which have a disproportionately greater contribution topopulation sustainability appear to have low risk of entrainment.
The results from DCPP indicate that the low numbers of larger larvae for some fishes wouldneed to be taken into account during the design of any further pilot studies to determine theeffectiveness of screening technologies at reducing entrainment. Studies would need to bedesigned to collect an adequate number of samples to account for the expected small numbers oflarge larvae. Such analysis, as applicable, should also focus on specific size classes asrecommended by Weisberg et al. (1987). In testing of WWS in Chesapeake Bay with slot sizesof 1, 2, and 3 mm (0.04, 0.08, and 0.12 in.) Weisberg et al. (1987) were unable to detect anyreductions in entrainment for smaller fish eggs and larvae, but did detect significant reductionsfor larger larvae. Even though the concentrations of the larger larvae were very low in that study,the analysis was able to detect statistically significant differences, which was at least partiallydue to the large differences in abundance for the larger larvae between the open and screenedintakes for the larger larvae. The results from the studies along the California coast indicate thatlarge larvae may only be present from a limited number of taxa and in low numbers complicatingany field testing of WWS effectiveness.
In addition to the assumptions associated with the modeling presented in this study, the estimatesof screen effectiveness do not attempt to account for the potential effects of field flow (currents)around specific WWS module designs, which may increase the effectiveness of offshore screenmodules at reducing larval entrainment. Additionally, the viability of larvae initially impinged oninshore fine-mesh screens and then released to the source water body was not evaluated. Larvalsurvival following impingement will be highly variable depending on the screen type and fishreturn systems employed, as well as the types of organisms susceptible to entrainment at a givenlocation. The results presented would also not be directly applicable to fine-mesh screens usingsquare mesh configurations due to differences in larval head dimensions, specifically variation in

Length-Specific Screen Entrainment Analysis
ESLO2013-017.4
Bechtel Power Screen Entrainment Analysis 21
head width versus depth. The smallest dimension (width or depth) of the head capsule is areasonable approach for estimating the minimum sizes of larvae that could be entrained throughrectangular mesh or WWS slot openings. The dimensions of the head capsule, as well as theoverall length and body shape, are all likely to contribute to the size of fish larvae that could beentrained through screens with square mesh openings. Therefore, the results of this study are bestapplied to WWS or fine-mesh screens with rectangular openings.
Length-Specific Screen Entrainment Analysis
ESLO2013-017.4
Bechtel Power Screen Entrainment Analysis 22
ReferencesAmaral, S. 2005. Laboratory evaluation of wedge wire screens for protecting fish at cooling
water intakes. In Proceedings Report. A Symposium on Cooling Water Intake Technologiesto Protect Aquatic Organisms. U.S. Environmental Protection Agency Office of Water,Office of Science and Technology, Washington, DC. EPA 625-C-05-002, pp. 279-302.
Beldade, R., R. Borges, and E. J. Goncalves. 2006. Depth distribution of nearshore temperatefish larval assemblages near rocky substrates. J. Plankton Research 28:1003-1013.
Dey, W. 2005. Optimal slot-width selection for wedge wire screens. In Proceedings Report. ASymposium on Cooling Water Intake Technologies to Protect Aquatic Organisms. U.S.Environmental Protection Agency Office of Water, Office of Science and Technology,Washington, DC. EPA 625-C-05-002, pp. 243-256.
Ehrler, C. and C. Raifsnider. 2000. Evaluation of the effectiveness of intake wedgewire screens.In Wisniewski, J., Ed. Power Plants & Aquatic Resources: Issues and Assessments. Env. Sci.Policy 3, S361–S368.
Fuiman, L. A. 1983. Growth gradients in fish larvae. J. Fish. Biol. 23:117123.
Gisbert, E., G. Merino, J. B. Muguet, D. Bush, R. H. Piedrahita, and D. E. Conklin. 2002.Morphological development and allometric growth patterns in hatchery-reared Californiahalibut larvae. J. Fish Biol. 61:12171229.
Moser, H. G. (ed.). 1996. The early stages of fishes in the California Current region. CaliforniaCooperative Oceanic Fisheries Investigations, Atlas No. 33, National Marine FisheriesService, La Jolla, California. 1505 p.
Pena, R. and S. Dumas. 2009. Development and allometric growth patterns during early larvalstages of the spotted sand bass Paralabrax maculatofasciatus (Percoidei: Serranidae).pp. 183189 in C. Clemmesen, A. M. Malzahn, M. A. Peck, and D. Schnack (eds.).Advances in early life history study of fish. Scientia Marina, Barcelona, Spain.
Tenera Environmental. 2010. City of Santa Cruz Water Department & Soquel Creek WaterDistrict SCWD2 Desalination Program Intake Effects Assessment Report. Document No.ESLO2010-017. Prepared for City of Santa Cruz, Santa Cruz, CA. 198 p.
Tenera Environmental. 2011. Intake Screening Technology Support Studies: Morphology ofLarval Fish Head Capsules. Document No. ESLO2011-005. Prepared for Pacific Gas andElectric, San Francisco, CA. 26 p.
Length-Specific Screen Entrainment Analysis
ESLO2013-017.4
Bechtel Power Screen Entrainment Analysis 23
Tenera Environmental. in prep. West Basin Municipal Water District DesalinationDemonstration Facility: Intake Effects Assessment Report. Prepared for West BasinMunicipal Water District, Carson, California.
Theilacker, G. H. 1980. Changes in body measurements of larval northern anchovy, Engraulismordax, and other fishes due to handling and preservation. Fishery Bulletin 78:685-692.
Weisberg, S. B., W. H. Burton, F. Jacobs, and E. A. Ross. 1987. Reductions in ichthyoplanktonentrainment with fine-mesh, wedge-wire screens. North American Journal of FisheriesManagement 7:386393.
Length-Specific Screen Entrainment Analysis
Appendix A
Regression Plots from Intake ScreeningTechnology Support Studies: Morphology ofLarval Fish Head Capsules (Tenera 2011)

Length-Specific Screen Entrainment Analysis
ESLO2013-017.4
Bechtel Power Screen Entrainment Analysis A-1
Figure A1. Kelpfishes (Gibbonsia spp.) allometric regression plots.
5 10 15 20 25
12
34
Gibbonsia spp.
Notochord length (mm)
Hea
d di
men
sion
(mm
)
y 0.05414x1.286
y 0.0998x1.014
Head heightHead widthHead height eqHead width eq
Length-Specific Screen Entrainment Analysis
ESLO2013-017.4
Bechtel Power Screen Entrainment Analysis A-2
Figure A2. Sculpins (Cottidae) allometric regression plots.
4 6 8 10
0.5
1.0
1.5
2.0
2.5
3.0
Cottidae
Notochord length (mm)
Hea
d di
men
sion
(mm
) y 0.1237x1.248
y 0.08774x1.381
Head heightHead widthHead height eqHead width eq
Length-Specific Screen Entrainment Analysis
ESLO2013-017.4
Bechtel Power Screen Entrainment Analysis A-3
Figure A3. Flatfishes (Pleuronectiformes) allometric regression plots.
2 3 4 5 6 7
0.5
1.0
1.5
2.0
2.5
Pleuronectiformes
Notochord length (mm)
Hea
d di
men
sion
(mm
) y 0.05017x1.918
y 0.08238x1.281
Head heightHead widthHead height eqHead width eq

Length-Specific Screen Entrainment Analysis
ESLO2013-017.4
Bechtel Power Screen Entrainment Analysis A-4
Figure A4. Monkeyface prickleback (Cebidichthys violaceus) allometric regression plots.
6 8 10 12 14 16 18
0.5
1.0
1.5
2.0
Cebidichthys violaceus
Notochord length (mm)
Hea
d di
men
sion
(mm
) y 0.1422x0.8724
y 0.1198x0.8927
Head heightHead widthHead height eqHead width eq
Length-Specific Screen Entrainment Analysis
ESLO2013-017.4
Bechtel Power Screen Entrainment Analysis A-5
Figure A5. Combtooth blennies (Hypsoblennius spp.) allometric regression plots.
2.0 2.5 3.0 3.5 4.0
0.4
0.6
0.8
1.0
Hypsoblennius spp.
Notochord length (mm)
Hea
d di
men
sion
(mm
)
y 0.1833x1.043
y 0.1777x0.9231
Head heightHead widthHead height eqHead width eq

Length-Specific Screen Entrainment Analysis
ESLO2013-017.4
Bechtel Power Screen Entrainment Analysis A-6
Figure A6. Clingfishes (Gobiesox spp.) allometric regression plots.
3 4 5 6
0.6
0.8
1.0
1.2
1.4
Gobiesox spp.
Notochord length (mm)
Hea
d di
men
sion
(mm
)
y 0.1474x1.114
y 0.1281x1.211
Head heightHead widthHead height eqHead width eq
Length-Specific Screen Entrainment Analysis
ESLO2013-017.4
Bechtel Power Screen Entrainment Analysis A-7
Figure A7. Anchovies (Engraulidae and Engraulis mordax) allometric regression plots.
5 10 15 20 25 30
0.0
0.5
1.0
1.5
2.0
2.5
3.0
3.5
Engraulidae
Notochord length (mm)
Hea
d di
men
sion
(mm
)y 0.02146x1.452
y 0.07755x1.017
Head heightHead widthHead height eqHead width eq
Length-Specific Screen Entrainment Analysis
ESLO2013-017.4
Bechtel Power Screen Entrainment Analysis A-8
Figure A8. Croakers (Seriphus politus and Genyonemus lineatus) allometric regression plots.
2 4 6 8 10 12 14
01
23
4
Sciaenidae
Notochord length (mm)
Hea
d di
men
sion
(mm
)y 0.2094x1.098
y 0.1894x0.9783
Head heightHead widthHead height eqHead width eq

Length-Specific Screen Entrainment Analysis
ESLO2013-017.4
Bechtel Power Screen Entrainment Analysis A-9
Figure A9. Gobies (Acanthogobius flavimanus, Lepidogobius lepidus and CIQ [Clevelandia, Ilypnus, Quietula] goby complex) allometricregression plots.
5 10 15 20
12
34
Gobiidae
Notochord length (mm)
Hea
d di
men
sion
(mm
)
y 0.11x1.074
y 0.08904x1.112
Head heightHead widthHead height eqHead width eq
Length-Specific Screen Entrainment Analysis
ESLO2013-017.4
Bechtel Power Screen Entrainment Analysis A-10
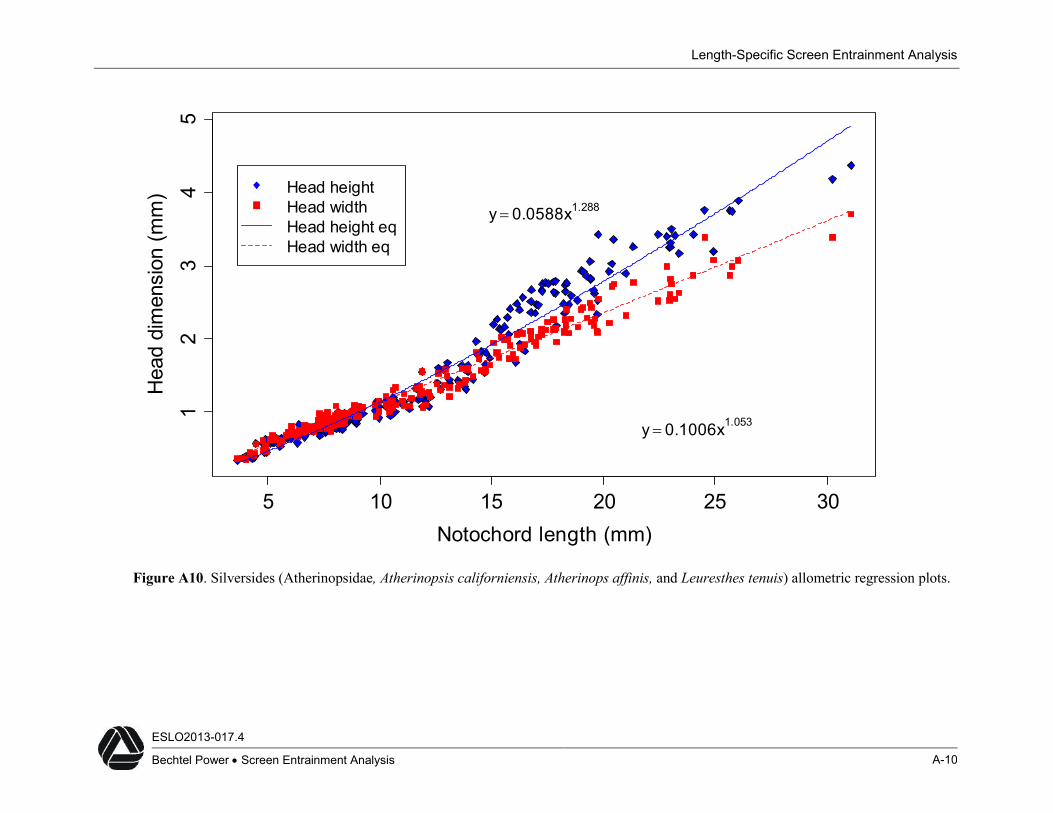
Figure A10. Silversides (Atherinopsidae, Atherinopsis californiensis, Atherinops affinis, and Leuresthes tenuis) allometric regression plots.
5 10 15 20 25 30
12
34
5
Atherinopsidae
Notochord length (mm)
Hea
d di
men
sion
(mm
)
y 0.0588x1.288
y 0.1006x1.053
Head heightHead widthHead height eqHead width eq
Length-Specific Screen Entrainment Analysis
ESLO2013-017.4
Bechtel Power Screen Entrainment Analysis A-11
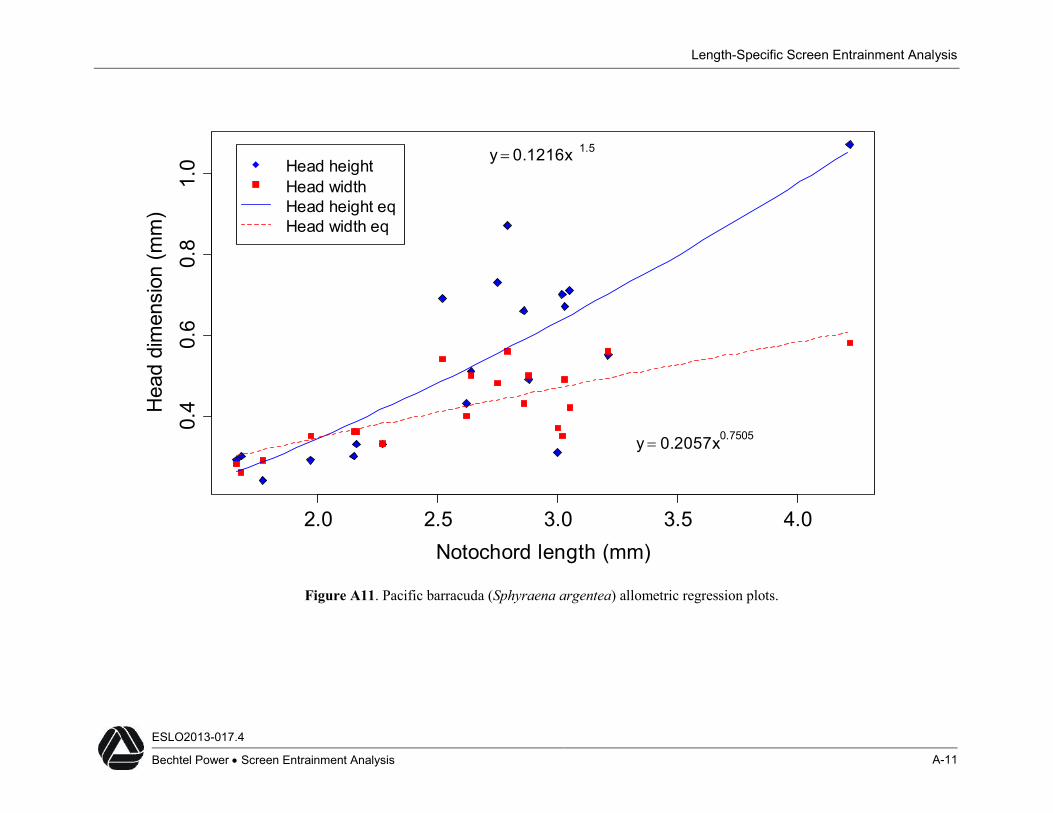
Figure A11. Pacific barracuda (Sphyraena argentea) allometric regression plots.
2.0 2.5 3.0 3.5 4.0
0.4
0.6
0.8
1.0
Sphyraena argentea
Notochord length (mm)
Hea
d di
men
sion
(mm
)y 0.1216x 1.5
y 0.2057x0.7505
Head heightHead widthHead height eqHead width eq

Length-Specific Screen Entrainment Analysis
ESLO2013-017.4
Bechtel Power Screen Entrainment Analysis A-12
Figure A12. Rockfishes (Sebastes spp.) allometric regression plots.
3 4 5 6
0.4
0.6
0.8
1.0
1.2
Sebastes spp.
Notochord length (mm)
Hea
d di
men
sion
(mm
) y 0.1867x0.9164
y 0.09361x1.197
Head heightHead widthHead height eqHead width eq
Length-Specific Screen Entrainment Analysis
ESLO2013-017.4
Bechtel Power Screen Entrainment Analysis A-13
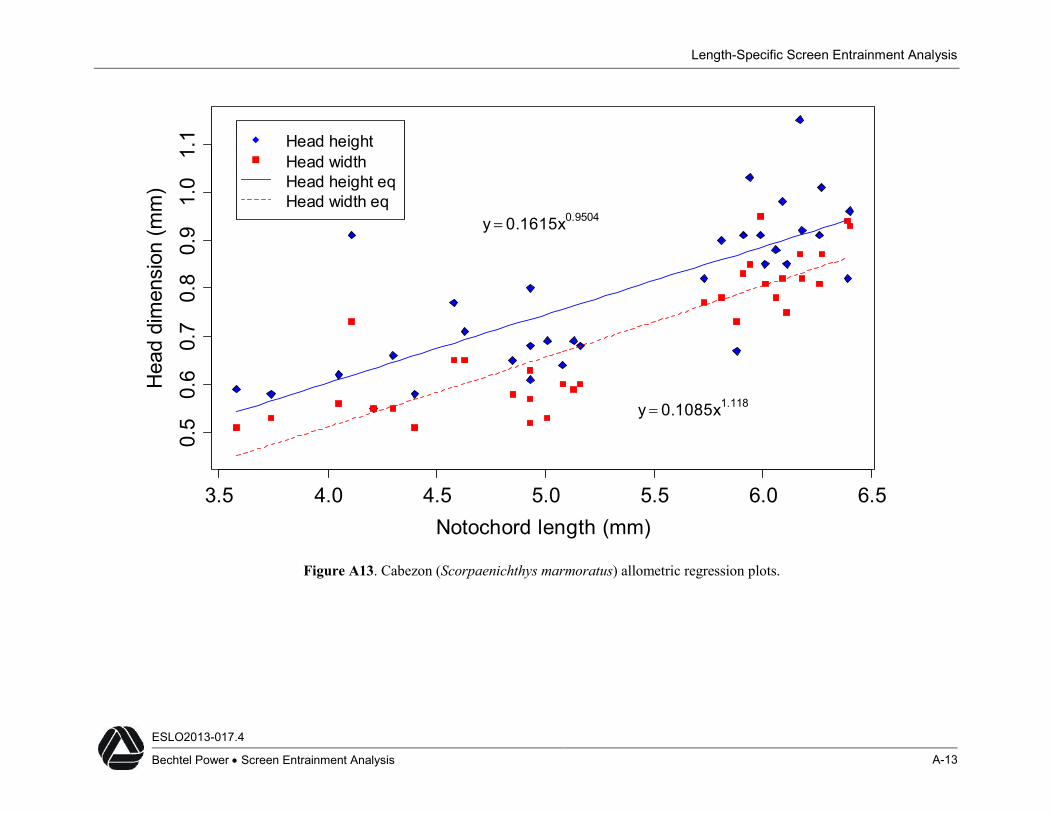
Figure A13. Cabezon (Scorpaenichthys marmoratus) allometric regression plots.
3.5 4.0 4.5 5.0 5.5 6.0 6.5
0.5
0.6
0.7
0.8
0.9
1.0
1.1
Scorpaenichthys marmoratus
Notochord length (mm)
Hea
d di
men
sion
(mm
)
y 0.1615x0.9504
y 0.1085x1.118
Head heightHead widthHead height eqHead width eq
Length-Specific Screen Entrainment Analysis
ESLO2013-017.4
Bechtel Power Screen Entrainment Analysis A-14
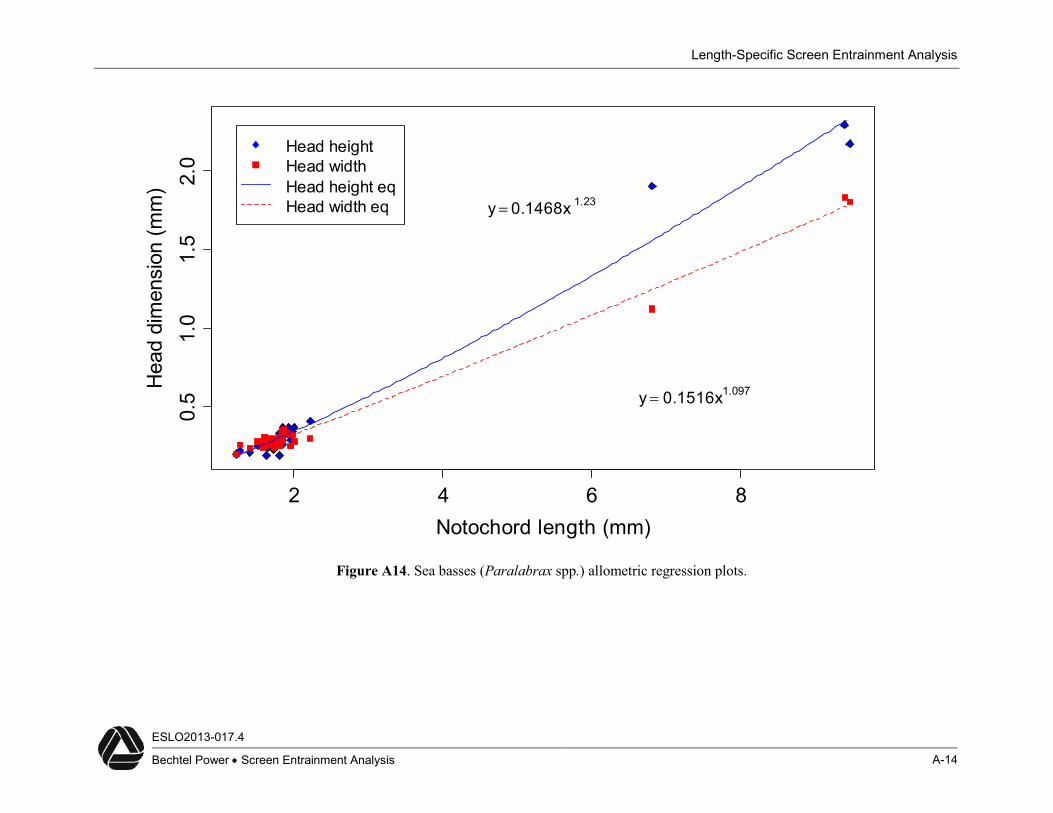
Figure A14. Sea basses (Paralabrax spp.) allometric regression plots.
2 4 6 8
0.5
1.0
1.5
2.0
Paralabrax spp.
Notochord length (mm)
Hea
d di
men
sion
(mm
)
y 0.1468x 1.23
y 0.1516x1.097
Head heightHead widthHead height eqHead width eq

Length-Specific Screen Entrainment Analysis
ESLO2013-017.4
Bechtel Power Screen Entrainment Analysis A-15
Figure A15. Pricklebacks (Stichaeidae) allometric regression plots.
6 8 10 12 14 16
0.6
0.8
1.0
1.2
1.4
1.6
1.8
Stichaeidae
Notochord length (mm)
Hea
d di
men
sion
(mm
) y 0.2809x0.5623
y 0.3506x0.4534
Head heightHead widthHead height eqHead width eq

Length-Specific Screen Entrainment Analysis
Appendix B
Estimated Proportions and Standard Errors ofLarval Fish Taxa Entrained Through Various
Screen Slot Openings Based on Head CapsuleAllometric Regressions on Notochord Lengths
Length-Specific Screen Entrainment Analysis
ESLO2013-017.4
Bechtel Power Screen Entrainment Analysis B-1
Table B1. Estimated proportions (standard error) of kelpfish larvae entrained through six different sizescreen slot openings based on head capsule allometric regressions on notochord lengths to 25 mm.
Length(mm)
Screen Slot Dimension (mm)0.75 1 2 3 4 6
2 1 (0) 1 (0) 1 (0) 1 (0) 1 (0) 1 (0)
3 1 (0) 1 (0) 1 (0) 1 (0) 1 (0) 1 (0)
4 1 (0) 1 (0) 1 (0) 1 (0) 1 (0) 1 (0)
5 1 (0) 1 (0) 1 (0) 1 (0) 1 (0) 1 (0)
6 0.970 (0.026) 1 (0) 1 (0) 1 (0) 1 (0) 1 (0)
7 0.766 (0.091) 0.998 (0.002) 1 (0) 1 (0) 1 (0) 1 (0)
8 0.418 (0.092) 0.954 (0.030) 1 (0) 1 (0) 1 (0) 1 (0)
9 0.171 (0.049) 0.747 (0.087) 1 (0) 1 (0) 1 (0) 1 (0)
10 0.057 (0.019) 0.426 (0.081) 1 (0) 1 (0) 1 (0) 1 (0)
11 0.018 (0.006) 0.213 (0.046) 1 (0) 1 (0) 1 (0) 1 (0)
12 0.006 (0.002) 0.098 (0.024) 1 (0) 1 (0) 1 (0) 1 (0)
13 0.002 (0.001) 0.041 (0.010) 0.999 (<.001) 1 (0) 1 (0) 1 (0)
14 0.001 (<.001) 0.017 (0.004) 0.995 (0.003) 1 (0) 1 (0) 1 (0)
15 0 (0) 0.007 (0.002) 0.976 (0.009) 1 (0) 1 (0) 1 (0)
16 0 (0) 0.003 (0.001) 0.927 (0.021) 1 (0) 1 (0) 1 (0)
17 0 (0) 0.001 (<.001) 0.831 (0.034) 1 (0) 1 (0) 1 (0)
18 0 (0) 0.001 (<.001) 0.698 (0.043) 1 (0) 1 (0) 1 (0)
19 0 (0) 0 (0) 0.543 (0.046) 0.999 (<.001) 1 (0) 1 (0)
20 0 (0) 0 (0) 0.397 (0.040) 0.997 (0.001) 1 (0) 1 (0)
21 0 (0) 0 (0) 0.271 (0.032) 0.991 (0.003) 1 (0) 1 (0)
22 0 (0) 0 (0) 0.175 (0.023) 0.976 (0.006) 1 (0) 1 (0)
23 0 (0) 0 (0) 0.108 (0.016) 0.948 (0.011) 1 (0) 1 (0)
24 0 (0) 0 (0) 0.065 (0.010) 0.905 (0.015) 1 (0) 1 (0)
25 0 (0) 0 (0) 0.037 (0.006) 0.842 (0.021) 0.999 (<.001) 1 (0)

Length-Specific Screen Entrainment Analysis
ESLO2013-017.4
Bechtel Power Screen Entrainment Analysis B-2
Table B2. Estimated proportions (standard error) of sculpin larvae entrained through six different sizescreen slot openings based on head capsule allometric regressions on notochord lengths to 25 mm.
Length(mm)
Screen Slot Dimension (mm)0.75 1 2 3 4 6
2 1 (0) 1 (0) 1 (0) 1 (0) 1 (0) 1 (0)3 0.998 (0.003) 1 (0) 1 (0) 1 (0) 1 (0) 1 (0)4 0.849 (0.108) 0.990 (0.012) 1 (0) 1 (0) 1 (0) 1 (0)5 0.393 (0.128) 0.823 (0.095) 1 (0) 1 (0) 1 (0) 1 (0)6 0.114 (0.044) 0.456 (0.104) 0.998 (0.002) 1 (0) 1 (0) 1 (0)7 0.028 (0.011) 0.179 (0.053) 0.967 (0.020) 1 (0) 1 (0) 1 (0)8 0.007 (0.003) 0.061 (0.019) 0.848 (0.049) 0.998 (0.001) 1 (0) 1 (0)9 0.002 (0.001) 0.021 (0.006) 0.648 (0.062) 0.985 (0.008) 1 (0) 1 (0)
10 0.001 (<.001) 0.008 (0.002) 0.436 (0.057) 0.930 (0.024) 0.998 (0.001) 1 (0)11 0 (0) 0.003 (0.001) 0.271 (0.040) 0.819 (0.041) 0.987 (0.006) 1 (0)12 0 (0) 0.001 (<.001) 0.160 (0.025) 0.661 (0.048) 0.955 (0.014) 1 (0)13 0 (0) 0.001 (<.001) 0.091 (0.015) 0.503 (0.043) 0.890 (0.024) 0.999 (<.001)14 0 (0) 0 (0) 0.051 (0.009) 0.368 (0.035) 0.789 (0.033) 0.995 (0.002)15 0 (0) 0 (0) 0.029 (0.005) 0.260 (0.027) 0.666 (0.036) 0.984 (0.005)16 0 (0) 0 (0) 0.017 (0.003) 0.181 (0.020) 0.539 (0.037) 0.963 (0.009)17 0 (0) 0 (0) 0.010 (0.002) 0.122 (0.014) 0.415 (0.033) 0.924 (0.013)18 0 (0) 0 (0) 0.006 (0.001) 0.083 (0.010) 0.314 (0.027) 0.870 (0.018)19 0 (0) 0 (0) 0.003 (0.001) 0.057 (0.007) 0.235 (0.020) 0.801 (0.022)20 0 (0) 0 (0) 0.002 (<.001) 0.038 (0.005) 0.176 (0.015) 0.722 (0.025)21 0 (0) 0 (0) 0.001 (<.001) 0.026 (0.003) 0.131 (0.012) 0.634 (0.026)22 0 (0) 0 (0) 0.001 (<.001) 0.018 (0.002) 0.097 (0.009) 0.547 (0.025)23 0 (0) 0 (0) 0.001 (<.001) 0.012 (0.002) 0.073 (0.007) 0.466 (0.023)24 0 (0) 0 (0) 0 (0) 0.008 (0.001) 0.053 (0.005) 0.388 (0.022)25 0 (0) 0 (0) 0 (0) 0.006 (0.001) 0.040 (0.004) 0.320 (0.019)
Length-Specific Screen Entrainment Analysis
ESLO2013-017.4
Bechtel Power Screen Entrainment Analysis B-3
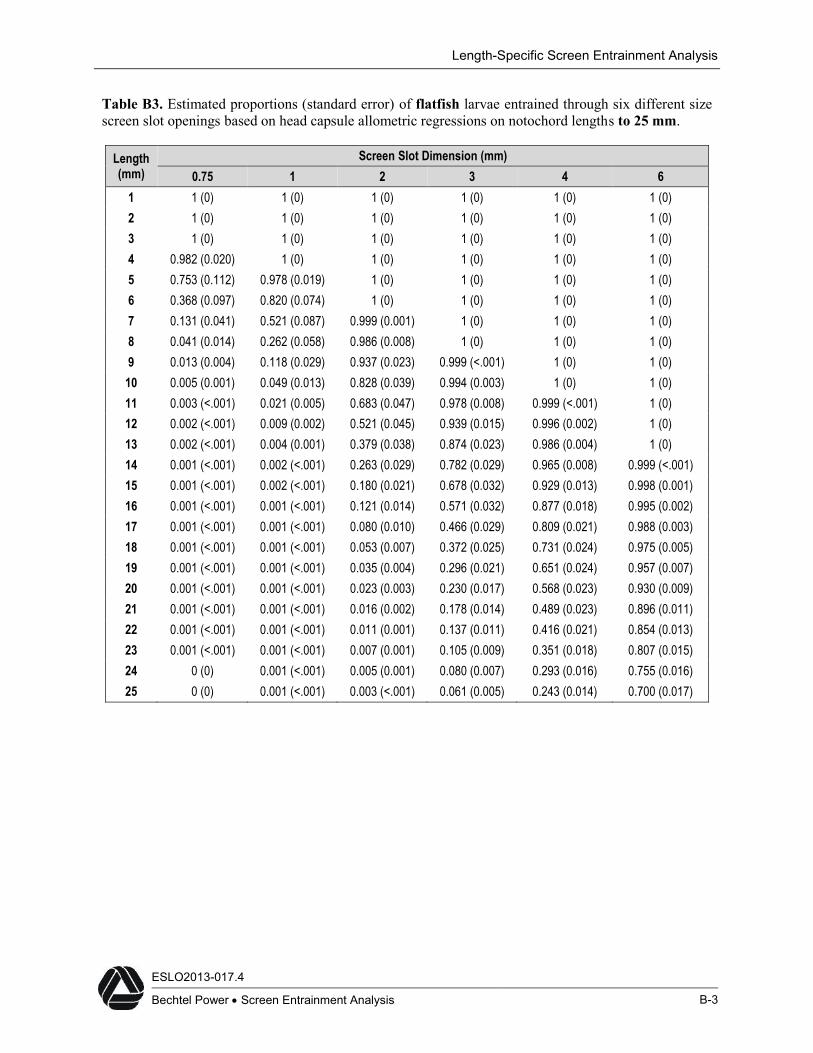
Table B3. Estimated proportions (standard error) of flatfish larvae entrained through six different sizescreen slot openings based on head capsule allometric regressions on notochord lengths to 25 mm.
Length(mm)
Screen Slot Dimension (mm)0.75 1 2 3 4 6
1 1 (0) 1 (0) 1 (0) 1 (0) 1 (0) 1 (0)2 1 (0) 1 (0) 1 (0) 1 (0) 1 (0) 1 (0)3 1 (0) 1 (0) 1 (0) 1 (0) 1 (0) 1 (0)4 0.982 (0.020) 1 (0) 1 (0) 1 (0) 1 (0) 1 (0)5 0.753 (0.112) 0.978 (0.019) 1 (0) 1 (0) 1 (0) 1 (0)6 0.368 (0.097) 0.820 (0.074) 1 (0) 1 (0) 1 (0) 1 (0)7 0.131 (0.041) 0.521 (0.087) 0.999 (0.001) 1 (0) 1 (0) 1 (0)8 0.041 (0.014) 0.262 (0.058) 0.986 (0.008) 1 (0) 1 (0) 1 (0)9 0.013 (0.004) 0.118 (0.029) 0.937 (0.023) 0.999 (<.001) 1 (0) 1 (0)
10 0.005 (0.001) 0.049 (0.013) 0.828 (0.039) 0.994 (0.003) 1 (0) 1 (0)11 0.003 (<.001) 0.021 (0.005) 0.683 (0.047) 0.978 (0.008) 0.999 (<.001) 1 (0)12 0.002 (<.001) 0.009 (0.002) 0.521 (0.045) 0.939 (0.015) 0.996 (0.002) 1 (0)13 0.002 (<.001) 0.004 (0.001) 0.379 (0.038) 0.874 (0.023) 0.986 (0.004) 1 (0)14 0.001 (<.001) 0.002 (<.001) 0.263 (0.029) 0.782 (0.029) 0.965 (0.008) 0.999 (<.001)15 0.001 (<.001) 0.002 (<.001) 0.180 (0.021) 0.678 (0.032) 0.929 (0.013) 0.998 (0.001)16 0.001 (<.001) 0.001 (<.001) 0.121 (0.014) 0.571 (0.032) 0.877 (0.018) 0.995 (0.002)17 0.001 (<.001) 0.001 (<.001) 0.080 (0.010) 0.466 (0.029) 0.809 (0.021) 0.988 (0.003)18 0.001 (<.001) 0.001 (<.001) 0.053 (0.007) 0.372 (0.025) 0.731 (0.024) 0.975 (0.005)19 0.001 (<.001) 0.001 (<.001) 0.035 (0.004) 0.296 (0.021) 0.651 (0.024) 0.957 (0.007)20 0.001 (<.001) 0.001 (<.001) 0.023 (0.003) 0.230 (0.017) 0.568 (0.023) 0.930 (0.009)21 0.001 (<.001) 0.001 (<.001) 0.016 (0.002) 0.178 (0.014) 0.489 (0.023) 0.896 (0.011)22 0.001 (<.001) 0.001 (<.001) 0.011 (0.001) 0.137 (0.011) 0.416 (0.021) 0.854 (0.013)23 0.001 (<.001) 0.001 (<.001) 0.007 (0.001) 0.105 (0.009) 0.351 (0.018) 0.807 (0.015)24 0 (0) 0.001 (<.001) 0.005 (0.001) 0.080 (0.007) 0.293 (0.016) 0.755 (0.016)25 0 (0) 0.001 (<.001) 0.003 (<.001) 0.061 (0.005) 0.243 (0.014) 0.700 (0.017)

Length-Specific Screen Entrainment Analysis
ESLO2013-017.4
Bechtel Power Screen Entrainment Analysis B-4
Table B4. Estimated proportions (standard error) of monkeyface prickleback larvae entrainedthrough six different size screen slot openings based on head capsule regressions on notochordlengths to 25 mm.
Length(mm)
Screen Slot Dimension (mm)0.75 1 2 3 4 6
3 1 (0) 1 (0) 1 (0) 1 (0) 1 (0) 1 (0)4 1 (0) 1 (0) 1 (0) 1 (0) 1 (0) 1 (0)5 0.995 (0.005) 1 (0) 1 (0) 1 (0) 1 (0) 1 (0)6 0.932 (0.038) 1 (0) 1 (0) 1 (0) 1 (0) 1 (0)7 0.722 (0.079) 0.992 (0.006) 1 (0) 1 (0) 1 (0) 1 (0)8 0.457 (0.073) 0.946 (0.023) 1 (0) 1 (0) 1 (0) 1 (0)9 0.250 (0.049) 0.831 (0.045) 1 (0) 1 (0) 1 (0) 1 (0)
10 0.122 (0.025) 0.655 (0.053) 1 (0) 1 (0) 1 (0) 1 (0)11 0.057 (0.013) 0.468 (0.050) 1 (0) 1 (0) 1 (0) 1 (0)12 0.027 (0.006) 0.312 (0.039) 1 (0) 1 (0) 1 (0) 1 (0)13 0.012 (0.003) 0.198 (0.028) 0.998 (0.001) 1 (0) 1 (0) 1 (0)14 0.006 (0.001) 0.122 (0.018) 0.994 (0.002) 1 (0) 1 (0) 1 (0)15 0.003 (0.001) 0.074 (0.011) 0.984 (0.004) 1 (0) 1 (0) 1 (0)16 0.002 (<.001) 0.044 (0.007) 0.964 (0.008) 1 (0) 1 (0) 1 (0)17 0.001 (<.001) 0.026 (0.004) 0.931 (0.012) 1 (0) 1 (0) 1 (0)18 0.001 (<.001) 0.016 (0.002) 0.886 (0.015) 1 (0) 1 (0) 1 (0)19 0 (0) 0.010 (0.002) 0.829 (0.018) 0.999 (<.001) 1 (0) 1 (0)20 0 (0) 0.006 (0.001) 0.762 (0.021) 0.997 (0.001) 1 (0) 1 (0)21 0 (0) 0.004 (0.001) 0.689 (0.023) 0.994 (0.001) 1 (0) 1 (0)22 0 (0) 0.003 (<.001) 0.613 (0.022) 0.989 (0.002) 1 (0) 1 (0)23 0 (0) 0.002 (<.001) 0.539 (0.022) 0.981 (0.003) 1 (0) 1 (0)24 0 (0) 0.001 (<.001) 0.468 (0.020) 0.969 (0.004) 0.999 (<.001) 1 (0)25 0 (0) 0.001 (<.001) 0.402 (0.019) 0.952 (0.006) 0.999 (<.001) 1 (0)

Length-Specific Screen Entrainment Analysis
ESLO2013-017.4
Bechtel Power Screen Entrainment Analysis B-5
Table B5. Estimated proportions (standard error) of combtooth blenny larvae entrained through sixdifferent size screen slot openings based on head capsule allometric regressions on notochord lengthsto 20 mm.
Length(mm)
Screen Slot Dimension (mm)0.75 1 2 3 4 6
2 1 (0) 1 (0) 1 (0) 1 (0) 1 (0) 1 (0)3 0.997 (0.005) 1 (0) 1 (0) 1 (0) 1 (0) 1 (0)4 0.842 (0.102) 0.997 (0.004) 1 (0) 1 (0) 1 (0) 1 (0)5 0.411 (0.117) 0.917 (0.050) 1 (0) 1 (0) 1 (0) 1 (0)6 0.134 (0.046) 0.659 (0.088) 1 (0) 1 (0) 1 (0) 1 (0)7 0.041 (0.014) 0.381 (0.071) 0.999 (<.001) 1 (0) 1 (0) 1 (0)8 0.012 (0.004) 0.183 (0.040) 0.992 (0.004) 1 (0) 1 (0) 1 (0)9 0.004 (0.001) 0.087 (0.020) 0.966 (0.012) 1 (0) 1 (0) 1 (0)
10 0.001 (<.001) 0.041 (0.009) 0.908 (0.022) 0.999 (<.001) 1 (0) 1 (0)11 0.001 (<.001) 0.020 (0.004) 0.817 (0.029) 0.996 (0.002) 1 (0) 1 (0)12 0 (0) 0.010 (0.002) 0.707 (0.034) 0.988 (0.004) 1 (0) 1 (0)13 0 (0) 0.005 (0.001) 0.593 (0.033) 0.970 (0.007) 0.999 (<.001) 1 (0)14 0 (0) 0.003 (<.001) 0.481 (0.031) 0.941 (0.011) 0.997 (0.001) 1 (0)15 0 (0) 0.002 (<.001) 0.385 (0.026) 0.900 (0.014) 0.992 (0.002) 1 (0)16 0 (0) 0.001 (<.001) 0.304 (0.022) 0.849 (0.017) 0.983 (0.003) 1 (0)17 0 (0) 0.001 (<.001) 0.239 (0.017) 0.789 (0.018) 0.970 (0.005) 1 (0)18 0 (0) 0 (0) 0.186 (0.014) 0.724 (0.020) 0.951 (0.007) 0.999 (<.001)19 0 (0) 0 (0) 0.145 (0.011) 0.657 (0.020) 0.926 (0.008) 0.998 (<.001)20 0 (0) 0 (0) 0.113 (0.009) 0.591 (0.019) 0.895 (0.010) 0.997 (0.001)

Length-Specific Screen Entrainment Analysis
ESLO2013-017.4
Bechtel Power Screen Entrainment Analysis B-6
Table B6. Estimated proportions (standard error) of clingfish larvae entrained through sixdifferent size screen slot openings based on head capsule allometric regressions on notochordlengths to 20 mm.
Length(mm)
Screen Slot Dimension (mm)0.75 1 2 3 4 6
2 1 (0) 1 (0) 1 (0) 1 (0) 1 (0) 1 (0)3 0.963 (0.040) 0.999 (0.001) 1 (0) 1 (0) 1 (0) 1 (0)4 0.652 (0.126) 0.943 (0.043) 1 (0) 1 (0) 1 (0) 1 (0)5 0.313 (0.070) 0.696 (0.092) 1 (0) 1 (0) 1 (0) 1 (0)6 0.141 (0.032) 0.396 (0.072) 0.990 (0.006) 1 (0) 1 (0) 1 (0)7 0.068 (0.014) 0.221 (0.036) 0.947 (0.020) 0.999 (<.001) 1 (0) 1 (0)8 0.035 (0.007) 0.127 (0.021) 0.850 (0.036) 0.993 (0.003) 1 (0) 1 (0)9 0.019 (0.003) 0.074 (0.011) 0.712 (0.043) 0.973 (0.009) 0.998 (0.001) 1 (0)
10 0.011 (0.002) 0.046 (0.007) 0.568 (0.041) 0.932 (0.016) 0.993 (0.003) 1 (0)11 0.007 (0.001) 0.029 (0.004) 0.436 (0.035) 0.866 (0.022) 0.979 (0.006) 1 (0)12 0.004 (0.001) 0.019 (0.003) 0.328 (0.028) 0.783 (0.026) 0.953 (0.010) 0.998 (<.001)13 0.003 (<.001) 0.013 (0.002) 0.243 (0.021) 0.689 (0.028) 0.913 (0.014) 0.995 (0.001)14 0.002 (<.001) 0.009 (0.001) 0.181 (0.016) 0.598 (0.027) 0.863 (0.017) 0.990 (0.002)15 0.002 (<.001) 0.006 (0.001) 0.135 (0.011) 0.509 (0.024) 0.802 (0.019) 0.979 (0.004)16 0.001 (<.001) 0.005 (0.001) 0.104 (0.008) 0.429 (0.022) 0.735 (0.021) 0.963 (0.006)17 0.001 (<.001) 0.004 (<.001) 0.082 (0.006) 0.360 (0.020) 0.667 (0.021) 0.942 (0.008)18 0.001 (<.001) 0.003 (<.001) 0.065 (0.005) 0.301 (0.017) 0.600 (0.020) 0.915 (0.009)19 0.001 (<.001) 0.002 (<.001) 0.053 (0.004) 0.250 (0.014) 0.535 (0.019) 0.882 (0.011)20 0 (0) 0.002 (<.001) 0.043 (0.003) 0.208 (0.012) 0.475 (0.017) 0.845 (0.012)
Length-Specific Screen Entrainment Analysis
ESLO2013-017.4
Bechtel Power Screen Entrainment Analysis B-7
Table B7. Estimated proportions (standard error) of anchovy larvae entrained throughsix different size screen slot openings based on head capsule allometric regressions onnotochord lengths to 25 mm.
Length(mm)
Screen Slot Dimension (mm)0.75 1 2 3 4 6
1 1 (0) 1 (0) 1 (0) 1 (0) 1 (0) 1 (0)2 1 (0) 1 (0) 1 (0) 1 (0) 1 (0) 1 (0)3 1 (0) 1 (0) 1 (0) 1 (0) 1 (0) 1 (0)4 1 (0) 1 (0) 1 (0) 1 (0) 1 (0) 1 (0)5 1 (0) 1 (0) 1 (0) 1 (0) 1 (0) 1 (0)6 1 (0) 1 (0) 1 (0) 1 (0) 1 (0) 1 (0)7 1 (0) 1 (0) 1 (0) 1 (0) 1 (0) 1 (0)8 1 (0) 1 (0) 1 (0) 1 (0) 1 (0) 1 (0)9 0.997 (0.003) 1 (0) 1 (0) 1 (0) 1 (0) 1 (0)
10 0.943 (0.037) 1 (0) 1 (0) 1 (0) 1 (0) 1 (0)11 0.699 (0.099) 0.997 (0.003) 1 (0) 1 (0) 1 (0) 1 (0)12 0.350 (0.089) 0.956 (0.024) 1 (0) 1 (0) 1 (0) 1 (0)13 0.125 (0.044) 0.803 (0.067) 1 (0) 1 (0) 1 (0) 1 (0)14 0.033 (0.013) 0.530 (0.084) 1 (0) 1 (0) 1 (0) 1 (0)15 0.007 (0.003) 0.268 (0.061) 1 (0) 1 (0) 1 (0) 1 (0)16 0.001 (0.001) 0.109 (0.031) 1 (0) 1 (0) 1 (0) 1 (0)17 0 (0) 0.037 (0.012) 1 (0) 1 (0) 1 (0) 1 (0)18 0 (0) 0.011 (0.004) 1 (0) 1 (0) 1 (0) 1 (0)19 0 (0) 0.003 (0.001) 0.999 (<.001) 1 (0) 1 (0) 1 (0)20 0 (0) 0.001 (<.001) 0.993 (0.004) 1 (0) 1 (0) 1 (0)21 0 (0) 0 (0) 0.968 (0.012) 1 (0) 1 (0) 1 (0)22 0 (0) 0 (0) 0.900 (0.028) 1 (0) 1 (0) 1 (0)23 0 (0) 0 (0) 0.765 (0.047) 1 (0) 1 (0) 1 (0)24 0 (0) 0 (0) 0.590 (0.057) 1 (0) 1 (0) 1 (0)25 0 (0) 0 (0) 0.401 (0.052) 1 (0) 1 (0) 1 (0)

Length-Specific Screen Entrainment Analysis
ESLO2013-017.4
Bechtel Power Screen Entrainment Analysis B-8
Table B8. Estimated proportions (standard error) of croaker larvae entrained through sixdifferent size screen slot openings based on head capsule allometric regressions on notochordlengths to 20 mm.
Length(mm)
Screen Slot Dimension (mm)0.75 1 2 3 4 6
1 1 (0) 1 (0) 1 (0) 1 (0) 1 (0) 1 (0)2 1 (0) 1 (0) 1 (0) 1 (0) 1 (0) 1 (0)3 0.996 (0.009) 1 (0) 1 (0) 1 (0) 1 (0) 1 (0)4 0.575 (0.252) 0.998 (0.004) 1 (0) 1 (0) 1 (0) 1 (0)5 0.041 (0.043) 0.780 (0.155) 1 (0) 1 (0) 1 (0) 1 (0)6 0.001 (0.001) 0.224 (0.123) 1 (0) 1 (0) 1 (0) 1 (0)7 0 (0) 0.019 (0.015) 1 (0) 1 (0) 1 (0) 1 (0)8 0 (0) 0.001 (0.001) 0.998 (0.002) 1 (0) 1 (0) 1 (0)9 0 (0) 0 (0) 0.969 (0.020) 1 (0) 1 (0) 1 (0)
10 0 (0) 0 (0) 0.826 (0.067) 1 (0) 1 (0) 1 (0)11 0 (0) 0 (0) 0.546 (0.086) 1 (0) 1 (0) 1 (0)12 0 (0) 0 (0) 0.280 (0.064) 0.998 (0.002) 1 (0) 1 (0)13 0 (0) 0 (0) 0.113 (0.032) 0.983 (0.008) 1 (0) 1 (0)14 0 (0) 0 (0) 0.039 (0.013) 0.932 (0.024) 1 (0) 1 (0)15 0 (0) 0 (0) 0.012 (0.004) 0.823 (0.041) 0.999 (<.001) 1 (0)16 0 (0) 0 (0) 0.003 (0.001) 0.657 (0.051) 0.997 (0.001) 1 (0)17 0 (0) 0 (0) 0.001 (<.001) 0.478 (0.052) 0.987 (0.005) 1 (0)18 0 (0) 0 (0) 0 (0) 0.315 (0.042) 0.960 (0.011) 1 (0)19 0 (0) 0 (0) 0 (0) 0.191 (0.030) 0.906 (0.020) 1 (0)20 0 (0) 0 (0) 0 (0) 0.108 (0.018) 0.821 (0.029) 1 (0)
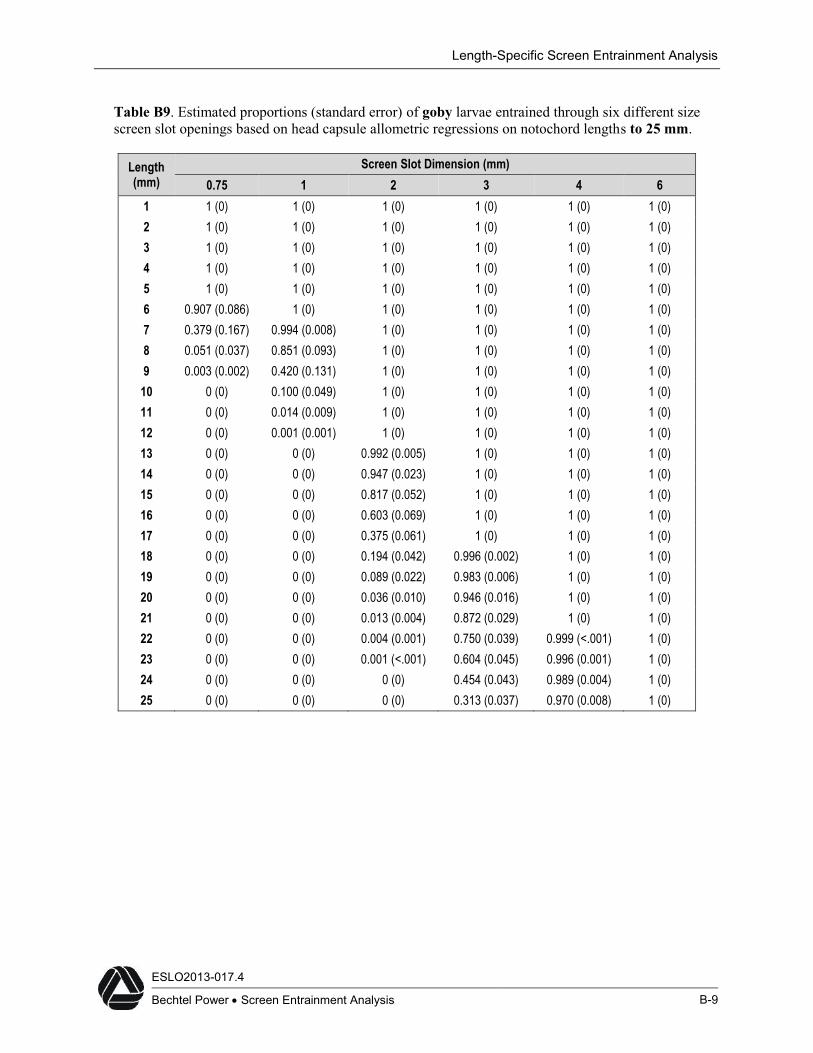
Length-Specific Screen Entrainment Analysis
ESLO2013-017.4
Bechtel Power Screen Entrainment Analysis B-9
Table B9. Estimated proportions (standard error) of goby larvae entrained through six different sizescreen slot openings based on head capsule allometric regressions on notochord lengths to 25 mm.
Length(mm)
Screen Slot Dimension (mm)0.75 1 2 3 4 6
1 1 (0) 1 (0) 1 (0) 1 (0) 1 (0) 1 (0)2 1 (0) 1 (0) 1 (0) 1 (0) 1 (0) 1 (0)3 1 (0) 1 (0) 1 (0) 1 (0) 1 (0) 1 (0)4 1 (0) 1 (0) 1 (0) 1 (0) 1 (0) 1 (0)5 1 (0) 1 (0) 1 (0) 1 (0) 1 (0) 1 (0)6 0.907 (0.086) 1 (0) 1 (0) 1 (0) 1 (0) 1 (0)7 0.379 (0.167) 0.994 (0.008) 1 (0) 1 (0) 1 (0) 1 (0)8 0.051 (0.037) 0.851 (0.093) 1 (0) 1 (0) 1 (0) 1 (0)9 0.003 (0.002) 0.420 (0.131) 1 (0) 1 (0) 1 (0) 1 (0)
10 0 (0) 0.100 (0.049) 1 (0) 1 (0) 1 (0) 1 (0)11 0 (0) 0.014 (0.009) 1 (0) 1 (0) 1 (0) 1 (0)12 0 (0) 0.001 (0.001) 1 (0) 1 (0) 1 (0) 1 (0)13 0 (0) 0 (0) 0.992 (0.005) 1 (0) 1 (0) 1 (0)14 0 (0) 0 (0) 0.947 (0.023) 1 (0) 1 (0) 1 (0)15 0 (0) 0 (0) 0.817 (0.052) 1 (0) 1 (0) 1 (0)16 0 (0) 0 (0) 0.603 (0.069) 1 (0) 1 (0) 1 (0)17 0 (0) 0 (0) 0.375 (0.061) 1 (0) 1 (0) 1 (0)18 0 (0) 0 (0) 0.194 (0.042) 0.996 (0.002) 1 (0) 1 (0)19 0 (0) 0 (0) 0.089 (0.022) 0.983 (0.006) 1 (0) 1 (0)20 0 (0) 0 (0) 0.036 (0.010) 0.946 (0.016) 1 (0) 1 (0)21 0 (0) 0 (0) 0.013 (0.004) 0.872 (0.029) 1 (0) 1 (0)22 0 (0) 0 (0) 0.004 (0.001) 0.750 (0.039) 0.999 (<.001) 1 (0)23 0 (0) 0 (0) 0.001 (<.001) 0.604 (0.045) 0.996 (0.001) 1 (0)24 0 (0) 0 (0) 0 (0) 0.454 (0.043) 0.989 (0.004) 1 (0)25 0 (0) 0 (0) 0 (0) 0.313 (0.037) 0.970 (0.008) 1 (0)
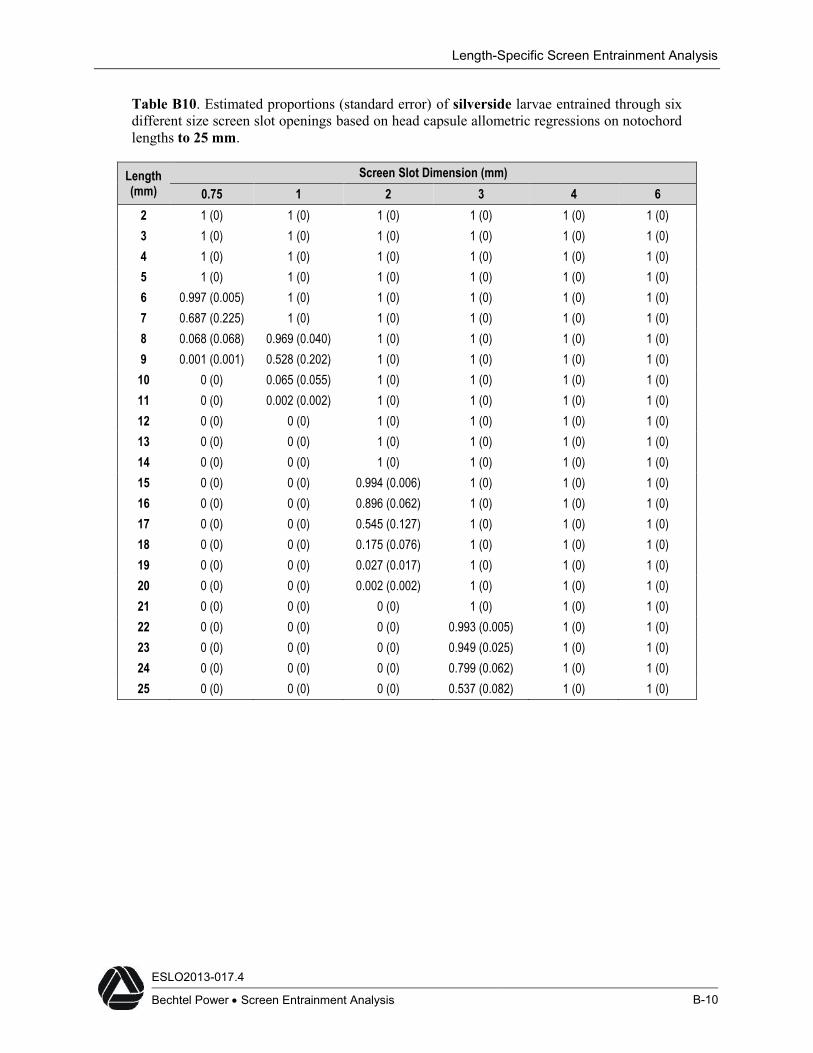
Length-Specific Screen Entrainment Analysis
ESLO2013-017.4
Bechtel Power Screen Entrainment Analysis B-10
Table B10. Estimated proportions (standard error) of silverside larvae entrained through sixdifferent size screen slot openings based on head capsule allometric regressions on notochordlengths to 25 mm.
Length(mm)
Screen Slot Dimension (mm)0.75 1 2 3 4 6
2 1 (0) 1 (0) 1 (0) 1 (0) 1 (0) 1 (0)3 1 (0) 1 (0) 1 (0) 1 (0) 1 (0) 1 (0)4 1 (0) 1 (0) 1 (0) 1 (0) 1 (0) 1 (0)5 1 (0) 1 (0) 1 (0) 1 (0) 1 (0) 1 (0)6 0.997 (0.005) 1 (0) 1 (0) 1 (0) 1 (0) 1 (0)7 0.687 (0.225) 1 (0) 1 (0) 1 (0) 1 (0) 1 (0)8 0.068 (0.068) 0.969 (0.040) 1 (0) 1 (0) 1 (0) 1 (0)9 0.001 (0.001) 0.528 (0.202) 1 (0) 1 (0) 1 (0) 1 (0)
10 0 (0) 0.065 (0.055) 1 (0) 1 (0) 1 (0) 1 (0)11 0 (0) 0.002 (0.002) 1 (0) 1 (0) 1 (0) 1 (0)12 0 (0) 0 (0) 1 (0) 1 (0) 1 (0) 1 (0)13 0 (0) 0 (0) 1 (0) 1 (0) 1 (0) 1 (0)14 0 (0) 0 (0) 1 (0) 1 (0) 1 (0) 1 (0)15 0 (0) 0 (0) 0.994 (0.006) 1 (0) 1 (0) 1 (0)16 0 (0) 0 (0) 0.896 (0.062) 1 (0) 1 (0) 1 (0)17 0 (0) 0 (0) 0.545 (0.127) 1 (0) 1 (0) 1 (0)18 0 (0) 0 (0) 0.175 (0.076) 1 (0) 1 (0) 1 (0)19 0 (0) 0 (0) 0.027 (0.017) 1 (0) 1 (0) 1 (0)20 0 (0) 0 (0) 0.002 (0.002) 1 (0) 1 (0) 1 (0)21 0 (0) 0 (0) 0 (0) 1 (0) 1 (0) 1 (0)22 0 (0) 0 (0) 0 (0) 0.993 (0.005) 1 (0) 1 (0)23 0 (0) 0 (0) 0 (0) 0.949 (0.025) 1 (0) 1 (0)24 0 (0) 0 (0) 0 (0) 0.799 (0.062) 1 (0) 1 (0)25 0 (0) 0 (0) 0 (0) 0.537 (0.082) 1 (0) 1 (0)
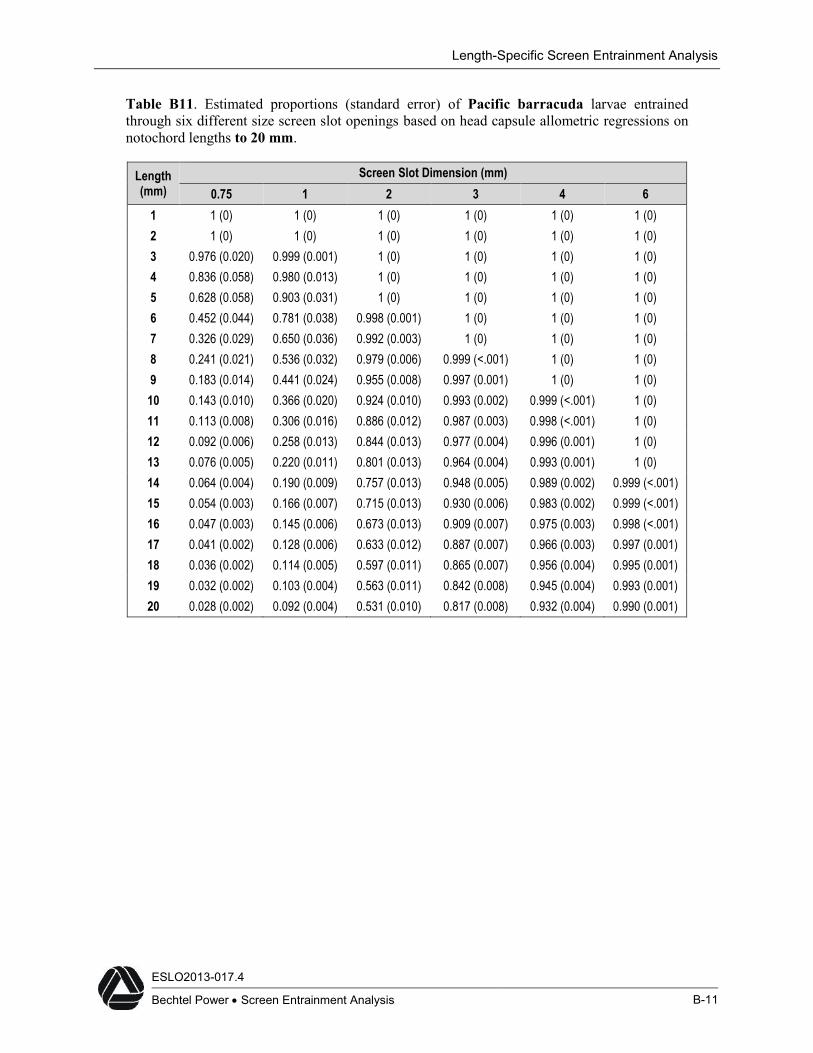
Length-Specific Screen Entrainment Analysis
ESLO2013-017.4
Bechtel Power Screen Entrainment Analysis B-11
Table B11. Estimated proportions (standard error) of Pacific barracuda larvae entrainedthrough six different size screen slot openings based on head capsule allometric regressions onnotochord lengths to 20 mm.
Length(mm)
Screen Slot Dimension (mm)0.75 1 2 3 4 6
1 1 (0) 1 (0) 1 (0) 1 (0) 1 (0) 1 (0)2 1 (0) 1 (0) 1 (0) 1 (0) 1 (0) 1 (0)3 0.976 (0.020) 0.999 (0.001) 1 (0) 1 (0) 1 (0) 1 (0)4 0.836 (0.058) 0.980 (0.013) 1 (0) 1 (0) 1 (0) 1 (0)5 0.628 (0.058) 0.903 (0.031) 1 (0) 1 (0) 1 (0) 1 (0)6 0.452 (0.044) 0.781 (0.038) 0.998 (0.001) 1 (0) 1 (0) 1 (0)7 0.326 (0.029) 0.650 (0.036) 0.992 (0.003) 1 (0) 1 (0) 1 (0)8 0.241 (0.021) 0.536 (0.032) 0.979 (0.006) 0.999 (<.001) 1 (0) 1 (0)9 0.183 (0.014) 0.441 (0.024) 0.955 (0.008) 0.997 (0.001) 1 (0) 1 (0)
10 0.143 (0.010) 0.366 (0.020) 0.924 (0.010) 0.993 (0.002) 0.999 (<.001) 1 (0)11 0.113 (0.008) 0.306 (0.016) 0.886 (0.012) 0.987 (0.003) 0.998 (<.001) 1 (0)12 0.092 (0.006) 0.258 (0.013) 0.844 (0.013) 0.977 (0.004) 0.996 (0.001) 1 (0)13 0.076 (0.005) 0.220 (0.011) 0.801 (0.013) 0.964 (0.004) 0.993 (0.001) 1 (0)14 0.064 (0.004) 0.190 (0.009) 0.757 (0.013) 0.948 (0.005) 0.989 (0.002) 0.999 (<.001)15 0.054 (0.003) 0.166 (0.007) 0.715 (0.013) 0.930 (0.006) 0.983 (0.002) 0.999 (<.001)16 0.047 (0.003) 0.145 (0.006) 0.673 (0.013) 0.909 (0.007) 0.975 (0.003) 0.998 (<.001)17 0.041 (0.002) 0.128 (0.006) 0.633 (0.012) 0.887 (0.007) 0.966 (0.003) 0.997 (0.001)18 0.036 (0.002) 0.114 (0.005) 0.597 (0.011) 0.865 (0.007) 0.956 (0.004) 0.995 (0.001)19 0.032 (0.002) 0.103 (0.004) 0.563 (0.011) 0.842 (0.008) 0.945 (0.004) 0.993 (0.001)20 0.028 (0.002) 0.092 (0.004) 0.531 (0.010) 0.817 (0.008) 0.932 (0.004) 0.990 (0.001)
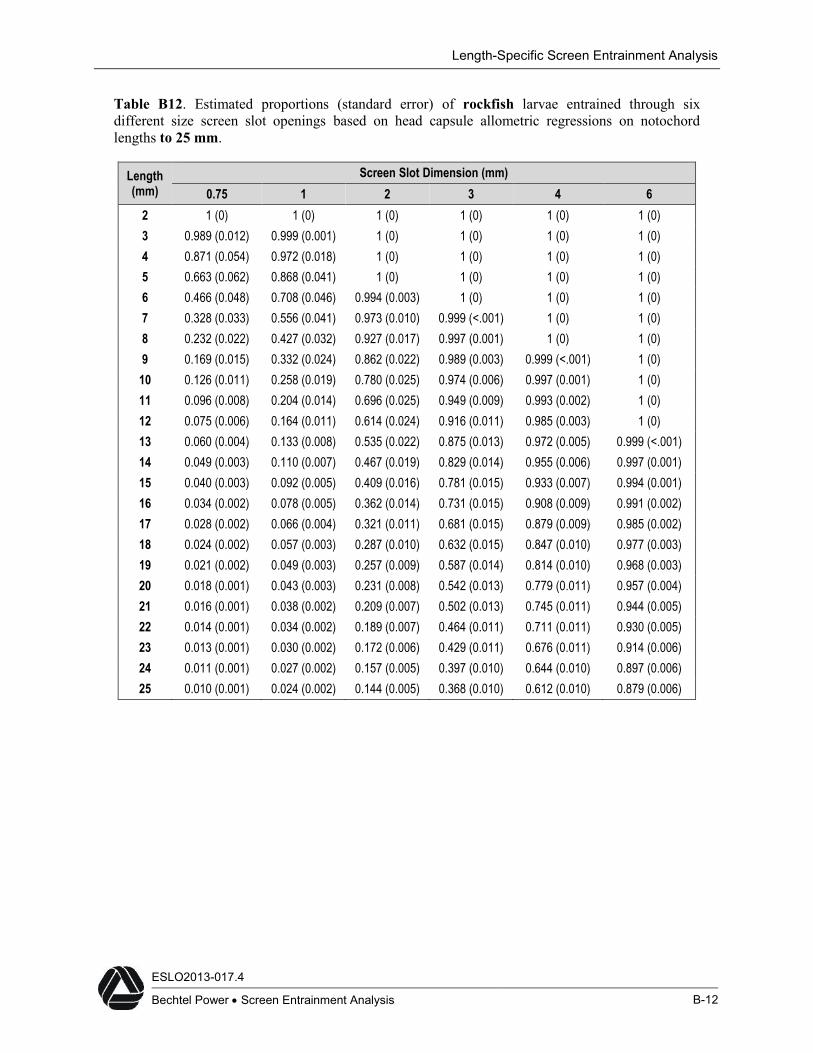
Length-Specific Screen Entrainment Analysis
ESLO2013-017.4
Bechtel Power Screen Entrainment Analysis B-12
Table B12. Estimated proportions (standard error) of rockfish larvae entrained through sixdifferent size screen slot openings based on head capsule allometric regressions on notochordlengths to 25 mm.
Length(mm)
Screen Slot Dimension (mm)0.75 1 2 3 4 6
2 1 (0) 1 (0) 1 (0) 1 (0) 1 (0) 1 (0)3 0.989 (0.012) 0.999 (0.001) 1 (0) 1 (0) 1 (0) 1 (0)4 0.871 (0.054) 0.972 (0.018) 1 (0) 1 (0) 1 (0) 1 (0)5 0.663 (0.062) 0.868 (0.041) 1 (0) 1 (0) 1 (0) 1 (0)6 0.466 (0.048) 0.708 (0.046) 0.994 (0.003) 1 (0) 1 (0) 1 (0)7 0.328 (0.033) 0.556 (0.041) 0.973 (0.010) 0.999 (<.001) 1 (0) 1 (0)8 0.232 (0.022) 0.427 (0.032) 0.927 (0.017) 0.997 (0.001) 1 (0) 1 (0)9 0.169 (0.015) 0.332 (0.024) 0.862 (0.022) 0.989 (0.003) 0.999 (<.001) 1 (0)
10 0.126 (0.011) 0.258 (0.019) 0.780 (0.025) 0.974 (0.006) 0.997 (0.001) 1 (0)11 0.096 (0.008) 0.204 (0.014) 0.696 (0.025) 0.949 (0.009) 0.993 (0.002) 1 (0)12 0.075 (0.006) 0.164 (0.011) 0.614 (0.024) 0.916 (0.011) 0.985 (0.003) 1 (0)13 0.060 (0.004) 0.133 (0.008) 0.535 (0.022) 0.875 (0.013) 0.972 (0.005) 0.999 (<.001)14 0.049 (0.003) 0.110 (0.007) 0.467 (0.019) 0.829 (0.014) 0.955 (0.006) 0.997 (0.001)15 0.040 (0.003) 0.092 (0.005) 0.409 (0.016) 0.781 (0.015) 0.933 (0.007) 0.994 (0.001)16 0.034 (0.002) 0.078 (0.005) 0.362 (0.014) 0.731 (0.015) 0.908 (0.009) 0.991 (0.002)17 0.028 (0.002) 0.066 (0.004) 0.321 (0.011) 0.681 (0.015) 0.879 (0.009) 0.985 (0.002)18 0.024 (0.002) 0.057 (0.003) 0.287 (0.010) 0.632 (0.015) 0.847 (0.010) 0.977 (0.003)19 0.021 (0.002) 0.049 (0.003) 0.257 (0.009) 0.587 (0.014) 0.814 (0.010) 0.968 (0.003)20 0.018 (0.001) 0.043 (0.003) 0.231 (0.008) 0.542 (0.013) 0.779 (0.011) 0.957 (0.004)21 0.016 (0.001) 0.038 (0.002) 0.209 (0.007) 0.502 (0.013) 0.745 (0.011) 0.944 (0.005)22 0.014 (0.001) 0.034 (0.002) 0.189 (0.007) 0.464 (0.011) 0.711 (0.011) 0.930 (0.005)23 0.013 (0.001) 0.030 (0.002) 0.172 (0.006) 0.429 (0.011) 0.676 (0.011) 0.914 (0.006)24 0.011 (0.001) 0.027 (0.002) 0.157 (0.005) 0.397 (0.010) 0.644 (0.010) 0.897 (0.006)25 0.010 (0.001) 0.024 (0.002) 0.144 (0.005) 0.368 (0.010) 0.612 (0.010) 0.879 (0.006)

Length-Specific Screen Entrainment Analysis
ESLO2013-017.4
Bechtel Power Screen Entrainment Analysis B-13
Table B13. Estimated proportions (standard error) of cabezon larvae entrained through sixdifferent size screen slot openings based on head capsule allometric regressions on notochordlengths to 25 mm.
Length(mm)
Screen Slot Dimension (mm)0.75 1 2 3 4 6
2 1 (0) 1 (0) 1 (0) 1 (0) 1 (0) 1 (0)3 0.998 (0.003) 1 (0) 1 (0) 1 (0) 1 (0) 1 (0)4 0.926 (0.048) 0.995 (0.006) 1 (0) 1 (0) 1 (0) 1 (0)5 0.690 (0.081) 0.934 (0.033) 1 (0) 1 (0) 1 (0) 1 (0)6 0.431 (0.066) 0.776 (0.057) 0.999 (0.001) 1 (0) 1 (0) 1 (0)7 0.250 (0.038) 0.572 (0.056) 0.992 (0.004) 1 (0) 1 (0) 1 (0)8 0.165 (0.016) 0.396 (0.042) 0.968 (0.011) 0.999 (<.001) 1 (0) 1 (0)9 0.119 (0.011) 0.289 (0.023) 0.918 (0.019) 0.996 (0.002) 1 (0) 1 (0)
10 0.087 (0.008) 0.224 (0.016) 0.842 (0.025) 0.986 (0.004) 0.999 (<.001) 1 (0)11 0.066 (0.006) 0.177 (0.013) 0.753 (0.028) 0.966 (0.008) 0.996 (0.001) 1 (0)12 0.052 (0.004) 0.141 (0.010) 0.659 (0.026) 0.934 (0.011) 0.990 (0.003) 1 (0)13 0.041 (0.003) 0.114 (0.007) 0.587 (0.019) 0.891 (0.014) 0.978 (0.004) 0.999 (<.001)14 0.033 (0.003) 0.094 (0.006) 0.526 (0.018) 0.838 (0.017) 0.960 (0.007) 0.998 (0.001)15 0.027 (0.002) 0.079 (0.005) 0.475 (0.015) 0.785 (0.015) 0.936 (0.008) 0.995 (0.001)16 0.023 (0.002) 0.066 (0.004) 0.426 (0.014) 0.737 (0.013) 0.904 (0.010) 0.990 (0.002)17 0.019 (0.002) 0.056 (0.003) 0.383 (0.012) 0.693 (0.013) 0.868 (0.011) 0.983 (0.003)18 0.016 (0.001) 0.048 (0.003) 0.346 (0.011) 0.652 (0.013) 0.833 (0.010) 0.974 (0.004)19 0.014 (0.001) 0.042 (0.003) 0.313 (0.010) 0.614 (0.012) 0.803 (0.010) 0.961 (0.005)20 0.012 (0.001) 0.036 (0.002) 0.284 (0.009) 0.576 (0.012) 0.772 (0.010) 0.946 (0.006)21 0.011 (0.001) 0.032 (0.002) 0.259 (0.008) 0.542 (0.011) 0.742 (0.010) 0.928 (0.006)22 0.009 (0.001) 0.028 (0.002) 0.236 (0.007) 0.508 (0.010) 0.711 (0.009) 0.909 (0.006)23 0.008 (0.001) 0.025 (0.002) 0.216 (0.007) 0.477 (0.010) 0.682 (0.010) 0.891 (0.006)24 0.007 (0.001) 0.022 (0.002) 0.198 (0.006) 0.449 (0.009) 0.653 (0.009) 0.874 (0.006)25 0.007 (0.001) 0.020 (0.001) 0.182 (0.006) 0.422 (0.009) 0.626 (0.009) 0.856 (0.006)
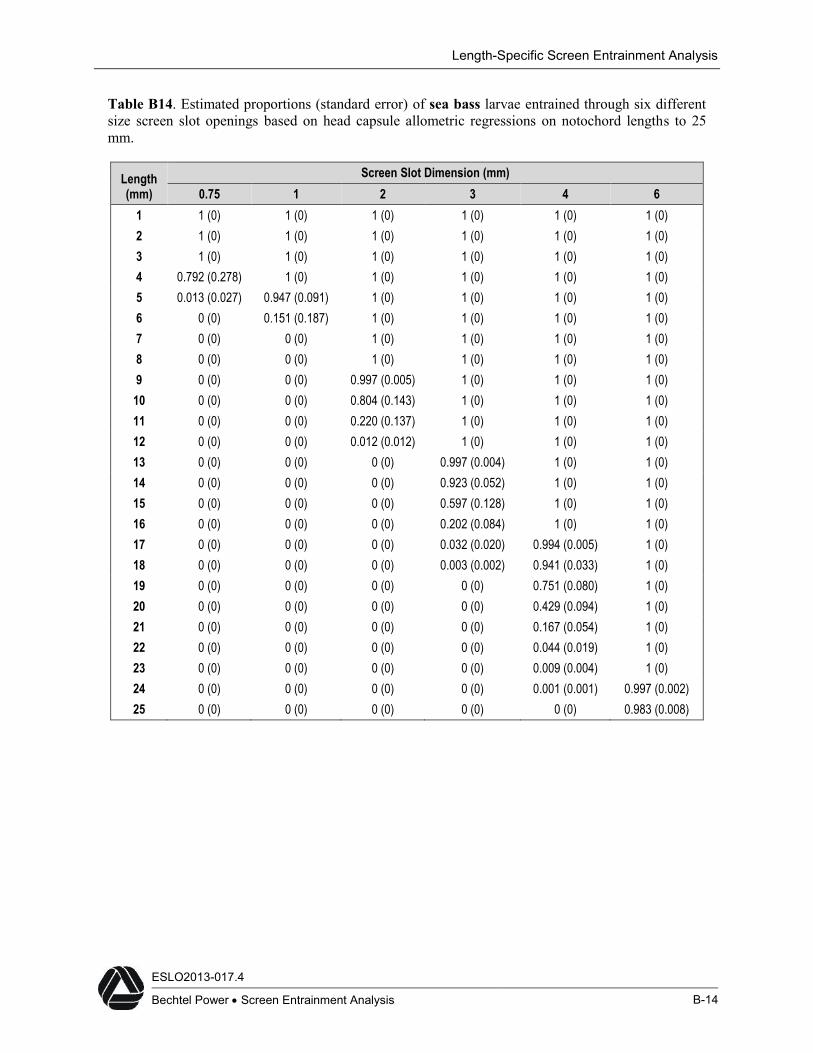
Length-Specific Screen Entrainment Analysis
ESLO2013-017.4
Bechtel Power Screen Entrainment Analysis B-14
Table B14. Estimated proportions (standard error) of sea bass larvae entrained through six differentsize screen slot openings based on head capsule allometric regressions on notochord lengths to 25mm.
Length(mm)
Screen Slot Dimension (mm)0.75 1 2 3 4 6
1 1 (0) 1 (0) 1 (0) 1 (0) 1 (0) 1 (0)2 1 (0) 1 (0) 1 (0) 1 (0) 1 (0) 1 (0)3 1 (0) 1 (0) 1 (0) 1 (0) 1 (0) 1 (0)4 0.792 (0.278) 1 (0) 1 (0) 1 (0) 1 (0) 1 (0)5 0.013 (0.027) 0.947 (0.091) 1 (0) 1 (0) 1 (0) 1 (0)6 0 (0) 0.151 (0.187) 1 (0) 1 (0) 1 (0) 1 (0)7 0 (0) 0 (0) 1 (0) 1 (0) 1 (0) 1 (0)8 0 (0) 0 (0) 1 (0) 1 (0) 1 (0) 1 (0)9 0 (0) 0 (0) 0.997 (0.005) 1 (0) 1 (0) 1 (0)
10 0 (0) 0 (0) 0.804 (0.143) 1 (0) 1 (0) 1 (0)11 0 (0) 0 (0) 0.220 (0.137) 1 (0) 1 (0) 1 (0)12 0 (0) 0 (0) 0.012 (0.012) 1 (0) 1 (0) 1 (0)13 0 (0) 0 (0) 0 (0) 0.997 (0.004) 1 (0) 1 (0)14 0 (0) 0 (0) 0 (0) 0.923 (0.052) 1 (0) 1 (0)15 0 (0) 0 (0) 0 (0) 0.597 (0.128) 1 (0) 1 (0)16 0 (0) 0 (0) 0 (0) 0.202 (0.084) 1 (0) 1 (0)17 0 (0) 0 (0) 0 (0) 0.032 (0.020) 0.994 (0.005) 1 (0)18 0 (0) 0 (0) 0 (0) 0.003 (0.002) 0.941 (0.033) 1 (0)19 0 (0) 0 (0) 0 (0) 0 (0) 0.751 (0.080) 1 (0)20 0 (0) 0 (0) 0 (0) 0 (0) 0.429 (0.094) 1 (0)21 0 (0) 0 (0) 0 (0) 0 (0) 0.167 (0.054) 1 (0)22 0 (0) 0 (0) 0 (0) 0 (0) 0.044 (0.019) 1 (0)23 0 (0) 0 (0) 0 (0) 0 (0) 0.009 (0.004) 1 (0)24 0 (0) 0 (0) 0 (0) 0 (0) 0.001 (0.001) 0.997 (0.002)25 0 (0) 0 (0) 0 (0) 0 (0) 0 (0) 0.983 (0.008)
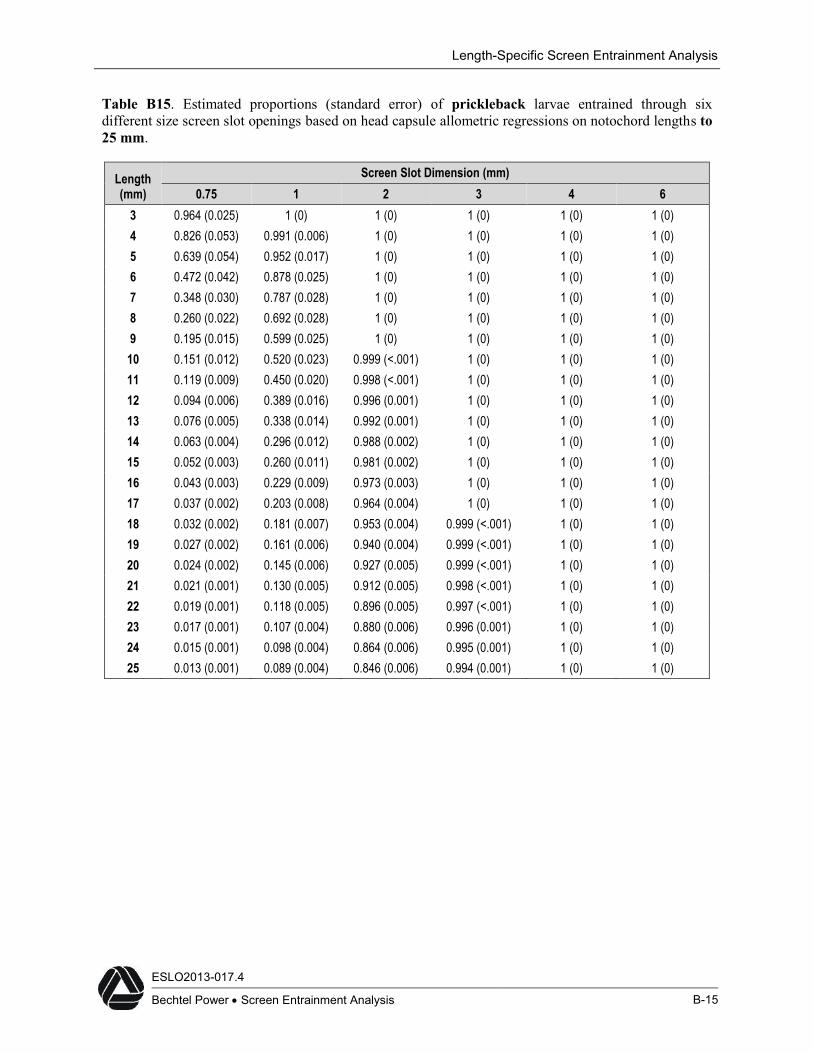
Length-Specific Screen Entrainment Analysis
ESLO2013-017.4
Bechtel Power Screen Entrainment Analysis B-15
Table B15. Estimated proportions (standard error) of prickleback larvae entrained through sixdifferent size screen slot openings based on head capsule allometric regressions on notochord lengths to25 mm.
Length(mm)
Screen Slot Dimension (mm)0.75 1 2 3 4 6
3 0.964 (0.025) 1 (0) 1 (0) 1 (0) 1 (0) 1 (0)4 0.826 (0.053) 0.991 (0.006) 1 (0) 1 (0) 1 (0) 1 (0)5 0.639 (0.054) 0.952 (0.017) 1 (0) 1 (0) 1 (0) 1 (0)6 0.472 (0.042) 0.878 (0.025) 1 (0) 1 (0) 1 (0) 1 (0)7 0.348 (0.030) 0.787 (0.028) 1 (0) 1 (0) 1 (0) 1 (0)8 0.260 (0.022) 0.692 (0.028) 1 (0) 1 (0) 1 (0) 1 (0)9 0.195 (0.015) 0.599 (0.025) 1 (0) 1 (0) 1 (0) 1 (0)
10 0.151 (0.012) 0.520 (0.023) 0.999 (<.001) 1 (0) 1 (0) 1 (0)11 0.119 (0.009) 0.450 (0.020) 0.998 (<.001) 1 (0) 1 (0) 1 (0)12 0.094 (0.006) 0.389 (0.016) 0.996 (0.001) 1 (0) 1 (0) 1 (0)13 0.076 (0.005) 0.338 (0.014) 0.992 (0.001) 1 (0) 1 (0) 1 (0)14 0.063 (0.004) 0.296 (0.012) 0.988 (0.002) 1 (0) 1 (0) 1 (0)15 0.052 (0.003) 0.260 (0.011) 0.981 (0.002) 1 (0) 1 (0) 1 (0)16 0.043 (0.003) 0.229 (0.009) 0.973 (0.003) 1 (0) 1 (0) 1 (0)17 0.037 (0.002) 0.203 (0.008) 0.964 (0.004) 1 (0) 1 (0) 1 (0)18 0.032 (0.002) 0.181 (0.007) 0.953 (0.004) 0.999 (<.001) 1 (0) 1 (0)19 0.027 (0.002) 0.161 (0.006) 0.940 (0.004) 0.999 (<.001) 1 (0) 1 (0)20 0.024 (0.002) 0.145 (0.006) 0.927 (0.005) 0.999 (<.001) 1 (0) 1 (0)21 0.021 (0.001) 0.130 (0.005) 0.912 (0.005) 0.998 (<.001) 1 (0) 1 (0)22 0.019 (0.001) 0.118 (0.005) 0.896 (0.005) 0.997 (<.001) 1 (0) 1 (0)23 0.017 (0.001) 0.107 (0.004) 0.880 (0.006) 0.996 (0.001) 1 (0) 1 (0)24 0.015 (0.001) 0.098 (0.004) 0.864 (0.006) 0.995 (0.001) 1 (0) 1 (0)25 0.013 (0.001) 0.089 (0.004) 0.846 (0.006) 0.994 (0.001) 1 (0) 1 (0)