report - resolution foundation...time the resolution foundation has published detailed analysis of...
TRANSCRIPT

REPORT
[email protected] +44 (0)203 372 2960 @resfoundation resolutionfoundation.org
Happy now?Lessons for economic policy makers from a focus on subjective well-being George Bangham
February 2019

2Resolution Foundation | Happy now?Acknowledgements
DownloadThis document is available to download as a free PDF at:https://www.resolutionfoundation.org/publications/happy-now
CitationIf you are using this document in your own writing, our preferred citation is:G. Bangham, Happy now?: Lessons for economic policy makers from a focus on subjective well-being, Resolution Foundation, February 2019
Permission to shareThis document is published under the Creative Commons Attribution Non Commercial No Derivatives 3.0 England and Wales Licence. This allows anyone to download, reuse, reprint, distribute, and/or copy Resolution Foundation publications without written permission subject to the conditions set out in the Creative Commons Licence. For commercial use, please contact: [email protected]
Acknowledgements
The author thanks Matthew Whittaker, Adam Corlett and Torsten Bell.
ONS crown copyright
This work contains statistical data from ONS which is Crown Copyright. The use of the ONS statistical data in this work does not imply the endorsement of the ONS in relation to the interpretation or analysis of the statistical data. This work uses research datasets which may not exactly reproduce National Statistics aggregates.
3Resolution Foundation | Happy now?Contents
Contents
Acknowledgements 2Executive Summary 4Section 1: Introduction 8Section 2: Well-being and income 16Section 3: Well-being in the labour market 21Section 4: Place and housing tenure 28Section 5: How has subjective well-being changed over time, and why? 33 Conclusion 43Annex 45

4Resolution Foundation | Happy now?Executive Summary
Executive Summary
How happy are people in the United Kingdom? How satisfied are they with their lives? These questions and others are central to the well-being agenda that has been growing in prominence in economic and wider policy circles since the turn of the century. At its core is the view that what is ultimately of value is human flourishing broadly defined, rather than the pounds and pence of Gross Domestic Product that traditionally dominates economic policy makers’ discussions.
In a sign that well-being had become a mainstream topic in public policy, in 2011 the Office for National Statistics started collecting data on ‘subjective well-being’ in several of its household surveys. Other government datasets have since followed suit. Unlike the usual economic living standards metrics, which measure externally-observed ‘objective’ factors like income and expenditure, subjective well-being data is collected by asking people to rate their own well-being – measuring it from their own perspective.
The aim behind collecting such data was in part the recognition that life is about more than pounds and pence, but it went beyond measuring well-being for its own sake. The broader intention was to better inform policy makers about what objectives they should pursue and what policies might have most value in terms of increasing our well-being. This paper, the first time the Resolution Foundation has published detailed analysis of subjective well-being, therefore takes a wide-ranging look at what well-being data has to offer by way of lessons for economic policy makers concerned with raising the nation’s living standards.
Well-being data shows that there’s more to life than economics, but that it still really matters
Subjective well-being data reminds us that economic trends aren’t the be-all and end-all of living standards: two of the most powerful influences on someone’s self-assessed level of well-being are a good (self-reported) state of health and their being in a stable relationship. But the data also reinforces the fact that economic outcomes do matter, revealing that higher employment rates and incomes improve well-being and allowing us to answer new questions, like how much changes in well-being relate to changes in income for households with incomes of £100,000 compared to those with incomes of £10,000.

5Resolution Foundation | Happy now?Executive Summary
Higher-income households report higher subjective well-being, but with diminishing returns
Subjective well-being tends to be higher among higher-income households, but the correlation is not a straight-line one. Looking at measures of life satisfaction, for example, shows that higher income households score higher. The satisfaction premium over a lower income household does not relate to the absolute size of the difference in their incomes, however, but rather the relative size of the difference as a proportion of their incomes. That suggests that an additional £1,000 in household income would raise the well-being of a low-income household by more than it would that of a high-income one. One implication is that policy makers concerned with well-being should favour a redistributive policy for its potential to raise overall average well-being.
A job increases well-being, but the well-being drop from losing a job is bigger than the well-being gain from getting into work
Having a job is better than not having one, according to the subjective well-being data, and the well-being boost is about more than just the increased income associated with it, as it remains even once we control for factors such as household income, earnings, age and region. The impact of job gains and job losses is also asymmetric: the drop in subjective well-being from losing a job is substantially bigger than the gain in well-being that an unemployed person receives from getting into employment, all other things equal. The well-being impact of losing one’s job is greater than can be explained by loss of income alone, reinforcing the sense that particularly fast employment churn may not be desirable.
Looking more broadly, the kind of work - not just its existence - matters for well-being. Self-employed work is associated with higher happiness and a stronger sense that life is worthwhile, if we control for earnings, though it is less strongly associated with life satisfaction. People on permanent contracts have higher well-being, all things equal, as do people who work as many hours as they would like to.
But life is about more than work, and the economic activity group that is most likely to be satisfied, happy and free from anxiety is retirees. This is partly because our well-being on average falls from our late 20s right through to our early 50s. It then rises sharply, with those in their late 60s and 70s having better self-worth and happiness than 20 somethings. Retirement also however boosts well-being even once we control for factors like age and income. These findings reinforce the case for ensuring that today’s younger cohorts (and their employers) save enough to provide pensions that are adequate for them to retire at a reasonable age.

6Resolution Foundation | Happy now?Executive Summary
Home and place matters: housing tenure is strongly associated with well-being, and the regional variation in well-being is significant
The labour market isn’t everything in determining society’s average subjective well-being. Where people live matters a lot as well. Homeowners have the highest level of well-being, even when controlling for income and other characteristics, while social renters have the lowest level. This should reinforce the need for action to improve housing quality in the social rented sector and security in the private rented sector, while also reinforcing the support of policy makers of all parties for home ownership.
Region of residence matters not only directly, with well-being varying by place, but also indirectly, since the impact on well-being of losing a job (for example) is greater in some regions than others. All other things equal, people becoming unemployed in Scotland record a bigger drop in well-being than any other UK region or nation, whereas people in Wales and the West Midlands report the smallest drops. Paradoxically, the highest average life satisfaction and happiness (and the biggest growth since 2011) are reported in Northern Ireland, the UK location which has had the poorest-performing labour market over the past few years.
Well-being data has a lot to tell policy makers, but also leaves a big puzzle unanswered by advocates for its use for public policy
Average subjective well-being has been rising across the country since the main data series began in 2011, on all four official measures of well-being. While some have argued that this is only the result of the recovery from the financial crisis, that is an unpersuasive argument given this secular upward trend is likely to have begun in the 1990s, according to longer-running datasets. This conclusion is reinforced by the fact that most of this trend is attributable to unexplained growth in well-being across every demographic group. The rise in the employment rate during this period has certainly helped a little, but this cannot explain the overwhelming majority of the rise in self-reported well-being. Indeed, even if employment had not grown since 2011, detailed analysis shows the upwards trend in average well-being would still have been strong.

7Resolution Foundation | Happy now?Executive Summary
Well-being data is a valuable additional measure of living standards, that complements but does not supersede economic measures
Some users of subjective well-being data suggest it ought to (largely) replace GDP as an objective of economic policy, and that the policies that will improve well-being are different from the typical priorities of economic policy. In this paper we argue that subjective well-being data is a complement to, rather than a replacement for, longer-established economic statistics, and that if policymakers seek to raise well-being then their choice of how to do so is important. The widespread focus among policymakers on boosting well-being is welcome, but the way to achieve this is to focus on the core policy priorities of better jobs, income redistribution, secure housing and strong healthcare.
A common counter-argument to policies to improve well-being is the one put forward by many psychologists that everyone ultimately has a fixed underlying level of well-being, which policy can do little to change. In this paper we take the economists’ view that policy can help to improve the well-being of every person, so this is a worthwhile aim for policy makers. They do however need to understand the limitations of subjective well-being data, and only use it to test propositions that it can reasonably be used to answer.
Well-being data is valuable in and of itself and provides important lessons for policy makers that take it seriously
We conclude with recommendations for policymakers who seek to boost well-being. It would be desirable if further boosts to average well-being could be delivered via higher employment. But given the present point in the economic cycle, and the fact that the UK is already at four-decade record high levels of employment, other policy areas are more likely to raise well-being in the short-term. Instead the best prospects for policy makers targetting future increases in national well-being lie in raising job quality, raising incomes particularly at the lower end, and policies to improve security in the housing market both by promoting homeownership and improving renters’ rights.

8Resolution Foundation | Happy now?Introduction
Section 1
Introduction
Interest in subjective measures of well-being has been increasing in recent years – not least since the ONS began collecting data on a regular basis from 2011. This growing focus on measuring how people judge the quality of their own life undoubtedly provides a rich new perspective on living standards that merits detailed exploration in its own right. But what can it teach policymakers about the areas they should be focusing on in order to most effectively boost well-being across society?
To dig into that question this paper focuses specifically on the relationship between subjective well-being and a variety of economic living standards measures; asking not just whether the latter are linked with the former, but how?
The study of subjective well-being is a vast and well-established academic field, with a majority of OECD countries now collecting some form of well-being data.[1] It offers an important approach to capturing what matters for happiness or satisfaction, showing how people assess their quality of life from their own perspective rather than against metrics established according to what a third-party observer thinks is important. But it is also not without controversy. There is considerable debate about how best to define and measure ‘well-being’, and even about whether individuals can durably increase their well-being at all.[2] The interpretation of well-being data is also complicated by the nature of the measurement scales, most responses to which tend to cluster in the same few categories.
In this report, we do not wade into the wider debate about the merits of different approaches to well-being measurement (Box 1 gives a brief summary of how well-being is measured and the specific data used in this report). Instead, we seek to answer a simpler question: namely what the well-being data might be able to teach us about the relative importance of different approaches to economic policy. Money might not make us ‘happy’, but does it at least make us happier? And if so, how?
[1] E Diener, R E Lucas and S Oishi, ‘Advances and Open Questions in the Science of Subjective Well-Being’, Collabra: Psychology 4(1): 15, 2018; A A Stone and A B Krueger, ‘Understanding subjective well-being’, in J Stiglitz, J-P Fitoussi and M Durand, For Good Measure: Advancing Research on Well-being Metrics Beyond GDP, OECD, November 2018[2] See for example the principle of ‘well-being homeostasis’, in which people’s finances and relationships allow them to smooth out changes in well-being over time, proposed in R A Cummins, ‘Measuring Population Happiness to Inform Public Policy’, National Centre for Social and Economic Modelling, Canberra, 2009.

9Resolution Foundation | Happy now?Introduction
i Box 1: Measuring subjective well-being
[3] E Diener, R E Lucas and S Oishi, ‘Advances and Open Questions in the Science of Subjective Well-Being’, Collabra: Psychology 4(1): 15, 2018[4] D Cameron, ‘Speech on Well-being’, November 2010. For a more detailed history of the development of UK well-being measurement, see P Allin and DJ Hand, ‘New statistics for old?—measuring the well-being of the UK’, Journal of the Royal Statistical Society 2017; I Bache, ‘Measuring Quality of Life: an idea whose time has come?’, Political Studies Association Annual International Conference, 2013[5] For more details see Office for National Statistics, Measures of National Well-being Dashboard[6] For a summary of the technical debate on the measurement of subjective well-being see: A Ferrer-i-Carbonell, ‘Income and well-being: an empirical analysis of the comparison income effect’, Journal of Public Economics 89, 2005. A comprehensive guide to state-of-the-art subjective well-being measurement for policymakers is found in the OECD Guidelines on Measuring Subjective Well-Being (2013)
The direct measurement of people’s well-being was regarded by economists for much of the 20th century as a fruitless task. It was simply too difficult to measure well-being and to decide how different people’s well-being ought to be compared, while accounting for differences in their incomes and backgrounds. Even among the same individuals, it was tricky to decide how their well-being ought to be compared over time. Should someone’s future well-being in ten years’ time be discounted to reflect the small probability that they might no longer be alive at that point? Economists got around the question by defining people’s utility as their realisation of material preferences.
Over the past decade however, subjective well-being has been heavily integrated into the design and evaluation of public policy around the world, with the consensus being that subjective well-being measurement can get around many of its former problems.[3] The UK government took a greater interest in 2010, with David Cameron announcing that the Office for National Statistics (ONS) would begin asking questions about subjective well-being in several major household surveys from April 2011.[4] It now asks the questions in over 20 household surveys.
The ONS measures personal well-being by asking individuals four questions:
• Overall, how satisfied are you with your life nowadays?
• Overall, to what extent do you feel the things you do in your life are worthwhile?
• Overall, how happy did you feel yesterday?
• Overall, how anxious did you feel yesterday?[5]
Respondents are asked to respond to each question on a scale from 0 and 10, where 0 is low (‘not at all’) and 10 is high (‘completely’). We don’t dwell on the mathematical assumptions that underlie well-being measurement, because they are complicated and widely documented elsewhere. But it is useful to think about the basic assumptions that need to be made in order to analyse questions that are asked on a bounded, discrete scale. If, for example, Person A reports well-being of 8 and Person B reports well-being of 6, we must assume that Person A’s well-being is strictly higher than that of Person B in all circumstances. [6]

10Resolution Foundation | Happy now?Introduction
Each of the four ONS measures aims to capture different elements of well-being, but we choose to focus primarily on the first and third: life satisfaction and happiness. Life satisfaction is regarded as more stable and less sensitive to measurement problems than the other questions, since it asks people to reflect on their well-being over a longer period of time rather than in the short-term. We focus also on happiness, as it provides an insight into people’s affective enjoyment of their lives in the short-term, and can be compared with fine-grained measures that ask how much they are enjoying their present activity as often as every ten minutes.
Our analysis of the four ONS measures moves between two main datasets over the course of this report, depending on the question of interest.
The Annual Population Survey (APS) provides us with a regular, quarterly time series of responses across the four well-being measures covering the period from April 2011 onwards. By combining responses across all waves of the survey, we can establish a database of more than 1.1 million observations that allows us to undertake detailed analysis of what drives well-being.
The APS does not include any details of respondents’ incomes however, and it provides limited information on their state of health. We therefore also make use of the DWP’s Family Resources Survey (FRS), which provides a more
[7] T N Bond and K Lang, ‘The Sad Truth About Happiness Scales’, NBER working paper 19950, March 2014. Among its other arguments, this paper argues that grouping happiness into categories – like ‘very happy’ or ‘7 out of 10’ - hides the distribution within each category. Making different assumptions about the distribution of responses within each category can substantially alter the conclusions drawn.[8] Eurobarometer Data Service, ‘Life Satisfaction’
limited (from 2014) and less regular (annual) time series. The FRS does have a relatively high rate of proxy responses, where one household member has answered on behalf of others, and it does not provide statistical weights to account for the corresponding fall in responses to well-being questions. But it is nonetheless a valuable source of data.
Additionally, we make use of longitudinal data in Understanding Society (USOC) in order to analyse within-person variation over time and overcome some of the limitations associated with a cross-sectional approach.[7] USOC does not ask the same well-being questions as the other surveys. Instead it provides two measures of interest: one question about ‘general life satisfaction’ on a 0 to 7 scale, and responses to the General Health Questionnaire (GHQ-12), a 12-question standard tool designed to assess individuals’ mental health that is summarised in a single scale between 0 and 12 (known as the Caseness scale). Box 2 provides more detail on this measure.
The final dataset we make use of is the Eurobarometer survey of people across Europe. The exact question and scale used in the survey has varied over the years, meaning it must be treated with some caution. But it does provide a useful sense of trends in life satisfaction (similar in scope and scale to the first of the ONS well-being measures) since 1973.[8]

11Resolution Foundation | Happy now?Introduction
We might expect well-being to be the product of a range of factors related to the personal characteristics of an individual: for instance how old they are, whether or not they are in a relationship, where they live, or their state of health. We might expect economic factors to play a role too: whether or not they are in work, how much they earn, the nature of their housing tenure and, ultimately, how much disposable income they have.
It is the relationship between well-being and the second group of factors that we are primarily interested in exploring in this report, and forthcoming sections will look at each of them in turn. But it is important to understand the role of the former group too, not least because it will affect our interpretation of the well-being recorded by any given individual. Before we look more deeply into the link between economic measures and well-being, therefore, we will first outline the relative importance of an array of different characteristics.
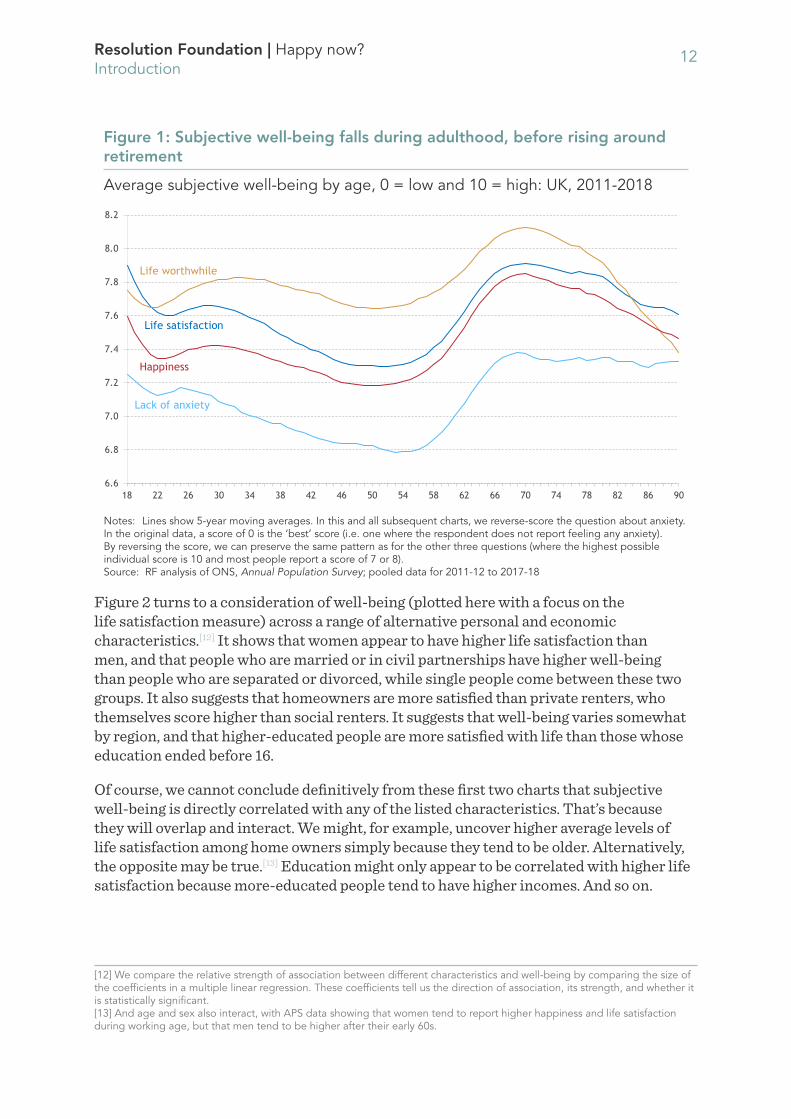
We begin with age. Pooling all waves of APS data from 2011-12 to 2017-18, Figure 1 plots the average level of well-being on the four main ONS measures for people of each single year of age. On all measures of subjective well-being, teenagers score higher than people in their early 20s. Life satisfaction, happiness and sense that life is worthwhile then climb slightly until people’s mid-30s, before falling until people reach around 50. People’s likelihood of having low anxiety about life rises only a little in their 20s, and then falls until it reaches a low point in their mid-50s. On all measures, subjective well-being then climbs rapidly on average as people move from their mid-50s towards retirement age. It reaches its peak levels soon after typical retirement age, and then life satisfaction, happiness and worth fall steadily as people get older, while anxiety stays at a consistent level.[9] Broadly speaking, well-being seems to be highest around age 70 and lowest in people’s early 50s.
On each measure then, we observe the ‘classic’ U-shaped pattern of well-being over the lifecycle.[10] International evidence shows that this relationship holds across wealthier, particularly Anglophone countries, but not for poorer countries outside Europe and North America.[11]
[9] We do not report results for people aged over 90, as the smaller sample size makes them less reliable than those for other ages.[10] D G Blanchflower and A J Oswald, ‘Is well-being U-shaped over the life cycle?’, Social Science & Medicine 66, 2008[11] A Steptoe, A Deaton and A A Stone, ‘Subjective well-being, health, and ageing’, The Lancet 385, 2015
12Resolution Foundation | Happy now?Introduction
Figure 1: Subjective well-being falls during adulthood, before rising around retirement
Average subjective well-being by age, 0 = low and 10 = high: UK, 2011-2018
Notes: Lines show 5-year moving averages. In this and all subsequent charts, we reverse-score the question about anxiety. In the original data, a score of 0 is the ‘best’ score (i.e. one where the respondent does not report feeling any anxiety). By reversing the score, we can preserve the same pattern as for the other three questions (where the highest possible individual score is 10 and most people report a score of 7 or 8).Source: RF analysis of ONS, Annual Population Survey; pooled data for 2011-12 to 2017-18
Figure 2 turns to a consideration of well-being (plotted here with a focus on the life satisfaction measure) across a range of alternative personal and economic characteristics.[12] It shows that women appear to have higher life satisfaction than men, and that people who are married or in civil partnerships have higher well-being than people who are separated or divorced, while single people come between these two groups. It also suggests that homeowners are more satisfied than private renters, who themselves score higher than social renters. It suggests that well-being varies somewhat by region, and that higher-educated people are more satisfied with life than those whose education ended before 16.
Of course, we cannot conclude definitively from these first two charts that subjective well-being is directly correlated with any of the listed characteristics. That’s because they will overlap and interact. We might, for example, uncover higher average levels of life satisfaction among home owners simply because they tend to be older. Alternatively, the opposite may be true.[13] Education might only appear to be correlated with higher life satisfaction because more-educated people tend to have higher incomes. And so on.
[12] We compare the relative strength of association between different characteristics and well-being by comparing the size of the coefficients in a multiple linear regression. These coefficients tell us the direction of association, its strength, and whether it is statistically significant.[13] And age and sex also interact, with APS data showing that women tend to report higher happiness and life satisfaction during working age, but that men tend to be higher after their early 60s.
Life satisfaction
Life worthwhile
Happiness
Lack of anxiety
6.6
6.8
7.0
7.2
7.4
7.6
7.8
8.0
8.2
18 22 26 30 34 38 42 46 50 54 58 62 66 70 74 78 82 86 90

13Resolution Foundation | Happy now?Introduction
Figure 2: Reported life satisfaction varies markedly by personal and economic circumstance
Average level of life satisfaction: UK, 2011-18
Note: Health status is not featured here due to limited data coverage in the APS.Source: RF analysis of ONS, Annual Population Survey; pooled data for 2011-12 to 2017-18
To tease out the individual relationships between subjective well-being and a range of personal characteristics – while holding all else equal – we must undertake a regression analysis. We use FRS data (in order to include high-quality household income data in our modelling), and are therefore now covering the period 2014-2017 rather than 2011-2018. We detail the full regression results in Annex 1, and provide a summary in Figure 3. The strongest associations with well-being are those with self-reported health, with relationship status and with having a job.
0 1 2 3 4 5 6 7 8
LondonNorth WestNorth East
West MidlandsWales
Yorks & HumberEast Midlands
EastScotland
South WestSouth East
Northern Ireland
Social rentPrivate rent
MortgagorOwn outright
NoYes
UnemployedEconomically inactive
EmployedSelf-employed
Retired
SeparatedDivorcedWidowed
SingleCivil partnership
Married
MaleFemale
AllSex
Marital status
Economic status
Educated post-16
Housing tenure
Region

14Resolution Foundation | Happy now?Introduction
Region of residence has a significant association with well-being; Northern
Ireland tops the scale for both happiness and life satisfaction.
Women have higher life satisfaction, happiness and sense that life is worthwhile, compared to men, but they are more likely
to report anxiety about their life.
Age is closely associated with well-being, with teenagers and 70-year-olds having the highest levels and people in their early 50s
the lowest levels.
People who are married or in a civil partnership are likely to report substantially higher life satisfaction, happiness and sense that life is worthwhile, all other things equal.
Self-reported health correlates strongly with people’s subjective well-
being, exerting a larger effect than any other factor we model.
Higher income is linked with higher
well-being, though an extra £1,000 of income delivers a far greater well-
being boost to a household with £10,000 than one with £100,000
Homeowners are likely to have higher well-being than people in
other types of housing, with social renters least
happy and private renters the least satisfied with life.
Being retired is the best economic status for well-being, followed by self-employment
and employment. Unemployed and economically inactive people are less happy
than others, all other things equal.
Figure 3: Holding all else constant, well-being is positively correlated with being female, in a relationship, healthy and in work

15Resolution Foundation | Happy now?Introduction
So economics does appear to matter to well-being. But, if we want to understand the relative well-being impact of different economic outcomes – in order to inform our approach to policymaking – then we must dig deeper into some of these relationships. That’s the purpose of the remainder of this report. Specifically:
• Section 2 explores the link between household income and personal well-being;
• Section 3 looks at the labour market, asking how people’s subjective well-being is linked to their employment status and earnings;
• Section 4 turns to the role of place, looking at how (housing tenure) and where (region) people live is associated with their subjective well-being;
• Section 5 considers how subjective well-being has changed over time in the UK and elsewhere, asking whether recent improvements mark a recovery from the financial crisis or a more secular trend; and
• Section 6 concludes.

16Resolution Foundation | Happy now?Well-being and income
Section 2
Well-being and income
We have seen that household income does matter for subjective well-being. Levels of life satisfaction, happiness and sense that life is worthwhile all rise with income, while anxiety levels fall, even after accounting for all other personal and economic characteristics. But from the perspective of public policy-making, we should ask whether the well-being gain associated with raising income varies for different groups. Simply put, does redistribution of income from better-off households to worse-off ones produce an improvement in aggregate well-being or not?
In this section we explore how much each ‘step’ up the income ladder boosts well-being, alongside taking a look at the longitudinal impact of income rises (and losses) on the well-being of individuals.
Higher household income is associated with higher well-being among a household’s members, but there appear to be diminishing marginal returns
The intuitive idea that higher-income households have higher well-being is well-accepted in the literature and supported by many separate sources of data. More contentious is the precise nature of the relationship. Many studies find that happiness stops rising in proportion to income after a certain point, whereas life satisfaction does not.[14] So how much does well-being change for every additional £1 of income, and does the link weaken after income exceeds a certain threshold?
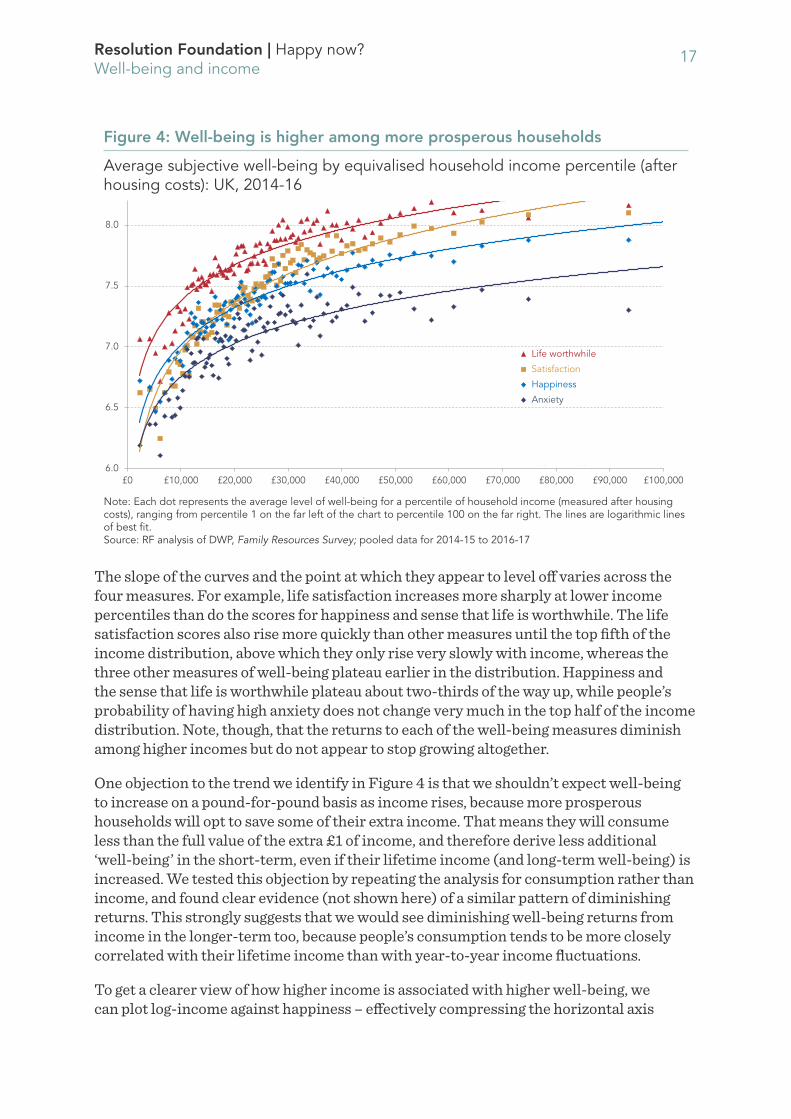
We’ve already shown that household income is positively correlated with well-being in the UK, even after controlling for a range of other personal and economic characteristics. But Figure 4 provides more detail, setting out the scores recorded on each of the four ONS well-being measures in the period 2014-16 for each household income percentile. It’s clear that people in households with higher income (on the right-hand side of the chart) tend to report higher levels of subjective well-being across the four ONS measures. But none of the relationships are linear, with the well-being return from each additional £1 of income appearing to diminish as incomes climb higher.
[14] D Kahneman and A Deaton, ‘High income improves evaluation of life but not emotional well-being’, PNAS, August 2010. See also the literature review in G O’Donnell, A Deaton, M Durand, D Halpern and R Layard, Well-being and Policy, Legatum Institute 2014
17Resolution Foundation | Happy now?Well-being and income
Figure 4: Well-being is higher among more prosperous households
Average subjective well-being by equivalised household income percentile (after housing costs): UK, 2014-16
Note: Each dot represents the average level of well-being for a percentile of household income (measured after housing costs), ranging from percentile 1 on the far left of the chart to percentile 100 on the far right. The lines are logarithmic lines of best fit.Source: RF analysis of DWP, Family Resources Survey; pooled data for 2014-15 to 2016-17
The slope of the curves and the point at which they appear to level off varies across the four measures. For example, life satisfaction increases more sharply at lower income percentiles than do the scores for happiness and sense that life is worthwhile. The life satisfaction scores also rise more quickly than other measures until the top fifth of the income distribution, above which they only rise very slowly with income, whereas the three other measures of well-being plateau earlier in the distribution. Happiness and the sense that life is worthwhile plateau about two-thirds of the way up, while people’s probability of having high anxiety does not change very much in the top half of the income distribution. Note, though, that the returns to each of the well-being measures diminish among higher incomes but do not appear to stop growing altogether.
One objection to the trend we identify in Figure 4 is that we shouldn’t expect well-being to increase on a pound-for-pound basis as income rises, because more prosperous households will opt to save some of their extra income. That means they will consume less than the full value of the extra £1 of income, and therefore derive less additional ‘well-being’ in the short-term, even if their lifetime income (and long-term well-being) is increased. We tested this objection by repeating the analysis for consumption rather than income, and found clear evidence (not shown here) of a similar pattern of diminishing returns. This strongly suggests that we would see diminishing well-being returns from income in the longer-term too, because people’s consumption tends to be more closely correlated with their lifetime income than with year-to-year income fluctuations.
To get a clearer view of how higher income is associated with higher well-being, we can plot log-income against happiness – effectively compressing the horizontal axis
6.0
6.5
7.0
7.5
8.0
£0 £10,000 £20,000 £30,000 £40,000 £50,000 £60,000 £70,000 £80,000 £90,000 £100,000
Life worthwhile
Satisfaction
Happiness
Anxiety
Log. (Life worthwhile)
Log. (Satisfaction)
Log. (Happiness)
Log. (Anxiety)

18Resolution Foundation | Happy now?Well-being and income
as it moves rightwards. The results, set out in Figure 5, show that there are strong relationships between log household income and each of the four well-being measures. The takeaway is that subjective well-being rises in relation to the proportionate increase in a household’s income, rather than in relation to the absolute size of the increase. Or in other words, to keep providing households with the same marginal increases in subjective well-being we would need to keep adding larger and larger amounts to their incomes.
Figure 5: Well-being appears to rise in relation to the proportionate increase in a household’s income, rather than the absolute increase
Average subjective well-being by log household income percentile, after housing costs: UK, 2014-16
Note: Each dot represents a percentile of people ranked by household income after housing costs.Source: RF analysis of DWP, Family Resources Survey; pooled data for 2014-15 to 2016-17
The implication of the relationship between income and well-being is that, when viewed from the perspective of maximising aggregate well-being, society might well get a larger increase in average well-being from increasing incomes in the bottom half of the income distribution than by raising those at the top. In other words, redistribution of income is positive not just for individuals but also for society as a whole. Even the objection to this argument that it is income rank rather than income level which matters for well-being is not decisive: we shall see later in this section that income changes are associated with well-being changes even when we control for someone’s place in the income distribution.[15]
This proposition is however based entirely on cross-sectional data. It tells us that well-being rises (by progressively less) as we move up the income distribution, but it says nothing about how much better-off a particular individual will feel when they receive an income boost. That is, it does not allow us to assert that a given income change causes
[15] There is empirical evidence that people’s utility is connected more strongly with their income rank relative to their reference group rather than income level. So this argument says that if people in the lower half of the distribution have their incomes raised at the same rate as those of their reference groups, we would not necessarily expect a corresponding change in well-being.
6.0
6.5
7.0
7.5
8.0
8.5
£1,000 £10,000 £100,000
Happiness SatisfactionWorthwhile Anxiety

19Resolution Foundation | Happy now?Well-being and income
a given change in well-being, since it might be that people with higher incomes have underlying unobserved characteristics that predispose them to have both higher well-being and higher incomes. We turn next then to consider this question with reference to the repeated observation of the same people’s well-being over time.
Longitudinal data confirms that increases in income have a positive effect on individual well-being
The Understanding Society survey (USOC) re-interviews the same individuals and households year after year, so allows us to see how their individual circumstances change over time. We can thus look at change over time within individuals, and control for many of the unobserved heterogeneities that cross-sectional data unavoidably includes. We combine all waves of USOC and identify each case when an individual reports an (inflation-adjusted) change in their household income from one survey wave to the next. We then look at how that income change affected the person’s subjective well-being, where our outcome measure of subjective well-being is in this case the Caseness GHQ-12 score (as discussed in Box 1, USOC does not include the same measures of subjective well-being as ONS surveys like the APS; Box 2 details its alternative approach).
i Box 2: Measuring well-being in Understanding Society
USOC (like its predecessor the British Household Panel Survey) does not ask the same questions about subjective well-being as ONS surveys like the APS. Instead, it includes two measures of interest from a well-being perspective. The first is a question about ‘general life satisfaction’, reported on a 0 to 7 scale. The second is the General Health Questionnaire (GHQ-12). This is a 12-question standard tool that is designed to assess individuals’ mental health. It is summarised in a single scale between 0 and 12 (known as the ‘Caseness’ scale). In the GHQ-12, respondents are asked if they have recently:
1. Been able to concentrate.
2. Lost much sleep.
3. Felt that they were playing a useful part in things.
4. Felt capable of making decisions.
5. Felt stressed.
6. Felt that they couldn’t overcome difficulties.
7. Been able to enjoy normal day-to-day activities.
8. Been able to face up to their problems.
9. Been unhappy and depressed.
10. Been losing confidence.
11. Been thinking of themselves as worthless.
12. Been feeling reasonably happy, all things considered.

20Resolution Foundation | Happy now?Well-being and income
For each question, respondents choose to answer on a four-point scale. To produce the summary score, responses of 1 and 2 are recoded to zero, and responses of 3 and 4 (less positive well-being) are recoded to 1. The ‘Caseness’ summary score is then given out of 12, where 12 means that a
[16] We perform a fixed-effects regression with panel data from Understanding Society, regressing change in well-being on change in log household income (with controls for individual characteristics). The coefficient on change in log household income is 0.114, with a p-value of 0.000 (and a stronger 0.172 if we restrict the sample only to people who are employed or self-employed). This means that a percentage change in the change in income between two periods is associated with a 0.114 point increase in the average individual’s GHQ-12 well-being score.[17] Technically, we did not find significant evidence to reject the null hypothesis that the effects of income changes on well-being are even across the income distribution.[18] See for example R Layard, S Nickell and G Mayraz, ‘The marginal utility of income’, Journal of Public Economics 92, 2008[19] See for example, A Berg, J Ostry & P Loungani, Confronting Inequality: How Societies Can Choose Inclusive Growth, 2019
respondent reported serious problems in all categories, and 12 means they reported generally positive mental health or well-being. In this paper we invert the scale, as is common practice, to give the more intuitive ordering where 12 equals generally good mental health or well-being, and 0 is the lowest score.
Our analysis finds that a change in household income does have a statistically significant association with an individual’s well-being, even when controlling for prior income, age, sex, employment status, region, housing tenure, health, education and the presence of children in the house.[16] Full regression results are set out in Annex 2. When testing to see if the impact of changes in household income on well-being varies between households, however, we could not find definitive evidence that the impact of income changes varies across the income distribution.[17] More research is needed on this question, since the leading studies of how the relationship between income and well-being changes across the income distribution use data that is now out-of-date.[18]
We can’t categorically conclude from this work that redistribution and a focus on supporting those on low to middle incomes always and everywhere has a positive effect on a country’s aggregate well-being, but there is at least a strong implication that this is the case. Certainly, policymakers would be well advised to view redistribution as an effective means to support well-being, especially as such a finding would complement a growing body of evidence which suggests that greater equality of income – and active redistribution – has a positive impact on a country’s economic growth prospects.[19]
But what about where the income comes from? For most people work represents the largest single source of income, and it is to that which we turn our attention in the next section.

21Resolution Foundation | Happy now?Well-being in the labour market
Section 3
Well-being in the labour market
We’ve shown that, all else equal, well-being is at its highest during retirement. However, this is clearly not an option open to all. Among those yet to reach this stage, well-being is higher for those in work than for those who are either unemployed or inactive – even after we control for other factors like income. But do all jobs provide the same boost? In this section we consider how well-being in work varies over the lifecycle and with pay. As with our analysis of household income, we explore whether the marginal return of higher earnings diminishes as we move up the distribution. We also consider whether there is an asymmetry in the well-being effect associated with moves into, and out of, employment.
The well-being gap between being in work and being out of work appears to widen until age 50
As noted in the regression analysis we set out in Section 1, there is a clear correlation between employment status and well-being even when we control for other personal and economic characteristics. In the simplest terms, retired people record the highest levels of well-being, followed by the self-employed and then employees. There is then a marked drop in well-being to the unemployed and the economically inactive. By controlling for individual age, housing tenure, marital status, region, and pay, we can make sure that these findings reflect independent features of the various economic statuses – such as autonomy, leisure time, and social esteem. So self-employed people, for example, are not just happier because many of them tend to be older and well-paid. Some other independent feature of being self-employed has a positive impact on people’s well-being.
Yet within these overall averages, we might expect the well-being reported under different economic statuses to vary across the life course. Focusing on life satisfaction shows that this is indeed the case. The first thing to note is that the ‘classic’ U-shaped pattern of well-being is much more pronounced among the unemployed and inactive populations. Well-being is at its lowest among the out-of-work at roughly age 50, likely reflecting the fact that those in the group may either not have worked for some considerable time or be concerned that they might not return to work anytime soon (or indeed, both). There is still a decline in well-being among those in work between the ages of 20 and 50, but it is much more modest. As a result, we can observe a steady widening of the well-being ‘gap’ between the in-work and out-of-work populations up to the age of 50. Thereafter, well-being picks up for both populations, with much steeper improvements for the unemployed and the inactive as they approach the state pension age.

22Resolution Foundation | Happy now?Well-being in the labour market
Figure 6: Satisfaction is U-shaped across the life course for all working-age economic statuses
Average life satisfaction by age and economic activity status: UK, 2011-2018
Note: Lines show five-year moving averages. 0 = low and 10 = high.Source: RF analysis of ONS, Annual Population Survey; pooled data for 2011-12 to 2017-18
This finding likely confirms the widely-held intuition that not working hurts more in middle age than at earlier life stages. We know that periods of unemployment early in someone’s career can have long-term ‘scarring’ effects on their future work prospects, and it is right that policy focuses on supporting people to minimise this. But the well-being data serves as a useful reminder that policymakers should care also about supporting older individuals who are not in work.
The curve for the retired population is actually downward sloping. This likely reflects both the elevated well-being recorded by those in a position to retire in their 50s, and the compositional effect associated with recent retirees entering this stage with higher levels of wealth than those who came before them had. Interestingly however, some of the highest levels of life satisfaction are recorded by the – admittedly quite small – population of people continuing to work above the state pension age. This likely captures a positive choice being made by those who both value work and are healthy enough to undertake it.
The hit associated with losing a job is stronger than the gain associated with starting work
As with our work on income in the previous section, in order to move beyond simple observations of differences in well-being between different populations we must switch from a cross-sectional approach to a longitudinal one. Focusing again on the GHQ-12 measure reported in USOC, we can directly observe the impact of a change in economic status on an individual’s subjective well-being. Controlling for a range of personal and economic characteristics – including income – Table 1 confirms that changes in economic status do have a statistically significant impact on well-being.
In work
Unemployed
Economically inactive
Retired
6.0
6.2
6.4
6.6
6.8
7.0
7.2
7.4
7.6
7.8
8.0
8.2
8.4
18 20 22 24 26 28 30 32 34 36 38 40 42 44 46 48 50 52 54 56 58 60 62 64 66 68 70 72 74 76 78 80 82 84 86 88 90

23Resolution Foundation | Happy now?Well-being in the labour market
It shows that the size of the negative well-being effect of moving from employment to unemployment is much greater than the size of the positive effect of moving out of unemployment into work, with the difference being bigger for men than for women. Likewise, the negative change in well-being associated with moving from employment into inactivity due to ill-health is significantly bigger than the positive change in well-being associated with a move the opposite way. Further analysis that we do not report here shows that the impact of job losses varies by region. All other things equal, someone who loses their job in Scotland records a bigger drop in well-being than in any other UK region or nation, whereas people in Wales and the West Midlands experience the smallest drops.
Table 1: Changes in an individual’s economic status are associated with significant changes in well-being
Selected results from fixed-effects regressions of GHQ-12 well-being on individual economic status, pooled USOC, 2009-2017: UK
Note: Regressions include a range of controls for individual time-varying characteristics, though these are not reported here. The fixed-effects structure assumes that unobserved individual characteristics are time-invariant and thus controlled for. The second panel does not split results for men and women since sample sizes are too small for this sort of analysis.Source: RF analysis of University of Essex, Understanding Society; pooled data for 2009 to 2017
These findings remind us that, along with focusing on improving opportunities for people to enter work, policymakers interested in boosting well-being should care also about doing what they can to keep people in work. This complements previous Resolution Foundation work focusing on the importance of helping those with health problems to stay in touch with the labour market.[20]
[20] L Gardiner and D Gaffney, Retention deficit: a new approach to boosting employment for people with health problems and disabilities, Resolution Foundation, June 2016
Coefficient p-value Coefficient p-value
Employment to unemployment -1.653 0.000 -1.138 0.0000.000Unemployment to employment 1.207 0.000 0.366 0.321
Coefficient p-value
Employment to long-term illness or disability -2.603 0.000
Long-term illness or disability to employment 3.598 0.000
Male Female
Male and female combined

24Resolution Foundation | Happy now?Well-being in the labour market
Subjective well-being rises with pay but, as with income, there appear to be diminishing marginal returns
We saw in the previous section that individuals’ well-being was closely correlated with income, meaning that well-being moves in relation to the proportional change in a household’s income. Is it a similar story for well-being and its relationship with people’s pay in the labour market?
Figure 7 shows that the relationship between individual net pay and well-being is indeed as strong as that between household income and well-being, albeit with less variation over the pay distribution. The trend lines in the figure – which show a logarithmic line of best fit – have a flatter profile than those in Figure 4, as we might expect given that individual pay is only a part of households’ incomes and this measure does not account for differences in household size. This suggests that although well-being rises faster in relation to pay among people in the lower half of the pay distribution than among people in the upper half, the variation in the rate of well-being increase is smaller across the individual pay distribution than across the household income distribution.
Figure 7: Well-being rises in relation to people’s net pay, but with diminishing marginal returns
Average subjective well-being by net labour market pay percentile: UK, 2014-16
Notes: Chart includes only employees with positive net pay from the labour market. Each dot represents the average well-being for a percentile of net labour market pay, with percentile calculated within each year of the survey data. The lines are logarithmic lines of best fit.Source: RF analysis of ONS, Family Resources Survey
As with wider household incomes then, we can conclude that people’s well-being changes in relation to the proportional – rather than the absolute – change in pay across the pay distribution. The recent policy of raising the wage floor relative to median pay – via the introduction of the National Living Wage – is therefore likely to have had an overall net positive effect on the UK’s aggregate well-being.
6.0
6.5
7.0
7.5
8.0
8.5
£0 £10,000 £20,000 £30,000 £40,000 £50,000 £60,000 £70,000 £80,000 £90,000 £100,000
Happiness Satisfaction
Meaning Anxiety
Log. (Happiness) Log. (Satisfaction)
Log. (Meaning) Log. (Anxiety)

25Resolution Foundation | Happy now?Well-being in the labour market
And there are numerous examples of similarly-paying occupations that return very different levels of satisfaction
While well-being tends to rise (at a diminishing pace) as we move up the earnings distribution, it’s also the case that we can identify many exceptions to the rule. Figure 8 reproduces ONS analysis of APS data together with data from the Annual Survey of Hours and Earnings (ASHE). It clusters 369 occupations by the gross average salary paid over the period 2012-15 and shows the average life satisfaction scores reported over the same period by people working in those occupations. A positive (but diminishing) relationship is again observable, and we can also see a significant spread in satisfaction across very similarly-paid occupations.
Figure 8: There’s a considerable spread in average reported life satisfaction across similarly-paid occupations
Average life satisfaction (0 = low and 10 = high) by average occupation salary: UK, 2012-2015
Source: ONS analysis of ONS, Annual Population Survey (pooled data for April 2012 to March 2015) and ONS, Annual Survey of Hours and Earnings (pooled data for the same time period)
For example, both printing machine assistants and members of the clergy reported average salaries of roughly £20,000. Yet their average life satisfaction ranged from 7.2 for the former to 8.3 for the latter. Likewise, we can see that the average satisfaction score of 8.0 among florists is the same as that for aircraft pilots, despite the average salaries in the two occupations ranging from £10,800 in the former to £86,300 in the latter.
It is important to be careful in our interpretation of these findings, and not to say that higher pay causes higher well-being. They are no more than raw correlations, with no controls for other factors such as age, sex, relationship status and so on. And the comparison of average salaries with average satisfaction scores means there is the potential for the figures to be skewed by extremes in either distribution. Nevertheless, they are at least useful reminders that the well-being someone derives from their job is likely to relate to more than just what they get paid.
ClergyAir traffic controllers
Aircraft pilotsFlorists
Printing machine assistants
Shelf fillers
7.0
7.2
7.4
7.6
7.8
8.0
8.2
8.4
£0 £20,000 £40,000 £60,000 £80,000 £100,000 £120,000
26Resolution Foundation | Happy now?Well-being in the labour market
Security and happiness with working hours also matters for well-being
Finally in this section, we dig in more detail into this issue of non-financial elements of work. Previous research by the Resolution Foundation and others has pointed to the impact of insecure and atypical employment on people’s economic well-being.[21] Here we look at the subjective well-being impact too.
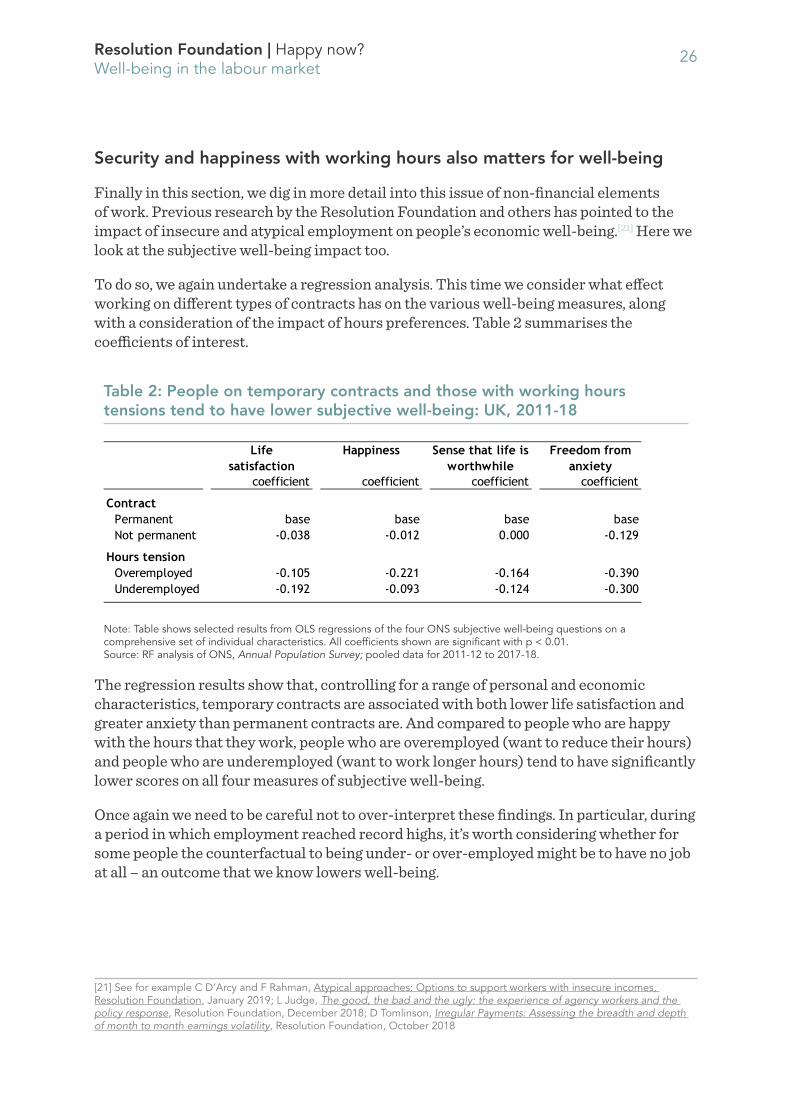
To do so, we again undertake a regression analysis. This time we consider what effect working on different types of contracts has on the various well-being measures, along with a consideration of the impact of hours preferences. Table 2 summarises the coefficients of interest.
Table 2: People on temporary contracts and those with working hours tensions tend to have lower subjective well-being: UK, 2011-18
Note: Table shows selected results from OLS regressions of the four ONS subjective well-being questions on a comprehensive set of individual characteristics. All coefficients shown are significant with p < 0.01.Source: RF analysis of ONS, Annual Population Survey; pooled data for 2011-12 to 2017-18.
The regression results show that, controlling for a range of personal and economic characteristics, temporary contracts are associated with both lower life satisfaction and greater anxiety than permanent contracts are. And compared to people who are happy with the hours that they work, people who are overemployed (want to reduce their hours) and people who are underemployed (want to work longer hours) tend to have significantly lower scores on all four measures of subjective well-being.
Once again we need to be careful not to over-interpret these findings. In particular, during a period in which employment reached record highs, it’s worth considering whether for some people the counterfactual to being under- or over-employed might be to have no job at all – an outcome that we know lowers well-being.
[21] See for example C D’Arcy and F Rahman, Atypical approaches: Options to support workers with insecure incomes, Resolution Foundation, January 2019; L Judge, The good, the bad and the ugly: the experience of agency workers and the policy response, Resolution Foundation, December 2018; D Tomlinson, Irregular Payments: Assessing the breadth and depth of month to month earnings volatility, Resolution Foundation, October 2018
Life satisfaction
Happiness Sense that life is worthwhile
Freedom from anxiety
coefficient coefficient coefficient coefficient
ContractPermanent base base base baseNot permanent -0.038 -0.012 0.000 -0.129
Hours tensionOveremployed -0.105 -0.221 -0.164 -0.390Underemployed -0.192 -0.093 -0.124 -0.300
27Resolution Foundation | Happy now?Well-being in the labour market
Nevertheless, given the rise of atypical working over the past decade, these findings serve as a warning to policymakers about the increased pressure today’s labour market is likely to be placing on the well-being of those in work.
The presence of a well-being gap points to both to the need to direct policy in a way that both supports people to move out of atypical employment (best achieved through further tightening of the labour market) and improves the conditions faced by those working in such ways (with implications for the government’s approach to labour market regulation and the continued need for strong worker representation).
The analysis in this section has highlighted both the importance of being in work for subjective well-being, and the need to ensure that it is the right type of work. Well-being rises with pay, but is dependent also on a number of other factors, including the security of the job and – potentially – the nature of the occupation itself. For those interested in maximising subjective well-being across society, the evidence suggests adopting an approach that raises the wage floor, supports people to remain in work, strengthens the worker voice and focuses on matching people to the right role.
Given how much time we spend at work, it’s no surprise that our economic status plays such an important role in our sense of well-being. We might likewise expect where we live to be a significant factor. That’s the topic we turn to in the next section.

28Resolution Foundation | Happy now?Place and housing tenure
Section 4
Place and housing tenure
Housing has been a vital component in the living standards story over the last two decades. Housing costs have accounted for an increasing share of household incomes, thanks in part to a compositional shift whereby more people are renting. With home ownership being increasingly out of reach for many younger households, a growing number have been forced to live in the relatively more expensive private rented sector. This ‘housing headwind’ has blown particularly hard for those on low to middle incomes. But what effect have these trends towards renting had on subjective well-being? We might expect rising costs to have negatively impacted average scores, but are there non-financial considerations at play too? In this section we look at differences in well-being by tenure, going beyond a simple analysis of housing costs. We look also more broadly at where people live, asking whether there are regional effects which we might do more to understand.
Happy are the home owners – and not just for economic reasons
We’ve already seen in our summary regression work in Section 1 that home owners report higher levels of well-being than those living in other tenures – even after controlling for a range of other factors such as age and income. Table 3 reproduces those results, reminding us that outright owners record the highest level of well-being on all four measures. Relative to this group, well-being is a little lower for those buying a house with a mortgage and lower again for renters (with relatively little difference between those in the private and social sectors).
Table 3: Housing tenure has a strong association with subjective well-being
Note: Coefficients with a small p value (under 0.05) are statistically significant.Source: RF analysis of DWP, Family Resources Survey; pooled data for 2014-15 to 2016-17. See Annex 1 for full results. Source: RF analysis of DWP, Family Resources Survey; 2014-15 to 2016-17.
coefficient p-value coefficient p-value coefficient p-value coefficient p-valueHousing tenure
Own outright base base base baseMortgagor -0.085 0.000 -0.119 0.000 -0.066 0.000 -0.102 0.000
Social renter -0.194 0.000 -0.207 0.000 -0.151 0.000 -0.150 0.000Private renter -0.214 0.000 -0.123 0.000 -0.130 0.000 -0.165 0.000
Life satisfaction HappinessSense that life is
worthwhileFreedom from
anxiety
29Resolution Foundation | Happy now?Place and housing tenure
It is good to note that this analysis controls for household incomes after housing costs (AHC), as does the analysis used throughout this report. That is, the income measure we use from the Family Resources Survey directly removes the amount respondents say they spend on their accommodation each year, and so Table 3 suggests that housing tenure has an association with well-being independently of the different costs of owning versus renting. It would appear that households value other outcomes associated with home ownership – security, housing quality and location perhaps.
Previous Resolution Foundation work has drawn firm conclusions about the importance of shifting tenure trends on the living standards of different groups.[22] Our focus has always been primarily on the economic aspect – with renters facing higher housing costs than owners. The implication of this new analysis is that, while differentials in housing costs across tenures are likely to play an important role in explaining differences in well-being, there is more going on.
The – perhaps unsurprising – finding that home owners derive well-being that goes beyond the cost savings helps to reinforce the case of twin approach to the UK’s housing crisis: namely, to improve access to ownership and to improve the reality of living in the private and social rented sectors. The former is needed to help meet the home owning aspirations of a larger number of families, while the latter is in recognition of the fact that renting will inevitably continue to be the norm for many but does not deliver the level of satisfaction, happiness or security they would like.
Regions have sharply differing levels of subjective well-being
When thinking more broadly about the importance of home, it’s worth noting that people’s well-being might be affected not just by their housing tenure but also by where they live. Of course, policy can have only a limited impact on many aspects of location: there are only so many tranquil views or atmospheric pubs to go around. But it is worth exploring whether some regions have higher or lower levels of well-being than we might expect given their demographic and economic backdrops, in order to understand whether there are lessons that can be drawn and applied more widely across the country.
As our summary regression in Section 1 showed, there are indeed well-being differences that sustain across different parts of the UK even after controlling for personal and economic characteristics. Table 4 reproduces the results.It shows that Northern Ireland records the highest average scores on life satisfaction, happiness and worth, with Wales scoring best on anxiety. In contrast, London is bottom on all measures except happiness. Interestingly, Figure 9 shows that well-being in Northern Ireland appears to have pulled further away from the other nations of the UK in the period since 2011 (when the APS well-being analysis began).
[22] S Clarke, A Corlett and L Judge, The housing headwind: the impact of rising housing costs on UK living standards, Resolution Foundation, June 2016; A Corlett and L Judge, Home affront: housing across the generations, Resolution Foundation, September 2017

30Resolution Foundation | Happy now?Place and housing tenure
Table 4: Controlling for all else, subjective well-being is highest in Northern Ireland and lowest in London
Selected results from regressions of subjective well-being on individual characteristics, 2014-16: UK
Notes: Table shows coefficients on region indicators from OLS regression of personal well-being on individual characteristics. Coefficients with a small p value (under 0.05) are statistically significant. Source: RF analysis of DWP, Family Resources Survey; pooled data for 2014-15 to 2016-17.
At first sight, the situation in Northern Ireland is unexpected. The region recorded the slowest growth in employment since 2011, and rates of unemployment and inactivity.
Figure 9: Life satisfaction and happiness scores in Northern Ireland have pulled increasingly away from the other UK nations since 2011
Average subjective well-being by age, 0 = low and 10 = high
Source: RF analysis of ONS, Annual Population Survey
coefficient p-value coefficient p-value coefficient p-value coefficient p-value
RegionNorth East base base base base
North West -0.084 0.000 -0.019 0.000 0.087 0.000 -0.113 0.000Yorkshire & Humber -0.035 0.000 0.043 0.000 0.028 0.000 -0.286 0.000
East Midlands -0.073 0.000 0.028 0.000 -0.003 0.019 -0.072 0.000West Midlands -0.141 0.000 -0.048 0.000 -0.051 0.000 -0.048 0.000
Eastern -0.165 0.000 -0.012 0.000 -0.057 0.000 -0.110 0.000London -0.237 0.000 -0.089 0.000 -0.204 0.000 -0.302 0.000
South East -0.125 0.000 0.042 0.000 -0.057 0.000 -0.219 0.000South West -0.118 0.000 -0.022 0.000 -0.097 0.000 -0.096 0.000
Wales -0.134 0.000 0.007 0.000 -0.020 0.000 0.068 0.000Scotland 0.004 0.000 0.106 0.000 0.018 0.000 0.035 0.000
Northern Ireland 0.148 0.000 0.164 0.000 0.094 0.000 -0.112 0.000
Life satisfaction HappinessSense that life is
worthwhile Freedom from anxiety
England
Scotland
Northern Ireland
Wales
7.2
7.3
7.4
7.5
7.6
7.7
7.8
7.9
2011 2012 2013 2014 2015 2016 2017
Life satisfaction
England
Scotland
Northern Ireland
Wales
7.2
7.3
7.4
7.5
7.6
7.7
7.8
7.9
2011 2012 2013 2014 2015 2016 2017
Happiness

31Resolution Foundation | Happy now?Place and housing tenure
There may be any number of factors at play, from cultural norms to environmental aspects. Here we examine one particular hypothesis, namely that lower levels of income inequality in the region have influenced households’ sense of what they should ‘expect’. We take a relatively simple approach, with Figure 10 detailing average satisfaction across the household income deciles in each of the regions and countries of the UK.[23] It shows that Northern Ireland has the highest average life satisfaction across the majority of its income distribution. The lowest-income households in Northern Ireland have higher life satisfaction than the lowest-income households in other parts of the UK, and so do the highest-income households in Northern Ireland (despite being less prosperous than the highest-income households in almost every other region).
Figure 10: Northern Ireland has a consistently higher level of life satisfaction across its income scale than London does
Average life satisfaction by regional household income decile after housing costs, by region, UK 2014-16
Source: RF analysis of DWP, Family Resources Survey
Comparing the pattern shown by Northern Ireland with that displayed in London, it appears that the difference in well-being between richer and poorer households is similar in size, even if well-being is higher in Northern Ireland for both groups. But this similarity masks that fact that the difference in income between different households is much greater in London than in other regions.
The 90:10 ratio in London, which compares the income of a household nine-tenths of the way up the distribution with that of a household one-tenth of the way up, is 9, by far the highest of any other region or nation. In Northern Ireland by contrast the 90:10 ratio is the lowest of any location, at just 3.6.
[23] This time for the 2014-16 period due to the necessity of using the FRS to get at incomes.
London
Northern Ireland
6.0
6.2
6.4
6.6
6.8
7.0
7.2
7.4
7.6
7.8
8.0
8.2
1(lowest)
2 3 4 5 6 7 8 9 10(highest)

32Resolution Foundation | Happy now?Place and housing tenure
What might be going on here? It might be that, as we speculated in Section 2, areas with lower levels of inequality enjoy higher aggregate well-being. There are of course, too many unknowns at play here to be able to draw any firm conclusion. But the presence of regional well-being gaps, even after controlling for personal and economic characteristics, suggests there is merit in policymakers digging deeper into what is going on in order to better understand what might make a difference to individuals’ quality of life.

33Resolution Foundation | Happy now?How has subjective well-being changed over time, and why?
Section 5
How has subjective well-being changed over time, and why?
The UK’s average subjective well-being has risen each year since the APS began collecting this data in 2011. Given the evolution of the economy as it has moved further away from the financial crisis, with employment in particular performing extremely well, we might speculate that at least some of this improvement is no more than a reversion to a pre-crisis mean. However, alternative and longer-established measures of well-being suggest that the recent improvement may be more structural in nature. In this section, we chart trends in subjective well-being and dig into what has driven the apparent pick-up since 2011. We look also at trends in other countries, in order to see where the UK’s development sits in an international context.
On all measures, well-being has been rising since 2011
Figure 11 tracks average well-being across the four ONS measures in each quarter since April 2011.
Figure 11: Subjective well-being has been increasing since 2011
Average subjective life satisfaction (0 = low and 10 = high): UK
Source: RF analysis of ONS, Annual Population Survey
Life worthwhile
Satisfaction
Happiness
Anxiety (reverse-scored)6.8
7.0
7.2
7.4
7.6
7.8
8.0
2012Q1
2013Q1
2014Q1
2015Q1
2016Q1
2017Q1
2018Q1

34Resolution Foundation | Happy now?How has subjective well-being changed over time, and why?
It details improvements in each of happiness, satisfaction and sense that life is worthwhile – with relatively rapid progress between 2011 and 2015, giving way to slower upward drifts thereafter.
Scores on each of these three measures are now significantly higher than they were at the start of the series, though there appears to have been a flattening over the past year. On anxiety, things again improved markedly between 2011 and 2015. Having dropped back a little over the subsequent 12 months, the average score appears to have picked up again in the past year.
These changes in national averages have most strongly been driven by changes at the lower end of the well-being scale. Figure 12 details the changing distribution of scores recorded on the happiness measure. It shows that the proportion of people recording well-being scores of 9 or 10 has changed very little over the period – holding steady at around one in three. In contrast, the proportion recording a ‘low’ score (5 or below) has dropped from 20 per cent to 17 per cent.
Figure 12: Improvements in the average happiness score since 2011 have been driven by a reduction in the proportion recording levels of 5 or below
Distribution of responses to the ONS question on subjectively-assessed happiness (0 = low and 10 = high): UK
Source: RF analysis of ONS, Annual Population Survey
Figure 13 repeats the exercise in relation to the life satisfaction measure of well-being. In this instance, there is more evidence of a pick-up in ‘high’ scores: the proportion recording a 9 or 10 has increased from 26 per cent to 30 per cent. However we can again see an even more marked decline in ‘low’ satisfaction scores, with the proportion recording a 5 or below dropping from 16 per cent to 11 per cent.
0%
10%
20%
30%
40%
50%
60%
70%
80%
90%
100%
2011 Q2 2012 Q2 2013 Q2 2014 Q2 2015 Q2 2016 Q2 2017 Q2
10 (completely)
9
8
7
6
5
4
3
2
1
0 (not at all)

35Resolution Foundation | Happy now?How has subjective well-being changed over time, and why?
Figure 13: Improvements in the average life satisfaction score since 2011 are the product of both a reduction in the proportion recording levels of 5 or below and an increase in the proportion scoring 9 or 10
Distribution of responses to the ONS question on subjectively-assessed life satisfaction (0 = low and 10 = high): UK
Source: RF analysis of ONS, Annual Population Survey
Alternative measures suggest that the post-2011 rise is the continuation of an older trend
A fall in the proportion of the population recording particularly low levels of subjective well-being might match our intuition, given the period since 2011 has been one in which the economy has generally improved and the number of people in employment (a status we’ve already shown to be a driver of well-being) has increased substantially. Economic drivers might also help to explain why some of the measures appear to have plateaued or gone backwards in recent quarters, with growth slowing and wages having been squeezed again in the post-EU referendum period.
However, alternative well-being measures hint at the fact that the upward trend of recent years might have a somewhat longer history. The Eurobarometer survey of people across Europe has asked about life satisfaction since 1973, using a similar question to the one used by the ONS to measure life satisfaction, albeit with a different scale.[24] The precise wording of the question has changed over time, meaning we can’t derive an entirely consistent series. And the survey is limited to satisfaction, so cannot tell us about an wider measures of well-being. Nevertheless, the responses provide a good indication of the direction of travel over the longer-term.
[24] Eurobarometer Data Service, ‘Life Satisfaction’. Note that the exact question and scale used in the Eurobarometer survey has varied over the years, as detailed in the link.
0%
10%
20%
30%
40%
50%
60%
70%
80%
90%
100%
2011 Q2 2012 Q2 2013 Q2 2014 Q2 2015 Q2 2016 Q2 2017 Q2
10 (completely)
9
8
7
6
5
4
3
2
1
0 (not at all)

36Resolution Foundation | Happy now?How has subjective well-being changed over time, and why?
Figure 14 presents the UK trend, detailing the proportion saying they are “fairly” or “very” satisfied in each wave since 1975. It also sets out the proportion of people recording a score of 8 or higher on the satisfaction question in the APS in the period from 2011.
Figure 14: The share of people who are satisfied with their life has grown consistently for two decades
Proportion who say they are ‘fairly satisfied’ or ‘very satisfied’ with their life on the whole: UK
Notes: The blue line shows a five-year moving average of the proportion of responses to a question about life satisfaction on a four-point scale. The orange line shows the proportion of people reporting life satisfaction of 6 or more out of 10 in the APS. Source: RF analysis of Eurobarometer data and ONS, Annual Population Survey
It points to a relatively steady trend between the mid-1970s and the millennium – albeit with some very marked fluctuation around successive economic recessions – followed by a very marked upward drift from the turn of the century. In this latter period, even the huge economic downturn sparked by the global financial crisis fails to register in any significant way. The distinction between the pre-2000 and post-2000 periods is clear when we consider that the average yearly growth rate in this measure increased from 0.05 per cent between 1973 and 2000, to 0.59 per cent from 2000 onwards. If we look just at the period since APS data collection began, the average annual growth rate is 0.42 per cent.
The Eurobarometer measure appears to match the APS one relatively well in the period from 2011. The implication then is that the trend we’ve observed in recent years is not (only) a bounce-back, but a continuation – or even acceleration – of a longer-running positive trend in people’s subjective well-being. It may be that the nature of the 2008 crisis (in which earnings were squeezed, but employment proved more resilient than had been expected) was not large enough to offset the structural upward drift.
Eurobarometer APS
83%
84%
85%
86%
87%
88%
89%
90%
91%
92%
93%
1975 1977 1979 1981 1983 1985 1987 1989 1991 1993 1995 1997 1999 2001 2003 2005 2007 2009 2011 2013 2015 2017

37Resolution Foundation | Happy now?How has subjective well-being changed over time, and why?
A more unemployment-heavy downturn may have produced a different result, so we must guard against complacency. But the steady improvement over the past two decades is nevertheless impressive.
Figure 15 compares the longer-run UK trend with a selection of other European countries. We should tread carefully in interpreting differences in levels across countries, with the potential for different cultural norms affecting the most likely ‘default’ response in any given country (though evidence from studies in China and other countries around the Pacific suggests that these statistics are relatively resistant to linguistic differences[25]). But the relative movements are interesting.
Figure 15: Life satisfaction appears to be trending up in a number of countries
Proportion of adults who say they are ‘fairly satisfied’ or ‘very satisfied’ with their life on the whole: UK
Source: RF analysis of Eurobarometer data
Unlike in the UK, we do see large reductions in life satisfaction around the time of the financial crisis in both Spain and Greece. These are two countries which were, of course, hit very hard by the downturn – with unemployment in particular surging in a way that was not observed in the UK.
[25] E Diener, E M Suh, H Smith and L Shao, ‘National differences in reported subjective well-being: Why do they occur?’, Social Indicators Research 34(1), 1995
0%
10%
20%
30%
40%
50%
60%
70%
80%
90%
100%
1973 1976 1979 1982 1985 1988 1991 1994 1997 2000 2003 2006 2009 2012 2015
France Germany Netherlands
UK Greece Spain

38Resolution Foundation | Happy now?How has subjective well-being changed over time, and why?
However, looking across the other countries – France, Germany and the Netherlands – we see variations on the UK theme: namely steady upward drifts from around the year 2000 which differ a little in magnitude. To the extent that the UK might be in the midst of a structural improvement in subjective well-being then, it is one that may have echoes in other parts of western Europe too.
Subjective well-being has improved for almost all groups since 2000, adding weight to the notion that it is a structural trend
Changes in the economy and the labour market undoubtedly explain some of the rise in average subjective well-being since 2011 in the UK. Over the period since April 2011 when the APS has measured well-being, the 16+ employment rate has risen from 58.3 per cent to 61.1 per cent, corresponding to 3 million more people in employment. All other things equal, employed people have higher well-being than unemployed people, and so we would expect the compositional effect of this higher employment rate to push average well-being upwards.
Other compositional factors may also be at play. For example, we might speculate that those older pensioners who have died over this period are likely to have been poorer and in worse health than those following behind them. As such, the level of life satisfaction recorded at any given older age might be expected to have increased slightly. This recent boost to well-being is less certain to continue in future than others, given concerns about today’s younger cohorts’ retirement income adequacy, a point that reinforces the need to strengthen pension provision for today’s workers.[26] Given that we also know from Figure 3 that those who remain in education beyond the age of 16 record higher levels of life satisfaction on average that those who do not, we might suppose that increasing levels of education in this population has also served to drive the overall average up.
However, Figure 16 suggests that something else is going on. It compares the average life satisfaction scores recorded in the first four quarters of the APS (2011-12) with those recorded in the most recent four quarters (2017-18) by different personal and economic characteristics. It shows that the overall increase (from 7.4 to 7.7) is reflected in improvements for almost all other groups.
So, while there is an improvement in the score reported by those aged 65+ (in line with our theory about the replacement of older, poorer pensioners with wealthier and healthier newer retirees), the increase is larger among many of the working-age groups. Similarly, the improvements recorded among retired people and among those in employment are bettered by the increase reported by unemployed people. There are big increases in average satisfaction recorded among those not staying in education beyond the age of 16 too.
[26] D Finch and L Gardiner, As good as it gets? The adequacy of retirement income for current and future generations of pensioners, Resolution Foundation, November 2017

39Resolution Foundation | Happy now?How has subjective well-being changed over time, and why?
Overall, the only two groups in which life satisfaction falls over the period are 16-17 year-olds and those in civil partnerships. Teenagers’ scores remain high, though people over 65 are now the highest.
Figure 16: Reported life satisfaction has improved among almost all groups over the past seven years
Average subjective life satisfaction (0 = low and 10 = high): UK, 2011-12 and 2017-18
Source: RF analysis of ONS, Annual Population Survey
Compositional factors may additionally be at play, but there appears to be a strong ‘within’ group effect too. We can test this supposition by considering how the overall life satisfaction average would have evolved over the period from 2011 in a world in which there was no change in the economic status composition of the population. That is, what if there had been no reduction in unemployment and corresponding increase in employment and self-employment, and no change in the proportion of people in retirement?
2011-12 2017-18
6.4 6.6 6.8 7.0 7.2 7.4 7.6 7.8 8.0 8.2
AllSex Female
MaleAge band 16-17
18-1920-2425-2930-3435-3940-4445-4950-5455-5960-6465+
Marital status MarriedCivil partnershipSingleDivorcedWidowedSeparated
Economic status RetiredSelf-employedEmployedEconomically inactiveUnemployed
Educated post-16 YesNo
Housing tenure Own outrightMortgagorPrivate rentSocial rent
Region Northern IrelandSouth WestSouth EastEastScotlandEast MidlandsWalesNorth WestWest MidlandsYorks & HumberNorth EastLondon

40Resolution Foundation | Happy now?How has subjective well-being changed over time, and why?
Figure 17 presents the results. The solid blue line shows the actual trend in average life satisfaction, which follows the upward trajectory shown in Figure 11. The dotted orange line shows our counterfactual simulation, where we estimate what average life satisfaction would have been had the proportions of people in employment, unemployment and retirement stayed the same as they were in early 2011. It is a little lower than the blue line, with a gap opening up slowly over time. That means if employment had not risen as fast as it did, life satisfaction would not be quite as high today. But the broader picture is clear: even if the proportion of people in work had not changed since 2011, this would not have made a substantial difference to the trend of rising well-being.
Figure 17: Compositional shifts from unemployment to employment appear to have had relatively little effect on trends in overall life satisfaction scores
Average subjective life satisfaction (0 = low and 10 = high), actual and simulated: UK
Notes: To create the dotted line, we calculate average life satisfaction every quarter for each economic status (employed, self-employed, unemployed, economically inactive, retired), and then calculate a weighted national average using the proportions of the population in each status as they were in April 2011. Source: RF analysis of ONS, Annual Population Survey
Testing this question more formally, we can run another multiple regression on the combined APS dataset, with a similar structure to the regression using FRS presented in Annex 1. This analysis shows that – like in the FRS regression - there is significant change over time in average well-being even after controlling for a wide range of individual characteristics. This suggests that much of the change over time in well-being is due to other factors not explained by the personal characteristics we analyse.
Actual
Constant proportions
7.2
7.3
7.4
7.5
7.6
7.7
7.8
2011 2012 2013 2014 2015 2016 2017 2018
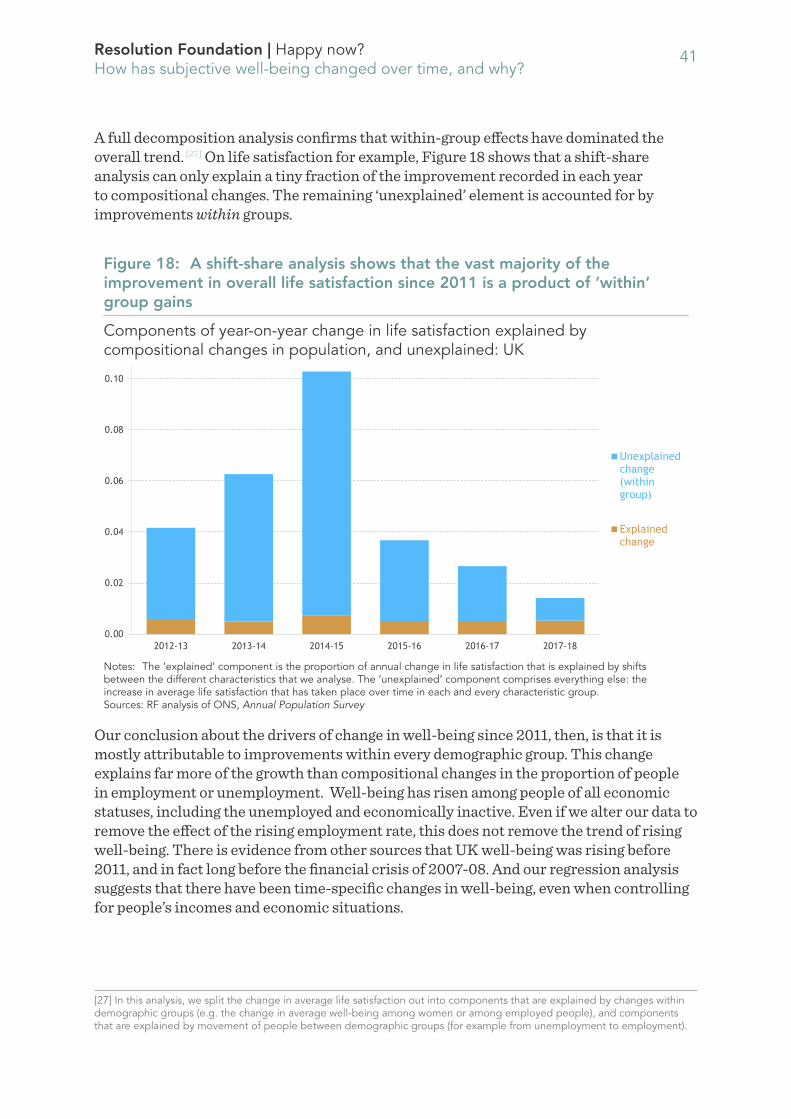
41Resolution Foundation | Happy now?How has subjective well-being changed over time, and why?
A full decomposition analysis confirms that within-group effects have dominated the overall trend. [27] On life satisfaction for example, Figure 18 shows that a shift-share analysis can only explain a tiny fraction of the improvement recorded in each year to compositional changes. The remaining ‘unexplained’ element is accounted for by improvements within groups.
Figure 18: A shift-share analysis shows that the vast majority of the improvement in overall life satisfaction since 2011 is a product of ‘within’ group gains
Components of year-on-year change in life satisfaction explained by compositional changes in population, and unexplained: UK
Notes: The ‘explained’ component is the proportion of annual change in life satisfaction that is explained by shifts between the different characteristics that we analyse. The ‘unexplained’ component comprises everything else: the increase in average life satisfaction that has taken place over time in each and every characteristic group.Sources: RF analysis of ONS, Annual Population Survey
Our conclusion about the drivers of change in well-being since 2011, then, is that it is mostly attributable to improvements within every demographic group. This change explains far more of the growth than compositional changes in the proportion of people in employment or unemployment. Well-being has risen among people of all economic statuses, including the unemployed and economically inactive. Even if we alter our data to remove the effect of the rising employment rate, this does not remove the trend of rising well-being. There is evidence from other sources that UK well-being was rising before 2011, and in fact long before the financial crisis of 2007-08. And our regression analysis suggests that there have been time-specific changes in well-being, even when controlling for people’s incomes and economic situations.
[27] In this analysis, we split the change in average life satisfaction out into components that are explained by changes within demographic groups (e.g. the change in average well-being among women or among employed people), and components that are explained by movement of people between demographic groups (for example from unemployment to employment).
0.00
0.02
0.04
0.06
0.08
0.10
2012-13 2013-14 2014-15 2015-16 2016-17 2017-18
Unexplainedchange(withingroup)
Explainedchange

42Resolution Foundation | Happy now?How has subjective well-being changed over time, and why?
This leaves a challenge for academic economists and for the policymakers they work with: does the apparent rise in average well-being since 2011 represent a material improvement in people’s living standards, and if so, what has driven it?

43Resolution Foundation | Happy now?Conclusion
Section 6
Conclusion
Subjective well-being data provides economic policymakers with rich and relevant information on how people assess their own living standards, in a useful complement to traditional metrics like GDP. Neither approach to living standards devalues the importance of the other. Even the old maxim that ‘it’s the economy, stupid’ that wins elections is enriched by well-being data – a recent study found that life satisfaction data can robustly predict voting behaviour, in some cases better than macro-economic data can.[28]
Well-being data also opens up new opportunities, for example in policy evalutation. Recent examples include the Public Health Outcomes Framework, whose monitoring includes the four ONS well-being questions, and past publications based on the Crime Survey of England and Wales, which used well-being questions to monitor the impact of crime on its victims’ well-being.[29] Another case in the UK government was a 2014 study of the impact of a randomised controlled trial of in-work support, for people receiving benefits.[30]
More generally, well-being data provides support for policies focused on work, housing and incomes, as well as health. Economic policymakers could also consider using well-being data more widely in the distributional analysis of public policy changes, though more research is needed in this area. Typical distributional analyses assess policy reforms in terms of their cash impact on household incomes, implicitly valuing a marginal change in household income the same whether it occurs in the richest of households or the poorest, while well-being data gives policymakers a numerical measure of the relative importance of income changes to households at different points in the income distribution.
Challenges do however remain with the collection and use of this data. To allow wider testing of what matters for well-being, it would be useful to keep adding relevant questions to more household surveys, and to ensure that the questions are standardised across different official datasets. A constant problem in well-being research is the vast number of legacy measures, which are very often not comparable to each other –
[28] G Ward, ‘Is Happiness a Predictor of Election Results?’, CEP Discussion Paper No 1343, April 2015. This paper finds that a one standard deviation change in national well-being is associated with a change in incumbent vote share of 8.5 percentage points, using cross-European data.[29] Public Health England, Public Health Outcomes Framework (last updated January 2019); Office for National Statistics, ‘Crime Statistics, Focus on Public Perceptions of Crime and the Police, and the Personal Well-being of Victims: 2013 to 2014’, March 2015[30] R Dorsett and A J Oswald, ‘Human Well-Being and In-Work Benefits: A Randomized Controlled Trial’, Warwick Economic Research Papers 1038, 2014

44Resolution Foundation | Happy now?Conclusion
for example an Australian research centre lists over 1,200 different instruments for measuring well-being in its list from around the world.[31]There is also an open question for academic economists in this area, to explain in more detail why average well-being appears to have risen in the past few years, and whether its growth is impervious to all but the most serious of economic downturns.
The strength of the evidence base on subjective well-being demonstrates the value of the ONS’s efforts over the past decade to build it into its data collection across numerous household surveys. It is important that this data collection continues, and it would be desirable if further household surveys could incorporate subjective well-being questions and harmonise the questions they ask. For example Understanding Society should ask the same four questions on subjective well-being as the main ONS surveys. A constant problem in well-being research is vast number of legacy measures, which are very often not comparable to each other – for example an Australian research centre lists over 1,200 instruments for measuring well-being in its list from around the world.[32]
These caveats aside, the broader collection and use of subjective well-being data is a laudable goal in public policy. It is a complement to economic measures of living standards, rather than a competitor, and it has much to teach policymakers already. There is exciting further potential for subjective well-being data to assist in designing better policy across the whole of government. It is up to policymakers, public servants, economists and others to rise to the challenge.
[31] See R Layard, S Nickell and G Mayraz, ‘The marginal utility of income’, Journal of Public Economics 92, 2008[32] Australian Centre on Quality of Life, Directory of Instruments.
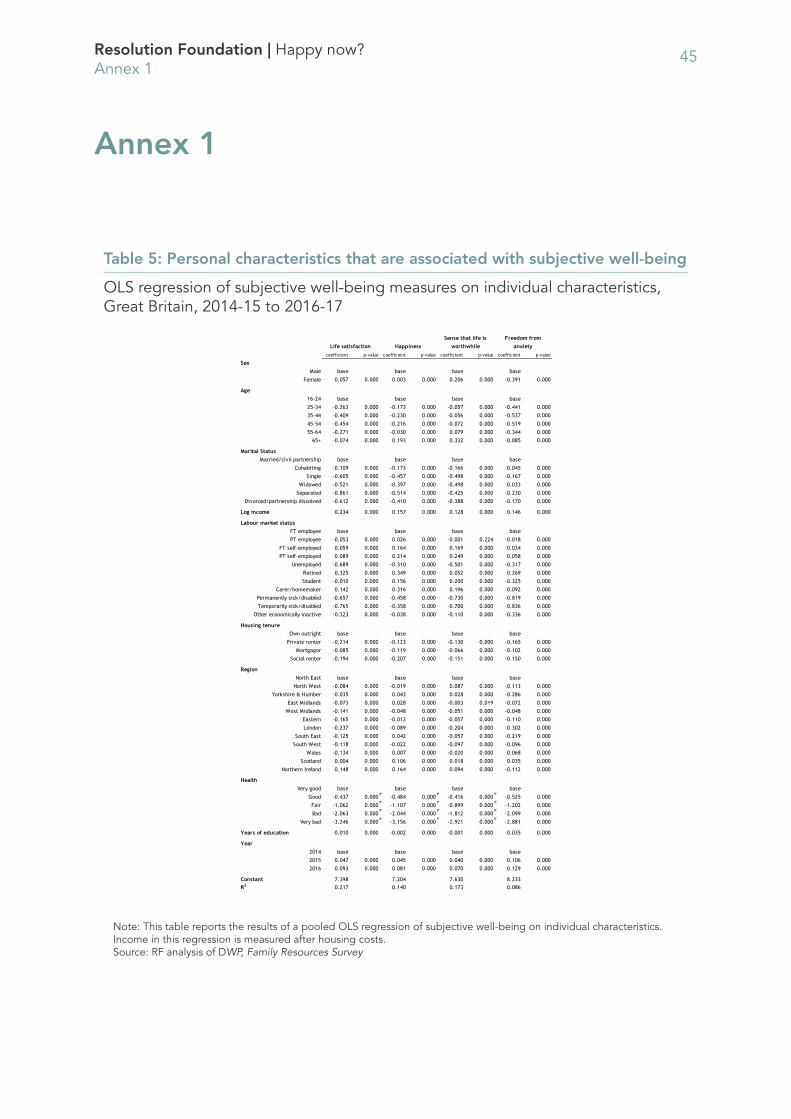
45Resolution Foundation | Happy now?Annex 1
Annex 1
Table 5: Personal characteristics that are associated with subjective well-being
OLS regression of subjective well-being measures on individual characteristics, Great Britain, 2014-15 to 2016-17
Note: This table reports the results of a pooled OLS regression of subjective well-being on individual characteristics. Income in this regression is measured after housing costs.Source: RF analysis of DWP, Family Resources Survey
coefficient p-value coefficient p-value coefficient p-value coefficient p-value
SexMale base base base base
Female 0.057 0.000 0.003 0.000 0.206 0.000 -0.391 0.000
Age16-24 base base base base25-34 -0.263 0.000 -0.173 0.000 -0.057 0.000 -0.441 0.00035-44 -0.409 0.000 -0.230 0.000 -0.056 0.000 -0.537 0.00045-54 -0.454 0.000 -0.216 0.000 -0.072 0.000 -0.519 0.00055-64 -0.271 0.000 -0.030 0.000 0.079 0.000 -0.344 0.000
65+ -0.074 0.000 0.193 0.000 0.332 0.000 -0.085 0.000
Marital StatusMarried/civil partnership base base base base
Cohabiting -0.109 0.000 -0.173 0.000 -0.166 0.000 -0.045 0.000Single -0.605 0.000 -0.457 0.000 -0.498 0.000 -0.167 0.000
Widowed -0.521 0.000 -0.397 0.000 -0.498 0.000 0.033 0.000Separated -0.861 0.000 -0.514 0.000 -0.425 0.000 -0.230 0.000
Divorced/partnership dissolved -0.612 0.000 -0.410 0.000 -0.388 0.000 -0.170 0.000
Log income 0.234 0.000 0.157 0.000 0.128 0.000 0.146 0.000
Labour market statusFT employee base base base basePT employee -0.053 0.000 0.026 0.000 -0.001 0.224 -0.018 0.000
FT self-employed 0.059 0.000 0.164 0.000 0.169 0.000 -0.034 0.000PT self-employed 0.089 0.000 0.214 0.000 0.249 0.000 0.058 0.000
Unemployed -0.689 0.000 -0.310 0.000 -0.501 0.000 -0.317 0.000Retired 0.325 0.000 0.349 0.000 0.052 0.000 0.269 0.000Student -0.010 0.000 0.156 0.000 0.200 0.000 -0.325 0.000
Carer/homemaker 0.142 0.000 0.316 0.000 0.196 0.000 0.092 0.000Permanently sick/disabled -0.657 0.000 -0.458 0.000 -0.730 0.000 -0.819 0.000Temporarily sick/disabled -0.765 0.000 -0.358 0.000 -0.700 0.000 -0.836 0.000
Other economically inactive -0.323 0.000 -0.038 0.000 -0.110 0.000 -0.336 0.000
Housing tenureOwn outright base base base base
Private renter -0.214 0.000 -0.123 0.000 -0.130 0.000 -0.165 0.000Mortgagor -0.085 0.000 -0.119 0.000 -0.066 0.000 -0.102 0.000
Social renter -0.194 0.000 -0.207 0.000 -0.151 0.000 -0.150 0.000
RegionNorth East base base base base
North West -0.084 0.000 -0.019 0.000 0.087 0.000 -0.113 0.000Yorkshire & Humber -0.035 0.000 0.043 0.000 0.028 0.000 -0.286 0.000
East Midlands -0.073 0.000 0.028 0.000 -0.003 0.019 -0.072 0.000West Midlands -0.141 0.000 -0.048 0.000 -0.051 0.000 -0.048 0.000
Eastern -0.165 0.000 -0.012 0.000 -0.057 0.000 -0.110 0.000London -0.237 0.000 -0.089 0.000 -0.204 0.000 -0.302 0.000
South East -0.125 0.000 0.042 0.000 -0.057 0.000 -0.219 0.000South West -0.118 0.000 -0.022 0.000 -0.097 0.000 -0.096 0.000
Wales -0.134 0.000 0.007 0.000 -0.020 0.000 0.068 0.000Scotland 0.004 0.000 0.106 0.000 0.018 0.000 0.035 0.000
Northern Ireland 0.148 0.000 0.164 0.000 0.094 0.000 -0.112 0.000
HealthVery good base base base base
Good -0.437 0.000 -0.484 0.000 -0.416 0.000 -0.525 0.000Fair -1.062 0.000 -1.107 0.000 -0.899 0.000 -1.202 0.000Bad -2.063 0.000 -2.044 0.000 -1.812 0.000 -2.099 0.000
Very bad -3.246 0.000 -3.156 0.000 -2.921 0.000 -2.881 0.000
Years of education -0.010 0.000 -0.002 0.000 -0.001 0.000 -0.035 0.000
Year2014 base base base base2015 0.047 0.000 0.045 0.000 0.040 0.000 0.106 0.0002016 0.093 0.000 0.081 0.000 0.070 0.000 0.129 0.000
Constant 7.398 7.204 7.630 8.233R2 0.217 0.140 0.173 0.086
Life satisfaction HappinessSense that life is
worthwhileFreedom from
anxiety
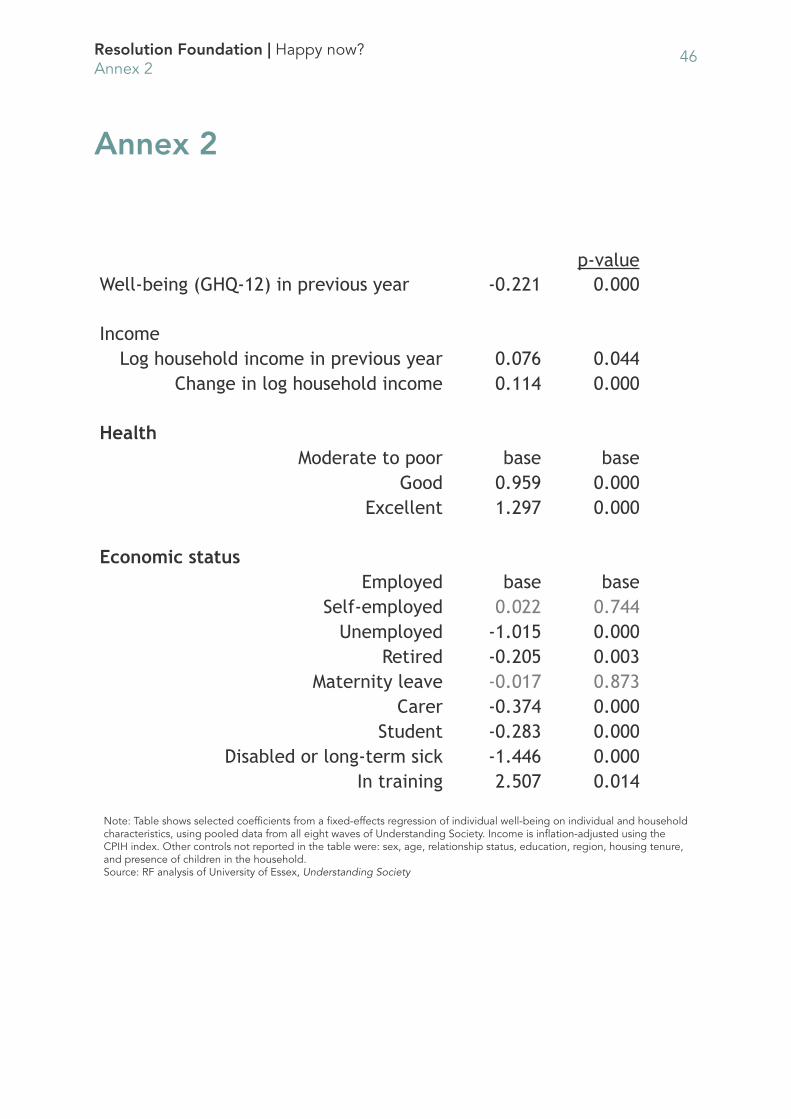
46Resolution Foundation | Happy now?Annex 2
Annex 2
p-value Well-being (GHQ-12) in previous year -0.221 0.000 Income
Log household income in previous year 0.076 0.044Change in log household income 0.114 0.000
Health
Moderate to poor base baseGood 0.959 0.000
Excellent 1.297 0.000 Economic status
Employed base baseSelf-employed 0.022 0.744
Unemployed -1.015 0.000Retired -0.205 0.003
Maternity leave -0.017 0.873Carer -0.374 0.000
Student -0.283 0.000Disabled or long-term sick -1.446 0.000
In training 2.507 0.014
Note: Table shows selected coefficients from a fixed-effects regression of individual well-being on individual and household characteristics, using pooled data from all eight waves of Understanding Society. Income is inflation-adjusted using the CPIH index. Other controls not reported in the table were: sex, age, relationship status, education, region, housing tenure, and presence of children in the household.Source: RF analysis of University of Essex, Understanding Society
[email protected] +44 (0)203 372 2960 @resfoundation resolutionfoundation.org
The Resolution Foundation is an independent research and policy organisation. Our goal is to improve the lives of people with low to middle incomes by delivering change in areas where they are currently disadvantaged. We do this by:
• undertaking research and economic analysis to understand the challenges facing people on a low to middle income;
• developing practical and effective policy proposals; and
• engaging with policy makers and stakeholders to influence decision-making and bring about change.
For more information on this report, contact: George BanghamResearch and Policy [email protected] 3372 2950