report on water quality relative to public health goals
TRANSCRIPT

Report on Water Quality Relative
to Public Health Goals
June 2019
CITY OF STOCKTON
Q ,
MUNICIPAL UTILITIES DEPARTMENT

INTENTIONALLY LEFT BLANK

TABLE OF CONTENTS
SECTION PAGE
BACKGROUND ....................................................................................................................... 3 PUBLIC HEALTH GOALS ....................................................................................................... 3 CITY OF STOCKTON WATER SOURCES ............................................................................. 4 WATER QUALITY DATA CONSIDERED ................................................................................ 4 GUIDELINES FOLLOWED ...................................................................................................... 4 BEST AVAILABLE TREATMENT TECHNOLOGY AND COST ESTIMATES .......................... 4 CONTAMINANTS DETECTED THAT EXCEED A PUBLIC HEALTH GOALS OR MAXIMUM CONTAMINANT LEVEL GOALS ............................................................................................. 4
Arsenic ........................................................................................................................ 5 Bromate ....................................................................................................................... 6 Radionuclides .............................................................................................................. 6 Gross Alpha ............................................................................................................ 7 Radium-228 ............................................................................................................ 7 Uranium .................................................................................................................. 8 Total Coliforms ............................................................................................................ 9
RECOMMENDATIONS FOR FURTHER ACTION ................................................................ 10
APPENDICES
APPENDIX A - MCLs, DLRs and PHGs for Regulated Drinking Water Contaminants
APPENDIX B - Health Risk Information for Public Health Goal Exceedance Reports
APPENDIX C - Cost Estimates for Treatment for Treatment Technologies

CITY OF STOCKTON WATER SYSTEM REPORT ON WATER QUALITY
RELATIVE TO PUBLIC HEALTH GOALS June 2019
BACKGROUND
Provisions of California Health and Safety Code Section 116470(b) require that public water systems serving more than 10,000 service connections prepare a brief, written report by July 1, 2019 that provides information on water quality levels from the three previous years that exceeded any Public Health Goals (PHGs), published by the California Environmental Protection Agency’s Office of Environmental Health Hazard Assessment (OEHHA). The law also requires that where OEHHA has not adopted a PHG for a contaminant, water suppliers are to use the Maximum Contaminant Level Goals (MCLGs) set by the United States Environmental Protection Agency (USEPA). Only contaminants in a water system which have a level exceeding a PHG or MCLG are addressed in this report.
This report provides the following information as specified in the California Health and Safety Code Section 116470(b) for any contaminant detected in the City's water supply between 2016 and 2018 at a level exceeding a PHG or MCLG:
• Numerical public health risk associated with the Maximum Contaminant Level (MCL),
and the PHG or MCLG, • Category or type of risk to health that could be associated with each contaminant level, • Best Available Treatment Technology that could be used to reduce the contaminant
level, and • Estimate of the cost to install that treatment.
PUBLIC HEALTH GOALS
PHGs are set by the California OEHHA and are based solely on public health risk considerations. None of the practical risk management factors that are considered by the USEPA or the California State Water Resources Control Board (SWRCB) Division of Drinking Water (DDW) in setting drinking water standards are considered in setting the PHGs. These factors include analytical detection capability, treatment technology available, benefits, and costs. PHGs are not enforceable and are not required to be met by any public water system. MCLGs are the federal equivalent to PHGs. Appendix A lists the regulated contaminants for which PHGs and MCLGs have been set.

CITY OF STOCKTON WATER SOURCES Most of the City’s drinking water is treated surface water produced through the Delta Water Treatment Plant (DWTP) or purchased from the Stockton East Water District (SEWD). Water is diverted from the Sacramento-San Joaquin Delta, and Mokelumne River water is purchased from Woodbridge Irrigation District for treatment at the City’s DWTP. SEWD imports surface water from New Melones and New Hogan Reservoirs for treatment and delivery to the City. The City of Stockton’s water supply also consists of groundwater sources.
WATER QUALITY DATA CONSIDERED All water quality data collected from the City’s treated surface water and groundwater between 2016 and 2018 for purposes of determining compliance with drinking water standards were considered for this report. In addition, water quality data from SEWD is also considered for this report. This data is summarized in the 2016, 2017, and 2018 annual Drinking Water Quality Reports (i.e., Consumer Confidence Reports) which are available on the City’s website. Copies of these reports may be viewed at www.stocktongov.com/mud.
GUIDELINES FOLLOWED Suggested Guidelines for Preparation of Required Reports on Public Health Goals (PHGs) to satisfy requirements of California Health and Safety Code Section 116470(b) by the Association of California Water Agencies was used in the preparation of this report.
PHGs, MCLGs and DLRs PHGs are based solely on public health risk considerations. They represent the level of a contaminant in drinking water below which there is no known or expected significant risk to health. None of the practical risk-management factors that are considered by the DDW or USEPA in setting drinking water MCLs are considered in setting PHGs. These factors include analytical detection capability, available treatment technologies, and benefits and costs of operating the treatment. MCLGs are the federal equivalent to PHGs, however, in cases where a contaminant is a known or suspected carcinogen, the MCLG is set to zero. PHGs and MCLGs are not enforceable and are not required to be met by any public water systems. A constituent’s DLR (Detection Limits for Purposes of Reporting) is the designated minimum level at or above which any analytical result for drinking water must be reported to DDW. PHG report guidance recommends considering results that are above their PHG or MCLG and less than their DLR to be zero. A list published by DDW of regulated constituents with the MCLs, DLRs and PHGs for Regulated Drinking Water Contaminants is included as Attachment 2.
BEST AVAILABLE TREATMENT TECHNOLOGY AND COST ESTIMATES Both the USEPA and SWRCB adopt Best Available Technologies (BATs) which are the best-known methods of reducing contaminant levels to the MCL. Costs can be estimated for such technologies. However, since many PHGs and all MCLGs are set much lower than the MCL, it is not always possible, nor feasible, to determine what treatment is needed to further reduce a contaminant to or near the PHG or MCLG, many of which are set at zero. Estimating the costs to reduce a contaminant to zero is difficult, if not impossible and costly. In some cases, installing

treatment to try and further reduce to very low levels of one contaminant may have adverse effects on other aspects of water quality.1
CONTAMINANTS DETECTED THAT EXCEED A PUBLIC HEALTH GOALS OR MAXIMUM CONTAMINANT LEVEL GOALS
The following is a discussion of contaminants that were detected in one or more of our drinking water sources at levels above the PHG, or if no PHG, above the MCLG. This report only provides information on contaminants that were found in the City’s drinking water system to have exceeded established PHG or MCLG. The City of Stockton consistently delivers safe water at the lowest possible cost to our customers. The levels of these contaminants were well below the MCLs, so this does not constitute a violation of drinking water regulations or indicate the water was unsafe to drink. These results could be considered typical for a California water agency. The health risk information for regulated contaminants with PHGs are provided in Appendix B.
Arsenic
The PHG for arsenic is 0.004 µg/L, and United States Environmental Protection Agency and State of California MCL is 10 µg/L. Arsenic is a naturally occurring element and is widely present in the environment. In certain geographical areas, natural mineral deposits may contain large quantities of arsenic and this may result in higher levels of arsenic in water. The main commercial use of arsenic in the United States is pesticides and in wood preservatives.
In humans, while ingestion of larger doses of arsenic may be lethal, lower levels of exposure may cause a variety of systemic effects including irritation of the digestive tract, nausea, vomiting, and diarrhea. In addition, arsenic ingestion can increase the risk of cancer in the digestive system, lungs, heart, and skin. The duration of arsenic exposure appears to be a key factor in determining the extent of the toxic effects.
The City of Stockton is required to monitor each of its drinking water wells for arsenic at least once every three years. In sampling conducted in 2016, 2017 and 2018, thirteen (13) samples were collected from a total of thirteen (13) active well sites. Arsenic values ranged from 0 µg/L to a maximum of 6.0 µg/L, with an average concentration of 4.5 µg/L over the three-year span. The MCL is 10 µg/L on a quarterly running average.
Three (3) samples were collected from the SEWD treated surface water and there were no detections of arsenic.
Health Risk Category The health risk category for arsenic is carcinogenicity. People who drink water containing arsenic above the MCL throughout their lifetime could experience an increased risk of getting cancer.
1 The estimated service connection costs were derived from adjusting the 2016 Public Health Goals Report’s estimated service connection costs with respects to the Updated 2012 ACWA Cost of Treatment Table (Attachment A, Table 3). The service connection costs will be revisited in the 2020 Urban Water Management Plan.

Numerical Health Risk at MCLG The numerical health risk for arsenic based on the PHG is 1 x 10⁻⁶. This means one excess cancer case per million people exposed.
Best Available Technologies and Treatment Costs The BAT to lower the level of arsenic below the MCL is the addition of ion exchange treatment units. The estimated annual cost to install and operate ion exchange treatment units at 13 of the City’s wells to reduce arsenic levels to below the PHG would be approximately $0.61 per 1,000 gallons of water treated, which includes annualized cost of construction, plus operation and maintenance costs. This translates into an additional annual cost of approximately $267 per service connection per year for the life of the treatment system.
Bromate
The PHG for bromate is 1 µg/L and MCL is 10 µg/L calculated on a quarterly running average. Bromate is formed when naturally occurring bromide reacts with ozone in the surface water treatment process. The City uses ozone in the treatment process at the Delta Water Supply Treatment Plant.
In sampling conducted at the DWTP from 2016 to 2018, a total of thirty (36) samples were collected and bromate was detected in seven of those samples. Bromate values ranged from 0 µg/L to 14 µg/L with an average of 1.7 µg/L over the three-year span. The City is complying of the MCL, as the quarterly running average is below 10 µg/L.
Health Risk Category The health risk category for bromate is carcinogenicity. People who drink water containing bromate above the MCL throughout their lifetime could experience an increased risk of getting cancer.
Numerical Health Risk at MCLG The numerical health risk for bromate based on the PHG is 1 x 10⁻⁶. This means one excess cancer case per million people exposed.
Best Available Technologies and Treatment Costs The BAT to lower the level of bromate below the MCL is the addition of granular activated carbon treatment units. The estimated annual cost to install and operate a granular activated carbon treatment unit at the Delta Water Supply Treatment Plant to reduce bromate levels to below the PHG would be approximately $0.57 per 1,000 gallons of water treated, which includes annualized cost of construction, plus operation and maintenance costs. This translates into an additional annual cost of approximately $129 per service connection per year for the life of the treatment system, assuming the treatment plant operates 365 days of the year.
Radionuclides
Many naturally occurring substances and a few man-made ones have the potential to emit ionizing radiation, and therefore, are referred to as radioactive. Of the radionuclides that have been observed in drinking water, most are naturally occurring. The naturally occurring

contaminant of greatest concern in drinking water is uranium. Most of the naturally occurring radionuclides are alpha particle emitters.
Contamination by man-made nuclear materials can also occur. The man-made radionuclides, which are primarily beta and photon emitters, are produced by a number of activities that involve the use of concentrated radioactive materials. These include production of electricity; nuclear medicines used in therapy and diagnosis; and various commercial products such as, televisions and smoke detectors. The City of Stockton is only required to monitor its groundwater and surface water supplies for naturally occurring radionuclides.
Exposure to radionuclides from drinking water results in an increased risk of cancer. In addition to cancer, exposure to uranium has the potential to cause kidney damage. In California, the radionuclides currently regulated in drinking water are gross alpha particle activity, radium 226, radium 228, uranium, and beta and photon emitters. The City detected Gross Alpha Particles, Radium-228, and Uranium above the PHG or MCLG but well under the MCL.
Gross Alpha Particles Radionuclides such as gross alpha particles in water supplies are predominantly from erosion of natural deposits. The term radionuclide refers to naturally occurring elemental radium, radon, uranium, and thorium with unstable atomic nuclei that spontaneously decay, producing ionizing radiation. Gross alpha is defined as the sum total of these radionuclides. The MCL for gross alpha is 15 picocuries per liter of water (pCi/L) and the MCLG is 0 pCi/L. The City collected and analyzed samples for gross alpha particles during 2016-2018, with values that ranged from non-detect (ND) to 9.07 pCi/L, with an average value of 7.51 pCi/L, all sample results were below the MCL. Health Risk Category The category of health risk for gross alpha particles is carcinogenicity chronic toxicity. Carcinogenic risk means capable of producing cancer. Chronic toxicity means that adverse effects may develop gradually from low levels of exposure over a long period of time. Numerical Health Risk at MCLG The numerical health risk based on USEA’s MCLG is zero therefore the cancer risk is zero. Best Available Technologies and Treatment Costs The best available technology (BAT) to lower the level of these compounds below the PHG is reverse osmosis. Since the levels are already below the MCL, reverse osmosis would be required to attempt to lower the levels to below the PHG. Please note that accurate cost estimates are difficult, if not impossible, and are highly speculative and theoretical. The estimated annual cost to install and operate reverse osmosis system at 13 of the City’s wells to reduce uranium levels to below the PHG would be approximately $4.33 per 1,000 gallons of water treated, which includes annualized cost of construction, plus operation and maintenance costs. This translates into an additional annual cost of approximately $1895.20 per service connection per year for the life of the treatment system.
Radium-228

Radium-228 is a naturally occurring radioactive element present in geological formations and the earth’s crust. It is introduced into groundwater and surface water through erosion. The MCL for Radium-228 is a combined total of Radium-226 + Radium-228 is 5 pCi/L and the PHG for Radium-228 is 0.019 pCi/L. The City collected and analyzed samples for Radium-228 during 2016-2018, with values that ranged from ND to 0.191 pCi/L, the only detection above the PHG was at Well 10R and Well 18 with an average result of 0.17 pCi/L, with all samples below the MCL. Health Risk Category The category of health risk for uranium is carcinogenicity chronic toxicity (kidneys). Carcinogenic risk means capable of producing cancer. Chronic toxicity means that adverse effects may develop gradually from low levels of exposure over a long period of time. Numerical Health Risk at MCLG The numerical health risk for Radium-228 based on the PHG is 1 x 10⁻⁶. This means one excess cancer case per million people exposed. Best Available Technologies and Treatment Costs The best available technology (BAT) to lower the level of these compounds below the PHG is reverse osmosis. Since the levels are already below the MCL, reverse osmosis would be required to attempt to lower the levels to below the PHG. Please note that accurate cost estimates are difficult, if not impossible, and are highly speculative and theoretical. The estimated annual cost to install and operate reverse osmosis system at 2 of the City’s wells to reduce uranium levels to below the PHG would be approximately $4.33 per 1,000 gallons of water treated, which includes annualized cost of construction, plus operation and maintenance costs. This translates into an additional annual cost of approximately $189.52 per service connection per year for the life of the treatment system.
Uranium
Uranium is a naturally occurring radioactive element present in geological formations and the earth’s crust. It is introduced into groundwater and surface water through erosion. The MCL for uranium is 20 pCi/L and the PHG for uranium is 0.43 pCi/L. The City collected and analyzed samples for uranium during 2016-2018, with values that ranged from ND to 5.78 pCi/L, there were 4 detections above the PHG with an average of 3.68 pCi/L, with all samples below the MCL. Health Risk Category The category of health risk for uranium is carcinogenicity chronic toxicity (kidneys). Carcinogenic risk means capable of producing cancer. Chronic toxicity means that adverse effects may develop gradually from low levels of exposure over a long period of time. Numerical Health Risk at MCLG The numerical health risk for uranium based on the PHG is 1 x 10⁻⁶. This means one excess cancer case per million people exposed.

Best Available Technologies and Treatment Costs The best available technology (BAT) to lower the level of these compounds below the PHG is reverse osmosis. Since the levels are already below the MCL, reverse osmosis would be required to attempt to lower the levels to below the PHG. Please note that accurate cost estimates are difficult, if not impossible, and are highly speculative and theoretical. The estimated annual cost to install and operate reverse osmosis system at 4 of the City’s wells to reduce uranium levels to below the PHG would be approximately $4.33 per 1,000 gallons of water treated, which includes annualized cost of construction, plus operation and maintenance costs. This translates into an additional annual cost of approximately $379.04 per service connection per year for the life of the treatment system.
Total Coliform Bacteria
Total coliform bacteria are tested at sampling sites throughout the City’s water distribution system. No more than 5% of all samples collected in a month can be positive for total coliforms in order to comply with the MCL. Although there is no PHG for total coliform bacteria, the MCLG is 0% positive samples. The reason for the total coliform drinking water standard is to minimize the possibility of the water containing pathogens, which are organisms that cause waterborne diseases. Because total coliform analysis is only a surrogate indicator of the potential presence of pathogens, it is not possible to state a specific numerical health risk. While USEPA normally sets MCLGs “at a level where no known or anticipated adverse effects on persons would occur,” the USEPA indicates that this is not possible with total coliforms.
Coliform bacteria are an indicator organism that are ubiquitous in nature and are not generally considered harmful. They are used because of the ease in monitoring and analysis. If a positive sample is found, it indicates a potential problem that needs to be investigated and additional sampling is warranted. It is not at all unusual for a system to have an occasional positive coliform bacteria sample. It is difficult, if not impossible; to assure that a system will never get a positive sample.
During 2016, 2017 and 2018, between 146 and 185 samples were collected each month for coliform analyses. Occasionally, a sample(s) is found to be positive for coliform bacteria. Repeat samples for sites having positive coliform bacteria were taken as a follow-up, and in every case, the repeat samples were negative.
The City provides chlorine disinfection to ensure that the water served is microbiologically safe. The chlorine residual levels are carefully controlled to provide the best health protection without causing the water to have undesirable taste and odor or increasing the level of certain compounds. This careful balance of treatment processes is essential to supplying our customers with safe drinking water.
Other equally important measures that we have implemented include: an effective cross- connection and backflow control programs; an effective monitoring and surveillance program; and maintaining positive pressures in our distribution system. The system has already taken all the steps described by DDW as “Best Available Technology” for coliform bacteria, which is regulated in Title 22, CCR, Section 64447.

RECOMMENDATIONS FOR FURTHER ACTION
The City of Stockton’s drinking water quality for the contaminants discussed in this 2019 Public Health Goals Report meet all State Water Resources Control Board and USEPA drinking water standards set to protect public health. To further reduce the levels of the contaminants identified in this report that are already significantly below the health-based maximum contaminant levels established to provide “safe drinking water”, additional costly treatment processes at City water wells and DWTP would be required. The effectiveness of the treatment processes to provide any significant reductions in contaminant levels at these already low values is uncertain. The health protection benefits of these further hypothetical reductions are not at all clear and may not be quantifiable. Therefore, no action is proposed at this time.

INTENTIONALLY LEFT BLANK

11
APPENDIX A MCLs, DLRs and PHGs for Regulated Drinking Water Contaminants

2019 PHG Triennial Report: Calendar Years 2016-2017-2018 MCLs, DLRs, and PHGs for Regulated Drinking Water Contaminants
(Units are in milligrams per liter (mg/L), unless otherwise noted.)
Last Update: December 29, 2018 (Reference last update 9/23/2018: http://www.waterboards.ca.gov/drinking_water/certlic/drinkingwater/MCLsandPHGs.shtml)
This table includes:
● DDW's maximum contaminant levels (MCLs)
● DDW's detection limits for purposes of reporting (DLRs) ● Public health goals (PHGs) from the Office of Environmental Health Hazard Assessment (OEHHA) ● PHGs for NDMA and 1,2,3-Trichloropropane (both are unregulated) are at the bottom of this table ● The federal MCLG for chemicals without a PHG, microbial contaminants, and the DLR for 1,2,3-TCP
Constituent MCL DLR PHG or (MCLG) Date of PHG
Chemicals with MCLs in 22 CCR §64431 —Inorganic Chemicals
Aluminum 1 0.05 0.6 2001 Antimony 0.006 0.006 0.02 1997 Antimony -- -- 0.0007 2009 draft Arsenic 0.010 0.002 0.000004 2004 Asbestos (MFL = million fibers per liter; for fibers >10 microns long) 7 MFL 0.2 MFL 7 MFL 2003
Barium 1 0.1 2 2003 Beryllium 0.004 0.001 0.001 2003 Cadmium 0.005 0.001 0.00004 2006 Chromium, Total - OEHHA withdrew the 1999 0.0025 mg/L PHG in Nov 2001 0.05 0.01 (0.100)
Chromium, Hexavalent (Chromium-6) 0.01 0.001 0.00002 2011 Cyanide 0.15 0.1 0.15 1997 Fluoride 2 0.1 1 1997 Mercury (inorganic) 0.002 0.001 0.0012 1999 (rev2005)* Nickel 0.1 0.01 0.012 2001
Nitrate (as N) 10 as N 0.4 45 as NO3 (=10 as N) 1997
Nitrite (as N) 1 as N 0.4 1 as N 1997 Nitrate + Nitrite (as N) 10 as N 0.4 10 as N 1997 Perchlorate 0.006 0.004 0.001 2018 Selenium 0.05 0.005 0.03 2010 Thallium 0.002 0.001 0.0001 1999 (rev2004)
Copper and Lead, 22 CCR §64672.3 Values referred to as MCLs for lead and copper are not actually MCLs; instead, they are called "Action Levels" under the lead
and copper rule Copper 1.3 0.05 0.3 2008 Lead 0.015 0.005 0.0002 2009

Constituent MCL DLR PHG or (MCLG) Date of PHG
Radionuclides with MCLs in 22 CCR §64441 and §64443 —Radioactivity
[units are picocuries per liter (pCi/L), unless otherwise stated; n/a = not applicable] Gross alpha particle activity - OEHHA concluded in 2003 that a PHG was not practical 15 3 (zero) n/a
Gross beta particle activity - OEHHA concluded in 2003 that a PHG was not practical 4 mrem/yr 4 (zero) n/a
Radium-226 -- 1 0.05 2006 Radium-228 -- 1 0.019 2006 Radium-226 + Radium-228 5 -- (zero) -- Strontium-90 8 2 0.35 2006 Tritium 20,000 1,000 400 2006 Uranium 20 1 0.43 2001
Chemicals with MCLs in 22 CCR §64444 —Organic Chemicals
(a) Volatile Organic Chemicals (VOCs) Benzene 0.001 0.0005 0.00015 2001 Carbon tetrachloride 0.0005 0.0005 0.0001 2000 1,2-Dichlorobenzene 0.6 0.0005 0.6 1997 (rev2009) 1,4-Dichlorobenzene (p-DCB) 0.005 0.0005 0.006 1997 1,1-Dichloroethane (1,1-DCA) 0.005 0.0005 0.003 2003 1,2-Dichloroethane (1,2-DCA) 0.0005 0.0005 0.0004 1999 (rev2005) 1,1-Dichloroethylene (1,1-DCE) 0.006 0.0005 0.01 1999 cis-1,2-Dichloroethylene 0.006 0.0005 0.1 2006 trans-1,2-Dichloroethylene 0.01 0.0005 0.06 2006 Dichloromethane (Methylene chloride) 0.005 0.0005 0.004 2000 1,2-Dichloropropane 0.005 0.0005 0.0005 1999 1,3-Dichloropropene 0.0005 0.0005 0.0002 1999 (rev2006) Ethylbenzene 0.3 0.0005 0.3 1997 Methyl tertiary butyl ether (MTBE) 0.013 0.003 0.013 1999 Monochlorobenzene 0.07 0.0005 0.07 2017 Styrene 0.1 0.0005 0.0005 2010 1,1,2,2-Tetrachloroethane 0.001 0.0005 0.0001 2003 Tetrachloroethylene (PCE) 0.005 0.0005 0.00006 2001 Toluene 0.15 0.0005 0.15 1999 1,2,4-Trichlorobenzene 0.005 0.0005 0.005 1999 1,1,1-Trichloroethane (1,1,1-TCA) 0.2 0.0005 1 2006 1,1,2-Trichloroethane (1,1,2-TCA) 0.005 0.0005 0.0003 2006 Trichloroethylene (TCE) 0.005 0.0005 0.0017 2009 Trichlorofluoromethane (Freon 11) 0.15 0.005 1.3 2017 1,1,2-Trichloro-1,2,2-Trifluoroethane (Freon 113) 1.2 0.01 4 1997 (rev2011) Vinyl chloride 0.0005 0.0005 0.00005 2000 Xylenes 1.75 0.0005 1.8 1997

Constituent MCL DLR PHG or (MCLG) Date of PHG
(b) Non-Volatile Synthetic Organic Chemicals (SOCs)
Alachlor 0.002 0.001 0.004 1997 Atrazine 0.001 0.0005 0.00015 1999 Bentazon 0.018 0.002 0.2 1999 (rev2009) Benzo(a)pyrene 0.0002 0.0001 0.000007 2010 Carbofuran 0.018 0.005 0.0017 2000 Carbofuran -- -- 0.0007 2018 draft Chlordane 0.0001 0.0001 0.00003 1997 (rev2006) Dalapon 0.2 0.01 0.79 1997 (rev2009) 1,2-Dibromo-3-chloropropane (DBCP) 0.0002 0.00001 0.0000017 1999 2,4-Dichlorophenoxyacetic acid (2,4-D) 0.07 0.01 0.02 2009 Di(2-ethylhexyl)adipate 0.4 0.005 0.2 2003 Di(2-ethylhexyl)phthalate (DEHP) 0.004 0.003 0.012 1997 Dinoseb 0.007 0.002 0.014 1997 (rev2010) Diquat 0.02 0.004 0.015 2000 Diquat -- -- 0.006 2018 draft Endrin 0.002 0.0001 0.0018 1999 (rev2008) Endrin -- -- 0.0003 2018 draft Endothal 0.1 0.045 0.094 2017 Ethylene dibromide (EDB) 0.00005 0.00002 0.00001 2003 Glyphosate 0.7 0.025 0.9 2007 Heptachlor 0.00001 0.00001 0.000008 1999 Heptachlor epoxide 0.00001 0.00001 0.000006 1999 Hexachlorobenzene 0.001 0.0005 0.00003 2003 Hexachlorocyclopentadiene 0.05 0.001 0.002 2017 Lindane 0.0002 0.0002 0.000032 1999 (rev2005) Methoxychlor 0.03 0.01 0.00009 2010 Molinate 0.02 0.002 0.001 2008 Oxamyl 0.05 0.02 0.026 2009 Pentachlorophenol 0.001 0.0002 0.0003 2009 Picloram 0.5 0.001 0.5 1997 Picloram -- -- 0.166 2018 draft Polychlorinated biphenyls (PCBs) 0.0005 0.0005 0.00009 2007 Simazine 0.004 0.001 0.004 2001 2,4,5-TP (Silvex) 0.05 0.001 0.003 2017 2,3,7,8-TCDD (dioxin) 3x10⁻⁸ 5x10⁻⁹ 5x10-11 2010 Thiobencarb 0.07 0.001 0.07 2000 Thiobencarb -- -- 0.042 2018 draft Toxaphene 0.003 0.001 0.00003 2003

Constituent MCL DLR PHG or (MCLG) Date of PHG
Chemicals with MCLs in 22 CCR §64533 —Disinfection Byproducts
Total Trihalomethanes 0.080 --
Total Trihalomethanes -- -- 0.0008 2010 draft Bromodichloromethane -- 0.0010 (zero) -- Bromoform -- 0.0010 (zero) -- Chloroform -- 0.0010 (0.07) -- Dibromochloromethane -- 0.0010 (0.06) --
Haloacetic Acids (five) (HAA5) 0.060 -- -- -- Monochloroacetic Acid -- 0.0020 (0.07) -- Dichloroacetic Adic -- 0.0010 (zero) -- Trichloroacetic Acid -- 0.0010 (0.02) -- Monobromoacetic Acid -- 0.0010 -- -- Dibromoacetic Acid -- 0.0010 -- --
Bromate 0.010 0.0050 or 0.0010a 0.0001 2009 Chlorite 1.0 0.020 0.05 2009
Microbiological Contaminants (TT = Treatment Technique)
Coliform % positive samples % 5 (zero)
Cryptosporidium** TT (zero)
Giardia lamblia** TT (zero)
Legionella** TT (zero)
Viruses** TT (zero) Chemicals with PHGs established in response to DDW requests. These are not currently regulated drinking water
contaminants. N-Nitrosodimethylamine (NDMA) -- -- 0.000003 2006 1,2,3-Trichloropropane -- 0.000005 0.0000007 2009
Notes: a DDW will maintain a 0.0050 mg/L DLR for bromate to accommodate laboratories that are using EPA Method 300.1. However, laboratories using EPA Methods 317.0 Revision 2.0, 321.8, or 326.0 must meet a 0.0010 mg/L MRL for bromate and should report results with a DLR of 0.0010 mg/L per Federal requirements. *OEHHA's review of this chemical during the year indicated (rev20XX) resulted in no change in the PHG ** Surface water treatment = TT

INTENTIONALLY LEFT BLANK

12
APPENDIX B Health Risk Information for Public Health Goal Exceedance Reports

Health Risk Information for Public Health Goal Exceedance Reports
Prepared by
Office of Environmental Health Hazard Assessment
California Environmental Protection Agency
February 2019
Under the Calderon-Sher Safe Drinking Water Act of 1996 (the Act), water utilities are required to prepare a report every three years for contaminants that exceed public health goals (PHGs) (Health and Safety Code Section 116470 (b)(2)). The numerical health risk for a contaminant is to be presented with the category of health risk, along with a plainly worded description of these terms. The cancer health risk is to be calculated at the PHG and at the California maximum contaminant level (MCL). This report is prepared by the Office of Environmental Health Hazard Assessment (OEHHA) to assist the water utilities in meeting their requirements.
PHGs are concentrations of contaminants in drinking water that pose no significant health risk if consumed for a lifetime. PHGs are developed and published by OEHHA (Health and Safety Code Section 116365) using current risk assessment principles, practices and methods.
Numerical health risks. Table 1 presents health risk categories and cancer risk values for chemical contaminants in drinking water that have PHGs.
The Act requires that OEHHA publish PHGs based on health risk assessments using the most current scientific methods. As defined in statute, PHGs for non-carcinogenic chemicals in drinking water are set at a concentration “at which no known or anticipated adverse health effects will occur, with an adequate margin of safety.” For carcinogens, PHGs are set at a concentration that “does not pose any significant risk to health.” PHGs provide one basis for revising MCLs, along with cost and technological feasibility. OEHHA has been publishing PHGs since 1997 and the entire list published to date is shown in Table 1.

Table 2 presents health risk information for contaminants that do not have PHGs but have state or federal regulatory standards. The Act requires that, for chemical contaminants with California MCLs that do not yet have PHGs, water utilities use the federal maximum contaminant level goal (MCLG) for the purpose of complying with the requirement of public notification. MCLGs, like PHGs, are strictly health based and include a margin of safety. One difference, however, is that the MCLGs for carcinogens are set at zero because the US Environmental Protection Agency (US EPA) assumes there is no absolutely safe level of exposure to such chemicals. PHGs, on the other hand, are set at a level considered to pose no significant risk of cancer; this is usually a no more than one-in-one-million excess cancer risk (1×10⁻⁶) level for a lifetime of exposure. In Table 2, the cancer risks shown are based on the US EPA’s evaluations.
For more information on health risks: The adverse health effects for each chemical with a PHG are summarized in a PHG technical support document. These documents are available on the OEHHA Web site (http://www.oehha.ca.gov). Also, technical fact sheets on most of the chemicals having federal MCLs can be found at http://www.epa.gov/your-drinking-water/table-regulated-drinking-water-contaminants.

Table 1: Health Risk Categories and Cancer Risk Values for Chemicals with California Public Health Goals (PHGs)
Chemical
Health Risk Category1 California
PHG (mg/L)2
Cancer Risk3 at the PHG
California MCL4 (mg/L)
Cancer Risk at the California
MCL
Alachlor carcinogenicity (causes cancer)
0.004 NA5 0.002 NA
Aluminum neurotoxicity and immunotoxicity
(harms the nervous and immune systems)
0.6 NA 1 NA
Antimony digestive system toxicity (causes vomiting)
0.02 NA 0.006 NA
Arsenic carcinogenicity (causes cancer)
0.000004 (4×10⁻⁶)
1×10⁻⁶ (one per million)
0.01 2.5×10⁻³ (2.5 per
thousand)
Asbestos carcinogenicity (causes cancer)
7 MFL6 (fibers >10 microns in length)
1×10⁻⁶ 7 MFL (fibers >10 microns in length)
1×10⁻⁶ (one per million)
Atrazine carcinogenicity (causes cancer)
0.00015 1×10⁻⁶ 0.001 7×10⁻⁶ (seven per
million)
1 Based on the OEHHA PHG technical support document unless otherwise specified. The categories are the hazard traits defined by OEHHA for California’s Toxics Information Clearinghouse (online at: http://oehha.ca.gov/multimedia/green/pdf/GC_Regtext011912.pdf). 2 mg/L = milligrams per liter of water or parts per million (ppm) 3 Cancer Risk = Upper estimate of excess cancer risk from lifetime exposure. Actual cancer risk may be lower or zero. 1×10⁻⁶ means one excess cancer case per million people exposed. 4 MCL = maximum contaminant level. 5 NA = not applicable. Risk cannot be calculated. The PHG is set at a level that is believed to be without any significant public health risk to individuals exposed to the chemical over a lifetime. 6 MFL = million fibers per liter of water.

Table 1: Health Risk Categories and Cancer Risk Values for Chemicals with California Public Health Goals (PHGs)
Chemical
Health Risk Category1 California
PHG (mg/L)2
Cancer Risk3 at the PHG
California MCL4 (mg/L)
Cancer Risk at the California
MCL
Barium cardiovascular toxicity (causes high blood
pressure)
2 NA 1 NA
Bentazon hepatotoxicity and digestive system toxicity
(harms the liver, intestine, and causes body weight effects7)
0.2 NA 0.018 NA
Benzene carcinogenicity (causes leukemia)
0.00015 1×10⁻⁶ 0.001 7×10⁻⁶ (seven per
million)
Benzo[a]pyrene carcinogenicity (causes cancer)
0.000007 (7×10⁻⁶)
1×10⁻⁶ 0.0002 3×10⁻⁵ (three per hundred
thousand)
Beryllium digestive system toxicity (harms the stomach or
intestine)
0.001 NA 0.004 NA
Bromate carcinogenicity (causes cancer)
0.0001 1×10⁻⁶ 0.01 1×10⁻⁴ (one per
ten thousand)
Cadmium nephrotoxicity (harms the kidney)
0.00004 NA 0.005 NA
Carbofuran reproductive toxicity (harms the testis)
0.0017 NA 0.018 NA
7 Body weight effects are an indicator of general toxicity in animal studies.

Table 1: Health Risk Categories and Cancer Risk Values for Chemicals with California Public Health Goals (PHGs)
Chemical
Health Risk Category1 California
PHG (mg/L)2
Cancer Risk3 at the PHG
California MCL4 (mg/L)
Cancer Risk at the California
MCL
Carbon tetrachloride
carcinogenicity (causes cancer)
0.0001 1×10⁻⁶ 0.0005 5×10⁻⁶ (five per million)
Chlordane carcinogenicity (causes cancer)
0.00003 1×10⁻⁶ 0.0001 3×10⁻⁶ (three per
million)
Chlorite hematotoxicity (causes anemia)
neurotoxicity (causes neurobehavioral
effects)
0.05 NA 1 NA
Chromium, hexavalent
carcinogenicity (causes cancer)
0.00002 1×10⁻⁶ 0.01 5×10⁻⁴ (five per
ten thousand)
Copper digestive system toxicity (causes nausea,
vomiting, diarrhea)
0.3 NA 1.3 (AL8) NA
Cyanide neurotoxicity (damages nerves) endocrine toxicity
(affects the thyroid)
0.15 NA 0.15 NA
Dalapon nephrotoxicity (harms the kidney)
0.79 NA 0.2 NA
8 AL = action level. The action levels for copper and lead refer to a concentration measured at the tap. Much of the copper and lead in drinking water is derived from household plumbing (The Lead and Copper Rule, Title 22, California Code of Regulations [CCR] section 64672.3).

Table 1: Health Risk Categories and Cancer Risk Values for Chemicals with California Public Health Goals (PHGs)
Chemical
Health Risk Category1 California
PHG (mg/L)2
Cancer Risk3 at the PHG
California MCL4 (mg/L)
Cancer Risk at the California
MCL
1,2-Dibromo-3- chloropropane (DBCP)
carcinogenicity (causes cancer)
0.0000017 (1.7x10⁻⁶)
1×10⁻⁶ 0.0002 1×10⁻⁴ (one per
ten thousand)
1,2-Dichloro- benzene (o- DCB)
hepatotoxicity (harms the liver)
0.6 NA 0.6 NA
1,4-Dichloro- benzene (p- DCB)
carcinogenicity (causes cancer)
0.006 1×10⁻⁶ 0.005 8×10⁻⁷ (eight per
ten million)
1,1-Dichloro- ethane (1,1- DCA)
carcinogenicity (causes cancer)
0.003 1×10⁻⁶ 0.005 2×10⁻⁶ (two per million)
1,2-Dichloro- ethane (1,2- DCA)
carcinogenicity (causes cancer)
0.0004 1×10⁻⁶ 0.0005 1×10⁻⁶ (one per million)
1,1-Dichloro- ethylene (1,1-DCE)
hepatotoxicity (harms the liver)
0.01 NA 0.006 NA
1,2-Dichloro- ethylene, cis
nephrotoxicity (harms the kidney)
0.1 NA 0.006 NA
1,2-Dichloro- ethylene, trans
hepatotoxicity (harms the liver)
0.06 NA 0.01 NA
Dichloromethane (methylene chloride)
carcinogenicity (causes cancer)
0.004 1×10⁻⁶ 0.005 1×10⁻⁶ (one per million)
2,4-Dichloro- phenoxyacetic acid (2,4-D)
hepatotoxicity and nephrotoxicity
(harms the liver and kidney)
0.02 NA 0.07 NA

Table 1: Health Risk Categories and Cancer Risk Values for Chemicals with California Public Health Goals (PHGs)
Chemical
Health Risk Category1 California
PHG (mg/L)2
Cancer Risk3 at the PHG
California MCL4 (mg/L)
Cancer Risk at the California
MCL
1,2-Dichloro- propane (propylene dichloride)
carcinogenicity (causes cancer)
0.0005 1×10⁻⁶ 0.005 1×10⁻⁵ (one per
hundred thousand)
1,3-Dichloro- propene (Telone II)
carcinogenicity (causes cancer)
0.0002 1×10⁻⁶ 0.0005 2×10⁻⁶ (two per million)
Di(2-ethylhexyl) adipate (DEHA)
developmental toxicity (disrupts development)
0.2 NA 0.4 NA
Diethylhexyl- phthalate (DEHP)
carcinogenicity (causes cancer)
0.012 1×10⁻⁶ 0.004 3×10⁻⁷ (three per ten million)
Dinoseb reproductive toxicity (harms the uterus and
testis)
0.014 NA 0.007 NA
Dioxin (2,3,7,8- TCDD)
carcinogenicity (causes cancer)
5×10-11 1×10⁻⁶ 3×10⁻⁸ 6×10⁻⁴ (six per ten thousand)
Diquat ocular toxicity (harms the eye)
developmental toxicity (causes malformation)
0.015 NA 0.02 NA
Endothall digestive system toxicity (harms the stomach or
intestine)
0.094 NA 0.1 NA
Endrin hepatotoxicity (harms the liver)
neurotoxicity (causes convulsions)
0.0018 NA 0.002 NA

Table 1: Health Risk Categories and Cancer Risk Values for Chemicals with California Public Health Goals (PHGs)
Chemical
Health Risk Category1 California
PHG (mg/L)2
Cancer Risk3 at the PHG
California MCL4 (mg/L)
Cancer Risk at the California
MCL
Ethylbenzene (phenylethane)
hepatotoxicity (harms the liver)
0.3 NA 0.3 NA
Ethylene dibromide
carcinogenicity (causes cancer)
0.00001 1×10⁻⁶ 0.00005 5×10⁻⁶ (five per million)
Fluoride musculoskeletal toxicity (causes tooth mottling)
1 NA 2 NA
Glyphosate nephrotoxicity (harms the kidney)
0.9 NA 0.7 NA
Heptachlor carcinogenicity (causes cancer)
0.000008 (8×10⁻⁶)
1×10⁻⁶ 0.00001 1×10⁻⁶ (one per million)
Heptachlor epoxide
carcinogenicity (causes cancer)
0.000006 (6×10⁻⁶)
1×10⁻⁶ 0.00001 2×10⁻⁶ (two per million)
Hexachloroben- zene
carcinogenicity (causes cancer)
0.00003 1×10⁻⁶ 0.001 3×10⁻⁵ (three per hundred
thousand)
Hexachloro- cyclopentadiene (HCCPD)
digestive system toxicity (causes stomach
lesions)
0.002 NA 0.05 NA
Lead developmental neurotoxicity
(causes neurobehavioral effects in children)
cardiovascular toxicity (causes high blood
pressure) carcinogenicity (causes cancer)
0.0002 <1×10⁻⁶ (PHG is
not based on this effect)
0.015 (AL8)
2×10⁻⁶ (two per million)

Table 1: Health Risk Categories and Cancer Risk Values for Chemicals with California Public Health Goals (PHGs)
Chemical
Health Risk Category1 California
PHG (mg/L)2
Cancer Risk3 at the PHG
California MCL4 (mg/L)
Cancer Risk at the California
MCL
Lindane (γ-BHC)
carcinogenicity (causes cancer)
0.000032 1×10⁻⁶ 0.0002 6×10⁻⁶ (six per million)
Mercury (inorganic)
nephrotoxicity (harms the kidney)
0.0012 NA 0.002 NA
Methoxychlor endocrine toxicity (causes hormone
effects)
0.00009 NA 0.03 NA
Methyl tertiary- butyl ether (MTBE)
carcinogenicity (causes cancer)
0.013 1×10⁻⁶ 0.013 1×10⁻⁶ (one per million)
Molinate carcinogenicity (causes cancer)
0.001 1×10⁻⁶ 0.02 2×10⁻⁵ (two per
hundred thousand)
Monochloro- benzene (chlorobenzene)
nephrotoxicity (harms the kidney)
0.07 NA 0.07 NA
Nickel developmental toxicity (causes increased neonatal deaths)
0.012 NA 0.1 NA
Nitrate hematotoxicity (causes
methemoglobinemia)
45 as nitrate
NA 10 as nitrogen (=45 as nitrate)
NA
Nitrite hematotoxicity (causes
methemoglobinemia)
1 as nitrogen
NA 1 as nitrogen
NA

Table 1: Health Risk Categories and Cancer Risk Values for Chemicals with California Public Health Goals (PHGs)
Chemical
Health Risk Category1 California
PHG (mg/L)2
Cancer Risk3 at the PHG
California MCL4 (mg/L)
Cancer Risk at the California
MCL
Nitrate and Nitrite
hematotoxicity (causes
methemoglobinemia)
10 as nitrogen
NA 10 as nitrogen
NA
N-nitroso- dimethyl-amine (NDMA)
carcinogenicity (causes cancer)
0.000003 (3×10⁻⁶)
1×10⁻⁶ none NA
Oxamyl general toxicity (causes body weight
effects)
0.026 NA 0.05 NA
Pentachloro- phenol (PCP)
carcinogenicity (causes cancer)
0.0003 1×10⁻⁶ 0.001 3×10⁻⁶ (three per
million)
Perchlorate endocrine toxicity (affects the thyroid)
developmental toxicity (causes neurodevelop-
mental deficits)
0.001 NA 0.006 NA
Picloram hepatotoxicity (harms the liver)
0.5 NA 0.5 NA
Polychlorinated biphenyls (PCBs)
carcinogenicity (causes cancer)
0.00009 1×10⁻⁶ 0.0005 6×10⁻⁶ (six per million)
Radium-226 carcinogenicity (causes cancer)
0.05 pCi/L 1×10⁻⁶ 5 pCi/L (combined Ra226+228)
1×10⁻⁴ (one per
ten thousand)
Radium-228 carcinogenicity (causes cancer)
0.019 pCi/L 1×10⁻⁶ 5 pCi/L (combined Ra226+228)
3×10⁻⁴ (three per
ten thousand)

Table 1: Health Risk Categories and Cancer Risk Values for Chemicals with California Public Health Goals (PHGs)
Chemical
Health Risk Category1 California
PHG (mg/L)2
Cancer Risk3 at the PHG
California MCL4 (mg/L)
Cancer Risk at the California
MCL
Selenium integumentary toxicity (causes hair loss and
nail damage)
0.03 NA 0.05 NA
Silvex (2,4,5-TP) hepatotoxicity (harms the liver)
0.003 NA 0.05 NA
Simazine general toxicity (causes body weight
effects)
0.004 NA 0.004 NA
Strontium-90 carcinogenicity (causes cancer)
0.35 pCi/L 1×10⁻⁶ 8 pCi/L 2×10⁻⁵ (two per
hundred thousand)
Styrene (vinylbenzene)
carcinogenicity (causes cancer)
0.0005 1×10⁻⁶ 0.1 2×10⁻⁴ (two per
ten thousand)
1,1,2,2- Tetrachloro- ethane
carcinogenicity (causes cancer)
0.0001 1×10⁻⁶ 0.001 1×10⁻⁵ (one per
hundred thousand)
Tetrachloro- ethylene (perchloro- ethylene, or PCE)
carcinogenicity (causes cancer)
0.00006 1×10⁻⁶ 0.005 8×10⁻⁵ (eight per hundred thousand)
Thallium integumentary toxicity (causes hair loss)
0.0001 NA 0.002 NA
Thiobencarb general toxicity (causes body weight
effects) hematotoxicity
(affects red blood cells)
0.07 NA 0.07 NA

Table 1: Health Risk Categories and Cancer Risk Values for Chemicals with California Public Health Goals (PHGs)
Chemical
Health Risk Category1 California
PHG (mg/L)2
Cancer Risk3 at the PHG
California MCL4 (mg/L)
Cancer Risk at the California
MCL
Toluene (methylbenzene)
hepatotoxicity (harms the liver) endocrine toxicity
(harms the thymus)
0.15 NA 0.15 NA
Toxaphene carcinogenicity (causes cancer)
0.00003 1×10⁻⁶ 0.003 1×10⁻⁴ (one per
ten thousand)
1,2,4-Trichloro- benzene
endocrine toxicity (harms adrenal glands)
0.005 NA 0.005 NA
1,1,1-Trichloro- ethane
neurotoxicity (harms the nervous
system), reproductive toxicity
(causes fewer offspring) hepatotoxicity (harms the liver) hematotoxicity
(causes blood effects)
1 NA 0.2 NA
1,1,2-Trichloro- ethane
carcinogenicity (causes cancer)
0.0003 1x10⁻⁶ 0.005 2×10⁻⁵ (two per
hundred thousand)
Trichloro- ethylene (TCE)
carcinogenicity (causes cancer)
0.0017 1×10⁻⁶ 0.005 3×10⁻⁶ (three per
million)
Trichlorofluoro- methane (Freon 11)
accelerated mortality (increase in early death)
1.3 NA 0.15 NA

Table 1: Health Risk Categories and Cancer Risk Values for Chemicals with California Public Health Goals (PHGs)
Chemical
Health Risk Category1 California
PHG (mg/L)2
Cancer Risk3 at the PHG
California MCL4 (mg/L)
Cancer Risk at the California
MCL
1,2,3-Trichloro- propane (1,2,3-TCP)
carcinogenicity (causes cancer)
0.0000007 (7×10⁻⁷)
1x10⁻⁶ .000005 (5×10⁻⁶)
7x10⁻⁶
(1 per 142,857)
1,1,2-Trichloro- 1,2,2-trifluoro- ethane (Freon 113)
hepatotoxicity (harms the liver)
4 NA 1.2 NA
Tritium carcinogenicity (causes cancer)
400 pCi/L 1x10⁻⁶ 20,000 pCi/L
5x10⁻⁵ (five per
hundred thousand)
Uranium carcinogenicity (causes cancer)
0.43 pCi/L 1×10⁻⁶ 20 pCi/L 5×10⁻⁵ (five per
hundred thousand)
Vinyl chloride carcinogenicity (causes cancer)
0.00005 1×10⁻⁶ 0.0005 1×10⁻⁵ (one per
hundred thousand)
Xylene neurotoxicity (affects the senses, mood, and motor
control)
1.8 (single isomer or
sum of isomers)
NA 1.75 (single isomer or
sum of isomers)
NA

Table 2: Health Risk Categories and Cancer Risk Values for Chemicals without California Public Health Goals
Chemical
Health Risk Category1
U.S. EPA MCLG2 (mg/L)
Cancer Risk3
@ MCLG
California MCL4 (mg/L)
Cancer Risk @
California MCL
Disinfection byproducts (DBPS)
Chloramines acute toxicity (causes irritation)
digestive system toxicity (harms the stomach)
hematotoxicity (causes anemia)
45,6 NA7 none NA
Chlorine acute toxicity (causes irritation)
digestive system toxicity (harms the stomach)
45,6 NA none NA
Chlorine dioxide hematotoxicity (causes anemia)
neurotoxicity (harms the nervous
system)
0.85,6 NA none NA
Disinfection byproducts: haloacetic acids (HAA5)
Chloroacetic acid general toxicity (causes body and organ
weight changes8)
0.07 NA none NA
1 Health risk category based on the U.S. EPA MCLG document or California MCL document unless otherwise specified. 2 MCLG = maximum contaminant level goal established by U.S. EPA. 3 Cancer Risk = Upper estimate of excess cancer risk from lifetime exposure. Actual cancer risk may be lower or zero. 1×10⁻⁶ means one excess cancer case per million people exposed. 4 California MCL = maximum contaminant level established by California. 5 Maximum Residual Disinfectant Level Goal, or MRDLG. 6 The federal Maximum Residual Disinfectant Level (MRDL), or highest level of disinfectant allowed in drinking water, is the same value for this chemical. 7 NA = not available. 8 Body weight effects are an indicator of general toxicity in animal studies.

Table 2: Health Risk Categories and Cancer Risk Values for Chemicals without California Public Health Goals
Chemical
Health Risk Category1
U.S. EPA MCLG2 (mg/L)
Cancer Risk3
@ MCLG
California MCL4 (mg/L)
Cancer Risk @
California MCL
Dichloroacetic acid
carcinogenicity (causes cancer)
0 0 none NA
Trichloroacetic acid
hepatotoxicity (harms the liver)
0.02 0 none NA
Bromoacetic acid NA none NA none NA
Dibromoacetic acid
NA none NA none NA
Total haloacetic acids
carcinogenicity (causes cancer)
none NA 0.06 NA
Disinfection byproducts: trihalomethanes (THMs)
Bromodichloro- methane (BDCM)
carcinogenicity (causes cancer)
0 0 none NA
Bromoform carcinogenicity (causes cancer)
0 0 none NA
Chloroform hepatotoxicity and nephrotoxicity
(harms the liver and kidney)
0.07 NA none NA
Dibromo- chloromethane (DBCM)
hepatotoxicity, nephrotoxicity, and
neurotoxicity (harms the liver, kidney,
and nervous system)
0.06 NA none NA
Total trihalomethanes (sum of BDCM, bromoform, chloroform and DBCM)
carcinogenicity (causes cancer), hepatotoxicity,
nephrotoxicity, and neurotoxicity
(harms the liver, kidney, and nervous system)
none NA 0.08 NA
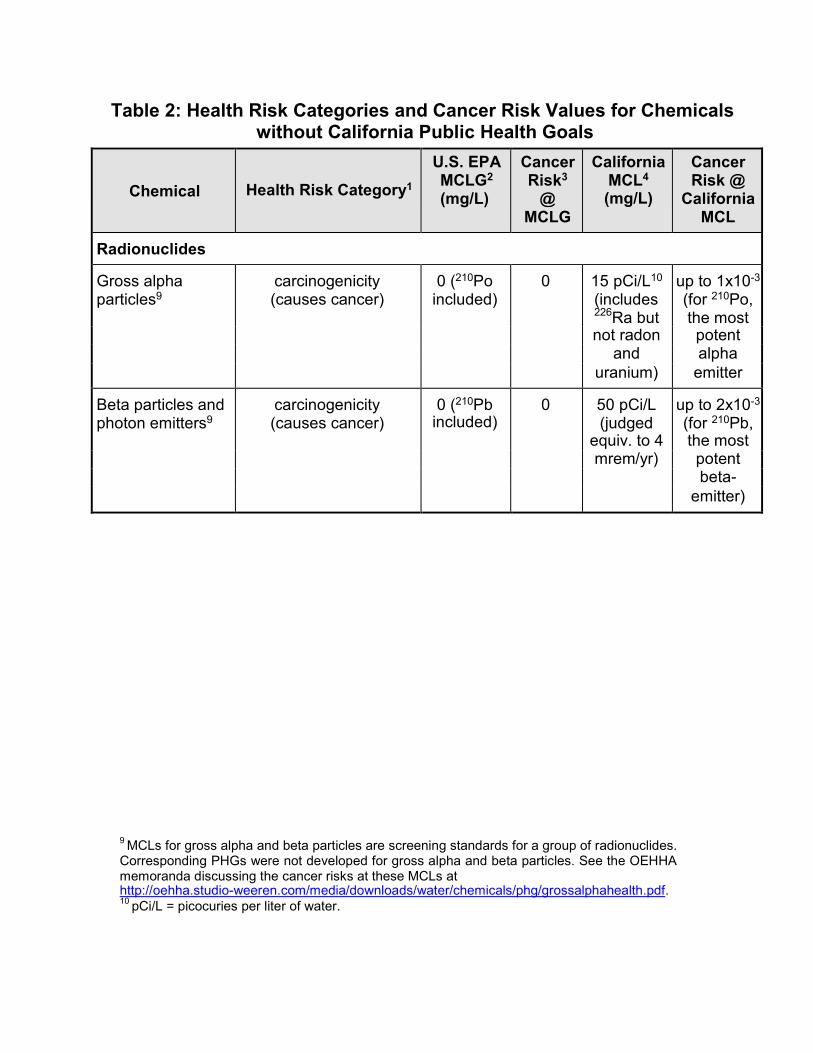
Table 2: Health Risk Categories and Cancer Risk Values for Chemicals without California Public Health Goals
Chemical
Health Risk Category1
U.S. EPA MCLG2 (mg/L)
Cancer Risk3
@ MCLG
California MCL4 (mg/L)
Cancer Risk @
California MCL
Radionuclides
Gross alpha particles9
carcinogenicity (causes cancer)
0 (210Po included)
0 15 pCi/L10 (includes 226Ra but
up to 1x10⁻³ (for 210Po, the most
not radon potent and alpha uranium) emitter
Beta particles and photon emitters9
carcinogenicity (causes cancer)
0 (210Pb included)
0 50 pCi/L (judged
up to 2x10⁻³ (for 210Pb,
equiv. to 4 the most mrem/yr) potent beta- emitter)
9 MCLs for gross alpha and beta particles are screening standards for a group of radionuclides. Corresponding PHGs were not developed for gross alpha and beta particles. See the OEHHA memoranda discussing the cancer risks at these MCLs at http://oehha.studio-weeren.com/media/downloads/water/chemicals/phg/grossalphahealth.pdf. 10 pCi/L = picocuries per liter of water.

13
APPENDIX C Cost Estimates for Treatment for Treatment Technologies
Source – Association of California Water Agencies – Suggested Guidelines for Preparation of Required Reports dated February 2016

ATTACHMENT NO. 3 Table 3
Reference: Updated 2012 ACWA Cost of Treatment Table
COST ESTIMATES FOR TREATMENT TECHNOLOGIES (INCLUDES ANNUALIZED CAPITAL AND O&M COSTS)
No. Treatment Technology
Source of Information
Estimated 2012 Unit Cost Indexed to 2018* ($/1,000 gallons treated)
1
Granular Activated
Carbon
Reference: Malcolm Pirnie estimate for California Urban Water Agencies, large surface water treatment plants treating water from the State Water Project to meet Stage 2 D/DBP and bromate regulation, 1998
0.57-1.08
2 Granular Activated
Carbon Reference: Carollo Engineers, estimate for VOC treatment (PCE), 95% removal of PCE, Oct. 1994,1900 gpm design capacity
0.26
3
Granular Activated
Carbon
Reference: Carollo Engineers, est. for a large No. Calif. surf. water treatment plant (90 mgd capacity) treating water from the State Water Project, to reduce THM precursors, ENR construction cost index = 6262 (San Francisco area) - 1992
1.25
4 Granular Activated
Carbon Reference: CH2M Hill study on San Gabriel Basin, for 135 mgd central treatment facility for VOC and SOC removal by GAC, 1990
0.49-0.71
5 Granular Activated
Carbon
Reference: Southern California Water Co. - actual data for "rented" GAC to remove VOCs (1,1-DCE), 1.5 mgd capacity facility, 1998
2.24
6 Granular Activated
Carbon
Reference: Southern California Water Co. - actual data for permanent GAC to remove VOCs (TCE), 2.16 mgd plant capacity, 1998
1.46
7
Reverse Osmosis
Reference: Malcolm Pirnie estimate for California Urban Water Agencies, large surface water treatment plants treating water from the State Water Project to meet Stage 2 D/DBP and bromate regulation, 1998
1.68-3.22
8
Reverse Osmosis
Reference: Boyle Engineering, RO cost to reduce 1000 ppm TDS in brackish groundwater in So. Calif., 1.0 mgd plant operated at 40% of design flow, high brine line cost, May 1991
3.98
9
Reverse Osmosis
Reference: Boyle Engineering, RO cost to reduce 1000 ppm TDS in brackish groundwater in So. Calif., 1.0 mgd plant operated at 100% of design flow, high brine line cost, May 1991
2.45
10
Reverse Osmosis
Reference: Boyle Engineering, RO cost to reduce 1000 ppm TDS in brackish groundwater in So. Calif., 10.0 mgd plant operated at 40% of design flow, high brine line cost, May 1991
2.65
11
Reverse Osmosis
Reference: Boyle Engineering, RO cost to reduce 1000 ppm TDS in brackish groundwater in So. Calif., 10.0 mgd plant operated at 100% of design flow, high brine line cost, May 1991
2.05
12
Reverse Osmosis
Reference: Arsenic Removal Study, City of Scottsdale, AZ - CH2M Hill, for a 1.0 mgd plant operated at 40% of design capacity, Oct. 1991
6.65

COST ESTIMATES FOR TREATMENT TECHNOLOGIES (INCLUDES ANNUALIZED CAPITAL AND O&M COSTS)
No. Treatment Technology
Source of Information
Estimated 2012 Unit Cost Indexed to 2018* ($/1,000 gallons treated)
13
Reverse Osmosis
Reference: Arsenic Removal Study, City of Scottsdale, AZ - CH2M Hill, for a 1.0 mgd plant operated at 100% of design capacity, Oct. 1991
3.92
14
Reverse Osmosis
Reference: Arsenic Removal Study, City of Scottsdale, AZ - CH2M Hill, for a 10.0 mgd plant operated at 40% of design capacity, Oct. 1991
2.94
15
Reverse Osmosis
Reference: Arsenic Removal Study, City of Scottsdale, AZ - CH2M Hill, for a 10.0 mgd plant operated at 100% of design capacity, Oct. 1991
1.82
16
Reverse Osmosis Reference: CH2M Hill study on San Gabriel Basin, for 135 mgd
central treatment facility with RO to remove nitrate, 1990
1.83-3.22
17
Packed Tower
Aeration
Reference: Analysis of Costs for Radon Removal... (AWWARF publication), Kennedy/Jenks, for a 1.4 mgd facility operating at 40% of design capacity, Oct. 1991
1.06
18 Packed Tower
Aeration
Reference: Analysis of Costs for Radon Removal... (AWWARF publication), Kennedy/Jenks, for a 14.0 mgd facility operating at 40% of design capacity, Oct. 1991
0.56
19
Packed Tower
Aeration
Reference: Carollo Engineers, estimate for VOC treatment (PCE) by packed tower aeration, without off-gas treatment, O&M costs based on operation during 329 days/year at 10% downtime, 16 hr/day air stripping operation, 1900 gpm design capacity, Oct. 1994
0.28
20
Packed Tower Aeration
Reference: Carollo Engineers, for PCE treatment by Ecolo-Flo Enviro-Tower air stripping, without off-gas treatment, O&M costs based on operation during 329 days/year at 10% downtime, 16 hr/day air stripping operation, 1900 gpm design capacity, Oct. 1994
0.29
21 Packed Tower
Aeration
Reference: CH2M Hill study on San Gabriel Basin, for 135 mgd central treatment facility - packed tower aeration for VOC and radon removal, 1990
0.45-0.74
22 Advanced Oxidation Processes
Reference: Carollo Engineers, estimate for VOC treatment (PCE) by UV Light, Ozone, Hydrogen Peroxide, O&M costs based on operation during 329 days/year at 10% downtime, 24 hr/day AOP operation, 1900 gpm capacity, Oct. 1994
0.55
23
Ozonation
Reference: Malcolm Pirnie estimate for CUWA, large surface water treatment plants using ozone to treat water from the State Water Project to meet Stage 2 D/DBP and bromate regulation, Cryptosporidium inactivation requirements,1998
0.13-0.26
24 Ion Exchange Reference: CH2M Hill study on San Gabriel Basin, for 135 mgd central treatment facility - ion exchange to remove nitrate, 1990 0.61-0.80
*Costs were adjusted from date of original estimates to present, where appropriate, using the Engineering News Record (ENR) annual average building costs of 2018 and 2012. The adjustment factor was derived from the ratio of 2018 Index/2012 Index.