report on the slp health care survey - american speech
TRANSCRIPT

Report on the ASHA Speech-Language Pathology Health Care Survey
Michael Rosenfeld, Ph.D.
October 2002

ACKNOWLEDGEMENTS
This report is the product of the efforts of a number of people to whom the author is indebted. In particular, I would like to recognize the assistance and support provided by Louise Zingeser, Janet Brown, and Sarah Slater of ASHA as well as the many speech-language pathologists who took time out of their busy schedules to complete the Speech-Language Pathology Healthcare Survey.

i
EXECUTIVE SUMMARY
INTRODUCTION
In recent years, health care has changed dramatically due to the growing prevalence of managed care systems and implementation of the Prospective Payment System for Medicare beneficiaries. These changes have had a profound effect on speech-language pathologists (SLPs) working in all health care settings with respect to service delivery, working conditions, caseloads, demographics, and practice patterns. Anecdotal reports and recent data from the Omnibus Survey and Member Counts have shown a declining rate of employment of SLPs in health care settings. To address these issues, and verify the accuracy of anecdotal reports, current and accurate survey data were needed. Therefore a survey of speech-language pathology clinical service providers across health care settings was conducted. The data from this survey may be used for advocacy with employers and payers in addition to providing information that ASHA may use to develop new resources for members.
METHOD
Development of the Initial Survey Instrument Draft questions were developed by ASHA staff based on issues and concerns raised by members, volunteer leaders, and the Omnibus Survey. Draft questions were reviewed and revised based on interaction with the consultant (Michael Rosenfeld Ph.D. & Associates) selected to conduct the ASHA Speech-Language Pathology (SLP) Health Care Survey. The survey was pilot tested with initial and follow-up cover letters. Pilot Test The purpose of the pilot test was to gather feedback on the draft SLP Health Care Survey as well as on the initial and follow-up letters. Twenty-three SLPs working in a general hospital, a rehabilitation hospital, a pediatric hospital, a home health agency, an outpatient clinic, and private SLP offices were represented in the pilot test. Forty-three percent returned their questionnaires. The vast majority of respondents reported the questions and instructions in the SLP Health Care Survey to be readily understandable and the cover letter and follow up letters to be clear and motivating. Several minor changes were made in the survey as a result of the pilot test. Selection of the Sample ASHA staff selected a proportional sample of 5,000 SLPs working in health care settings from the ASHA data base. SLPs were then randomly selected and stratified across various health care settings. This sample size was selected to ensure a sufficient number of respondents in each setting to allow for separate analyses by practice setting.
ii
Printing and Distribution of ASHA SLP Health Care Surveys The final survey was printed in scannable format by National Computer Systems (NCS) and provided to ASHA for distribution to the sample of SLPs. The first mailing of the SLP Health Care Survey and cover letter occurred on June10, 2002. Since the surveys were anonymous, a second survey and follow up cover letter was mailed to the entire sample two weeks later to encourage return of the SLP Health Care Survey. Pre-paid addressed envelopes were included in each mailing. The surveys were to be returned to NCS for scanning and entry of the write-in responses. Data Analysis Data analyses were to be conducted overall for all respondents and separately for each of the six defined practice settings: general medical hospital, rehabilitation hospital, pediatric hospital, skilled nursing facility, home health agency or client’s home (hereafter referred to as home health). Frequency counts were computed for all items as well as means and standard deviations where appropriate. Content analyses were conducted for questions 20 and 33 where respondents were asked to write in narrative responses.
SUMMARY OF RESULTS
The survey of SLP clinical service providers across health care settings provided a great deal of information. The data can be broadly categorized into the following broad areas: demographics, work conditions, professional services, workforce information, impact of reimbursement, HIPAA (Health Insurance Portability and Accountability Act), technology use, and ASHA services. Results obtained from each area are summarized below. Demographics The overall response rate to the ASHA SLP Health Care Survey was 42%. The percent of respondents from each practice setting was similar to the percentage of SLPs included in the proportional sample used in this study. Respondents came from all nine geographic regions of the country used by ASHA in its national database with representation of facilities located in metropolitan/urban, suburban, and rural settings. Survey respondents appeared to be representative of the population of SLPs working in health care settings in the ASHA constituency. Work Conditions Principal employment situation. Forty-six percent of respondents indicated they were salaried employees, 38% were contract employees, and 17% were self employed. A large majority (79%) of the salaried employees reported working full time; one-third of contract employees worked full time; and the majority of self employed SLPs (64%) reported working full time. The percentages of salaried and contract SLPs varied by practice setting. The largest percentages of salaried employees were found in pediatric (76%) and rehabilitation (73%) hospital settings while the largest percentages of contract employees were found in skilled nursing facilities

iii
(67%) and home health (45%). SLPs working in home health had the largest percentage of part time contract employees (72%). The largest percentages of self-employed SLPs were found in outpatient clinics or speech/hearing clinics (30%). Benefits provided by employer. Respondents reported the benefits most frequently provided were paid vacation (80%), health insurance (79%), and paid sick leave (77%). The benefits least often reported as being provided were membership in other professional organizations (5%), state association dues (14%), licensure fees (19%), and ASHA dues (24%). The largest percentage of respondents reporting paid vacation, paid sick leave, and health insurance benefits were found in general medical, rehabilitation, and pediatric hospital settings. Lesser percentages were reported for home health, outpatient clinics or speech/hearing clinics, and skilled nursing facilities. Skilled nursing facilities, home health, and outpatient clinics or speech/hearing clinics were more likely to provide ASHA dues, state association dues, and licensure fees than were those employed in hospital settings. Level of job satisfaction compared to three years ago. Overall, the level of satisfaction of SLPs was about the same as it was three years ago. Respondents in outpatient clinics or speech/hearing clinics reported the highest levels of satisfaction compared to the past three years. The lowest levels of satisfaction compared to the past three years were obtained from respondents from skilled nursing facilities and rehabilitation hospitals. The percent of respondents indicating they were somewhat or extremely more dissatisfied was 43% for those in skilled nursing facilities and 33% for rehabilitation hospitals. Fifteen percent of the respondents from skilled nursing facilities were extremely dissatisfied compared to three years ago. This was more than twice the percentage from any other practice setting. There was no practice setting where the mean rating indicated they were more satisfied than they were three years ago. Reasons for job dissatisfaction. Overall, the most frequently cited reason for dissatisfaction was the volume of paperwork. This was cited by a majority of respondents. A majority of respondents from skilled nursing facilities noted involuntary reduction in salaries or benefits without changes in work hours, involuntary increase in number of sites served, and near majorities noted conversion from salaried to hourly PRN pay, and involuntary reduction in paid work hours. A majority of respondents from rehabilitation hospitals noted the involuntary increase in caseload as a major source of dissatisfaction. Number of hours worked in a typical day. A majority of respondents from general medical, rehabilitation, and pediatric hospital settings and outpatient clinics or speech/hearing clinics reported they worked between eight and 10 hours per day. A majority of the respondents from skilled nursing facilities and home health indicated they worked fewer than eight hours per day. Productivity requirements. A productivity requirement was defined as the number of hours in direct patient contact divided by the number of hours worked. Overall, 48% of respondents indicated their facility had a productivity requirement. The percentage of those reporting a productivity requirement ranged from 23% for respondents working in home health to 93% for those working in pediatric hospitals. The largest percentage of respondents (44%) indicated that their productivity requirements ranged from 70-79%. While SLPs from pediatric hospitals were

iv
most likely to have productivity requirements, these requirements appeared to be somewhat lower than those in other practice settings. Provision of SLP services on weekends. Overall, 40% of respondents indicated that their facility provided services on weekends. This ranged from a high of 77% for rehabilitation hospitals to a low of 19% for those working in outpatient clinics or speech/hearing clinics. Professional Services Percent of direct treatment provided in group vs. individual sessions. Overall, the average percent of direct treatment time spent working with individuals was 91%. The six practice settings reported spending from 89% of their direct treatment time (rehabilitation hospitals) to 98% of their direct treatment time (general medical hospitals) providing individual sessions with their patients. Approximately nine percent of SLPs’ direct treatment time was spent working with groups. The most time spent working with groups was in rehabilitation hospitals (11%). Percent of time spent on interventions with adult and pediatric patients. Seventy-three percent of respondents indicated they worked with adults. Aside from pediatric hospitals, the majority of respondents from the remaining five settings reported that they worked with adults. The largest percentages of time spent working with adults involved treatment of dysphagia, cognitive-communication disorders, and aphasia. The percent of time spent on interventions by SLPs varied by practice setting. Fifty-three percent of respondents indicated they worked with children. A majority of the respondents from pediatric hospitals, home health, and outpatient clinics or speech/hearing clinics reported working with children. The largest percentage of time spent working with children involved intervention for difficulty with language and articulation/phonology. The percent of time spent varied for different disorders by practice setting. Respondents from pediatric hospitals reported spending more time providing treatment for cognitive-communication disorders and dysphagia than did respondents from home health and outpatient clinics or speech/hearing clinics. Respondents from outpatient clinics or speech/hearing clinics were most likely to provide treatment for language and articulation/phonology disorders.
Provision of primary dysphagia services. Eighty-five percent of respondents indicated that no professionals other than SLPs provided primary dysphagia services in their work setting. Pediatric hospitals appeared to be the setting where another professional was most likely to provide these services.
Training or supervising other disciplines in the provision of dysphagia services. Ninety percent of all respondents indicated they had not been asked to train or supervise other disciplines to provide primary dysphagia services. SLPs from skilled nursing facilities provided the largest percentage of respondents (18%) indicating they had been asked to supervise other disciplines in the provision of primary dysphagia services.
Referrals for patients/clients appropriate for AAC services. Overall, 66% of SLPs say they received referrals for AAC devices. This percentage was fairly consistent across practice settings other than pediatric hospitals where 93% of SLPs reported receiving these referrals.

v
These requests were usually handled by referring them to providers outside their facility/setting. The least likely choice in every practice setting was to refer to professionals in other disciplines in their own practice setting. Workforce Information Use of full time and part time SLPs, SLPAs, and other support personnel. The majority of full time SLPs report working in departments by themselves or with one other full time SLP. This is particularly true for SLPs working in skilled nursing facilities and home health. Respondents from pediatric hospitals appear to be the most likely to work with larger numbers of other SLPs. Similar trends exist for part time SLPs as for full time SLPs. The employment of full time and part time SLPAs appeared to be rare, with 98% of respondents indicating they were not used in their departments. Other support personnel, full time and part time, are employed at a higher rate than SLPAs. The vast majority of respondents indicated they do not use full time other support personnel (87%) or part time other support personnel. Outpatient clinics or speech/hearing clinics appeared to be the most likely to use full or part time other support personnel. Impact of SLPAs on the provision of services. For those who employ SLPAs, the most frequently noted effects on the way they provided services were more time for direct service and one-on-one service provision, larger caseloads, and increased supervisory duties. Funded, unfilled positions for SLPs. Seventy-five percent of respondents reported there were no funded unfilled positions for SLPs in their facility. The largest percentages of unfilled positions were found in pediatric and rehabilitation hospitals where 61% and 35% of respondents, respectively, indicated one or more positions were unfilled. The largest percentage of respondents indicating their positions were unfilled for more than six months came from skilled nursing homes (72%) and home health (69%). Recruiting/hiring of SLPs. The majority of respondents from all practice settings reported having difficulty hiring qualified SLPs. This ranged from a low of 63% for respondents from general hospitals to a high of 79% from respondents from skilled nursing facilities. The most frequently cited reasons for difficulty in hiring were: a lack of qualified SLPs, non-competitive salary and benefits, undesirable working conditions, and undesirable geographic location. Respondents from skilled nursing facilities appeared to have the greatest number of problems hiring qualified SLPs. Write-in comments confirmed the reasons cited above and added concerns such as: location was not close to a university, inefficient recruiting, and unavailability of bilingual SLPs. Overall, the majority of respondents reported that recruiting was conducted using local advertising and networking with professional contacts. A majority of respondents from pediatric hospitals reported they also use national advertising while skilled nursing facilities seemed to be the largest users of professional recruiters. SLP student interns and clinical fellows. Forty-five percent of respondents reported they had an SLP intern in their facility within the past 12 months. Respondents from pediatric and

vi
rehabilitation hospitals were the most likely to use SLP student interns while respondents from home health and skilled nursing facilities were least likely to use student interns. Overall, 28% of respondents reported hiring a clinical fellow within the past 12 months. Pediatric and rehabilitation hospitals were the most likely to have hired a clinical fellow while home health and skilled nursing facilities were the least likely to have hired one. Time spent supervising students, SLPAs, and clinical fellows. Forty-three percent of respondents reported spending some time providing supervision. Approximately half of those SLPs indicated they spent less than 20% of their time in supervision. Respondents from pediatric and rehabilitation hospitals were most likely to spend time in supervision while SLPs from home health and skilled nursing facilities provided the lowest levels of supervision. These results were consistent with the hiring trends in those practice settings. Impact of Reimbursement Reimbursement under Medicare PPS. Fifty-one percent of respondents reported their facility received some form of payment under PPS. The percent receiving these payments varied by practice setting with respondents from skilled nursing facilities (95%) and rehabilitation hospitals (72%) reporting the highest percentages, while respondents from pediatric hospitals (16%) and outpatient clinics or speech/hearing clinics (22%) reported the lowest percentages of facilities receiving these reimbursements. Large majorities of respondents from all practice settings other than those from skilled nursing facilities either did not know or thought there had been no change in the number of SLP positions in their facility/setting as a result of Medicare PPS. The majority of respondents from skilled nursing facilities reported there were fewer SLP positions since implementation of PPS. It was rare to find respondents from any setting who reported that Medicare PPS resulted in more SLP positions being made available. The majority of respondents from all practice settings agreed that there were more barriers to providing good patient care now than before PPS. Respondents from skilled nursing facilities, general medical hospitals, rehabilitation hospitals, and outpatient clinics or speech/hearing clinics had the largest percentages of respondents agreeing that there were more barriers now while slightly lower percentages were reported by respondents from pediatric hospitals and home health. The most frequently cited barriers to providing good patient care were pressure to contain services within predetermined limits, increased documentation demands, and reduced lengths of stay. These findings were generally similar across practice settings. However, reduced lengths of stay was most frequently cited by respondents from rehabilitation hospitals (76%) and pressure to limit referrals for instrumental swallowing studies was most often cited by respondents from skilled nursing facilities (53%). Respondents from skilled nursing facilities were also the most likely to indicate there was insufficient SLP staffing, and fewer opportunities to screen patients. Respondents from outpatient clinics or speech/hearing clinics and skilled

vii
nursing facilities were the most likely to indicate there was pressure to contain services within predetermined limits. Primary reimbursement sources. The largest percentage of respondents indicated that Medicare (36%) was their primary source of reimbursement. The remaining sources of reimbursement listed in rank order were: private insurance (19%), Medicaid (16%), and self pay (8%). The primary sources for reimbursement varied by practice setting. Medicare was the largest reimbursement source for skilled nursing facilities (71%), rehabilitation hospitals (47%), general medical hospitals (46%), and home health (35%). Respondents from pediatric hospitals reported that private insurance (35%) and Medicaid (34%) were their primary sources of reimbursement. Respondents from outpatient clinics or speech/hearing clinics indicated that private insurance (32%), Medicaid (23%), and self-pay (20%) were their primary sources for reimbursement. HIPAA (Health Insurance Portability and Accountability Act) The majority of respondents from all practice settings reported they were not at all knowledgeable about HIPAA. Respondents from home health seemed to be least knowledgeable with 72% reporting they were not at all knowledgeable about HIPAA. Technology Use Respondents reported that computer programs and software or web-based programs were not widely used by SLPs for treatment, evaluation, documentation, patient education, or billing in any of the major health care practice settings. The most frequent use across all health care practice settings was for billing. Even here, however, it was generally used only rarely. The highest levels of reported use of computer software or web-based programs were in pediatric hospitals and outpatient clinics or speech/hearing clinics and the lowest levels of use were in skilled nursing homes and home health. These latter two settings, however, were using computer programs and software or web-based programs for billing. ASHA Services Respondents were asked to use a five-point importance rating scale to indicate the importance of a variety of ASHA services. The ratings were: 1) not important; 2) of minimal importance; 3) moderately important; 4) important; and 5) very important. All of the programs, products, and services provided by ASHA were judged to be at least moderately important. ASHA advocacy on health care issues received the highest rating (a rating of important). Listed below are the programs, products, and services listed in rank order of their overall ratings of importance.
1. ASHA advocacy on health care issues (3.86) 2. ASHA policy documents (3.48) 3. Publications (3.26) 4.5 Health care related information on the web site (3.08) 4.5 ASHA CE self study self-study products (3.08) 6. Research information (2.97)
viii
7. Special interest divisions (2.78) 8. Professional consultation with ASHA staff (2.68) 9. Other ASHA products (2.60) 10. ASHA convention (2.59)
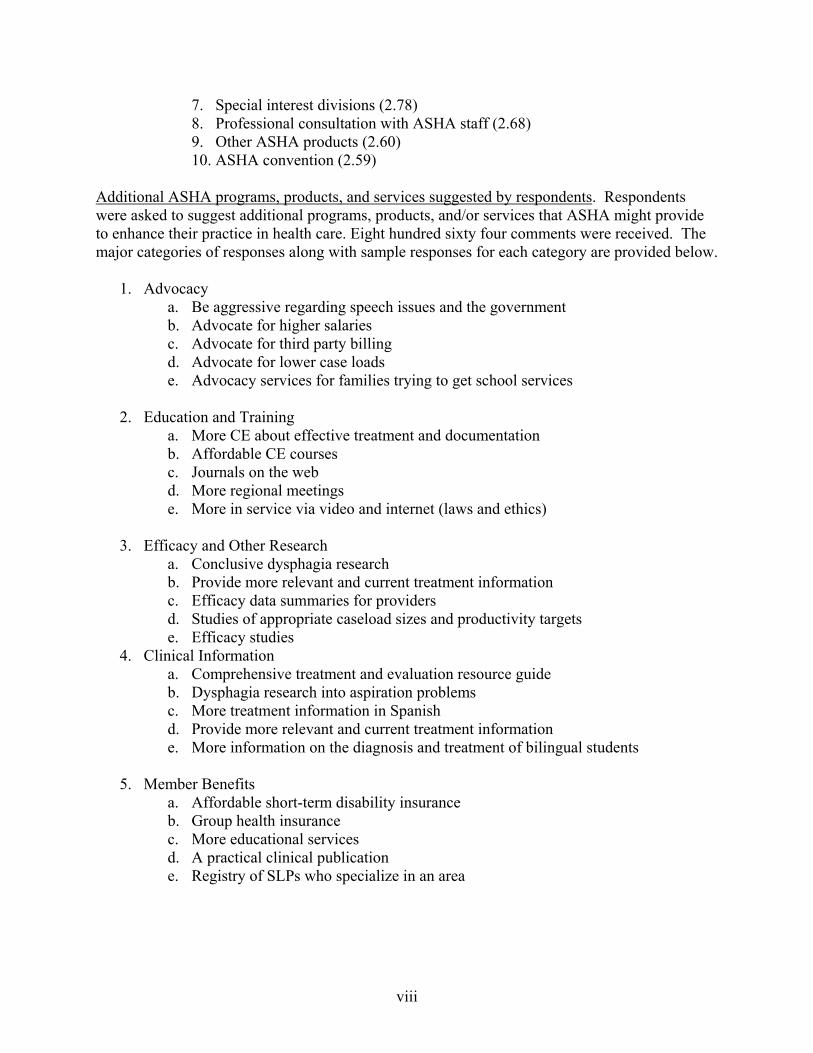
Additional ASHA programs, products, and services suggested by respondents. Respondents were asked to suggest additional programs, products, and/or services that ASHA might provide to enhance their practice in health care. Eight hundred sixty four comments were received. The major categories of responses along with sample responses for each category are provided below.
1. Advocacy a. Be aggressive regarding speech issues and the government b. Advocate for higher salaries c. Advocate for third party billing d. Advocate for lower case loads e. Advocacy services for families trying to get school services
2. Education and Training
a. More CE about effective treatment and documentation b. Affordable CE courses c. Journals on the web d. More regional meetings e. More in service via video and internet (laws and ethics)
3. Efficacy and Other Research
a. Conclusive dysphagia research b. Provide more relevant and current treatment information c. Efficacy data summaries for providers d. Studies of appropriate caseload sizes and productivity targets e. Efficacy studies
4. Clinical Information a. Comprehensive treatment and evaluation resource guide b. Dysphagia research into aspiration problems c. More treatment information in Spanish d. Provide more relevant and current treatment information e. More information on the diagnosis and treatment of bilingual students
5. Member Benefits
a. Affordable short-term disability insurance b. Group health insurance c. More educational services d. A practical clinical publication e. Registry of SLPs who specialize in an area

ix
6. Business Practices
a. Information for private practice b. Tips to improve efficiency c. Marketing programs d. Help with guidelines on the use of SLPAs e. Grant writing for research
7. Public Relations a. Let the public know more about what we do b. Let third party payers know more about what we do and how well it works c. More frequent radio and television spots
CONCLUSION
The results obtained from the ASHA Health Care Survey provided feedback from a representative sample of SLPs working in health care settings. These responses provide ASHA with a more accurate picture of the changes taking place in the health care settings in which SLPs work than can be obtained from the anecdotal information ASHA receives from SLPs calling or writing in with their specific comments or concerns. It is important for ASHA to have accurate information from a large representative sample of SLPs in order to insure that the programs and services it provides meet the needs of the membership. Highlights of the survey include the first systematic collection of data regarding weekend work activities of SLPs as well as updated information on productivity standards and caseload for SLPs in health care settings. Surprisingly, survey results indicated low levels of use of technology by SLPs. In addition, SLPAs and other support personnel were infrequently used by SLPs in most health care settings. Although levels of dissatisfaction have not changed significantly since three years ago, it was interesting to note that the major source of dissatisfaction across all practice settings was an increased volume of paperwork. Another interesting finding was that almost 75% of all respondents indicated they were not at all knowledgeable about HIPAA (Health Insurance Portability and Accountability Act), which is due to be implemented in 2002-2003 and will impact all health care settings. The highest rated ASHA service was advocacy, which received a rating of important. All of the programs and services were rated as being at least of moderate importance. It was clear that the programs and services currently being offered by ASHA are valued by SLPs in health care settings.
x
TABLE OF CONTENTS
EXECUTIVE SUMMARY……………………………………………………………………………………. i Introduction ……………………………………………………………………………………………… i Method ……………………………………………………………………………….………………….. i Development of the Initial Survey Instrument …………………………………………………… i Pilot Test …………………………………………………………………………………………. i Selection of the Sample ………………………………………………………………………….. i Printing and Distribution of ASHA SLP Health Care Surveys ………………………………….. ii Data Analysis ……………………………………………………………………………………. ii Summary of Results …………………………………………………………………………………….. ii Demographics…………………………………………………………………………………….. ii Work Conditions………………………………………………………………………………….. ii Professional Services……………………………………………………………………………... iv Workforce Information…………………………………………………………………………… v Impact of Reimbursement………………………………………………………………………… vi HIPAA……………………………………………………………………………………………. vii Technology Use…………………………………………………………………………………... vii ASHA Services…………………………………………………………………………………… vii Conclusion……………………………………………………………………………………………….. ix INTRODUCTION……………………………………………………………………………………………… 1 Method…………………………………………………………………………………………………… 1 Development of the Initial Survey Instrument …………………………………………………… 1 Pilot Test …………………………………………………………………………………………. 1 Selection of the Sample ………………………………………………………………………….. 1 Printing and Distribution of ASHA SLP Health Care Surveys ………………………………….. 2 Data Analysis ……………………………………………………………………………………. 2 Results……………………………………………………………………………………………………. 3 Response Rate…………………………………………………………………………………….. 3 Question by Question Responses…………………………………………………………………. 4-59 Summary of Results……………………………………………………………………………………… 60 Demographics…………………………………………………………………………………….. 60 Work Conditions………………………………………………………………………………….. 60 Professional Services……………………………………………………………………………... 61 Workforce Information…………………………………………………………………………… 62 Impact of Reimbursement………………………………………………………………………… 63 HIPAA……………………………………………………………………………………………. 64 Technology Use…………………………………………………………………………………... 65 ASHA Services…………………………………………………………………………………… 65 CONCLUSION………………………………………………………………………………………………… 66

1
INTRODUCTION
In recent years, health care has changed dramatically due to the growing prevalence of managed care systems and implementation of the Prospective Payment System for Medicare beneficiaries. These changes have had a profound effect on speech-language pathologists (SLPs) working in all health care settings with respect to service delivery, working conditions, caseloads, demographics, and practice patterns. Anecdotal reports and recent data from the Omnibus Survey and Member Counts have shown a declining rate of employment of SLPs in health care settings. To address these issues, and verify the accuracy of anecdotal reports, current and accurate survey data were needed. Therefore a survey of speech-language pathology clinical service providers across health care settings was conducted. The data from this survey may be used for advocacy with employers and payers in addition to providing information that ASHA may use to develop new resources for members.
METHOD
This section of the report describes the procedures used to construct, administer, and process the ASHA Health Care Survey. Development of the Initial Survey Instrument Draft questions were developed by ASHA staff based on issues and concerns raised by members, volunteer leaders, and the Omnibus Survey. Draft questions were reviewed and revised based on interaction with the consultant (Michael Rosenfeld Ph.D. & Associates) selected to conduct the ASHA Speech-Language Pathology (SLP) Health Care Survey. The survey was pilot tested with initial and follow-up cover letters. Pilot Test The purpose of the pilot test was to gather feedback on the draft SLP Health Care Survey as well as on the initial and follow-up letters. Twenty-three SLPs working in a general hospital, a rehabilitation hospital, a pediatric hospital, a home health agency, an outpatient clinic, and private SLP offices were represented in the pilot test. Forty-three percent returned their questionnaires. The vast majority of respondents reported the questions and instructions in the SLP Health Care Survey to be readily understandable and the cover letter and follow up letters to be clear and motivating. Several minor changes were made in the survey as a result of the pilot test. A copy of the final SLP Health Care Survey as well as the cover and follow up letters are contained in Appendix A. Selection of the Sample ASHA staff selected a proportional sample of 5,000 SLPs working in health care settings from the ASHA data base. SLPs were then randomly selected and stratified across

2
various health care settings. This sample size was selected to ensure a sufficient number of respondents in each setting to allow for separate analyses by practice setting. Table 1 shows the sampling by practice setting. The “Other” category includes SLPs from a range of practice settings (e.g., psychiatric hospitals). Table 1
Sampling Plan
Practice Setting N %
General Medical Hospital
1159 23.2
Rehabilitation Hospital
714 14.3
Pediatric Hospital
173 3.5
Skilled Nursing Facility
962 19.2
Home Health
607 12.1
Outpatient Clinics or Speech-Hearing Clinics
620 12.4
Other Health Care Settings
766 15.3
Total Sample 5001 100
Printing and Distribution of ASHA SLP Health Care Surveys The final survey was printed in scannable format by National Computer Systems (NCS) and provided to ASHA for distribution to the sample of SLPs. The first mailing of the SLP Health Care Survey and cover letter occurred on June10, 2002. Since the surveys were anonymous, a second survey and follow up cover letter was mailed to the entire sample two weeks later to encourage return of the SLP Health Care Survey. Pre-paid addressed envelopes were included in each mailing. The surveys were to be returned to NCS for scanning and entry of the write-in responses. Data Analysis Data analyses were to be conducted overall for all respondents and separately for each of the six defined practice settings: general medical hospital, rehabilitation hospital, pediatric hospital, skilled nursing facility, home health agency or client’s home (hereafter referred to as home health). Frequency counts were computed for all items as well as means and standard deviations where appropriate. Content analyses were conducted for questions 20 and 33 where respondents were asked to write in narrative responses.

3
RESULTS
Response Rate Surveys were distributed to 5,001 SLPs from the ASHA database working in health care settings. There were 2,093 surveys returned for a return rate of 42%. Of these, 1955 were usable for data analysis purposes. Some respondents did not complete their surveys and indicated they had retired, left the profession, or were no longer working in health care settings. Others were returned and were mostly incomplete. Table 2 provides the number of usable responses by practice setting, the response rate by practice setting, and the percent of the total number of usable returns by practice setting. This latter figure can be used to compare the similarity of the respondents (by practice setting) to the SLPs included in the sample. Table 2
Response Rate and Percent of Usable Responses by Practice Setting
Practice Setting N Response Rate
Percent of Usable
Responses General Medical Hospital
444 38% 22.7%
Rehabilitation Hospital
177 25% 9.1%
Pediatric Hospital
59 34% 3.0%
Skilled Nursing Facility
330 34% 16.9%
Home Health
242 40% 12.4%
Outpatient Clinic or Speech-Hearing Clinic
281 45% 14.4%
Other Health Care Settings
422 45% 21.6%
Total 1955
Note: Response rates ranged from 25% for respondents from rehabilitation hospitals to 45% for respondents from outpatient clinics or speech/hearing clinics and other health care settings. The percent of respondents from each practice setting was similar to the percentages of SLPs included in the proportional sample. The largest discrepancy occurred for the “other health care” setting and was 6.3%. Some of this difference may be attributable to the inclusion of respondents who reported they worked in multiple settings into that category. The respondents seem representative of the population of SLPs working in health care settings that are contained in the ASHA database.

4
Question by Question Responses
Overall General Medical hospital
Rehabilitation hospital
Pediatric hospital
Skilled nursing facility
Home health agency or
client's home
Outpatient clinic or
speech/hearing clinic
Other
DEMOGRAPHICS N % N % N % N % N % N % N % N % Question 1 Total
N 1955 444 177 59 330 242 281 422
Please indicate your primary work setting. (a) General Medical hospital 444 22.7 444 100.0 0 0.0 0 0.0 0 0.0 0 0.0 0 0.0 0 0.0 (b) Rehabilitation hospital 177 9.1 0 0.0 177 100.0 0 0.0 0 0.0 0 0.0 0 0.0 0 0.0 (c) Pediatric hospital 59 3.0 0 0.0 0 0.0 59 100.0 0 0.0 0 0.0 0 0.0 0 0.0 (d) Skilled nursing facility 330 16.9 0 0.0 0 0.0 0 0.0 330 100.0 0 0.0 0 0.0 0 0.0 (e) Home health agency or client's home 242 12.4 0 0.0 0 0.0 0 0.0 0 0.0 242 100.0 0 0.0 0 0.0 (f) Outpatient clinic or speech/hearing clinic 281 14.4 0 0.0 0 0.0 0 0.0 0 0.0 0 0.0 281 100.0 0 0.0 (g) Other 422 21.6 0 0.0 0 0.0 0 0.0 0 0.0 0 0.0 0 0.0 422 100.0
• There were 1955 respondents to this question. The largest percentage of respondents came from general medical hospital settings (23%). Other practice settings with the large percentages of respondents came from SLPs working in skilled nursing facilities (17%), outpatient clinics or speech/hearing clinics (14%), home health agencies or clients’ homes (hereafter referred to as home health) (12%), and rehabilitation hospitals (9%). Pediatric hospitals had the lowest percentage of respondents (3%).
• The second largest percentage of respondents came from “other” work settings. This “other” category likely includes respondents for other
healthcare settings (e.g., psychiatric hospitals), other residential healthcare settings, or any other hospital setting. It also includes respondents whose employment settings have not recently been updated in the ASHA member database. This category also contains respondents who reported working in multiple practice settings. As a result of the heterogeneity of this group and our inability to accurately describe them, data from this group will be shown on each table but will not be discussed.

5
Overall General Medical hospital
Rehabilitation hospital
Pediatric hospital
Skilled nursing facility
Home health agency or
client's home
Outpatient clinic or
speech/hearing clinic
Other
WORK CONDITIONS N % N % N % N % N % N % N % N % Question 2 Total
N 1942 444 177 59 330 240 280 412
Which one of the following best describes your principal employment situation? Do you work part or full time?
(a) Salaried employee 885 45.6 265 59.7 129 72.9 45 76.3 98 29.7 61 25.4 104 37.1 183 44.4 Full Time (>=30 hrs/wk) 700 79.1 200 75.5 110 85.3 37 82.2 83 84.7 39 63.9 86 82.7 145 79.2 Part Time (<30 hrs/wk) 185 20.9 65 24.5 19 14.7 8 17.8 15 15.3 22 36.1 18 17.3 38 20.8
(b) Contract employee (hourly rate) 733 37.7 168 37.8 47 26.6 14 23.7 222 67.3 108 45.0 91 32.5 83 20.1 Full Time (>=30 hrs/wk) 257 35.1 57 33.9 15 31.9 5 35.7 91 41.0 30 27.8 30 33.0 29 34.9 Part Time (<30 hrs/wk) 476 64.9 111 66.1 32 68.1 9 64.3 131 59.0 78 72.2 61 67.0 54 65.1
(c) Owner (self-employed) 324 16.7 11 2.5 1 0.6 0 0.0 10 3.0 71 29.6 85 30.4 146 35.4 Full Time (>=30 hrs/wk) 206 63.6 7 63.6 1 100.0 0 0.0 6 60.0 37 52.1 69 81.2 86 58.9 Part Time (<30 hrs/wk) 118 36.4 4 36.4 0 0.0 0 0.0 4 40.0 34 47.9 16 18.8 60 41.1
• Overall, there were 1942 respondents to this question. Forty-six percent reported being salaried employees; of these, 79% indicated they were full time employees. Thirty-eight percent reported being contract employees, with 35% indicating they were full time employees. Seventeen percent reported they were owners, with 64% indicating they worked full time.
• The largest percentages of salaried employees were found in pediatric (76%) and rehabilitation (73%) hospital settings. The lowest percentages of salaried employees were found in home health (25%) and skilled nursing facilities (30%) settings. Over 80% of the salaried employees working in rehabilitation hospitals, pediatric hospitals, skilled nursing facilities, and outpatient clinics or speech/hearing clinics reported being full time employees. Those working in home health had the largest percentage of part time employees (36%)
• The largest percentages of contract employees were found in skilled nursing facilities (67%) and home health (45%). The smallest percentages were found in other (20%), pediatric hospitals (24%), and rehabilitation hospitals (27%). Skilled nursing facilities had the largest percentages of full time contract employees (41%). SLPs working in home health had the largest percentage of part time contract employees (72%).
• The largest percentages of owners were found in outpatient clinics or speech/hearing clinics (30%), and home health (30%) settings.

6
Overall General Medical hospital
Rehabilitation hospital
Pediatric hospital
Skilled nursing facility
Home health agency or
client's home
Outpatient clinic or
speech/hearing clinic
Other
WORK CONDITIONS N % N % N % N % N % N % N % N % Question 3 Total N 1416 385 165 58 234 123 205 246 Which of the following benefits are provided by your employer? (Mark all that apply)
(a) Paid Vacation 1136 80.2 344 89.4 152 92.1 55 94.8 192 82.1 76 61.8 152 74.1 165 67.1 (b) Paid sick leave 1084 76.6 328 85.2 140 84.8 53 91.4 163 69.7 66 53.7 140 68.3 194 78.9 (c) Health insurance - Paid (full or partial): 1116 78.8 321 83.4 143 86.7 51 87.9 185 79.1 79 64.2 152 74.1 185 75.2 (d) ASHA dues 336 23.7 82 21.3 19 11.5 5 8.6 87 37.2 20 16.3 74 36.1 49 19.9 (e) State association dues 199 14.1 35 9.1 8 4.8 0 0.0 58 24.8 13 10.6 48 23.4 37 15.0 (f) Membership in other professional
organizations 76 5.4 7 1.8 3 1.8 0 0.0 15 6.4 7 5.7 25 12.2 19 7.7
(g) Licensure fees 263 18.6 43 11.2 11 6.7 3 5.2 85 36.3 17 13.8 63 30.7 41 16.7 (h) External continuing education programs 912 64.4 262 68.1 105 63.6 43 74.1 127 54.3 64 52.0 156 76.1 155 63.0 (i) Pension or other retirement plan 905 63.9 274 71.2 124 75.2 40 69.0 120 51.3 76 61.8 119 58.0 152 61.8 (j) On-site continuing education programs 747 52.8 233 60.5 101 61.2 40 69.0 74 31.6 63 51.2 105 51.2 131 53.3
• There were 1416 respondents to this question which is more than 500 fewer respondents than were obtained to the previous two questions. A
comparison by practice setting of the response rates to this question with those obtained from the previous two questions indicates that general medical hospital, rehabilitation hospital, and pediatric hospitals had high response rates (87%, 94%, and 98% respectively). Lower response rates were obtained from respondents from home health (51%), skilled nursing facilities (71%), and outpatient clinics or speech/hearing clinics (73%). It is likely that most of the SLPs that did not respond to this question were not receiving benefits. As a result, the responses shown in this table are likely to be an overestimate of the benefits being provided by skilled nursing facilities, home health, and outpatient clinics or speech/hearing clinics.
• Overall, respondents reported the benefits most frequently provided were: paid vacation (80%), health insurance (79%), and paid sick leave (77%). The benefits least often reported as being provided were membership in other professional organizations (5%), state association dues (14%), licensure fees (19%), and ASHA dues (24%).
• Similar rank orderings were found in the six practice settings. The largest percentages of respondents reporting paid vacation, paid sick leave, and health insurance benefits were found in the following settings: general medical hospitals, rehabilitation hospitals, and pediatric hospitals. Lesser percentages were reported for home health and outpatient clinics or speech/hearing clinics. It is interesting to note that skilled nursing facilities, home health agencies, and outpatient clinics or speech/hearing clinics were more likely to provide ASHA dues, state association dues, and licensure fees than were those employed in hospital settings.
• Hospital settings were more likely to provide both on-site and external continuing education than were the other settings. • Rehabilitation and general medical hospitals were the most likely to provide pension or other retirement plans while skilled nursing facilities
were the least likely to provide this benefit

7
Overall General Medical hospital
Rehabilitation hospital
Pediatric hospital
Skilled nursing facility
Home health agency or
client's home
Outpatient clinic or
speech/hearing clinic
Other
WORK CONDITIONS Total N 1901 440 176 58 327 229 274 397 Question 4 MEAN | SD 3.00 1.06 2.99 0.99 2.87 1.01 2.83 0.99 2.65 1.18 2.97 0.92 3.28 1.07 3.25 1.03
If you are in the same type of facility as you were three years ago, has your level of job satisfaction changed?
N % N % N % N % N % N % N % N % (a) N/A; not in same type of facility as 3 yrs ago 350 18.4 61 13.9 22 12.5 11 19.0 51 15.6 44 19.2 44 16.1 117 29.5
(b) Extremely dissatisfied compared to 3 yrs ago 112 5.9 22 5.0 10 5.7 4 6.9 48 14.7 8 3.5 8 2.9 12 3.0 (c) Somewhat dissatisfied compared to 3 yrs ago 395 20.8 98 22.3 48 27.3 14 24.1 91 27.8 46 20.1 49 17.9 49 12.3 (d) Not much different between then and now 562 29.6 144 32.7 59 33.5 16 27.6 66 20.2 86 37.6 79 28.8 112 28.2 (e) Somewhat more satisfied than 3 yrs ago 345 18.1 92 20.9 26 14.8 12 20.7 51 15.6 34 14.8 59 21.5 71 17.9 (f) Extremely satisfied compared to 3 yrs ago 137 7.2 23 5.2 11 6.3 1 1.7 20 6.1 11 4.8 35 12.8 36 9.1
• There were 1901 respondents to this question. Overall, 350 (18%) of the respondents indicated they were not in the same type of facility as three years ago. The highest percents of change were in pediatric hospitals (19%) and in those working in home health (19%)
• A mean rating was computed by assigning the following set of values to question options b through e: b=1, c=2, d=3, e=4, and f=5. The overall mean rating was 3.00 indicating the level of satisfaction seemed to be about the same as it was three years ago. It should be noted that 27% of respondents indicated they were either somewhat or extremely dissatisfied compared to three years ago.
• Respondents in outpatient clinics or speech/hearing clinics reported the highest levels of satisfaction. The mean rating obtained from respondents from this setting was 3.28. Respondents from skilled nursing facilities and rehabilitation hospitals had the lowest mean ratings. The mean ratings obtained from respondents from these practice settings were 2.65 and 2.87 respectively. There was no setting where the mean rating indicated respondents were more satisfied than they were three years ago.
• The percent of respondents indicating they were either somewhat or extremely dissatisfied compared to three years ago ranged from a low of 21% for respondents from outpatient clinics or speech/hearing clinics to a high of 43% for respondents from skilled nursing facilities.

8
Overall General Medical hospital
Rehabilitation hospital
Pediatric hospital
Skilled nursing facility
Home health agency or
client's home
Outpatient clinic or
speech/hearing clinic
Other
WORK CONDITIONS N % N % N % N % N % N % N % N % Question 5 Total N 527 127 58 16 140 56 60 70
If you answered "extremely dissatisfied" or 'somewhat dissatisfied," mark all reasons that apply for your dissatisfaction.
(a) Involuntary reduction in paid work hours 117 22.2 23 18.1 9 15.5 0 0.0 64 45.7 10 17.9 4 6.7 7 10.0 (b) Involuntary increase in paid work hours 36 6.8 15 11.8 5 8.6 0 0.0 6 4.3 3 5.4 2 3.3 5 7.1 (c) Involuntary reduction in salary or benefits (without
change in work hours) 185 35.1 33 26.0 21 36.2 1 6.3 81 57.9 16 28.6 14 23.3 19 27.1
(d) Involuntary increase in the number of sites served 147 27.9 19 15.0 12 20.7 4 25.0 75 53.6 12 21.4 10 16.7 15 21.4 (e) Involuntary reduction in caseload 69 13.1 8 6.3 3 5.2 0 0.0 32 22.9 13 23.2 9 15.0 4 5.7 (f) Involuntary increase in caseload 168 31.9 50 39.4 35 60.3 8 50.0 26 18.6 10 17.9 17 28.3 22 31.4 (g) Conversion from salaried to hourly or PRN pay 97 18.4 11 8.7 7 12.1 0 0.0 68 48.6 4 7.1 3 5.0 4 5.7 (h) Volume of paperwork 301 57.1 55 43.3 35 60.3 10 62.5 81 57.9 38 67.9 36 60.0 46 65.7 (i) Other 216 41.0 61 48.0 25 43.1 7 43.8 34 24.3 17 30.4 32 53.3 40 57.1
• There were 527 respondents to this question. Overall, the most frequently cited reasons given for being either extremely or somewhat more dissatisfied than three years ago were: volume of paperwork (57%), involuntary reduction in salary or benefits without change in work hours (35%), involuntary increase in caseload (32%), and involuntary increase in the number of sites served (28%).
• For those reporting from general hospital settings, the most frequently cited reasons were increase in volume of paper work (43%) and involuntary increase in caseload (39%).
• For those reporting from rehabilitation hospitals, the most frequently cited reasons were involuntary increase in caseload (60%), volume of paperwork (60%), and involuntary reduction in salary or benefits (36%)
• For those reporting from pediatric hospitals, the most frequently cited reasons were volume of paperwork (63%) and involuntary increase in caseload (50%).
• From skilled nursing facilities, the most frequently cited reasons were volume of paperwork (58%), involuntary reduction in salary or benefits (58%), involuntary increase in the number of sites served (54%), and conversion from salaried to hourly or PRN pay (49%)
• From home health, the most frequently cited reasons were volume of paperwork (68%) and involuntary reduction in salary or benefits (29%). • From outpatient clinics or speech/hearing clinics, the most frequently cited reasons were volume of paperwork (60%) and involuntary
increase in caseload (28%)

9
Overall General Medical hospital
Rehabilitation hospital
Pediatric hospital
Skilled nursing facility
Home health agency or
client's home
Outpatient clinic or
speech/hearing clinic
Other
WORK CONDITIONS N % N % N % N % N % N % N % N % Question 6 Total N 1915 439 174 58 326 237 275 406
How many hours do you work in a typical day? (Round to nearest half hour)
< 2 17 0.9 4 0.9 0 0.0 0 0.0 3 0.9 5 2.1 0 0.0 5 1.2 >= 2 and < 4 93 4.9 9 2.1 2 1.1 0 0.0 37 11.3 26 11.0 8 2.9 11 2.7 >= 4 and < 6 268 14.0 61 13.9 15 8.6 1 1.7 72 22.1 44 18.6 23 8.4 52 12.8 >= 6 and < 8 435 22.7 75 17.1 22 12.6 7 12.1 77 23.6 80 33.8 59 21.5 115 28.3 >= 8 and < 10 961 50.2 267 60.8 124 71.3 36 62.1 123 37.7 69 29.1 155 56.4 187 46.1 >= 10 hrs 141 7.4 23 5.2 11 6.3 14 24.1 14 4.3 13 5.5 30 10.9 36 8.9
• There were 1915 responses to this question. Overall, 50% of the respondents report working between 8 and 10 hours per day, 23% between 6 and 8 hours per day, and 14% between 4 and 6 hours per day. Six percent of the respondents indicated they worked fewer than four hours a day and 7% indicated they worked more than 10 hours a day.
• Respondents from the three hospital settings were more likely to indicate that they worked between 8 and less than 10 hours per day. This was the case for 61% of the respondents from general medical hospitals, 62% of the respondents from pediatric hospitals, and 71% of the respondents from rehabilitation hospitals. The majority of respondents from home health agencies and skilled nursing facilities reported working fewer than eight hours per day. These two practice settings employ the largest percentages of contract employees. Sixty-seven percent of the respondents from skilled nursing homes reported being contract employees as were 45% of the respondents working in home health. The majority of these contract employees reported working part time. Respondents from pediatric hospitals provided the highest percentage of respondents working 10 hours or more (24%).

10
Overall General Medical hospital
Rehabilitation hospital
Pediatric hospital
Skilled nursing facility
Home health agency or
client's home
Outpatient clinic or
speech/hearing clinic
Other
WORK CONDITIONS N % N % N % N % N % N % N % N % Question 7 Total N 1935 440 176 58 327 239 277 418
In your normal work day, how much time do you typically spend in actual (vs. scheduled) direct patient care? (exclude documentation, phone calls, team meetings, etc.)
90 – 100 % of time 125 6.5 12 2.7 9 5.1 0 0.0 15 4.6 22 9.2 28 10.1 39 9.3 80 – 89 322 16.6 80 18.2 22 12.5 9 15.5 53 16.2 25 10.5 54 19.5 79 18.9 70 – 79 506 26.1 117 26.6 55 31.3 12 20.7 74 22.6 62 25.9 72 26.0 114 27.3 60 – 69 450 23.3 125 28.4 47 26.7 18 31.0 70 21.4 59 24.7 56 20.2 75 17.9 50 – 59 310 16.0 76 17.3 20 11.4 13 22.4 63 19.3 44 18.4 43 15.5 51 12.2 40 – 49 85 4.4 19 4.3 7 4.0 2 3.4 19 5.8 14 5.9 9 3.2 15 3.6 30 – 39 33 1.7 3 0.7 3 1.7 1 1.7 9 2.8 5 2.1 5 1.8 7 1.7 20 – 29 32 1.7 3 0.7 4 2.3 2 3.4 5 1.5 3 1.3 6 2.2 9 2.2 10 – 19 8 0.4 0 0.0 1 0.6 0 0.0 3 0.9 1 0.4 1 0.4 2 0.5 0 – 9 64 3.3 5 1.1 8 4.5 1 1.7 16 4.9 4 1.7 3 1.1 27 6.5
• There were 1935 responses to this question. Overall, 49% of the respondents indicated that they spend 70% or more of their time in actual patient care. Forty percent reported spending between 50 to 69 % in actual patient care.
• Respondents from outpatient clinics or speech/hearing clinics reported having the highest percentage of SLPs (56%) spending 70% or more of their time in direct patient care while respondents working in pediatric hospitals reported the lowest percentage (36%).

11
Overall General Medical hospital
Rehabilitation hospital
Pediatric hospital
Skilled nursing facility
Home health agency or
client's home
Outpatient clinic or
speech/hearing clinic
Other
WORK CONDITIONS N % N % N % N % N % N % N % N % Question 8 Total N 1831 417 163 54 319 219 272 387
Does your facility have a productivity requirement? (N) No 948 51.8 171 41.0 42 25.8 4 7.4 80 25.1 169 77.2 167 61.4 315 81.4 (Y) Yes (If yes, please indicate the percentage 883 48.2 246 59.0 121 74.2 50 92.6 239 74.9 50 22.8 105 38.6 72 18.6
below ) 90 - 100 64 7.2 17 6.9 10 8.3 1 2.0 18 7.5 5 10.0 6 5.7 7 9.7 80 – 89 212 24.0 49 19.9 29 24.0 6 12.0 76 31.8 9 18.0 22 21.0 21 29.2 70 – 79 392 44.4 110 44.7 62 51.2 14 28.0 120 50.2 13 26.0 43 41.0 30 41.7 60 – 69 152 17.2 57 23.2 13 10.7 22 44.0 15 6.3 12 24.0 24 22.9 9 12.5 50 – 59 49 5.5 11 4.5 4 3.3 5 10.0 8 3.3 10 20.0 8 7.6 3 4.2 40 – 49 3 0.3 0 0.0 0 0.0 2 4.0 0 0.0 0 0.0 0 0.0 1 1.4 30 – 39 6 0.7 1 0.4 1 0.8 0 0.0 1 0.4 0 0.0 2 1.9 1 1.4 20 – 29 2 0.2 1 0.4 1 0.8 0 0.0 0 0.0 0 0.0 0 0.0 0 0.0 10 – 19 0 0.0 0 0.0 0 0.0 0 0.0 0 0.0 0 0.0 0 0.0 0 0.0 0 – 9 3 0.3 0 0.0 1 0.8 0 0.0 1 0.4 1 2.0 0 0.0 0 0.0
• Productivity requirement was defined as the number of hours in direct patient contact divided by the number of hours worked • There were 1831 responses to this question. Overall, 48% of respondents indicated their facility had a productivity requirement. This
ranged from 23% for respondents working in home health to 93% for those working in pediatric hospitals. • Overall, 75% of respondents indicated that their productivity requirement ranged from 70 to 100%. The largest percentage of respondents
(44%) indicated that their productivity requirement ranged from 70-79%. • Ninety percent of respondents from skilled nursing facilities, 84% from rehabilitation hospitals, 72% from general hospitals, and 71%
from outpatient clinics or speech/hearing clinics reported productivity requirements ranging from 70 to 100%, while only 42% of respondents from pediatric hospitals and 54% of respondents working in home health reported productivity standards at those same levels. While employees of pediatric hospitals were most likely to have productivity standards, these standards appeared to be somewhat lower than those in the other practice settings.

12
Overall General Medical hospital
Rehabilitation hospital
Pediatric hospital
Skilled nursing facility
Home health agency or
client's home
Outpatient clinic or
speech/hearing clinic
Other
WORK CONDITIONS N % N % N % N % N % N % N % N % Question 9 Total N 1919 442 175 59 326 237 280 400
Does the facility setting in which you primarily work provide for SLP services on weekends?
(Y) Yes 770 40.1 279 63.1 135 77.1 34 57.6 120 36.8 67 28.3 54 19.3 81 20.3 (N) No 1149 59.9 163 36.9 40 22.9 25 42.4 206 63.2 170 71.7 226 80.7 319 79.8
• There were 1919 responses to this question. Overall, 40% of respondents indicated that their facility provided SLP services on weekends. This ranged from a high of 77% for rehabilitation hospitals to a low of 19% for those working in outpatient clinics or speech/hearing clinics.
13
Overall General Medical hospital
Rehabilitation hospital
Pediatric hospital
Skilled nursing facility
Home health agency or
client's home
Outpatient clinic or
speech/hearing clinic
Other
PROFESSIONAL SERVICES
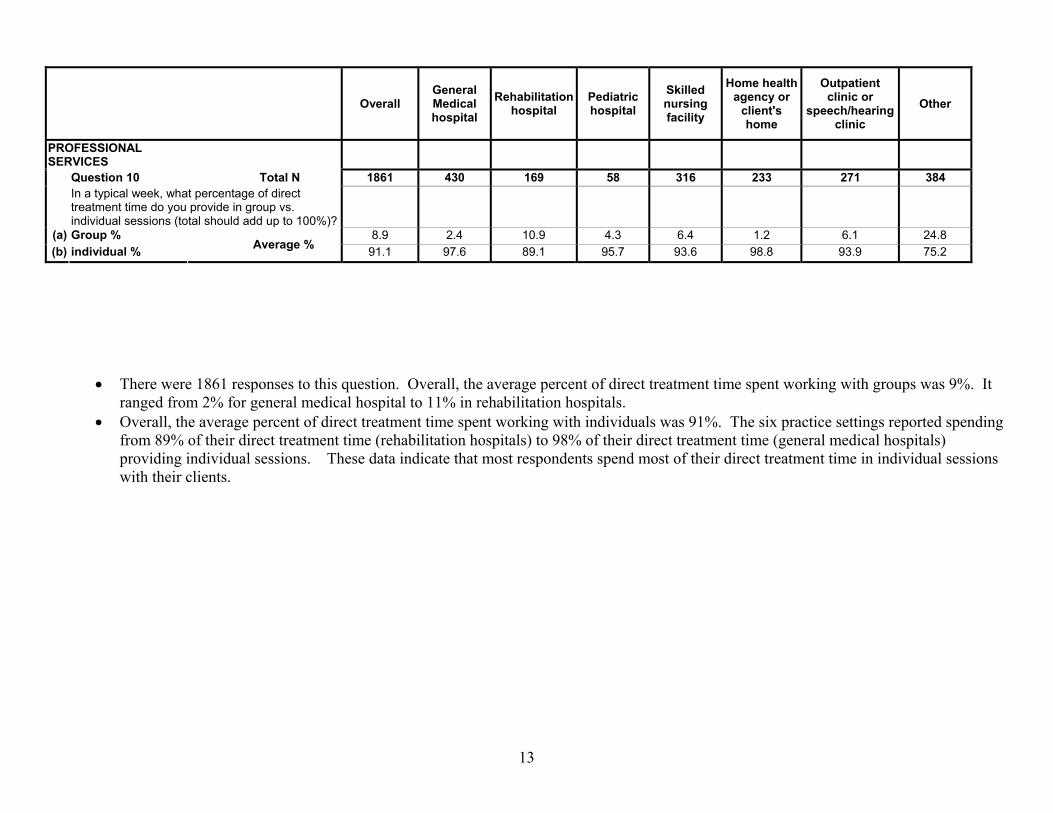
Question 10 Total N 1861 430 169 58 316 233 271 384 In a typical week, what percentage of direct
treatment time do you provide in group vs. individual sessions (total should add up to 100%)?
(a) Group % 8.9 2.4 10.9 4.3 6.4 1.2 6.1 24.8 (b) individual % Average % 91.1 97.6 89.1 95.7 93.6 98.8 93.9 75.2
• There were 1861 responses to this question. Overall, the average percent of direct treatment time spent working with groups was 9%. It ranged from 2% for general medical hospital to 11% in rehabilitation hospitals.
• Overall, the average percent of direct treatment time spent working with individuals was 91%. The six practice settings reported spending from 89% of their direct treatment time (rehabilitation hospitals) to 98% of their direct treatment time (general medical hospitals) providing individual sessions. These data indicate that most respondents spend most of their direct treatment time in individual sessions with their clients.
14
Overall General Medical hospital
Rehabilitation hospital
Pediatric hospital
Skilled nursing facility
Home health agency or
client's home
Outpatient clinic or
speech/hearing clinic
Other
PROFESSIONAL SERVICES Question 11a Total N 1565 379 156 46 287 194 202 301
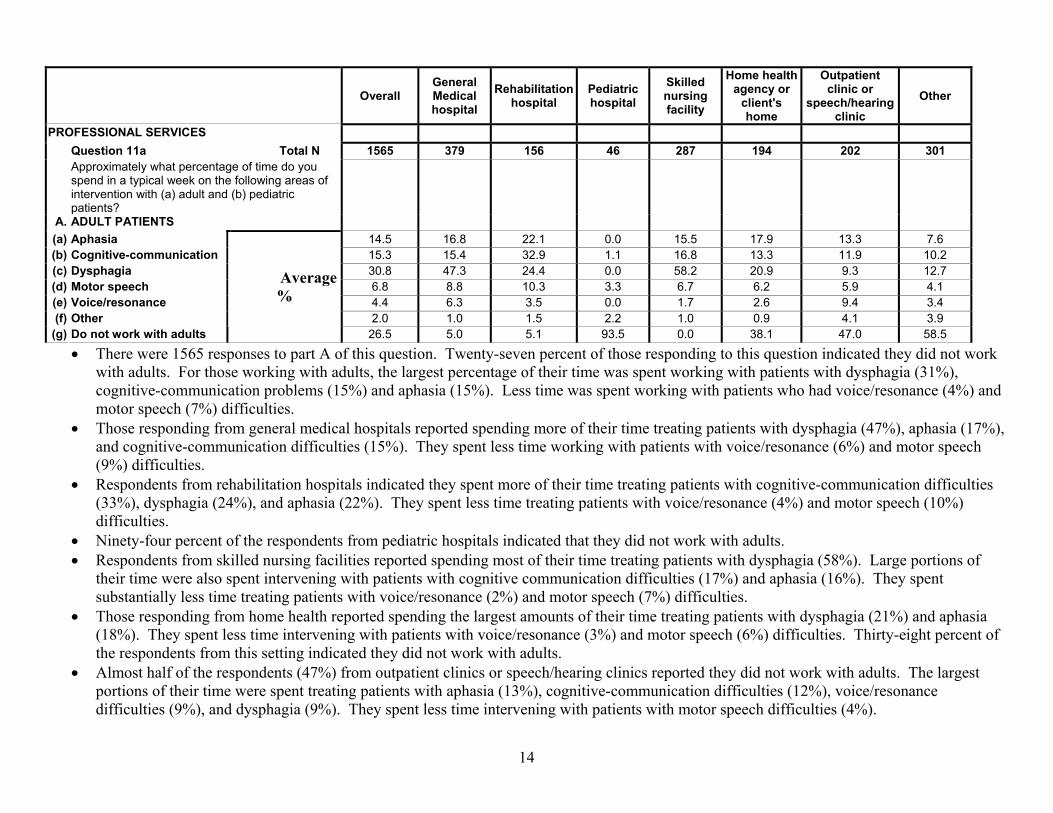
Approximately what percentage of time do you spend in a typical week on the following areas of intervention with (a) adult and (b) pediatric patients?
A. ADULT PATIENTS
(a) Aphasia 14.5 16.8 22.1 0.0 15.5 17.9 13.3 7.6 (b) Cognitive-communication 15.3 15.4 32.9 1.1 16.8 13.3 11.9 10.2 (c) Dysphagia 30.8 47.3 24.4 0.0 58.2 20.9 9.3 12.7 (d) Motor speech 6.8 8.8 10.3 3.3 6.7 6.2 5.9 4.1 (e) Voice/resonance 4.4 6.3 3.5 0.0 1.7 2.6 9.4 3.4 (f) Other 2.0 1.0 1.5 2.2 1.0 0.9 4.1 3.9
(g) Do not work with adults
Average %
26.5 5.0 5.1 93.5 0.0 38.1 47.0 58.5
• There were 1565 responses to part A of this question. Twenty-seven percent of those responding to this question indicated they did not work with adults. For those working with adults, the largest percentage of their time was spent working with patients with dysphagia (31%), cognitive-communication problems (15%) and aphasia (15%). Less time was spent working with patients who had voice/resonance (4%) and motor speech (7%) difficulties.
• Those responding from general medical hospitals reported spending more of their time treating patients with dysphagia (47%), aphasia (17%), and cognitive-communication difficulties (15%). They spent less time working with patients with voice/resonance (6%) and motor speech (9%) difficulties.
• Respondents from rehabilitation hospitals indicated they spent more of their time treating patients with cognitive-communication difficulties (33%), dysphagia (24%), and aphasia (22%). They spent less time treating patients with voice/resonance (4%) and motor speech (10%) difficulties.
• Ninety-four percent of the respondents from pediatric hospitals indicated that they did not work with adults. • Respondents from skilled nursing facilities reported spending most of their time treating patients with dysphagia (58%). Large portions of
their time were also spent intervening with patients with cognitive communication difficulties (17%) and aphasia (16%). They spent substantially less time treating patients with voice/resonance (2%) and motor speech (7%) difficulties.
• Those responding from home health reported spending the largest amounts of their time treating patients with dysphagia (21%) and aphasia (18%). They spent less time intervening with patients with voice/resonance (3%) and motor speech (6%) difficulties. Thirty-eight percent of the respondents from this setting indicated they did not work with adults.
• Almost half of the respondents (47%) from outpatient clinics or speech/hearing clinics reported they did not work with adults. The largest portions of their time were spent treating patients with aphasia (13%), cognitive-communication difficulties (12%), voice/resonance difficulties (9%), and dysphagia (9%). They spent less time intervening with patients with motor speech difficulties (4%).

15
Overall General Medical hospital
Rehabilitation hospital
Pediatric hospital
Skilled nursing facility
Home health agency or
client's home
Outpatient clinic or
speech/hearing clinic
Other
PROFESSIONAL SERVICES Question 11b Total N 1652 385 159 52 282 202 233 339
Approximately what percentage of time do you spend in a typical week on the following areas of intervention with (a) adult and (b) pediatric patients?
B. PEDIATRIC PATIENTS
(h) Articulation/phonology 16.3 14.6 6.0 21.9 2.0 14.6 28.2 27.3 (i) Cognitive-communication 7.1 3.3 3.5 18.5 1.2 10.7 11.7 10.9 (j) Dysphagia 5.0 5.9 3.0 18.3 0.7 6.9 6.2 4.5 (k) Language 19.7 12.5 5.0 26.7 3.6 27.7 32.1 33.5 (l) Voice/resonance 2.0 1.5 0.7 5.0 0.3 1.2 4.5 2.7
(m) Other 3.0 0.9 1.3 9.6 0.4 1.8 6.1 5.8 (n) Do not work with children
Average %
47.2 61.3 80.5 0.0 91.8 38.1 11.6 15.3
• There were 1652 responses to part B of this question. Forty-seven percent of the respondents indicated they did not work with children. For those working with pediatric patients, the largest percentage of their time was spent working with patients with language (20%) and articulation/phonology (16%) difficulties. Less time was spent working with patients with voice/resonance (2%), dysphagia (5%), and cognitive-communication (7%) difficulties.
• Sixty-one percent of the respondents from general medical hospitals indicated they did not work with children. Those who did work with children reported spending more time treating children with articulation/phonology (15%) and language (13%) difficulties. They reported spending less time intervening with children having voice/resonance (2%), cognitive-communication (3%), and dysphagia (6%) difficulties.
• Eighty-one percent of the respondents from rehabilitation hospitals reported they did not work with children. Those who worked with children reported spending more time providing treatment for articulation/phonology (6%) and language (5%) and less time providing treatment for voice/resonance (1%), dysphagia (3%), and cognitive-communication (4%) difficulties.
• Respondents from pediatric hospitals reported spend more of their time treating patients for language (27%), articulation/phonology (22%), cognitive-communication (19%), and dysphagia (18%) difficulties. They spent less time dealing with voice/resonance problems (5%).
• Ninety-two percent of respondents from skilled nursing facilities indicated they did not work with children. • Thirty-eight percent of those responding from home health reported they did not work with children. Those who did indicated they spent
more of their time working with children with language (27%), articulation/phonology (15%), and cognitive communication (11%) difficulties. They spent less of their time treating children with voice/resonance (1%) and dysphagia (7%) problems.
• Twelve percent of the respondents from outpatient clinics or speech/hearing clinics report they do not work with children. Those who did indicated they spent more of their time working with children with language difficulties (32%), articulation/phonology (28%), and cognitive-communication (12%) difficulties. They spend less of their time intervening with children with voice/resonance (5%) and dysphagia (6%).

16
Summary of Questions 11 A and B
• Seventy-three percent of those responding to question 11A indicated they worked with adults. Aside from pediatric hospitals, the majority of respondents from the remaining five settings reported that they worked with adults. The largest percentages of time spent working with adults involved treatment of dysphagia, cognitive-communication difficulties, and aphasia. The percent of time spent by staff varied by practice setting.
• Fifty-three percent of those responding to question 11B indicated they worked with children. A majority of the respondents from pediatric hospitals, home health, and outpatient clinics or speech/hearing clinics reported working with children. The largest percentage of time spent working with children involved intervention for difficulty with language and articulation/phonology. The percent of time spent varied for different disorders by practice setting. Respondents from pediatric hospitals reported spending more time providing treatment for cognitive-communication problems and dysphagia than respondents from home health and outpatient clinics or speech/hearing clinics. Respondents from outpatient clinics or speech/hearing clinics were most likely to provide treatment for language and articulation/phonology difficulties.

17
Overall General Medical hospital
Rehabilitation hospital
Pediatric hospital
Skilled nursing facility
Home health agency or
client's home
Outpatient clinic or
speech/hearing clinic
Other
PROFESSIONAL SERVICES N % N % N % N % N % N % N % N % Question 12 Total N 1910 441 173 59 326 235 275 401
Do any professionals other than SLPs in your facility provide primary dysphagia services (e.g., assessment, treatment, instrumental studies)?
(N) No 1619 84.8 385 87.3 150 86.7 25 42.4 309 94.8 186 79.1 236 85.8 328 81.8 (Y) Yes (If 'yes", which professionals? 291 15.2 56 12.7 23 13.3 34 57.6 17 5.2 49 20.9 39 14.2 73 18.2
(Mark all that apply) (a) Physician 51 17.5 16 28.6 9 39.1 8 23.5 2 11.8 0 0.0 6 15.4 10 13.7 (b) PT 22 7.6 6 10.7 3 13.0 0 0.0 0 0.0 4 8.2 6 15.4 3 4.1 (c) OT 243 83.5 40 71.4 17 73.9 29 85.3 15 88.2 46 93.9 34 87.2 62 84.9 (d) Nurse 30 10.3 11 19.6 3 13.0 0 0.0 6 35.3 2 4.1 0 0.0 8 11.0 (e) Dietitian 39 13.4 5 8.9 4 17.4 6 17.6 5 29.4 4 8.2 5 12.8 10 13.7
• Overall, there were 1910 responses to this question. Eighty-five percent of the respondents indicated that no professionals other than SLPs provided primary dysphagia services in their work setting. This percentage varied by practice setting. The percentages ranged from 95% in skilled nursing facilities to 42% in pediatric hospitals. Most percentages were in the mid to upper eighties.
• Those who reported that other professionals in their work setting provided primary dysphagia services indicated that occupational therapists (84%) and physicians (18%) were most likely to provide such services. Occupational therapists were the most likely other professional to provide this service across all practice settings.

18
Overall General Medical hospital
Rehabilitation hospital
Pediatric hospital
Skilled nursing facility
Home health agency or
client's home
Outpatient clinic or
speech/hearing clinic
Other
PROFESSIONAL SERVICES N % N % N % N % N % N % N % N % Question 13 Total N 1922 441 174 59 327 237 277 407
In the past 12 months, have you been asked to train or supervise other disciplines to provide primary dysphagia services?
(Y) Yes 191 9.9 40 9.1 14 8.0 6 10.2 59 18.0 15 6.3 19 6.9 38 9.3 (N) No 1731 90.1 401 90.9 160 92.0 53 89.8 268 82.0 222 93.7 258 93.1 369 90.7
• Overall, there were 1922 responses to this question. Ninety percent of respondents reported that they had not been asked to train or supervise other disciplines to provide primary dysphagia services. These responses were similar across all practice settings except those responding from skilled nursing facilities. Eighteen percent of the respondents from skilled nursing facilities indicated that they had been asked to train or supervise other disciplines to provide primary dysphagia services.

19
Overall General
Medical hospital
Rehabilitation hospital
Pediatric hospital
Skilled nursing facility
Home health agency or
client's home
Outpatient clinic or
speech/hearing clinic
Other
PROFESSIONAL SERVICES N % N % N % N % N % N % N % N % Question 14 Total N 1948 448 174 59 328 242 281 416
Do you receive referrals for patients/clients who may be appropriate for AAC devices?
(N) No 673 34.5 160 35.7 44 25.3 4 6.8 146 44.5 76 31.4 77 27.4 166 39.9 (Y) Yes (If yes, which of the following best 1275 65.5 288 64.3 130 74.7 55 93.2 182 55.5 166 68.6 204 72.6 250 60.1
describes how you typically accommodate the patients need for AAC services? (Mark one))
(a) Refer to other SLPs in my facility/setting 129 10.1 34 11.8 24 18.5 14 25.5 4 2.2 6 3.6 31 15.2 16 6.4 (b) Refer to professionals in other disciplines in my
facility/setting 10 0.8 1 0.3 3 2.3 0 0.0 2 1.1 0 0.0 1 0.5 3 1.2
(c) Provide services as part of interdisciplinary team in my facility/setting 326 25.6 43 14.9 30 23.1 21 38.2 44 24.2 46 27.7 45 22.1 97 38.8
(d) Provide services by myself in my facility/setting 331 26.0 79 27.4 27 20.8 8 14.5 76 41.8 41 24.7 49 24.0 51 20.4 (e) Refer to providers outside my facility/setting 479 37.6 131 45.5 46 35.4 12 21.8 56 30.8 73 44.0 78 38.2 83 33.2
• Overall, there were 1948 responses to this question. Sixty-six percent of the respondents reported they had received referrals for patients who might be appropriate for AAC devices. This percentage was fairly consistent across practice settings other than those responding from pediatric hospitals in which 93% of respondents indicated that they received such referrals.
• Overall, the most frequently reported methods for accommodating patients’ needs for these services was to: refer to providers outside my facility (38%), provide services by myself in my facility/setting (26%), provide services as part of interdisciplinary team in my facility/setting (26%), refer to SLPs in my facility/setting (10%), or refer to professionals in other disciplines in my facility/setting (1%). Similar rank orderings were found in all practice settings other than the pediatric hospital setting. Respondents from pediatric hospitals were more likely to provide services as part of an interdisciplinary team or to refer to other SLPs in their facility/setting. As will be seen in discussion of question 15, SLPs in pediatric hospitals are more likely to be working with larger numbers of SLPs than those in other practice settings. The least likely choice in every practice setting was to refer to professionals in other disciplines in my facility/setting.

20
Overall General Medical hospital
Rehabilitation hospital
Pediatric hospital
Skilled nursing facility
Home health agency or
client's home
Outpatient clinic or
speech/hearing clinic
Other
WORKFORCE INFORMATION N % N % N % N % N % N % N % N % Question 15
Indicate the number of full time and part time SLPS, SLPAS, and Other Support Personnel (e.g., rehabilitation techs) working in your department. Please write the numbers in the boxes above the grid and then shade in those numbers on the grid.
SLPs (a) Full Time (>=30 hrs/wk) Total
N 1682 406 169 54 288 178 258 329
0 – 1* 864 51.4 139 34.2 39 23.1 3 5.6 248 86.1 128 71.9 119 46.1 188 57.1 2 – 5 586 34.8 212 52.2 87 51.5 20 37.0 33 11.5 35 19.7 110 42.6 89 27.1 6 – 10 139 8.3 43 10.6 27 16.0 16 29.6 1 0.3 8 4.5 15 5.8 29 8.8 > 10 93 5.5 12 3.0 16 9.5 15 27.8 6 2.1 7 3.9 14 5.4 23 7.0
(b) Part Time (<30 hrs/wk) Total N
1598 392 151 52 271 182 240 310
0 – 1 966 60.5 190 48.5 77 51.0 19 36.5 216 79.7 115 63.2 126 52.5 223 71.9 2 – 5 525 32.9 183 46.7 63 41.7 20 38.5 48 17.7 55 30.2 87 36.3 69 22.3 6 – 10 72 4.5 10 2.6 9 6.0 9 17.3 3 1.1 6 3.3 23 9.6 12 3.9 > 10 35 2.2 9 2.3 2 1.3 4 7.7 4 1.5 6 3.3 4 1.7 6 1.9
• SLPs full time. Overall, there were 1682 responses to this question. Fifty-one percent of respondents indicated they worked in
departments with one SLP, 35% worked in departments with from two to five SLPs, eight percent with six to10, and six percent with more than 10 SLPs. Respondents from skilled nursing facilities (86%) and those working in home health agencies or clients’ homes (72%) were most likely to be the only SLP in their departments. Those working in pediatric hospitals (57%) were most likely to have six or more SLPs in their department. Those working in rehabilitation hospitals were the next most likely (26%) to have six or more SLPs in their department.
• SLPs part time. Overall, there were 1598 responses to this part of the question. Sixty-one percent of respondents indicated they worked in departments with one part time SLP, 33% worked in departments with from two to five part time SLPs, five percent with six to 10, and two percent worked in departments with more than 10 part time SLPs. Respondents working in skilled nursing facilities ((80%) and in home health were most likely to be working with one part time SLP while those working in pediatric hospital settings (25%) were most likely to work with six or more part time SLPs.
• *The zero option for SLPs was included in the 0-1 category because some SLPs apparently failed to count themselves when responding to this question.

21
Overall General Medical hospital
Rehabilitation hospital
Pediatric hospital
Skilled nursing facility
Home health agency or
client's home
Outpatient clinic or
speech/hearing clinic
Other
WORKFORCE INFORMATION N % N % N % N % N % N % N % N % Question 15
Indicate the number of full time and part time SLPS, SLPAS, and Other Support Personnel (e.g., rehabilitation techs) working in your department. Please write the numbers in the boxes above the grid and then shade in those numbers on the grid.
SLP Assistants (c) Full Time (>=30 hrs/wk) 1324 311 126 46 250 146 190 255
0 1298 98.0 311 100.0 124 98.4 42 91.3 249 99.6 146 100.0 183 96.3 243 95.3 1 - 5 20 1.5 0 0.0 2 1.6 4 8.7 0 0.0 0 0.0 5 2.6 9 3.5 6 – 10 2 0.2 0 0.0 0 0.0 0 0.0 0 0.0 0 0.0 0 0.0 2 0.8 > 10 4 0.3 0 0.0 0 0.0 0 0.0 1 0.4 0 0.0 2 1.1 1 0.4
(d) Part Time (<30 hrs/wk) 1316 312 128 42 245 146 191 252 0 1292 98.2 308 98.7 125 97.7 42 100.0 244 99.6 146 100.0 184 96.3 243 96.4 1 – 5 17 1.3 3 1.0 3 2.3 0 0.0 0 0.0 0 0.0 6 3.1 5 2.0 6 – 10 2 0.2 1 0.3 0 0.0 0 0.0 0 0.0 0 0.0 1 0.5 0 0.0 > 10 5 0.4 0 0.0 0 0.0 0 0.0 1 0.4 0 0.0 0 0.0 4 1.6
• SLPAs full time. Overall, there were 1324 respondents to this question. Ninety-eight percent of the respondents reported there were
no full time SLPAs in their department, and two percent indicated there were from one to five SLPAs in their department. These percentages were very similar across all practice settings. Respondents from general medical hospitals and home health indicated they had no SLPAs working in their department.
• SLPAs part time. Overall, there were 1316 respondents to this question. Ninety-eight percent of respondents indicated there were no part time SLPAs working in their department. These percentages were similar across practice settings. Respondents from pediatric hospitals and home health reported they had no part time SLPAs working in their departments.

22
Overall General Medical hospital
Rehabilitation hospital
Pediatric hospital
Skilled nursing facility
Home health agency or
client's home
Outpatient clinic or
speech/hearing clinic
Other
WORKFORCE INFORMATION N % N % N % N % N % N % N % N % Question 15
Indicate the number of full time and part time SLPS, SLPAS, and Other Support Personnel (e.g., rehabilitation techs) working in your department. Please write the numbers in the boxes above the grid and then shade in those numbers on the grid.
Other Support Personnel (e) Full Time (>=30 hrs/wk) 1312 309 121 44 248 144 193 253
0 1143 87.1 279 90.3 106 87.6 32 72.7 217 87.5 130 90.3 160 82.9 219 86.6 1 – 5 132 10.1 29 9.4 13 10.7 5 11.4 25 10.1 6 4.2 29 15.0 25 9.9 6 – 10 19 1.4 1 0.3 0 0.0 4 9.1 1 0.4 6 4.2 4 2.1 3 1.2 > 10 18 1.4 0 0.0 2 1.7 3 6.8 5 2.0 2 1.4 0 0.0 6 2.4
(f) Part Time (<30 hrs/wk) 1236 294 110 37 228 136 177 254 0 1132 91.6 270 91.8 103 93.6 31 83.8 222 97.4 125 91.9 155 87.6 226 89.0 1 – 5 81 6.6 20 6.8 6 5.5 5 13.5 4 1.8 8 5.9 19 10.7 19 7.5 6 – 10 11 0.9 1 0.3 1 0.9 1 2.7 1 0.4 1 0.7 1 0.6 5 2.0 > 10 12 1.0 3 1.0 0 0.0 0 0.0 1 0.4 2 1.5 2 1.1 4 1.6
• Other support personnel full time. Overall, 1312 SLPs responded to this question. Eighty-seven percent reported that there were no other full time support personnel (e.g., rehabilitation techs). Ten percent of the respondents indicated they employed between one and five full time other support personnel. The percentages of no other full time support personnel were similar across practice settings. Respondents from outpatient clinics or speech/hearing clinics (15%) reported the most use of one to five other full time support personnel and respondents from home health reported the least use (4%).
• Other support personnel part time. Overall, 1525 SLPs responded to this question. Ninety-two percent indicated there were no part time other support personnel in their department. Six percent indicated there were from one to five part time other support personnel in their department. These percentages were similar across practice settings with pediatric hospitals (14%) and outpatient clinics or speech/hearing clinics (11%) the most likely to use part time other support personnel.

23
Summary for Question 15
• Responses to the six parts of this question indicate that the majority of full time SLPs work in department by themselves or with one other full time SLP. This is particularly true for SLPs working in skilled nursing facilities and home health. Respondents from pediatric hospitals appear to be the most likely to work with larger numbers of other SLPs. Similar trends exist for part time SLPs as for full time SLPs. The employment of full time and part time SLPAs appeared to be rare with 98% of respondents indicating they were not used in their departments. Other support personnel, full time and part time are employed at a higher rate than SLPAs, but the vast majority of respondents (87%) indicated they do not use full time support personnel and 92% indicated they do not use part time other support personnel. Outpatient clinics or speech/hearing clinics appeared to be the most likely to use full or part time other support personnel.

24
Overall General Medical hospital
Rehabilitation hospital
Pediatric hospital
Skilled nursing facility
Home health agency or
client's home
Outpatient clinic or
speech/hearing clinic
Other
WORKFORCE INFORMATION N % N % N % N % N % N % N % N % Question 16 Total N 1525 347 154 51 275 183 211 304
If SLPAs are employed in your facility, what impact has their use had on the way you provide services? (Mark all that apply)
(a) N/A (Facility does not employ SLPAs) 1393 91.3 339 97.7 136 88.3 39 76.5 266 96.7 176 96.2 180 85.3 257 84.5 (b) More time for direct service and one-on-ones
service provision 74 4.9 7 2.0 10 6.5 7 13.7 3 1.1 1 0.5 22 10.4 24 7.9
(c) Less time for direct service delivery 7 0.5 1 0.3 1 0.6 1 2.0 1 0.4 1 0.5 0 0.0 2 0.7 (d) Increased supervisory duties 58 3.8 3 0.9 10 6.5 3 5.9 1 0.4 4 2.2 14 6.6 23 7.6 (e) More time for planning, research or
interdisciplinary consultation 27 1.8 0 0.0 5 3.2 0 0.0 1 0.4 3 1.6 5 2.4 13 4.3
(f) More paperwork 35 2.3 2 0.6 9 5.8 3 5.9 0 0.0 3 1.6 5 2.4 13 4.3 (g) Larger patient/client caseload 65 4.3 1 0.3 11 7.1 4 7.8 6 2.2 3 1.6 17 8.1 23 7.6
• Overall, there were 1525 respondents to this question with 91% indicating that there facility does not employ SLPAs. For those who employed SLPAs, the most frequently stated impact on the way they provided services were: more time for direct service and one-on-one service provision (5%), larger patient/client caseload (4%), increased supervisory duties (4%). Similar rank orderings were obtained from the practice settings employing the highest percentages of SLPAs (pediatric hospitals, outpatient clinics or speech/hearing clinics, and rehabilitation hospitals).
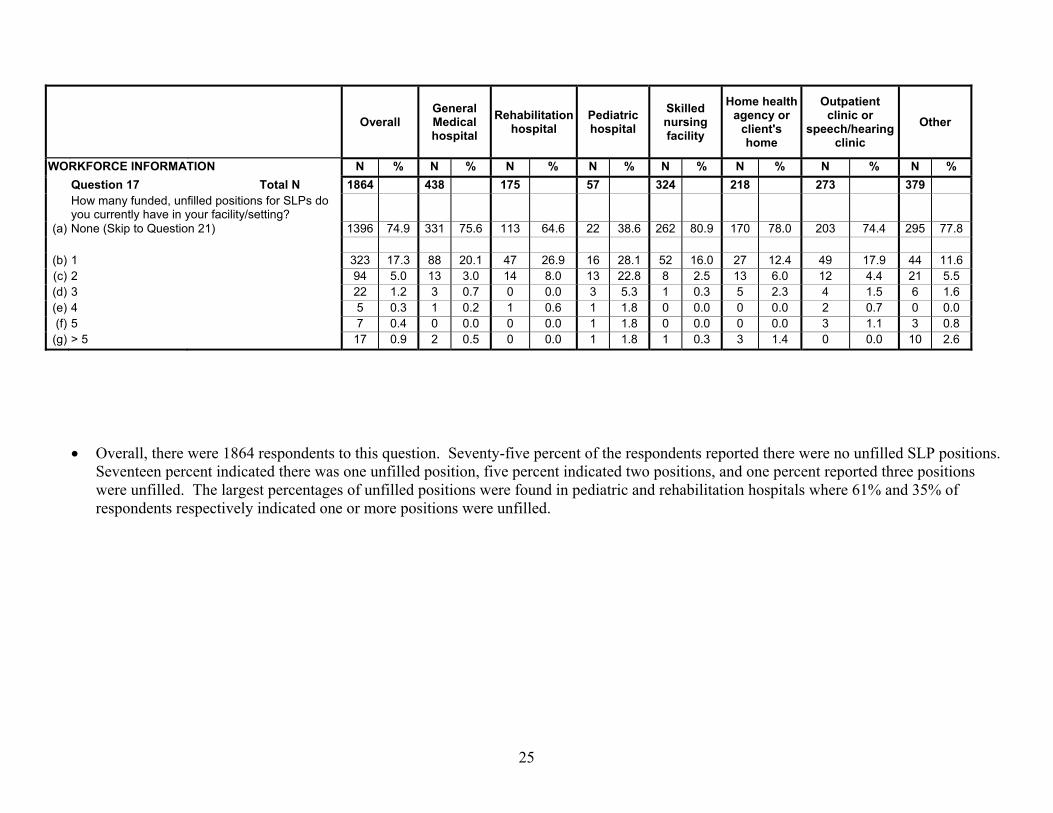
25
Overall General Medical hospital
Rehabilitation hospital
Pediatric hospital
Skilled nursing facility
Home health agency or
client's home
Outpatient clinic or
speech/hearing clinic
Other
WORKFORCE INFORMATION N % N % N % N % N % N % N % N % Question 17 Total N 1864 438 175 57 324 218 273 379
How many funded, unfilled positions for SLPs do you currently have in your facility/setting?
(a) None (Skip to Question 21) 1396 74.9 331 75.6 113 64.6 22 38.6 262 80.9 170 78.0 203 74.4 295 77.8
(b) 1 323 17.3 88 20.1 47 26.9 16 28.1 52 16.0 27 12.4 49 17.9 44 11.6 (c) 2 94 5.0 13 3.0 14 8.0 13 22.8 8 2.5 13 6.0 12 4.4 21 5.5 (d) 3 22 1.2 3 0.7 0 0.0 3 5.3 1 0.3 5 2.3 4 1.5 6 1.6 (e) 4 5 0.3 1 0.2 1 0.6 1 1.8 0 0.0 0 0.0 2 0.7 0 0.0 (f) 5 7 0.4 0 0.0 0 0.0 1 1.8 0 0.0 0 0.0 3 1.1 3 0.8 (g) > 5 17 0.9 2 0.5 0 0.0 1 1.8 1 0.3 3 1.4 0 0.0 10 2.6
• Overall, there were 1864 respondents to this question. Seventy-five percent of the respondents reported there were no unfilled SLP positions. Seventeen percent indicated there was one unfilled position, five percent indicated two positions, and one percent reported three positions were unfilled. The largest percentages of unfilled positions were found in pediatric and rehabilitation hospitals where 61% and 35% of respondents respectively indicated one or more positions were unfilled.

26
Overall General Medical hospital
Rehabilitation hospital
Pediatric hospital
Skilled nursing facility
Home health agency or
client's home
Outpatient clinic or
speech/hearing clinic
Other
WORKFORCE INFORMATION N % N % N % N % N % N % N % N % Question 18 Total N 483 115 64 35 64 48 74 83
On average, how long have these positions remained unfilled?
(a) < 2 months 86 17.8 26 22.6 14 21.9 8 22.9 6 9.4 5 10.4 12 16.2 15 18.1 (b) 2-6 months 151 31.3 39 33.9 27 42.2 17 48.6 12 18.8 10 20.8 24 32.4 22 26.5 (c) > 6 months 246 50.9 50 43.5 23 35.9 10 28.6 46 71.9 33 68.8 38 51.4 46 55.4
• Overall, there were 483 respondents to this question. Fifty-one percent reported that the positions were unfilled for more than six months, 33% indicated they were unfilled from two to six months, and 18% indicated they had been unfilled for less than two months. The largest percentage of respondents reporting that their positions were unfilled for more than six months were from skilled nursing homes (72%) and home health (69%).

27
Overall General Medical hospital
Rehabilitation hospital
Pediatric hospital
Skilled nursing facility
Home health agency or
client's home
Outpatient clinic or
speech/hearing clinic
Other
WORKFORCE INFORMATION N % N % N % N % N % N % N % N % Question 19 Total N 679 166 81 39 100 73 97 123
Which of the following conditions describe the recruiting/hiring of qualified SLPs in your facility/setting? (Select one)
(a) No difficulty hiring qualified SLPs 112 16.5 30 18.1 15 18.5 11 28.2 9 9.0 5 6.8 18 18.6 24 19.5 (b) No active recruiting to fill SLP positions 100 14.7 32 19.3 7 8.6 3 7.7 12 12.0 12 16.4 13 13.4 21 17.1 (c) Difficulty hiring qualified SLPs 467 68.8 104 62.7 59 72.8 25 64.1 79 79.0 56 76.7 66 68.0 78 63.4
• Overall, there were 679 respondents to this question. Sixty-nine percent of the respondents indicated that they had difficulty hiring SLPs, 17% reported they had no difficulty hiring SLPs, and 15% indicated they were not actively trying to hire SLPs. The majority of respondents from all practice settings indicated they were having trouble hiring SLPs. This ranged from a low of 63% for respondents from general hospitals to a high of 79% from respondents from skilled nursing facilities.

28
Overall General Medical hospital
Rehabilitation hospital
Pediatric hospital
Skilled nursing facility
Home health agency or
client's home
Outpatient clinic or
speech/hearing clinic
Other
WORKFORCE INFORMATION N % N % N % N % N % N % N % N % Question 20 Total N 477 110 60 25 77 56 68 81
If you selected "difficulty hiring qualified SLPs what do you think the reasons are for this? (Mark all that apply)
(a) No qualified SLP applicants 212 44.4 49 44.5 28 46.7 11 44.0 34 44.2 23 41.1 34 50.0 33 40.7 (b) Salary/benefits not competitive 205 43.0 47 42.7 34 56.7 13 52.0 30 39.0 25 44.6 18 26.5 38 46.9 (c) Working conditions not desirable (travel, hours,
productivity requirements) 136 28.5 28 25.5 13 21.7 7 28.0 36 46.8 21 37.5 11 16.2 20 24.7
(d) Setting/caseload not considered desirable 84 17.6 12 10.9 5 8.3 3 12.0 32 41.6 10 17.9 10 14.7 12 14.8 (e) Geographic location not considered desirable 126 26.4 31 28.2 11 18.3 2 8.0 25 32.5 16 28.6 19 27.9 22 27.2 (f) Other 97 20.3 25 22.7 9 15.0 6 24.0 13 16.9 10 17.9 16 23.5 18 22.2
• Overall, there were 477 respondents to this question. The most frequently cited reasons were: there were no qualified SLP applicants (44%), salary and benefits were not competitive (43%), working conditions were not desirable (29%), and geographic location was not considered to be desirable (26%). The most frequently cited reasons were similar across practice setting. Respondents from skilled nursing homes appeared to have the largest number of problems. Their most frequently cited reason was that working conditions were not desirable (47%) and there were four other reasons noted by over 30% of the respondents from that setting.
• Write-in comments confirmed the reasons cited above and added concerns such as: location was not close to a university, inefficient recruiting, and unavailability of bilingual SLPs.

29
Overall General Medical hospital
Rehabilitation hospital
Pediatric hospital
Skilled nursing facility
Home health agency or
client's home
Outpatient clinic or
speech/hearing clinic
Other
WORKFORCE INFORMATION N % N % N % N % N % N % N % N % Question 21 Total N 1775 433 175 59 322 203 261 322
How does your facility/setting recruit for unfilled positions? (mark all that apply)
(a) Don't know 226 12.7 42 9.7 6 3.4 3 5.1 45 14.0 38 18.7 23 8.8 69 21.4 (b) Local university programs 433 24.4 108 24.9 51 29.1 17 28.8 53 16.5 30 14.8 96 36.8 78 24.2 (c) Networking with professional contacts 957 53.9 246 56.8 95 54.3 36 61.0 148 46.0 93 45.8 173 66.3 166 51.6 (d) Local advertising 1185 66.8 322 74.4 141 80.6 46 78.0 210 65.2 131 64.5 162 62.1 173 53.7 (e) National advertising (e.g., ASHA Leader,
Advance) 492 27.7 129 29.8 60 34.3 33 55.9 91 28.3 32 15.8 84 32.2 63 19.6
(f) Professional recruiters 155 8.7 24 5.5 8 4.6 2 3.4 84 26.1 6 3.0 19 7.3 12 3.7
• Overall, there were 1775 respondents to this question. Thirteen percent indicated they did not know, 67% indicated they used local advertising, 54% networking with professional contacts, 28% national advertising, 24% local university programs, and 9% professional recruiters. This rank ordering is similar across all settings. The most frequently used sources are local advertising, networking with professional contacts, and national advertising. Professional recruiters were the least used source for recruiting for unfilled positions, except for skilled nursing facilities (26%).

30
Overall General Medical hospital
Rehabilitation hospital
Pediatric hospital
Skilled nursing facility
Home health agency or
client's home
Outpatient clinic or
speech/hearing clinic
Other
WORKFORCE INFORMATION N % N % N % N % N % N % N % N % Question 22 Total N 1862 426 172 57 323 228 269 387
Have you had SLP student interns in your facility/setting within the past 12 months?
(N) No 1020 54.8 139 32.6 27 15.7 8 14.0 261 80.8 188 82.5 137 50.9 260 67.2 (Y) Yes (If yes, how many?) 842 45.2 287 67.4 145 84.3 49 86.0 62 19.2 40 17.5 132 49.1 127 32.8
(1) 1 303 36.0 82 28.6 40 27.6 14 28.6 39 62.9 30 75.0 50 37.9 48 37.8 (2) 2 262 31.1 92 32.1 39 26.9 12 24.5 16 25.8 7 17.5 48 36.4 48 37.8 (3) 3 127 15.1 66 23.0 21 14.5 7 14.3 5 8.1 2 5.0 12 9.1 14 11.0 (4) >= 4 150 17.8 47 16.4 45 31.0 16 32.7 2 3.2 1 2.5 22 16.7 17 13.4
• Overall, there were 1862 respondents to this question. Forty-five percent of the respondents reported they had an SLP intern in their facility within the past 12 months. Of those using SLP student interns, thirty six percent indicated they had one intern, 31% two interns, 15% three interns, and 18% four or more interns. Respondents from home health (83%) and respondents from skilled nursing facilities (81%) indicated they were the least likely to be using SLP student interns while respondents from pediatric (86%) and rehabilitation (84%) hospitals were the most likely to use student interns.

31
Overall General Medical hospital
Rehabilitation hospital
Pediatric hospital
Skilled nursing facility
Home health agency or
client's home
Outpatient clinic or
speech/hearing clinic
Other
WORKFORCE INFORMATION N % N % N % N % N % N % N % N % Question 23 Total N 1895 439 175 59 325 227 278 392
In the past 12 months, has your facility/setting hired a Clinical Fellow?
(Y) Yes 525 27.7 136 31.0 80 45.7 36 61.0 48 14.8 31 13.7 95 34.2 99 25.3 (N) No 1370 72.3 303 69.0 95 54.3 23 39.0 277 85.2 196 86.3 183 65.8 293 74.7
• Overall, there were 1895 responses to this question. Twenty-eight percent of the respondents indicated they had hired a clinical fellow in the past 12 months. Sixty-one percent of respondents working in pediatric hospitals and 46% of those working in rehabilitation hospitals indicated that they had hired a clinical fellow over the past 12 months. Clinical fellows were least likely to be hired by home health (86%) and skilled nursing homes (85%).

32
Overall General Medical hospital
Rehabilitation hospital
Pediatric hospital
Skilled nursing facility
Home health agency or
client's home
Outpatient clinic or
speech/hearing clinic
Other
WORKFORCE INFORMATION N % N % N % N % N % N % N % N % Question 24 Total N 1890 432 175 59 324 232 275 393
In a typical month, what percentage of your time do you spend providing supervision to students, SLPA'S, or clinical fellows?
(a) 0% 1072 56.7 174 40.3 47 26.9 14 23.7 256 79.0 191 82.3 133 48.4 257 65.4 (b) < 10% 209 11.1 57 13.2 22 12.6 15 25.4 21 6.5 17 7.3 41 14.9 36 9.2 (c) 10-19% 201 10.6 56 13.0 24 13.7 16 27.1 15 4.6 16 6.9 41 14.9 33 8.4 (d) 20-29% 136 7.2 47 10.9 22 12.6 6 10.2 10 3.1 3 1.3 21 7.6 27 6.9 (e) 30-39% 102 5.4 36 8.3 20 11.4 2 3.4 11 3.4 2 0.9 12 4.4 19 4.8 (f) 40-49% 60 3.2 24 5.6 12 6.9 3 5.1 5 1.5 0 0.0 10 3.6 6 1.5 (g) > 50% 110 5.8 38 8.8 28 16.0 3 5.1 6 1.9 3 1.3 17 6.2 15 3.8
• Overall, there were 1890 respondents to this question. Forty-three percent of all respondents indicated that they provided supervision. Twenty-two percent spent less than 20% of their time in supervision, 7% spent between 20-29% of their time in supervision, nine percent spent between 30 and 49 percent, and six percent spent more than 50% of their time in supervision. The lowest levels of supervision were provided by respondents from home health and skilled nursing facilities. Eighty-two percent of the respondents from home health and 79% of respondents from skilled nursing facilities indicated they provided no supervision. This is not surprising since they report hiring the fewest numbers of SLPAs and clinical fellows and are among the lowest in hiring other support personnel. Respondents from pediatric and rehabilitation hospitals were most likely to spend time in supervision. Again, this is not surprising because they are among the practice settings most likely to hire SLPAs, clinical fellows, and other support personnel.

33
Overall General Medical hospital
Rehabilitation hospital
Pediatric hospital
Skilled nursing facility
Home health agency or
client's home
Outpatient clinic or
speech/hearing clinic
Other
IMPACT OF REIMBURSEMENT N % N % N % N % N % N % N % N % Question 25 Total N 1914 437 174 58 324 238 279 404
Are you working in a facility/setting that receives reimbursement under one of the Medicare Prospective Payment Systems (PPS)?
(a) Yes 978 51.1 263 60.2 126 72.4 9 15.5 308 95.1 122 51.3 60 21.5 90 22.3 (b) No (Skip to question 29) 754 39.4 125 28.6 32 18.4 31 53.4 8 2.5 96 40.3 190 68.1 272 67.3 (c) Don't know (Skip to question 29) 182 9.5 49 11.2 16 9.2 18 31.0 8 2.5 20 8.4 29 10.4 42 10.4
• Overall, there were 1914 respondents to this question with 51% indicating their facility received payment under some form of PPS, 39% indicated their facility did not, and 10% indicated they do not know whether or not their facility received these types of payments. The percent receiving these payments varies by practice setting with respondents from skilled nursing facilities (95%) and rehabilitation hospitals (72%) reported the highest percentages of facilities receiving these reimbursements while respondents from pediatric hospitals (16%) and outpatient clinics or speech/hearing clinics (22%) reported the lowest percentage of facilities receiving these reimbursements. These findings are not surprising given the types of patients that are traditionally treated in these settings. Skilled nursing facilities and rehabilitation hospitals are more likely to treat older adults who are more likely to receive medicare payments. Pediatric hospitals and outpatient clinics or speech/hearing clinics are more likely to treat children who do not receive Medicare payments.
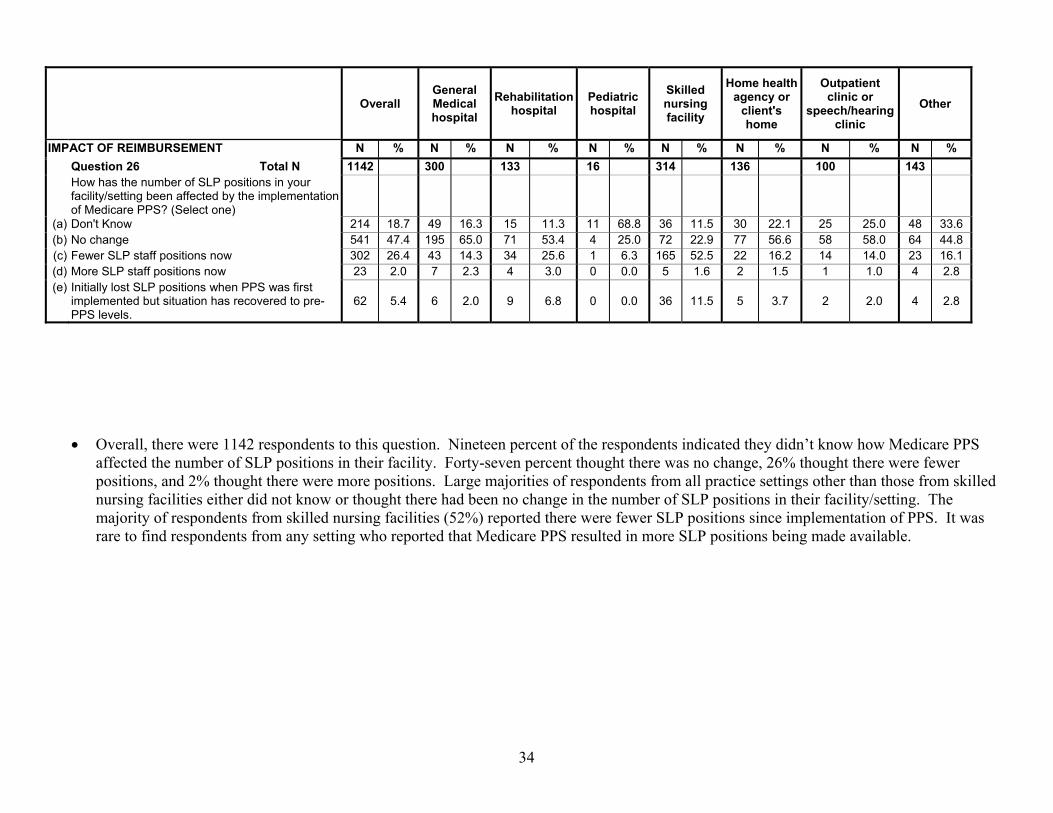
34
Overall General Medical hospital
Rehabilitation hospital
Pediatric hospital
Skilled nursing facility
Home health agency or
client's home
Outpatient clinic or
speech/hearing clinic
Other
IMPACT OF REIMBURSEMENT N % N % N % N % N % N % N % N % Question 26 Total N 1142 300 133 16 314 136 100 143
How has the number of SLP positions in your facility/setting been affected by the implementation of Medicare PPS? (Select one)
(a) Don't Know 214 18.7 49 16.3 15 11.3 11 68.8 36 11.5 30 22.1 25 25.0 48 33.6 (b) No change 541 47.4 195 65.0 71 53.4 4 25.0 72 22.9 77 56.6 58 58.0 64 44.8 (c) Fewer SLP staff positions now 302 26.4 43 14.3 34 25.6 1 6.3 165 52.5 22 16.2 14 14.0 23 16.1 (d) More SLP staff positions now 23 2.0 7 2.3 4 3.0 0 0.0 5 1.6 2 1.5 1 1.0 4 2.8 (e) Initially lost SLP positions when PPS was first
implemented but situation has recovered to pre-PPS levels.
62 5.4 6 2.0 9 6.8 0 0.0 36 11.5 5 3.7 2 2.0 4 2.8
• Overall, there were 1142 respondents to this question. Nineteen percent of the respondents indicated they didn’t know how Medicare PPS affected the number of SLP positions in their facility. Forty-seven percent thought there was no change, 26% thought there were fewer positions, and 2% thought there were more positions. Large majorities of respondents from all practice settings other than those from skilled nursing facilities either did not know or thought there had been no change in the number of SLP positions in their facility/setting. The majority of respondents from skilled nursing facilities (52%) reported there were fewer SLP positions since implementation of PPS. It was rare to find respondents from any setting who reported that Medicare PPS resulted in more SLP positions being made available.

35
Overall General Medical hospital
Rehabilitation hospital
Pediatric hospital
Skilled nursing facility
Home health agency or
client's home
Outpatient clinic or
speech/hearing clinic
Other
IMPACT OF REIMBURSEMENT N % N % N % N % N % N % N % N % Question 27 Total N 1108 292 132 11 317 131 92 133
Do you believe there are more barriers to providing good patient care now than there were before PPS?
(a) Yes 807 72.8 212 72.6 96 72.7 6 54.5 264 83.3 81 61.8 67 72.8 81 60.9 (b) No 213 19.2 67 22.9 29 22.0 1 9.1 41 12.9 38 29.0 15 16.3 22 16.5 (c) Not practicing in this setting before PPS 88 7.9 13 4.5 7 5.3 4 36.4 12 3.8 12 9.2 10 10.9 30 22.6
• Overall, there were 1108 respondents to this question. Seventy-three percent believe there are more barriers now than before PPS. Responses to this question varied somewhat by practice setting. However, the majority of respondents from all practice settings agreed that there were more barriers now than before PPS. Respondents from skilled nursing facilities (83%), general medical hospitals (73%), rehabilitation hospitals (73%), and outpatient clinics or speech/hearing clinics (73%) had the largest percentages of respondents agreeing that there were more barriers now. Slightly lower percentages of respondents from pediatric hospitals (55%) and home health (62%) agreed that there were more barriers now than before PPS.

36
Overall General Medical hospital
Rehabilitation hospital
Pediatric hospital
Skilled nursing facility
Home health agency or
client's home
Outpatient clinic or
speech/hearing clinic
Other
IMPACT OF REIMBURSEMENT N % N % N % N % N % N % N % N % Question 28 Total N 802 210 97 6 262 83 67 77
If "yes', what do you believe are the barriers? (Mark all that apply)
(a) Insufficient SLP staffing 206 25.7 47 22.4 30 30.9 0 0.0 86 32.8 7 8.4 15 22.4 21 27.3 (b) Pressure to contain services within predetermined
limits (number of minutes or visits) 639 79.7 159 75.7 59 60.8 6 100.0 227 86.6 62 74.7 59 88.1 67 87.0
(c) Fewer opportunities to screen patients 198 24.7 32 15.2 11 11.3 2 33.3 109 41.6 8 9.6 12 17.9 24 31.2 (d) Increased documentation demands 551 68.7 140 66.7 64 66.0 6 100.0 181 69.1 60 72.3 49 73.1 51 66.2 (e) Services being provided by other professionals 70 8.7 7 3.3 5 5.2 1 16.7 30 11.5 5 6.0 9 13.4 13 16.9 (f) Reduced length of stay 434 54.1 135 64.3 74 76.3 5 83.3 111 42.4 34 41.0 30 44.8 45 58.4 (g) Pressure to limit referrals for instrumental
swallowing studies (i.e., modified barium swallows, endoscopy)
313 39.0 70 33.3 26 26.8 2 33.3 138 52.7 25 30.1 20 29.9 32 41.6
• Overall, there were 802 respondents to this question. The most frequently cited reasons were pressure to contain services with predetermined limits (80%), increased documentation demands (69%), and reduced lengths of stay (54%). The least frequently cited reason was service was being provided by other professionals (9%). These findings were generally similar across practice settings. However, reduced lengths of stay was most frequently cited by respondents from rehabilitation hospitals (76%) and pressure to limit referrals for instrumental swallowing studies was most often cited by respondents from skilled nursing facilities (53%). Respondents from skilled nursing facilities were also the most likely to indicate there was insufficient SLP staffing and fewer opportunities to screen patients. Respondents from outpatient clinics or speech/hearing clinics and skilled nursing facilities were the most likely to indicate there was pressure to contain services within predetermined limits.

37
Overall General Medical hospital
Rehabilitation hospital
Pediatric hospital
Skilled nursing facility
Home health agency or
client's home
Outpatient clinic or
speech/hearing clinic
Other
IMPACT OF REIMBURSEMENT Question 29 Total N 1804 406 169 52 311 231 263 372
What is the primary reimbursement source for patients you serve? (total should add up to 100%)
(a) Medicare 36.0 45.9 47.3 2.5 71.3 34.9 11.1 13.5 (b) Medicaid 16.1 15.0 14.0 33.8 11.2 16.9 22.6 15.0 (c) Private Insurance 19.0 18.3 20.9 34.8 10.7 15.1 31.9 16.9 (d) Self Pay 8.0 2.4 2.4 4.8 0.9 5.2 19.8 16.5 (e) Other 12.3 4.1 3.8 6.3 3.4 20.2 10.5 29.8 (f) I Don't know
Average %
8.5 14.3 11.5 17.7 2.6 7.7 3.9 8.3
• Overall, there were 1804 respondents to this question. The largest percentage of respondents indicated that Medicare (36%) was their primary source of reimbursement. The remaining sources of reimbursement are listed in rank order: private insurance (19%), Medicaid (16%), and self pay (8%).
• The primary sources for reimbursement varied by practice setting. Medicare was the largest reimbursement source for skilled nursing facilities (71%), rehabilitation hospitals (47%), general medical hospitals (46%), and home health (35%). Respondents from pediatric hospitals reported that private insurance (35%) and Medicaid (34%) were their primary sources of reimbursement. Respondents from outpatient clinics or speech/hearing clinics indicated that private insurance (32%), Medicaid (23%), and self-pay (20%) were their primary sources for reimbursement.

38
Overall General Medical hospital
Rehabilitation hospital
Pediatric hospital
Skilled nursing facility
Home health agency or
client's home
Outpatient clinic or
speech/hearing clinic
Other
HIPAA N % N % N % N % N % N % N % N % Question 30 Total N 1929 441 175 58 328 240 280 407
How knowledgeable do you feel you are about HIPAA (Health Insurance Portability and Accountability Act)?
(a) Not knowledgeable at all 1220 63.2 258 58.5 101 57.7 30 51.7 185 56.4 172 71.7 176 62.9 298 73.2 (b) Somewhat knowledgeable 584 30.3 144 32.7 57 32.6 24 41.4 114 34.8 59 24.6 92 32.9 94 23.1 (c) Knowledgeable 108 5.6 33 7.5 15 8.6 4 6.9 25 7.6 7 2.9 10 3.6 14 3.4 (d) Very knowledgeable 17 0.9 6 1.4 2 1.1 0 0.0 4 1.2 2 0.8 2 0.7 1 0.2
• Overall, 1929 SLPs responded to this question. The majority (63%), indicated they were not at all knowledgeable about HIPAA, 30% indicated they were somewhat knowledgeable, and 7% indicated they were either knowledgeable or very knowledgeable. The majority of respondents from all practice settings reported they were not knowledgeable at all about HIPAA. Respondents from home health seemed to be least knowledgeable with 72% reporting they were not at all knowledgeable about HIPAA.

39
Overall General Medical hospital
Rehabilitation hospital
Pediatric hospital
Skilled nursing facility
Home health agency or
client's home
Outpatient clinic or
speech/hearing clinic
Other
TECHNOLOGY USE Question 31a Total N 1895 434 173 59 323 232 276 398 Mean | SD 1.93 1.1 1.83 1.0 2.20 1.0 2.90 0.9 1.30 0.7 1.69 1.0 2.40 1.2 2.11 1.1
Using the following scale, how often do you use computer software or web based programs for the services listed below?
(a) Treatment N % N % N % N % N % N % N % N % 1 Never 933 49.2 225 51.8 52 30.1 5 8.5 260 80.5 142 61.2 82 29.7 167 42.0 2 Rarely 374 19.7 90 20.7 53 30.6 12 20.3 38 11.8 43 18.5 66 23.9 72 18.1 3 Sometimes 414 21.8 93 21.4 51 29.5 28 47.5 19 5.9 33 14.2 74 26.8 116 29.1 4 Frequently 135 7.1 18 4.1 15 8.7 12 20.3 4 1.2 6 2.6 44 15.9 36 9.0 5 all the time 39 2.1 8 1.8 2 1.2 2 3.4 2 0.6 8 3.4 10 3.6 7 1.8
This is a five-part question. Each part is described below. Mean ratings were computed to summarize the responses to each part of the question using a five point rating scale where 1=never, 2=rarely, 3=sometimes, 4=frequently, and 5= all the time.
• Part (a) asks SLPs how often they use computer programs and software or web-based programs in treating clients or patients. Overall, there were 1895 respondents to this question. The overall mean rating was 1.93 indicating that computer programs and software or web-based programs are rarely used. The use varied slightly by practice setting with the highest rating occurring in pediatric hospitals (2.90) which indicates it is used sometimes and the lowest rating occurring in skilled nursing facilities (1.30) indicating it is almost never used .

40
Overall General Medical hospital
Rehabilitation hospital
Pediatric hospital
Skilled nursing facility
Home health agency or
client's home
Outpatient clinic or
speech/hearing clinic
Other
TECHNOLOGY USE Question 31b 1892 435 172 59 321 230 278 397 Mean | SD 1.54 1.0 1.51 1.0 1.53 1.0 2.15 1.4 1.17 0.7 1.50 1.1 1.70 1.1 1.71 1.1
Using the following scale, how often do you use computer software or web based programs for the services listed below?
(b) Evaluation N % N % N % N % N % N % N % N % 1 never 1362 72.0 318 73.1 124 72.1 28 47.5 291 90.7 174 75.7 176 63.3 251 63.2 2 rarely 247 13.1 52 12.0 22 12.8 11 18.6 19 5.9 26 11.3 48 17.3 69 17.4 3 sometimes 143 7.6 37 8.5 16 9.3 8 13.6 3 0.9 12 5.2 30 10.8 37 9.3 4 frequently 67 3.5 18 4.1 3 1.7 7 11.9 2 0.6 7 3.0 10 3.6 20 5.0 5 all the time 73 3.9 10 2.3 7 4.1 5 8.5 6 1.9 11 4.8 14 5.0 20 5.0
• Part (b) asks SLPs how often they use computer programs and software or web-based programs for use in evaluation. Overall there were
1892 responses to this question. The overall mean rating was 1.54 indicating that computer programs and software or web-based programs are rarely used for evaluation. The use varied slightly by practice setting with the highest rating occurring in pediatric hospitals (2.15) indicating that it was rarely used and the lowest rating occurring in skilled nursing facilities (1.17) indicating that it was almost never used.

41
Overall General Medical hospital
Rehabilitation hospital
Pediatric hospital
Skilled nursing facility
Home health agency or
client's home
Outpatient clinic or
speech/hearing clinic
Other
TECHNOLOGY USE Question 31c Total N 1907 441 172 59 322 237 277 399 Mean | SD 2.36 1.6 2.39 1.6 2.22 1.6 3.17 1.7 1.61 1.2 2.26 1.6 2.56 1.6 2.79 1.6
Using the following scale, how often do you use computer software or web based programs for the services listed below?
(c) Documentation N % N % N % N % N % N % N % N % 1 Never 963 50.5 216 49.0 98 57.0 19 32.2 242 75.2 129 54.4 117 42.2 142 35.6 2 Rarely 169 8.9 42 9.5 16 9.3 5 8.5 21 6.5 20 8.4 30 10.8 35 8.8 3 Sometimes 222 11.6 61 13.8 10 5.8 3 5.1 25 7.8 23 9.7 38 13.7 62 15.5 4 Frequently 237 12.4 41 9.3 19 11.0 11 18.6 12 3.7 27 11.4 41 14.8 86 21.6 5 all the time 316 16.6 81 18.4 29 16.9 21 35.6 22 6.8 38 16.0 51 18.4 74 18.5
• Part (c) asks SLPs how often they use computer programs and software or web-based programs for use in documentation. Overall, there were
1907 responses to this question. The overall mean rating was 2.36 indicating that computer programs and software or web-based programs are rarely used for documentation. The use varied slightly by practice setting with the highest rating occurring in pediatric hospitals (3.17) indicating that it is sometimes used and the lowest rating occurring in skilled nursing facilities (1.61) indicating that it is rarely used.

42
Overall General Medical hospital
Rehabilitation hospital
Pediatric hospital
Skilled nursing facility
Home health agency or
client's home
Outpatient clinic or
speech/hearing clinic
Other
TECHNOLOGY USE Question 31d Total N 1888 435 172 58 321 234 276 392 Mean | SD 1.91 1.1 1.89 1.1 1.88 1.1 2.34 1.1 1.48 0.9 1.92 1.1 2.14 1.0 2.05 1.2
Using the following scale, how often do you use computer software or web based programs for the services listed below?
(d) Patient education N % N % N % N % N % N % N % N % 1 Never 947 50.2 214 49.2 84 48.8 17 29.3 231 72.0 119 50.9 99 35.9 183 46.7 2 Rarely 377 20.0 102 23.4 45 26.2 14 24.1 42 13.1 43 18.4 66 23.9 65 16.6 3 Sometimes 397 21.0 86 19.8 29 16.9 18 31.0 32 10.0 48 20.5 86 31.2 98 25.0 4 Frequently 128 6.8 21 4.8 8 4.7 8 13.8 15 4.7 19 8.1 22 8.0 35 8.9 5 all the time 39 2.1 12 2.8 6 3.5 1 1.7 1 0.3 5 2.1 3 1.1 11 2.8
• Part (d) asks SLPs how often they use computer programs and software or web-based programs for use in patient education. Overall, there
were 1888 responses to this question. The overall mean rating was 1.91 indicating that computer programs and software or web-based programs are rarely used for patient education. The use varied slightly by practice setting with the highest rating occurring in pediatric hospitals (2.34) indicating it is rarely used and the lowest rating occurring in skilled nursing facilities (1.48) indicating it is almost never used.

43
Overall General Medical hospital
Rehabilitation hospital
Pediatric hospital
Skilled nursing facility
Home health agency or
client's home
Outpatient clinic or
speech/hearing clinic
Other
TECHNOLOGY USE Question 31e Total N 1879 430 169 58 322 235 273 392 Mean | SD 2.47 1.8 2.47 1.8 2.17 1.7 2.45 1.9 2.44 1.8 2.13 1.7 2.93 1.9 2.50 1.8
Using the following scale, how often do you use computer software or web based programs for the services listed below?
(e) Billing N % N % N % N % N % N % N % N % 1 Never 1078 57.4 243 56.5 111 65.7 34 58.6 188 58.4 155 66.0 129 47.3 218 55.6 2 Rarely 60 3.2 18 4.2 6 3.6 3 5.2 9 2.8 6 2.6 4 1.5 14 3.6 3 sometimes 78 4.2 20 4.7 6 3.6 0 0.0 15 4.7 12 5.1 8 2.9 17 4.3 4 frequently 114 6.1 24 5.6 5 3.0 3 5.2 15 4.7 13 5.5 21 7.7 33 8.4 5 all the time 549 29.2 125 29.1 41 24.3 18 31.0 95 29.5 49 20.9 111 40.7 110 28.1
• Part (e) asks SLPs how often they use computer programs and software or web-based programs for use in billing. Overall, there were 1879
responses to this question. The overall mean rating was 2.47 indicating that computer programs and software or web-based programs are rarely used for billing. The use varied slightly by practice setting with the highest rating occurring in outpatient clinics or speech/hearing clinics (2.93) indicating it is used sometimes and the lowest rating occurring in home health (2.13) indicating it is rarely used.

44
Summary for Question 31
• These findings indicate that computer programs and software or web-based programs are not widely used by SLPs in any of the major health care practice settings. The most frequent use across all health care practice settings is for billing. Even here, however, it is generally used only rarely. The highest levels of reported use of computer software or web-based programs were in pediatric hospitals and outpatient clinics or speech/hearing clinics and the lowest levels of use were in skilled nursing homes and home health. These latter two settings, however, were using computer programs and software or web-based programs for billing.

45
Overall General Medical hospital
Rehabilitation hospital
Pediatric hospital
Skilled nursing facility
Home healthagency or
client's home
Outpatient clinic or
speech/hearing clinic
Other
ASHA SERVICES Question 32a Total N 1884 433 170 57 317 236 277 394 Mean | SD 3.86 1.2 4.01 1.1 4.01 1.2 3.93 1.1 3.99 1.2 3.81 1.3 3.74 1.2 3.61 1.3
Using the following scale how important are these ASHA programs, products and services to your practice In health cars?
(a) ASHA advocacy on health care issues (legislative, regulatory, with other professional groups) N % N % N % N % N % N % N % N %
1 Not Important 111 5.9 16 3.7 11 6.5 3 5.3 19 6.0 17 7.2 17 6.1 28 7.1 2 Of Minimal Importance 188 10.0 33 7.6 14 8.2 4 7.0 28 8.8 25 10.6 32 11.6 52 13.2 3 Moderately Important 341 18.1 79 18.2 22 12.9 9 15.8 47 14.8 39 16.5 49 17.7 96 24.4 4 Important 466 24.7 108 24.9 39 22.9 19 33.3 65 20.5 61 25.8 88 31.8 86 21.8 5 Very Important 778 41.3 197 45.5 84 49.4 22 38.6 158 49.8 94 39.8 91 32.9 132 33.5
This question asks SLPs how important various ASHA programs, products, and services are to their practice in health care. This is a 10 part question. Each part is described below. Mean ratings were computed using a five point rating scale where 1=not important, 2=of minimal importance, 3=moderately important, 4=important, and 5=very important.
• Part (a) asks SLPs about the importance of ASHA advocacy on health care issues. Overall, there were 1884 responses to this question. The overall mean rating was 3.86 indicating that this is important to SLPs working in health care settings. These ratings were consistent across practice settings with mean ratings ranging from 3.74 for SLPs working in outpatient clinics or speech/hearing clinics to a mean of 4.01 obtained from SLPs working in both general medical hospitals and rehabilitation hospitals. In all cases, the mean rating would round to a rating of important.

46
Overall General Medical hospital
Rehabilitation hospital
Pediatric hospital
Skilled nursing facility
Home health agency or
client's home
Outpatient clinic or
speech/hearing clinic
Other
ASHA SERVICES Question 32b Total N 1901 436 172 58 326 236 277 396 Mean | SD 3.08 1.3 3.15 1.2 3.04 1.2 2.79 1.2 3.21 1.3 3.08 1.2 2.93 1.3 3.08 1.3
Using the following scale how important are these ASHA programs, products and services to your practice In health cars?
(b) ASHA CE self-study products N % N % N % N % N % N % N % N % 1 Not Important 244 12.8 43 9.9 19 11.0 9 15.5 45 13.8 29 12.3 46 16.6 53 13.4 2 Of Minimal Importance 392 20.6 97 22.2 44 25.6 15 25.9 55 16.9 42 17.8 60 21.7 79 19.9 3 Moderately Important 546 28.7 121 27.8 44 25.6 19 32.8 82 25.2 83 35.2 73 26.4 124 31.3 4 Important 397 20.9 103 23.6 41 23.8 9 15.5 73 22.4 44 18.6 63 22.7 64 16.2 5 Very Important 322 16.9 72 16.5 24 14.0 6 10.3 71 21.8 38 16.1 35 12.6 76 19.2
• Part (b) asks SLPs about the importance of ASHA CE self-study products. Overall there were 1901 responses to this question. The overall
mean rating was 3.08 indicating that SLPs judged these products to be moderately important to their health care practice. Mean ratings were consistent across practice settings and ranged from a mean of 2.93 for SLPs working in outpatient clinics or speech/hearing clinics to 3.21 for SLPs working in skilled nursing facilities. In all cases, the mean rating would round to a rating of moderately important.

47
Overall General Medical hospital
Rehabilitation hospital
Pediatric hospital
Skilled nursing facility
Home health agency or
client's home
Outpatient clinic or
speech/hearing clinic
Other
ASHA SERVICES Question 32c Total N 1901 434 173 56 325 237 278 398 Mean | SD 2.59 1.2 2.66 1.2 2.49 1.2 2.86 1.2 2.33 1.2 2.56 1.2 2.70 1.2 2.69 1.2
Using the following scale how important are these ASHA programs, products and services to your practice In health cars?
(c) ASHA Convention N % N % N % N % N % N % N % N % 1 Not Important 391 20.6 72 16.6 38 22.0 8 14.3 102 31.4 53 22.4 49 17.6 69 17.3 2 Of Minimal Importance 572 30.1 142 32.7 60 34.7 13 23.2 87 26.8 66 27.8 84 30.2 120 30.2 3 Moderately Important 504 26.5 120 27.6 37 21.4 19 33.9 81 24.9 66 27.8 73 26.3 108 27.1 4 Important 287 15.1 63 14.5 28 16.2 11 19.6 38 11.7 36 15.2 45 16.2 66 16.6 5 Very Important 147 7.7 37 8.5 10 5.8 5 8.9 17 5.2 16 6.8 27 9.7 35 8.8
• Part (c) asks SLPs about the importance of the ASHA convention. There were 1901 responses to this question. The overall mean rating was
2.59 indicating a rating of moderately important. Mean ratings were fairly consistent across practice settings and ranged from a mean of 2.33 for SLPs working in skilled nursing facilities indicating it was judged to be of minimal importance to a mean of 2.86 for SLPs working in pediatric hospitals indicating it was moderately important.

48
Overall General Medical hospital
Rehabilitation hospital
Pediatric hospital
Skilled nursing facility
Home health agency or
client's home
Outpatient clinic or
speech/hearing clinic
Other
ASHA SERVICES Question 32d Total N 1904 439 170 58 325 235 279 398 Mean | SD 3.48 1.1 3.62 1.1 3.75 1.2 3.41 1.0 3.40 1.2 3.33 1.2 3.49 1.1 3.39 1.2
Using the following scale how important are these ASHA programs, products and services to your practice In health cars?
(d) ASHA policy documents (position statements, guidelines, etc.) N % N % N % N % N % N % N % N %
1 Not Important 107 5.6 22 5.0 10 5.9 2 3.4 17 5.2 19 8.1 11 3.9 26 6.5 2 Of Minimal Importance 260 13.7 43 9.8 13 7.6 8 13.8 65 20.0 31 13.2 37 13.3 63 15.8 3 Moderately Important 581 30.5 134 30.5 46 27.1 20 34.5 85 26.2 81 34.5 92 33.0 123 30.9 4 Important 518 27.2 122 27.8 42 24.7 20 34.5 88 27.1 61 26.0 83 29.7 102 25.6 5 Very Important 438 23.0 118 26.9 59 34.7 8 13.8 70 21.5 43 18.3 56 20.1 84 21.1
• Part (d) asks SLPs about the importance of ASHA policy documents. There were 1904 responses to this question. The overall mean rating
was 3.48 indicating these documents were judged to be moderately important. Mean ratings varied somewhat by practice setting. The highest ratings were obtained from respondents in rehabilitation hospitals (3.75) and general medical hospitals (3.62) indicating it was judged to be important. Lower ratings were obtained from respondents in home health (3.33), skilled nursing facilities (3.40), pediatric hospitals (3.41), and outpatient clinics or speech/hearing clinics (3.49) indicating it was judged to be moderately important in those practice settings.

49
Overall General Medical hospital
Rehabilitation hospital
Pediatric hospital
Skilled nursing facility
Home health agency or
client's home
Outpatient clinic or
speech/hearing clinic
Other
ASHA SERVICES Question 32e Total N 1898 437 170 58 324 235 280 394 Mean | SD 3.08 1.2 3.29 1.2 3.15 1.2 3.07 1.1 3.02 1.3 2.92 1.2 3.10 1.2 2.96 1.3
Using the following scale how important are these ASHA programs, products and services to your practice In health cars?
(e) Health care related information on the Web site N % N % N % N % N % N % N % N % 1 Not Important 232 12.2 35 8.0 14 8.2 7 12.1 53 16.4 34 14.5 33 11.8 56 14.2 2 Of Minimal Importance 372 19.6 73 16.7 41 24.1 8 13.8 54 16.7 52 22.1 50 17.9 94 23.9 3 Moderately Important 570 30.0 131 30.0 49 28.8 21 36.2 95 29.3 76 32.3 88 31.4 110 27.9 4 Important 453 23.9 125 28.6 38 22.4 18 31.0 76 23.5 45 19.1 74 26.4 77 19.5 5 Very Important 271 14.3 73 16.7 28 16.5 4 6.9 46 14.2 28 11.9 35 12.5 57 14.5
• Part (e) asks SLPs about the importance of health care related information on the ASHA web site. There were 1898 responses to this question. The overall mean rating was 3.08 indicating that this information was judged to be moderately important. These ratings were consistent across practice settings and ranged from a mean of 2.92 from SLPs working in home health agencies or clients’ homes to a mean of 3.29 for SLPs working in general hospitals indicating it was judged to be moderately important in all of the practice settings.

50
Overall General Medical hospital
Rehabilitation hospital
Pediatric hospital
Skilled nursing facility
Home health agency or
client's home
Outpatient clinic or
speech/hearing clinic
Other
ASHA SERVICES Question 32f Total N 1871 428 171 58 317 234 276 387 Mean | SD 2.60 1.0 2.62 1.0 2.51 1.0 2.59 1.0 2.49 1.1 2.57 1.0 2.71 1.0 2.66 1.0
Using the following scale how important are these ASHA programs, products and services to your practice In health cars?
(f) Other ASHA products N % N % N % N % N % N % N % N % 1 Not Important 307 16.4 62 14.5 31 18.1 9 15.5 68 21.5 42 17.9 37 13.4 58 15.0 2 Of Minimal Importance 550 29.4 134 31.3 55 32.2 15 25.9 98 30.9 65 27.8 75 27.2 108 27.9 3 Moderately Important 658 35.2 151 35.3 54 31.6 27 46.6 94 29.7 86 36.8 101 36.6 145 37.5 4 Important 290 15.5 68 15.9 28 16.4 5 8.6 41 12.9 33 14.1 56 20.3 59 15.2 5 Very Important 66 3.5 13 3.0 3 1.8 2 3.4 16 5.0 8 3.4 7 2.5 17 4.4
• Part (f) asks SLPs about the importance of other ASHA products. There were 1871 responses to this question. The overall mean rating was 2.60 indicating that these products were judged to be moderately important. These ratings were fairly consistent across practice settings and ranged from a mean of 2.49 for SLPs working in skilled nursing facilities indicating they were judged to be of minimal importance to a mean of 2.71 for SLPs working in outpatient clinics or speech/hearing clinics indicating they were judged to be moderately important.
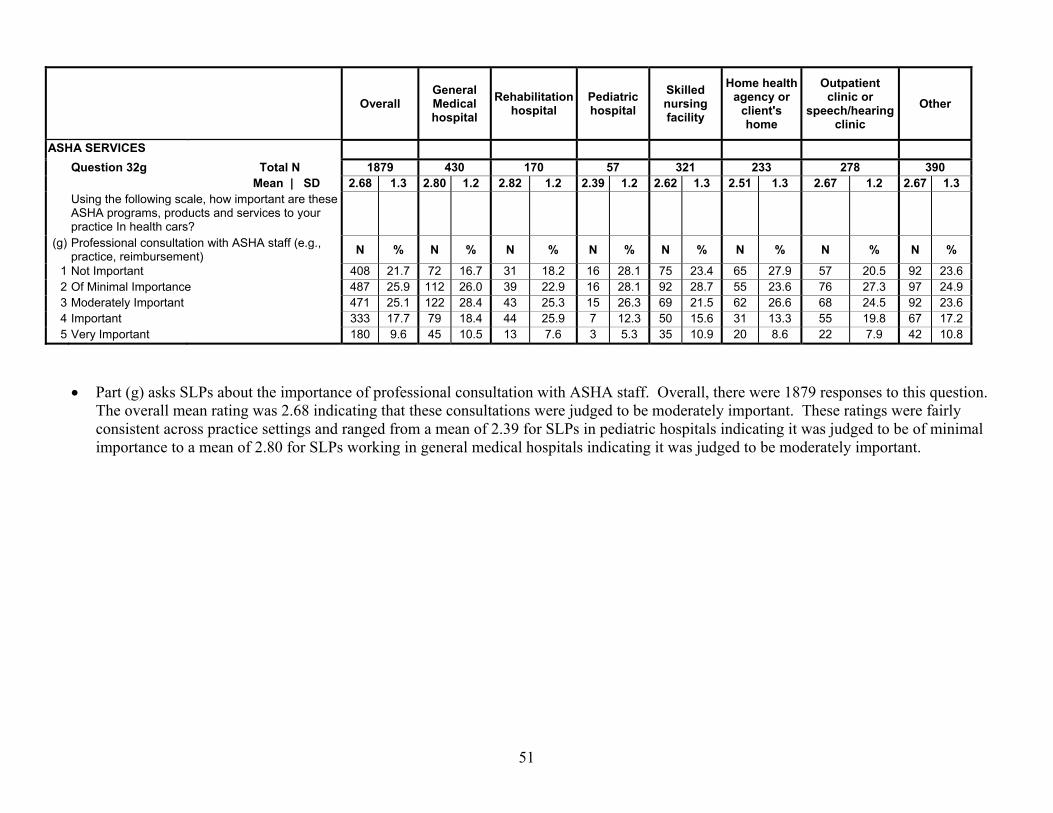
51
Overall General Medical hospital
Rehabilitation hospital
Pediatric hospital
Skilled nursing facility
Home health agency or
client's home
Outpatient clinic or
speech/hearing clinic
Other
ASHA SERVICES Question 32g Total N 1879 430 170 57 321 233 278 390 Mean | SD 2.68 1.3 2.80 1.2 2.82 1.2 2.39 1.2 2.62 1.3 2.51 1.3 2.67 1.2 2.67 1.3
Using the following scale, how important are these ASHA programs, products and services to your practice In health cars?
(g) Professional consultation with ASHA staff (e.g., practice, reimbursement) N % N % N % N % N % N % N % N %
1 Not Important 408 21.7 72 16.7 31 18.2 16 28.1 75 23.4 65 27.9 57 20.5 92 23.6 2 Of Minimal Importance 487 25.9 112 26.0 39 22.9 16 28.1 92 28.7 55 23.6 76 27.3 97 24.9 3 Moderately Important 471 25.1 122 28.4 43 25.3 15 26.3 69 21.5 62 26.6 68 24.5 92 23.6 4 Important 333 17.7 79 18.4 44 25.9 7 12.3 50 15.6 31 13.3 55 19.8 67 17.2 5 Very Important 180 9.6 45 10.5 13 7.6 3 5.3 35 10.9 20 8.6 22 7.9 42 10.8
• Part (g) asks SLPs about the importance of professional consultation with ASHA staff. Overall, there were 1879 responses to this question.
The overall mean rating was 2.68 indicating that these consultations were judged to be moderately important. These ratings were fairly consistent across practice settings and ranged from a mean of 2.39 for SLPs in pediatric hospitals indicating it was judged to be of minimal importance to a mean of 2.80 for SLPs working in general medical hospitals indicating it was judged to be moderately important.

52
Overall General Medical hospital
Rehabilitation hospital
Pediatric hospital
Skilled nursing facility
Home health agency or
client's home
Outpatient clinic or
speech/hearing clinic
Other
ASHA SERVICES Question 32h Total N 1905 435 173 57 324 238 279 399 Mean | SD 3.26 1.1 3.29 1.1 3.20 1.1 3.23 1.1 3.11 1.1 3.11 1.1 3.43 1.0 3.36 1.1
Using the following scale how important are these ASHA programs, products and services to your practice In health cars?
(h) Publications (ASHA Leader, journals) N % N % N % N % N % N % N % N % 1 Not Important 122 6.4 26 6.0 14 8.1 5 8.8 31 9.6 17 7.1 7 2.5 22 5.5 2 Of Minimal Importance 309 16.2 64 14.7 22 12.7 6 10.5 59 18.2 61 25.6 40 14.3 57 14.3 3 Moderately Important 678 35.6 170 39.1 69 39.9 23 40.4 116 35.8 65 27.3 99 35.5 136 34.1 4 Important 542 28.5 109 25.1 51 29.5 17 29.8 79 24.4 68 28.6 93 33.3 125 31.3 5 Very Important 254 13.3 66 15.2 17 9.8 6 10.5 39 12.0 27 11.3 40 14.3 59 14.8
• Part (h) asks SLPs about the importance of ASHA publications. Overall, there were 1905 responses to this question. The overall mean rating was 3.26 indicating that these publications were judged to be moderately important. These ratings were consistent across practice settings and ranged from a mean of 3.11 obtained from SLPs in both skilled nursing facilities and those working in home health to a mean of 3.43 for SLPs working in outpatient clinics or in speech/hearing clinics. ASHA publications were judged to be moderately important across all six practice settings.

53
Overall General Medical hospital
Rehabilitation hospital
Pediatric hospital
Skilled nursing facility
Home health agency or
client's home
Outpatient clinic or
speech/hearing clinic
Other
ASHA SERVICES Question 32i Total N 1884 431 172 51 321 236 275 398 Mean | SD 2.97 1.2 3.15 1.2 3.09 1.2 3.04 1.1 2.72 1.2 2.86 1.2 3.05 1.1 2.94 1.2
Using the following scale how important are these ASHA programs, products and services to your practice In health cars?
(i) Research information (NOMS data, research reports) N % N % N % N % N % N % N % N %
1 Not Important 233 12.4 44 10.2 23 13.4 4 7.8 58 18.1 37 15.7 21 7.6 46 11.6 2 Of Minimal Importance 442 23.5 87 20.2 30 17.4 12 23.5 91 28.3 62 26.3 63 22.9 97 24.4 3 Moderately Important 585 31.1 130 30.2 55 32.0 19 37.3 87 27.1 62 26.3 101 36.7 131 32.9 4 Important 391 20.8 101 23.4 37 21.5 10 19.6 52 16.2 48 20.3 62 22.5 81 20.4 5 Very Important 233 12.4 69 16.0 27 15.7 6 11.8 33 10.3 27 11.4 28 10.2 43 10.8
• Part (i) asks SLPs about the importance of research information provided by ASHA. Overall, there were 1884 responses to this question. The overall mean rating was 2.97 indicating that research information was judged to be moderately important. These ratings were consistent across practice settings and ranged from a mean of 2.72 for SLPs in skilled nursing facilities to a mean of 3.15 for SLPs working in general medical hospitals. Research information was judged to be moderately important across all six practice settings.

54
Overall General Medical hospital
Rehabilitation hospital
Pediatric hospital
Skilled nursing facility
Home health agency or
client's home
Outpatient clinic or
speech/hearing clinic
Other
ASHA SERVICES Question 32j Total N 1892 428 173 57 321 237 278 398 Mean | SD 2.78 1.2 2.99 1.2 2.88 1.3 2.77 1.2 2.59 1.3 2.49 1.2 2.87 1.2 2.80 1.3
Using the following scale how important are these ASHA programs, products and services to your practice In health cars?
(j) Special Interest Divisions N % N % N % N % N % N % N % N % 1 Not Important 354 18.7 56 13.1 32 18.5 10 17.5 77 24.0 63 26.6 42 15.1 74 18.6 2 Of Minimal Importance 459 24.3 103 24.1 33 19.1 15 26.3 87 27.1 60 25.3 69 24.8 92 23.1 3 Moderately Important 521 27.5 115 26.9 53 30.6 16 28.1 81 25.2 63 26.6 76 27.3 117 29.4 4 Important 357 18.9 99 23.1 34 19.7 10 17.5 42 13.1 37 15.6 65 23.4 70 17.6 5 Very Important 201 10.6 55 12.9 21 12.1 6 10.5 34 10.6 14 5.9 26 9.4 45 11.3
• Part (j) asks SLPs about the importance of special interest divisions. Overall, there were 1892 responses to this question. The overall mean rating was 2.78 indicating that special interest groups were judged to be moderately important. These ratings were fairly consistent across practice settings and ranged from a mean of 2.49 for SLPs working in home health indicating it was judged to be of minimal importance to a mean of 2.99 for SLPs working in general medical hospitals indicating it was judged to be moderately important.
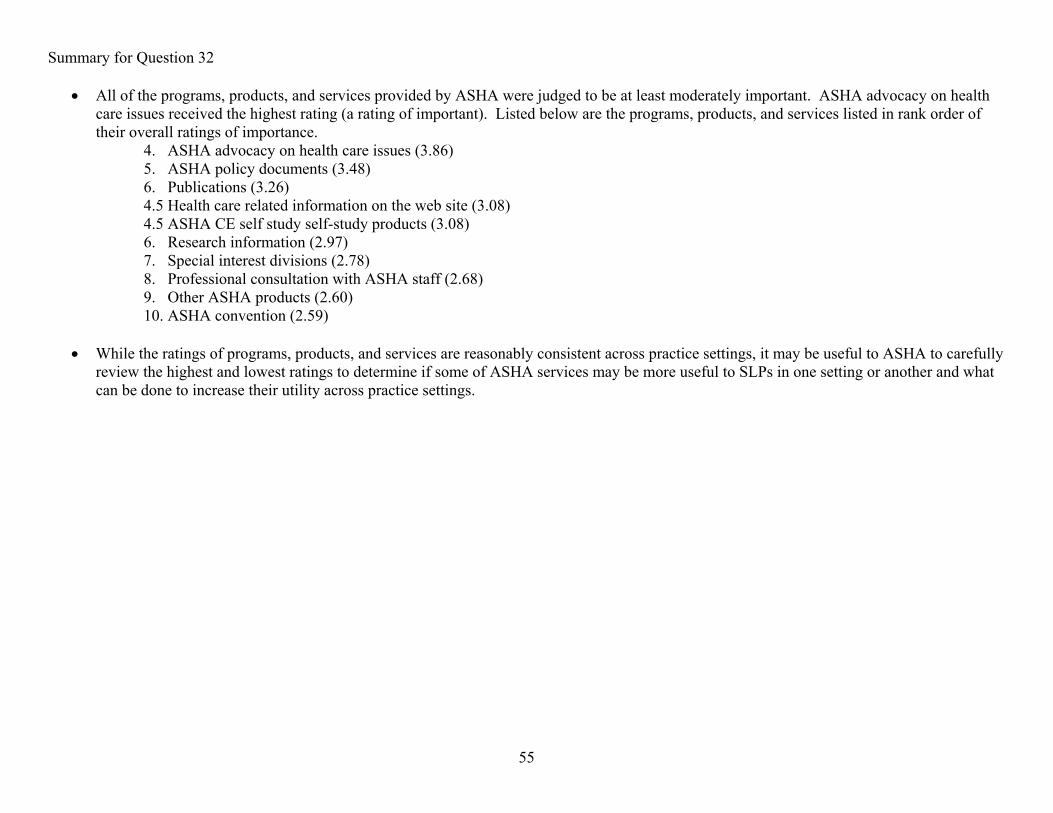
55
Summary for Question 32
• All of the programs, products, and services provided by ASHA were judged to be at least moderately important. ASHA advocacy on health care issues received the highest rating (a rating of important). Listed below are the programs, products, and services listed in rank order of their overall ratings of importance.
4. ASHA advocacy on health care issues (3.86) 5. ASHA policy documents (3.48) 6. Publications (3.26) 4.5 Health care related information on the web site (3.08) 4.5 ASHA CE self study self-study products (3.08) 6. Research information (2.97) 7. Special interest divisions (2.78) 8. Professional consultation with ASHA staff (2.68) 9. Other ASHA products (2.60) 10. ASHA convention (2.59)
• While the ratings of programs, products, and services are reasonably consistent across practice settings, it may be useful to ASHA to carefully review the highest and lowest ratings to determine if some of ASHA services may be more useful to SLPs in one setting or another and what can be done to increase their utility across practice settings.
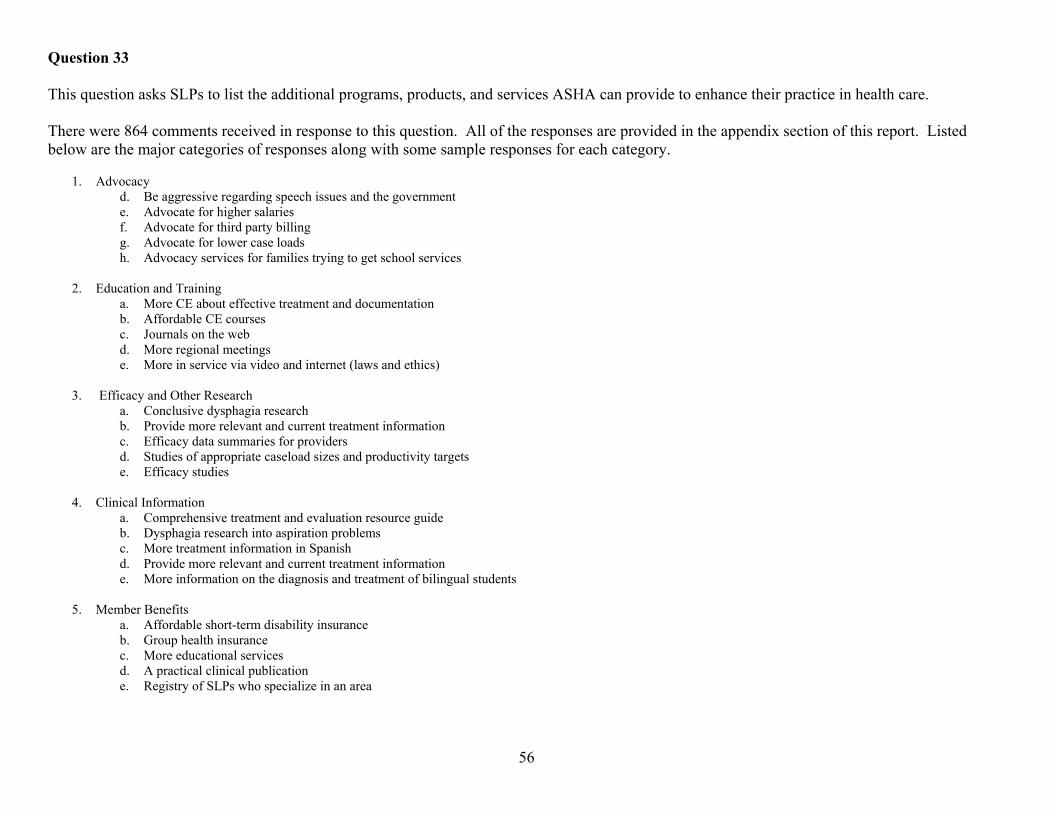
56
Question 33 This question asks SLPs to list the additional programs, products, and services ASHA can provide to enhance their practice in health care. There were 864 comments received in response to this question. All of the responses are provided in the appendix section of this report. Listed below are the major categories of responses along with some sample responses for each category.
1. Advocacy d. Be aggressive regarding speech issues and the government e. Advocate for higher salaries f. Advocate for third party billing g. Advocate for lower case loads h. Advocacy services for families trying to get school services
2. Education and Training
a. More CE about effective treatment and documentation b. Affordable CE courses c. Journals on the web d. More regional meetings e. More in service via video and internet (laws and ethics)
3. Efficacy and Other Research
a. Conclusive dysphagia research b. Provide more relevant and current treatment information c. Efficacy data summaries for providers d. Studies of appropriate caseload sizes and productivity targets e. Efficacy studies
4. Clinical Information
a. Comprehensive treatment and evaluation resource guide b. Dysphagia research into aspiration problems c. More treatment information in Spanish d. Provide more relevant and current treatment information e. More information on the diagnosis and treatment of bilingual students
5. Member Benefits
a. Affordable short-term disability insurance b. Group health insurance c. More educational services d. A practical clinical publication e. Registry of SLPs who specialize in an area

57
6. Business Practices a. Information for private practice b. Tips to improve efficiency c. Marketing programs d. Help with guidelines on the use of SLPAs e. Grant writing for research
7. Public Relations
a. Let the public know more about what we do b. Let third party payers know more about what we do and how well it works c. More frequent radio and TV spots

58
Overall General Medical hospital
Rehabilitation hospital
Pediatric hospital
Skilled nursing facility
Home health agency or
client's home
Outpatient clinic or
speech/hearing clinic
Other
GEOGRAPHIC INFORMATION N % N % N % N % N % N % N % N % Question 34 Total N 1884 429 170 58 322 234 275 396
In what state do you currently practice? Middle Atlantic NJ,NY,PA 296 15.7 50 11.7 23 13.5 3 5.2 63 19.6 47 20.1 35 12.7 75 18.9 New England CT, ME, MA, NH, RI, VT 92 4.9 15 3.5 5 2.9 3 5.2 11 3.4 22 9.4 4 1.5 32 8.1 East North Central IL, IN, MI, OH, WI 379 20.1 98 22.8 30 17.6 14 24.1 82 25.5 42 17.9 47 17.1 66 16.7 West North Central IA, KS, MN, MO, NE, ND, SD 156 8.3 63 14.7 16 9.4 4 6.9 17 5.3 13 5.6 21 7.6 22 5.6 East South Central AL, KY, MS, TN 106 5.6 15 3.5 15 8.8 2 3.4 24 7.5 20 8.5 14 5.1 16 4.0 South Atlantic DE, DC, FL, GA, MD, NC,
SC, VA, WV 333 17.7 68 15.9 28 16.5 17 29.3 54 16.8 30 12.8 57 20.7 79 19.9
West South Central AR, LA, OK, TX 174 9.2 39 9.1 23 13.5 4 6.9 18 5.6 19 8.1 33 12.0 38 9.6 Mountain AZ, CO, ID, MT,NV, NM, UT,
WY 140 7.4 32 7.5 15 8.8 7 12.1 15 4.7 14 6.0 23 8.4 34 8.6
Pacific AK, CA, HI, OR, WA 208 11.0 49 11.4 15 8.8 4 6.9 38 11.8 27 11.5 41 14.9 34 8.6
• These results indicate that there was representation from each of the nine ASHA regions and seems to be representative of the ASHA membership

59
Overall General Medical hospital
Rehabilitation hospital
Pediatric hospital
Skilled nursing facility
Home health agency or
client's home
Outpatient clinic or
speech/hearing clinic
Other
IMPACT OF REIMBURSEMENT N % N % N % N % N % N % N % N % Question 35 Total N 1925 440 174 59 327 238 278 409
Which one of the following best describes where you work?
(a) Metropolitan/urban 715 37.1 194 44.1 86 49.4 48 81.4 99 30.3 65 27.3 106 38.1 117 28.6 (b) Suburban 841 43.7 151 34.3 65 37.4 9 15.3 159 48.6 122 51.3 126 45.3 209 51.1 (c) Rural 369 19.2 95 21.6 23 13.2 2 3.4 69 21.1 51 21.4 46 16.5 83 20.3
• Overall, there were 1925 responses to this question. Thirty-seven percent of respondents indicated they worked in a metropolitan/urban setting, 44% in a suburban setting, and 19% in a rural setting. The distribution of respondents varied somewhat by practice setting. Some settings had the largest percentage of their respondents from metropolitan/urban settings: pediatric hospitals (81%), rehabilitation hospitals (49%), and general hospitals (44%). Some setting had the largest percentage of their respondents from suburban settings: home health (51%), skilled nursing facilities (49%), and outpatient clinics or speech/hearing clinics (45%).