report on selected executive branch departments...
TRANSCRIPT

Report on Selected Executive Branch Departments’ Information Technology Expenditures
A Report to the Governorand the Legislature of the State of Hawai‘i
THE AUDITORSTATE OF HAWAI‘I
Report No. 16-01March 2016

Offi ce of the Auditor
The missions of the Offi ce of the Auditor are assigned by the Hawai‘i State Constitution (Article VII, Section 10). The primary mission is to conduct post audits of the transactions, accounts, programs, and performance of public agencies. A supplemental mission is to conduct such other investigations and prepare such additional reports as may be directed by the Legislature.
Under its assigned missions, the offi ce conducts the following types of examinations:
1. Financial audits attest to the fairness of the fi nancial statements of agencies. Theyexamine the adequacy of the fi nancial records and accounting and internal controls,and they determine the legality and propriety of expenditures.
2. Management audits, which are also referred to as performance audits, examine theeffectiveness of programs or the effi ciency of agencies or both. These audits arealso called program audits, when they focus on whether programs are attaining theobjectives and results expected of them, and operations audits, when they examinehow well agencies are organized and managed and how effi ciently they acquire andutilize resources.
3. Sunset evaluations evaluate new professional and occupational licensing programs todetermine whether the programs should be terminated, continued, or modifi ed. Theseevaluations are conducted in accordance with criteria established by statute.
4. Sunrise analyses are similar to sunset evaluations, but they apply to proposed ratherthan existing regulatory programs. Before a new professional and occupationallicensing program can be enacted, the statutes require that the measure be analyzedby the Offi ce of the Auditor as to its probable effects.
5. Health insurance analyses examine bills that propose to mandate certain healthinsurance benefi ts. Such bills cannot be enacted unless they are referred to the Offi ceof the Auditor for an assessment of the social and fi nancial impact of the proposedmeasure.
6. Analyses of proposed special funds and existing trust and revolving funds determine ifproposals to establish these funds are existing funds meet legislative criteria.
7. Procurement compliance audits and other procurement-related monitoring assist theLegislature in overseeing government procurement practices.
8. Fiscal accountability reports analyze expenditures by the state Department ofEducation in various areas.
9. Special studies respond to requests from both houses of the Legislature. The studiesusually address specifi c problems for which the Legislature is seeking solutions.
Hawai‘i’s laws provide the Auditor with broad powers to examine all books, records, fi les, papers, and documents and all fi nancial affairs of every agency. The Auditor also has the authority to summon persons to produce records and to question persons under oath. However, the Offi ce of the Auditor exercises no control function, and its authority is limited to reviewing, evaluating, and reporting on its fi ndings and recommendations to the Legislature and the Governor.
THE AUDITORSTATE OF HAWAI‘IKekuanao‘a Building465 S. King Street, Room 500Honolulu, Hawai‘i 96813

Offi ce of the Auditor465 S. King Street Rm. 500Honolulu, HI 96813Ph. (808) 587-0800
Jan K. YamaneActing State AuditorState of Hawai‘i
For the full text of this and other reports, visit our website: http://auditor.hawaii.gov/
Report on Selected Executive Branch Departments’ Information Technology ExpendituresReport No. 16-01, March 2016
IT reform must begin with good accounting practices
Defi nition, categorization, and recording of IT expenditures vary widely throughout state governmentThe lack of a statewide defi nition of what constitutes IT goods and services, coupled with inconsistent coding of IT expenditures, makes it extremely diffi cult if not impossible for the State to assemble an accurate inventory of its IT resources. In addition, without an annual reporting requirement to a central agency, the State is unable to manage its IT resources in the short-term or plan for long-term growth.
The six selected departments’ initial reports of IT expenditures were only 44 percent of the fi nal compilation of data. The initial reports totaled $156.4 million while the fi nal reports totaled $359.6 million for the fi scal years 2011–2014, an increase of approximately 130 percent. We also found that the number of object codes used by the departments to categorize IT expenditures varies signifi cantly, ranging from as many as 66 different codes to as few as seven codes. Some codes are simple and straightforward, like the Department of Health’s codes for “software,” “hardware,” and “repairs/maintenance services.” Others defi ne IT costs more broadly, using codes for general offi ce supplies, membership dues, and even mileage, travel costs, parking permits, and janitorial services.
IT staffi ng has fl attened out while overall spending continues to increaseOverall, IT-related staffi ng increased about 13 percent for the fi scal years 2011–2014 but has fl attened out in the past two years. After experiencing modest growth from 382 IT-related positions in FY2011 to 418 such positions in FY2012, the number of positions remained steady in FY2013 and FY2014 at 433, while IT-related expenditures for the six departments we surveyed grew signifi cantly over the same time period, from approximately $52 million in FY2011 to about $140 million in FY2014, an increase of almost 170 percent.
A small group of vendors provides IT goods and services to a majority of the departments surveyedWe noted that six of the top ten vendors provided goods and services to a majority of the departments we surveyed. The State’s chief information offi cer (CIO) expressed concern that these vendors offer easily accessible menus for goods and services but may not represent the best value for the State.
Agency responseThe Offi ce of Enterprise Technology Services agreed with our recommendations. The State CIO noted that the challenges we faced in collecting executive departments’ IT expenditure data are consistent with the diffi culties experienced during similar efforts in the past. He also pointed out that a standard taxonomy for use in all IT-related expenditures, regardless of project size and scope, would benefi t his IT governance efforts.
IT-related expenditures for
the six departments we surveyed grew signifi cantly, from approximately $52
million in FY2011 to about $140 million in FY2014, an increase
of almost 170 percent.
Recommendations
Response
Prior Reports

Report on Selected Executive Branch Departments’ Information Technology Expenditures
Report No. 16-01March 2016
A Report to the Governorand the Legislature of the State of Hawai‘i
Conducted by
The AuditorState of Hawai‘iandAccuity LLP
THE AUDITORSTATE OF HAWAI‘I
Submitted by

This is a report on our review of selected executive branch departments’ information technology expenditures for the fiscal years 2011–2014. The review was requested by Senate Concurrent Resolution No. 162 of the 2015 Legislature and was conducted by the Office of the Auditor and the certified public accounting firm of Accuity LLP.
We wish to express our appreciation for the cooperation and assistance extended by the selected departments, Department of Budget and Finance, Department of Human Resources Development, and the Office of Enterprise Technology Services during the course of the review.
Jan K. YamaneActing State Auditor
Foreword
v
Table of Contents
Chapter 1 Introduction
Background..................................................................1Prior Reports ................................................................3Objectives of the Engagement .....................................4Scope and Methodology ..............................................4
Chapter 2 IT Reform Efforts Must Begin With Good Accounting Practices
Summary of Findings ................................................10 Defi nition, Categorization, and Recording of IT Expenditures Vary Widely Throughout State Government ...................................................10IT Staffi ng Has Flattened Out While Overall Spending Continues to Increase ..............................15A Small Group of Vendors Provides IT Goods and Services to a Majority of the Departments Surveyed ............................................17Conclusion .................................................................18Recommendations......................................................19
Chapter 3 Independent Accountant’s ReportIndependent Accountant’s Report ..............................21
AppendicesAppendix A Detailed List of IT Expenditures by Department,
FY2011–FY2014A-1 Department of Accounting and General Services.......23A-2 Department of the Attorney General ..........................26A-3 Department of Health ................................................28A-4 Department of Human Services .................................30A-5 Department of Taxation .............................................32A-6 Department of Transportation ....................................33
Appendix B List of IT Expenditures by Vendor, FY2011–FY2014 ....................................................37
vi
Appendix C Detailed List of IT Encumbrances of $100,000 or Greater by Department, FY2011–FY2014
C-1 Department of Accounting and General Services.......43C-2 Department of the Attorney General ..........................45C-3 Department of Health ................................................45C-4 Department of Human Services .................................46C-5 Department of Taxation .............................................47C-6 Department of Transportation ....................................47
Appendix D Detailed List IT Encumbrances of $100,000 or Greater by Vendor, FY2011–FY2014......................49
Appendix E Detailed List of IT Positions, Budgeted and Actual Salaries by Department, FY2011–FY2014
E-1 Department of Accounting and General Services.......53E-2 Department of the Attorney General ..........................55E-3 Department of Health ................................................56E-4 Department of Human Services .................................58E-5 Department of Taxation .............................................59E-6 Department of Transportation ....................................60
Response of the Affected Agency ........................................61
List of Exhibits
Exhibit 1.1 Modifi cations to Scope of Work Requested in SCR No. 162 (2015) .................................................4
Exhibit 1.2 Approximate Total IT Expenditures of Executive Departments*, FY2011 ............................5
Exhibit 2.1 IT Expenditures as Initially Reported, by Department, FY2011–FY2014 ................................ 11
Exhibit 2.2 Departments’ Revised IT Expenditures, FY2011–FY2014 ....................................................12
Exhibit 2.3 Number of IT Object Codes used by Departments .....13Exhibit 2.4 Department of Health IT-Related Object Codes .........13Exhibit 2.5 Department of the Attorney General IT-Related
Object Codes ..........................................................14Exhibit 2.6 Aggregate IT Positions for Surveyed Departments,
FY2011–FY2014 ....................................................16Exhibit 2.7 Aggregate IT Expenditures for Surveyed
Departments, FY2011–FY2014 ($ millions) ...........16Exhibit 2.8 Top Vendor Encumbrances, FY2011–FY2014 ...........17
Report No. 16-01 / March 2016 1
Chapter 1Introduction
This report of IT expenditures in selected executive branch departments was conducted by the Offi ce of the Auditor and the independent certifi ed public accounting fi rm of Accuity LLP. The work was performed pursuant to Senate Concurrent Resolution (SCR) No. 162 of the 2015 Legislature, which asked the Auditor to conduct a fi nancial audit of information technology expenditures in the executive branch departments and attached agencies, excluding the Department of Education, University of Hawai‘i, and Offi ce of Hawaiian Affairs, over the past four fi scal years.
Background In its request to the Auditor, the Legislature noted that the Offi ce of Information Management and Technology (OIMT) was responsible for modernizing the State’s patchwork of antiquated information technology (IT) systems and for streamlining business practices across 18 departments, 108 attached agencies, and 168 boards and commissions. The Legislature also noted that OIMT was working across state departments and attached agencies to compile an accurate and up-to-date information technology investment portfolio for the executive branch in order to provide a complete picture of both short-term operating and long-term capital IT investment expenditures.
Furthermore, the Legislature noted, the State’s accounting system, inventory management system, tax system, and health care entitlement system all run on legacy computer equipment whose eventual breakdown would mean the irretrievable loss of data. As of January 2013, Hawai‘i had spent only 1.4 percent of its budget on IT, while the national average was closer to 3 percent. In addition, of the State’s 41,000 employees, only 746 were in IT, many of whom were scattered across departments and agencies. The Legislature also noted that Hawai‘i’s IT budget is decentralized across the executive branch, limiting the opportunities for consolidating procurement efforts, leveraging economies of scale, and transitioning to integrated systems.
Organization of IT controls in the executive branch
Statewide coordination of information technology in Hawai‘i is relatively new and is still evolving. Prior to January 1, 2011, the Department of Accounting and General Services’ (DAGS) Information and Communication Services Division (ICSD) was the primary State body dealing with IT. The Legislature subsequently established a State Chief Information Offi cer (CIO) and OIMT. The CIO is now overseeing the

2 Report No. 16-01 / March 2016
Chapter 1: Introduction
transition of OIMT into what will be the Offi ce of Enterprise Technology Services (ETS).
Information and Communication Services Division
ICSD plans, coordinates, and administers statewide information processing and telecommunications services and programs, and operates an overall program for improving government effi ciency and effectiveness through telecommunications and information processing technologies, and provides statewide voice, data, radio, and video communications, and networking. ICSD also operates a central information processing center, electronic mail, web page hosting for state departments, internet support services, and a video conferencing system, and develops, operates, and maintains information, fi ber optic, and radio systems for the State.
Chief Information Offi cer
Act 200, Session Laws of Hawai‘i (SLH) 2010, created a State CIO as of January 1, 2011 to organize, manage, and oversee statewide IT governance, including supervision and oversight of DAGS’ ICSD. Codifi ed as Section 27-43, Hawai‘i Revised Statutes (HRS), the CIO is appointed by the governor and reports directly to the governor. The CIO is responsible for developing, implementing, and managing statewide IT governance, strategic plans, and technology standards, and for reporting to the governor and Legislature annually on the status and implementation of the State IT strategic plan. The CIO leads OIMT and oversees ICSD.
Information Technology Steering Committee
Act 200, SLH 2010, also established an Information Technology Steering Committee to assist the CIO in developing the State’s IT standards and policies. The committee consists of 11 members and is charged with assisting the CIO in developing and implementing the State’s IT strategic plans; assessing executive branch departments’ progress in meeting the objectives defi ned in the State’s IT strategic plans and identifying best practices for shared or consolidated services; ensuring technology projects are selected based on their potential impact and risk to the State as well as their strategic value; ensuring executive branch departments maintain suffi cient tools to assess the value and benefi ts of technology initiatives; assisting the CIO in developing state IT standards and policies; and clarifying the roles, responsibilities, and authority of ICSD, specifi cally as it relates to its statewide duties.
Originally established within the Offi ce of the Governor, Act 84, SLH 2011, moved the CIO and the committee under DAGS as of July 1, 2011.
Report No. 16-01 / March 2016 3
Chapter 1: Introduction
Offi ce of Information Management and Technology (OIMT) and Offi ce of Enterprise Technology Services (ETS)
The Offi ce of Information Management and Technology is budgeted under the Department of Accounting and General Services’ program ID AGS130. Its purpose is to assist state agencies in the effective, effi cient, and convenient delivery of programs and services to the public through business process reengineering and IT services. As of late 2015, OIMT is now operating as the Offi ce of Enterprise Technology Services. The reorganization has yet to be formalized, but according to the CIO’s 2015 annual report, the two agencies—OIMT and ICSD—have already begun working as one under ETS.
According to its website, ETS is led by the CIO and provides governance for IT modernization and transformation efforts for the executive branch. Shortly after taking his position in 2015, the CIO announced the initiation of efforts to consolidate OIMT and ICSD to form a unifi ed team under ETS. The reorganization is to centralize and better synchronize the State’s modernization and IT workforce development efforts while ensuring continuity of service and security. The new ETS offi ce focuses on six CIO priorities to facilitating effective, effi cient, and open government, namely: IT workforce development, IT governance, enterprise shared services (service-oriented infrastructure), enterprise projects and programs, open government, and cyber security.
At the time of our work, OIMT/ETS was already calling itself ETS and this is how we will refer to the agency in this report.
Prior Reports We have issued two reports related to information technology, both in 2009.
Our Audit of the State of Hawai‘i’s Information Technology: Who’s in Charge? (Report No. 09-06) found that the State’s IT leaders provided weak and ineffective management and the State no longer had a lead agency for IT. We recommended, among other things, that the governor formally assign responsibility for the development and execution of the IT strategic plan to a State chief information offi cer. Our recommendations were implemented by Act 200, SLH 2010, which established a full-time state CIO and an Information Technology Steering Committee.
Our Management Audit of Information Technology Within the Offi ce of Hawaiian Affairs (Report No. 09-08) found that OHA did not fully recognize the need for information systems to be managed at a strategic level and critical elements of sound IT governance were still missing.
4 Report No. 16-01 / March 2016
Chapter 1: Introduction
Objectives of the Engagement
1. Provide the Legislature with a more complete picture of short-term operating expenditures and long-term capital investments in information technology to enable strategic decisionmaking on future projects.
2. Make recommendations as appropriate.
Scope and Methodology
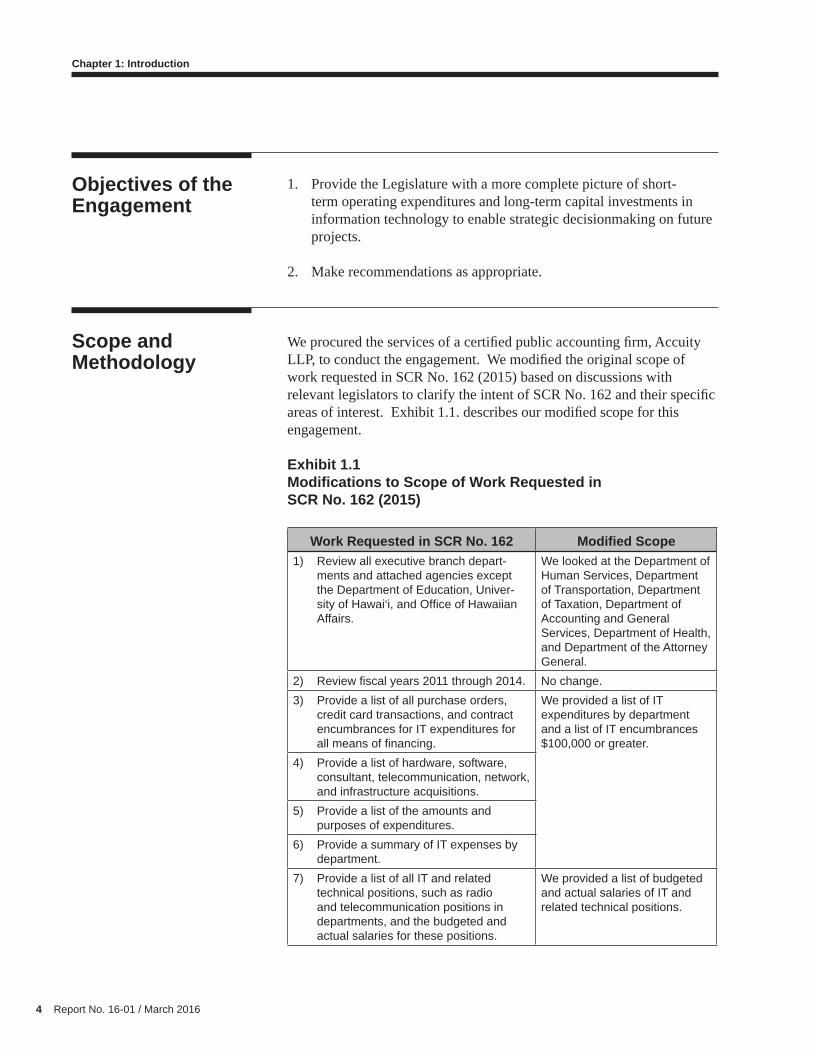
We procured the services of a certifi ed public accounting fi rm, Accuity LLP, to conduct the engagement. We modifi ed the original scope of work requested in SCR No. 162 (2015) based on discussions with relevant legislators to clarify the intent of SCR No. 162 and their specifi c areas of interest. Exhibit 1.1. describes our modifi ed scope for this engagement.
Exhibit 1.1Modifi cations to Scope of Work Requested inSCR No. 162 (2015)
Work Requested in SCR No. 162 Modifi ed Scope1) Review all executive branch depart-
ments and attached agencies except the Department of Education, Univer-sity of Hawai‘i, and Offi ce of Hawaiian Affairs.
We looked at the Department of Human Services, Department of Transportation, Department of Taxation, Department of Accounting and General Services, Department of Health, and Department of the Attorney General.
2) Review fi scal years 2011 through 2014. No change.3) Provide a list of all purchase orders,
credit card transactions, and contract encumbrances for IT expenditures for all means of fi nancing.
We provided a list of IT expenditures by department and a list of IT encumbrances $100,000 or greater.
4) Provide a list of hardware, software, consultant, telecommunication, network, and infrastructure acquisitions.
5) Provide a list of the amounts and purposes of expenditures.
6) Provide a summary of IT expenses by department.
7) Provide a list of all IT and related technical positions, such as radio and telecommunication positions in departments, and the budgeted and actual salaries for these positions.
We provided a list of budgeted and actual salaries of IT and related technical positions.
Report No. 16-01 / March 2016 5
Chapter 1: Introduction
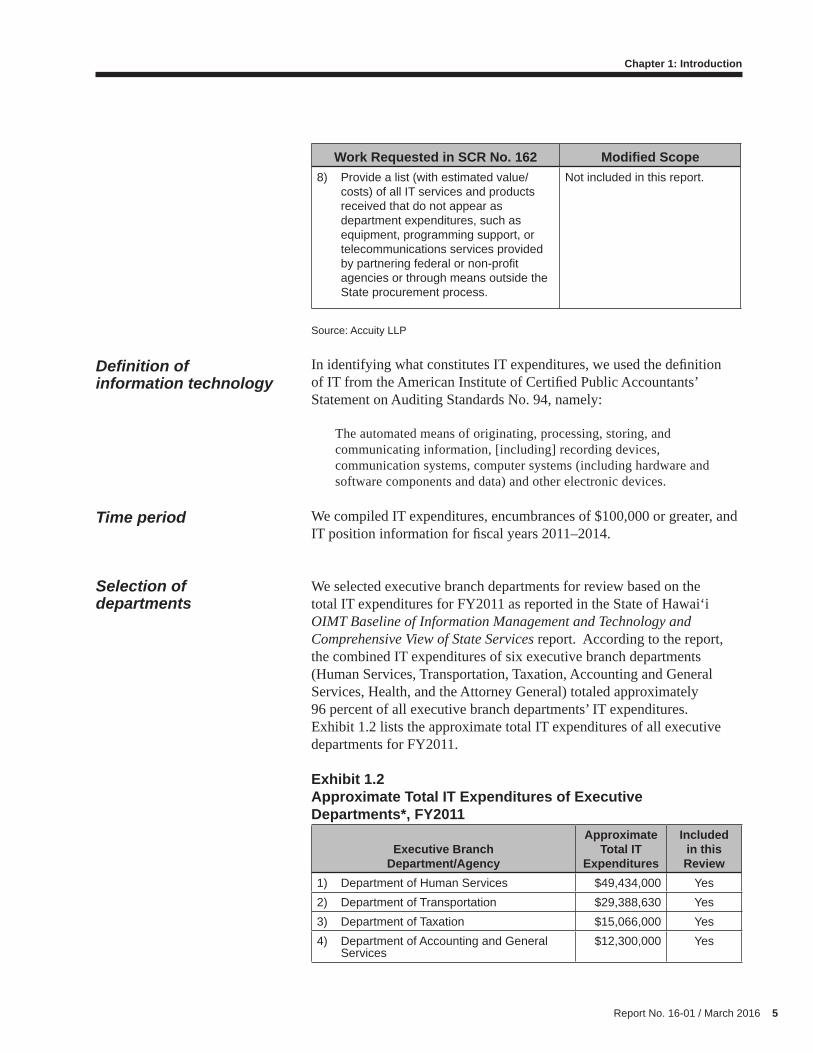
Work Requested in SCR No. 162 Modifi ed Scope8) Provide a list (with estimated value/
costs) of all IT services and products received that do not appear as department expenditures, such as equipment, programming support, or telecommunications services provided by partnering federal or non-profi t agencies or through means outside the State procurement process.
Not included in this report.
Source: Accuity LLP
Defi nition of information technology
In identifying what constitutes IT expenditures, we used the defi nition of IT from the American Institute of Certifi ed Public Accountants’ Statement on Auditing Standards No. 94, namely:
The automated means of originating, processing, storing, and communicating information, [including] recording devices, communication systems, computer systems (including hardware and software components and data) and other electronic devices.
Time period We compiled IT expenditures, encumbrances of $100,000 or greater, and IT position information for fi scal years 2011–2014.
Selection of departments
We selected executive branch departments for review based on the total IT expenditures for FY2011 as reported in the State of Hawai‘i OIMT Baseline of Information Management and Technology and Comprehensive View of State Services report. According to the report, the combined IT expenditures of six executive branch departments (Human Services, Transportation, Taxation, Accounting and General Services, Health, and the Attorney General) totaled approximately 96 percent of all executive branch departments’ IT expenditures. Exhibit 1.2 lists the approximate total IT expenditures of all executive departments for FY2011.
Exhibit 1.2Approximate Total IT Expenditures of Executive Departments*, FY2011
Executive BranchDepartment/Agency
Approximate Total IT
Expenditures
Included in this Review
1) Department of Human Services $49,434,000 Yes2) Department of Transportation $29,388,630 Yes3) Department of Taxation $15,066,000 Yes4) Department of Accounting and General
Services$12,300,000 Yes

6 Report No. 16-01 / March 2016
Chapter 1: Introduction
Executive BranchDepartment/Agency
Approximate Total IT
Expenditures
Included in this Review
5) Department of Health $12,000,000 Yes6) Department of the Attorney General $8,300,000 Yes7) Department of Commerce and Consumer
Affairs$1,600,000
8) Department of Land and NaturalResources
$775,000
9) Department of Labor and IndustrialRelations
$500,000
10) Department of Human ResourcesDevelopment
$480,000
11) Department of Business, EconomicDevelopment and Tourism
$460,000
12) Department of Public Safety $230,00013) Department of Hawaiian Home Lands $200,00014) Department of Defense $178,00015) Department of Budget and Finance $110,00016) Offi ce of the Governor and Offi ce of the
Lieutenant Governor$97,000
17) Department of Agriculture $67,000Total $131,185,630
*Excluding the Department of Education, University of Hawai‘i, and Offi ce of Hawaiian Affairs.
Source: Accuity LLP
Compilation procedures
We met with relevant members of the Legislature to fi nalize the scope of work and specifi c areas of interest. We met with the six selected departments and their attached agencies and the Department of Human Resources Development to gain an understanding of how IT procurement and position information is processed and maintained, and how best to obtain budgeted and actual personnel information. We also met with ETS. Based on our discussions, we compiled each set of IT information as follows.
IT expenditures
ETS assisted us with compiling a list of known general IT and radio vendors used by the State. We disseminated this list of 164 vendors to the six departments for them to identify additional vendors they used that incurred expenditures of more than $100,000. We then identifi ed the amounts paid to each vendor by department for fi scal years 2011–2014. Summarized and detailed IT expenditure data for departments and vendors is shown in Exhibit 2.2 and Appendices A and B.

Report No. 16-01 / March 2016 7
Chapter 1: Introduction
IT encumbrances of $100,000 or greater
We obtained encumbrance reports for the six departments for fi scal years 2011–2014 that listed the date encumbrances were executed and remaining encumbered balances. We sorted this data and compared general and signifi cant department-specifi c IT vendors to vendors in the encumbrance reports. We identifi ed encumbrance balances of IT vendors totaling $100,000 or more at June 30, 2010 and executed encumbrances for IT vendors totaling $100,000 or more for fi scal years 2011–2014. Summarized and detailed IT encumbrances of $100,000 or greater by department and vendor for fi scal years 2011–2014 are listed in Appendices C and D.
IT and related technical positions
The Department of Human Resources Development and the Department of Budget and Finance helped us generate an initial list of IT and related technical positions by department for fi scal years 2011– 2014, along with budgeted salaries. We forwarded these lists to the six departments and asked that they include actual salaries for each position and provide their IT organizational charts for fi scal years 2011–2014. We discussed anomalies (for example, duplicate position numbers and IT-related positions listed on organizational charts that were not in the raw data) with the six departments, and updated our data accordingly. Summarized and detailed budgeted and actual salaries of IT and related technical positions for fi scal years 2011-2014 are listed in Appendix E.
Our work was performed from May 2015 through December 2015.
8 Report No. 16-01 / March 2016
Chapter 1: Introduction
This page is intentionally left blank.

Report No. 16-01 / March 2016 9
Chapter 2IT Reform Efforts Must Begin With Good Accounting Practices
On March 30, 2015, the State of Hawai‘i’s then-chief information officer (CIO) submitted testimony in support of Senate Concurrent Resolution (SCR) No. 162, which asked the Auditor to conduct a financial audit of information technology (IT) expenditures in the State’s executive branch. The then-CIO wrote that while his office monitored some IT spending in state government, a comprehensive financial audit of executive branch expenditures would greatly help his office to plan enterprise technology budgets that would improve the coordination and integration of business processes and technology spending throughout state government. In addition, the then-CIO concurred with the resolution’s contention that compiling an accurate and up-to-date IT investment portfolio of the executive branch would provide a “complete picture” of technology investments, which would be necessary to make strategic decisions for reducing recurring IT costs.
We agree that a comprehensive and up-to-date IT inventory, or investment portfolio, is integral to an effective reform effort; however, we found that such an undertaking is premature and must begin at a more foundational level—specifically, with fundamental changes to how the State defines, categorizes, and reports IT expenditures. In other words, the State needs to start with good, basic accounting practices. For instance, in our effort to collect and compile IT expenditure data, we found that departments have varying interpretations of which goods and services constitute “IT expenditures.” Some departments narrowly define IT costs, including only moneys spent on the purchase and maintenance of computer and telecommunications equipment. Others take a broader view, including ancillary expenditures such as construction and leasing costs for facilities that house IT equipment, as well as utility bills for those facilities. In addition, how IT expenditures are recorded and reported also varies widely across state government. We found IT expenditures were accounted for under everything from “general office supplies” to “membership dues” and even “janitorial services.”
As a result of this lack of standardization, IT expenditure data are spread throughout dozens of unrelated categories, (known in accounting as object codes); and an accurate and comprehensive compilation of these costs would be extremely time consuming, if not impossible, to complete. Therefore, the schedules of IT expenditures, personnel costs, and contract encumbrances contained in this report represent only a partial and approximate accounting of IT expenditures from selected departments.

10 Report No. 16-01 / March 2016
Chapter 2: IT Reform Efforts Must Begin With Good Accounting Practices
In contrast to departments’ accounting of IT expenditures, we found their accounting of IT staffing is more consistent and straightforward. When we compared staffing data with IT expenditures, we found that while IT expenditures have increased significantly, IT staffing has flattened out. We also found that a handful of IT vendors are providing goods and services to a majority of the departments we surveyed.
Summary of Findings
1. The definition, categorization, and recording of information technology expenditures vary widely throughout state government.
2. IT staffing has flattened out while overall spending continues to increase.
3. A small group of vendors provides IT goods and services to a majority of the departments we surveyed.
Since the State does not require its executive branch departments and attached agencies to report IT expenditures, we anticipated that departments would account for IT expenditure under a wide variety of categories. In preparation for these differences, we met with the Department of Accounting and General Services (DAGS) to find out what information we could request from executive branch departments to capture their IT expenditures, encumbrances, and position information. DAGS informed us that all state expenditures (IT and non-IT) are captured within object codes; however, each department uses different object codes to record expenditures for similar goods and services. As a result, we asked departments to identify their IT expenditures (by specific object code) and encumbrances of at least $100,000 for fiscal years 2011–2014. We also provided departments with a guide to IT expenditures, which included the American Institute of Certified Public Accountants’ (AICPA) definition of information technology.1
However, this compilation of IT data produced expenditure numbers much lower than anticipated, which necessitated follow-up to capture additional costs. Expenditures from our second effort were about 130 percent greater than those from our initial request, indicating departments are unclear about what comprises an IT expenditure. We also found that the number and variety of object codes used to account
1 The AICPA defines IT as “the automated means of originating, processing, storing, and communicating information, and includes recording devices, communication systems (including hardware and software components and data) and other electronic devices.”
Definition, Categorization, and Recording of IT Expenditures Vary Widely Throughout State Government

Report No. 16-01 / March 2016 11
Chapter 2: IT Reform Efforts Must Begin With Good Accounting Practices
for IT expenditures varies widely among departments and agencies. This lack of standardization makes it impossible for the State to compile a comprehensive and accurate inventory of IT resources.
Departments’ initial report of IT expenditures was only 44 percent of the final compilation of data
In response to our first request, the six departments submitted IT expenditure data totaling approximately $156 million for fiscal years 2011–2014. Exhibit 2.1 summarizes these expenditures by department.
Exhibit 2.1IT Expenditures as Initially Reported, by Department, FY2011–FY2014
Department FY2011 FY2012 FY2013 FY2014 TotalAccounting and General Services $5,697,496 $5,957,684 $13,685,991 $31,501,167 $56,842,338Attorney General 5,423,002 4,370,129 4,490,466 3,718,825 18,002,422Health 8,601,375 8,579,289 6,868,604 9,923,950 33,973,218Human Services 2,794,270 6,209,891 4,569,684 5,327,229 18,901,074Taxation 596,835 638,509 722,994 1,067,084 3,025,422Transportation 5,952,972 6,887,615 7,806,288 5,032,961 25,679,836Total $29,065,950 $32,643,117 $38,144,027 $56,571,216 $156,424,310
Source: Office of the Auditor
The Office of Enterprise Technology Services (ETS) reviewed these numbers and concluded that the reported IT costs were significantly less than what they had anticipated, questioning whether the departments had included all expenditures paid to IT service providers. ETS gave us a list of approximately 100 IT vendors, excluding radio vendors, that do, or have done, work with the State. We provided the ETS list to the departments and requested they identify any additional department-specific IT or radio vendors with significant expenditures. Upon updating the ETS list for additional IT or radio vendors identified by the departments, we compiled the amounts paid to each vendor for fiscal years 2011–2014.
The results of our compilation were significantly different from the IT expenditure data initially provided by the six departments. Overall, IT expenditures were revised considerably upward, from $156.4 million to $359.6 million, an increase of approximately 130 percent. The revisions by each department varied widely. The Department of Human Services had the biggest difference, reporting total IT expenditures of $160.4 million, which was nearly 750 percent over its original estimate of $18.9 million. The Department of Transportation’s revised expenditures totaled $53.7 million, more than double its original report

12 Report No. 16-01 / March 2016
Chapter 2: IT Reform Efforts Must Begin With Good Accounting Practices
of $25.6 million. The Department of Health’s revised expenditures increased a little more than 50 percent, from $33.9 million to $51.1 million. Only the Department of the Attorney General revised its numbers downward, from $18.9 million to $13.1 million. Exhibit 2.2 summarizes the departments’ revised expenditures.
Exhibit 2.2Departments’ Revised IT Expenditures, FY2011–FY2014
Department FY2011 FY2012 FY2013 FY2014 TotalAccounting and General Services $13,828,952 $10,304,934 $17,445,407 $35,911,726 $77,491,019Attorney General 4,096,886 3,082,150 3,433,579 2,533,579 13,146,194Health 7,440,333 13,059,375 16,278,223 14,343,141 51,121,072Human Services 16,896,561 17,858,799 54,041,907 71,620,546 160,417,813Taxation 637,154 697,420 760,030 1,525,411 3,620,015Transportation 9,470,331 13,283,998 16,821,669 14,208,121 53,784,119Total $52,370,217 $58,286,676 $108,780,815 $140,142,524 $359,580,232
Source: Office of the Auditor
We did not inquire about the reasons for these discrepancies. However, the significant differences show there is a lack of understanding by departments as to which goods and services constitute IT expenditures.
Number and variety of object codes vary widely from department to department
We also found that the number of object codes used by departments to categorize their IT expenditures varies significantly, ranging from as many as 66 different codes used by the Department of Human Services (DHS) to as few as seven by the Department of Taxation (TAX). The Department of the Attorney General (ATG) uses 49 codes; DAGS uses 17 codes; the Department of Health (DOH), eight codes; and the Department of Transportation (DOT), 25 codes. Exhibit 2.3 illustrates the range of number of object codes used by departments to account for their IT expenditures.

Report No. 16-01 / March 2016 13
Chapter 2: IT Reform Efforts Must Begin With Good Accounting Practices
Exhibit 2.3Number of IT Object Codes used by Departments
Source: Office of the Auditor
The object codes used by departments to account for their IT expenditures capture a wide variety of goods and services. Some codes are simple and straightforward, like the Department of Health’s codes for “software,” “hardware,” and “repair/maintenance service.” Exhibit 2.4 lists DOH’s IT-related object codes.
Exhibit 2.4Department of Health IT-Related Object Codes
Object Code Description3520 Software 3810 Phones - Land Lines3812 Cellphones and Wireless5490 Internet / Network Services5820 Hardware5890 Repair / Maintenance Service7190 Contract Services7290 Miscellaneous Expenses
Source: Office of the Auditor
Other departments, however, define IT costs more broadly. Some include ancillary expenditures such as the cost of printers or improvements to buildings that house IT equipment. Four of the six departments we surveyed listed air conditioning as an IT expense. As highlighted in Exhibit 2.5, other codes used for IT expenditures include “general office supplies,” “membership dues,” and even “mileage,” travel costs, parking permits, and “janitorial services.”
0
10
20
30
40
50
60
70
ATG DAGS DOH DHS DOT TAX
No. of IT Object Codes

14 Report No. 16-01 / March 2016
Chapter 2: IT Reform Efforts Must Begin With Good Accounting Practices
Exhibit 2.5Department of the Attorney General IT-Related Object Codes
Object Code Description3200 General Office Supplies3290 Other Stationery and Office Supplies3400 Other supplies3400 Computer Supplies3500 Membership Dues3510 Web content subscription3600 Freight and Delivery Charges3800 Telephone3800 Telephone lines3801 Telephone conference calls3806 Teleprocessing lines, computer circuits3810 Cellular Phone Charges4100 Mileage4110 Car mileage-employees4200 Transportation-In-State4210 Transportation-In-State-Employees4310 Per-Diem and Subsistence-In-state - Employees4710 Motor Pool Cars, parking permits (DAGS/Auto Mgmt.)4803 Miscellaneous Travel Costs, In State4805 Miscellaneous Travel Costs, Out-Of-State5401 Cable services5501 Office Rental-DAGS Leasing5506 Parking Stalls-rental-DAGS-Parking Permits5603 Other Computer Usage5630 Equipment Rental - Computer Usage5850 Repairs and maintenance - Data Processing Equipment5860 Repairs and maintenance - Data Processing Software5890 Repairs and Maintenance-Other Repairs and Maintenance7112 Professional Fees - Other Experts7114 Professional Fees - Computer Experts7135 Services on Fee Basis-Locate Fees7150 Consultant Fees7173 Janitorial Services7198 Other Services on Fee Basis7200 Other Current Expenses7200 Miscellaneous Expenses7201 Other Current Expenses-Registration Fees7207 Document Verification (SAVE)7209 NCIC User Fees

Report No. 16-01 / March 2016 15
Chapter 2: IT Reform Efforts Must Begin With Good Accounting Practices
Object Code Description7230 Other Current Expenses-Non-Asset-Books7244 Non-asset Computer Hardware (<$1,000.00)7246 Non-asset Computer Related (<$1,000.00)7247 Non-asset Software (<$1,000.00)7300 Interest Charge7700 Equipment - Switches NGN 35607744 Computer Hardware7746 Machinery and Equipment-Miscellaneous computer related7747 Computer Software7790 Other Machinery and Equipment
Source: Office of the Auditor
Without uniform designations for IT expenditures as well as policies and procedures on how and where to account for those expenditures, it is impossible to accurately calculate the State’s overall IT costs.
IT Staffing Has Flattened Out While Overall Spending Continues To Increase
Before we surveyed departments about their IT personnel we met with the Department of Human Resources Development (DHRD), which compiled an initial list of IT positions. DHRD told us that, like IT expenditures, budgeted and actual IT position information is maintained by each department. However, in contrast to the State’s numerous IT-related object codes, which lack clarity, IT-related position designations are standardized, conforming to state budgeting requirements and making their tracking more straightforward.
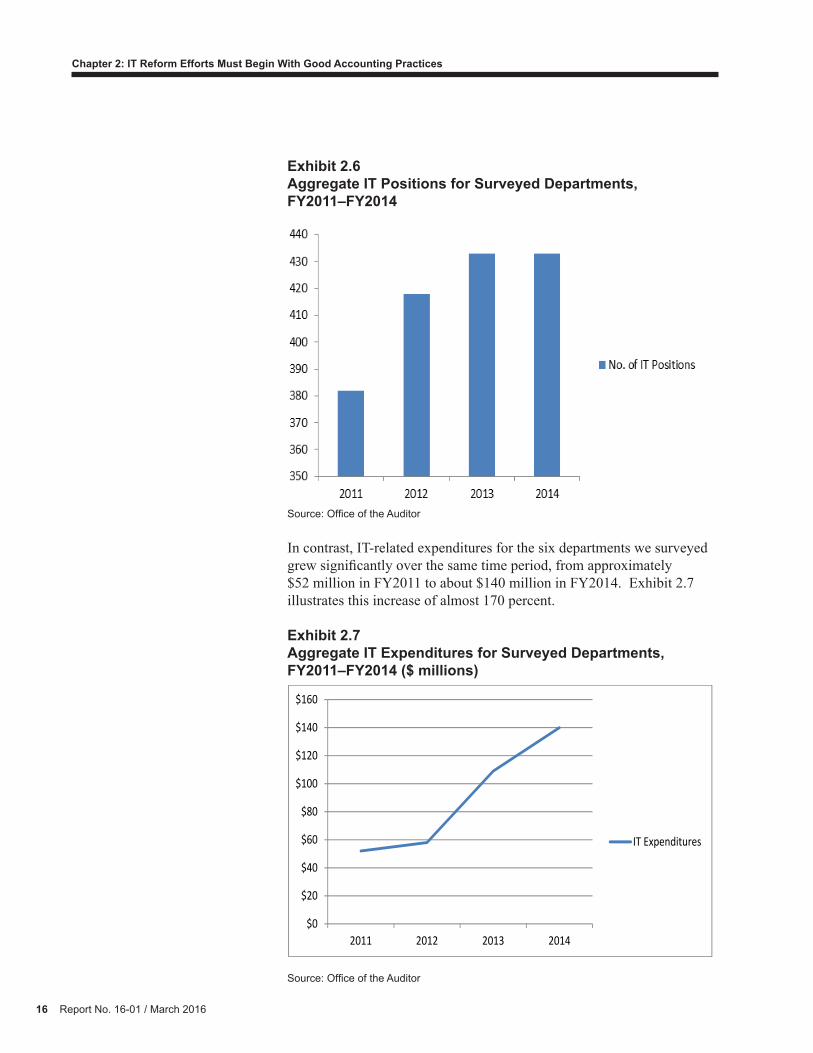
Overall, IT-related staffing increased about 13 percent over the four-year time period we surveyed and has flattened out in the last several years. After experiencing modest growth, from 382 in FY2011 to 418 in FY2012, IT-related positions remained steady in FY2013 and FY2014 at 433 positions. Exhibit 2.6 illustrates the total number of IT-related positions reported by the six departments we surveyed.
16 Report No. 16-01 / March 2016
Chapter 2: IT Reform Efforts Must Begin With Good Accounting Practices
Exhibit 2.6Aggregate IT Positions for Surveyed Departments,FY2011–FY2014
Source: Office of the Auditor
In contrast, IT-related expenditures for the six departments we surveyed grew significantly over the same time period, from approximately $52 million in FY2011 to about $140 million in FY2014. Exhibit 2.7 illustrates this increase of almost 170 percent.
Exhibit 2.7Aggregate IT Expenditures for Surveyed Departments, FY2011–FY2014 ($ millions)
$0
$20
$40
$60
$80
$100
$120
$140
$160
2011 2012 2013 2014
IT Expenditures
Source: Office of the Auditor

Report No. 16-01 / March 2016 17
Chapter 2: IT Reform Efforts Must Begin With Good Accounting Practices
A Small Group of Vendors Provides IT Goods and Services to a Majority of the Departments Surveyed
After sorting departments’ revised IT expenditures, which included expenditures paid to IT service providers, we noted that six of the top ten IT vendors provided goods and services to a majority of the departments we surveyed. The top vendor providing services to multiple departments was Gartner, Inc., which accounted for total encumbrances of over $17.5 million from four departments in just two fiscal years, FY2013 and FY2014. En Pointe Technologies Sales accounted for more than $16.6 million in encumbrances from four departments in the three fiscal years from FY2012 to FY2014. IBM Corporation, with a total of $12.5 million in encumbrances, and EWorld Enterprise Solutions, with $11 million in encumbrances, also provided goods and services to a majority of the departments we surveyed. Exhibit 2.8 lists the top ten vendors that provided IT goods and services to the departments we surveyed.
Exhibit 2.8Top Vendor Encumbrances, FY2011–FY2014
Vendor Name / Department FY2011 FY2012 FY2013 FY2014
Total Encumbrances
KPMG LLP - - $89,941,995 $24,481,385 $114,423,380DHS - - 89,941,995 24,481,385 114,423,380
Arizona Health Care Cost $5,000,000 $7,000,000 $8,000,000 $8,920,639 $28,920,639
DHS 5,000,000 7,000,000 8,000,000 8,920,639 28,920,639Gartner, Inc. - - $3,806,296 $13,713,406 $17,519,702
DAGS - - 3,806,296 8,258,575 12,064,871DHS - - 2,467,550 2,467,550DOT - - - 2,611,421 2,611,421TAX - - - 375,860 375,860
En Pointe Technologies Sales - $1,341,981 $2,611,865 $12,697,438 $16,651,284
DAGS - 557,002 1,943,827 9,872,751 12,373,580DHS - 463,341 668,038 2,643,927 3,775,306DOH - 192,208 - 180,760 372,968DOT - 129,430 - - 129,430
IBM Corporation $1,610,977 $2,876,476 $3,225,099 $4,838,844 $12,551,396DAGS 1,219,419 1,152,889 1,852,237 3,515,887 7,740,432DHS 261,029 1,485,012 968,475 999,346 3,713,862DOT 130,529 238,575 404,387 323,611 1,097,102
Eworld Enterprise Solutions $1,220,820 $4,675,015 $2,554,634 $2,643,085 $11,093,554
ATG - - - 144,200 144,200

18 Report No. 16-01 / March 2016
Chapter 2: IT Reform Efforts Must Begin With Good Accounting Practices
Vendor Name / Department FY2011 FY2012 FY2013 FY2014
Total Encumbrances
DAGS - 267,195 751,434 1,151,530 2,170,159DHS 498,400 3,610,400 856,400 948,400 5,913,600DOT 722,420 797,420 946,800 398,955 2,865,595
Oahu Air Conditioning Service $2,471,572 $4,685,490 $2,611,211 $994,240 $10,762,513
DAGS 505,750 476,920 386,189 493,218 1,862,077DOT 1,965,822 4,208,570 2,225,022 501,022 8,900,436
Hart Intercivic, Inc. $2,550,000 $3,450,000 - $3,450,000 $9,450,000DAGS 2,550,000 3,450,000 - 3,450,000 9,450,000
Hawaiian Telcom $1,661,465 $2,364,747 $2,728,534 $2,095,481 $8,850,227DAGS 556,496 962,507 1,030,404 1,257,216 3,806,623DHS 252,386 470,364 - 108,686 831,436DOH 209,597 219,764 154,512 110,095 693,968DOT 642,986 712,112 1,543,618 441,894 3,340,610TAX - - - 177,590 177,590
Pacific Wireless $3,196,024 $1,571,210 $1,953,295 $1,477,213 $8,197,742DAGS 260,815 255,103 348,216 494,246 1,358,380DOH 2,675,219 896,531 1,075,664 586,769 5,234,183DOT 259,990 419,576 529,415 396,198 1,605,179
Source: Office of the Auditor
When we met with the current CIO to discuss our initial findings of selected departments’ IT expenditures, he shared some of his concerns regarding wasteful IT spending throughout state government. Specifically, he said that a relatively small group of IT vendors may be providing goods and services for a majority of executive branch departments. He told us these vendors offer easily accessible menus of products and service but may not represent the best value for the State. Effective December 10, 2015, the State’s new IT governance process, which requires departments to process IT contracts of $1 million or more through the ETS, is designed to address this need to share IT information and expertise throughout state government.
Conclusion The lack of a statewide definition of what constitutes IT goods and services, coupled with inconsistent coding of IT expenditures, makes it extremely difficult if not impossible for the State to assemble an accurate inventory of its IT resources. In addition, without an annual reporting requirement to a central agency, the State is unable to manage its IT resources in the short term or plan for long-term IT growth. Although this report on IT data from selected departments does not match SCR

Report No. 16-01 / March 2016 19
Chapter 2: IT Reform Efforts Must Begin With Good Accounting Practices
No. 162’s original request to conduct a financial audit of State IT expenditures, our report presents relevant data on spending and staffing and is an initial and important step towards statewide IT reform.
Recommendations 1. The Office of Enterprise Technology Services should be the central agency to establish policies and procedures over IT governance statewide. This is consistent with the governor’s December 10, 2015, announcement that ETS be the lead agency for IT planning and procurement.
2. The Office of Enterprise Technology Services should:
a. Establish a statewide definition for IT that clearly defines what ETS considers IT costs;
b. Provide statewide training to fiscal personnel to ensure all IT costs are consistently recorded to assigned object codes;
c. Require annual reporting by all departments to report IT assets, expenditures, contracts, and personnel costs and positions to facilitate decisionmaking; and
d. Incorporate ETS into the IT budgeting process and ETS oversight into significant IT contracts and expenditures to ensure these activities align with the State’s overall IT strategic plan.

20 Report No. 16-01 / March 2016
Chapter 2: IT Reform Efforts Must Begin With Good Accounting Practices
This page is intentionally left blank.

Report No. 16-01 / March 2016 21
Chapter 3Independent Accountant’s Report
This chapter presents the independent accountant’s report issued by Accuity LLP on the compilation of data regarding information technology expenditures, encumbrances, and job positions forFY2011–2014.
Independent Accountant’s Report
Accuity LLP (“Accuity”) has been contracted by the State of Hawai‘i (the “State”), Offi ce of the Auditor, to compile data regarding information technology expenditures, encumbrances, and job positions for FY2011–2014 pursuant to Senate Concurrent Resolution No. 162 (2015) for the following executive branch departments and their attached agencies:
• Department of Accounting and General Services
• Department of the Attorney General
• Department of Health
• Department of Human Services
• Department of Taxation
• Department of Transportation.
We performed the engagement in accordance with Statement on Standards for Consulting Services promulgated by the American Institute of Certifi ed Public Accountants. We did not audit or review the data provided by the State, nor were we required to perform any procedures to verify the accuracy or completeness of the information provided by the State. Accordingly, we do not express an opinion, a conclusion, or provide any form of assurance on the compiled data.
/s/ Accuity LLPHonolulu, Hawai‘iJanuary 21, 2016

22 Report No. 16-01 / March 2016
Chapter 3: Independent Accountant’s Report
This page is intentionally left blank.

Report No. 16-01 / March 2016 23
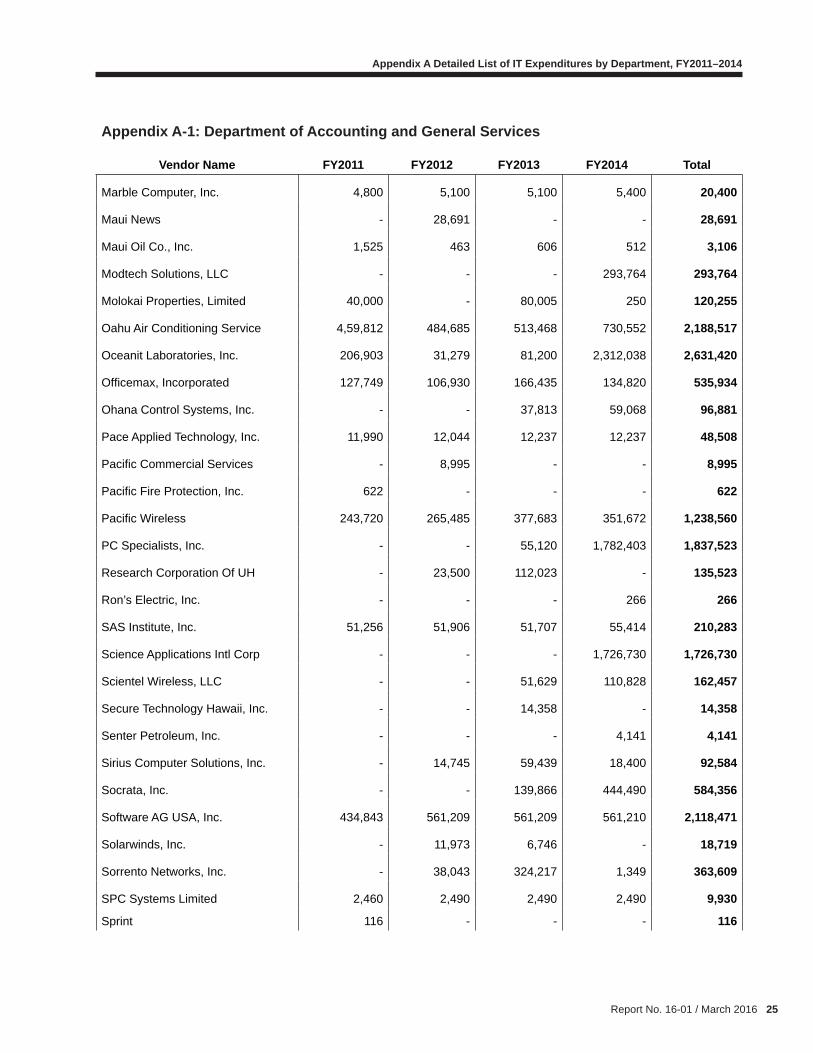
Appendix ADetailed List of IT Expenditures by Department, FY2011–2014Appendix A-1: Department of Accounting and General Services
Vendor Name FY2011 FY2012 FY2013 FY2014 Total
ADI Design Group, Inc. $ 3,883 $ - $ - $ - $ 3,883
Advanced Micro-Image Systems - - 8,286 - 8,286
Air Conditioning Hawaii - - - 3,787 3,787
Alexander Gow Fire - - - 165,731 165,731
Allen Systems Group, Inc. 47,744 31,808 - 52,519 132,071
Apple, Inc. - 9,272 58,684 7,830 75,786
Arisumi Brothers, Inc. 206,942 254,606 221,872 130,147 813,567
Audio Visual Company - - - 27,556 27,556
Autodesk, Inc. 128,543 82,163 - 66,416 277,122
Aviat U. S., Inc. 1,045,476 1,499,278 1,237,433 - 3,782,187
Axway, Inc. - 101,028 510,009 114,538 725,575
BT Conferencing Video, Inc. 27,266 178,988 79,572 - 285,826
C & A Generator Services, Inc. 35,743 33,898 45,365 34,248 149,254
CA, Inc. 232,996 232,996 232,996 - 698,988
Catalano & Plache, PLLC - - - 34,022 34,022
CDW Government, Inc. - 39,187 9,497 8,541 57,225
Chicago-Soft, Ltd. 5,680 5,850 6,084 6,296 23,910
Christiansen, John R. - - - 24,090 24,090
Civic Initiatives, LLC - - 90,000 272,195 362,195
Commercial Data Systems, Inc. 299,673 29,967 - - 329,640
Comsearch 6,760 15,942 7,978 3,060 33,740
Cummins Pacifi c, LLC - - - 6,035 6,035
Dell Marketing, LP 608,675 202,564 119,525 125,881 1,056,645
Desktop Solutions, Inc. - - 31,779 198,794 230,573
Dewberry & Davis Service - - 21,231 42,867 64,098
ECS, Inc. 292,037 96,027 254,338 430,945 1,073,347
E. F. Johnson, Co. - - 659,338 57,141 716,479
Electrical Equipment Company - - - 3,574 3,574
En Pointe Technologies Sales - 46,128 1,588,188 6,775,150 8,409,466
Escal Institute Of Advanced Tech - 260 - 2,000 2,260
Esecuritytogo, LLC - - 5,801 1,631 7,432
Esri, Inc. 12,565 576,561 74,111 50,517 713,754
Eworld Enterprise Solutions 74,951 20,803 294,574 1,066,474 1,456,802

24 Report No. 16-01 / March 2016
Appendix A Detailed List of IT Expenditures by Department, FY2011–2014
Appendix A-1: Department of Accounting and General Services
Vendor Name FY2011 FY2012 FY2013 FY2014 Total
Fresh Leadership, LLC - - - 250,000 250,000
Gartner, Inc. - - 2,415,008 3,469,471 5,884,479
Gas Company 41,303 48,362 29,747 - 119,412
General Dynamics Fidelis - - 19,200 138,000 157,200
Grainger 82,825 49,872 95,507 104,959 333,163
Graybar - - - 88,628 88,628
Grove Farm Company, Inc. 12,500 13,295 25,397 479 51,671
Hart Intercivic, Inc. 2,938,267 891,058 864,366 862,624 5,556,315
Hawaii Gas - - 22,116 47,717 69,833
Hawaii Information Consortium 15,000 - 180,775 680,467 876,242
Hawaiian Telcom 868,337 984,355 1,630,139 1,540,000 5,022,831
Hawaiya Technologies, Inc. - - - 19,049 19,049
Hewlett-Packard, Inc. 42,478 46,876 175,056 137,224 401,634
Howard Technology Solutions - - 11,492 - 11,492
HTDC-Maui Research & Tech Ctr. - - - 264,499 264,499
Hualalai Land Corporation - - 48,672 14,976 63,648
IBM Corporation 1,388,633 1,651,918 1,884,668 3,975,801 8,901,020
Innovation Data Processing 4,067 4,067 4,067 4,067 16,268
Iron Bow Technologies, LLC - - - 2,459,716 2,459,716
Island Pacifi c Distributors - 3,997 3,774 4,940 12,711
Islandwide Fencing, Inc. 2,524 - - 4,398 6,922
Kaye Scholer, LLP - - - 400,072 400,072
Lanai Builders, Inc. 240,484 - - 91,200 331,684
Lanai City Service, Inc. 555 515 1,048 991 3,109
Lanai Resorts, LLC - - 6,285 33,444 39,729
Law Offi ces Of Rich Wyde PC - - - 1,164 1,164
Lenovo (United States), Inc. 70,149 41,856 20,719 31,525 164,249
Limpacifi c, Inc. - 3,500 86,970 - 90,470
Lockheed Martin Services, Inc. - - 140,078 - 140,078
Manpower - - - 17,974 17,974
Report No. 16-01 / March 2016 25
Appendix A Detailed List of IT Expenditures by Department, FY2011–2014
Appendix A-1: Department of Accounting and General Services
Vendor Name FY2011 FY2012 FY2013 FY2014 Total
Marble Computer, Inc. 4,800 5,100 5,100 5,400 20,400
Maui News - 28,691 - - 28,691
Maui Oil Co., Inc. 1,525 463 606 512 3,106
Modtech Solutions, LLC - - - 293,764 293,764
Molokai Properties, Limited 40,000 - 80,005 250 120,255
Oahu Air Conditioning Service 4,59,812 484,685 513,468 730,552 2,188,517
Oceanit Laboratories, Inc. 206,903 31,279 81,200 2,312,038 2,631,420
Offi cemax, Incorporated 127,749 106,930 166,435 134,820 535,934
Ohana Control Systems, Inc. - - 37,813 59,068 96,881
Pace Applied Technology, Inc. 11,990 12,044 12,237 12,237 48,508
Pacifi c Commercial Services - 8,995 - - 8,995
Pacifi c Fire Protection, Inc. 622 - - - 622
Pacifi c Wireless 243,720 265,485 377,683 351,672 1,238,560
PC Specialists, Inc. - - 55,120 1,782,403 1,837,523
Research Corporation Of UH - 23,500 112,023 - 135,523
Ron’s Electric, Inc. - - - 266 266
SAS Institute, Inc. 51,256 51,906 51,707 55,414 210,283
Science Applications Intl Corp - - - 1,726,730 1,726,730
Scientel Wireless, LLC - - 51,629 110,828 162,457
Secure Technology Hawaii, Inc. - - 14,358 - 14,358
Senter Petroleum, Inc. - - - 4,141 4,141
Sirius Computer Solutions, Inc. - 14,745 59,439 18,400 92,584
Socrata, Inc. - - 139,866 444,490 584,356
Software AG USA, Inc. 434,843 561,209 561,209 561,210 2,118,471
Solarwinds, Inc. - 11,973 6,746 - 18,719
Sorrento Networks, Inc. - 38,043 324,217 1,349 363,609
SPC Systems Limited 2,460 2,490 2,490 2,490 9,930
Sprint 116 - - - 116

26 Report No. 16-01 / March 2016
Appendix A Detailed List of IT Expenditures by Department, FY2011–2014
Appendix A-1: Department of Accounting and General Services
Vendor Name FY2011 FY2012 FY2013 FY2014 Total
Summit Construction, Inc. 2,648,992 412,546 - - 3,061,538
Technology Integration Group 6,706 48,633 149,859 30,405 235,603
Time Warner Cable, Inc. 17,801 71,204 71,209 71,204 231,418
Treehouse Software Inc. 6,931 49,005 99,895 60,052 215,883
TW Telecom - - 3,003 97,421 100,424
Unicom Systems, Inc. 27,000 - 58,118 - 85,118
Unisys Corporation 34,346 120,653 - 104,728 259,727
University Of Hawaii - - 210,500 1,024,050 1,234,550
Verizon Wireless 6,456 6,295 14,355 21,905 49,011
Viatron Systems, Inc. - - - 221,937 221,937
Vincent Communications, Inc. - - - 24,119 24,119
Wilson Okamoto Corporation 474,780 532,708 300,075 310,737 1,618,300
World Wide Technology, Inc. - - 350,470 712,484 1,062,954
Xerox Corporation 284,088 219,355 312,827 269,280 1,085,550
Total $ 13,828,952 $ 10,304,934 $ 17,445,407 $ 35,911,726 $ 77,491,019
Source: Offi ce of the Auditor
Appendix A-2: Department of the Attorney GeneralVendor Name FY2011 FY2012 FY2013 FY2014 Total
Advanced Micro-Image Systems $ 3,553 $ 2,766 $ 11,012 $ 4,199 $ 21,530
Aloha Data Services, Inc. - - - 129,422 129,422
Apple, Inc. 5,265 4,130 - - 9,395
Bureau Of National Affairs 3,195 12,657 3,529 1,910 21,291
CDW Government, Inc. 16,249 2,880 11,020 4,022 34,171
Century Computers, Inc. 48,241 - - - 48,241
Commerce Solutions, Inc. 55,962 69,618 54,420 - 180,000
Dataimage, Inc. 19,371 289,659 48,042 19,791 376,863
Dell Marketing, LP 648,686 644,596 86,675 89,328 1,469,285
Electrical Equipment Company 677 - - - 677

Report No. 16-01 / March 2016 27
Appendix A Detailed List of IT Expenditures by Department, FY2011–2014
Appendix A-2: Department of the Attorney GeneralVendor Name FY2011 FY2012 FY2013 FY2014 Total
En Pointe Technologies Sales - 56,369 372,111 197,619 626,099
Escal Institute Of Advanced Tech - 95 - - 95
Esri, Inc. - - - 21,888 21,888
Eworld Enterprise Solutions 165,000 45,670 72,600 30,450 313,720
Fresh Leadership, LLC - - - 995 995
Gartner, Inc. 12,122 - 13,272 - 25,394
Hawaii Information Consortium 15,021 46,448 57,572 51,971 171,012
Hawaiian Telcom 251,001 296,141 243,226 305,942 1,096,310
Hewlett Packard, Inc. 127,670 14,572 58,849 4,936 206,027
IBM Corporation 486,537 70,140 63,650 144,392 764,719
ISDI Technologies, Inc. 249,579 - - - 249,579
Island Movers, Inc. 1,169 - - - 1,169
Lenovo (United States), Inc. 15,696 11,694 - 3,246 30,636
Marquis Consulting Services 109,304 300,715 180,520 - 590,539
Maui News 5,702 5,856 3,633 5,239 20,430
Morphotrak, Inc. 356,520 529,675 902,575 511,964 2,300,734
Oahu Air Conditioning Service 1,841 360 - - 2,201
Redmane Technology, LLC 1,095,979 36,019 503,689 679,490 2,315,177
Rematics, LLC 332,510 535,343 594,740 71,909 1,534,502
Search Group, Inc. 32,421 23,930 86,978 173,934 317,263
Sirius Computer Solutions, Inc. - 32,837 13,370 1,252 47,459
Solarwinds, Inc. - - 395 - 395
Sprint 3,312 1,717 52 - 5,081
Technology Integration Group 1,532 7,800 14,907 - 24,239
Treehouse Software, Inc. - 32,042 - 33,927 65,969
Verizon Wireless 579 212 - - 791
Viatron Systems, Inc. - - - 4,999 4,999
Xerox Corporation 32,192 8,209 36,742 40,754 117,897
Total $ 4,096,886 $ 3,082,150 $ 3,433,579 $ 2,533,579 $ 13,146,194
Source: Offi ce of the Auditor

28 Report No. 16-01 / March 2016
Appendix A Detailed List of IT Expenditures by Department, FY2011–2014
Appendix A-3: Department of HealthVendor Name FY2011 FY2012 FY2013 FY2014 Total
Advanced Data Processing, Inc. $ - $ - $ 392,013 $ 911,009 $ 1,303,022
Advanced Micro-Image Systems - 13,167 - - 13,167
Aloha Air Cargo 4,470 1,292 - - 5,762
Apple, Inc. 8,026 - 27,204 3,973 39,203
AT&T Mobility 3,027 2,648 1,362 67,297 74,334
Business Solution - - - 96,533 96,533
CDW Government, Inc. 5,152 22,500 3,916 778,006 809,574
Commercial Data Systems, Inc. 89,572 - - - 89,572
Consilience Software - 1,128,750 446,000 268,491 1,843,241
Dell Marketing, LP 319,554 249,098 45,456 546,829 1,160,937
En Pointe Technologies Sales - 235,037 139,707 713,096 1,087,840
Esri, Inc. 6,230 6,230 - 12,606 25,066
FEI.com, Inc. 323,775 293,870 52,590 763,929 1,434,164
Fresh Leadership, LLC - - 10,000 - 10,000
G4S Secure Solutions (USA), Inc. 501,276 252,093 - - 753,369
Gartner, Inc. - 14,421 40,128 51,310 105,859
Gas Company 231,023 241,865 257,095 - 729,983
Grainger 4,129 4,305 70,447 54,111 132,992
Graybar 898 1,049 - - 1,947
Harmony Information Systems - 152,381 188,273 151,542 492,196
Hawaii Gas - - 82,009 393,738 475,747
Hawaii Information Consortium 83,158 81,104 137,937 75,461 377,660
Hawaiian Telcom, Inc. 537,312 702,842 597,983 1,001,226 2,839,363
Health Monitoring Systems, Inc. - - - 99,924 99,924
Hewlett-Packard, Inc. 412,701 265,369 54,355 22,088 754,513
Hoike Networks, Inc. - 150,485 131,597 554,764 836,846

Report No. 16-01 / March 2016 29
Appendix A Detailed List of IT Expenditures by Department, FY2011–2014
Appendix A-3: Department of HealthVendor Name FY2011 FY2012 FY2013 FY2014 Total
HP Enterprise Services, LLC 302,990 663,214 632,595 424,978 2,023,777
IBM Corporation - 3,112 - 4,553 7,665
InfoMC, Inc. 97,850 455,545 158,235 230,140 941,770
Island Pacifi c Distributors - - - 2,002 2,002
Lanai City Service, Inc. 534 714 718 835 2,801
Lanai Resorts, LLC - - 868 3,533 4,401
Lenovo (United States), Inc. - 356,016 13,497 62,440 431,953
Manpower - - - 290 290
Maui News 186 - - - 186
Maximus Health Services, Inc. - - 113,462 121,941 235,403
Med-Media, Inc. 232,329 567,389 614,803 580,805 1,995,326
Netsmart New York, Inc. 25,848 - - - 25,848
Netsmart Technologies 160,733 128,146 713,497 227,233 1,229,609
Oceanit Laboratories, Inc. 246,741 185,427 133,846 45,751 611,765
Oracle America, Inc. - - 483 1,448 1,931
Pacifi c Commercial Services 2,932 - - - 2,932
Pacifi c Fire Protection, Inc. - 682 - - 682
Pacifi c Wireless 2,455,027 541,344 793,122 1,332,901 5,122,394
PC Specialists, Inc. - - - 3,016 3,016
PKF Pacifi c Hawaii, LLP 416,538 108,513 - - 525,051
RCM Technologies (USA), Inc. - - - 987,901 987,901
Rematics, LLC 41,623 257,900 163,457 141,695 604,675
Research Corporation Of UH - 341,091 59,423 - 400,514
Revacomm, Inc. - - 13,868 10,744 24,612
Ron’s Electric, Inc. 4,853 5,653 2,095 2,150 14,751
Siemens Medical Solutions USA - 3,880,588 8,358,092 1,555,950 13,794,630
Social Solutions Global, Inc. - - - 32,662 32,662
Sprint 7,120 5,619 706 - 13,445

30 Report No. 16-01 / March 2016
Appendix A Detailed List of IT Expenditures by Department, FY2011–2014
Appendix A-3: Department of HealthVendor Name FY2011 FY2012 FY2013 FY2014 Total
Technology Integration Group 7,713 4,507 21,896 4,065 38,181
Time Warner Cable, Inc. - 5,225 5,225 5,225 15,675
University Of Hawaii - 695,012 673,798 982,145 2,350,955
Verizon Wireless 39,539 53,386 56,243 58,796 207,964
Video Warehouse, Inc. 127,958 - - 85,008 212,966
Windsor Solutions, Inc. 708,746 959,948 1,061,208 867,854 3,597,756
Xerox Corporation 30,770 21,838 9,014 1,147 62,769
Total $ 7,440,333 $13,059,375 $ 16,278,223 $ 14,343,141 $ 51,121,072
Source: Offi ce of the Auditor
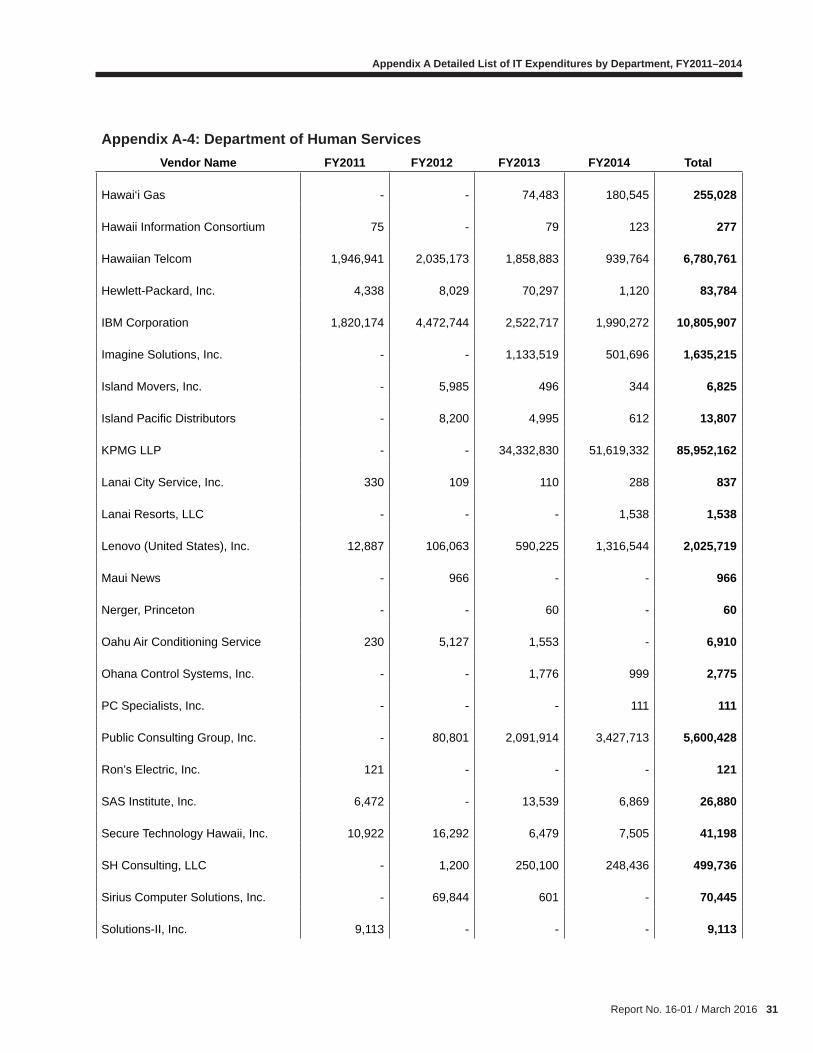
Appendix A-4: Department of Human ServicesVendor Name FY2011 FY2012 FY2013 FY2014 Total
Apple, Inc. $ 12,739 $ 2,073 $ 20,779 $ - $ 35,591
Arizona Health Care Cost 6,222,190 6,995,259 7,070,006 7,080,866 27,368,321
Audio Visual Company - - - 8,648 8,648
Axway, Inc. 36,611 36,614 38,503 - 111,728
CDW Government, Inc. 5,755 - 4,552 - 10,307
Connecting The Dots, LLC - - - 54,675 54,675
Dell Marketing, LP 372,058 123,686 60,926 4,052 560,722
Emphasys Computer Solutions - 69,882 - 82,102 151,984
En Pointe Technologies Sales - 125,828 902,868 1,514,625 2,543,321
Eworld Enterprise Solutions 2,939,659 1,354,909 1,759,113 2,229,362 8,283,043
Gartner, Inc. 18,392 24,558 52,250 35,289 130,489
Gas Company 303,153 266,160 210,071 62,822 842,206
Grainger 19,679 16,463 18,799 16,761 71,702
Graybar 5,183 - 558 - 5,741
Report No. 16-01 / March 2016 31
Appendix A Detailed List of IT Expenditures by Department, FY2011–2014
Appendix A-4: Department of Human ServicesVendor Name FY2011 FY2012 FY2013 FY2014 Total
Hawai‘i Gas - - 74,483 180,545 255,028
Hawaii Information Consortium 75 - 79 123 277
Hawaiian Telcom 1,946,941 2,035,173 1,858,883 939,764 6,780,761
Hewlett-Packard, Inc. 4,338 8,029 70,297 1,120 83,784
IBM Corporation 1,820,174 4,472,744 2,522,717 1,990,272 10,805,907
Imagine Solutions, Inc. - - 1,133,519 501,696 1,635,215
Island Movers, Inc. - 5,985 496 344 6,825
Island Pacifi c Distributors - 8,200 4,995 612 13,807
KPMG LLP - - 34,332,830 51,619,332 85,952,162
Lanai City Service, Inc. 330 109 110 288 837
Lanai Resorts, LLC - - - 1,538 1,538
Lenovo (United States), Inc. 12,887 106,063 590,225 1,316,544 2,025,719
Maui News - 966 - - 966
Nerger, Princeton - - 60 - 60
Oahu Air Conditioning Service 230 5,127 1,553 - 6,910
Ohana Control Systems, Inc. - - 1,776 999 2,775
PC Specialists, Inc. - - - 111 111
Public Consulting Group, Inc. - 80,801 2,091,914 3,427,713 5,600,428
Ron’s Electric, Inc. 121 - - - 121
SAS Institute, Inc. 6,472 - 13,539 6,869 26,880
Secure Technology Hawaii, Inc. 10,922 16,292 6,479 7,505 41,198
SH Consulting, LLC - 1,200 250,100 248,436 499,736
Sirius Computer Solutions, Inc. - 69,844 601 - 70,445
Solutions-II, Inc. 9,113 - - - 9,113

32 Report No. 16-01 / March 2016
Appendix A Detailed List of IT Expenditures by Department, FY2011–2014
Appendix A-4: Department of Human ServicesVendor Name FY2011 FY2012 FY2013 FY2014 Total
Sprint 37,168 25,869 3,061 678 66,776
Technology Integration Group 54,576 55,323 107,580 134,087 351,566
Unicom Systems, Inc. 71,000 53,093 58,343 64,043 246,479
University Of Hawaii 2,412,025 1,278,390 316,699 34,241 4,041,355
Verizon Wireless 753 410 1,676 1,880 4,719
Xerox Corporation 574,017 619,749 461,467 52,604 1,707,837
Total $ 16,896,561 $ 17,858,799 $ 54,041,907 $ 71,620,546 $160,417,813
Source: Offi ce of the Auditor
Appendix A-5: Department of Taxation
Vendor Name FY2011 FY2012 FY2013 FY2014 Total
Advanced Micro-Image Systems $ 2,940 $ 3,202 $ - $ - $ 6,142
Bureau Of National Affairs 25,117 26,056 7,803 25,706 84,682
CDW Government, Inc. 3,337 - - - 3,337
Century Computers, Inc. 126 - - - 126
Dell Marketing, LP 63,123 138,004 40,961 312,603 554,691
EMC Corporation 9,737 6,594 8,167 19,150 43,648
En Pointe Technologies Sales - 149,145 245,091 199,641 593,877
Hawaii Information Consortium - - 143,630 509,898 653,528
Hawaiian Telcom 157,896 151,913 206,693 221,201 737,703
Hewlett-Packard, Inc. 1,818 9,918 - 88,259 99,995
Howard Technology Solutions - 2,848 - 35,687 38,535
IBM Corporation 120,128 - 3,969 - 124,097
Oracle America, Inc. 33,735 46,036 47,491 11,930 139,192
Sprint 46,233 16,919 267 - 63,419
Symago, LLC 60,899 69,884 55,958 101,336 288,077
Xerox Corporation 112,065 76,901 - - 188,966
Total $ 637,154 $ 697,420 $ 760,030 $ 1,525,411 $ 3,620,015
Source: Offi ce of the Auditor
Report No. 16-01 / March 2016 33
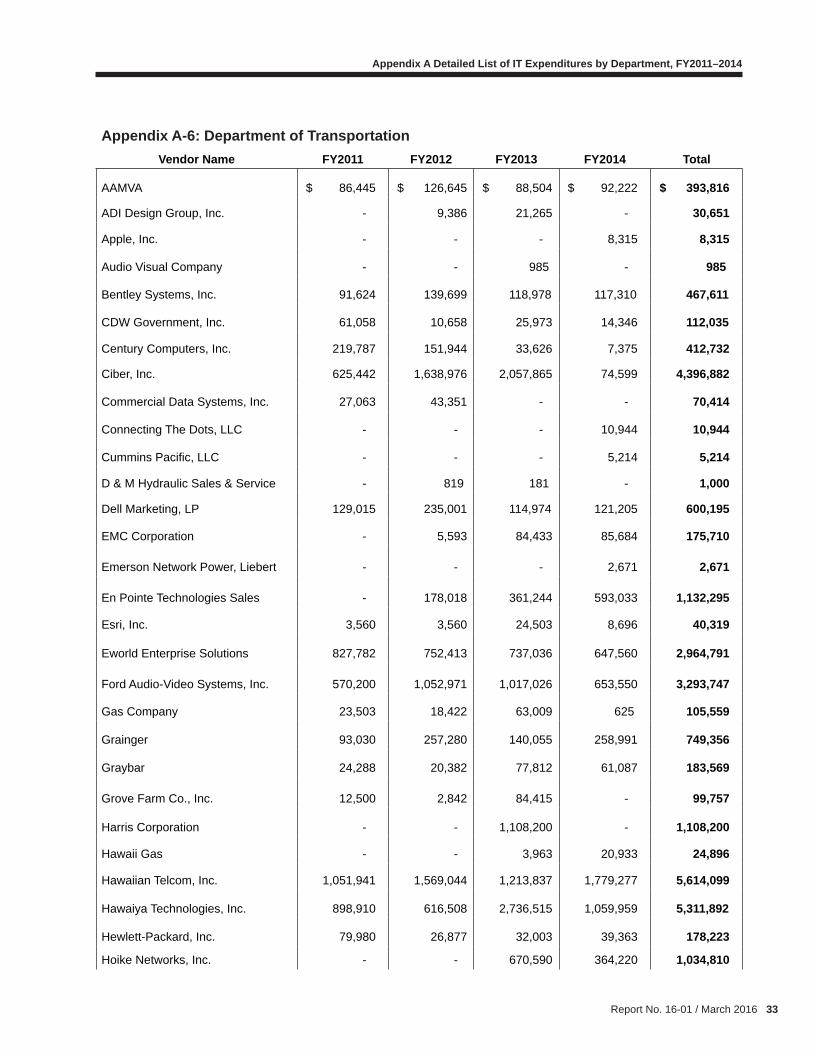
Appendix A Detailed List of IT Expenditures by Department, FY2011–2014
Appendix A-6: Department of TransportationVendor Name FY2011 FY2012 FY2013 FY2014 Total
AAMVA $ 86,445 $ 126,645 $ 88,504 $ 92,222 $ 393,816
ADI Design Group, Inc. - 9,386 21,265 - 30,651
Apple, Inc. - - - 8,315 8,315
Audio Visual Company - - 985 - 985
Bentley Systems, Inc. 91,624 139,699 118,978 117,310 467,611
CDW Government, Inc. 61,058 10,658 25,973 14,346 112,035
Century Computers, Inc. 219,787 151,944 33,626 7,375 412,732
Ciber, Inc. 625,442 1,638,976 2,057,865 74,599 4,396,882
Commercial Data Systems, Inc. 27,063 43,351 - - 70,414
Connecting The Dots, LLC - - - 10,944 10,944
Cummins Pacifi c, LLC - - - 5,214 5,214
D & M Hydraulic Sales & Service - 819 181 - 1,000
Dell Marketing, LP 129,015 235,001 114,974 121,205 600,195
EMC Corporation - 5,593 84,433 85,684 175,710
Emerson Network Power, Liebert - - - 2,671 2,671
En Pointe Technologies Sales - 178,018 361,244 593,033 1,132,295
Esri, Inc. 3,560 3,560 24,503 8,696 40,319
Eworld Enterprise Solutions 827,782 752,413 737,036 647,560 2,964,791
Ford Audio-Video Systems, Inc. 570,200 1,052,971 1,017,026 653,550 3,293,747
Gas Company 23,503 18,422 63,009 625 105,559
Grainger 93,030 257,280 140,055 258,991 749,356
Graybar 24,288 20,382 77,812 61,087 183,569
Grove Farm Co., Inc. 12,500 2,842 84,415 - 99,757
Harris Corporation - - 1,108,200 - 1,108,200
Hawaii Gas - - 3,963 20,933 24,896
Hawaiian Telcom, Inc. 1,051,941 1,569,044 1,213,837 1,779,277 5,614,099
Hawaiya Technologies, Inc. 898,910 616,508 2,736,515 1,059,959 5,311,892
Hewlett-Packard, Inc. 79,980 26,877 32,003 39,363 178,223
Hoike Networks, Inc. - - 670,590 364,220 1,034,810
34 Report No. 16-01 / March 2016
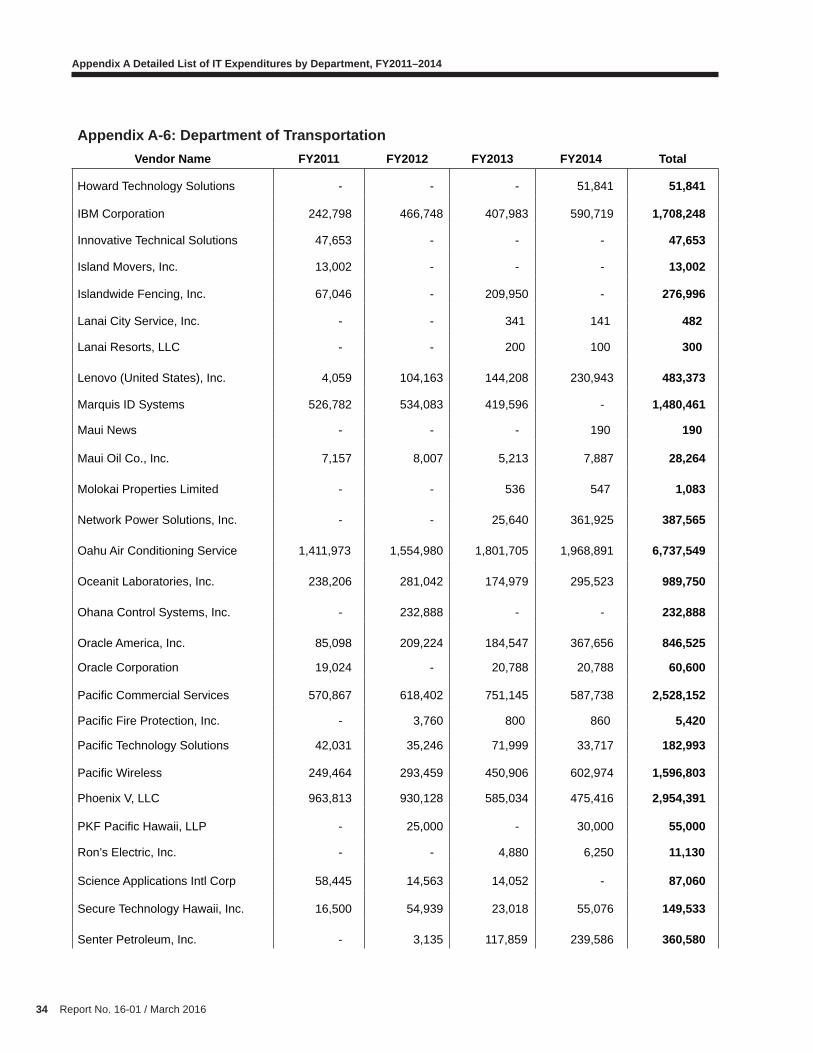
Appendix A Detailed List of IT Expenditures by Department, FY2011–2014
Appendix A-6: Department of TransportationVendor Name FY2011 FY2012 FY2013 FY2014 Total
Howard Technology Solutions - - - 51,841 51,841
IBM Corporation 242,798 466,748 407,983 590,719 1,708,248
Innovative Technical Solutions 47,653 - - - 47,653
Island Movers, Inc. 13,002 - - - 13,002
Islandwide Fencing, Inc. 67,046 - 209,950 - 276,996
Lanai City Service, Inc. - - 341 141 482
Lanai Resorts, LLC - - 200 100 300
Lenovo (United States), Inc. 4,059 104,163 144,208 230,943 483,373
Marquis ID Systems 526,782 534,083 419,596 - 1,480,461
Maui News - - - 190 190
Maui Oil Co., Inc. 7,157 8,007 5,213 7,887 28,264
Molokai Properties Limited - - 536 547 1,083
Network Power Solutions, Inc. - - 25,640 361,925 387,565
Oahu Air Conditioning Service 1,411,973 1,554,980 1,801,705 1,968,891 6,737,549
Oceanit Laboratories, Inc. 238,206 281,042 174,979 295,523 989,750
Ohana Control Systems, Inc. - 232,888 - - 232,888
Oracle America, Inc. 85,098 209,224 184,547 367,656 846,525
Oracle Corporation 19,024 - 20,788 20,788 60,600
Pacifi c Commercial Services 570,867 618,402 751,145 587,738 2,528,152
Pacifi c Fire Protection, Inc. - 3,760 800 860 5,420
Pacifi c Technology Solutions 42,031 35,246 71,999 33,717 182,993
Pacifi c Wireless 249,464 293,459 450,906 602,974 1,596,803
Phoenix V, LLC 963,813 930,128 585,034 475,416 2,954,391
PKF Pacifi c Hawaii, LLP - 25,000 - 30,000 55,000
Ron’s Electric, Inc. - - 4,880 6,250 11,130
Science Applications Intl Corp 58,445 14,563 14,052 - 87,060
Secure Technology Hawaii, Inc. 16,500 54,939 23,018 55,076 149,533
Senter Petroleum, Inc. - 3,135 117,859 239,586 360,580

Report No. 16-01 / March 2016 35
Appendix A Detailed List of IT Expenditures by Department, FY2011–2014
Appendix A-6: Department of TransportationVendor Name FY2011 FY2012 FY2013 FY2014 Total
Sirius Computer Solutions, Inc. - 24,152 2,901 25,278 52,331
SITA Information Networking - 876,642 291,542 2,002,460 3,170,644
Solutions Thru Software, Inc. - 77,592 196,476 139,455 413,523
Sprint 16,017 17,480 16,230 15,739 65,466
Technology Integration Group - 3,495 731 6,599 10,825
Thoughtfocus Technologies, LLC - - - 2,200 2,200
Time Warner Cable, Inc. - - 35,524 11,681 47,205
Verizon Wireless 22,189 13,063 12,542 10,912 58,706
Xerox Corporation 42,079 41,418 33,352 37,850 154,699
Total $ 9,470,331 $ 13,283,998 $ 16,821,669 $ 14,208,121 $ 53,784,119
Source: Offi ce of the Auditor

36 Report No. 16-01 / March 2016
Appendix A Detailed List of IT Expenditures by Department, FY2011–2014
This page is intentionally left blank.

Report No. 16-01 / March 2016 37
Appendix BList of IT Expenditures by Vendor, FY2011–2014
Vendor Name FY2011 FY2012 FY2013 FY2014 Total
KPMG LLP $ - $ - $ 34,332,830 $ 51,619,332 $ 85,952,162
Arizona Health Care Cost 6,222,190 6,995,259 7,070,006 7,080,866 27,368,321
IBM Corporation 4,058,270 6,664,662 4,882,987 6,705,737 22,311,656
Hawaiian Telcom, Inc. 4,813,428 5,739,468 5,750,761 5,787,410 22,091,067
En Pointe Technologies Sales - 790,525 3,609,209 9,993,164 14,392,898
Siemens Medical Solutions USA - 3,880,588 8,358,092 1,555,950 13,794,630
Eworld Enterprise Solutions 4,007,392 2,173,795 2,863,323 3,973,846 13,018,356
Oahu Air Conditioning Service
1,873,856
2,045,152
2,316,726 2,699,443 8,935,177
Pacifi c Wireless 2,948,211 1,100,288 1,621,711 2,287,547 7,957,757
University Of Hawaii 2,412,025 1,973,402 1,200,997 2,040,436 7,626,860
Gartner, Inc. 30,514 38,979 2,520,658 3,556,070 6,146,221
Public Consulting Group, Inc. - 80,801 2,091,914 3,427,713 5,600,428
Hart Intercivic, Inc. 2,938,267 891,058 864,366 862,624 5,556,315
Dell Marketing, LP 2,141,111 1,592,949 468,517 1,199,898 5,402,475
Hawaiya Technologies, Inc. 898,910 616,508 2,736,515 1,079,008 5,330,941
Ciber, Inc. 625,442 1,638,976 2,057,865 74,599 4,396,882
Oceanit Laboratories, Inc. 691,850 497,748 390,025 2,653,312 4,232,935
Aviat U. S., Inc. 1,045,476 1,499,278 1,237,433 - 3,782,187
Windsor Solutions, Inc. 708,746 959,948 1,061,208 867,854 3,597,756
Xerox Corporation 1,075,211 987,470 853,402 401,635 3,317,718
Ford Audio-Video Systems, Inc. 570,200 1,052,971 1,017,026 653,550 3,293,747
SITA Information Networking - 876,642 291,542 2,002,460 3,170,644
Lenovo (United States), Inc. 102,791 619,792 768,649 1,644,698 3,135,930
Summit Construction, Inc. 2,648,992 412,546 - - 3,061,538
Phoenix V, LLC 963,813 930,128 585,034 475,416 2,954,391
Pacifi c Commercial Services 573,799 627,397 751,145 587,738 2,540,079
Iron Bow Technologies, LLC - - - 2,459,716 2,459,716
Redmane Technology LLC 1,095,979 36,019 503,689 679,490 2,315,177

38 Report No. 16-01 / March 2016
Appendix B List of IT Expenditures by Vendor, FY2011–2014
Vendor Name FY2011 FY2012 FY2013 FY2014 Total
Morphotrak, Inc. 356,520 529,675 902,575 511,964 2,300,734
Rematics, LLC 374,133 793,243 758,197 213,604 2,139,177
Software AG USA, Inc. 434,843 561,209 561,209 561,210 2,118,471
Hawaii Information Consortium 113,254 127,552 519,993 1,317,920 2,078,719
HP Enterprise Services, LLC 302,990 663,214 632,595 424,978 2,023,777
Med-Media, Inc. 232,329 567,389 614,803 580,805 1,995,326
Hoike Networks, Inc. - 150,485 802,187 918,984 1,871,656
Consilience Software - 1,128,750 446,000 268,491 1,843,241
PC Specialists, Inc. - - 55,120 1,785,530 1,840,650
Science Applications Intl Corp 58,445 14,563 14,052 1,726,730 1,813,790
Gas Company 598,982 574,809 559,922 63,447 1,797,160
Hewlett-Packard, Inc. 668,985 371,641 390,560 292,990 1,724,176
Imagine Solutions, Inc. - - 1,133,519 501,696 1,635,215
Wilson Okamoto Corporation 474,780 532,708 300,075 310,737 1,618,300
Marquis ID Systems 526,782 534,083 419,596 - 1,480,461
FEI.com, Inc. 323,775 293,870 52,590 763,929 1,434,164
Advanced Data Processing, Inc. - - 392,013 911,009 1,303,022
Grainger 199,663 327,920 324,808 434,822 1,287,213
Netsmart Technologies 186,581 128,146 713,497 227,233 1,255,457
Harris Corporation - - 1,108,200 - 1,108,200
ECS, Inc. 292,037 96,027 254,338 430,945 1,073,347
World Wide Technology, Inc. - - 350,470 712,484 1,062,954
Oracle America, Inc. 137,857 255,260 253,309 401,822 1,048,248
CDW Government, Inc. 91,551 75,225 54,958 804,915 1,026,649
RCM Technologies (USA), Inc. - - - 987,901 987,901
InfoMC, Inc. 97,850 455,545 158,235 230,140 941,770
Axway, Inc. 36,611 137,642 548,512 114,538 837,303
Hawaii Gas - - 182,571 642,933 825,504

Report No. 16-01 / March 2016 39
Appendix B List of IT Expenditures by Vendor, FY2011–2014
Vendor Name FY2011 FY2012 FY2013 FY2014 Total
Arisumi Brothers, Inc. 206,942 254,606 221,872 130,147 813,567
Esri, Inc. 22,355 586,351 98,614 93,707 801,027
G4S Secure Solutions (USA), Inc. 501,276 252,093 - - 753,369
E. F. Johnson, Co. - - 659,338 57,141 716,479
CA, Inc. 232,996 232,996 232,996 - 698,988
Technology Integration Group 70,527 119,758 294,973 175,156 660,414
Marquis Consulting Services 109,304 300,715 180,520 - 590,539
Socrata, Inc. - - 139,866 444,490 584,356
PKF Pacifi c Hawaii, LLP 416,538 133,513 - 30,000 580,051
Research Corp Of UH - 364,591 171,446 - 536,037
Offi cemax Incorporated 127,749 106,930 166,435 134,820 535,934
SH Consulting, LLC - 1,200 250,100 248,436 499,736
Harmony Information Systems - 152,381 188,273 151,542 492,196
Commercial Data Systems, Inc. 416,308 73,318 - - 489,626
Bentley Systems, Inc. 91,624 139,699 118,978 117,310 467,611
Century Computers, Inc. 268,154 151,944 33,626 7,375 461,099
Solutions Thru Software Inc. - 77,592 196,476 139,455 413,523
Kaye Scholer, LLP - - - 400,072 400,072
AAMVA 86,445 126,645 88,504 92,222 393,816
Network Power Solutions, Inc. - - 25,640 361,925 387,565
Dataimage, Inc. 19,371 289,659 48,042 19,791 376,863
Senter Petroleum, Inc. - 3,135 117,859 243,727 364,721
Sorrento Networks, Inc. - 38,043 324,217 1,349 363,609
Civic Initiatives, LLC - - 90,000 272,195 362,195
Ohana Control Systems, Inc. - 232,888 39,589 60,067 332,544
Lanai Builders, Inc. 240,484 - - 91,200 331,684
Unicom Systems, Inc. 98,000 53,093 116,461 64,043 331,597
Verizon Wireless 69,516 73,366 84,816 93,493 321,191
Search Group, Inc. 32,421 23,930 86,978 173,934 317,263
Time Warner Cable, Inc. 17,801 76,429 111,958 88,110 294,298
Modtech Solutions, LLC - - - 293,764 293,764

40 Report No. 16-01 / March 2016
Appendix B List of IT Expenditures by Vendor, FY2011–2014
Vendor Name FY2011 FY2012 FY2013 FY2014 Total
Symago, LLC 60,899 69,884 55,958 101,336 288,077
BT Conferencing Video, Inc. 27,266 178,988 79,572 - 285,826
Islandwide Fencing, Inc. 69,570 - 209,950 4,398 283,918
Treehouse Software, Inc. 6,931 81,047 99,895 93,979 281,852
Graybar 30,369 21,431 78,370 149,715 279,885
Autodesk, Inc. 128,543 82,163 - 66,416 277,122
HTDC-Maui Research & Tech Ctr - - - 264,499 264,499
Sirius Computer Solutions, Inc. - 141,578 76,311 44,930 262,819
Fresh Leadership, LLC - - 10,000 250,995 260,995
Unisys Corporation 34,346 120,653 - 104,728 259,727
ISDI Technologies, Inc. 249,579 - - - 249,579
SAS Institute. Inc. 57,728 51,906 65,246 62,283 237,163
Maximus Health Services, Inc. - - 113,462 121,941 235,403
Desktop Solutions, Inc. - - 31,779 19,794 230,573
Viatron Systems, Inc. - - - 226,936 226,936
EMC Corporation 9,737 12,187 92,600 104,834 219,358
Sprint 109,966 67,604 20,316 16,417 214,303
Video Warehouse, Inc. 127,958 - - 85,008 212,966
Secure Technology Hawaii, Inc. 27,422 71,231 43,855 62,581 205,089
Pacifi c Technology Solutions 42,031 35,246 71,999 33,717 182,993
Commerce Solutions, Inc. 55,962 69,618 54,420 - 180,000
Apple, Inc. 26,030 15,475 106,667 20,118 168,290
Alexander Gow Fire - - - 165,731 165,731
Scientel Wireless, LLC - - 51,629 110,828 162,457
General Dynamics Fidelis - - 19,200 138,000 157,200
Emphasys Computer Solutions - 69,882 - 82,102 151,984
Grove Farm Company, Inc. 25,000 16,137 109,812 479 151,428
C & A Generator Services, Inc. 35,743 33,898 45,365 34,248 149,254
Lockheed Martin Services, Inc. - - 140,078 - 140,078
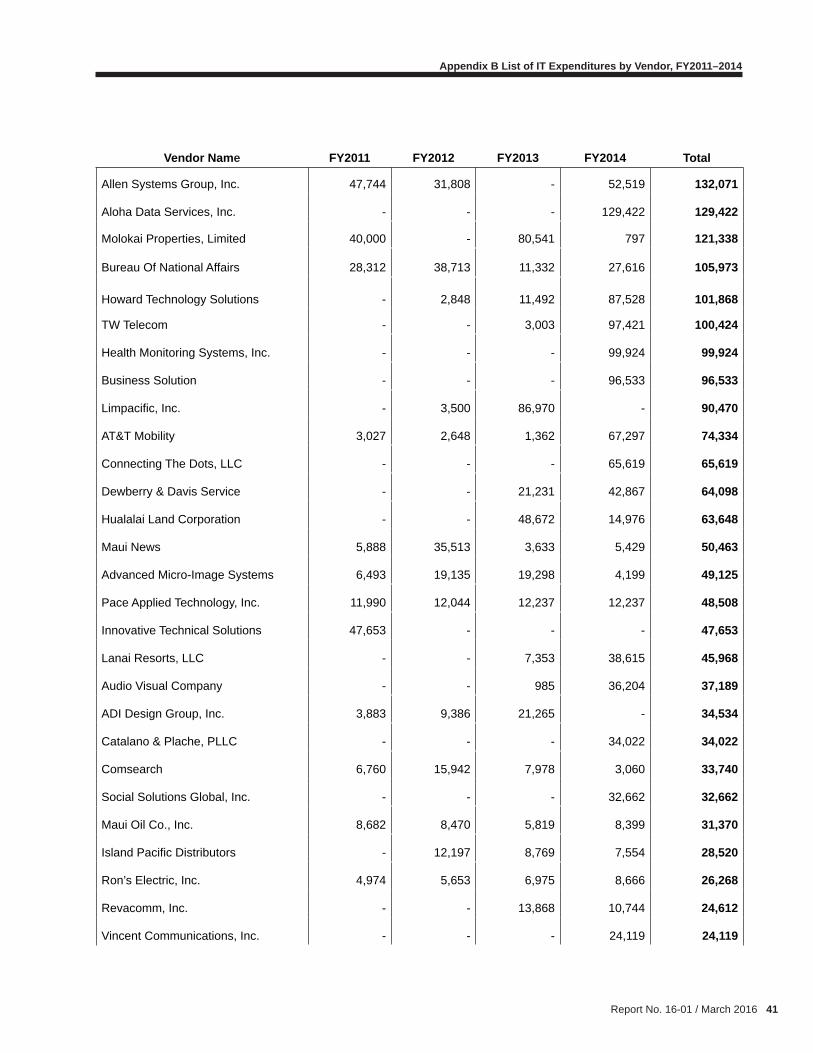
Report No. 16-01 / March 2016 41
Appendix B List of IT Expenditures by Vendor, FY2011–2014
Vendor Name FY2011 FY2012 FY2013 FY2014 Total
Allen Systems Group, Inc. 47,744 31,808 - 52,519 132,071
Aloha Data Services, Inc. - - - 129,422 129,422
Molokai Properties, Limited 40,000 - 80,541 797 121,338
Bureau Of National Affairs 28,312 38,713 11,332 27,616 105,973
Howard Technology Solutions - 2,848 11,492 87,528 101,868
TW Telecom - - 3,003 97,421 100,424
Health Monitoring Systems, Inc. - - - 99,924 99,924
Business Solution - - - 96,533 96,533
Limpacifi c, Inc. - 3,500 86,970 - 90,470
AT&T Mobility 3,027 2,648 1,362 67,297 74,334
Connecting The Dots, LLC - - - 65,619 65,619
Dewberry & Davis Service - - 21,231 42,867 64,098
Hualalai Land Corporation - - 48,672 14,976 63,648
Maui News 5,888 35,513 3,633 5,429 50,463
Advanced Micro-Image Systems 6,493 19,135 19,298 4,199 49,125
Pace Applied Technology, Inc. 11,990 12,044 12,237 12,237 48,508
Innovative Technical Solutions 47,653 - - - 47,653
Lanai Resorts, LLC - - 7,353 38,615 45,968
Audio Visual Company - - 985 36,204 37,189
ADI Design Group, Inc. 3,883 9,386 21,265 - 34,534
Catalano & Plache, PLLC - - - 34,022 34,022
Comsearch 6,760 15,942 7,978 3,060 33,740
Social Solutions Global, Inc. - - - 32,662 32,662
Maui Oil Co., Inc. 8,682 8,470 5,819 8,399 31,370
Island Pacifi c Distributors - 12,197 8,769 7,554 28,520
Ron’s Electric, Inc. 4,974 5,653 6,975 8,666 26,268
Revacomm, Inc. - - 13,868 10,744 24,612
Vincent Communications, Inc. - - - 24,119 24,119
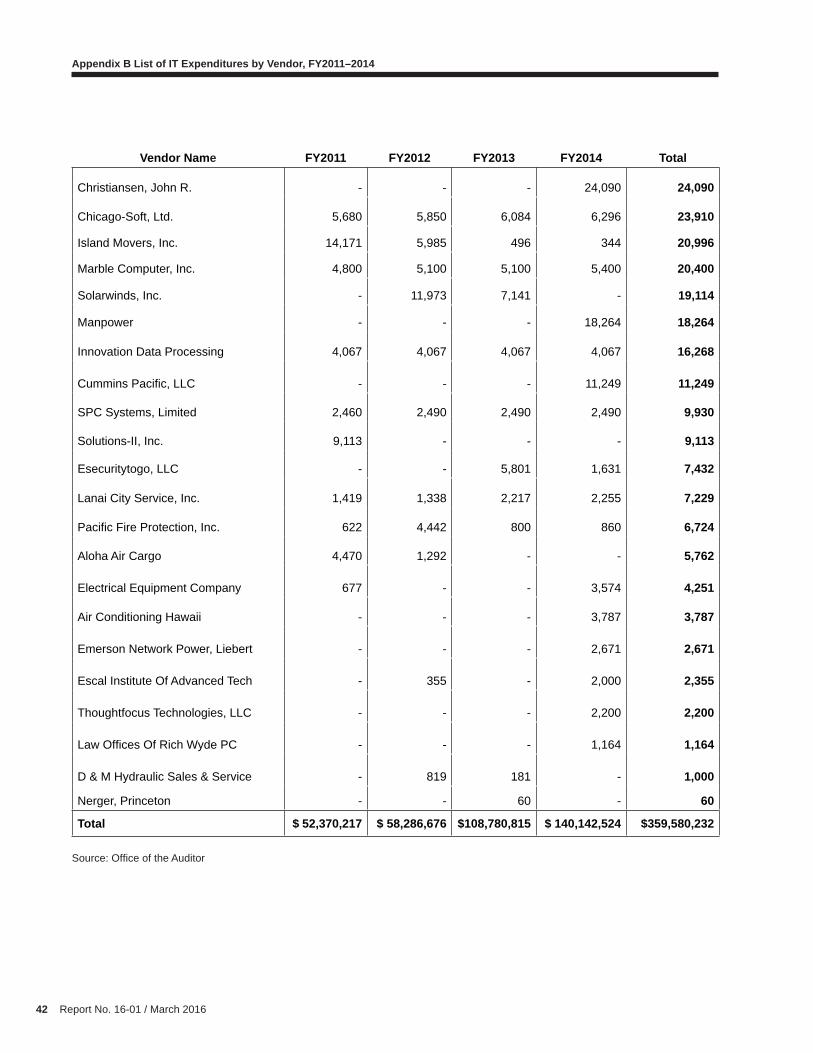
42 Report No. 16-01 / March 2016
Appendix B List of IT Expenditures by Vendor, FY2011–2014
Vendor Name FY2011 FY2012 FY2013 FY2014 Total
Christiansen, John R. - - - 24,090 24,090
Chicago-Soft, Ltd. 5,680 5,850 6,084 6,296 23,910
Island Movers, Inc. 14,171 5,985 496 344 20,996
Marble Computer, Inc. 4,800 5,100 5,100 5,400 20,400
Solarwinds, Inc. - 11,973 7,141 - 19,114
Manpower - - - 18,264 18,264
Innovation Data Processing 4,067 4,067 4,067 4,067 16,268
Cummins Pacifi c, LLC - - - 11,249 11,249
SPC Systems, Limited 2,460 2,490 2,490 2,490 9,930
Solutions-II, Inc. 9,113 - - - 9,113
Esecuritytogo, LLC - - 5,801 1,631 7,432
Lanai City Service, Inc. 1,419 1,338 2,217 2,255 7,229
Pacifi c Fire Protection, Inc. 622 4,442 800 860 6,724
Aloha Air Cargo 4,470 1,292 - - 5,762
Electrical Equipment Company 677 - - 3,574 4,251
Air Conditioning Hawaii - - - 3,787 3,787
Emerson Network Power, Liebert - - - 2,671 2,671
Escal Institute Of Advanced Tech - 355 - 2,000 2,355
Thoughtfocus Technologies, LLC - - - 2,200 2,200
Law Offi ces Of Rich Wyde PC - - - 1,164 1,164
D & M Hydraulic Sales & Service - 819 181 - 1,000
Nerger, Princeton - - 60 - 60
Total $ 52,370,217 $ 58,286,676 $108,780,815 $ 140,142,524 $359,580,232
Source: Offi ce of the Auditor

Report No. 16-01 / March 2016 43
Appendix CDetailed List of IT Encumbrances of $100,000 or Greater by Department, FY2011–2014Appendix C-1: Department of Accounting and General Services
Vendor Name FY2011 FY2012 FY2013 FY2014 Total
Arisumi Brothers, Inc. $ 545,000 $ 208,065 $ 50,600 $ 66,619 $ 870,284
Autodesk, Inc. 134,911 - 100,159 - 235,070
Aviat U. S., Inc. 1,599,722 - 188,128 3,591,908 5,379,758
Axway, Inc. 101,970 - 417,466 114,538 633,974
BT Conferencing Video, Inc. 179,173 - - - 179,173
CA, Inc. 233,469 233,469 232,996 - 699,934
Civic Initiatives, LLC - - - 349,960 349,960
Commercial Data Systems, Inc. 179,804 - - - 179,804
Dell Marketing, LP 192,624 - - - 192,624
Desktop Solutions, Inc. - - - 113,297 113,297
Dewberry & Davis Service - - - 100,257 100,257
ECS, Inc. 78,834 274,415 188,302 370,024 911,575
En Pointe Technologies Sales - 557,002 1,943,827 9,872,751 12,373,580
Esri, Inc. 574,634 - - - 574,634
Eworld Enterprise Solutions - 267,195 751,434 1,151,530 2,170,159
Fresh Leadership, LLC - - 250,000 - 250,000 Gartner, Inc. - - 3,806,296 8,258,575 12,064,871
General Dynamics Fidelis - - 138,000 - 138,000
Hart Intercivic, Inc. 2,550,000 3,450,000 - 3,450,000 9,450,000
Hawaii Information Consortium - - 698,073 320,375 1,018,448
Hawaiian Telcom 556,496 962,507 1,030,404 1,257,216 3,806,623
Hewlett-Packard, Inc. - 135,428 125,589 - 261,017
HTDC-Maui Research & Tech Ctr - - - 238,049 238,049
IBM Corporation 1,219,419 1,152,889 1,852,237 3,515,887 7,740,432
Iron Bow Technologies, LLC - - 415,017 3,073,820 3,488,837
E. F. Johnson, Co. - 659,338 1,144,781 3,845,888 5,650,007

44 Report No. 16-01 / March 2016
Appendix C Detailed List of IT Encumbrances of $100,000 or Greater by Department, FY2011–2014
Appendix C-1: Department of Accounting and General Services
Vendor Name FY2011 FY2012 FY2013 FY2014 Total
Lockheed Martin Services, Inc. - - 228,017 108,781 336,798
Moditech Solutions, LLC - - - 358,926 358,926
Oahu Air Conditioning Service 505,750 476,920 386,189 493,218 1,862,077
Oceanit Laboratories, Inc. - - 3,139,742 - 3,139,742
Pacifi c Power Group, LLC - - - 143,625 143,625
Pacifi c Wireless 260,815 255,103 348,216 494,246 1,358,380
PC Specialists, Inc. - - 394,933 1,344,838 1,739,771
PKF Pacifi c Hawaii, LLP - - 1,066,962 - 1,066,962
Kaye Scholer, LLP - - - 150,000 150,000
Science Applications Intl Corp - - 2,229,955 1,525,000 3,754,955
Scientel Wireless, LLC - - 110,828 - 110,828
Sirius Computer Solutions, Inc. 767,273 771,969 808,116 1,800,100 4,147,458
Socrata, Inc. - - 109,293 - 109,293
Software AG USA, Inc. 800,471 561,209 - - 1,361,680
Sorrento Networks, Inc. - 198,359 - - 198,359
Summit Construction, Inc. 132,500 187,645 2,046,450 - 2,366,595
Technology Integration Group - 137,925 - - 137,925
TW Telecom - - - 547,363 547,363
UH Offi ce Of Research Services - - 353,000 957,859 1,310,859
Unisys Corporation - - - 694,758 694,758
Viatron Systems, Inc. - - 221,937 - 221,937
Wilson Okamoto Corporation 365,606 1,074,211 111,814 27,000 1,578,631
World Wide Technology, Inc. - - 507,887 486,131 994,018 Xerox Corporation 259,824 391,260 263,696 254,544 1,169,324
Total $ 11,238,295 $ 11,954,909 $ 25,660,344 $ 49,077,083 $ 97,930,631
Source: Offi ce of the Auditor

Report No. 16-01 / March 2016 45
Appendix C Detailed List of IT Encumbrances of $100,000 or Greater by Department, FY2011–2014
Appendix C-2: Department of the Attorney GeneralVendor Name FY2011 FY2012 FY2013 FY2014 Total
Aloha Data Services, Inc. $ - $ - $ 363,664 $ - $ 363,664
Dell Marketing, LP 125,480 - - - 125,480
Eworld Enterprise Solutions - - - 144,200 144,200
Marquis Consulting Services 117,248 200,000 - - 317,248
Morphotrak, Inc. - 1,509,094 - - 1,509,094
Redmane Technology, LLC - - 2,438,793 - 2,438,793
Rematics, LLC 994,470 765,461 150,000 411,270 2,321,201
Search Group, Inc. - - 384,880 - 384,880
Total $ 1,237,198 $ 2,474,555 $ 3,337,337 $ 555,470 $ 7,604,560
Appendix C-3: Department of HealthVendor Name FY2011 FY2012 FY2013 FY2014 Total
Advanced Data Processing, Inc. $ - $ - $ 753,704 $ 1,458,275 $ 2,211,979
Commercial Data Systems, Inc. 146,600 - - - 146,600
Consilience Software - 1,394,750 215,000 - 1,609,750
Dell Marketing, LP - - - 126,824 126,824
En Pointe Technologies Sales - 192,208 - 180,760 372,968
FEI.com, Inc. 260,300 253,560 527,830 343,560 1,385,250
G4S Secure Solutions (USA), Inc. 371,609 188,887 - - 560,496
Gas Company - 107,586 - - 107,586
Harmony Information Systems 115,000 - 103,845 - 218,845
Hawaii Gas - - 139,822 163,982 303,804
Hawaii Information Consortium - 125,600 - 200,000 325,600
Hawaiian Telcom 209,597 219,764 154,512 110,095 693,968
Health Monitoring Systems, Inc. - - - 174,869 174,869
Hewlett-Packard, Inc. 503,459 - - - 503,459
Hoike Networks, Inc. - 154,008 250,664 174,624 579,296
Source: Offi ce of the Auditor
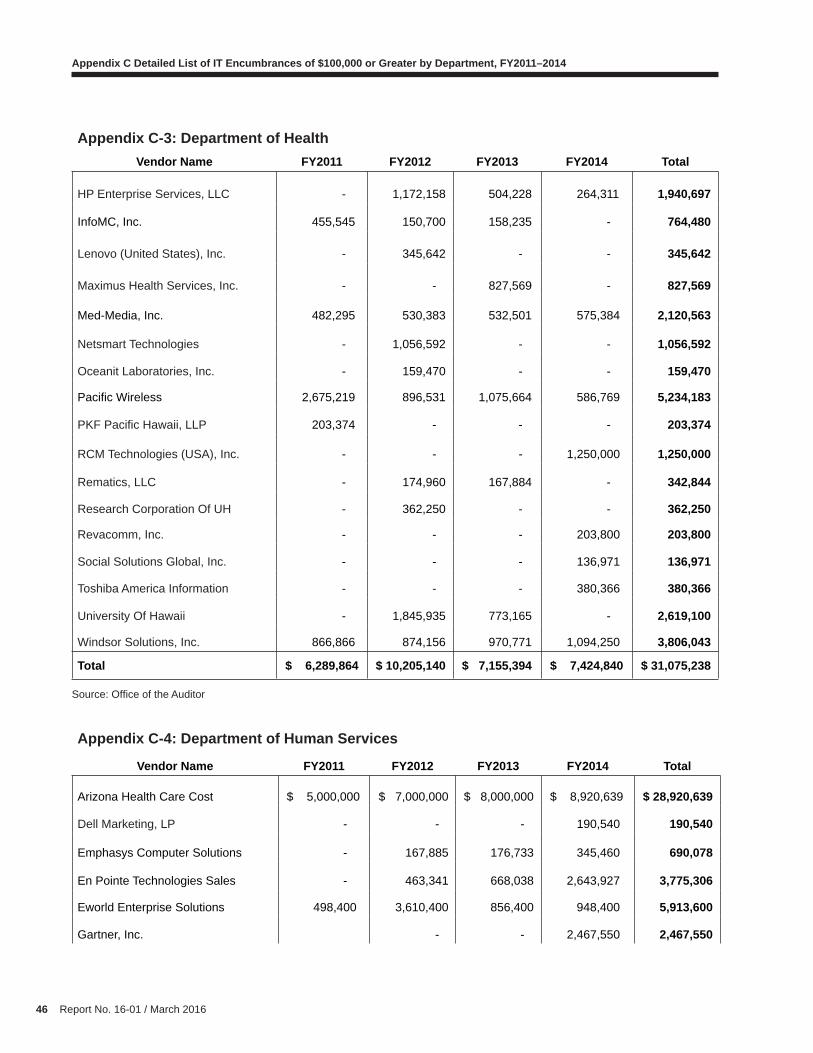
46 Report No. 16-01 / March 2016
Appendix C Detailed List of IT Encumbrances of $100,000 or Greater by Department, FY2011–2014
Appendix C-3: Department of HealthVendor Name FY2011 FY2012 FY2013 FY2014 Total
HP Enterprise Services, LLC - 1,172,158 504,228 264,311 1,940,697
InfoMC, Inc. 455,545 150,700 158,235 - 764,480
Lenovo (United States), Inc. - 345,642 - - 345,642
Maximus Health Services, Inc. - - 827,569 - 827,569
Med-Media, Inc. 482,295 530,383 532,501 575,384 2,120,563
Netsmart Technologies - 1,056,592 - - 1,056,592
Oceanit Laboratories, Inc. - 159,470 - - 159,470
Pacifi c Wireless 2,675,219 896,531 1,075,664 586,769 5,234,183
PKF Pacifi c Hawaii, LLP 203,374 - - - 203,374
RCM Technologies (USA), Inc. - - - 1,250,000 1,250,000
Rematics, LLC - 174,960 167,884 - 342,844
Research Corporation Of UH - 362,250 - - 362,250
Revacomm, Inc. - - - 203,800 203,800
Social Solutions Global, Inc. - - - 136,971 136,971
Toshiba America Information - - - 380,366 380,366
University Of Hawaii - 1,845,935 773,165 - 2,619,100
Windsor Solutions, Inc. 866,866 874,156 970,771 1,094,250 3,806,043
Total $ 6,289,864 $ 10,205,140 $ 7,155,394 $ 7,424,840 $ 31,075,238
Appendix C-4: Department of Human Services
Vendor Name FY2011 FY2012 FY2013 FY2014 Total
Arizona Health Care Cost $ 5,000,000 $ 7,000,000 $ 8,000,000 $ 8,920,639 $ 28,920,639
Dell Marketing, LP - - - 190,540 190,540
Emphasys Computer Solutions - 167,885 176,733 345,460 690,078
En Pointe Technologies Sales - 463,341 668,038 2,643,927 3,775,306
Eworld Enterprise Solutions 498,400 3,610,400 856,400 948,400 5,913,600
Gartner, Inc. - - 2,467,550 2,467,550
Source: Offi ce of the Auditor
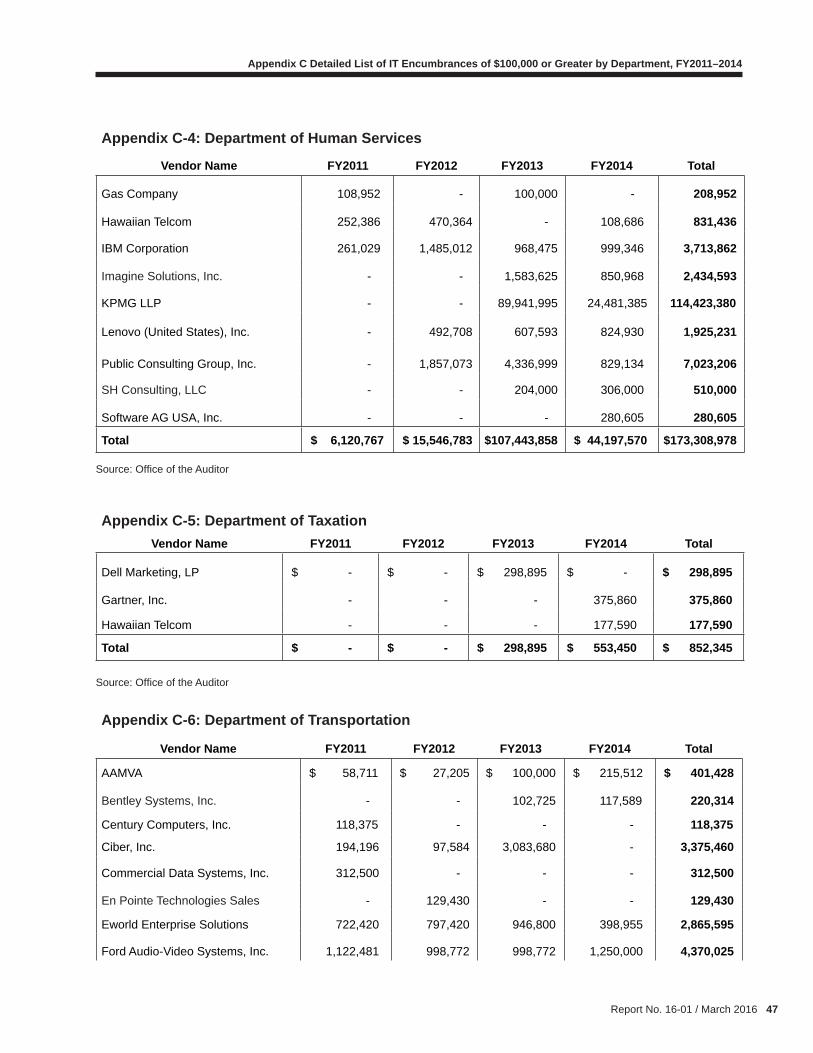
Report No. 16-01 / March 2016 47
Appendix C Detailed List of IT Encumbrances of $100,000 or Greater by Department, FY2011–2014
Appendix C-4: Department of Human Services
Vendor Name FY2011 FY2012 FY2013 FY2014 Total
Gas Company 108,952 - 100,000 - 208,952
Hawaiian Telcom 252,386 470,364 - 108,686 831,436
IBM Corporation 261,029 1,485,012 968,475 999,346 3,713,862
Imagine Solutions, Inc. - - 1,583,625 850,968 2,434,593
KPMG LLP - - 89,941,995 24,481,385 114,423,380
Lenovo (United States), Inc. - 492,708 607,593 824,930 1,925,231
Public Consulting Group, Inc. - 1,857,073 4,336,999 829,134 7,023,206
SH Consulting, LLC - - 204,000 306,000 510,000
Software AG USA, Inc. - - - 280,605 280,605
Total $ 6,120,767 $ 15,546,783 $107,443,858 $ 44,197,570 $173,308,978
Source: Offi ce of the Auditor
Appendix C-5: Department of TaxationVendor Name FY2011 FY2012 FY2013 FY2014 Total
Dell Marketing, LP $ - $ - $ 298,895 $ - $ 298,895
Gartner, Inc. - - - 375,860 375,860
Hawaiian Telcom - - - 177,590 177,590
Total $ - $ - $ 298,895 $ 553,450 $ 852,345
Source: Offi ce of the Auditor
Appendix C-6: Department of Transportation
Vendor Name FY2011 FY2012 FY2013 FY2014 Total
AAMVA $ 58,711 $ 27,205 $ 100,000 $ 215,512 $ 401,428
Bentley Systems, Inc. - - 102,725 117,589 220,314
Century Computers, Inc. 118,375 - - - 118,375
Ciber, Inc. 194,196 97,584 3,083,680 - 3,375,460
Commercial Data Systems, Inc. 312,500 - - - 312,500
En Pointe Technologies Sales - 129,430 - - 129,430
Eworld Enterprise Solutions 722,420 797,420 946,800 398,955 2,865,595
Ford Audio-Video Systems, Inc. 1,122,481 998,772 998,772 1,250,000 4,370,025

48 Report No. 16-01 / March 2016
Appendix C Detailed List of IT Encumbrances of $100,000 or Greater by Department, FY2011–2014
Appendix C-6: Department of Transportation
Vendor Name FY2011 FY2012 FY2013 FY2014 Total
Gartner, Inc. - - - 2,611,421 2,611,421
Grainger - - 122,508 - 122,508
Harris Corporation - 1,108,200 - - 1,108,200
Hawaiian Telcom 642,986 712,112 1,543,618 441,894 3,340,610
Hawaiya Technologies, Inc. 967,439 - 2,624,676 - 3,592,115
Hoike Networks, Inc. - - 1,707,816 - 1,707,816
IBM Corporation 130,529 238,575 404,387 323,611 1,097,102
Lanai Resorts, LLC - - 725,183 - 725,183
Lenovo (United States), Inc. - - 112,868 123,408 236,276
Marquis ID Systems 1,237,999 - 418,000 - 1,655,999
Network Power Solutions, Inc. - - 420,000 692,395 1,112,395
Oahu Air Conditioning Service 1,965,822 4,208,570 2,225,022 501,022 8,900,436
Oceanit Laboratories, Inc. - 150,000 135,188 780,000 1,065,188
Oracle America, Inc. 115,232 118,689 209,663 166,160 609,744
Pacifi c Commercial Services 183,194 141,700 873,674 858,600 2,057,168
Pacifi c Wireless 259,990 419,576 529,415 396,198 1,605,179
Phoenix V, LLC - 1,150,000 - - 1,150,000
SITA Information Networking 1,245,000 - 2,401,676 - 3,646,676
Solutions Thru Software, Inc. 628,420 - 111,455 - 739,875
Total $ 9,905,294 $ 10,297,833 $ 19,797,126 $ 8,876,765 $ 48,877,018
Source: Offi ce of the Auditor

Report No. 16-01 / February 2016 49
Appendix DDetailed List of IT Encumbrances of $100,000 or Greater by Vendor, FY2011–2014Appendix D-1: Detailed List of IT Encumbrances of $100,000 or Greater by Vendor
Vendor Name FY2011 FY2012 FY2013 FY2014 Total
KPMG LLP $ - $ - $ 89,941,995 $ 24,481,385 $114,423,380
Arizona Health Care Cost 5,000,000 7,000,000 8,000,000 8,920,639 28,920,639
Gartner, Inc. - - 3,806,296 13,713,406 17,519,702
En Pointe Technologies Sales - 1,341,981 2,611,865 12,697,438 16,651,284
IBM Corporation 1,610,977 2,876,476 3,225,099 4,838,844 12,551,396
Eworld Enterprise Solutions 1,220,820 4,675,015 2,554,634 2,643,085 11,093,554
Oahu Air Conditioning Service 2,471,572 4,685,490 2,611,211 994,240 10,762,513
Hart Intercivic, Inc. 2,550,000 3,450,000 - 3,450,000 9,450,000
Hawaiian Telcom 1,661,465 2,364,747 2,728,534 2,095,481 8,850,227
Pacifi c Wireless 3,196,024 1,571,210 1,953,295 1,477,213 8,197,742
Public Consulting Group, Inc. - 1,857,073 4,336,999 829,134 7,023,206
E. F. Johnson, Co. - 659,338 1,144,781 3,845,888 5,650,007
Aviat U. S., Inc. 1,599,722 - 188,128 3,591,908 5,379,758
Ford Audio-Video Systems, Inc. 1,122,481 998,772 998,772 1,250,000 4,370,025
Oceanit Laboratories, Inc. - 309,470 3,274,930 780,000 4,364,400
Sirius Computer Solutions, Inc. 767,273 771,969 808,116 1,800,100 4,147,458
Windsor Solutions, Inc. 866,866 874,156 970,771 1,094,250 3,806,043
Science Applications Intl Corp - - 2,229,955 1,525,000 3,754,955
SITA Information Networking 1,245,000 - 2,401,676 - 3,646,676
Hawaiya Technologies, Inc. 967,439 - 2,624,676 - 3,592,115
Iron Bow Technologies, LLC - - 415,017 3,073,820 3,488,837
Ciber, Inc. 194,196 97,584 3,083,680 - 3,375,460
Rematics, LLC 994,470 940,421 317,884 411,270 2,664,045
University Of Hawaii - 1,845,935 773,165 - 2,619,100
Lenovo (United States), Inc. - 838,350 720,461 948,338 2,507,149
Redmane Technology, LLC - - 2,438,793 - 2,438,793
Imagine Solutions, Inc. - - 1,583,625 850,968 2,434,593
Summit Construction, Inc. 132,500 187,645 2,046,450 - 2,366,595

50 Report No. 16-01 / March 2016
Appendix D Detailed List of IT Encumbrances of $100,000 or Greater by Vendor, FY2011–2014
Appendix D-1: Detailed List of IT Encumbrances of $100,000 or Greater by Vendor
Vendor Name FY2011 FY2012 FY2013 FY2014 Total
Hoike Networks, Inc. - 154,008 1,958,480 174,624 2,287,112
Advanced Data Processing, Inc. - - 753,704 1,458,275 2,211,979
Med-Media, Inc. 482,295 530,383 532,501 575,384 2,120,563
Pacifi c Commercial Services 183,194 141,700 873,674 858,600 2,057,168
HP Enterprise Services, LLC 342,727 829,431 504,228 264,311 1,940,697
PC Specialists, Inc. - - 394,933 1,344,838 1,739,771
Marquis ID Systems 1,237,999 - 418,000 - 1,655,999
Software AG USA, Inc. 800,471 561,209 - 280,605 1,642,285
Consilience Software - 1,394,750 215,000 - 1,609,750
Wilson Okamoto Corporation 365,606 1,074,211 111,814 27,000 1,578,631
Morphotrak, Inc. - 1,509,094 - - 1,509,094
FEI.com, Inc. 260,300 253,560 527,830 343,560 1,385,250
Hawaii Information Consortium - 125,600 698,073 520,375 1,344,048
UH Offi ce Of Research Services - - 353,000 957,859 1,310,859
PKF Pacifi c Hawaii, LLP 203,374 - 1,066,962 - 1,270,336
RCM Technologies (USA), Inc. - - - 1,250,000 1,250,000
Xerox Corporation 259,824 391,260 263,696 254,544 1,169,324
Phoenix V, LLC - 1,150,000 - - 1,150,000
Network Power Solutions, Inc. - - 420,000 692,395 1,112,395
Harris Corporation - 1,108,200 - - 1,108,200
Netsmart Technologies - 1,056,592 - - 1,056,592
World Wide Technology, Inc. - - 507,887 486,131 994,018
Dell Marketing, LP 318,104 - 298,895 317,364 934,363
ECS, Inc. 78,834 274,415 188,302 370,024 911,575
Arisumi Brothers, Inc. 545,000 208,065 50,600 66,619 70,284
Maximus Health Services, Inc. - - 827,569 - 827,569
InfoMC, Inc. 455,545 150,700 158,235 - 764,480
Hewlett-Packard, Inc. 503,459 135,428 125,589 - 764,476
Solutions Thru Software Inc. 628,420 - 111,455 - 739,875
Lanai Resorts, LLC - - 725,183 - 725,183
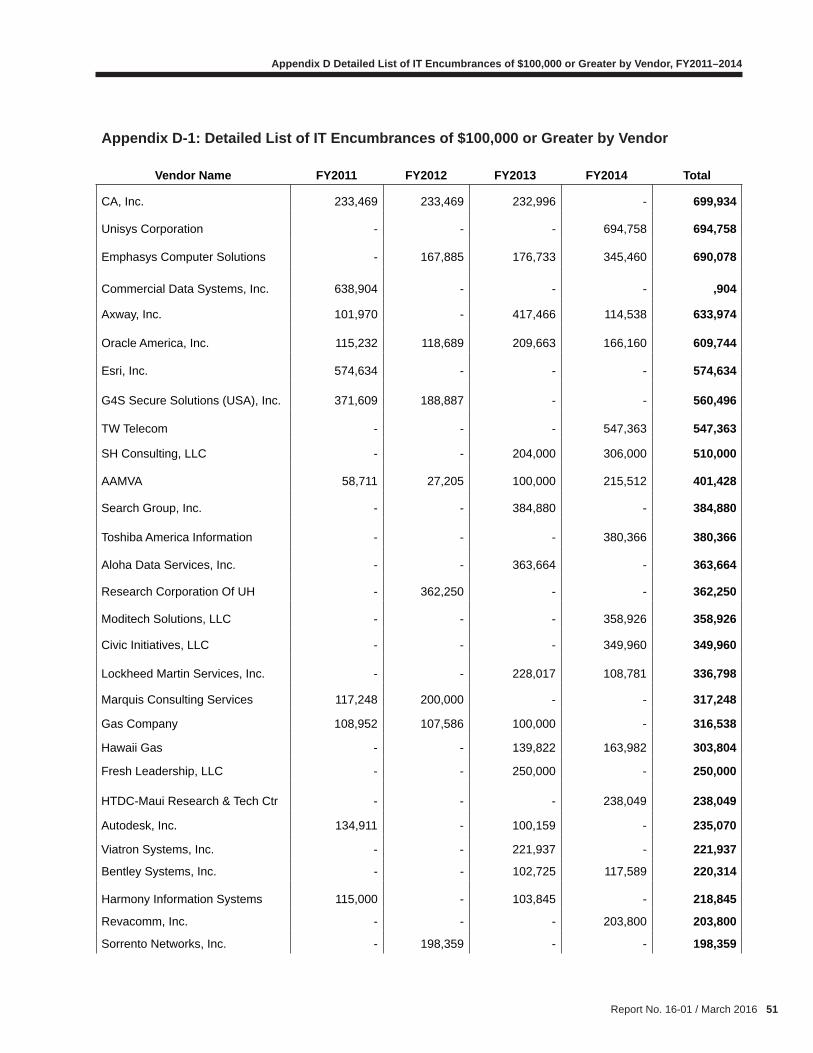
Report No. 16-01 / March 2016 51
Appendix D Detailed List of IT Encumbrances of $100,000 or Greater by Vendor, FY2011–2014
Appendix D-1: Detailed List of IT Encumbrances of $100,000 or Greater by Vendor
Vendor Name FY2011 FY2012 FY2013 FY2014 Total
CA, Inc. 233,469 233,469 232,996 - 699,934
Unisys Corporation - - - 694,758 694,758
Emphasys Computer Solutions - 167,885 176,733 345,460 690,078
Commercial Data Systems, Inc. 638,904 - - - ,904
Axway, Inc. 101,970 - 417,466 114,538 633,974
Oracle America, Inc. 115,232 118,689 209,663 166,160 609,744
Esri, Inc. 574,634 - - - 574,634
G4S Secure Solutions (USA), Inc. 371,609 188,887 - - 560,496
TW Telecom - - - 547,363 547,363
SH Consulting, LLC - - 204,000 306,000 510,000
AAMVA 58,711 27,205 100,000 215,512 401,428
Search Group, Inc. - - 384,880 - 384,880
Toshiba America Information - - - 380,366 380,366
Aloha Data Services, Inc. - - 363,664 - 363,664
Research Corporation Of UH - 362,250 - - 362,250
Moditech Solutions, LLC - - - 358,926 358,926
Civic Initiatives, LLC - - - 349,960 349,960
Lockheed Martin Services, Inc. - - 228,017 108,781 336,798
Marquis Consulting Services 117,248 200,000 - - 317,248
Gas Company 108,952 107,586 100,000 - 316,538
Hawaii Gas - - 139,822 163,982 303,804
Fresh Leadership, LLC - - 250,000 - 250,000
HTDC-Maui Research & Tech Ctr - - - 238,049 238,049
Autodesk, Inc. 134,911 - 100,159 - 235,070
Viatron Systems, Inc. - - 221,937 - 221,937
Bentley Systems, Inc. - - 102,725 117,589 220,314
Harmony Information Systems 115,000 - 103,845 - 218,845
Revacomm, Inc. - - - 203,800 203,800
Sorrento Networks, Inc. - 198,359 - - 198,359

52 Report No. 16-01 / March 2016
Appendix D Detailed List of IT Encumbrances of $100,000 or Greater by Vendor, FY2011–2014
Appendix D-1: Detailed List of IT Encumbrances of $100,000 or Greater by Vendor
Vendor Name FY2011 FY2012 FY2013 FY2014 Total
BT Conferencing Video, Inc. 179,173 - - - 179,173
Health Monitoring Systems, Inc. - - - 174,869 174,869
Kaye Scholer, LLP - - - 150,000 150,000
Pacifi c Power Group, LLC - - - 143,625 143,625
General Dynamics Fidelis - - 138,000 - 138,000
Technology Integration Group - 137,925 - - 137,925
Social Solutions Global, Inc. - - - 136,971 136,971
Grainger - - 122,508 - 122,508
Century Computers, Inc. 118,375 - - - 118,375
Desktop Solutions, Inc. - - - 113,297 113,297
Scientel Wireless, LLC - - 110,828 - 110,828
Socrata, Inc. - - 109,293 - 109,293
Dewberry & Davis Service - - - 100,257 100,257
Total $ 35,134,145 $ 50,136,493 $163,692,954 $ 110,685,178 $359,648,770
Source: Offi ce of the Auditor

Report N
o. 16-01 / March 2016 53
Appendix EDetailed List of IT Positions, Budgeted and Actual Salaries by Department, FY2011–2014Appendix E-1: Department of Accounting and General Services FY2011 FY2012 FY2013 FY2014
IT Position Title CountBudgeted
SalaryActual Salary Count
Budgeted Salary
Actual Salary Count
Budgeted Salary
Actual Salary Count
Budgeted Salary
Actual Salary
Asst Admr, Info and Comn Svcs 1 $ 88,416 $ 81,663 2 $ 90,012 $ 100,281 2 $ 90,012 $ 43,446 2 $ 90,012 $ 92,937
Business Innovation Offi cer 0 - - 0 - - 0 - - 1 56,000 23,438
Chief Information Offi cer 0 - - 1 67,221 67,221 1 306,759 306,759 1 188,688 293,376
Chief Technology Offi cer 0 - - 0 - - 0 - - 1 56,000 56,250
Computer Operation Scheduler 1 53,352 - 2 76,140 - 1 53,352 1,414 1 - 2,951
Computer Operations Supervisor I 2 105,948 96,146 3 125,688 104,273 3 145,428 146,304 3 153,996 159,363
Computer Operations Supervisor II 2 125,124 64,183 2 102,060 49,252 2 102,060 63,968 2 98,112 101,510
Computer Operator I 1 42,684 38,735 1 42,684 40,473 1 42,684 40,548 0 - -
Computer Operator II 13 541,368 437,897 13 527,076 410,618 14 608,880 464,028 14 524,796 537,723
Computer Operator III 1 56,172 3,104 3 92,688 33,610 3 129,204 122,148 3 128,568 132,876
Data Center PM, Exempt 0 - - 0 - - 0 - - 1 50,000 -
Data Entry Operator I 4 129,948 116,692 4 123,474 119,266 4 129,948 113,359 4 129,948 134,425
Data Entry Supervisor I 1 33,756 30,625 1 33,756 31,945 1 33,756 14,696 2 42,684 12,793
Data Processing Control Clerk I 4 181,176 96,470 7 174,000 111,431 8 278,484 213,528 7 246,384 186,941
Data Processing Control Clerk II 3 147,912 45,312 3 147,912 140,259 3 147,912 140,520 3 147,912 142,951
GIS Data Base Administrator 0 - - 0 - - 1 65,000 - 1 65,000 8,458
GIS Web Application Developer 0 - - 0 - - 0 - - 1 60,000 -
Information & Comn Svcs Admr 1 111,120 100,814 1 111,120 105,172 1 111,120 105,564 1 111,120 114,727

Appendix E Detailed List of IT Positions, Budgeted and Actual Salaries by Department, FY2011–2014
54 Report N
o. 16-01 / March 2016
Appendix E-1: Department of Accounting and General Services FY2011 FY2012 FY2013 FY2014
IT Position Title CountBudgeted
SalaryActual Salary Count
Budgeted Salary
Actual Salary Count
Budgeted Salary
Actual Salary Count
Budgeted Salary
Actual Salary
Information & Comn Systems Analyst 2 62,448 45,382 2 72,198 75,248 2 72,198 49,713 2 39,756 43,910
IT Manager 8 727,116 622,866 8 736,260 572,425 8 736,260 527,288 8 684,504 530,198
IT Specialist II 1 53,352 48,416 0 - - 0 - - 2 - 3,167
IT Specialist III 0 - - 1 51,312 48,563 1 51,312 48,744 0 - -
IT Specialist IV 16 862,080 747,778 18 951,588 837,522 20 1,069,296 930,064 19 1,007,220 978,984
IT Specialist V 47 3,051,728 2,623,413 48 3,070,533 2,650,528 50 3,226,528 2,703,246 47 3,033,333 3,005,988
IT Specialist VI 16 1,223,796 1,045,630 16 1,223,796 1,085,629 16 1,223,796 1,088,268 14 1,031,376 1,054,598
Network Control Supervisor 1 36,516 - 1 56,172 - 1 56,172 - 1 56,172 58,229
Network Control Technician 5 149,028 186,180 4 149,028 141,061 4 149,028 141,588 4 149,028 153,886
Radio Engineer 1 79,984 74,529 1 82,128 77,879 1 82,128 78,024 1 82,128 83,875
Senior Communications Manager 0 - - 1 73,500 26,186 1 73,500 69,314 1 73,500 67,314
Senior Enterprise Architect, Exempt 0 - - 0 - - 0 - - 1 45,000 -
Senior IT Program Manager 0 - - 1 - - 1 66,500 66,500 0 - -
Senior IT Project Manager 0 - - 1 30,548 30,548 1 82,916 82,916 1 73,000 52,145
Senior IT Security Manager 0 - - 1 34,912 34,912 1 100,372 100,372 1 73,000 8,728
Senior IT Systems Analyst 0 - 1 39,276 39,276 1 100,372 100,372 1 80,000 30,334
Senior Project Manager, Exempt 0 - - 0 - - 0 - - 6 210,000 86,013
Senior Technical/ Enterprise Architect 0 - - 1 44,888 44,888 1 119,700 119,700 1 80,000 121,763
Statewide Interoperability COO 0 - - 0 - - 0 - - 1 45,000 47,902
Telecommunications Planner 1 53,352 44,368 1 53,352 - 1 53,352 19,230 1 - 4,231
Telephone Engineer 1 70,224 63,727 1 70,224 66,584 1 70,224 66,708 1 70,224 71,716
Total 133 $7,986,600 $6,613,930 150 $8,453,546 $7,045,050 156 $9,578,253 $8,068,329 161 $8,982,461 $8,403,700
Source: Offi ce of the Auditor

Appendix E Detailed List of IT Positions, Budgeted and Actual Salaries by Department, FY2011–2014
Report N
o. 16-01 / March 2016 55
Appendix E-2: Department of the Attorney General FY2011 FY2012 FY2013 FY2014
IT Position Title CountBudgeted
SalaryActual Salary Count
Budgeted Salary
Actual Salary Count
Budgeted Salary
Actual Salary Count
Budgeted Salary
Actual Salary
Computer Programmer III 2 $ 94,824 $ 89,969 2 $ 94,824 $ 89,511 2 $ 63,532 $ 63,977 2 $ 63,532 $ 70,082
Computer Programmer IV 1 51,312 49,992 1 51,312 50,775 1 17,446 17,296 0 33,866 34,710
CSEA Computer Tech Specialist 1 45,576 - 0 - - 0 - - 0 - -
Data Processing User Support 1 35,064 - 1 35,064 - 3 118,788 104,052 2 83,724 98,769
Data Processing User Support Tech 3 113,584 105,610 3 113,584 117,255 3 113,584 99,259 2 76,104 62,232
HIJIS IT Specialist 0 - - 1 43,824 36,333 1 43,824 - 2 87,648 43,629
HIJIS Program Manager 0 - - 1 75,548 23,221 1 75,548 25,288 1 75,548 79,785
HIJIS Project IT Specialist 0 - - 1 43,824 - 1 43,824 - 0 - -
IT Manager 1 81,960 85,285 1 81,960 86,118 1 81,960 117,145 1 83,484 90,300
IT Specialist 1 - 150,573 0 - - 0 - - 0 - -
IT Specialist II 1 49,332 44,768 1 49,332 50,282 2 111,756 50,688 1 49,332 55,288
IT Specialist III 2 89,544 88,115 1 42,132 39,085 1 73,424 72,146 1 82,604 78,370
IT Specialist IV 14 735,390 650,530 15 782,802 669,680 14 754,244 669,611 16 755,060 654,501
IT Specialist V 12 757,514 625,254 12 757,514 680,939 12 757,514 710,590 13 771,124 772,695
IT Specialist VI 3 222,456 201,428 3 222,456 185,331 3 222,456 207,511 3 218,112 199,025
Teleprocessing System Monitor 1 42,450 42,700 1 42,450 42,321 0 - - 0 - -
Total 43 $2,319,006 $2,134,224 44 $2,436,626 $2,070,851 45 $2,477,900 $2,137,563 44 $2,380,138 $2,239,386
Source: Offi ce of the Auditor

Appendix E Detailed List of IT Positions, Budgeted and Actual Salaries by Department, FY2011–2014
56 Report N
o. 16-01 / March 2016
Appendix E-3: Department of Health FY2011 FY2012 FY2013 FY2014
IT Position Title CountBudgeted
SalaryActual Salary Count
Budgeted Salary
Actual Salary Count
Budgeted Salary
Actual Salary Count
Budgeted Salary
Actual Salary
AMHD IT Specialist 1 $ - $ 102,447 1 $ - $ 106,881 1 $ - $ 107,280 1 $ - $ 116,586
Application Developer 2 92,400 - 6 277,200 - 2 92,400 - 2 92,400 -
BTP DPSA III 1 - 44,473 1 - 45,234 1 - 38,424 1 - 43,540
BTP DPSA IV 2 - 95,474 2 - 97,916 2 - 107,334 2 - 106,386
BTP IT Specialist 0 - - 1 36,036 - 1 36,036 - 0 - -
BTP IT Specialist IV 1 42,180 - 1 42,180 - 1 42,180 - 0 - -
BTP Kauai IT Specialist 1 - 43,744 1 - 39,399 1 - 49,480 1 - 47,412
BTP Lab & Info Support Tech 1 - 42,050 1 - 43,486 1 - 47,697 1 - 55,342
BTP Maui IT Specialist 1 - 49,235 1 - 50,922 1 - 55,806 1 - 4,447
BTP Senior DPSA 1 - 80,181 1 - 82,922 1 - 90,886 1 - 90,094
CAMHD Applications Analyst 1 - 96,450 1 - 100,781 1 - 100,968 1 - 110,134
CAMHD DPSA 1 - 44,757 1 - 46,687 1 - 46,860 1 - 50,930
CAMHD DPSA III (Oracle) 1 - 39,672 1 - 40,196 1 - 40,020 1 - 43,496
CAMHD Networking Specialist 1 - 72,311 1 - 75,439 1 - 75,720 1 - 82,298
CAMHD Senior App. Analyst 1 - 120,560 0 - - 1 - 126,204 1 - 138,168
CORE IT Database Specialist 1 - 31,644 1 - 39,123 1 - 42,885 0 - -
CORE MIS App Inter-Context Mgt 0 - - 1 - 47,000 1 - 66,000 1 - 71,731
CORE MIS ISS Technician 2 - 70,994 2 - 74,064 2 - 74,340 1 - 42,201
CORE MIS IT Database Specialist 2 - 115,924 2 - 88,217 2 - 85,694 2 - 92,211
CORE MIS Program Specialist 1 - 53,422 1 - 55,736 1 - 55,944 1 - 60,795

Appendix E Detailed List of IT Positions, Budgeted and Actual Salaries by Department, FY2011–2014
Report N
o. 16-01 / March 2016 57
Appendix E-3: Department of Health FY2011 FY2012 FY2013 FY2014
IT Position Title CountBudgeted
SalaryActual Salary Count
Budgeted Salary
Actual Salary Count
Budgeted Salary
Actual Salary Count
Budgeted Salary
Actual Salary
CORE Res. Eval. Database Specialist 0 - - 1 - 52,042 2 - 70,700 2 - 97,164
CORE Tele-Hth/Elec Hth Rec Analyst 0 - - 0 - - 0 - - 1 - 47,400
Data Processing Systems Analyst VI 0 - - 0 - - 1 40,512 - 1 40,512 -
Data Processing User Supp Tech 10 67,514 272,532 10 141,637 304,608 12 71,724 378,301 1 - 37,847
Database Admin 2 78,000 - 1 39,000 - 2 78,000 - 2 78,000 -
ELC DPSA V 1 - 34,154 1 - 45,800 0 - - 0 - -
ELC Informatician 0 - - 1 - 15,810 1 - 51,350 1 - 54,996
Environmental Information Manager 1 - 70,766 1 - 73,825 1 - 74,100 1 - 80,535
Fern Lab Informatics Coordinator 0 - - 1 - 55,068 1 - 60,430 1 - 60,012
HIPAA Security Offi cer 0 - - 0 - - 0 - - 1 - 69,000
IT Manager 1 98,196 90,494 1 98,196 94,564 1 98,196 94,759 1 98,196 103,331
IT Specialist III 6 243,400 89,157 7 285,532 92,337 6 243,400 96,181 4 176,796 116,767
IT Specialist IV 31 1,422,837 1,127,774 33 1,560,936 1,059,623 36 1,662,276 1,192,222 35 1,622,910 1,347,019
IT Specialist V 8 497,136 408,630 9 548,448 479,150 10 547,136 543,556 10 547,136 576,202
IT Specialist VI 3 232,139 132,659 3 165,895 138,618 3 232,139 138,876 3 232,139 151,481
IT Support Tech 0 - - 0 - - 0 - - 12 105,480 382,205
MIS Trainer 3 114,000 - 3 114,000 - 3 114,000 - 3 114,000 -
Network Admin 2 78,000 - 2 78,000 - 2 78,000 - 2 78,000 -
Notifi able Dis Srvl & Info Coordinator 0 - - 0 - - 0 - - 1 - 75,684
Public Health Informatics Analyst 1 - 20,275 0 - - 1 - 60,175 1 - 62,200
Senior IT Specialist 1 - 55,358 1 - 57,250 1 - 59,750 1 - 62,200
Total 92 $2,965,802 $3,405,137 102 $3,387,060 $3,502,698 107 $3,335,999 $4,031,942 104 $ 3,185,569 $ 4,479,814
Source: Offi ce of the Auditor
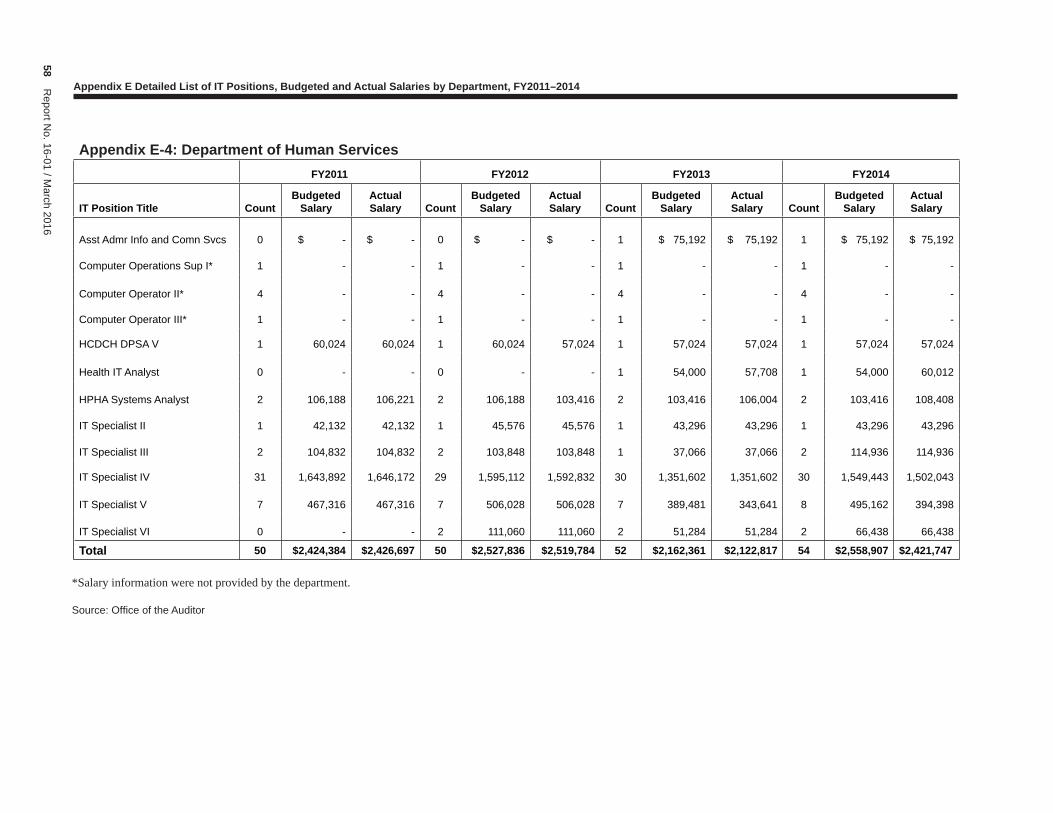
Appendix E Detailed List of IT Positions, Budgeted and Actual Salaries by Department, FY2011–2014
58 Report N
o. 16-01 / March 2016
Appendix E-4: Department of Human Services FY2011 FY2012 FY2013 FY2014
IT Position Title CountBudgeted
SalaryActual Salary Count
Budgeted Salary
Actual Salary Count
Budgeted Salary
Actual Salary Count
Budgeted Salary
Actual Salary
Asst Admr Info and Comn Svcs 0 $ - $ - 0 $ - $ - 1 $ 75,192 $ 75,192 1 $ 75,192 $ 75,192
Computer Operations Sup I* 1 - - 1 - - 1 - - 1 - -
Computer Operator II* 4 - - 4 - - 4 - - 4 - -
Computer Operator III* 1 - - 1 - - 1 - - 1 - -
HCDCH DPSA V 1 60,024 60,024 1 60,024 57,024 1 57,024 57,024 1 57,024 57,024
Health IT Analyst 0 - - 0 - - 1 54,000 57,708 1 54,000 60,012
HPHA Systems Analyst 2 106,188 106,221 2 106,188 103,416 2 103,416 106,004 2 103,416 108,408
IT Specialist II 1 42,132 42,132 1 45,576 45,576 1 43,296 43,296 1 43,296 43,296
IT Specialist III 2 104,832 104,832 2 103,848 103,848 1 37,066 37,066 2 114,936 114,936
IT Specialist IV 31 1,643,892 1,646,172 29 1,595,112 1,592,832 30 1,351,602 1,351,602 30 1,549,443 1,502,043
IT Specialist V 7 467,316 467,316 7 506,028 506,028 7 389,481 343,641 8 495,162 394,398
IT Specialist VI 0 - - 2 111,060 111,060 2 51,284 51,284 2 66,438 66,438
Total 50 $2,424,384 $2,426,697 50 $2,527,836 $2,519,784 52 $2,162,361 $2,122,817 54 $2,558,907 $2,421,747
Source: Offi ce of the Auditor
*Salary information were not provided by the department.

Appendix E Detailed List of IT Positions, Budgeted and Actual Salaries by Department, FY2011–2014
Report N
o. 16-01 / March 2016 59
Appendix E-5: Department of Taxation FY2011 FY2012 FY2013 FY2014
Title CountBudgeted
SalaryActual Salary Count
Budgeted Salary
Actual Salary Count
Budgeted Salary
Actual Salary Count
Budgeted Salary
Actual Salary
IT Manager 1 $ 73,344 $ 66,541 1 $ 73,344 $ 69,414 1 $ 73,344 $ 64,501 1 $ 73,344 $ -
IT Specialist II 1 40,548 25,686 6 307,308 34,024 5 231,816 44,494 3 147,252 -
IT Specialist III 4 178,632 157,556 4 196,104 96,104 6 302,808 197,675 6 302,808 223,763
IT Specialist IV 7 346,103 293,919 9 433,056 391,927 9 461,868 399,537 10 515,220 485,861
IT Specialist V 5 335,952 319,648 5 335,952 335,737 5 335,952 348,997 5 335,952 319,540
IT Specialist VI 2 135,468 131,716 3 200,388 98,438 3 200,388 76,287 2 137,964 87,573
Total 20 $1,110,047 $ 995,066 28 $1,546,152 $1,025,644 29 $1,606,176 $1,131,491 27 $1,512,540 $1,116,737
Source: Offi ce of the Auditor

Appendix E Detailed List of IT Positions, Budgeted and Actual Salaries by Department, FY2011–2014
60 Report N
o. 16-01 / March 2016
Appendix E-6: Department of Transportation FY2011 FY2012 FY2013 FY2014
IT Position Title CountBudgeted
SalaryActual Salary Count
Budgeted Salary
Actual Salary Count
Budgeted Salary
Actual Salary Count
Budgeted Salary
Actual Salary
Computer Operator II 1 $ 42,684 $ 9,556 1 $ 2,684 $ 41,260 1 $ 42,684 $ 38,773 1 $ 42,684 $ 4,340
Computer Op Supervisor I 1 48,048 45,266 1 48,048 46,448 1 48,048 43,763 1 48,048 49,854
Data Entry Operator I 2 54,504 43,991 2 63,900 45,400 2 63,900 52,509 2 58,092 60,260
DP Control Clerk I 1 33,756 30,531 1 33,756 16,173 1 33,756 24,363 1 30,036 14,356
Engineer (Civil) III 1 53,364 48,132 1 57,708 49,600 1 57,708 53,033 1 57,708 53,193
Engineer (Civil) V 1 62,424 62,541 1 67,488 65,240 1 67,488 67,488 1 67,488 70,081
Engineer (Civil) VI 1 75,948 77,372 1 82,128 79,392 1 82,128 84,864 1 82,128 85,279
IT Manager 1 88,476 81,991 1 88,476 85,524 1 88,476 88,476 1
88,476 97,285
IT Specialist III 1 42,144 - 1 45,576 - 1 45,576 31,730 1 45,576 47,573
IT Specialist IV 10 426,492 377,475 10 489,984 423,389 10 489,984 482,072 11 507,084 490,054
IT Specialist V 15 954,312 844,659 15 957,816 875,920 15 957,816 966,211 15 954,792 972,757
IT Specialist VI 6 439,272 340,647 6 419,568 361,944 6 419,568 436,236 6 424,092 440,127
IT Specialist VII 1 82,128 77,372 1 82,128 79,392 1 82,128 84,905 1 82,128 85,279
Total 42 $2,403,552 $ 2,069,533 42 $2,479,260 $ 2,169,682 42 $2,479,260 $ 2,454,423 43 $2,488,332 $ 2,510,438
Source: Offi ce of the Auditor

Report No. 16-01 / March 2016 61
Response of the Affected Agency
Comments on Agency Response
We transmitted a draft of this report to the Office of Enterprise Technology Services on February 23, 2016 A copy of the transmittal letter is included as Attachment 1 and the office’s response, dated March 3, 2016, is included as Attachment 2.
The office agrees with our recommendations. The State chief information officer said he looks forward to working with the Department of Accounting and General Services to implement consistent accounting codes and criteria for IT expenditures. The CIO noted that the challenges we faced in collecting executive departments’ IT expenditures are consistent with those faced during similar efforts in the past. He also pointed out that a standard taxonomy for use in all IT-related expenditures, regardless of project size, would benefit his IT governance efforts.


