report on proposed convenience store located at 123 main
TRANSCRIPT

Report on Proposed Convenience Store
Located at
123 Main St, Somewhere TX 79821
Prepared by
Prepared for
Client
2
1.Scope of work: Client engaged Talavera Consulting to provide a business plan study related for a
proposed convenience store located at the 123 Main St, Somewhere TX 79821. The
report is to provide the following information:
Current market information based on the following data:
• Current market information based on the following data:
o Overall assessment of market’s economic outlook
o Assessment of proposed locations demographic makeup, within 5 and 10
mile radius.
o Assessment of potential competition.
• Industry Report on Specific Industry:
o Operating Ratios
o Revenue Trends
o Operating margins and expenses
o Benchmark information
• Financial analysis of the following areas:
o Capital Investment
o Working Capital
o Profit and Loss
o Projected Operating Yield Trends
o Profitability Indicator Ratios
o Monthly Cash Flow Projections for 24 months.
• Provide a breakeven analysis that will outline feasible boundaries based on:
o Overall Project Cost
o Operating income based on number of clients
o Operating income based on service price structure

3
2. Market Outlook Industry - Gasoline Stations with
Convenience Store Gasoline Stations with Convenience Stores are categorized under the NAICS
code 447110 this industry comprises establishments engaged in retailing
automotive fuels (e.g., diesel fuel, gasohol, and gasoline) in combination with
convenience store or food mart items. These establishments can either be in a
convenience store (i.e., food mart) setting or a gasoline station setting and may
also provide automotive repair services.
Gasoline Stations with Convenience Stores (NAICS 447110)
Number of Establishments as of 2012 U.S. Census.
Key Industry Statistics: United States (US Bureau of Census Information)
Receipts/Revenue: United States Receipts/Revenue per Employee: United States

4
While the US. Census Bureau reported totals sales of $426,061 million for
2012, the information provided was compiled excluded information from 15
states.
According to the National Association of Convenience Stores, the U.S. convenience
store industry had overall industry sales $697.5 billion for 2014. For the same
period, U.S. convenience had record in-store sales of $214.9 billion in, higher
than overall industry sales in 1998.
The industry’s in-store sales of $214.9 billion represent an increase of 4.6% over
2013, which was itself a record year. Although more gallons of fuel were sold in
2014 than 2013, total industry fuel sales decreased by 1.8%, due to gasoline
prices that were 4% lower in 2014 than the previous year.
In 2012, the convenience store industry had record sales of $700.3 billion, with
in-store sales increasing 2.2% to reach a record $199.3 billion and motor fuels
sales increasing 2.9% to a record $501.0 billion. Convenience store pretax profits
reached a record $7.2 billion in 2012, but taken as a percent of total sales,
profits only moved from 1.027% to 1.028% of total sales.
$693.00
$694.00
$695.00
$696.00
$697.00
$698.00
$699.00
$700.00
$701.00
2012 2013 2104
$700.30
$695.50
$697.50
Convenience Stores Total Sales
In Billions

5
Overall, 83.5% of convenience stores (127,588 total) sell motor fuels, a .7%
increase (930 stores) over 2013, according to the 2015 NACS/Nielsen
Convenience Industry Store Count. The growth of convenience stores selling motor
fuels is double the overall growth in the industry, as fuel retailers add convenience
operations and convenience retailers add fueling operations. The U.S. convenience
store count increased to 152,794 stores as of December 31, 2014, an almost
1% increase (1,512 stores) from the year prior.
Convenience stores also account for 33.9% of all retail outlets in the United
States, according to Nielsen, which is significantly higher than the U.S. total of
other retail channels including drug stores (41,799 stores),
supermarket/supercenter (41,529 stores) and dollar stores (26,572 stores).
In-store sales growth in 2014 was driven by sales gains in both foodservice and
merchandise, with the highest growth in commissary (e.g., packaged sandwiches,
deli salads) up 9.8%, salty snacks (up 8.5%) and packaged beverages (up 6.5%).
Here’s how in-store sales were broken down in 2014:
• Tobacco (cigarettes and OTP): 35.9% of in-store sales
Tobacco36%
Foodservice20%
Packaged beverages
15%
Center of the store11%
Beer: 7% Other:
11%
Convenience In-Store Sales Breakdown

6
• Foodservice (prepared and commissary food; hot, cold and dispensed
beverages): 19.4%
• Packaged beverages (soda, alternative beverages, sports drinks, juices,
water, teas, etc.): 15.4%
• Center of the store (candy; sweet, salty and alternative snacks): 10.6%
• Beer: 7.3%
• Other: 11.4%
Beyond sales, convenience stores remain an important part of the economy. The
convenience and fuel retailing industry employed 2.43 million people last year (a
10.6% increase from 2013).
Convenience store pretax profits increased in 2014 to $10.2 billion, due primarily
to higher profit margins as wholesale fuel costs decrease. The industry saw an
18.8% increase in fuel margins this year, at an average of 22.2 cents per gallon
for 2014 compared to 18.7 cents per gallon in 2013.
Motor fuels continued to drive sales dollars, but in-store sales drove profit dollars.
Overall, 69.2% of total sales were motor fuels, but motor fuels only accounted
for 39.5% of profit dollars.
The industry’s bifurcation also continues, with a considerable difference between
top quartile and bottom quartile performers — although the gap was less
pronounced this year in some categories. The year also brought unprecedented
M&A activity in the convenience channel, mainly driven by Master Limited
Partnerships (MLPs), with four of the top five firms by store count selling or
acquiring stores in 2014.
During 2014 food service accounted for 33.5% of gross profit dollars, a 4.4
percentage point increase over 2013. While tobacco products constituted 35.9%

7
of in-store revenue dollars, they accounted for only 17.3% of gross margin
dollars. Packaged beverages were third, accounting for 18.5% of gross profit
dollars.
8
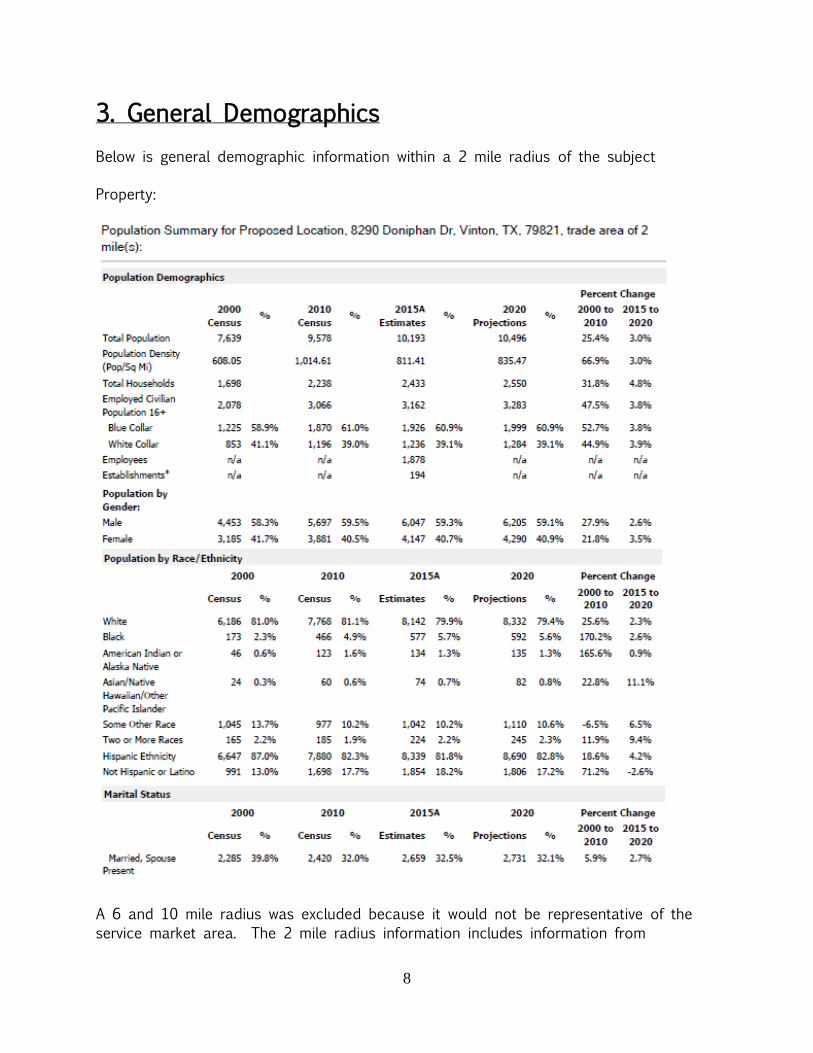
3. General Demographics
Below is general demographic information within a 2 mile radius of the subject
Property:
A 6 and 10 mile radius was excluded because it would not be representative of the
service market area. The 2 mile radius information includes information from

9
transcends various geographical barriers such as the freeway. A more representative
segment of the service area would be the community of Somewhere Texas.
Somewhere, TX
Somewhere is a very small village located in Northwest of El Paso, TX with a
population of 1,951 people and just one neighborhood, Somewhere TX is on the
smallest communities in Texas.
The per capita income in Somewhere TX in 2010 was $11,145, which is low income
relative to Texas and the nation. This equates to an annual income of $44,580 for a
family of four. Somewhere also has one of the higher rates of people living in poverty
in the nation, with 35.53% of its population below the federal poverty line.
The population of Somewhere TX has one of the lowest overall levels of education in
the country: only 4.35% of people over 25 hold a college degree. The national average
for all municipalities is 21.84%.

10
Location
Somewhere, TX is located in the El Paso Metropolitan area.
Ages and Marital Status
The majority of the population is under 30 years old, with 41.3% married.
Occupations and Workforce
Because occupations involving physical labor dominate the local economy, Somewhere
TX is generally considered to be a blue-collar town. 37.43% of the Somewhere
workforce is employed in blue-collar occupations, compared to the national average of
11
27.7%. Overall, Somewhere is a village of sales and office workers, service providers
and construction workers and builders. There are especially a lot of people living in
Somewhere who work in office and administrative support (13.90%), sales jobs (9.27%)
and teaching (7.66%).
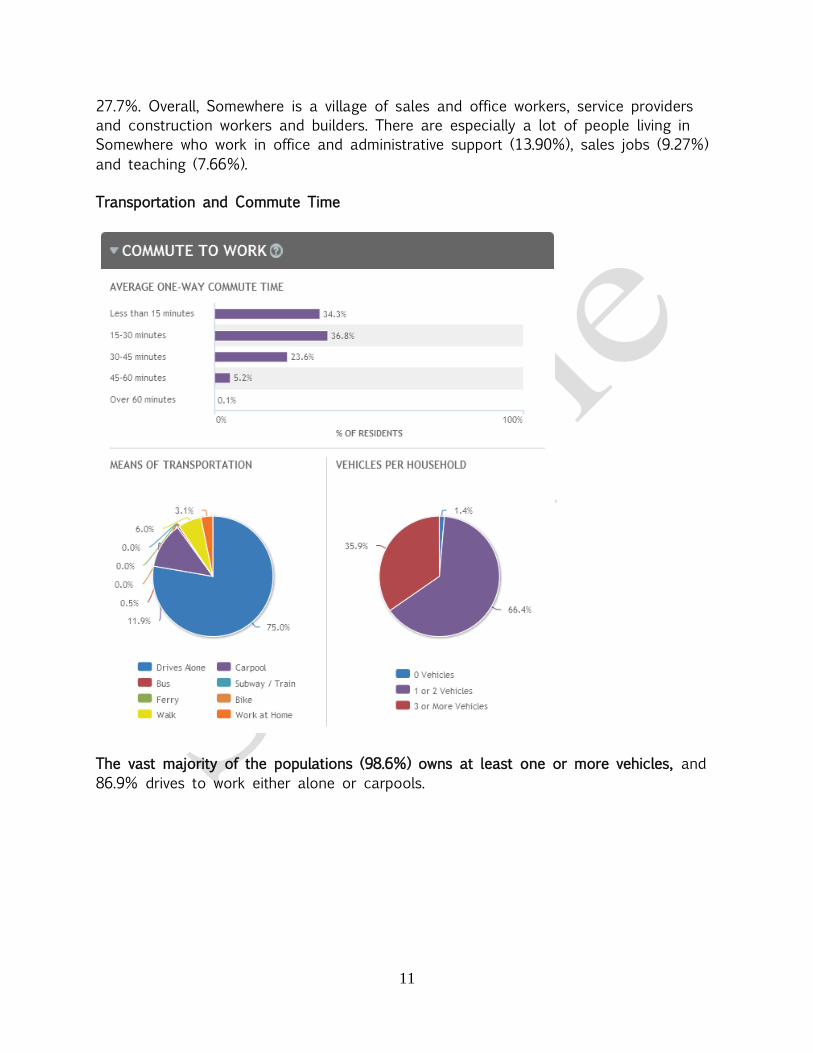
Transportation and Commute Time
The vast majority of the populations (98.6%) owns at least one or more vehicles, and
86.9% drives to work either alone or carpools.
12
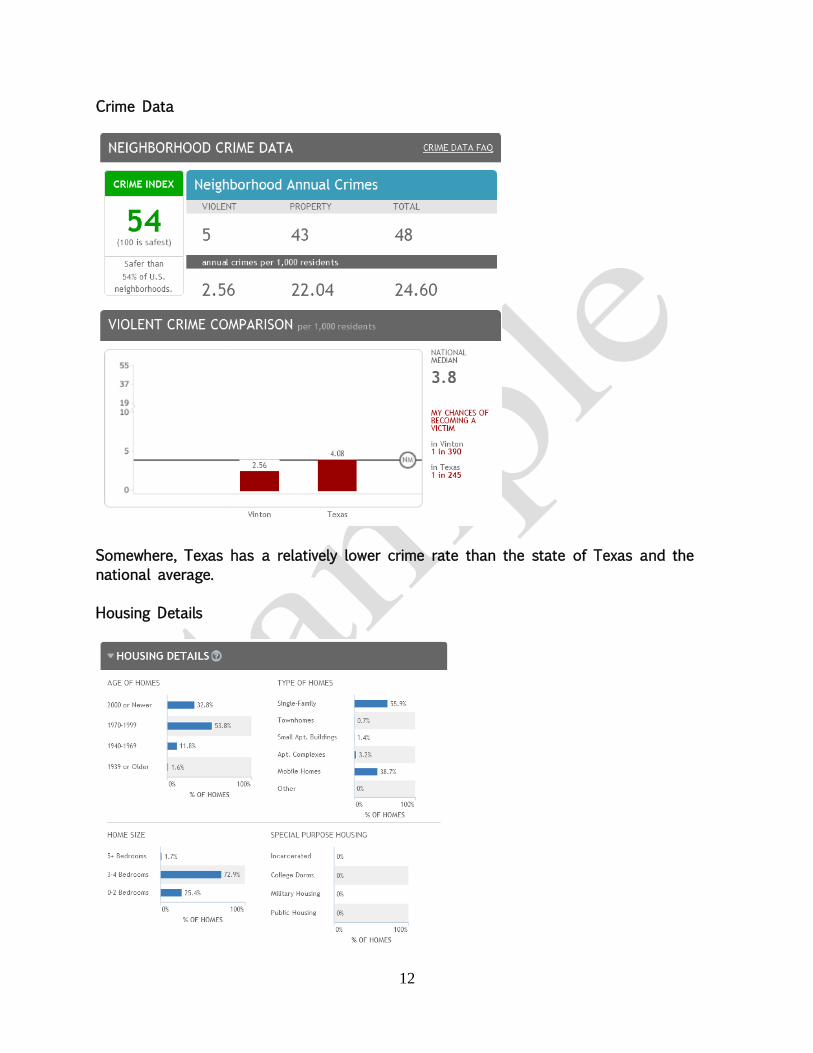
Crime Data
Somewhere, Texas has a relatively lower crime rate than the state of Texas and the
national average.
Housing Details

13
El Paso Texas Metropolitan Area Overview
Source U.S. Census Bureau and Borderplex Economic Outlook: 2016, UTEP Border Region Modeling Project.
El Paso is located at the westernmost tip of Texas, bordering Mexico and New Mexico.
As of 2014, the City of El Paso was the fifth largest city in the state of Texas with an
estimated population of 679,034. The City of El Paso is located within El Paso County,
with an estimated population of 831,900 as of 2014. Across the Texas-Mexico border
is Ciudad Juarez with an estimated population of 1.2 million. The two cities along with
Las Cruces, form a combined international metropolitan area sometimes referred as the
El Paso del Norte Region. The El Paso-Juárez region is the largest bilingual, bi-national
work force in the Western Hemisphere. As shown in the graph above, El Paso’s population
650,000
700,000
750,000
800,000
850,000
900,000
El Paso County Population Year Growth
2006 2.2
2007 2.0
2008 1.9
2009 2.2
2010 2.2
2011 2.1
2012 0.8
2013 0.0
2014* 1.2
2015* 1.4
2016* 1.5
El Paso Population

14
growth rate temporarily stalled in 2013, but it is estimated to have regained strength in
2014 and is projected to continue growing until at least 2016. (UTEP, US Census Bureau)
According to U.S. Department of Housing and Urban Development’s Comprehensive
Housing Market Analysis for El Paso Texas, the current population of the El Paso
county/metropolitan-area is an estimated 831,900, which reflects an average annual
increase of about 7,825, or 1.0 percent, from the April 2010 census population of
800,647. From 2000 to 2010, the population grew by an average of 12,100, or 1.7
percent, annually. Net in-migration during that decade accounted for slightly more than
20 percent of the population gain; the remainder of the growth came from net natural
change (resident births minus resident deaths). Population growth in the El Paso was
strongest from 2006 to 2009, when the population increased by an average of 14,650,
or 2.0 percent, annually. The growth peaked at about 16,800 people in 2009. Previous
population growth from 2009 to 2012 was largely attributable to greater net migration
into the County associated with troop increases at Fort Bliss. In 2009 and 2010 alone,
more than 11,000 soldiers and their families relocated to El Paso. (HUD, UTEP)
An estimated 272,300 households reside in El Paso, which represents an increase of
3,925 households, or 1.5 percent, annually since 2010. The number of Households in El
Paso increased by 4,650, or 2.2 percent, annually from 210,022 households in 2000 to
256,557 households in 2010. The homeownership rate in the HMA decreased from 2000
to 2010, from 63.6 to 63.0 percent. The homeownership rate, which has decreased
slightly since 2010, is currently estimated at 62.3 percent. (HUD)
From 2014 to 2017, the population is expected to increase by an average of 9,600, or
1.1 percent, annually. By April 1, 2017, the total population is projected to be 860,700.
The number of households is expected to grow by 3,400, or 1.2 percent, annually to
reach approximately 282,500 by April 1, 2017. (HUD)

15
A young metropolitan area, the median age of El Paso County residents during the last
census was 30.68 years. According to the Borderplex Economic Outlook for 2016, it
forecasted that an improved job market conditions in El Paso will result in positive in-
migration flows throughout 2015 and 2016. Although natural increase remains positive,
the gap between births and deaths is projected to slowly narrow through 2016. The
number of households in El Paso is predicted to move beyond 285.2 thousand by the
end of 2016.
Employment
El Paso’s economy is primarily based on government, wholesale and retail, education
and health services, warehousing and, increasingly, on professional and business services.
As a consequence of the large government presence in El Paso, the local economy was
insulated from the sustained economic downturn that occurred across most areas of the
country from late 2007 through mid 2009. The local unemployment rate decreased to
7.9% in 2014 from 8.8% in 2013, and it is projected to remain on a downward trend
over the next couple of years. It is estimated for unemployment rate to decrease to
7.4% and 6.8% for 2015 and 2016, respectively. Part of the reason behind the declines
in the rate of joblessness during the last two years is a lower labor force participation
rate.

16
Source U.S. Census Bureau and Borderplex Economic Outlook: 2016, UTEP Border Region Modeling Project.
The largest employment sector in El Paso is the government sector, which accounts for
nearly 24 percent of total nonfarm payrolls. El Paso is home to Fort Bliss Army Base,
headquarters of the William Beaumont Army Medical Center and the U.S. Army Sergeants
Major Academy. As the leading employer in the El Paso, with approximately 28,650 troops
and 8,350 civilian personnel, Fort Bliss has an estimated $3.1 billion annual economic
impact on the HMA (U.S. Army). The 2005 Defense Base Closure and Realignment (BRAC)
Commission Report positively affected Fort Bliss. The base was transformed into a heavy
armor training post that included 11,500 new troops from the 1st Armored Division,
previously stationed in Germany, and units from Fort Sill, Oklahoma, and Fort Hood,
Texas. An estimated 15,900 military jobs and 380 civilian jobs transferred to Fort Bliss,
bringing the total number of troops stationed at Fort Bliss to 35,000 by 2013. In addition,
the U.S. Air Force is in the process of moving the newly configured Security Forces
Regional Training Center to Fort Bliss, the military’s preferred site for the training
operation. When complete, the move will bring between 8,000 and 10,000 airmen to Fort
Bliss each year for security forces training, beginning in September 2015.
The state government subsector accounts for nearly 15 percent of all government sector
employment in the El Paso. UTEP is a major contributor to the El Paso economy, with
23,000 students enrolled and about 3,700 faculty and staff employed. The university has
an estimated annual economic impact of $1.3 billion on the El Paso economy (Institute
for Policy and Economic Development at UTEP). El Paso is also home to another large
state education institution, the Texas Tech University Health Sciences Center El Paso
campus, a 4-year medical school that enrolls approximately 420 students and 250
residents. The school employs 1,200 faculty and staff and has a $205 million operating
budget. The Table below provides a list of the largest employers in El Paso; two of the
top three are in the government sector.
Below are the top ten employers for the El Paso metropolitan area:

17
Excludes local school districts. Fort Bliss employment includes 28,650 military personnel.
El Paso is one of the primary entry points for trade and population flows between Mexico
and the United States. El Paso derives a significant economic benefit from its proximity
to Mexico. Mexican nationals spend $4.5 billion per year in Texas border retail,
approximately 10 to 15 percent of which is spent in the city of El Paso (The Borderplex
Alliance). The 47,200 jobs currently in the wholesale and retail trade sector account for
16 percent of all jobs in El Paso, a substantial number of which result from the economic
interaction between the two countries. (HUD)
Total nonfarm payrolls in the El Paso have increased by an average of 2,350 jobs, or
0.9 percent, a year since 2000. From 2004 through 2008, nonfarm payrolls in El Paso
increased by an average of 4,625 jobs, or 1.8 percent, annually, to an average of
278,100 jobs in 2008. During this period, the professional and business services, the
government, and construction sectors led job growth, with average annual increases of
1,200, 1,100, and 800 jobs, or 4.2, 1.9, and 6.1 percent, respectively. (HUD)
The economy in El Paso began to decline in 2009, when payrolls decreased by 4,600
jobs, to 273,500. Job losses during 2009 were concentrated primarily in the manufacturing
and the wholesale and retail trade sectors, which lost 2,400 and 2,000 jobs, or 12.2 and
5.7 percent, respectively. The decline in manufacturing was primarily a result of jobs
relocating across the border to Mexico. During 2010 and 2011, nonfarm payrolls began
Employer Sector
Number of
Employees
Fort Bliss Army Base Government 37,000
T&T Staff Management, Inc. Professional & Business Services 4,400
University of Texas at El Paso Government 3,700
Sierra Providence Health Network Health Services 3,075
RMPersonnel Professional & Business Services 1,950
Dish Network Corporation Technical Support Center 1,800
Alorica Inc. Professional & Business Services 1,750
ReadyOne Industries Manufacturing 1,300
GC Services Limited Partnership Professional & Business Services 1,200
Texas Tech University Health Science Center Government 1,200
El Paso Major Employers

18
to improve and increased by 3,150 jobs, or 1.1 percent, annually, to 279,800 jobs. Growth
during the period was partially a result of significant employment gains in the education
and health services, leisure and hospitality, and government sectors, which increased
annually by 1,300, 1,050, and 700 jobs, or 3.5, 3.7, and 1.0 percent, respectively. (HUD)
The total number of businesses operating in El Paso is forecast to surpass 14.3 thousand
by 2016. Because economic conditions have improved, the number of business
bankruptcies is projected to decline through the end of 2016. A similar downward
trajectory is also predicted for personal bankruptcies. Local college enrollments, however,
grow more slowly as increased hours worked reduces time available for academic pursuits.
Labor force participation is expected to recover at least some of its losses as employment
increases in 2015 and 2016. Among other things, lower energy prices are allowing
manufacturing jobs to stage comebacks in the United States and those increases have
helped create new business opportunities on both sides of the border. Sectors expected
to add to their payrolls in order to meet growing sales volumes in 2015 and 2016
include construction, retail, trade, call centers and healthcare companies. Job losses
were experienced due to budgetary weaknesses by local government, state government,
and federal civilian government payrolls. (UTEP)
El Paso Personal Income
Borderplex economic conditions strengthened substantially in 2014. Employment grew
throughout the Paso del Norte Region, with the strongest job gains occurring in Ciudad
Juarez. Total personal income in El Paso is projected reach $30.1 billion by the end of
the forecast period, with per capita income climbing to $34,965. Emblematic of border
region economic expansion, total commercial activity in El Paso is projected to exceed
$12.5 billion. (UTEP)
Stronger labor market conditions allow personal income growth to accelerate and remain
near 5.0 percent per year throughout 2015 and 2016. Wage and salary disbursements

19
will grow at successively higher rates through 2016. More robust business balance sheets
are behind the lower volumes of business bankruptcies. Not surprisingly, residence
adjustments continue to increase in magnitude as residents of nearby communities on
both sides of the border flock to El Paso for work. Dividends, interest, and rental incomes
also do relatively well as a consequence of solid performances in both equity and real
estate markets. Unemployment transfers are predicted to decline sharply as a function
of ongoing erosion in the jobless rate. (Borderplex Economic Outlook, 2016)
Source U.S. Census Bureau and Borderplex Economic Outlook: 2016, UTEP Border Region Modeling Project.
Stronger labor market conditions allow personal income growth to accelerate and remain
near 5.0 percent per year. Wage and salary disbursements are projected to grow at
successively higher rates through 2016. Similar improvements are observed for proprietor
incomes. More robust business balance sheets are behind the lower volumes of business
bankruptcies highlighted above. Not surprisingly, residence adjustments continue to
increase in magnitude as residents of nearby communities on both sides of the border
flock to El Paso for work. Dividends, interest, and rental incomes also do relatively well
as a consequence of solid performances in both equity and real estate markets. Along
those lines, retirement transfers grow at increasing rates each year of the outlook. Better
federal fiscal performance allows income maintenance transfers to also expand at faster
rate.
-
5,000
10,000
15,000
20,000
25,000
30,000
35,000
2006 2007 2008 2009 2010 2011 2012 2013 2014 2015 2016
Personal Income 18,303 19,644 20,802 21,477 22,792 23,985 24,974 26,014 27,289 28,607 30,160
Percent Change 8.6% 7.3% 5.9% 3.2% 6.1% 5.2% 4.1% 4.2% 4.9% 4.8% 5.4%
In M
illio
ns
of D
olla
rs
El Paso Personal Income
20
Downtown El Paso and Quality of Life Bonds
El Paso has emerged as being one of the fifteen U.S. cities with up and coming revitalized
downtowns. Located in the heart of downtown El Paso, the Southwest University Park
opened in 2014, and won Ballpark of the Year Award for the same year. The El Paso
Chihuahuas, the ballpark’s official team, have drawn more than 500,000 fans during its
first season, becoming just the fourth team in the Pacific Coast League to accomplish
the feat.
There are additional amenities slated to come to the downtown area. One such amenity
will be the bus rapid transit (BRT) system. When completed, it will provide transportation
choices to connect residents to downtown El Paso. Another step in the right direction
is the redevelopment of all public owned parking lots around the Union Depot, plus the
development of an expanded mix of restaurants, shops, and high quality condominiums
fronting a formal plaza. These developments should jointly help to improve economic
conditions in this portion of the City.
In 2012, the City of El Paso voted and approved the issuance of $473 million worth of
bonds for quality of life improvements to be implemented over the next 7 years, in
addition to an estimated $500 million in regular repair and maintenance to be spent in
the upcoming years. As of 2015 the City of El Paso’s debt had ratings of A2 according
to Moody's Investors Service.

21
4. Convenience Store Operations
While most people assume that stores that sell gas rake in big profits of $1 or more
per gallon, profits are pennies per gallon at the pump, and a store usually makes an
average of about 30 to 50 cents total on a fill-up. Gross margins (the markup before
expenses are factored in) on gasoline have averaged 18.9 cents per gallon (5.7%) over
the past five years.Gross margins for fuel at convenience stores are roughly one-half of
the gross margin of that renowned low-cost retailer Costco establishes as a benchmark
for its products. Convenience stores sell about 80% of the fuel purchased in the United
States and after expenses, especially credit card fees, the average pretax profit is around
3–5 cents per gallon. Fuel margins are slim because of consumer price sensitivity. Nearly
three in four consumers (71%) say that price is the most important factor in determining
where they buy gas. The percentage of customers who say price is the most important
factor has stayed fairly consistent since 2007.
Most Important Factors for Gas Consumers
(Source: 2015 NACS Consumer Fuels Survey)
Consumers also will drive somewhere else to find a better price. Two-thirds of consumers
(64%) would make a left-hand turn across a busy road to save 5 cents per gallon and
0% 20% 40% 60% 80%
Ease of Entrance or Exit
Price Sign at Store
Brand
Location of Store

22
nearly the same percentage (63%) would drive five minutes out of their way to save five
cents a gallon.
It is common for retailers to offer competitive prices on fuel so they can have a much
better chance to get that consumer inside the store for additional purchases beyond the
low-margin gas purchase. While motor fuels drive sales dollars for convenience stores,
in-store sales drive profit dollars. On average, 71% of a store’s total sales are motor
fuels, but motor fuels only account for 36% of profit dollars.
Among the 35% of consumers who went inside the store the last time they bought fuel,
most of them made a purchase. Convenience stores sell immediate consumption items
— 84% of the items sold inside a store are purchased for consumption within an hour.
A beverage or snacks are the two most popular items bought in stores by customers
also buying gas. While in-store items drive profits, gross margins inside the store are in
line with those in other retail formats.
In-store convenience store margins are about 27% for merchandise and 56% for
foodservice. By comparison, grocery stores have gross margins of 27%, according to
The Food Industry Speaks 2011, published by the Food Marketing Institute (FMI), the
trade group representing grocery chains.
Traffic and Transactions
For convenience stores, the increase in customer traffic in stores doesn’t necessarily
correlate to more customers on the road — they are already on the road and visit a
convenience store because it is on their way and convenient. Convenience stores seek
out locations with a variety of favorable characteristics, including high traffic counts past
the proposed site. In neighborhoods, convenience stores have the tightest shopping radius
of any retail establishment (most customers generally come from within a 2-mile radius,
as opposed to 10 miles for grocery stores and as much as

23
40 miles for big-box retailers) and the people in and around the stores reflect the
community.
When looking at traffic, it’s important to look at both customer counts and the length
of time customers spend in stores. The average convenience store has 1,130 transactions
per day. Of that total, 293 are at the pump, and 837 are inside the store. Of those
consumers who buy gas, 35% say that they also went inside the store, whether to
purchase merchandise, go to the bathroom or use the ATM. Parking lots at convenience
stores are much smaller than other retail formats and the reasoning is simple: Parking
lots are larger at locations where customers spend a lot of time inside the stores. The
core proposition of convenience stores is convenience/speed of service. Time in
convenience stores is limited; customers want to get what they need and move on
quickly. The average time a convenience store customer spends from the time they leave
their car to return to their car with a purchase is 3 minutes and 33 seconds. This
transaction speed is less than one-tenth the time spent in grocery stores, where the
average is 41 minutes, which doesn’t include the time spent driving to and from the
store. Convenience stores need parking lots large enough to accommodate peak traffic
patterns, but overall these footprints are smaller than those of other formats, like grocery
stores.
The average convenience store provides 15 jobs in the community, split about equally
between full- and part-time workers. Many people in the community are familiar with
stores because they worked in a store. Nationwide, 11% of adult Americans say they
have worked at a convenience store or gas station. And those who have worked at
convenience stores found it to be very positive experience.
Crime
According to the latest information in the FBI Uniform Crime Report, in 2013, 5.0% of
total robberies were at convenience stores, and 2.4% were at gas stations. Meanwhile,
13.3% were at a “commercial house” a bar or restaurant or other retail establishment,
24
and 1.9% were at banks. Overall, most robberies in the United States occur at home or
on the street. Street muggings account for 43.5% of robberies; robberies at a residence
account for 16.9% of all robberies. Concerns over a higher likelihood of fires are also
raised by groups opposed to new convenience stores. However, the data show that these
concerns are unfounded. The National Fire Protection Agency examined all fires between
2007-2011 (the latest analysis available) and reported that 1.6% of vehicle fires were
reported at convenience stores and gas stations. The group also examined structural
fires and found that convenience stores and gas stations combined were responsible for
only 0.3% of all structural fires and only 0.4% of all damage associated with these fires.
In regards to drunk driving, there is the overall misperception that there is a strong
relationship between drunk driving and convenience stores. But there is 30 years of
data suggesting otherwise. Two California-based studies from 1985 found that less than
1% of drunk drivers had purchased their alcohol from a convenience store. An updated
study found that more than half of all drunk drivers (54%) had their last drink at an
establishment licensed to sell on-premise consumed alcohol (bar, restaurant, club,
stadium, etc.). Another 33% had their last drink in a private residence. Nearly half of
those arrested (47%) had been at their place of last drink for more than 2 hours.
How Branded Stations Operate
Major oil companies have essentially exited the retail fuels business, but it often looks
like they dominate the retail landscape. About half of the fueling stations in the
United States sell a brand of fuel from one of the 15 major refiners/suppliers, which
often makes the signage touting a particular fuel brand seem like an oil company
owns the store.
But instead the contractual relationship for fuels is much like that inside the store,
where beverage companies often help provide branded fountain dispensers that
dispense a branded soft drink. Both the oil company and the beverage company help
the retailer sell product, but that doesn’t mean they own the store.

25
Retailer Benefits
For retailers, being branded means consumer recognition. More than half of all
convenience stores selling fuels (58%) are single-store operations, so having a branded
contract with a major refiner/supplier instantly provides a retailer with a familiar brand
for their top product: motor fuels. A branded fuel can also determine where some
customers choose to shop.
While price is still the number-one determinant for gas purchases, about one in
12 motorists consider fuel brand as the top reason for their purchasing decision.
A branded contract also guarantees fuel supply, especially when supplies are tight.
Supply guarantees can also smooth out extreme price volatility seen in the wholesale
gas markets.
There also are non-fuel benefits to branding. Operators can take advantage of the oil
company’s knowledge in retail best practices for attracting customers and employee
training tools. Retailers can also receive financial support such as an imaging
allowance (loan) to improve the look of the store.
Major Oil Company Benefits
Major oil companies shed their retail portfolios to better utilize their assets in upstream
production — that is, oil refining and/or oil production. Instead of tying up resources
on real estate and making a few cents a gallon selling fuel, they can funnel their
resources into large-scale, long-term projects. But there is obvious value to having your
company name displayed in front of millions of consumers every day. And this is why
the major oil companies continue to brand stations that they don’t own or operate. A
second reason is that branded relationships give oil companies a guaranteed customer
for their product, and at predictable volumes. The same holds true for other refiners
or supply companies.

26
Contractual Terms
What are the typical terms of these branded contacts? While every contract differs,
here is a broad overview:
• Length
A typical contract is for 10 years, although contracts may be as long as 20 years
or as short as 3 years for renewed contracts.
• Volume requirements
Contracts typically set forth a certain amount of fuel each month that retailers
must sell. Usually retailers can sell more than the agreed-to amount, but when
supply disruptions exist, they may be put on allocation and only given a percentage
of what they historically receive in a given time period. This enables the supplier
to more efficiently manage fuel distribution to all branded outlets in an equitable
fashion.
• Image requirements
A branded retailer receives marketing muscle from its oil company partner, which
may include broad advertising to encourage in-store sales. Also, the oil company
may provide financial incentives to display its brands. This also depends on who
operates the station and whether the store owner has access to capital. In
exchange, the oil company expects the store to adhere to certain imaging
requirements, including specific colors, logos and signage, standards of cleanliness
and service. The oil company often relies on mystery-shopping programs to assess
compliance.
• Wholesale price requirements
A branded retailer must purchase fuel from a branded supplier or distributor.
Branded contracts benchmark the wholesale price to common fuels indexes, such
27
as Platt’s, plus a premium of a few cents for brand/marketing support. Some
branded contracts also stipulate the retail markup on the fuel through a
“consignment agreement,” whereby the supplier or distributor retains ownership of
the fuel until it is sold and pays the retailer a commission.
Types of Branded Retailers
There are different ownership structures within the branded station industry:
• Regional company or chain operated - A chain of convenience stores with a
common name that operates the branded locations. In many cases, a chain may
sell different brands at different stores, based on the needs of the marketplace
and terms of contracts that may have been carried forward from stores that were
acquired from other operators. Many operations of this kind serve as distributors
to themselves and maintain supply agreements with the branded oil companies.
• Lessee dealers - The dealer/retailer owns the business. A major or regional oil
company or a distributor owns the land and building and leases it to a dealer.
The dealer operates the location and pays rent to the owner, as opposed to an
open dealer who owns the property. This arrangement gives the oil company or
distributor a guaranteed supply outlet for its petroleum products, pursuant to a
supply contract. A typical lessee dealer may operate more than one facility and
does not wholesale gasoline or sell to other dealers.
• Open dealer operated — The independent dealer purchases fuel from the oil
company or a distributor, supplies fuel to the station — and possibly others —
owns the business and owns or leases the building/facility independent from
any supply agreement. The dealer may contract with a manager to run the
business or run it himself.

28
• Company operated — A “salary operation” where a major or regional oil
company or a distributor owns the building/facility and the business. The
company pays a salary to the managers/proprietors and supplies fuel to the
location. This is also known as company-operated and direct operated retail.
Current Issues in the Industry
C-Stores could benefit if rules on craft beer sales end.
Sales of craft beer at convenience stores could rise if states successfully scale back
industry distribution requirements. With craft beer sales dramatically outperforming sales
of traditional brews in the US, states are thirsty for the tax revenue generated by the
purchase of IPAs, Porters, and their liquid ilk. Yet many small brewers have limited
exposure and lack distribution deals, while some states have archaic laws regulating or
even prohibiting beer sales. Now some states (including California, Florida, and Illinois)
and the craft beer industry are pushing to reduce the barriers slowing craft beer growth,
with the intent of expanding their market shares (and generating more tax revenue). A
bill sent to the governor of Illinois in June 2015 would allow more breweries to bypass
distributors and sell beer directly to retailers, according to Bloomberg.
Current Industry Data
• US consumer spending on nondurable goods, an indicator of convenience store
sales, fell 3 percent in June 2015 compared to the same month in 2014.
• US retail sales for gasoline stations, a potential measure of demand for
convenience items, and decreased 19.7 percent in the first seven months of
2015 compared to the same period in 2014.
• US tourism spending on all tourism goods and services, an indicator of tourism
spending at convenience stores, increased 1.4 percent in the first quarter of
2015 compared to the same period in 2014.

29
Growth
US personal consumption expenditures of food, nonalcoholic beverages, and tobacco,
all major indicators for convenience stores and truck stops, are forecast to grow at an
annual compounded rate of 2 percent between 2015 and 2019.
Data Published: February 2015 First Research forecasts are based on INFORUM forecasts that are licensed from the
Interindustry Economic Research Fund, Inc. (IERF) in College Park, MD. INFORUM's.
0%
1%
1%
2%
2%
3%
3%
2014 2015 2016 2017 2018 2019

30
5. Site Location Requirements A convenience store site consists of three functional components: access, the forecourt,
and the store envelope. A description of each component follows.
Easy access to the site is an absolute necessity for a convenience store to thrive.
All other factors being equal, the site with the most convenient access attracts the most
customers. For a convenience store in an urban setting, the industry considers 100 feet
of frontage to be the minimum amount of space necessary for access. For a location
with truck fueling, a minimum of 300 feet of frontage and adequate space for vehicles
to turn around are essential.
Entry and exit characteristics are usually identified as the permitted turning movements
into and out of the site. For example, a site with full in and out access is described as
"left-right in and left-right out." Limited access caused by a median may be described
as "right-in, right-out," indicating that only right-hand turns into the site are permitted
and only right-hand turns leaving the site are allowed.
The store envelope includes the building footprint, the drive-through lane, and parking
areas. Many local zoning ordinances are drafted from model legislation and call for a
minimum of 3.3 on-site parking spaces for every 1,000 square feet of building area. The
average convenience store site today is 52,991 square feet, a little over an acre.
While these are ratios and requirements usually used in the industry, Site selection
criteria will vary from company to company, depending on the target market and business
model.
Branding Requirements
The convenience store industry is moving toward expanding their customer base by
offering “on-the-go” eating and selling a wider range of food products.

31
Branded fast food restaurants within convenience stores are becoming more common
due to the food franchises taking advantage of the leverage of an established equity,
and convenience stores being able to sell diverse options at much higher margins that
gas.
In addition, large fast food chains, such as McDonalds, claim that shared land can lower
development and constriction cots. Based on this trend this reports applies the criteria
established by McDonalds and ExxonMobil for the potential sites.
McDonald's Site Criteria
McDonald's market criteria for a co-branded facility are no different than the criteria
required for a traditional restaurant. McDonald's criteria for urban and suburban sites
are listed as follows:
The following are McDonald's criteria for rural sites:
• The store must be in a prime location.
• The approximate lot size should be 48,000 square feet.
• Frontage should be 223 linear feet.
• There should be a total of 40 parking spaces.
• Total drive-through stacking should be seven cars.
ExxonMobil Site Criteria
Not every site is suitable for retail fuel sales, and major oil companies such as Chevron,
Shell, and ExxonMobil have established minimum criteria that must be met before sites
can carry their brands.

32
Site selection criteria are established to help retail operators select economically viable
sites. Brand identity and protecting their brand's public image are important to oil
companies. When a retail store affiliated with a nationally recognized brand fails, the oil
company's image is tainted and the public associates the brand with failure.
The specific site selection criteria used by ExxonMobil are listed here to provide an
example of how oil companies evaluate potential sites:
• Exclusivity of trade area. A trade area's supply and demand profile is a key
factor in site selection.
• High traffic counts. There should be 20,000 vehicles passing by the convenience
store each day.
• More than 56,000 net usable square feet. The company will consider less square
footage for stores in metropolitan markets.
• Residential density. There should be 15,000 existing or planned residences within
a 1.5-mile radius.
• Excellent visibility. The site must be visible from one-third of a mile away.
• Excellent accessibility. There should be convenient ingress and egress from both
primary and secondary streets.
• Signalized corner intersections. Ideally, stores should be located at four-corner
sites.
• Absence of operating restrictions. A store should be open 24 hours a day, seven
days a week, sell beer and wine, and have a car wash.

33
Below is a matrix of the proposed site in regards to the McDonald’s and ExxonMobil
Criteria:
Traffic Capture Rates
Convenience store operators frequently project traffic capture rates for the locations of
their stores. Traffic capture rates are a percentage measure of the number of vehicles
entering the site from the passing vehicle traffic. Retail pricing is the single most important
factor that impacts traffic capture rates. Lower-priced gasoline attracts more customers
and increases traffic capture rates. However, other factors such as visibility and ease of
access play an important role when pricing is held constant.
The relationship between traffic volume and traffic capture rates for a particular site is
generally inverse. Higher traffic volumes usually result in lower traffic capture rates. This
can be explained by several causes. Higher speeds are usually associated with higher
traffic volumes. For example, traffic volumes of 50,000 to 100,000 vehicles per day are
typical of freeway traffic and speeds greater than 50 miles per hour. Drivers in this type
of traffic are less likely to make impulse decisions to stop at a convenience store than
Yes No Unknown
McDonalds
Prime Location X
Lot of at least 48,000 Sq Ft X
Frontage of 223 linear feet X
40 Parking Spaces X
Drive-through for 7 Car X
Exxon Mobil
Exclusivity of trade area. X
High traffic counts. X
More than 56,000 net usable square feet. X
Residential density. X
Excellent visibility. X
Excellent accessibility. X
Signalized corner intersections. X
Absence of operating restrictions. X
Proposed Site

34
drivers in slower traffic. Higher traffic volumes are also associated with destination travel
rather than commuter or local travel.
A study conducted by Robert Bainbridge and published in the Appraisal Journal Winter
2012 edition demonstrates that traffic capture rates can be projected when the traffic
volume is known. The equation for this relationship is:
y = 27.901 [x-0.738] where:
y = the traffic capture rate
x = traffic volume
The coefficient of determination ([R²]) in this study is 53%. In this real-world study, traffic
volume alone accounted for 53% of the variability in capture rates among the locations.
The original sample used in the study included locations (data points) with many different
brands as well as different retail pricing. It is to be noted that while there is positive
correlation, the coefficient of determination for the model it is low and other factors
can create a high degree of uncertainty.
According to the Texas Department of Transportation, the following traffic count was
recorded on Doniphan St. less than ½ mile from the proposed location:
Station Flag 72H116A
Site ID H 116A
AADT 2013 7,029
AADT 2012 8,300
AADT 2011 8,500
AADT 2010 8,200
AADT 2009 9,500
AADT 2008 8,600
AADT 2007 8,400

35
Based on AADT of 7,029 as of 2013, we can solve for traffic capture rates as follows:
y = 27.901 x [7,029-0.738]
y = 27.901 x 0.001449
y = 4.04%
7,029 AADT x 4.04% Capture Rate = 284 customer visits per day.
The estimated traffic capture rate is 4.04%, so the subject site can expect 284 customer
visits per day. From this annual gross sales can be estimated using average consumption
for customer.
According to the NACS’s data from 2013, there average consumption for a segment of
the population categorized as low income was $12.87 per person. This factor was used
due to the majority of the population having income of less than $35,000 per household.
As of 2014, there was an increase in total expenditures of less than 1 percent so it
concluded that average transaction per customer has remained at the same level as
well.
Assuming the average customer transaction (motor fuel and in-store sales) is $12.87
multiplying the average customer transaction of $12.87 by the 284 projected customer
visits per day equals $3,657 per day of gross sales. The annual gross sales are therefore
projected at $1,334,680 ($3,657 x 365 days per year).

36
6. Competition
According to the various sources in the industry the retail market area can defined as
1.5 and 2 mile radius. At this time, there were two competing convenience stores with
gas dispensing right on the edge of what is defined as the retail market area:
Description Location Distance
Circle K
601 S Main St
Somewhere TX 2 Miles
Rio Grande Market (Ram Gas Station)
7240 Doniphan,
Somewhere TX 2 Miles
Petro Service Station
601 Somewhere Rd
Canutillo TX 2.5 Miles

37
7. Proposed Location Cost
While it is impossible to come up with a definite construction cost without plans and
specs, local market information was used to estimate size of the proposed location and
current data on construction cost per Sq. Ft.
The proposed convenience store would consist of a 2,600 Sq Ft building with 2 separate
double walled tanks, and 4 service stations. The site assumes that 50,000 Sq Ft will be
paved and used by the convenience store, and that site will have a Canopy of 3,000 Sq
Ft.
Building
Proposed Sq FT 2,600
Projecte Cost / Sq Ft 74.68$
Total Building Cost 194,160.24$
Development
Proposed Site Sq Ft 50,000.00
Projected Cost of Asphalt / Sq Ft 2.36$
Total Development Cost 118,000.0$
Additional Improvements
Electronic Dispenser
3 Hose x 4 ($18,300) $73,200
Double sided ($5,450) $10,900
Ticket Printer ($745 x 2 x 4) $4,470
Canopy ($38.56 psf @ 3.000 sf) $115,680
Air & Water dispenser $745
Concrete Islands ($11.75 x 150 x 4) $7,050
UST (20,000 gal, double walled) $157,500
Total Additional Improvement Costs $369,545
Total Cost 681,705.24$
Proposed Site Cost
38
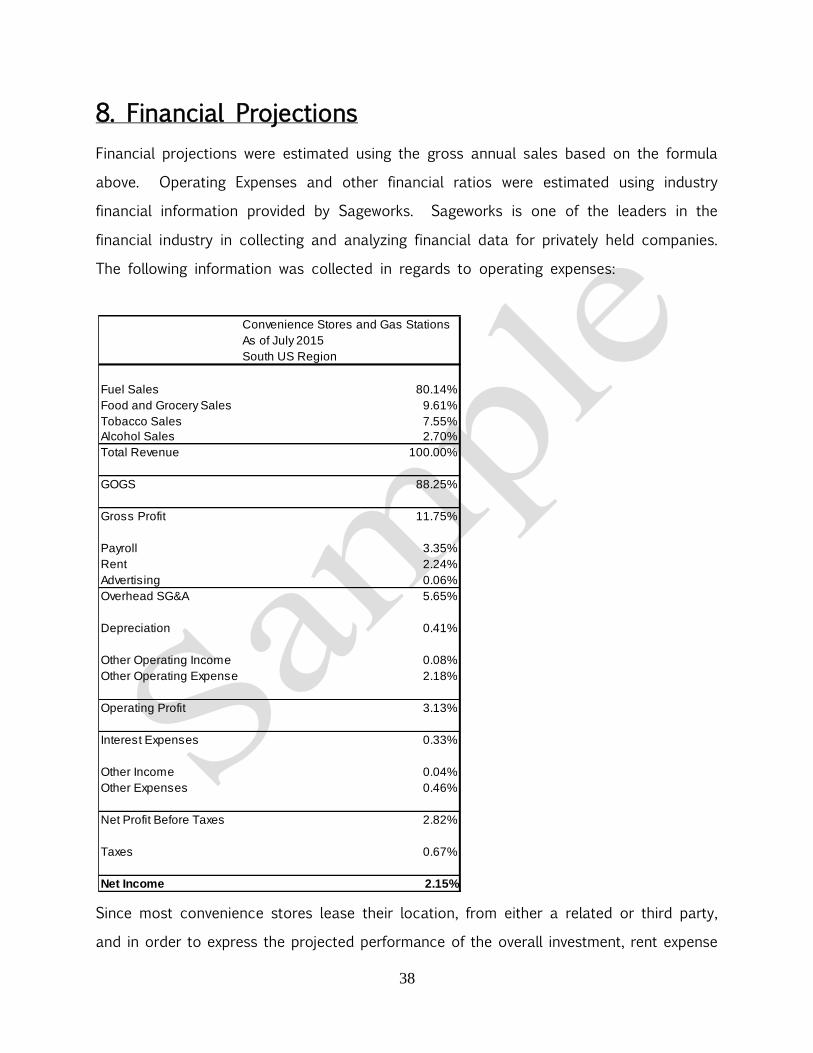
8. Financial Projections
Financial projections were estimated using the gross annual sales based on the formula
above. Operating Expenses and other financial ratios were estimated using industry
financial information provided by Sageworks. Sageworks is one of the leaders in the
financial industry in collecting and analyzing financial data for privately held companies.
The following information was collected in regards to operating expenses:
Since most convenience stores lease their location, from either a related or third party,
and in order to express the projected performance of the overall investment, rent expense
Convenience Stores and Gas Stations
As of July 2015
South US Region
Fuel Sales 80.14%
Food and Grocery Sales 9.61%
Tobacco Sales 7.55%
Alcohol Sales 2.70%
Total Revenue 100.00%
GOGS 88.25%
Gross Profit 11.75%
Payroll 3.35%
Rent 2.24%
Advertising 0.06%
Overhead SG&A 5.65%
Depreciation 0.41%
Other Operating Income 0.08%
Other Operating Expense 2.18%
Operating Profit 3.13%
Interest Expenses 0.33%
Other Income 0.04%
Other Expenses 0.46%
Net Profit Before Taxes 2.82%
Taxes 0.67%
Net Income 2.15%

39
was removed and was replaced by the interested and depreciation expense related to
the real estate investment.
Assumptions:
• Cost of land was taken as sunk cost.
• Looking at feasibility of project as an operating entity from day one.
• Interest rate of 6%.
• Loan Amortization 20 years.
• Assumes a 2% growth for revenue and cost of goods sold for year 2 and 3.
• Assumes operations begin in January, and does not take into account construction
time.
• Construction time is taken into account as interest expense for three months that
it is capitalized into the overall project cost.
• Assumes that convenience store is the owner of the location and does not pay
rent.
• Amortization based on 27.5 years. (15 Year amortization is available for
convenience stores, but there are certain criteria that has to be met, and for
purposes of this report a more conservative approach was taken)
Below are the projected startup expenses:
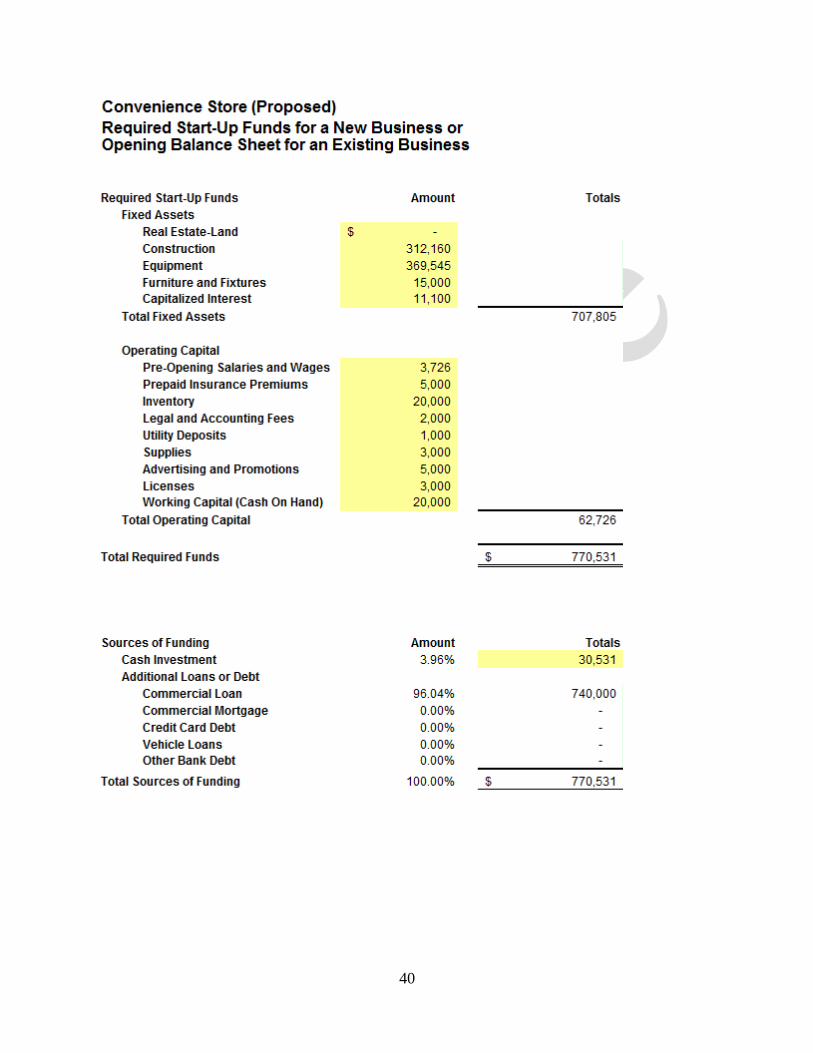
40

41
Co
nv
en
ien
ce
Sto
re (P
rop
os
ed
)
Pro
jec
ted
Inc
om
e S
tate
me
nt - Y
ea
r On
e
Ja
nFe
bM
ar
Ap
rM
ay
Ju
nJ
ul
Au
gS
ep
Oc
tN
ov
De
cT
ota
ls
Inc
om
e
Fu
el S
ale
s8
4,6
49
8
6,1
46
8
5,9
83
8
6,5
83
8
8,2
63
9
0,7
87
9
2,0
09
9
3,1
59
8
9,0
87
9
1,0
42
9
1,6
73
9
0,1
66
1
,06
9,5
48
Fo
od
an
d G
roc
ery
Sa
les
10
,15
4
10
,33
3
10
,31
4
10
,38
6
10
,58
7
10
,89
0
11
,03
7
11
,17
5
10
,68
6
10
,92
1
10
,99
6
10
,81
6
12
8,2
93
Ta
ba
cc
o S
ale
s7
,97
8
8,1
19
8
,10
4
8,1
60
8
,31
9
8,5
56
8
,67
2
8,7
80
8
,39
6
8,5
80
8
,64
0
8,4
98
1
00
,80
2
Alc
oh
ol S
ale
s2
,85
2
2,9
03
2
,89
7
2,9
17
2
,97
4
3,0
59
3
,10
0
3,1
39
3
,00
2
3,0
67
3
,08
9
3,0
38
3
6,0
36
To
tal In
co
me
10
5,6
33
1
07
,50
0
10
7,2
97
1
08
,04
7
11
0,1
43
1
13
,29
3
11
4,8
17
1
16
,25
2
11
1,1
71
1
13
,61
0
11
4,3
98
1
12
,51
8
1,3
34
,68
0
To
tal C
os
t of S
ale
s9
3,2
21
9
4,8
69
9
4,6
90
9
5,3
51
9
7,2
01
9
9,9
81
1
01
,32
6
10
2,5
93
9
8,1
09
1
00
,26
1
10
0,9
56
9
9,2
97
1
,17
7,8
55
Gro
ss
Ma
rgin
12
,41
2
12
,63
1
12
,60
7
12
,69
5
12
,94
2
13
,31
2
13
,49
1
13
,66
0
13
,06
3
13
,34
9
13
,44
2
13
,22
1
15
6,8
25
To
tal S
ala
ry a
nd
Wa
ge
s3
,72
6
3,7
26
3
,72
6
3,7
26
3
,72
6
3,7
26
3
,72
6
3,7
26
3
,72
6
3,7
26
3
,72
6
3,7
26
4
4,7
12
Fix
ed
Bu
sin
es
s E
xp
en
se
s
Re
nt
-
-
-
-
-
-
-
-
-
-
-
-
-
Ad
ve
rtisin
g6
7
67
6
7
67
6
7
67
6
7
67
6
7
67
6
7
67
8
01
Oth
er O
pe
ratin
g In
co
me
(1,0
68
)
(1,0
68
)
(1,0
68
)
(1,0
68
)
(1,0
68
)
(1,0
68
)
(1,0
68
)
(1,0
68
)
(1,0
68
)
(1,0
68
)
(1,0
68
)
(1,0
68
)
(12
,81
3)
Oth
er O
pe
ratin
g E
xp
en
se
2,4
25
2
,42
5
2,4
25
2
,42
5
2,4
25
2
,42
5
2,4
25
2
,42
5
2,4
25
2
,42
5
2,4
25
2
,42
5
29
,09
6
Oth
er In
co
me
(44
)
(44
)
(44
)
(44
)
(44
)
(44
)
(44
)
(44
)
(44
)
(44
)
(44
)
(44
)
(53
4)
Oth
er E
xp
en
se
s5
12
5
12
5
12
5
12
5
12
5
12
5
12
5
12
5
12
5
12
5
12
5
12
6
,14
0
To
tal F
ixe
d B
us
ine
ss
Ex
pe
ns
es
1,8
91
1
,89
1
1,8
91
1
,89
1
1,8
91
1
,89
1
1,8
91
1
,89
1
1,8
91
1
,89
1
1,8
91
1
,89
1
22
,69
0
Oth
er E
xp
en
se
s
Am
ortiz
ed
Sta
rt-up
Ex
pe
ns
es
63
1
63
1
63
1
63
1
63
1
63
1
63
1
63
1
63
1
63
1
63
1
63
1
7,5
75
De
pre
cia
tion
2,2
78
2
,27
8
2,2
78
2
,27
8
2,2
78
2
,27
8
2,2
78
2
,27
8
2,2
78
2
,27
8
2,2
78
2
,27
8
27
,33
6
Inte
res
t
Co
mm
erc
ial L
oa
n3
,70
0
3,6
92
3
,68
4
3,6
76
3
,66
8
3,6
60
3
,65
1
3,6
43
3
,63
5
3,6
26
3
,61
8
3,6
10
4
3,8
63
Ta
xe
s1
63
2
09
2
06
2
25
2
76
3
52
3
89
4
24
3
07
3
66
3
86
3
43
3
,64
5
To
tal O
the
r Ex
pe
ns
es
6,7
73
6
,81
0
6,7
99
6
,81
0
6,8
53
6
,92
0
6,9
50
6
,97
7
6,8
51
6
,90
1
6,9
13
6
,86
2
82
,41
9
Ne
t Inc
om
e2
2
20
4
19
2
26
9
47
2
77
5
92
5
1,0
66
5
95
8
31
9
12
7
42
7
,00
5

42
Convenience Store (Proposed)
Balance Sheet - Year One
Base Period End of Year One
Assets
Current Assets
Cash 20,000 43,074
Accounts Receivable - -
Inventory 18,500 18,500
Prepaid Expenses 22,726 15,151
Other Current - -
Total Current Assets 61,226 76,725
Fixed Assets
Real Estate-Land - -
Construction 546,101 546,101
Leasehold Improvements - -
Equipment 249,180 249,180
Furniture and Fixtures 1,000 1,000
Vehicles - -
Other Fixed Assets - -
Total Fixed Assets 796,281 796,281
Less: Accumulated Depreciation - 63,102
Total Assets 857,506 809,903
Liabilities and Owner's Equity
Liabilities
Accounts Payable - -
Loan Payable 771,756 751,152
Mortgage Payable - -
Credit Card Debt - -
Vehicle Loans - -
Other Bank Debt - -
Line of Credit Balance - -
Total Liabilities 771,756 751,152
Owner's Equity
Common Stock 85,750 85,751
Retained Earnings - (26,999)
Dividends Dispersed - -
Total Owner's Equity 85,750 58,752
Total Liabilities and Owner's Equity 857,506 809,904

43
Co
nv
en
ien
ce
Sto
re (P
rop
os
ed
)
Pro
jec
ted
Inc
om
e S
tate
me
nt - Y
ea
r Tw
o
Ja
nFe
bM
ar
Ap
rM
ay
Ju
nJ
ul
Au
gS
ep
Oc
tN
ov
De
cT
ota
ls
Inc
om
e
Fu
el S
ale
s8
6,3
42
8
7,8
69
8
7,7
02
8
8,3
15
9
0,0
28
9
2,6
03
9
3,8
49
9
5,0
22
9
0,8
69
9
2,8
63
9
3,5
06
9
1,9
70
1
,09
0,9
39
Fo
od
an
d G
roc
ery
Sa
les
10
,35
7
10
,54
0
10
,52
0
10
,59
3
10
,79
9
11
,10
8
11
,25
7
11
,39
8
10
,90
0
11
,13
9
11
,21
6
11
,03
2
13
0,8
59
Ta
ba
cc
o S
ale
s8
,13
8
8,2
81
8
,26
6
8,3
23
8
,48
5
8,7
28
8
,84
5
8,9
56
8
,56
4
8,7
52
8
,81
3
8,6
68
1
02
,81
8
Alc
oh
ol S
ale
s2
,90
9
2,9
61
2
,95
5
2,9
76
3
,03
3
3,1
20
3
,16
2
3,2
02
3
,06
2
3,1
29
3
,15
1
3,0
99
3
6,7
57
To
tal In
co
me
10
7,7
46
1
09
,65
0
10
9,4
43
1
10
,20
8
11
2,3
45
1
15
,55
9
11
7,1
13
1
18
,57
7
11
3,3
95
1
15
,88
3
11
6,6
86
1
14
,76
8
1,3
61
,37
4
To
tal C
os
t of S
ale
s9
5,0
86
9
6,7
67
9
6,5
84
9
7,2
58
9
9,1
45
1
01
,98
0
10
3,3
53
1
04
,64
5
10
0,0
71
1
02
,26
6
10
2,9
75
1
01
,28
3
1,2
01
,41
2
Gro
ss
Ma
rgin
12
,66
0
12
,88
4
12
,86
0
12
,94
9
13
,20
1
13
,57
8
13
,76
1
13
,93
3
13
,32
4
13
,61
6
13
,71
1
13
,48
5
15
9,9
61
To
tal S
ala
ry a
nd
Wa
ge
s3
,72
6
3,7
26
3
,72
6
3,7
26
3
,72
6
3,7
26
3
,72
6
3,7
26
3
,72
6
3,7
26
3
,72
6
3,7
26
4
4,7
12
Fix
ed
Bu
sin
es
s E
xp
en
se
s
Re
nt
-
-
-
-
-
-
-
-
-
-
-
-
-
Ad
ve
rtisin
g6
8
68
6
8
68
6
8
68
6
8
68
6
8
68
6
8
68
8
17
Oth
er O
pe
ratin
g In
co
me
(1,0
89
)
(1,0
89
)
(1,0
89
)
(1,0
89
)
(1,0
89
)
(1,0
89
)
(1,0
89
)
(1,0
89
)
(1,0
89
)
(1,0
89
)
(1,0
89
)
(1,0
89
)
(13
,06
9)
Oth
er O
pe
ratin
g E
xp
en
se
2,4
73
2
,47
3
2,4
73
2
,47
3
2,4
73
2
,47
3
2,4
73
2
,47
3
2,4
73
2
,47
3
2,4
73
2
,47
3
29
,67
8
Oth
er In
co
me
(45
)
(45
)
(45
)
(45
)
(45
)
(45
)
(45
)
(45
)
(45
)
(45
)
(45
)
(45
)
(54
5)
Oth
er E
xp
en
se
s5
22
5
22
5
22
5
22
5
22
5
22
5
22
5
22
5
22
5
22
5
22
5
22
6
,26
2
To
tal F
ixe
d B
us
ine
ss
Ex
pe
ns
es
1,9
29
1
,92
9
1,9
29
1
,92
9
1,9
29
1
,92
9
1,9
29
1
,92
9
1,9
29
1
,92
9
1,9
29
1
,92
9
23
,14
3
Oth
er E
xp
en
se
s
Am
ortiz
ed
Sta
rt-up
Ex
pe
ns
es
63
1
63
1
63
1
63
1
63
1
63
1
63
1
63
1
63
1
63
1
63
1
63
1
7,5
75
De
pre
cia
tion
2,2
78
2
,27
8
2,2
78
2
,27
8
2,2
78
2
,27
8
2,2
78
2
,27
8
2,2
78
2
,27
8
2,2
78
2
,27
8
27
,33
6
Inte
res
t
Co
mm
erc
ial L
oa
n3
,60
1
3,5
93
3
,58
4
3,5
76
3
,56
7
3,5
58
3
,55
0
3,5
41
3
,53
2
3,5
23
3
,51
4
3,5
05
4
2,6
44
Ta
xe
s2
25
2
72
2
69
2
88
3
40
4
17
4
56
4
92
3
72
4
32
4
53
4
09
4
,42
5
To
tal O
the
r Ex
pe
ns
es
6,7
36
6
,77
4
6,7
62
6
,77
3
6,8
16
6
,88
5
6,9
15
6
,94
2
6,8
13
6
,86
5
6,8
76
6
,82
4
81
,98
0
Ne
t Inc
om
e2
70
4
56
4
43
5
22
7
30
1
,03
9
1,1
92
1
,33
6
85
6
1,0
97
1
,18
0
1,0
07
1
0,1
26

44
C
on
ve
nie
nc
e S
tore
(Pro
po
se
d)
Pro
jec
ted
Ca
sh
Flo
w S
tate
me
nt - Y
ea
r Tw
o
Ja
nFe
bM
ar
Ap
rM
ay
Ju
nJ
ul
Au
gS
ep
Oc
tN
ov
De
c
Be
gin
nin
g C
as
h B
ala
nc
e4
2,1
59
4
3,8
63
4
5,7
91
4
6,9
29
4
8,9
22
5
1,1
67
5
2,7
43
5
5,5
47
5
8,5
24
5
9,5
72
6
2,2
32
6
4,9
87
Ca
sh
Inflo
ws
Inc
om
e fro
m S
ale
s1
07
,74
6
10
9,6
50
1
09
,44
3
11
0,2
08
1
12
,34
5
11
5,5
59
1
17
,11
3
11
8,5
77
1
13
,39
5
11
5,8
83
1
16
,68
6
11
4,7
68
Ac
co
un
ts R
ec
eiv
ab
le-
-
-
-
-
-
-
-
-
-
-
-
To
tal C
as
h In
flow
s1
07
,74
6
10
9,6
50
1
09
,44
3
11
0,2
08
1
12
,34
5
11
5,5
59
1
17
,11
3
11
8,5
77
1
13
,39
5
11
5,8
83
1
16
,68
6
11
4,7
68
Ca
sh
Ou
tflow
s
Inve
stin
g A
ctiv
ities
Ne
w F
ixe
d A
ss
ets
Pu
rch
as
es
-
-
-
-
-
-
-
-
-
-
-
-
Inve
nto
ry A
dd
ition
to B
al. S
he
et
-
-
-
-
-
-
-
-
-
-
-
-
Co
st o
f Sa
les
95
,08
6
96
,76
7
96
,58
4
97
,25
8
99
,14
5
10
1,9
80
1
03
,35
3
10
4,6
45
1
00
,07
1
10
2,2
66
1
02
,97
5
10
1,2
83
Op
era
ting
Ac
tivitie
s
Sa
larie
s a
nd
Wa
ge
s3
,72
6
3,7
26
3
,72
6
3,7
26
3
,72
6
3,7
26
3
,72
6
3,7
26
3
,72
6
3,7
26
3
,72
6
3,7
26
Fix
ed
Bu
sin
es
s E
xp
en
se
s1
,92
9
1,9
29
1
,92
9
1,9
29
1
,92
9
1,9
29
1
,92
9
1,9
29
1
,92
9
1,9
29
1
,92
9
1,9
29
Ta
xe
s-
-
7
66
-
-
1
,04
6
-
-
1,3
19
-
-
1
,29
4
Fin
an
cin
g A
ctiv
ities
Lo
an
Pa
ym
en
ts5
,30
2
5,3
02
5
,30
2
5,3
02
5
,30
2
5,3
02
5
,30
2
5,3
02
5
,30
2
5,3
02
5
,30
2
5,3
02
Lin
e o
f Cre
dit In
tere
st
-
-
-
-
-
-
-
-
-
-
-
-
Lin
e o
f Cre
dit R
ep
aym
en
ts-
-
-
-
-
-
-
-
-
-
-
-
Div
ide
nd
s P
aid
-
-
-
-
-
-
-
-
-
-
-
-
To
tal C
as
h O
utflo
ws
10
6,0
42
1
07
,72
3
10
8,3
05
1
08
,21
4
11
0,1
01
1
13
,98
3
11
4,3
09
1
15
,60
1
11
2,3
47
1
13
,22
3
11
3,9
31
1
13
,53
4
Ca
sh
Flo
w1
,70
4
1,9
28
1
,13
8
1,9
93
2
,24
4
1,5
76
2
,80
5
2,9
77
1
,04
8
2,6
60
2
,75
4
1,2
35
Op
era
ting
Ca
sh
Ba
lan
ce
43
,86
3
45
,79
1
46
,92
9
48
,92
2
51
,16
7
52
,74
3
55
,54
7
58
,52
4
59
,57
2
62
,23
2
64
,98
7
66
,22
1
Lin
e o
f Cre
dit D
raw
do
wn
s-
-
-
-
-
-
-
-
-
-
-
-
En
din
g C
as
h B
ala
nc
e4
3,8
63
4
5,7
91
4
6,9
29
4
8,9
22
5
1,1
67
5
2,7
43
5
5,5
47
5
8,5
24
5
9,5
72
6
2,2
32
6
4,9
87
6
6,2
21
45
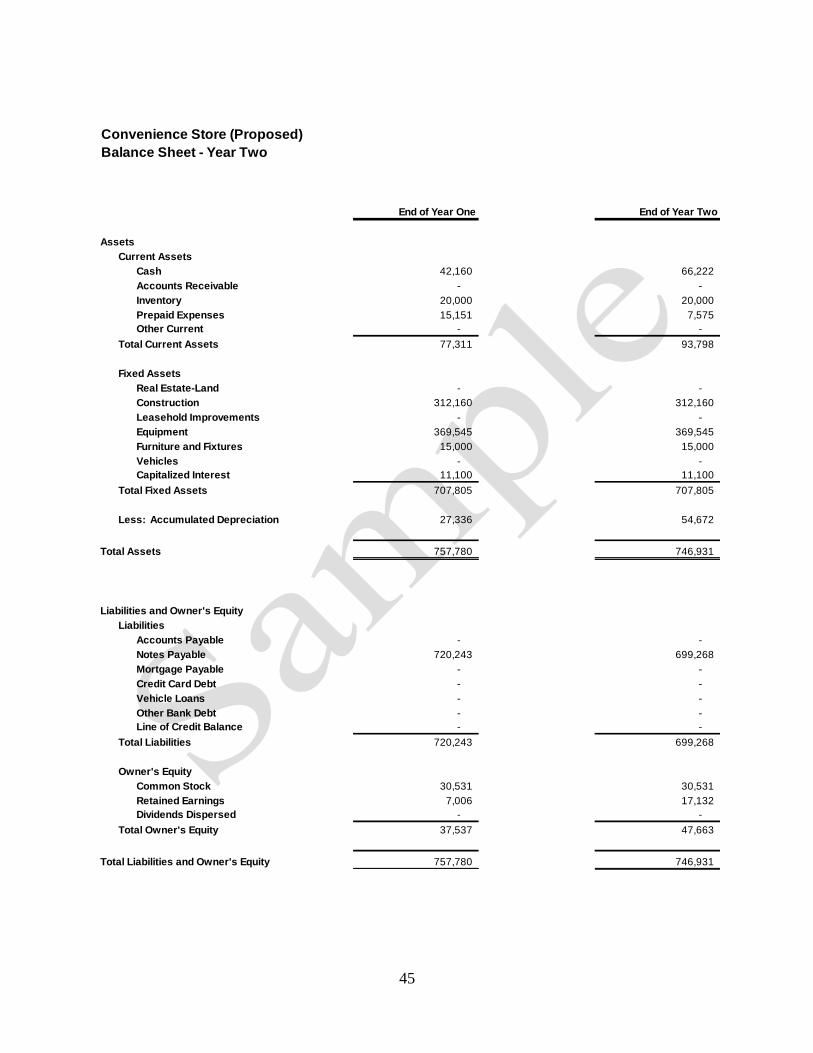
Convenience Store (Proposed)
Balance Sheet - Year Two
End of Year One End of Year Two
Assets
Current Assets
Cash 42,160 66,222
Accounts Receivable - -
Inventory 20,000 20,000
Prepaid Expenses 15,151 7,575
Other Current - -
Total Current Assets 77,311 93,798
Fixed Assets
Real Estate-Land - -
Construction 312,160 312,160
Leasehold Improvements - -
Equipment 369,545 369,545
Furniture and Fixtures 15,000 15,000
Vehicles - -
Capitalized Interest 11,100 11,100
Total Fixed Assets 707,805 707,805
Less: Accumulated Depreciation 27,336 54,672
Total Assets 757,780 746,931
Liabilities and Owner's Equity
Liabilities
Accounts Payable - -
Notes Payable 720,243 699,268
Mortgage Payable - -
Credit Card Debt - -
Vehicle Loans - -
Other Bank Debt - -
Line of Credit Balance - -
Total Liabilities 720,243 699,268
Owner's Equity
Common Stock 30,531 30,531
Retained Earnings 7,006 17,132
Dividends Dispersed - -
Total Owner's Equity 37,537 47,663
Total Liabilities and Owner's Equity 757,780 746,931

46
Co
nv
en
ien
ce
Sto
re (P
rop
os
ed
)
Pro
jec
ted
Inc
om
e S
tate
me
nt - Y
ea
r Th
ree
Ja
nFe
bM
ar
Ap
rM
ay
Ju
nJ
ul
Au
gS
ep
Oc
tN
ov
De
cT
ota
ls
Inc
om
e
Fu
el S
ale
s8
8,0
69
8
9,6
26
8
9,4
57
9
0,0
81
9
1,8
29
9
4,4
55
9
5,7
26
9
6,9
23
9
2,6
87
9
4,7
20
9
5,3
77
9
3,8
09
1
,11
2,7
58
Fo
od
an
d G
roc
ery
Sa
les
10
,56
4
10
,75
1
10
,73
0
10
,80
5
11
,01
5
11
,33
0
11
,48
2
11
,62
6
11
,11
8
11
,36
2
11
,44
1
11
,25
3
13
3,4
76
Ta
ba
cc
o S
ale
s8
,30
0
8,4
47
8
,43
1
8,4
90
8
,65
5
8,9
02
9
,02
2
9,1
35
8
,73
5
8,9
27
8
,98
9
8,8
41
1
04
,87
4
Alc
oh
ol S
ale
s2
,96
7
3,0
20
3
,01
4
3,0
35
3
,09
4
3,1
82
3
,22
5
3,2
66
3
,12
3
3,1
91
3
,21
4
3,1
61
3
7,4
92
To
tal In
co
me
10
9,9
01
1
11
,84
3
11
1,6
32
1
12
,41
2
11
4,5
92
1
17
,87
0
11
9,4
56
1
20
,94
9
11
5,6
63
1
18
,20
0
11
9,0
20
1
17
,06
4
1,3
88
,60
1
To
tal C
os
t of S
ale
s9
6,9
87
9
8,7
02
9
8,5
15
9
9,2
03
1
01
,12
8
10
4,0
20
1
05
,42
0
10
6,7
38
1
02
,07
2
10
4,3
12
1
05
,03
5
10
3,3
09
1
,22
5,4
40
Gro
ss
Ma
rgin
12
,91
3
13
,14
2
13
,11
7
13
,20
8
13
,46
5
13
,85
0
14
,03
6
14
,21
2
13
,59
0
13
,88
9
13
,98
5
13
,75
5
16
3,1
61
To
tal S
ala
ry a
nd
Wa
ge
s3
,72
6
3,7
26
3
,72
6
3,7
26
3
,72
6
3,7
26
3
,72
6
3,7
26
3
,72
6
3,7
26
3
,72
6
3,7
26
4
4,7
12
Fix
ed
Bu
sin
es
s E
xp
en
se
s
Re
nt
-
-
-
-
-
-
-
-
-
-
-
-
-
Ad
ve
rtisin
g6
9
69
6
9
69
6
9
69
6
9
69
6
9
69
6
9
69
8
33
Oth
er O
pe
ratin
g In
co
me
(1,1
11
)
(1,1
11
)
(1,1
11
)
(1,1
11
)
(1,1
11
)
(1,1
11
)
(1,1
11
)
(1,1
11
)
(1,1
11
)
(1,1
11
)
(1,1
11
)
(1,1
11
)
(13
,33
1)
Oth
er O
pe
ratin
g E
xp
en
se
2,5
23
2
,52
3
2,5
23
2
,52
3
2,5
23
2
,52
3
2,5
23
2
,52
3
2,5
23
2
,52
3
2,5
23
2
,52
3
30
,27
2
Oth
er In
co
me
(46
)
(46
)
(46
)
(46
)
(46
)
(46
)
(46
)
(46
)
(46
)
(46
)
(46
)
(46
)
(55
5)
Oth
er E
xp
en
se
s5
32
5
32
5
32
5
32
5
32
5
32
5
32
5
32
5
32
5
32
5
32
5
32
6
,38
8
To
tal F
ixe
d B
us
ine
ss
Ex
pe
ns
es
1,9
67
1
,96
7
1,9
67
1
,96
7
1,9
67
1
,96
7
1,9
67
1
,96
7
1,9
67
1
,96
7
1,9
67
1
,96
7
23
,60
6
Oth
er E
xp
en
se
s
Am
ortiz
ed
Sta
rt-up
Ex
pe
ns
es
63
1
63
1
63
1
63
1
63
1
63
1
63
1
63
1
63
1
63
1
63
1
63
1
7,5
75
De
pre
cia
tion
2,2
78
2
,27
8
2,2
78
2
,27
8
2,2
78
2
,27
8
2,2
78
2
,27
8
2,2
78
2
,27
8
2,2
78
2
,27
8
27
,33
6
Inte
res
t
Co
mm
erc
ial L
oa
n3
,49
6
3,4
87
3
,47
8
3,4
69
3
,46
0
3,4
51
3
,44
2
3,4
32
3
,42
3
3,4
13
3
,40
4
3,3
95
4
1,3
50
Ta
xe
s2
89
3
37
3
33
3
54
4
07
4
86
5
25
5
62
4
39
5
01
5
22
4
78
5
,23
1
To
tal O
the
r Ex
pe
ns
es
6,6
95
6
,73
3
6,7
21
6
,73
2
6,7
76
6
,84
6
6,8
75
6
,90
3
6,7
71
6
,82
4
6,8
35
6
,78
2
81
,49
3
Ne
t Inc
om
e5
25
7
15
7
03
7
83
9
96
1
,31
1
1,4
67
1
,61
5
1,1
26
1
,37
2
1,4
56
1
,28
0
13
,35
0

47
Co
nv
en
ien
ce
Sto
re (P
rop
os
ed
)
Pro
jec
ted
Ca
sh
Flo
w S
tate
me
nt - Y
ea
r Th
ree
Ja
nFe
bM
ar
Ap
rM
ay
Ju
nJ
ul
Au
gS
ep
Oc
tN
ov
De
cT
ota
ls
Be
gin
nin
g C
as
h B
ala
nc
e6
6,2
21
6
8,1
40
7
0,2
87
7
1,4
50
7
3,6
63
7
6,1
33
7
7,7
42
8
0,7
83
8
4,0
00
8
5,0
70
8
7,9
64
9
0,9
54
Ca
sh
Inflo
ws
Inc
om
e fro
m S
ale
s1
09
,90
1
11
1,8
43
1
11
,63
2
11
2,4
12
1
14
,59
2
11
7,8
70
1
19
,45
6
12
0,9
49
1
15
,66
3
11
8,2
00
1
19
,02
0
11
7,0
64
1
,38
8,6
01
Ac
co
un
ts R
ec
eiv
ab
le-
-
-
-
-
-
-
-
-
-
-
-
-
To
tal C
as
h In
flow
s1
09
,90
1
11
1,8
43
1
11
,63
2
11
2,4
12
1
14
,59
2
11
7,8
70
1
19
,45
6
12
0,9
49
1
15
,66
3
11
8,2
00
1
19
,02
0
11
7,0
64
1
,38
8,6
01
Ca
sh
Ou
tflow
s
Inve
stin
g A
ctiv
ities
Ne
w F
ixe
d A
ss
ets
Pu
rch
as
es
-
-
-
-
-
-
-
-
-
-
-
-
-
Inve
nto
ry A
dd
ition
to B
al.S
he
et
-
-
-
-
-
-
-
-
-
-
-
-
-
Co
st o
f Sa
les
96
,98
7
98
,70
2
98
,51
5
99
,20
3
10
1,1
28
1
04
,02
0
10
5,4
20
1
06
,73
8
10
2,0
72
1
04
,31
2
10
5,0
35
1
03
,30
9
1,2
25
,44
0
Op
era
ting
Ac
tivitie
s
Sa
larie
s a
nd
Wa
ge
s3
,72
6
3,7
26
3
,72
6
3,7
26
3
,72
6
3,7
26
3
,72
6
3,7
26
3
,72
6
3,7
26
3
,72
6
3,7
26
4
4,7
12
Fix
ed
Bu
sin
es
s E
xp
en
se
s1
,96
7
1,9
67
1
,96
7
1,9
67
1
,96
7
1,9
67
1
,96
7
1,9
67
1
,96
7
1,9
67
1
,96
7
1,9
67
2
3,6
06
Ta
xe
s-
-
9
59
-
-
1
,24
6
-
-
1,5
26
-
-
1
,50
1
5,2
31
Fin
an
cin
g A
ctiv
ities
-
Lo
an
Pa
ym
en
ts5
,30
2
5,3
02
5
,30
2
5,3
02
5
,30
2
5,3
02
5
,30
2
5,3
02
5
,30
2
5,3
02
5
,30
2
5,3
02
6
3,6
19
Lin
e o
f Cre
dit In
tere
st
-
-
-
-
-
-
-
-
-
-
-
-
-
Lin
e o
f Cre
dit R
ep
aym
en
ts-
-
-
-
-
-
-
-
-
-
-
-
-
Div
ide
nd
s P
aid
-
-
-
-
-
-
-
-
-
-
-
-
-
To
tal C
as
h O
utflo
ws
10
7,9
82
1
09
,69
7
11
0,4
69
1
10
,19
8
11
2,1
22
1
16
,26
1
11
6,4
14
1
17
,73
2
11
4,5
93
1
15
,30
6
11
6,0
30
1
15
,80
4
1,3
62
,60
9
Ca
sh
Flo
w1
,91
9
2,1
47
1
,16
3
2,2
14
2
,47
0
1,6
09
3
,04
1
3,2
17
1
,07
0
2,8
94
2
,99
0
1,2
60
2
5,9
92
Op
era
ting
Ca
sh
Ba
lan
ce
68
,14
0
70
,28
7
71
,45
0
73
,66
3
76
,13
3
77
,74
2
80
,78
3
84
,00
0
85
,07
0
87
,96
4
90
,95
4
92
,21
4
Lin
e o
f Cre
dit D
raw
do
wn
s-
-
-
-
-
-
-
-
-
-
-
-
-
En
din
g C
as
h B
ala
nc
e6
8,1
40
7
0,2
87
7
1,4
50
7
3,6
63
7
6,1
33
7
7,7
42
8
0,7
83
8
4,0
00
8
5,0
70
8
7,9
64
9
0,9
54
9
2,2
14

48
Convenience Store (Proposed)
Balance Sheet - Year Three
End of Year Two End of Year Three
Assets
Current Assets
Cash 66,222 92,214
Accounts Receivable - -
Inventory 20,000 20,000
Prepaid Expenses 7,575 -
Other Current - -
Total Current Assets 93,798 112,214
Fixed Assets
Real Estate-Land - -
Construction 312,160 312,160
Leasehold Improvements - -
Equipment 369,545 369,545
Furniture and Fixtures 15,000 15,000
Vehicles - -
Capitalized Interest 11,100 11,100
Total Fixed Assets 707,805 707,805
Less: Accumulated Depreciation 54,672 82,007
Total Assets 746,931 738,011
Liabilities and Owner's Equity
Liabilities
Accounts Payable - -
Notes Payable 699,269 677,000
Mortgage Payable - -
Credit Card Debt - -
Vehicle Loans - -
Other Bank Debt - -
Line of Credit Balance - -
Total Liabilities 699,269 677,000
Owner's Equity
Common Stock 30,531 30,531
Retained Earnings 17,132 30,482
Dividends Dispersed - -
Total Owner's Equity 47,663 61,013
Total Liabilities and Owner's Equity 746,932 738,012

49
Net Income of .52% differs from the average net income for the industry of 2.15%, this
is due to this report contemplates the development of the real estate as a part of the
project and, for demonstrative purposes, assumes the owner of the real estate and
operating entity to be one and the same. If we are to take adjust the net income
margin by the difference in depreciation expense, interest expense and rent expense, the
result is a net income of 2.84% which is comparable with 2.15% for the industry. The
Consultant does not advocate, for or against, for the operating entity to own the real
estate asset. This is done so it will be more representative of the project as a whole.
Convenience Store (Proposed)
Year End Summary
Year One % Year Two % Year Three %
Income
Fuel Sales 1,069,548 80% 1,090,939 80% 1,112,758 80%
Food and Grocery Sales 128,293 10% 130,859 10% 133,476 10%
Tabacco Sales 100,802 8% 102,818 8% 104,874 8%
Alcohol Sales 36,036 3% 36,757 3% 37,492 3%
Total Income 1,334,680 100.00% 1,361,374 100.00% 1,388,601 100.00%
Total Cost of Sales 1,177,855 88.25% 1,201,412 88.25% 1,225,440 88.25%
Gross Margin 156,825 11.75% 159,961 11.75% 163,161 11.75%
Total Salary and Wages 44,712 3.35% 44,712 3.28% 44,712 3.22%
Fixed Business Expenses
Rent - 0.00% - 0.00% - 0.00%
Advertising 801 0.06% 817 0.06% 833 0.06%
Other Operating Income (12,813) -0.96% (13,069) -0.96% (13,331) -0.98%
Other Operating Expense 29,096 2.18% 29,678 2.18% 30,272 2.22%
Other Income (534) -0.04% (545) -0.04% (555) -0.04%
Other Expenses 6,140 0.46% 6,262 0.46% 6,388 0.47%
Total Fixed Business Expenses 22,690 1.70% 23,143 1.70% 23,606 1.70%
Operating Income (before Other Expenses) 89,424 6.70% 92,106 6.77% 94,843 6.83%
[EBITDA]
Other Expenses
Amortized Start-up Expenses 7,575 0.57% 7,575 0.56% 7,575 0.6%
Depreciation 27,336 2.05% 27,336 2.01% 27,336 2.0%
Interest 0.00% 0.00% 0.0%
Commercial Loan 43,863 3.29% 42,644 3.13% 41,350 3.0%
Taxes 3,645 0.27% 4,425 0.33% 5,231 0.4%
Total Other Expenses 82,419 6.18% 81,980 6.02% 81,493 5.87%
Net Income 7,005 0.52% 10,126 0.74% 13,350 0.96%

50
Below is the projected debt service coverage for years 1 – 3:
Ratios
Net Income 7,005 10,126 13,350 Depreciation 27,336 27,336 27,336 Interest 43,863 42,644 41,350
Income Available for DS 78,203 80,106 82,036
Debt Service 63,619 63,619 63,619
Surplus after Debt Service 14,584 16,487 18,417 Debt Service Coverage Ratio 1.23 1.26 1.29
Debt Service Coverage
Proposed Convenience Stores
Year One Year Two Year Three

51
Breakeven Analysis
Convenience Store (Proposed)
Breakeven Analysis
Breakeven Analysis Dollars Percent
Annual Sales Revenue 1,334,680$ 100.00%
Cost of Sales 1,177,855 88.25%
Gross Margin 156,825 11.75%
Salaries and Wages -
Fixed Operating Expenses 93,888
Total Fixed Business Expenses 93,888
Breakeven Sales Calculation 93,888
11.75%
Breakeven Sales in Dollars 799,046$
Breakeven in number of
Customers a day 170
Breakeen in amount of
Average Expenditure 7.71$

52
Disclaimer
The preceding report is subject to the following assumptions and limiting
conditions:
• The analyses set forth in this report are subject to the following assumptions
and limiting conditions, all of which, for purposes of this report, have been
accepted as true and correct without verification or investigation by Talavera
Consulting, which assumes no responsibility whatsoever therefore. None of the
following particulars should be read to limit the generality of the foregoing
qualification.
• We assume no responsibility for any conditions, not readily observable from
our customary research, which might affect the analyses. We reserve the right
to change the analyses if so warranted, when supplied with further information,
if that information dictates.
• No conclusions are intended to be expressed regarding matters that require
legal expertise or specialized investigations or knowledge beyond that
customarily employed by consulting professionals.
• This report is to be used as tool in the decision making process, but not as
a guarantee, neither expressed nor implied, of future performance. This report
gathers a large array from various sources to exemplify what the average
performance of a proposed project could be, based on past performance.
Materials situations can and will change in the future.
• Neither Talavera Consulting nor any of its present or former personnel,
including, without limitation, the signatories hereto, shall be required to give
further consultation or testimony, or appear in court or at any public hearing
with reference to the property valued, unless satisfactory prior arrangements
have been made.
• Neither all nor any part of this report shall be disseminated to the general
public by the user through advertising media, public relations media, news
media, sales media or other media for public communication without the prior
written consent, which will not be unreasonably withheld, of Talavera Consulting,
particularly as to conclusions.
• No liability is assumed for matters which are legal in nature.
• Ownership and management are assumed to be in competent and responsible
hands.
• The report was prepared for the purpose stated and should not be used for
any other purpose.
• All direct and indirect written information supplied by the client, its agents
and assigns, concerning the properties is assumed to be true, accurate and
complete; additionally, information identified as supplied or prepared by others
is believed to be reliable. However, no responsibility for the accuracy of such
information is assumed.

53
• This report is intended to be read and used as a whole and not in parts.
• Our analyses are based on currently available information, estimates and
assumptions about based on information we believe to be reliable. We do not
represent them as results that will be achieved. Some assumptions inevitably will
not materialize and unanticipated events and circumstances may occur;
therefore, the actual results achieved may vary materially from the estimated
results.
• It is assumed that all necessary licenses and agreements remain in full force
and effect in order to continue the operations of the properties.
• It is assumed that the zoning requirements are met by the property.
• It is assumed that there are no environmental issues with the property.
• It is assumed that the business is under competent management, and
assumes operations to be that of an average business for the industry.
• Please consult your legal counsel and tax advisor for the best ownership
structure.
• With respect to our analyses, our work did not include an analysis of the
potential impact of any unexpected sharp rise or decline in local or general
markets or economic conditions or technological changes.
• Our report is dated June 23, 2020 (the “Report Date”). We cannot be held
responsible for changes in the market conditions or properties which would
have a material impact on the value(s) reported herein subsequent to our
Report Date.
• Talavera Consulting’s liability regardless of whether such liability is based on
breach of contract, tort, strict liability, breach of warranties, failure of essential
purpose or otherwise, under this Agreement or with respect to the services shall
be limited to the amount actually paid to Talavera Consulting for this scope of
work
• Support for conclusions contained in this report is retained within a
corresponding work paper file retained in our offices.
THERE ARE NO GUARANTEES OF PERFOMANCE OF ANY NATURE. THIS REPORT
SERVES AS A GUIDE OF POTENTIAL HYPOTHETICAL SCENARIO.