report on new zealand cost of illness studies on long … on new zealand cost-of-illness studies on...
TRANSCRIPT

Report on New Zealand Cost-of-Illness Studies on Long-Term Conditions

Citation: Ministry of Health. 2009. Report on New Zealand Cost-of-Illness Studies on Long-Term Conditions. Wellington: Ministry of Health.
Published in July 2009 by the Ministry of Health
PO Box 5013, Wellington, New Zealand
ISBN 978-0-478-31922-4 (online) HP 4764
This document is available on the Ministry of Health’s website: http://www.moh.govt.nz
Acknowledgements
This report was written by Dr. Richard Jaine. The author was employed by the Long-Term Conditions Programme of the Ministry of Health’s Sector Capability and Innovation Directorate. The author gratefully acknowledges the support, helpful ideas and peer review from the members of the Long-Term Conditions Programme, particularly the author’s supervisor Jane O’Hallahan and Anne McNicholas. The author also acknowledges the valuable contributions and peer review from Darren Hunt, Jackie Cumming and Scott Metcalfe.
Thanks must also go to all those who assisted with the report by responding to requests for information, documents and ideas (these people and organisations are listed in the appendix).
Report on New Zealand Cost-of-Illness Studies on Long-Term Conditions iii


Contents
Executive Summary vii Purpose of this report vii Estimated annual costs from the cost-of-illness literature vii Gaps in the cost-of-illness literature vii Conclusion vii
Introduction 1 Definitions and examples of long-term conditions 1 Modifiable lifestyle risk factors for long-term conditions 2 People affected by long-term conditions 2 Purpose of this report 2
General Principles Underlying Cost-of-Illness Studies 4 What cost-of-illness and burden-of-disease studies measure 4 Reasons for completing cost-of-illness studies 4 Types of costs: direct, indirect and intangible 5 Approaches for estimating costs: prevalence-based and incidence-based 5 Perspectives of cost-of-illness studies: health system, individual, and society 5 Measuring disease burden: quality-adjusted life year and disability-adjusted life year 6 Measuring intangible costs: human capital and willingness-to-pay approaches to valuing a life 6 Methodological differences 7
Identifying the Literature 8 Literature search methodology 8 International studies for context 8 Literature identified 8 Costs in New Zealand dollars 8
International Literature 9 Global research on the costs and burden of long-term conditions 9 Country-specific studies on long-term conditions: United States and Australia 10
Summary of the New Zealand Literature 11 Introduction 11 Burden-of-disease studies 11 Cost-of-illness studies by disease 12 Cost-of-illness studies by risk factor 16 Summary of cost-of-illness studies 18 Future cost estimates 21
Discussion 22 Long-term conditions consume many resources but studies are limited 22 Cost findings: indirect costs are about the same as direct costs 22
Report on New Zealand Cost-of-Illness Studies on Long-Term Conditions v
Cost findings: intangible costs may be in the billions 22 Limitations of this report 23 Future Research Options 24
Conclusion 25
Appendix: Publication Search Contact List 26
References 27
List of Tables Table 1: Definitions of the types of costs used in cost-of-illness studies 5 Table 2: Summary of cost-of-illness and cost-of-risk-factor studies conducted in New Zealand,
1985–2008 19
vi Report on New Zealand Cost-of-Illness Studies on Long-Term Conditions

Executive Summary
Long-term conditions are now the major challenge for the New Zealand health system. Two in every three New Zealand adults have been diagnosed with at least one long-term condition and long-term conditions are the leading driver of health inequalities. The predominance of modifiable risk factors such as physical inactivity, obesity and tobacco consumption have continued to fuel the rise of long-term conditions. Along with the detrimental health outcomes from long-term conditions the individual, their family/ whānau, the community and the health sector experience considerable financial and social costs. The major risk factors also place a significant economic burden on New Zealand society. Despite this, no documents appear to summarise or detail the economic impact reports that have been conducted on long-term conditions in New Zealand.
Purpose of this report
This report identifies and summarises economic impact reports on the health and societal costs of long-term conditions in New Zealand. The author identified 30 New Zealand-specific publications, articles and reports dating from 1985.
Estimated annual costs from the cost-of-illness literature
Long-term conditions consume a vast amount of resources in New Zealand – both in terms of direct health care and the indirect costs on society as a whole. Most of the studies estimated annual societal costs of more than $100 million per condition or risk factor. Where indirect costs had been calculated, these costs generally contributed between one-third and two-thirds of the total cost. From this, it was estimated that indirect costs roughly approximate direct costs.
Gaps in the cost-of-illness literature
Gaps were identified in the New Zealand literature. The cost-of-illness studies investigated only 11 long-term conditions. Common long-term conditions where no research was identified include cancer (excluding lung cancer), mental health conditions, chronic obstructive pulmonary disease and chronic pain. No studies of the overall economic cost of all long-term conditions in New Zealand were identified. None of the studies accounted for the effect of comorbidities on costs. Limited New Zealand research has estimated the future cost of long-term conditions.
Conclusion
Although New Zealand research lacks both breadth and depth, it provides a reasonable indication of the economic consequences of long-term conditions. However, cost-of-illness studies have only limited ability to fully inform policy and decision making. Cost-
Report on New Zealand Cost-of-Illness Studies on Long-Term Conditions vii

effectiveness analyses will better assess potential solutions and, therefore, better serve decision-making.
viii Report on New Zealand Cost-of-Illness Studies on Long-Term Conditions

Report on New Zealand Cost-of-Illness Studies on Long-Term Conditions 1
Introduction
Long-term conditions are the major challenge for health care in New Zealand. They are the leading driver for health inequalities (Ajwani et al 2003) and the leading cause of preventable morbidity and mortality (Ministry of Health 1999). Along with the detrimental effects of long-term conditions on the individual, the family/whānau, community and health sector experience major financial and social costs. These costs include:
direct costs (for example, health care provision, pharmaceuticals, and income support)
indirect costs (for example, lost productivity)
intangible costs (for example, the physical and emotional toll on the individual and their family/whānau).
The World Health Organization (WHO) stated, ‘the cost to the world of the current and projected epidemic of chronic disease ... dwarfs all other health costs’ (WHO 2003, p 137). The overall cost of long-term conditions in New Zealand has not been estimated recently. However, in the United States, long-term conditions are estimated to cost the economy over US$1 trillion every year (DeVol and Bedroussian 2007) and account for over 75 percent of the total United States health spend (CDC 2008). It is expected that in New Zealand long-term conditions ‘consume a major proportion of our health care funds’ (National Health Committee 2007, p 1).
Definitions and examples of long-term conditions
The Ministry of Health defines a long-term condition as any ongoing, long-term or recurring condition that may have a significant impact on a person’s life (Ministry of Health 2008a). This broad definition is consistent with definitions used worldwide. Long-term conditions are sometimes known as ‘chronic conditions’, ‘chronic diseases’ or ‘chronic illnesses’. Other definitions, however, relate to the period or course of the condition. For example, the New Zealand Health Survey defined a ‘health condition’ as ‘a doctor-diagnosed physical or mental illness that has lasted, or is expected to last, for more than six months’ (Ministry of Health 2008b, p 119). The use of different definitions influences incidence and prevalence calculations. Disabilities are not included in the definition of long-term condition used in this report. However, it is recognised that many people with disabilities may have one or more long-term conditions and that they may be causally linked. There are many long-term conditions and they can affect any part of the body. Some common long-term conditions are:
alcohol and other drug addictions
arthritis
asthma
cancer
cardiovascular disease

chronic obstructive pulmonary disease
chronic pain
depression
diabetes.
Modifiable lifestyle risk factors for long-term conditions
Important modifiable lifestyle risk factors for long-term conditions are:
physical inactivity
obesity
poor nutrition
tobacco consumption. The proportion of adults who lead sedentary lifestyles is increasing, and obesity has increased greatly since the late 1980s. Although tobacco consumption has decreased in recent years, levels of tobacco consumption are still high (Ministry of Health 2008b).
People affected by long-term conditions
Two-thirds of New Zealand adults have been diagnosed with a long-term condition (Ministry of Health 2008b), and long-term conditions account for more than 80 percent of deaths (National Health Committee 2007). One in three children has also been diagnosed with a long-term condition (Ministry of Health 2008b). Long-term conditions are not randomly distributed across society, with several disadvantaged groups tending to have greater exposure to health risks, lower access to health services, and consequently poorer health as a result of long-term conditions. In New Zealand, long-term conditions disproportionately affect Māori, Pacific peoples and people of low socioeconomic status (Ministry of Health and Otago University 2006). These groups have higher rates of mortality and morbidity from long-term conditions than other groups in society. Many people have more than one long-term condition (that is, comorbid long-term conditions). Often the development of comorbidities is related. For example, depressive disorders develop as a common comorbidity for people with a long-term condition: conversely, depression can contribute to the development of a long-term condition (National Health Committee 2007). The prevalence of long-term conditions has risen in recent years and current predictions expect the burden of long-term conditions to continue to rise. This growth is affected by the increase in lifestyle risk factors and the ageing population (National Health Committee 2007).
Purpose of this report
In New Zealand it appears that no documents summarise or detail the economic impact reports that have been conducted on long-term conditions. This report summarises the
2 Report on New Zealand Cost-of-Illness Studies on Long-Term Conditions
economic impact reports on the health and societal costs of long-term conditions in New Zealand dating from about 1985.
Report on New Zealand Cost-of-Illness Studies on Long-Term Conditions 3
General Principles Underlying Cost-of-Illness Studies
This section summarises general methodological principles that underlie cost-of-illness studies (for example, what such studies measure and from what perspective, and the different types of costs and how they are measured).
What cost-of-illness and burden-of-disease studies measure
Cost-of-illness studies are descriptive studies that value in dollar terms the costs of a particular health problem (Jefferson et al 2000), which then enables the economic burden of the problem to be estimated. Burden-of-disease studies are similar to cost of illness studies, but they describe the magnitude of a health problem, typically measured in health outcomes such as mortality and morbidity (see the Measures of disease burden section). Cost-of-illness studies are not considered full economic evaluations because they do not assess actions to address the problem (Drummond et al 2005). However, cost-of-illness studies can highlight the importance of health issues in society.
Reasons for completing cost-of-illness studies
Calculating the economic burden of a condition can show the potential savings from eliminating the condition (Byford et al 2000), even if elimination of a condition is unrealistic or impossible. Cost-of-illness studies can also identify the different components of the costs and their relative sizes (Byford et al 2000). This information can highlight areas where costs can be saved or inefficiencies reduced and is practical information to guide funding decisions and policy-making. One criticism of cost-of-illness studies is that they are an ineffective use of resources because they do not provide enough information to identify inefficiency or waste (Byford et al 2000).
4 Report on New Zealand Cost-of-Illness Studies on Long-Term Conditions
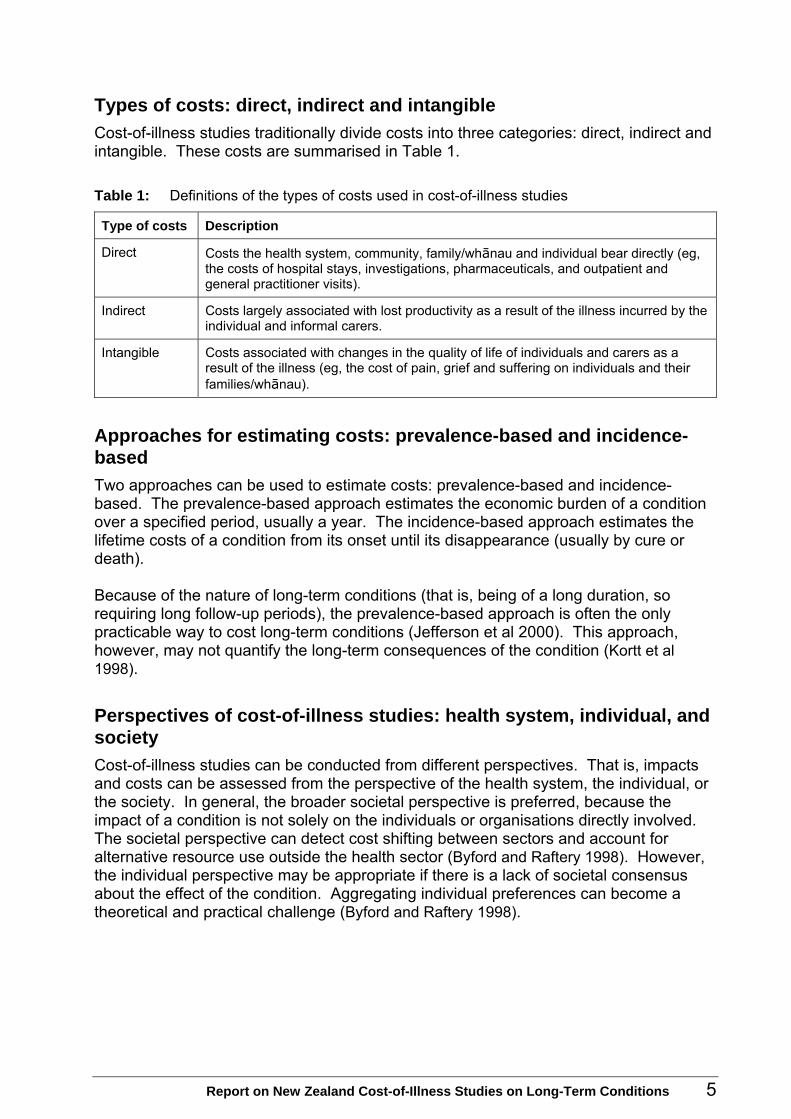
Types of costs: direct, indirect and intangible
Cost-of-illness studies traditionally divide costs into three categories: direct, indirect and intangible. These costs are summarised in Table 1.
Table 1: Definitions of the types of costs used in cost-of-illness studies
Type of costs Description
Direct Costs the health system, community, family/whānau and individual bear directly (eg, the costs of hospital stays, investigations, pharmaceuticals, and outpatient and general practitioner visits).
Indirect Costs largely associated with lost productivity as a result of the illness incurred by the individual and informal carers.
Intangible Costs associated with changes in the quality of life of individuals and carers as a result of the illness (eg, the cost of pain, grief and suffering on individuals and their families/whānau).
Approaches for estimating costs: prevalence-based and incidence-based
Two approaches can be used to estimate costs: prevalence-based and incidence-based. The prevalence-based approach estimates the economic burden of a condition over a specified period, usually a year. The incidence-based approach estimates the lifetime costs of a condition from its onset until its disappearance (usually by cure or death). Because of the nature of long-term conditions (that is, being of a long duration, so requiring long follow-up periods), the prevalence-based approach is often the only practicable way to cost long-term conditions (Jefferson et al 2000). This approach, however, may not quantify the long-term consequences of the condition (Kortt et al 1998).
Perspectives of cost-of-illness studies: health system, individual, and society
Cost-of-illness studies can be conducted from different perspectives. That is, impacts and costs can be assessed from the perspective of the health system, the individual, or the society. In general, the broader societal perspective is preferred, because the impact of a condition is not solely on the individuals or organisations directly involved. The societal perspective can detect cost shifting between sectors and account for alternative resource use outside the health sector (Byford and Raftery 1998). However, the individual perspective may be appropriate if there is a lack of societal consensus about the effect of the condition. Aggregating individual preferences can become a theoretical and practical challenge (Byford and Raftery 1998).
Report on New Zealand Cost-of-Illness Studies on Long-Term Conditions 5

Measuring disease burden: quality-adjusted life year and disability-adjusted life year
Health outcomes are typically quantified using measures of mortality (for example, lives or life years lost) or morbidity (for example, lost quality of life). Two common measures that combine and standardise outcome measures are the quality-adjusted life year (QALY) and disability-adjusted life year (DALY). QALYs tend to be used to illustrate health benefits. They are estimated by multiplying each year of life by a weight that reflects the quality of life. Weightings for particular health states are determined by asking patients or the public to rate their preference for particular health states (Wanless 2004). Health states are placed on a continuum from zero to one, with zero reflecting the worst health state and one reflecting full health. A variety of methods determine the social preferences for utility values, including the standard gamble, the person trade-off and the time trade-off (Wanless 2004). The DALY is a utility measure that represents the loss of one year of healthy life, so illustrates the negative impact of a condition. DALYs are commonly used to quantify disease burden at a population level. A DALY is a summation of two other health gap indicators: years of life lost (also known as potential years of life lost) and years lost to disability. Years of life lost estimates the social burden of fatal health outcomes. It is calculated by subtracting the age at death from the life expectancy remaining at that age (Ministry of Health 2001). Years lost to disability measures non-fatal health disease outcomes. Years lost to disability is severity adjusted with weightings similar to those used for the QALY. Collectively, these two measures take into account the burden of both fatal and non-fatal disease states. Dollar values can then be put on lives and life years lost.
Measuring intangible costs: human capital and willingness-to-pay approaches to valuing a life
Two common methods are used to place an economic value on a human life: the human capital approach and the willingness to pay approach. The human capital approach values a life with respect to the individual’s lost earnings potential (Rice 1994). This approach ignores that people are worth more than just what they produce. The willingness-to-pay approach places a higher price on a life than the human capital approach. In this approach, the value of a life is calculated based on research on the public’s ‘willingness to pay’ for certain outcomes. These figures are generally country specific. The most recent New Zealand calculation valued a statistical life at $3.35 million (Ministry of Transport 2008). The human capital and willingness-to-pay approaches are used to calculate the intangible costs of a condition or risk factor.
6 Report on New Zealand Cost-of-Illness Studies on Long-Term Conditions

Methodological differences
The methodology used in cost-of-illness studies varies in terms of the above principles. For example, studies incorporate different components of the types of costs into their final calculations. These methodological differences affect the total costs derived from the study. These differences, and the year in which the estimates are produced, make direct comparisons between studies impossible.
Report on New Zealand Cost-of-Illness Studies on Long-Term Conditions 7

Identifying the Literature
Literature search methodology
Literature searches were conducted on the Medline and Embase databases throughout August, September and October 2008. Search terms included ‘chronic disease’, ‘long-term conditions’, ‘long-term care’, ‘economics’, ‘costs’ and ‘cost analysis’, ‘cost of illness’ and ‘New Zealand’. These search terms were also variously used to search the internet literature through the Google and Google Scholar search engines. Additional publications were identified by scanning the reference lists of publications obtained through the database search. A variety of people were contacted throughout New Zealand and asked to identify other publications and their plans for future research in this area. The response rate to this request was over 80 percent (39 out of 47). Those who responded are listed in the appendix.
International studies for context
International studies were identified to provide a brief international overview of the current research on the economic impact of long-term conditions. This also helped to place the New Zealand research in an international context. The international studies were major publications from 1993 to 2008. These studies were conducted on a global scale and/or on long-term conditions in general (that is, not specific diseases).
Literature identified
The literature search identified 30 New Zealand–specific publications, articles and reports dating from 1985. Of the 30 documents:
20 were cost-of-illness studies that did not focus on specific risk factors
seven were cost-of-illness studies that focused on the cost of specific risk factors (for example, smoking and physical inactivity)
three were burden-of-disease studies (of which two had a greater focus on risk factors).
Costs in New Zealand dollars
All costs specified in this report are in New Zealand dollars unless otherwise stated.
8 Report on New Zealand Cost-of-Illness Studies on Long-Term Conditions
Report on New Zealand Cost-of-Illness Studies on Long-Term Conditions 9
International Literature
Global research on the costs and burden of long-term conditions
Since the early 1990s, several organisations have estimated the costs and burden of long-term conditions on a global scale or for a selected group of countries. Outputs from these studies include monetary costs, costs in terms of a percentage of gross domestic product, lost national income, DALYs, a ranking of the burden of disease, and estimates of future costs.
Estimates of the global burden of long-term conditions
WHO updated its Global Burden of Disease with 2004 data (WHO 2008). Of the top 10 causes of death in high-income countries, nine were the result of long-term conditions. Coronary heart disease and cerebrovascular diseases were the top two long-term conditions, accounting for over a quarter of deaths in high-income countries. These diseases were also the top two causes of death globally, accounting for about a quarter of deaths. Long-term conditions accounted for the top nine causes of burden of disease (as calculated by DALYs), in high-income countries. Unipolar depressive disorders caused 10 million DALYs in high-income countries in 2004.
Estimates of the global cost of long-term conditions
No studies were identified that estimated the total global cost of long-term conditions in general. However, some reports estimated the costs of long-term conditions. WHO estimated foregone national income due to heart disease, stroke and diabetes in nine countries (WHO 2005; Abegunde and Stanciole 2006). The estimated income loss in 2005 ranged from less than 1 billion to more than 18 billion international dollars per country.1 This income loss equated to an estimated annual reduction in gross domestic product of 0.5 percent. The World Bank found a variety of results for different conditions and risk factors (Adevi et al 2007). The total costs of cardiovascular diseases in most developed countries ranged from 1 percent to 3 percent of gross domestic product. Direct costs for diabetes ranged from 2.5 percent to 15 percent of the annual health care budgets. The costs of tobacco use in developed countries typically ranged from 1 percent to 4 percent of gross domestic product, and the cost of obesity was around 1 percent of GDP. WHO also estimated the costs of obesity to be from 2 percent to 7 percent of a country’s health care costs (WHO 2000).
1 The international dollar is a hypothetical currency unit that has the same purchasing power that the
United States dollar had in the United States at a given point in time. It is used to make comparisons between countries and over time.

Future estimates of the global cost and burden of long-term conditions
Future estimates suggest that the cost and burden of long-term conditions is likely to increase greatly (WHO 2008; Abegunde and Stanciole 2006). It is expected that the estimated loss of income as a percentage of gross domestic product due to heart disease, stroke and diabetes will increase from 0.5 percent to 1 percent in some countries over the period 2005 to 2015 (Abegunde and Stanciole 2006). The global burden of long-term conditions is also expected to increase. By 2030, it is expected that unipolar depressive disorders will be the greatest cause of burden of disease in the world (not just in high-income countries) (WHO 2008). Ischaemic heart disease, cerebrovascular disease and chronic obstructive pulmonary disease are all projected to be in the top five by 2030 (of these, only ischaemic heart disease currently ranks in the top five).
Country-specific studies on long-term conditions: United States and Australia
Most country-specific studies on the economic impact of long-term conditions have been conducted in the United States. One of the first estimates from the United States was that the total cost of chronic conditions was US$658 billion in 1990 (Hoffmann et al 1996). Of this total, about 65 percent (US$425 billion) was for direct health care costs with the remainder for indirect costs (ie, lost productivity through morbidity and mortality). More recent estimates have calculated higher totals. A 2007 report calculated that Long-term conditions were costing the United States economy US$1.3 trillion annually (DeVol and Bedroussian 2007). This included a far greater proportion of indirect costs (lost productivity) (85 percent or US$1.1 trillion) than direct costs. Research in 2008 suggested that 75 percent of the health spend in the United States was for patients with one or more chronic conditions. This equates to over $US1.5 trillion annually in direct costs alone. This is consistent with previous estimates of the proportion of health care spending on people with one or more chronic conditions (CDC 2008; John Hopkins University 2002). Not surprisingly, individual long-term conditions are consistently the most expensive conditions in the United States (Druss et al 2001; Druss et al 2002; Cohen and Krauss 1997). Heart disease, cancers and mental illness are often at the top of these lists. A burden of disease study undertaken in Australia in 2001 (Mathers et al 2001) found that the top 10 leading causes of disease burden in Australia were long-term conditions. Heading the list were ischaemic heart disease, stroke and chronic obstructive pulmonary disease. The leading cause of years lost to disability was mental disorder, which accounted for 30 percent of the non-fatal burden of disease in Australia.
10 Report on New Zealand Cost-of-Illness Studies on Long-Term Conditions
Report on New Zealand Cost-of-Illness Studies on Long-Term Conditions 11
Summary of the New Zealand Literature
Introduction
This section discusses the findings from the New Zealand studies dating from 1985. Some conditions and risk factors have had multiple studies into their costs. Five studies looked at type 2 diabetes and four looked at tobacco use. However, for most conditions and risk factors there was only one study. Overall, the studies specified 11 Long-term conditions and three risk factors. These findings are also summarised in Table 2 at the end of the section.
Burden-of-disease studies
Three burden-of-disease studies were identified from the New Zealand literature. They were:
The Burden of Disease and Injury in New Zealand (Ministry of Health 2001)
Looking Upstream (Ministry of Health 2004)
Nutrition and the Burden of Disease (Ministry of Health and University of Auckland 2003).
The Burden of Disease and Injury in New Zealand used the estimated incidence of each condition in New Zealand in 1996–97 (Ministry of Health 2001). Cardiovascular disease accounted for almost a quarter of all DALYs lost by the New Zealand population. The other two major health losses were from cancer (20 percent) and neuropsychiatric disorders (19 percent). Overall, these three cause groups – all of which are classified as long-term conditions groups – accounted for close to two-thirds of total DALYs lost. The Ministry of Health (2001) report also examined the top causes of DALYs lost by specific conditions. The report found that the top 10 specific causes of DALYs lost in New Zealand were heavily dominated by long-term conditions: nine of the top 10 causes were long-term conditions.2 The top 10 causes included two cancers (lung and colorectal), two respiratory conditions (chronic obstructive pulmonary disease and asthma), two mental health conditions (depression and anxiety disorders) and diabetes. The top three causes of DALYs lost to New Zealanders were ischaemic heart disease (73,804 DALYs), stroke (30,115 DALYs) and chronic obstructive pulmonary disease (27,848 DALYs). The Ministry of Health (2001) report also estimated the disease burden attributable to major risk factors. Tobacco had the largest attributable fraction. Fifteen percent of all DALYs lost among males and 9 percent among females were attributable to tobacco use. Physical inactivity was identified as the second leading risk factor contributing 6 percent to 7 percent of total DALYs lost. Obesity was also a major contributor to DALYs lost, with an attributable fraction of about 5 percent.
2 The other cause in the top 10 was road traffic injury (ranked ninth).
Looking Upstream attempted to class the causes of death by risk factor (Ministry of Health 2004). Using 1997 data, the study estimated that the joint effect of dietary factors was responsible for 30 percent of deaths. Tobacco use accounted for 18 percent of deaths, and insufficient physical activity a further 10 percent. Overweight and obesity accounted for 12 percent of deaths. Nutrition and the Burden of Disease investigated the attributable burden of disease to nutrition-related factors (Ministry of Health and University of Auckland 2003). The study used 1997 data and estimated that 40 percent of all deaths (about 11,000 deaths) were attributable to nutrition-related risk factors. The risk factors used were total blood cholesterol, systolic blood pressure, body mass index, and vegetable and fruit intake. The nutrition-related risk factors also accounted for more than 70 percent of stroke and heart disease mortality. The risk factor higher-than-optimal body mass index accounted for 80 percent of diabetes cases.
Cost-of-illness studies by disease
Arthritis
Arthritis New Zealand and Access Economics (2005)
This study estimated direct costs of $564 million for arthritis in 2005. Of these costs, direct health costs (hospital costs) represented about one-third of the total. This study estimated indirect costs of $1,788 million for arthritis in 2005. This estimate outweighs the direct health costs by more than three to one. At over $1 billion, lost productivity was the greatest contributor to indirect costs. Other indirect costs included informal care, aids, modification and travel costs. This study estimated intangible costs of $2,560 million for arthritis in 2005. The burden of disease for arthritis was estimated at over 19,000 DALYs. After accounting for the direct and indirect costs, this led to a net cost of suffering of $2.56 billion.
Asthma
Mitchell (1989)
This study estimated direct costs of $102 million for asthma in 1988/89. This combined hospital costs of $17 million and pharmaceutical costs of $85 million. Hospital costs did not include outpatient or accident and emergency costs. This study did not calculate the indirect costs of asthma.
Holt and Beasley (2001)
This study estimated direct costs of $125 million for asthma in the late 1990s. Pharmaceuticals made up the largest proportion of direct costs with hospital inpatient costs contributing significantly less to the total. This is consistent with the Mitchell (1989) analysis of asthma costs.
12 Report on New Zealand Cost-of-Illness Studies on Long-Term Conditions

This study estimated indirect costs of $699 million for asthma in the late 1990s. Indirect costs (work loss, premature death and DALYs) accounted for 85 percent of the total costs or 5½ times the direct costs. This study also looked at the burden of asthma. It identified asthma as the third highest ranking specific disease in terms of years lost to disability behind depression and anxiety disorders.
Chronic obstructive pulmonary disease and lung cancer
Broad and Jackson (2003)
This study estimated direct costs of $103 million to $192 million for chronic obstructive pulmonary disease in 2002. Hospitalisations were the highest cost items, accounting for 63 percent of costs. Pharmaceuticals accounted for 15 percent of costs. This study estimated direct costs of $18 million to $28 million for lung cancer in 2002. Hospitalisation costs were about two-thirds of the total costs. Palliative care costs were more expensive than pharmaceutical costs. Direct cost calculations for both parts of the study did not include private part-payments or individual costs such as travel to services or rest-home care. This study did not estimate indirect costs for chronic obstructive pulmonary disease and lung cancer.
Coronary heart disease
Scott et al (1993)
This study estimated direct costs of $179 million for coronary heart disease in 1992. The extensive range of direct costs included ambulance costs, hospital costs, diagnostic tests, private consultation costs, and medicine and dispensing costs. Hospital ward stays were the main contributor to direct costs. Direct costs outnumbered indirect costs by about 10 to 1. This study estimated indirect costs of $14 million to $24 million for coronary heart disease in 1992. Indirect costs included primarily lost productivity, but also medical research and health promotion costs. This study estimated intangible costs of $114 million to $264 million for coronary heart disease in 1992. These costs were calculated by costing the loss of life using the human capital approach. Under the willingness-to-pay approach, the intangible costs increased to $14,568 million.
Report on New Zealand Cost-of-Illness Studies on Long-Term Conditions 13
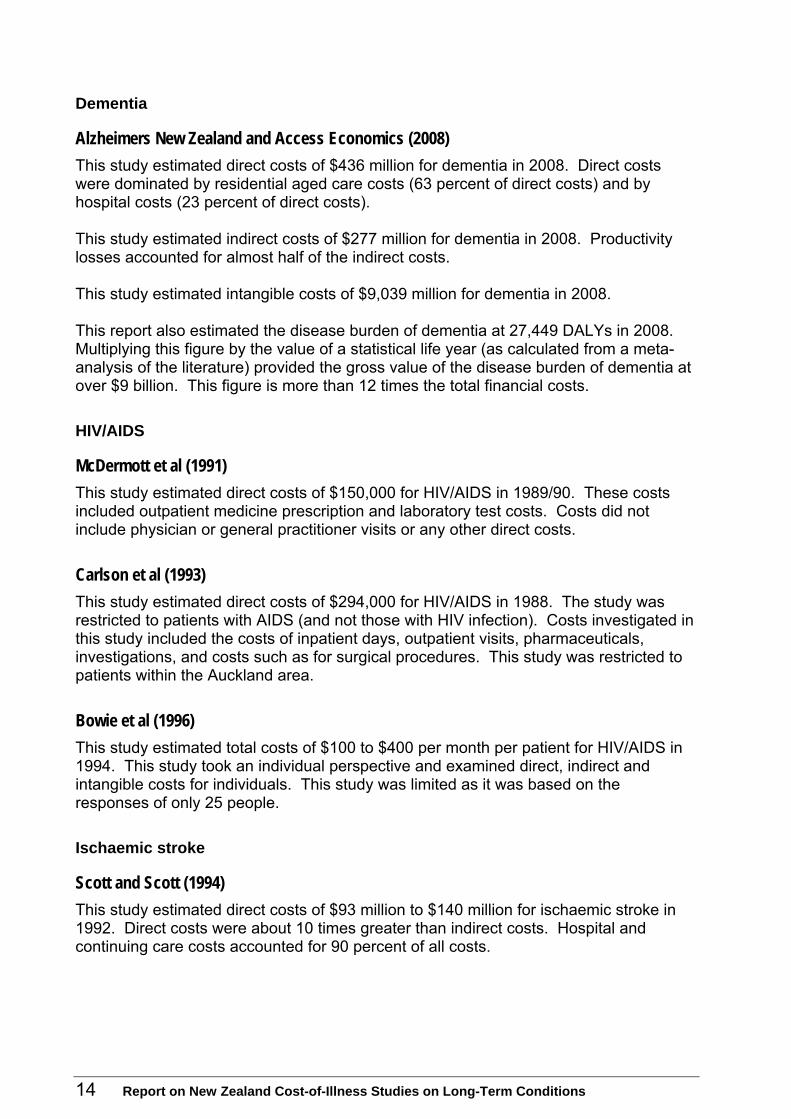
Dementia
Alzheimers New Zealand and Access Economics (2008)
This study estimated direct costs of $436 million for dementia in 2008. Direct costs were dominated by residential aged care costs (63 percent of direct costs) and by hospital costs (23 percent of direct costs). This study estimated indirect costs of $277 million for dementia in 2008. Productivity losses accounted for almost half of the indirect costs. This study estimated intangible costs of $9,039 million for dementia in 2008. This report also estimated the disease burden of dementia at 27,449 DALYs in 2008. Multiplying this figure by the value of a statistical life year (as calculated from a meta-analysis of the literature) provided the gross value of the disease burden of dementia at over $9 billion. This figure is more than 12 times the total financial costs.
HIV/AIDS
McDermott et al (1991)
This study estimated direct costs of $150,000 for HIV/AIDS in 1989/90. These costs included outpatient medicine prescription and laboratory test costs. Costs did not include physician or general practitioner visits or any other direct costs.
Carlson et al (1993)
This study estimated direct costs of $294,000 for HIV/AIDS in 1988. The study was restricted to patients with AIDS (and not those with HIV infection). Costs investigated in this study included the costs of inpatient days, outpatient visits, pharmaceuticals, investigations, and costs such as for surgical procedures. This study was restricted to patients within the Auckland area.
Bowie et al (1996)
This study estimated total costs of $100 to $400 per month per patient for HIV/AIDS in 1994. This study took an individual perspective and examined direct, indirect and intangible costs for individuals. This study was limited as it was based on the responses of only 25 people.
Ischaemic stroke
Scott and Scott (1994)
This study estimated direct costs of $93 million to $140 million for ischaemic stroke in 1992. Direct costs were about 10 times greater than indirect costs. Hospital and continuing care costs accounted for 90 percent of all costs.
14 Report on New Zealand Cost-of-Illness Studies on Long-Term Conditions

This study estimated indirect costs of $6 million to $14 million (lost productivity only) for ischaemic stroke in 1992.
Obstructive sleep apnoea
Scott et al (2007)
This study estimated direct costs of $29 million for obstructive sleep apnoea in 2005. Direct costs accounted for the majority of costs and included hospital costs, outpatient and general practitioner visits, surgery, appliances, transport costs, and associated costs such as motor vehicle accident costs and cardiovascular disease costs. This study estimated indirect costs of $10 million for obstructive sleep apnoea in 2005. Indirect costs (mainly lost productivity) were only one-third the size of direct costs. This study estimated intangible costs of $1.3 million for obstructive sleep apnoea in 2005. A small proportion of the total costs was contributed by the intangible costs of loss of life.
Osteoporosis
Lane (1996)
This study estimated direct costs of $41.7 million in the first year and $25.0 million in the second year for osteoporosis in 1995. This study used osteoporosis attribution factors to estimate the annual incidence of osteoporotic hip and non-hip fractures. The study also calculated annual pharmaceutical costs. Acute inpatient care costs represented a significant proportion of these costs, although private hospital and residential care costs were also high. Other costs included non-hip fracture costs and pharmaceuticals.
Brown et al (2007)
This study estimated direct costs of $1,159 million for osteoporosis in 2007. Costs were dominated by the treatment of other osteoporotic conditions such as musculoskeletal problems, back problems and curvature of the spine (estimated at $828 million). Immediate fracture treatment and after-fracture care accounted for almost $300 million. The treatment and management of osteoporosis totalled $34 million, which was dominated by pharmaceuticals.
Type 2 diabetes
This report identified more analyses on the costs of type 2 diabetes than any other disease.
Cooper and Scott (1985)
This study estimated direct costs of $1.4 million for type 2 diabetes in 1982. Estimates were based solely on hospital admission bed costs at Middlemore Hospital and equated to 4.4 percent of the total hospital budget.
Report on New Zealand Cost-of-Illness Studies on Long-Term Conditions 15

Simmons (1996)
This study estimated direct costs of $250 million to $600 million for type 2 diabetes in 1996. The estimate was based on international studies from other developed nations.
Simmons et al (1999)
This study estimated direct costs from an individual perspective of $191 to $329 per year per patient for type 2 diabetes in 1996. Costs included scripts, shoes, and clinic and general practice visits.
Diabetes New Zealand and PricewaterhouseCoopers (2001, 2007, 2008)
These studies estimated direct costs for type 2 diabetes of $247 million in 2001, $540 million in 2007 and $600 million in 2008. These studies estimated the cost of publicly provided health services for type 2 diabetes. The reports provided future cost projections for annual health costs for diabetes, which are reported in the Future cost estimates section of this report.
Cost-of-illness studies by risk factor
Several major risk factors contribute significantly to the development of long-term conditions. Commonly identified examples are tobacco use, low levels of physical activity and poor nutrition (National Health Committee 2007; Ministry of Health 2001, 2008b; WHO 2005). Obesity is also classed as a major risk factor for the development of long-term conditions. To estimate the cost and/or burden of any risk factor, a population attributable risk must be calculated (Ministry of Health 2001). This measure takes into account the strength of the association between exposure (or risk factor) and the condition and prevalence of the exposure. Therefore, results from risk factor studies are often regarded as approximate estimations due to the potential uncertainty around the calculation of population attributable risk. Alcohol use is also cited as a risk factor that contributes to the development of Long-term conditions. However, cost-of-alcohol studies were not examined in this report because, unlike obesity, physical inactivity and tobacco use, a significant proportion of alcohol-related conditions used in economic analyses are not long-term conditions (for example, injuries, pregnancy-related conditions and acute conditions).
Obesity
Swinburn et al (1997)
This study estimated direct costs of $135 million for obesity in 1991. This was the only New Zealand study to calculate the direct costs of obesity. Six obesity-related disorders were used: type 2 diabetes, coronary heart disease, hypertension, gallstones, post-menopausal breast cancer and colon cancer. Type 2 diabetes, coronary heart disease and hypertension dominated obesity costs, each contributing around $40 million. Direct
16 Report on New Zealand Cost-of-Illness Studies on Long-Term Conditions

costs covered inpatient services (public and private hospitals), outpatient services, general practitioner visits, pharmaceuticals, laboratory tests and ambulance services. The total cost of $135 million represented 2.5 percent of the total health spend. This percentage is consistent with international literature (Swinburn et al 1997). The prevalence of adult obesity (a body mass index equal or higher to 30) in this study was 14 percent. The most recent obesity prevalence rates are over 25 percent (Ministry of Health 2008b).
New Zealand Government 2007
This study estimated direct costs of $460 million for obesity in 2004. This figure was based on the above 1991 cost analysis (Swinburn et al 1997) and accounted for changes in obesity prevalence. This study estimated indirect costs of $370 million for obesity in 2004. This figure, estimated from international literature, was restricted to lost productivity.
Physical inactivity
Russell et al (1993)
This study estimated direct costs of $60 million for physical inactivity in 1991. The health costs calculated were associated with seven conditions related to physical inactivity: coronary heart disease, hypertension, obesity, osteoporosis, type 2 diabetes, stroke and colon cancer. Direct costs included public and private hospital costs and primary care costs (for example, general practitioner visits, laboratory costs, diagnostic tests and pharmaceuticals). Public hospital costs contributed over 50 percent of the direct costs. This study estimated indirect costs of $104 million for physical inactivity in 1991. Indirect costs were calculated as the lost productivity due to morbidity and mortality. Comparisons of the level of physical inactivity between the early 1990s (when the Russell et al (1993) study was conducted) and now are difficult because of the different definitions of physical inactivity used.
Tobacco use
Gray et al (1988)
This study estimated direct costs of $82 million for tobacco use in 1986. This figure was based solely on the attributable excess hospital admission days (both public and private) caused by smoking on a variety of conditions (for example, some cancers, cardiovascular disease, respiratory diseases). The study did not estimate outpatient services, pharmaceuticals or other direct costs. The study did not estimate indirect costs for tobacco use.
Report on New Zealand Cost-of-Illness Studies on Long-Term Conditions 17
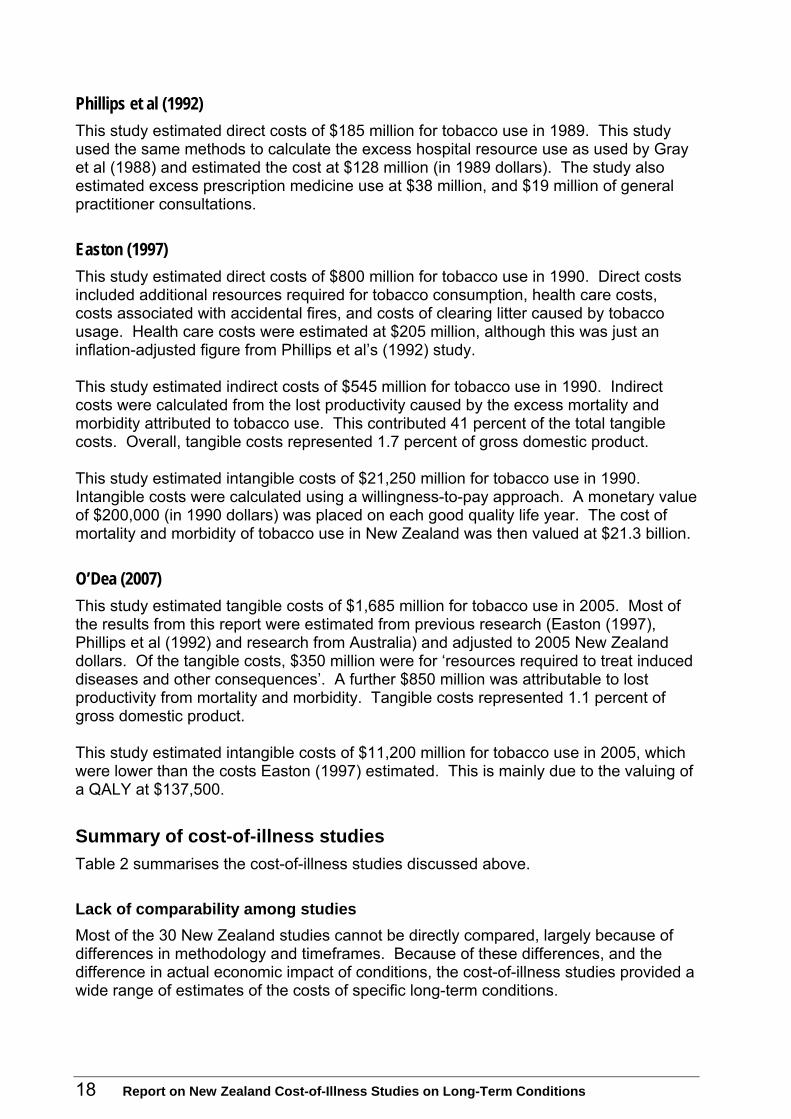
Phillips et al (1992)
This study estimated direct costs of $185 million for tobacco use in 1989. This study used the same methods to calculate the excess hospital resource use as used by Gray et al (1988) and estimated the cost at $128 million (in 1989 dollars). The study also estimated excess prescription medicine use at $38 million, and $19 million of general practitioner consultations.
Easton (1997)
This study estimated direct costs of $800 million for tobacco use in 1990. Direct costs included additional resources required for tobacco consumption, health care costs, costs associated with accidental fires, and costs of clearing litter caused by tobacco usage. Health care costs were estimated at $205 million, although this was just an inflation-adjusted figure from Phillips et al’s (1992) study. This study estimated indirect costs of $545 million for tobacco use in 1990. Indirect costs were calculated from the lost productivity caused by the excess mortality and morbidity attributed to tobacco use. This contributed 41 percent of the total tangible costs. Overall, tangible costs represented 1.7 percent of gross domestic product. This study estimated intangible costs of $21,250 million for tobacco use in 1990. Intangible costs were calculated using a willingness-to-pay approach. A monetary value of $200,000 (in 1990 dollars) was placed on each good quality life year. The cost of mortality and morbidity of tobacco use in New Zealand was then valued at $21.3 billion.
O’Dea (2007)
This study estimated tangible costs of $1,685 million for tobacco use in 2005. Most of the results from this report were estimated from previous research (Easton (1997), Phillips et al (1992) and research from Australia) and adjusted to 2005 New Zealand dollars. Of the tangible costs, $350 million were for ‘resources required to treat induced diseases and other consequences’. A further $850 million was attributable to lost productivity from mortality and morbidity. Tangible costs represented 1.1 percent of gross domestic product. This study estimated intangible costs of $11,200 million for tobacco use in 2005, which were lower than the costs Easton (1997) estimated. This is mainly due to the valuing of a QALY at $137,500.
Summary of cost-of-illness studies
Table 2 summarises the cost-of-illness studies discussed above.
Lack of comparability among studies
Most of the 30 New Zealand studies cannot be directly compared, largely because of differences in methodology and timeframes. Because of these differences, and the difference in actual economic impact of conditions, the cost-of-illness studies provided a wide range of estimates of the costs of specific long-term conditions.
18 Report on New Zealand Cost-of-Illness Studies on Long-Term Conditions

Direct costs: hospital inpatient costs are largest single contributor
Most studies provided some estimate of direct costs of the long-term condition or risk factor. The main contributors to direct costs included hospital inpatient costs, outpatient visits, primary care visits, pharmaceuticals and laboratory costs. Some studies also included transport costs, ambulance costs, residential care costs and rehabilitation costs in their estimates. For most long-term conditions, the largest single contributor to direct costs was hospital inpatient cost. Where figures were given, hospital costs usually accounted for over 50 percent of the total direct costs. Figures, however, ranged from about 35 percent for arthritis to 90 percent for ischaemic stroke. Hospital costs also accounted for most of the direct costs for both tobacco use and physical inactivity. Because of the different nature of some diseases, there were exceptions to this finding. For asthma, pharmaceutical costs contributed over 80 percent of the total direct costs. For dementia, residential care costs dominated. Residential care and rehabilitation costs were also high for osteoporosis.
Indirect costs: lost productivity
Several studies estimated indirect costs. The most commonly used measure of indirect costs and the major contributor to indirect costs was lost productivity. In most studies, productivity loss was the only measure of indirect costs. Indirect costs contributed variable amounts to the total costs depending on the condition. In some studies indirect costs accounted for as little as 4 percent, in another study it was as high as 85 percent. Most estimates fell between 39 percent and 76 percent.
Approach and perspective of most studies
Almost all the 30 studies used the prevalence approach to estimate costs, and took a societal or health system perspective.
Table 2: Summary of cost-of-illness and cost-of-risk-factor studies conducted in New Zealand, 1985–2008
Condition or risk factor
Reference Year of data
Direct costs (NZ$)
Indirect costs (NZ$)
Intangible costs (NZ$)
Approach Perspective
Long-term conditions
Arthritis Arthritis New Zealand and Access Economics (2005)
2005 564 million 1,788 million 2,560 million Prevalence Societal
Mitchell (1989) 1988 102 million – – Prevalence Health systemAsthma
Holt and Beasley (2001)
Late 1990s
125 million 699 million – Prevalence Societal
Chronic obstructive pulmonary disease
Broad and Jackson (2003)
2002 103–192 million – – Prevalence Societal
Report on New Zealand Cost-of-Illness Studies on Long-Term Conditions 19

20 Report on New Zealand Cost-of-Illness Studies on Long-Term Conditions
Condition or risk factor
Reference Year of data
Direct costs (NZ$)
Indirect costs (NZ$)
Intangible costs (NZ$)
Approach Perspective
Lung cancer Broad and Jackson (2003)
2002 18–28 million – – Prevalence Societal
Coronary heart disease
Scott et al (1993) 1992 179 million 14–24 million 114–264 million Prevalence Societal
Dementia Alzheimers New Zealand and Access Economics (2008)
2008 436 million 277 million 9,039 million Prevalence Societal
HIV infection McDermott et al (1991)
1989/90 0.15 million – – Prevalence Health system
AIDS Carlson et al (1993) 1988 0.29 million – – Prevalence Health system
HIV/AIDS Bowie et al (1996) 1994 Total: $100–400 per month per patient Prevalence Individual
Ischaemic stroke
Scott and Scott (1994)
1992 93–140 million 6–14 million – Prevalence Societal
Obstructive sleep apnoea syndrome
Scott et al (2007) 2005 29 million 10 million 1.3 million Prevalence Societal
Lane (1996) 1995 42 million (1st year); 25 million (2nd year)
– – Incidence Societal Osteoporosis
Brown et al (2007) 2007 1,159 million – – Prevalence Societal
Cooper and Scott (1985)
1982 1.4 million (limited to Middlemore Hospital only)
– – Prevalence Health system
Simmons (1996) 1996 250–600 million – – Prevalence Societal
Simmons et al (1999)
1996 $191–329 (per year per patient
– – Prevalence Individual
Diabetes New Zealand and Pricewaterhouse-Coopers (2001)
2001 247 million – – Prevalence Health system
Diabetes New Zealand and Pricewaterhouse-Coopers (2007)
2007 540 million – – Prevalence Health system
Type 2 diabetes
Diabetes New Zealand and Pricewaterhouse-Coopers (2008)
2008 600 million – – Prevalence Health system
Risk factors
Swinburn et al (1997)
1991 135 million – – Prevalence Health systemObesity
New Zealand Government (2007)
2004 460 million 370 million – Prevalence Societal
Physical inactivity
Russell et al (1993) 1991 60 million 104 million – Prevalence Societal
Gray et al (1988) 1986 82 million – – Prevalence Health system
Phillips et al (1992) 1989 185 million – – Prevalence Health system
Easton (1997) 1990 800 million 545 million 21,250 million Prevalence Societal
Tobacco use
O’Dea (2007) 2005 1,685 million in total tangible costs
11,200 million Prevalence Societal
Note: All costs are annual costs to the year of data.
Source: The references are in the reference list at the end of the report.
Future cost estimates
Few of the 30 New Zealand studies provided any estimates of the future costs of any long-term conditions. However, the future costs of osteoporosis and type 2 diabetes have been estimated. Based entirely on the expected increase in osteoporosis prevalence, the future cost of osteoporosis is expected to increase (Brown et al 2007). Direct costs in 2007 were estimated at $1.16 billion, growing to $1.37 billion in 2013 and $1.61 billion in 2020. These estimates assumed the expected cost-per-case remained the same from 2007 to 2020. PricewaterhouseCoopers completed three economic analyses on type 2 diabetes (Diabetes New Zealand and PricewaterhouseCoopers 2001, 2007, 2008). All three analyses provided cost estimates under various future scenarios. Only the most recent estimates are provided here (Diabetes New Zealand and PricewaterhouseCoopers 2008). If existing diabetes services remained in place, the forecast cost of diabetes was predicted to rise from $600 million in 2006/07 to $920 million in 2011/12, $1,310 million in 2016/17 and $1,770 million in 2021/22. Two other scenarios assumed additional funding of between $20 million and $60 million per year. Although initial costs increased, total costs by 2021/22 were lower than or equal to the existing diabetes services costs forecast (ranging from $1,510 million to $1,770 million). Although no other studies identified estimated future costs of long-term conditions in New Zealand, it is expected that the prevalence of long-term conditions in New Zealand will increase over time. This increase will be driven by the structural ageing of the population and the increase in risk factors known to affect the development of long-term conditions. It can be assumed that an increase in the prevalence of long-term conditions will equate to an increase in the cost and burden of long-term conditions in New Zealand.
Report on New Zealand Cost-of-Illness Studies on Long-Term Conditions 21

Discussion
Long-term conditions consume many resources but studies are limited
This report has shown that long-term conditions consume a vast amount of resources in New Zealand: both in terms of direct health care costs and the indirect costs on society as a whole. This finding is consistent with the international literature that long-term conditions are utilising most of a country’s overall health spend (DeVol R, Bedroussian 2007; Druss et al 2001; Druss et al 2002; Cohen and Krauss 2003) and cause the greatest health burden to society (WHO 2008). Direct comparisons between the studies are impossible because of differences in the methods used, costs calculated and timeframes. Nevertheless, most studies reported annual societal costs of more than $100 million per condition. The cost-of-illness studies investigated only 11 conditions, and there are many more long-term conditions for which no current economic research is available. Some common long-term conditions where no cost-of-illness research was identified include cancer (excluding lung cancer), mental health conditions, chronic obstructive pulmonary disease and chronic pain. No studies into the overall economic cost of all long-term conditions in New Zealand were identified. These findings illustrate a gap in both the breadth and depth of cost-of-illness studies in New Zealand.
Cost findings: indirect costs are about the same as direct costs
In almost half the studies, the direct costs were the only costs estimated. Several studies, however, provided some estimate of indirect costs for the specific condition or risk factor. As a percentage of the combined direct and indirect costs, indirect costs varied in their contribution. In most studies indirect costs contributed between one-third and two-thirds of the costs. Comparison between studies is impossible because of the different methods used. However, a rough estimate for all long-term conditions indicates that indirect costs account for about half of the combined direct and indirect costs; that is, indirect costs are roughly the same as direct costs. This figure is consistent with data from other developed countries (Adevi et al 2007; Oxford Health Alliance 2006).
Cost findings: intangible costs may be in the billions
A few of the studies estimated the intangible costs of the condition or risk factor. Most studies used the willingness-to-pay approach to calculate the costs, although one study provided figures for both the willingness-to-pay and human capital approaches (Scott et al 1993). Intangible costs tended to be estimated in the billions.
22 Report on New Zealand Cost-of-Illness Studies on Long-Term Conditions

Limitations of this report
Lack of comparability
One of the most obvious limitations with this report is the inability to provide valid comparisons between studies. The studies have been conducted on different conditions, over different timeframes, using different approaches, and considering different components of cost. Therefore, it is not possible to state that one condition or risk factor is more costly than any other on the basis of these studies.
Potential over- and under-estimation of costs
A further limitation relates to whether cost-of-illness studies tend to over- or under-estimate costs. Some researchers argue that under-estimation is because household expenditure is not fully accounted to an individual with an long-term condition, risk factor–associated behaviours are inadequately captured, and the effects of long-term conditions on employers are under-estimated (Adevi et al 2007). Other researchers argue that over-estimation occurs because cost-of-illness studies often use the total absence of a condition as the counterfactual (Oxford Health Alliance 2006). This counterfactual is often unrealistic, so over-estimates the total cost that potentially could be saved.
Assumptions about risk factors
Some limitations are specifically associated with the cost estimates for risk factors. Several assumptions are made when estimating the costs of risk factors. First, a list of risk factor–related conditions must be decided on. The conditions selected are likely to influence the final results. Secondly, arriving at an appropriate population attributable risk for a risk factor requires several assumptions: the level of association between the risk factor and the condition in the New Zealand environment, the different effects of the risk factor on mortality compared with morbidity, the potential interaction between risk factors, and any important confounders of the risk factor or condition (Ministry of Health 2001). The population attributable risk may vary depending on the assumptions made, so all cost estimates are only approximate.
No consideration of comorbidity
A further limitation of the research conducted in New Zealand is that none of the studies accounted for the effect of comorbidities on costs. Many people who experience long-term conditions often have two or more different (and not necessarily related) conditions (National Health Committee 2007). Comorbidities can affect the overall cost to the health system and society. International literature suggests health spending increases exponentially with increasing number of long-term conditions (John Hopkins University 2002). Comorbid conditions have been shown to be an important economic cost of a long-term condition (Strassels et al 2001).
Report on New Zealand Cost-of-Illness Studies on Long-Term Conditions 23

Limited research into future costs
There is little New Zealand research that has estimated future costs. Based on the limited research identified, it is expected that future costs of long-term conditions will increase. In addition, both international data and New Zealand data suggest that the burden of long-term conditions will increase into the future (National Health Committee 2007; WHO 2008). Therefore, it could be expected that the cost of long-term conditions will also increase into the future. Future costs may also be increased by the proliferation of high-cost medical technology.
Future Research Options
Future economic analyses could address the gaps in the cost-of-illness literature identified in this report, including considering the role of co-morbidities in driving the costs of long-term conditions. Although coverage of long-term conditions in cost-of-illness studies in New Zealand is incomplete, further such studies may not be the most efficient use of research resources. There is a fair amount of evidence from New Zealand that long-term conditions have considerable economic consequences. Cost-of-illness studies are useful in highlighting areas of great expense. However, policy and decision-making is better informed by research that assesses potential solutions and identifies the actions that will provide greatest value for money, for example through use of cost effectiveness analyses. A greater understanding is needed about whether certain investments will provide benefits and how to maximise population health outcomes with the resources available. An improved New Zealand–specific evidence base on cost-effective strategies would provide practical information to guide decision-making.
24 Report on New Zealand Cost-of-Illness Studies on Long-Term Conditions

Conclusion
Cost-of-illness studies can provide some useful pieces of information. Firstly, calculating the costs and economic magnitude of a particular condition can, by implication, provide the costs that could be saved if the condition was eliminated (Byford et al 2000). Cost-of-illness studies can also identify the different components of cost and their relative sizes. This can potentially provide priorities for funding in areas where costs can be saved or inefficiencies reduced (Byford et al 2000). However, cost-of-illness studies can not provide information on cost-effectiveness or cost-efficiency of specific actions. It is also argued that many conditions can not be eliminated, therefore the total costs of a condition are not a true reflection of the resources that could be saved (Byford et al 2000). Cost-of-illness studies provide no information on prevention costs: prevention costs may well be greater than the costs of the condition. Despite these limitations, this report has clearly identified that long-term conditions are especially costly and are a source of significant economic burden on society. This burden is not just restricted to the health system and direct health costs. At a rough approximation, indirect costs (such as lost productivity) will equal the direct costs of a given condition. Whatever the total cost of long-term conditions in New Zealand, it can be expected that these costs will increase in the future. There are very few future cost-of-illness projections, however, with the expected increase in the prevalence of long-term conditions and some risk factors, as well as the ageing population, it is expected that costs will also increase if the status quo remains. This report has highlighted that there is not a wide range of data on the costs of long-term conditions in New Zealand. Although New Zealand research lacks both breadth and depth, it provides a reasonable indication of the economic consequences of long-term conditions. There is, however, no detailed overall single estimate of the costs of long-term conditions in New Zealand. Further cost-of-illness studies alone are unlikely to offer information of much further benefit. Cost-effectiveness analyses on actions to reduce long-term conditions will better serve decision-making. Finally, we should not seek to reduce the burden of long-term conditions in New Zealand purely for the sake of economic gain. Health gain in itself is the primary goal of health care, and potential economic benefit is just another incentive on the way to achieving that goal.
Report on New Zealand Cost-of-Illness Studies on Long-Term Conditions 25

Appendix: Publication Search Contact List
Toni Ashton School of Population Health, University of Auckland Robert Bowie Formerly Lecturer in Health Economics, Department of Public
Health, Wellington School of Medicine and Health Sciences Paul Brown School of Population Health, University of Auckland Tessa Buchanan The Treasury Joy Cooper Wairarapa District Health Board Bronwyn Croxson Ministry of Health Jackie Cumming Victoria University of Wellington Warwick Davenport MidCentral District Health Board Devon Diggle Ministry of Health Raewyn Dowman Arthritis Foundation Brian Easton JD Stout Fellow, Victoria University of Wellington Liz Falkner Wairarapa District Health Board Jon Foley Ministry of Health John Foreman New Zealand Organisation for Rare Disorders Lorna Fox Pain Society Gill Hall Accident Compensation Corporation Dave Hill SuperficialSiderosis.org.nz Joe Howells Wairarapa District Health Board Darren Hunt Ministry of Health Victoria Jackson Alzheimer’s Foundation Penny Jorgensen Allergy New Zealand Judy Kavanagh Ministry of Education Elizabeth Knopf Ministry of Health Stephen Lungley Ministry of Health Stephen Manning Ministry of Health Eileen McKinlay University of Otago, Wellington Richard Milne Health Outcomes Associates Ltd Gerald Minnee The Treasury Des O’Dea University of Otago, Wellington Jane Patterson Asthma and Respiratory Foundation David Rees Synergia Norman Sharpe National Heart Foundation Ian Sheerin University of Otago, Christchurch Suzanne Snively PriceWaterhouseCoopers Ruth Taka Accident Compensation Corporation Sarah Thomson Diabetes New Zealand Jocelyn Tracey PHOcus on Health Natalia Valentino Arthritis Foundation Simon Wright Ministry for the Environment
26 Report on New Zealand Cost-of-Illness Studies on Long-Term Conditions

References
Abegunde D, Stanciole A. 2006. An Estimation of the Economic Impact of Chronic Non-communicable Diseases in Selected Countries. Geneva: World Health Organization.
Adeyi O, Smith O, Robles S. 2007. Public Policy and the Challenge of Chronic Non-communicable Diseases. Washington DC: World Bank.
Ajwani S, Blakely T, Robson B, et al. 2003. Decades of Disparity: Ethnic mortality trends in New Zealand 1980–1999. Wellington: Ministry of Health and University of Otago.
Alzheimers New Zealand, Access Economics. 2008. Dementia Economic Impact Report 2008. Wellington: Alzheimers New Zealand.
Arthritis New Zealand, Access Economics. 2005. The Economic Cost of Arthritis in New Zealand. Wellington: Arthritis New Zealand.
Bowie RD, Tobias MI, Williams T. 1996. The private costs of HIV/AIDS. New Zealand Medical Journal 109(1016): 51–4.
Broad J, Jackson R. 2003. Chronic Obstructive Pulmonary Disease and Lung Cancer in New Zealand. Dunedin: Thoracic Society of Australia and New Zealand.
Brown P, McNeill R, Radwan E, et al. 2007. The Burden of Osteoporosis in New Zealand: 2007–2020. Wellington: Osteoporosis New Zealand.
Byford S, Raftery J. 1998. Perspectives in economic evaluation. British Medical Journal 316(7143): 1529–30.
Byford S, Torgerson D, Raftery J. 2000. Cost of illness studies. British Medical Journal 320(7245): 1335.
Carlson R, Dickson N, McDermott J, et al. 1993. Hospital associated costs of treating patients with AIDS. New Zealand Medical Journal 106: 76–8.
CDC. 2008. Chronic Disease Overview. Centers for Disease Control and Prevention. URL: http: //www.cdc.gov/nccdphp/overview.htm
Cohen JW, Krauss NA. 2003. Spending and service use among people with the 15 most costly medical conditions, 1997. Health Affairs 22(2): 129–38.
Cooper GJS, Scott DJ. 1985. The cost of diabetes in south Auckland. New Zealand Medical Journal 98(773): 113.
DeVol R, Bedroussian A. 2007. An Unhealthy America: The economic burden of chronic disease. Charting a new course to save lives and increase productivity and economic growth. Santa Monica: Milken Institute.
Diabetes New Zealand, PricewaterhouseCoopers. 2001. Type 2 Diabetes: Managing for Better Health Outcomes. Wellington: Diabetes New Zealand.
Diabetes New Zealand, PricewaterhouseCoopers. 2007. Type 2 Diabetes: Outcomes model update. Wellington: Diabetes New Zealand.
Diabetes New Zealand, PricewaterhouseCoopers. 2008. Type 2 Diabetes: Outcomes model update. Wellington: Diabetes New Zealand.
Report on New Zealand Cost-of-Illness Studies on Long-Term Conditions 27

Drummond MF, Sculpher MJ, Torrance GW, et al. 2005. Methods for the Economic Evaluation of Health Care Programmes (3rd ed). Oxford: Oxford University Press.
Druss BG, Marcus SC, Olfson M, et al. 2001. Comparing the national economic burden of five chronic conditions. Health Affairs 20(6): 233–41.
Druss BG, Marcus SC, Olfson M, et al. 2002. The most expensive medical conditions in America. Health Affairs 21(4): 105–11.
Easton B. 1997. The Social Costs of Tobacco Use and Alcohol Misuse. Wellington: Wellington School of Medicine, Alcohol Advisory Council of New Zealand and Public Health Commission.
Gray AJ, Reinken JA, Laugesen M. 1988. The cost of cigarette smoking in New Zealand. New Zealand Medical Journal 101: 270–3.
Hoffman C, Rice D, Sung H-Y. 1996. Persons with chronic conditions: their prevalence and costs. Journal of American Medical Association 276(18): 1473–9.
Holt S, Beasley R. 2001. The Burden of Asthma in New Zealand. Wellington: Asthma and Respiratory Foundation of New Zealand.
Jefferson T, Demicheli V, Mugford M. 2000. Elementary Economic Evaluation in Health Care (2nd ed). London: BMJ Books.
John Hopkins University. 2002. Chronic Conditions: Making the Case for Ongoing Care. Baltimore: Robert Wood Johnson Foundation.
Kortt MA, Langley PC, Cox ER. 1998. A review of cost-of-illness studies on obesity. Clinical Therapeutics 20(4): 772-9.
Lane A. 1996. Direct costs of osteoporosis for New Zealand women. Pharmacoeconomics 9(3): 231–45.
Mathers CD, Vos ET, Stevenson CE, et al. 2001. The burden of disease and injury in Australia. Bulletin of the World Health Organization 79(11): 1076–84.
McDermott J, Williamson E, Wallace E, et al. 1991. Hospital outpatient costs for patients with HIV infection. New Zealand Medical Journal 104(905): 477–9.
Ministry of Health. 1999. Our Health, Our Future: Hauora Pakari, Koiora Roa: The health of New Zealanders 1999. Wellington: Ministry of Health.
Ministry of Health. 2001. The Burden of Disease and Injury in New Zealand. Wellington: Ministry of Health.
Ministry of Health. 2004. Looking Upstream: Causes of death cross-classified by risk and condition New Zealand 1997. Wellington: Ministry of Health.
Ministry of Health. 2008a. Long-Term Conditions. URL: http: //www.moh.govt.nz/longtermconditions
Ministry of Health. 2008b. A Portrait of Health. Key Results of the 2006/07 New Zealand Health Survey. Wellington: Ministry of Health.
Ministry of Health, Otago University. 2006. Decades of Disparity III: Ethnic and socioeconomic inequalities in mortality, New Zealand 1981–1999. Wellington: Ministry of Health.
Ministry of Health, University of Auckland. 2003. Nutrition and the Burden of Disease: New Zealand 1997–2011. Wellington: Ministry of Health.
28 Report on New Zealand Cost-of-Illness Studies on Long-Term Conditions

Ministry of Transport. 2008. The Social Cost of Road Crashes and Injuries: June 2008 update. Wellington: Ministry of Transport.
Mitchell E. 1989. Asthma costs. New Zealand Medical Journal 102(865): 171–2.
National Health Committee. 2007. Meeting the Needs of People with Chronic Conditions: Hāpai te Whānau mo Ake Ake Tonu. Wellington: National Advisory Committee on Health and Disability.
New Zealand Government. 2007. Government Response to the Inquiry into Obesity and Type 2 Diabetes 2007. Wellington: New Zealand Government. URL: http://www.obesityaction.org.nz/docs/GovernmentResponsetotheInquiryintoObesityandType2Diabetes.pdf
O’Dea D. 2007. Tobacco Taxation in New Zealand. Wellington: Smokefree Coalition and ASH New Zealand.
Oxford Health Alliance. 2006. Chronic Disease: An economic perspective. London: Oxford Health Alliance.
Phillips D, Kawachi I, Tilyard M. 1992. The costs of smoking revisited. New Zealand Medical Journal 105: 240–2.
Rice D. 1994. Cost-of-illness studies: fact or fiction? The Lancet 344: 1519–20.
Russell R, Berkeley M, Fraser G, et al. 1993. The Cost of Inactivity. Dunedin: University of Otago.
Scott HM, Scott WG, Mihaere K, et al. 2007. Economic evaluation of the treatment of obstructive sleep apnoea syndrome in Aotearoa/New Zealand. International Review of Business Research Papers 3(2): 237–61.
Scott WG, Scott HM. 1994. Ischaemic stroke in New Zealand: an economic study. New Zealand Medical Journal 107(989): 443–6.
Scott WG, White HD, Scott HM. 1993. Cost of coronary heart disease in New Zealand. New Zealand Medical Journal 106(962): 347–9.
Simmons D. 1996. Diabetes and its complications in New Zealand: an epidemiological perspective. New Zealand Medical Journal 109(1025): 245–7.
Simmons D, Peng A, Cecil A, et al. 1999. The personal costs of diabetes: a significant barrier to care in South Auckland. New Zealand Medical Journal 112(1097): 383–5.
Strassels S, Smith D, Sullivan S, et al. 2001. The costs of treating COPD in the United States. Chest 119(2): 344–52.
Swinburn B, Ashton T, Gillespie J, et al. 1997. Health care costs of obesity in New Zealand. International Journal of Obesity 21(10): 891–6.
Wanless D. 2004. Securing Good Health for the Whole Population. London: HM Treasury.
WHO. 2000. Obesity: Preventing and managing the global epidemic: Report of a WHO consultation. Technical Report Series 894. Geneva: World Health Organization.
WHO. 2003. Diet, Nutrition and the Prevention of Chronic Diseases: Report of a joint WHO/FAO expert consultation. Technical Report Series 916. Geneva: World Health Organization.
Report on New Zealand Cost-of-Illness Studies on Long-Term Conditions 29

30 Report on New Zealand Cost-of-Illness Studies on Long-Term Conditions
WHO. 2005. Preventing Chronic Disease: A vital assessment. Geneva: World Health Organization.
WHO. 2008. The Global Burden of Disease 2004 Update. Geneva: World Health Organization.