report on initial assessment of relevant recycling ... technologies catalouge 2.1... · report on...
TRANSCRIPT
Plastic ZERO - Public Private Cooperations for Avoiding Plastic as a Waste
1 City of Copenhagen | City of Malmö | City of Hamburg | SIA Liepajas RAS
I/S Amager Ressourcecenter| Tampere Regional Solid Waste Management Ltd. | Aalborg University LIFE10 ENV/DK/098 - with the contribution of the LIFE financial instrument of the European Union
Report on initial assessment of relevant recycling technologies
September 2013
Prepared by COWI A/S
Trine Lund Neidel and Jens Bjørn Jakobsen
2
CONTENTS
Contents ........................................................................................................................................ 2
1. Introduction ...................................................................................................................... 3
2. The value chain for plastic waste ..................................................................................... 3
3. Collection ......................................................................................................................... 4
4. Sorting and separation technologies ................................................................................. 5
Size separation ................................................................................................................. 6
Separation according to gravity/density ........................................................................... 8
Magnetic and eddy current separation ........................................................................... 11
Optic sensor separation .................................................................................................. 13
Manual sorting/quality control ....................................................................................... 15
Rejects from sorting plants ............................................................................................. 17
5. Reprocessing .................................................................................................................. 17
6. Product manufacturing ................................................................................................... 18
Barriers for application .................................................................................................. 19
7. Examples ........................................................................................................................ 20
Central sorting facility Graz ........................................................................................... 20
PET reprocessing plant Wöllersdorf, Austria ................................................................ 23
Kruschitz PET reprocessing at Völkermarkt .................................................................. 24
Swerec AB ..................................................................................................................... 25
8. Costs and revenues in plastics recycling ........................................................................ 25
Plastic waste streams and collection systems ................................................................. 25
Costs for fine sorting ...................................................................................................... 26
Value of secondary plastics ............................................................................................ 26
Cost example (plastic from households) ........................................................................ 27 Variant 1 – recycling of mixed source separated plastics from households. ............... 27
Variant 2 - recycling of mixed source separated plastics together with other recyclable
materials (paper, cardboard, metal and glass) from households. ................................. 28
Collection and transport .............................................................................................. 28
Fine sorting and transport to recycling industry .......................................................... 28
Total costs for collection, transport and sorting .......................................................... 29
9. Environmental issues ..................................................................................................... 30
10. Overview ........................................................................................................................ 31
11. References ...................................................................................................................... 33
Quality Assurance by COWI A/S, Parallelvej 2, DK-2800 Lyngby
PREPARED TLHA, JBJ
CHECKED JBJ
APPROVED TLHA
3
1. INTRODUCTION This report is a part of the external assistance on the EU LIFE+ project Plastic Zero, Public
Private Cooperations for avoiding plastics as waste, LIFE10 ENV/DK/000098. The report
describes the most commonly used sorting technologies and application options for recycled
plastic under present market conditions in Europe. The connection between input material
(bottles, source separated, residual waste), technology choice, quality of the secondary plastic
material and the application options of the material are described and to a certain extent
quantified.
Other relevant issues, such as barriers for application, costs and revenues as well as
environmental issues are briefly touched upon.
2. THE VALUE CHAIN FOR PLASTIC WASTE From a systematic point of view the plastic recycling value chain can be divided into
thefollowing overall operations: Collection, Sorting/separation, reprocessing (secondary raw
material production) and product manufacturing1.
The different steps of the chain affect each other. The characteristics (composition, type and
quality) of the collected plastic will affect the choice of sorting technology, which again affect
the quality of the output and what applications the secondary plastic can be used for.
The collected waste may be either pre-consumer waste (scrap from manufacturing of products)
or post-consumer waste (waste arising after the use of plastic products at the consumer market).
The further steps in processing of the waste will depend largely on the origin and composition
of the waste. Often pre- consumer waste will have been subject to a monomaterial collection
and it will have low levels of impurities while post-consumer waste usually needs more
intensive treatment.
Due to the high quality of the pre-consumer plastic waste it is often economically feasible to
recycle these waste streams and this is often already done either internally in the production
facility or through external channels.
The main focus of this catalogue is therefore on post-consumer plastic waste.
1 Plastic reprocessing can take place either through mechanical or chemical/feedstock recycling.
In this report the focus will be on mechanical recycling.

4
Figure 1: The plastic recycling value chain (modified from JRC 2011 p. 38)
3. COLLECTION The collection systems are specifically dealt with in details in other parts of the Plastic Zero
project. Here, an overall description of the collection system is only used to give an impression
of the quality and nature of the collected materials.
PlasticsEurope assessed that approximately 25.1 million tonnes post-consumer plastic ended in
the waste stream in Europe in 2011. Of this, approximately 25 % was recycled, 35 %
incinerated (with energy recovery) and 40 % disposed at landfills (PlasticEurope, 2012).
Systems that include collection of post-comsumer plastic waste can be roughly devided into
three overall categories:
› Monomaterial collection: The waste collection is designed in order to obtain only one
source separated material fraction such as plastics. The waste collection can include several
plastic types together or targeting specific plastic types (e.g. PET bottles, or rigid plastic
such as pots, tubs and trays).
› Multimaterial collection (co-mingled collection): The collection is designed to collect
several types of source separated recycable materials such as metals, glass and plastics (dry
recyclables).
5
› Mixed MSW collection: The waste origining from this type of collection is often very
contaminated and needs intensive further treatment (JRC 2011, p. 39). This stream may
include the organic waste.
The monomaterial collection of plastic can be designed very differently. The collection systems
can be designed for only one or few polymers (e.g. PET bottles), for plastic types (e.g. rigid or
flexible plastic) or plastic in general.
The more plastic types included in the collection scheeme, the larger volumes will be collected
for potential recycling. However, a broad collection of a large variety of plastic types also
requires a more thougroug fine sorting afterwards resulting in a larger proportion of rejected
material and in some cases a lower quality of the output fraction (secondary plastic).
Collection of dry recyclable materials as co-mingled materials provides a relatively cheap
collection of a range of materials, but add some extra sorting steps to the subsequent fine sorting
of the waste stream before actual production of secondary raw materials.
The residual waste stream can also be sorted resulting in recovery of an additional amount of
recyclable materials. The best results from this sorting will be obtained if the waste stream is
dry (i.e. organic waste is collected separately).
4. SORTING AND SEPARATION TECHNOLOGIES2 Sorting and separation of the collected plastic have the overall purpose to enable high quality
recycling, preferably of single polymers. The sorting and separation technologies are aiming at:
› Reducing the quantity of non-targeted plastic polymers
› Reducing the quantity of non-plastics as
› Other recyclables such as metals or glass
› Oil, soil or other contaminants
› Additives within the plastic matrix
Based on the experience from Christensen & Fruergaard (2011), JRC (2011) and COWI, some
of the most common sorting operations are described below. Many of the technologies will
typically be applied in a certain combination depending on the input material and the quality
requirement for the output material. Examples of specific plants with their combination of
technologies are described in Section 7.
The output from the sorting plants can be single polymer or different mixes of polymer types
(single colours or mixed colours).
Below is presented a brief description of major types of separation technologies/equipment
covering
2 The Austrian Consulting Company IUT (Innovative Umwelttechnik) has provided relevant
information on technologies for this chapter.

6
› Size separation
› Gravity/density separation
› Metal separation
› Optical/sensor separation
› Manual separation/quality control
Most European sorting plants consist of a mix of the above mentioned technologies to ensure an
economical and efficient sorting of the input material with satisfying output quality. The exact
composition of the specific plant should be adjusted according to input material as well as
required output quality. The figure below shows a possible composition of a sorting plant
receiving plastic waste, either from monomaterial collection, co-mingled collection or as dry
residual waste.
Section 7 contains some European examples of sorting plants for plastic waste streams.
Figure 2 Generic composition of an advanced sorting plant for either monomaterial collected plastic,
co-mingled materials (e.g. packaging) or dry residual waste.
Size separation Size separation equipment is splitting the incoming waste/recyclable materials according to size
of the individual piece of waste/material. Typical types of equipment for this are:
› Drum screen
› Vibrating screen
› Other screens
Below is shown a drum screen and a vibrating screen.

7
Figure 3 Drum screen
Figure 4 Vibrating screen

8
Input materials for size separation equipment often is mixed municipal waste but can also be co-
mingled recyclable packaging waste. The size separation equipment normally constitutes the
first primary sorting after shredding or bag opening. Shredding is not always necessary.
Typically the screen splits up the incoming waste in three fractions:
› Undersize: < 50 mm
› Middle size: 50/300 mm
› Oversize: > 300 mm
Plastics will normally appear in the middle size and oversize fractions. Middle sized 2D3 and
3D4 normally will be further sorted in a ballistic separator and maybe also an air classifier. The
oversize fraction normally continues into a manual sorting cabin for handpicking of the large
2D plastic films.
Size separation equipment is widely used in sorting facilities to enhance the performance of
subsequent equipment installed at the facility.
Separation according to gravity/density Separation of different plastic materials and removal of impurities can be performed by
gravity/density sorting with a range of different technologies, which are described in the
following.
Float sink method: Density sorting with a fluid medium. Different plastic materials can be
separated from each other resulting in a purity of up to 98 % for mixed plastics. This technology
can also be used to separate plastic from heavier materials.
Hydrocyclones: Density sorting based on the centripetal force to fluid resistance. The waste
will be fed into the hydrocyclone in a suspension. Lighter fractions will be transported upwards,
while more dense particles will end in the bottom of the cyclone. Size reduction is usually done
before treatment in hydrocyclones.
3 2-dimentional plastic, mainly foils, plastic bags etc.
4 3-dimentional plastic, such as pots, tubs and trays.

9
Figure 5 Hydrocyclone. An inner vortex carries the lighter fractions upwards, while an outer vortex
carries the heavy fraction downwards.
Air classifier: Separate according to materials’ falling velocity" in an air stream. The function
is to separate in light and heavy parts. Different types of air classifiers are available. The figure
below illustrates the type of air classifier typically used for waste sorting plants.
Figure 6 Typical air classifier.
The air classifier is especially well suited for separation of 2D plastics from more heavy
materials (3D plastics and other materials/impurities).
Ballistic separator: Automatic sorting according to size, density and rigidness. The sorting
results in three fractions;
› Light fraction (light and flat parts)
› Heavy fraction (heavy and cubical parts)
› Fine fraction (e.g. less 20 mm)

10
Figure 7 Ballistic separator
A ballistic separator is in principle a vibrating perforated deck. A small incline in the deck
causes heavy materials to fall to the lower level of the deck while lighter materials such as
plastic foils are transported upwards. Fine materials fall through the perforated bottom.
Input materials for gravity/density separation often are the middle fraction from size separation
equipment. Considering plastic separation this separation equipment is applied to separate the
2D and the 3D plastic materials as well as to separate major none plastic materials. In the
ballistic separator 2D plastic will appear in the light fraction (together with other light none
cubic paper and cardboard and textiles). This light fraction will need one or two more sorting
steps to separate plastic from paper/cardboard. This might be an air classifier.
The 3D plastic materials will appear in the heavy/cube fraction together with other heavy/cube
materials (wood, leather, glass, metals). This heavy fraction will need one or two more sorting
steps to sort out the plastic. This might e.g. be metal sorting equipment.
Via change of inclination of the separation component, the performance of the separator can be
adjusted.
11
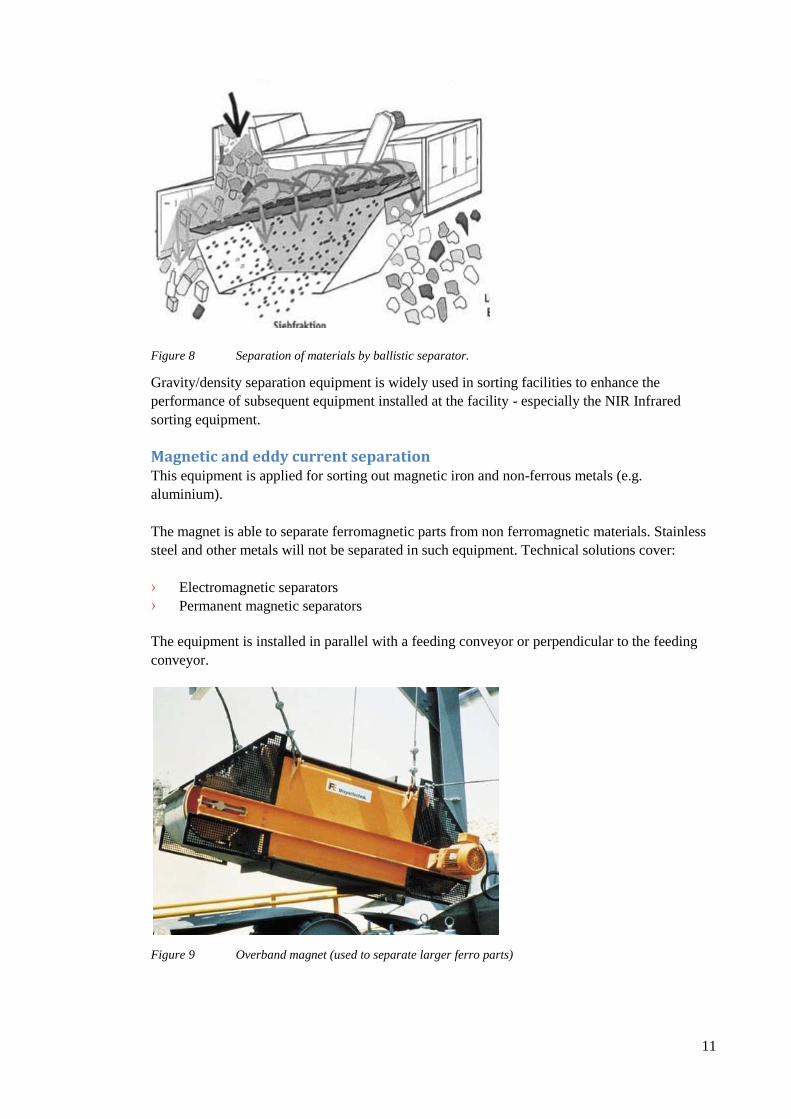
Figure 8 Separation of materials by ballistic separator.
Gravity/density separation equipment is widely used in sorting facilities to enhance the
performance of subsequent equipment installed at the facility - especially the NIR Infrared
sorting equipment.
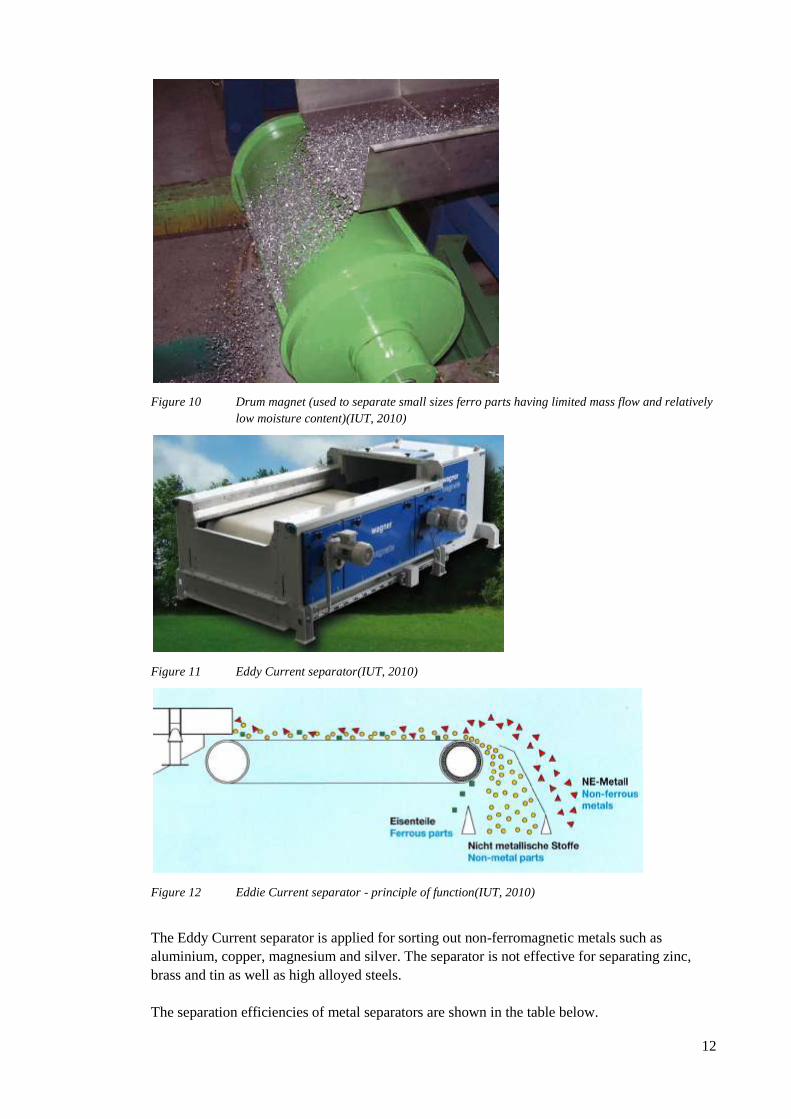
Magnetic and eddy current separation This equipment is applied for sorting out magnetic iron and non-ferrous metals (e.g.
aluminium).
The magnet is able to separate ferromagnetic parts from non ferromagnetic materials. Stainless
steel and other metals will not be separated in such equipment. Technical solutions cover:
› Electromagnetic separators
› Permanent magnetic separators
The equipment is installed in parallel with a feeding conveyor or perpendicular to the feeding
conveyor.
Figure 9 Overband magnet (used to separate larger ferro parts)
12
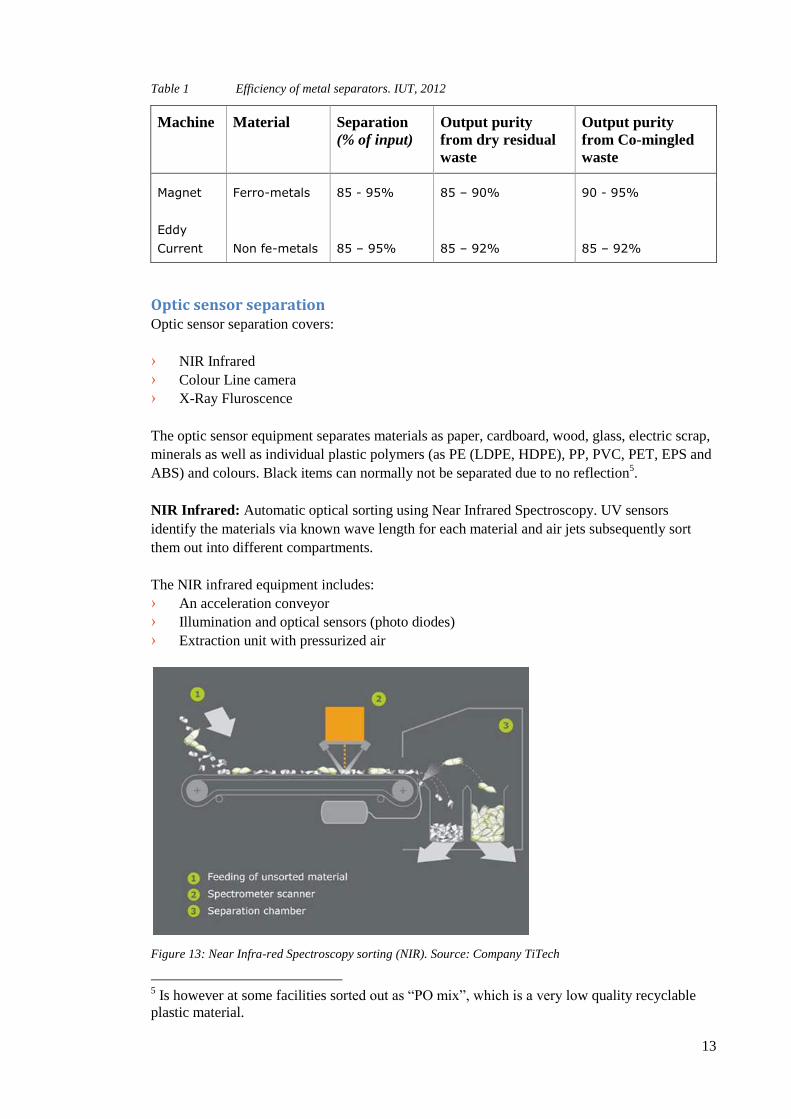
Figure 10 Drum magnet (used to separate small sizes ferro parts having limited mass flow and relatively
low moisture content)(IUT, 2010)
Figure 11 Eddy Current separator(IUT, 2010)
Figure 12 Eddie Current separator - principle of function(IUT, 2010)
The Eddy Current separator is applied for sorting out non-ferromagnetic metals such as
aluminium, copper, magnesium and silver. The separator is not effective for separating zinc,
brass and tin as well as high alloyed steels.
The separation efficiencies of metal separators are shown in the table below.
13
Table 1 Efficiency of metal separators. IUT, 2012
Machine Material Separation
(% of input)
Output purity
from dry residual
waste
Output purity
from Co-mingled
waste
Magnet
Eddy
Current
Ferro-metals
Non fe-metals
85 - 95%
85 – 95%
85 – 90%
85 – 92%
90 - 95%
85 – 92%
Optic sensor separation Optic sensor separation covers:
› NIR Infrared
› Colour Line camera
› X-Ray Fluroscence
The optic sensor equipment separates materials as paper, cardboard, wood, glass, electric scrap,
minerals as well as individual plastic polymers (as PE (LDPE, HDPE), PP, PVC, PET, EPS and
ABS) and colours. Black items can normally not be separated due to no reflection5.
NIR Infrared: Automatic optical sorting using Near Infrared Spectroscopy. UV sensors
identify the materials via known wave length for each material and air jets subsequently sort
them out into different compartments.
The NIR infrared equipment includes:
› An acceleration conveyor
› Illumination and optical sensors (photo diodes)
› Extraction unit with pressurized air
Figure 13: Near Infra-red Spectroscopy sorting (NIR). Source: Company TiTech
5 Is however at some facilities sorted out as “PO mix”, which is a very low quality recyclable
plastic material.

14
Figure 14 RedWawe NIR infrared sorter
The NIR Infrared separator is typically applied for separation of
Mixed plastics by polymer type (except those coloured with carbon black)
Wood and textiles
Paper, cardboard and packaging
PVC in RDF
The plastic and paper separation efficiency of NIR Infrared separators are shown in the Table 2.
Table 2 Efficiency of NIR separators for separation from input stream and purity of output stream
(depending on input). Source: IUT, 2012.
Machine Material Separation
(% of input)
Output purity from
dry residual waste
Output purity form
Co-mingled waste
NIR
NIR
NIR
3D plastic
2D plastic
Paper
80 - 90%
85 - 92%
70 - 90%
80 - 90%
80 - 90%
75 - 90%
85 - 92%
85 - 92%
85 - 92%
Typically, each run of NIR sorting can sort for two parameters (output fractions). Sorting into
more than 3 streams thus requires more runs or more NIR scanners.
Colour Line Camera:
Automatic optical sorting using camera units to identify the colour of materials(in the visible
spectrum) via photo recognition. Air jets subsequently sort them out into different
compartments.
The Colour Line camera equipment includes:

15
› A vibration feeder
› A camera unit
› A light source
› A reject unit with pressurized air
The Colour Line Camera is normally applied for separation of
› Different colours of plastic items (e.g. bottles, film)
› Electronic scrap
› Glass
› Minerals
The Clour Line Camera is also able to
Separate magazines from waste paper
Determine lead content in glass
Separate bottle caps (3D camera)
Separation of black plastic can be made via colour line camera.
The colour line camera is at present not widely used when sorting mixed waste from
households. As can be observed, the Colour Line Camera however has a wide range of
applications. Most of these do not concern plastics sorting and other conventional materials in
the household waste stream. Since the costs of this technology does not differ from the NIR
technology it is expected that this application will increase in the future to improve the
separation efficiency as well as the quality of separated materials.
X-Ray Fluorescence separation (XRF):
Automatic sensor based sorting using X-ray photons to impact a targeted material and detect
electrons movements and subsequent emission of X-rays. Via XRF spectra different materials
can be recognised.
The X-Ray Fluorescence separation is applied for separation of
› Different non-ferrous (copper, brass, stainless steel, aluminium, zinc)
› Electronic scrap (printed circuit boards)
› Minerals
The X-Ray Fluorescence separation is at present not widely used when sorting mixed waste
from households as this technology is not able to destinguish between polymers. The use is
however expected to increase in future in some areas (separating valuable metals from ash and
slag and separation precious metals from e.g. electronic scrap), but not for separating plastic
waste.
Manual sorting/quality control Manual sorting and quality control is used for different applications. Typical applications are:
› Separating large items as 2D plastic films from other plastics/mixed recyclables. Is applied
either as one of the first operations in a central sorting plant or when separating at oversize
fraction after drum screen. Positive sorting.
› As negative sorting, removing non-targeted materials from mono-origin waste streams.
Non targeted materials can be impurities or non certified types of packaging waste
materials (in producer responsibility systems). This action can also be called quality control
of output materials for the purpose of achieving sufficient purity.
16
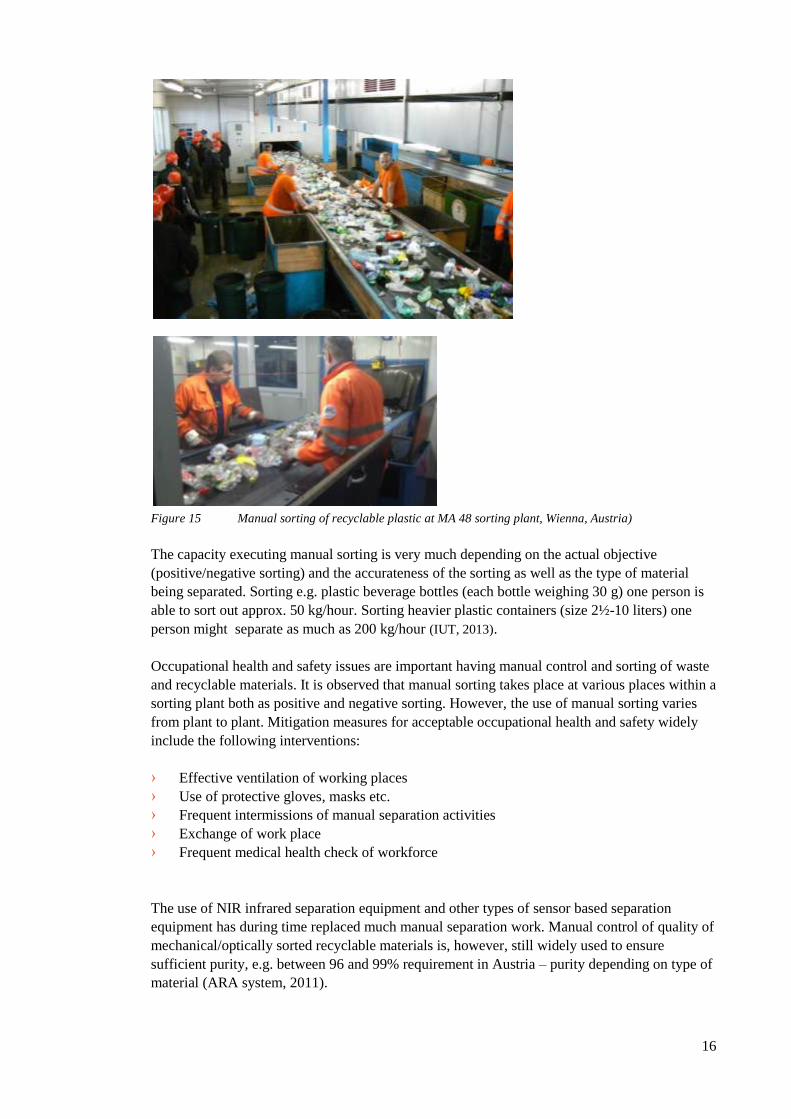
Figure 15 Manual sorting of recyclable plastic at MA 48 sorting plant, Wienna, Austria)
The capacity executing manual sorting is very much depending on the actual objective
(positive/negative sorting) and the accurateness of the sorting as well as the type of material
being separated. Sorting e.g. plastic beverage bottles (each bottle weighing 30 g) one person is
able to sort out approx. 50 kg/hour. Sorting heavier plastic containers (size 2½-10 liters) one
person might separate as much as 200 kg/hour (IUT, 2013).
Occupational health and safety issues are important having manual control and sorting of waste
and recyclable materials. It is observed that manual sorting takes place at various places within a
sorting plant both as positive and negative sorting. However, the use of manual sorting varies
from plant to plant. Mitigation measures for acceptable occupational health and safety widely
include the following interventions:
› Effective ventilation of working places
› Use of protective gloves, masks etc.
› Frequent intermissions of manual separation activities
› Exchange of work place
› Frequent medical health check of workforce
The use of NIR infrared separation equipment and other types of sensor based separation
equipment has during time replaced much manual separation work. Manual control of quality of
mechanical/optically sorted recyclable materials is, however, still widely used to ensure
sufficient purity, e.g. between 96 and 99% requirement in Austria – purity depending on type of
material (ARA system, 2011).
17
Rejects from sorting plants The amount and quality of rejects from sorting plants equiped with highly advanced automised
sorting equipment depends among others on:
Quality of input
Criteria for outputs
Technical concept for the sorting plant
Market for outputs (recyclable materials and other fractions)
Only few information are available on amount and quality of rejects – and such information
have to be seen in the local context.
In Austria the sorting facilities separate only/primarily packaging waste materials certified by
the ARA system, Non-certified but recyclable plastics and other materials will not be recycled
but instead incinerated or landfilled. In one Austrian sorting plant as much as 60% of the input
is not recycled. This fraction is instead incinerated.
The situation is different in Germany where the actual recycling of valuable materials is more
dependent on the market situation. One sorting plant in Northern Germany generates an amount
of reject of 5-15% - the high value in case of poor market for difficult recyclable materials.
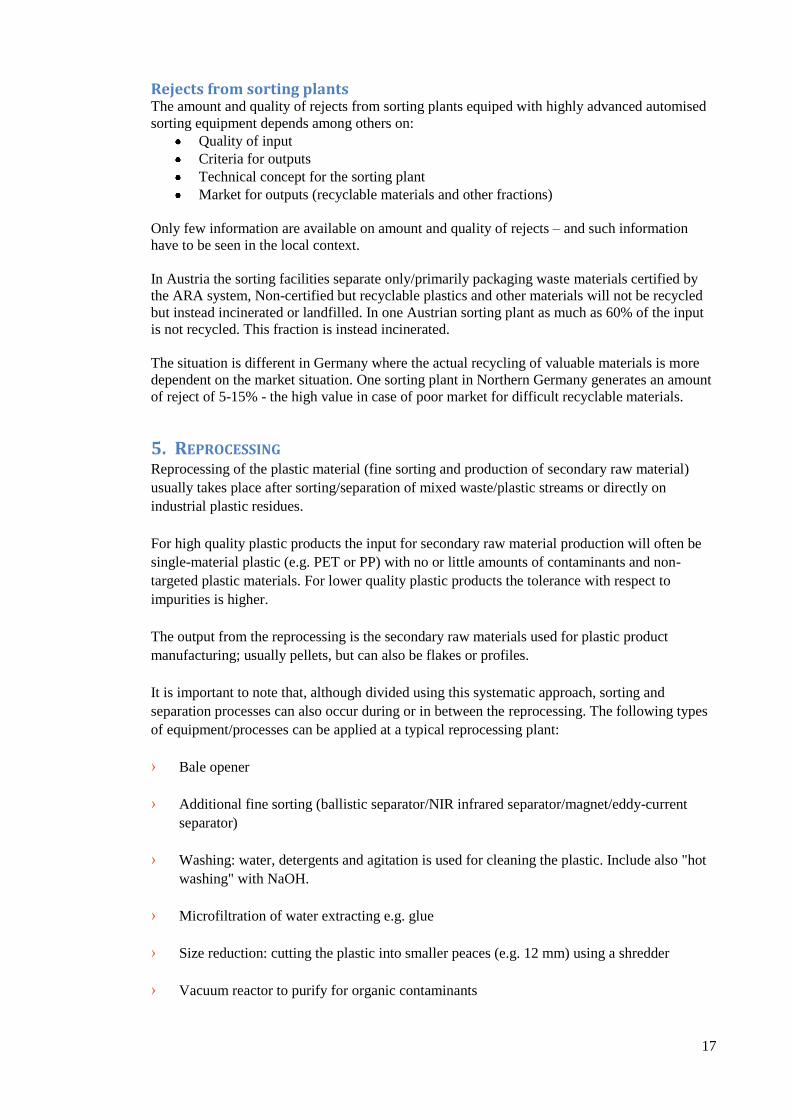
5. REPROCESSING Reprocessing of the plastic material (fine sorting and production of secondary raw material)
usually takes place after sorting/separation of mixed waste/plastic streams or directly on
industrial plastic residues.
For high quality plastic products the input for secondary raw material production will often be
single-material plastic (e.g. PET or PP) with no or little amounts of contaminants and non-
targeted plastic materials. For lower quality plastic products the tolerance with respect to
impurities is higher.
The output from the reprocessing is the secondary raw materials used for plastic product
manufacturing; usually pellets, but can also be flakes or profiles.
It is important to note that, although divided using this systematic approach, sorting and
separation processes can also occur during or in between the reprocessing. The following types
of equipment/processes can be applied at a typical reprocessing plant:
› Bale opener
› Additional fine sorting (ballistic separator/NIR infrared separator/magnet/eddy-current
separator)
› Washing: water, detergents and agitation is used for cleaning the plastic. Include also "hot
washing" with NaOH.
› Microfiltration of water extracting e.g. glue
› Size reduction: cutting the plastic into smaller peaces (e.g. 12 mm) using a shredder
› Vacuum reactor to purify for organic contaminants

18
› Extrusion: In an extruder the waste is melted and pressed through a cone, which will
produce long strings of plastic
› Screening: After or during extrusion processes the plastic might pass through a screen in
order to remove any solid impurity
› Pelletizing: A rotating knife cuts the strings into pellets that often are cooled in water
(Christensen & Fruergaard 2011).
Purity of 99.9% is recorded having a maximum of contaminants at a level of 100-200 ppm.
Figure 16: Plastic Pellets, a secondary raw material. Source: www.reeds-carpets.co.uk
6. PRODUCT MANUFACTURING Plastic products can be manufactured using as an input virgin material made from crude oil or
secondary raw materials recovered from plastic waste. The input is typically in the form of
pellets, flakes or profiles depending on the type of product produced (see also figure 1 or JRC
2011 p. 38).
The use of secondary raw materials often substitutes the production of virgin plastic materials.
However, in some cases (often low quality plastic products) other materials, e.g. wood, are
replaced. This issue is important when assessing the environmental benefits from recycling of
plastic.
The product manufacturing generally involves shaping the plastic intermediates through
extrusion, moulding or blowing (JRC 2011).
Plastic from households will typically generate secondary raw materials of different qualities.
High qualities from positive sorting (NIR) could be PP, HDPE, PET and PS pellets for high
quality plastic products. However, very often, there will be an additional residual plastic waste
fraction of mixed plastic, which can either be used for energy purpose or for production of low
quality products. Table 3 shows examples of products manufactured from household plastic
collected in Germany.
19
Table 3 Examples of products manufactured from household plastic. Source: Alba, 2011.
Plastic polymer (secondary raw material)
Product type
PP Household articles: Bins, Buckets, boxes, crates, cradles
Automobile parts Industrial: Storage solutions, transportation tools.
HDPE Construction: Pipes, tubers, sheets, thick films, profiles
Cable protection
PS Household articles: Coat hangers, transport boxes Construction
PET Fibres: Clothing, textiles, fabrics, car components
Packaging: Bottles, films
LDPE Films, buckets
Recycled mixed plastic Palisades, profiles, pallets, poles
Different products require different qualities of plastic with respect to purity (polymer and
impurities) and stable composition. As shown in Table 3 e.g. PET can be used for textile
production as well as production of bottles, films etc. Bottles are often produced from recycled
plastic in a closed bottle to bottle system, since it requires high quality plastic and must fulfil
requirements for food packaging. Production of fleece jackets and similar can tolerate more
impurities and can thus be produced from PET from more mixed plastic waste streams.
The typical trend is that high quality products substitute virgin plastic, while low quality
products increasingly substitutes plastic as well as other materials. For palisades profiles, park
benches etc. the substituted material will often be wood.
Barriers for application One of the major obstacles for using recycled plastic in high quality products is stability. For a
plastic producer, it is very important to have the exact same raw material every time, since the
production is very sensitive to even small deviations in e.g. melting point of the raw material.
Deviations in the melting point of the raw material can affect the functionality, strength or
durability of the product, which is not acceptable for some applications, such as e.g. medical
equipment or automobile parts (affecting safety). The use of secondary plastic for these products
is therefore very limited. For less sensitive products a very common way to limit this problem is
to "dilute" the secondary plastic with virgin plastic, where the composition in stable and fully
documented.
The possible presence of hazardous substances in mixed plastic streams also limits the
applications of recycled plastic in products such as medical equipment, toys, food packaging
(see below) and baby equipment (e.g. nursing bottles).
Impurities, such as organic waste, bacteria etc. constitute mainly a hygienic problem during the
collection, storage and sorting and separation of the plastic waste. However, these impurities are
seldom affecting the quality of the end product (secondary plastic).
The plastic consumption for production of food packaging is huge and use of recycled plastic
for this purpose is therefore attractive. However, a range of requirements from the European
food safety (EFSA) legislation must be fulfilled, which may prevent the use of non-food
packaging in the production. This is a barrier for using recycled plastic from mixed plastic
streams, since no technologies available today can generally separate food packaging from non-
food packaging. Only positive sorting of e.g. easily recognisable items, such as milk or PET
bottles (or similar), can be separated from a mixed plastic stream by NIR separation. The use of
recycled plastic or food packaging is therefore currently limited to single products (e.g. bottles
recognised by NIR) or separately collected materials (e.g. bottle to bottle collection of PET
bottles). A future development of sensor based recognition techniques might reduce such a

20
problem and thereby increase the proportion of secondary plastic involved in production of food
packaging. The DEXRT (Dual Energy X-Ray Transmission) and the LIBS (Laser Induced
Brakdown Spectroscopy) technologies are examples on such enabling separation of e.g. heavy
metal contaminants. This development however is not observed being effectuated at the time
being due to high costs connected to some of these technologies (Source: Ciprian Cimpan,
Syddansk Universitet).
The colour of the secondary raw material can exclude some uses. Recycled plastic often have
grey, green or similar colours, which makes is suitable for production of strongly coloured
materials, but not clear products. Production of entirely clear products requires a very clean
stream of clear plastic only.
For plastic products of lower quality a higher degree of impurities and varying composition can
be accepted without compromising the function of the product.
7. EXAMPLES This section describes European examples of sorting plants treating, among other materials,
recyclable plastic.
Central sorting facility Graz As part of the Austrian take back system is established a central sorting facility in Graz. The
Austrian waste contractor Saubermacher is contracted to receive packaging waste from the Graz
region and separate certified packaging waste materials.
The input to the plant is separated into recyclable plastics, paper/cardboard and a RDF fraction.
Individual output fractions (and quality criteria) are shown below:
Mixed paper
Cardboard
HDPE bottles - 95% purity
PET bottles (white) - 98% purity
PET bottles (light blue) - 98% purity
PET bottles (green) - 98% purity
LDPE film (white) - 95% purity
RDF fraction (impurities, non certified packaging waste materials)
The size if the RDF fraction/rejected fraction will depend on several parameters, such as
technology, input material and system. The technology has a certain capability to separate
certain items from a stream as shown in Table 2. This means that a certain percentage of
specific items in the stream will be separated. The resulting reject fraction will depend on the
quality of the input material. The more impurities and non-targeted items, the larger the rejected
fraction will be. The system will also influence the size of the rejected fraction. In the Austrian
system only certified packaging must be included and all other materials are therefore discarded,
event if it is suitable for recycling. This increases the size of the rejected fraction due to a
system issue and not a technical issue.
The plant is equipped with the following components:
Reception at floor
Sorting drum screen (50/300 mm)
Overbandsmagnet

21
Air classifier
Ballistic separator
NIR Infrared separator
Manuel quality control/finesorting
Balepress
The plant capacity is 6,6 - 7,5 tonne/hour making approx. 11.000 tonnes/year per shift.
Information (and photos) on the Graz sorting plant is obtained via visit at the facility February
2011.
Figure 17 Images from the Graz sorting facility (I)

22
Figure 18 Photos from the Graz sorting facility (II)
Figure 19 Photos from the Graz sorting facility (III)

23
Figure 20 Photos from the Graz sorting facility (IV)
Figure 21 Photos from the Graz sorting facility (V)
PET reprocessing plant Wöllersdorf, Austria This plant produces secondary PET raw materials.
Figure 22 PET reprocessing plant at Wöllersdorf
24
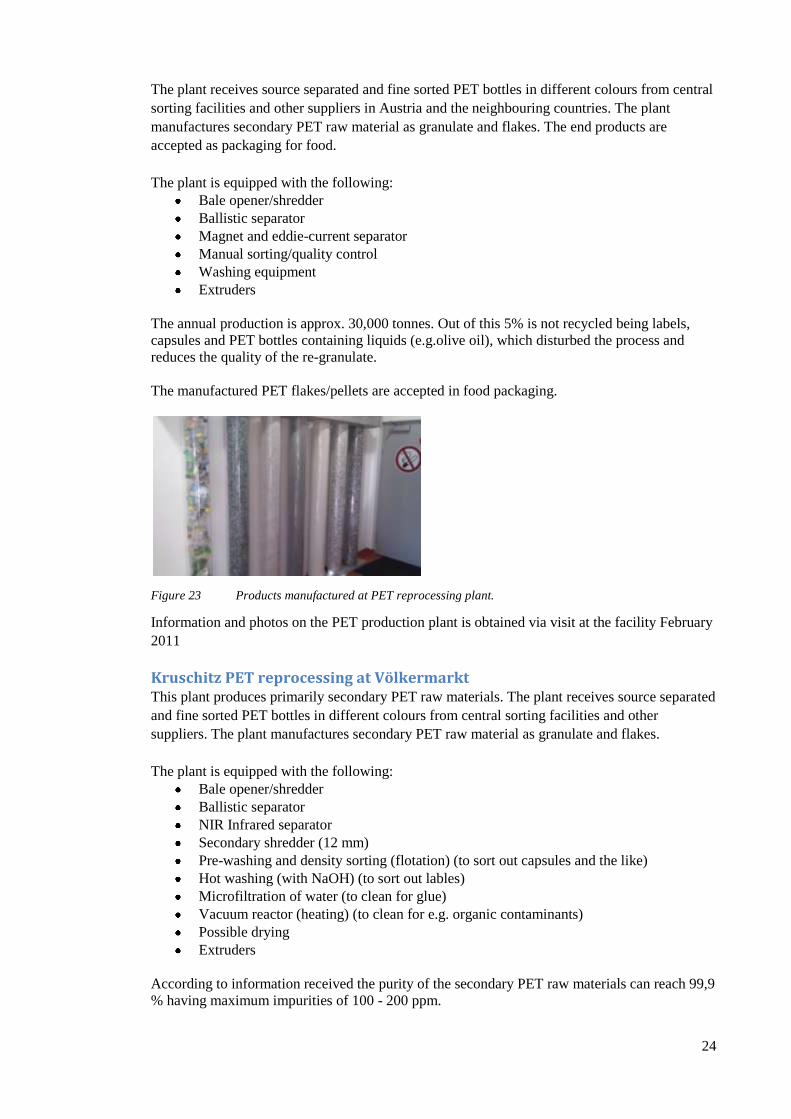
The plant receives source separated and fine sorted PET bottles in different colours from central
sorting facilities and other suppliers in Austria and the neighbouring countries. The plant
manufactures secondary PET raw material as granulate and flakes. The end products are
accepted as packaging for food.
The plant is equipped with the following:
Bale opener/shredder
Ballistic separator
Magnet and eddie-current separator
Manual sorting/quality control
Washing equipment
Extruders
The annual production is approx. 30,000 tonnes. Out of this 5% is not recycled being labels,
capsules and PET bottles containing liquids (e.g.olive oil), which disturbed the process and
reduces the quality of the re-granulate.
The manufactured PET flakes/pellets are accepted in food packaging.
Figure 23 Products manufactured at PET reprocessing plant.
Information and photos on the PET production plant is obtained via visit at the facility February
2011
Kruschitz PET reprocessing at Völkermarkt This plant produces primarily secondary PET raw materials. The plant receives source separated
and fine sorted PET bottles in different colours from central sorting facilities and other
suppliers. The plant manufactures secondary PET raw material as granulate and flakes.
The plant is equipped with the following:
Bale opener/shredder
Ballistic separator
NIR Infrared separator
Secondary shredder (12 mm)
Pre-washing and density sorting (flotation) (to sort out capsules and the like)
Hot washing (with NaOH) (to sort out lables)
Microfiltration of water (to clean for glue)
Vacuum reactor (heating) (to clean for e.g. organic contaminants)
Possible drying
Extruders
According to information received the purity of the secondary PET raw materials can reach 99,9
% having maximum impurities of 100 - 200 ppm.
25
The annual production is approx. 20,000 tonnes. Out of this 5 % - 10 % is not recycled being
paper, dust and other impurities: Labels are recycled.
Information on the PET production plant is obtained via visit at the facility October 2012.
Swerec AB Swerec is a Swedish combined sorting and production plant for secondary raw materials.
A central plastic packaging waste sorting and reprocessing plant has been established in
Värnamo in the Southern part of Sweden. The plant is operated by the company Swerec AB. It
receives plastic packaging wastes from households in Sweden, Norway and Denmark and
produces regenerated plastic as PP, HDPE, LDPE, PET, PVC (flakes, granulate).
The plant is equipped with
Bale opener/shredder
NIR Infrared separator
Washing equipment
Extruders
The regenerated plastic products have different qualities. Some of the plastic is directly used for
production of low quality products, while other outputs are pellets sold for industrial uses in e.g.
Holland and Sweden. The products are all grey and can be coloured black, green or brown, but
not white or clear. Approximately 80 % of the input material is recycled (Swerec, 2012).
8. COSTS AND REVENUES IN PLASTICS RECYCLING
Plastic waste streams and collection systems Normally, recycling of plastics takes place either:
from single waste streams in the plastic industry or
from mixed/multiple waste streams for households and commercial enterprises
In the first case the system for recycling is quite simple since the polymer type is well known
and is collected and processed as secondary plastic in a single waste stream. Such plastic waste
is generated at industries manufacturing plastic items/products .The value of such plastic waste
can be seen in Table 4 below the column "Cuttings from the industry".
In the second case the system for recycling will often include collection of more than one
material (or even a mixed waste stream). This can vary from collection of mixed source
separated plastics (several polymers) to collection of mixed source separated plastics and other
valuable recyclable materials (e.g.paper, cardboard, metal and glass). It can even be collection
of mixed household waste (in a dry fraction or a dry-wet fraction). In this case some kind of
automatic separation of plastic polymers will always be required.
To assess the costs of plastic recycling, it is necessary to look at this from a system point of
view, since the collection of one fraction may influence the rest of the waste system:
The plastic can either be collected separately or together with other recyclable materials
(co-mingled). Collection of more materials is often more cost-effective due to lower
collection costs.
The separately collected plastic is removed from the treatment of the residual waste
(incineration or landfilling), thus reducing the amounts for this treatment.
26
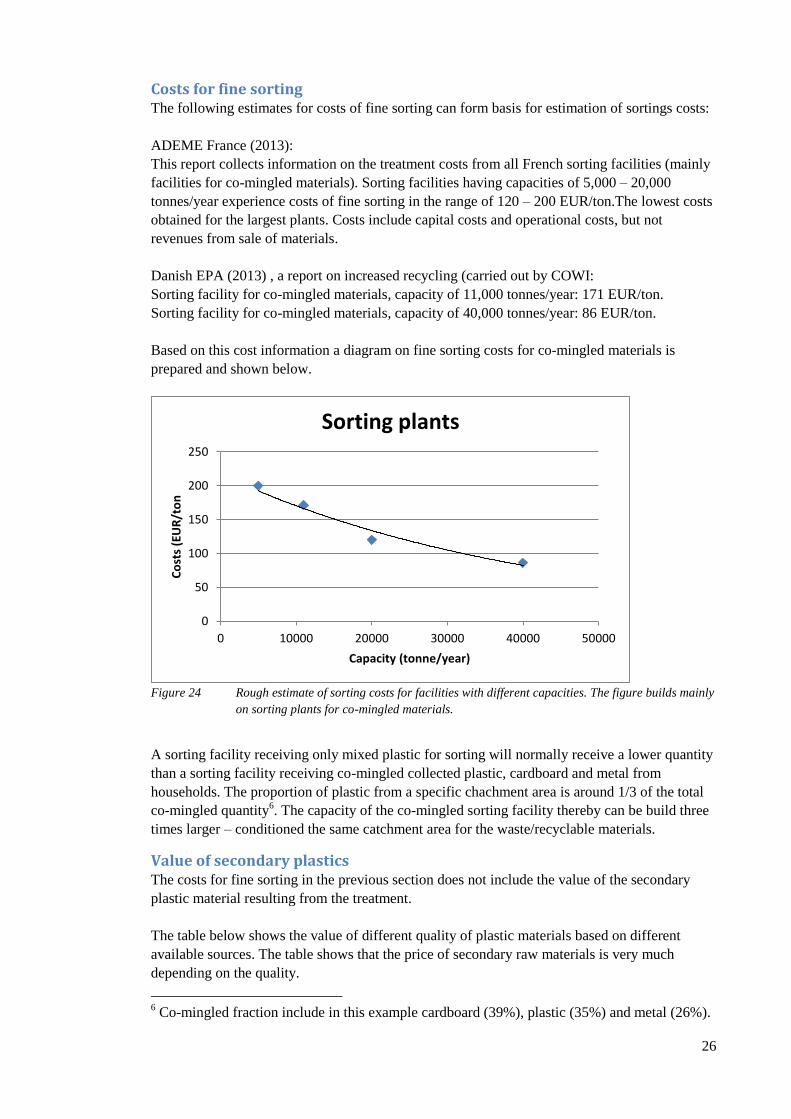
Costs for fine sorting The following estimates for costs of fine sorting can form basis for estimation of sortings costs:
ADEME France (2013):
This report collects information on the treatment costs from all French sorting facilities (mainly
facilities for co-mingled materials). Sorting facilities having capacities of 5,000 – 20,000
tonnes/year experience costs of fine sorting in the range of 120 – 200 EUR/ton.The lowest costs
obtained for the largest plants. Costs include capital costs and operational costs, but not
revenues from sale of materials.
Danish EPA (2013) , a report on increased recycling (carried out by COWI:
Sorting facility for co-mingled materials, capacity of 11,000 tonnes/year: 171 EUR/ton.
Sorting facility for co-mingled materials, capacity of 40,000 tonnes/year: 86 EUR/ton.
Based on this cost information a diagram on fine sorting costs for co-mingled materials is
prepared and shown below.
Figure 24 Rough estimate of sorting costs for facilities with different capacities. The figure builds mainly
on sorting plants for co-mingled materials.
A sorting facility receiving only mixed plastic for sorting will normally receive a lower quantity
than a sorting facility receiving co-mingled collected plastic, cardboard and metal from
households. The proportion of plastic from a specific chachment area is around 1/3 of the total
co-mingled quantity6. The capacity of the co-mingled sorting facility thereby can be build three
times larger – conditioned the same catchment area for the waste/recyclable materials.
Value of secondary plastics The costs for fine sorting in the previous section does not include the value of the secondary
plastic material resulting from the treatment.
The table below shows the value of different quality of plastic materials based on different
available sources. The table shows that the price of secondary raw materials is very much
depending on the quality.
6 Co-mingled fraction include in this example cardboard (39%), plastic (35%) and metal (26%).
0
50
100
150
200
250
0 10000 20000 30000 40000 50000
Co
sts
(EU
R/t
on
Capacity (tonne/year)
Sorting plants

27
Table 4 Value of different qualities of plastic (virgin and secondary raw materials). All values are
given in EUR/t.
Type of
plastic
Virgin
granulate1
Highest
quality
regenerate
(sec. plastic)2
Cuttings
from
industry1
High quality from source
separated and fine sorted
plastic
(1, 2 and 3, respectively)
Source
separated
mixed
plastic
HDPE 1450 600-800 725-1130 280-
320
250-350 240
LDPE 1500 740-1170 255-
295
375
PP 1600 600-800 790-1250 15-270 250-350 270
PA 2100-
3000
??
PVC 1700 ??
PS 1755 870-1355 230
PET ?? 900-1000
(flakes)
1200 (pellets)
?? 400-600
(white)
300-500
(blue)
270
ABS 2200-
2600
805-1610
Mixed
source
sep.
-50-+25
1) Alstrup (2012), 2) Kruschnitz Plastic & Recycling (2012), 3) Danish Recycling industry -COWI
(2012)
Cost example (plastic from households) The costs of introducing collection of recyclable materials, including plastic, depend entirely on
the system chosen .Throughout Europe different systems have been implemented to recycle the
valuable materials in the household waste (and in the C&I waste). Some of these are described
earlier in this report. The systems differ from each other, often due to local circumstances. Most
often the systems integrate recycling of a number of valuable materials within the same
"umbrella" (co-mingled materials). It is therefore not an easy task to identify the costs related to
recycling of each of the indivual materials.
To identify the costs connected to plastics recycling, we have in stead collected general
availbale information on the most important cost elements and prepared rough costs estimates
covering collection and sorting of collection of plastic (mixed from households) as source-
separated and co-mingled, respectively.
Variant 1 – recycling of mixed source separated plastics from households. This include the following operations from collection until a fine sorted polymer is delivered to
a plastic recycling industry.
Collection of the mixed source separated plastic as a single fraction.
The collection from single family housing is assumed to be in a 4-compartment bin
containing plastic, metal, paper and cardboard.
From multistorey housing the plastic is collected in mini-containers (660 liters) for
plastic only.
Transport to centrally situated facility for fine sorting of the mixed plastic polymers.
Fine sorting at central facility
Transport to recycling industry (upgrading the waste polymers to secondary plastic)

28
Variant 2 - recycling of mixed source separated plastics together with other recyclable materials (paper, cardboard, metal and glass) from households. This include the following operations from collection until a fine sorted polymer is delivered to
a plastic recycling industry.
Collection of the mixed source separated plastic together with other recyclable materials
(metal, paper and cardboard) as multiple/co-mingled fractions.
The collection from single family housing is assumed to be in bins with 2
compartments, hereof one for co-mingled plastics, metals and cardboard)
From multistorey housing the plastic is collected in mini-containers (660 liters) together
with metal and cardboard.
Transport to centrally situated facility for fine sorting of the co-mingled fractions into
individual materials/polymers
Fine sorting at central facility
Transport to recycling industry (upgrading the waste polymers to secondary plastic)
The difference between the above two variants is mainly the way the plastic is collected (single
or co-mingled). The overall technical concept for the central fine sorting plant, however, is not
assumed to differ significantly between the two variants. Fine sorting of mixed source separated
plastic as a single waste stream does not in a narrow sence require pre-separation of e.g. metals,
glass and cardboard. It is, however, in both variants important to separate impurities from the
high value recyclable fraction to ensure a sufficient high quality of the individual recyclable
material. In practise, the technical concept for the finesorting plant will be very similar in the
two variants, possibly having the required capacity as the only significant difference.
Collection and transport Table 5 shows the data used for calculation of economic costs of collection and transport in the
two systems.
Table 5 Datas for calculation of economic costs for two different systems for plastic collection and
transport.
The collection costs are estimated as shown below:
Bin Materials Collections per year
Collection costs (EUR/ household)
Collection costs (EUR/ton)
Single family
Var. 1 4 comp., 370 litre
Paper, plastic, metal, card board 280 kg/year
12 40 145
Var. 2 2 comp., 240 litre
Paper, plastic, metal, card board 280 kg/year
12 24 86
Multi family
Var. 1 Mini container, 660 litre
Plastic 79
Var. 2 Mini container,
660 litre
Plastic, cardboard, metal
73
After collection the plastic waste is to be transported to a sorting facility for fine sorting into
individual materials/polymers (including sepapartion of contaminants from the plastic). A
transport distance of 100 km might be realistic. The costs of this transport can roughly be
estimated at 15 €/ton.
Fine sorting and transport to recycling industry Based on the presented cost estimations for fine sorting the following exaples of fine sorting
cost can be applied in this overall cost calculation:

29
Sorting costs for plant for mixed plastic sorting – capacity 20,000 tonnes/year: approx. 120
EUR/ton plastic.
Sorting costs for plant for co-mingled materials including plastic – capacity 60,000 tonnes/year:
approx. 80 EUR/ton of recyclable material. It is not possible to estimate a specific sorting cost
for plastic, since the treatment of the different materials is integrated at the facility. The
treatment cost is therefore an average cost per ton of material treated at the facility.
The capacity of 20,000 tonnes/year is assumed to be a medium sorting plant for mixed plastic
sorting. The capacity of the sorting plant for co-mingled materials is assumed to be
approximately three times as large (same catchment area), which is a large plant according the
sources used (largest facilities mentioned in ADME (2013) is 40,000 t/yr).
After fine sorting the plastic polymers is to be transported to a reprocessing facility producing
secondary plastic (as flakes or granulate). A transport distance of 300 km might be realistic. The
costs of this transport can roughly be estimated at 20 EUR/ton.
Total costs for collection, transport and sorting
Based on the above estimations the total system costs of plastic recycling can be calculated for
the two variants for recycling of plastic from households.
Table 6 Total costs for the two systems for collection, transport and sorting of plastic for recycling.
The value of the secondary material is not included.
Costs in Euro per ton plastic
Variant 1 – Mixed plastic Variant 2 – Co-mingled
Single family Multistorey Single family Multistorey
Collection 145 79 86 73
Transport 1 15 15 15 15
Fine sorting 120 120 80 80
Transport 2 20 20 20 20
Total 300 234 201 188
The lower costs for Variant 2 (co-mingled) for single family households is mainly due to lower
collection costs, For multi-storey households, the difference in collection costs is much less
important. Due to the difference in capacity of the sorting facilities included in the calculations,
the treatment costs differ between the two variants (120 EUR/ton plastic and 80 kr./average ton
recyclable material, respectively).
It is important to note that the above presented estimations are very uncertain and is based on
few actual experienced costs – especially in relation to collection but in fact also in relation to
actual mixed plastic waste fine sorting. It is further important to note that other pre-conditions
for calculation of the collection costs might result in quite some different costs compared to the
above presented.
The cost calculations in the table above does not include the value of secondary plastic materials
from the fine sorting. The value of different qualities of secondary plastics are shown in Table 4.

30
9. ENVIRONMENTAL ISSUES Plastic recycling in general is regarded as an environmental advantage compared to the
alternatives, which will typically be incineration or landfilling. However, since plastic is a good
(fossil) fuel, the recycling system should be effective to ensure the environmental advantage of
the recycling.
The following issues are important to the overall environmental performance of the recycling
system for plastic:
› The fraction of the collected plastic rejected in the sorting process, e.g. black plastic, non-
certified packaging, non-targeted polymers etc.
› Substitution of virgin material (virgin plastic, wood or other materials).
› Energy consumption of the sorting plant
› Transportation distances (especially if the plastic is exported to Asia)
› Alternative waste treatment (incineration or landfilling and the performance of these
treatment technologies)
A more specific environmental assessment cannot be performed before an actual system is
specified and specific scenarios for comparison are defined. However, below are listed some
examples of relevant CO₂ data for estimating the savings obtained by recycling of plastic. CO2
is here chosen as an example of an environmental impact parameter. A range of other
parameters (acidification, smog formation, toxic impacts etc.) could be relevant as well and
therefore should be taking into account, but are not shown here.
Positive numbers represent emissions, while negative numbers represent savings due to saved
production of e.g. energy or new materials.
The actual savings in a specific case should be assessed in waste system scenarios (collection,
treatment and disposal including up-stream and down-stream effects) comparing recycling to
the alternative waste treatment option.
Table 7 CO₂ emissions from transport of plastic
Transportation Kg CO₂/km/ton Source
Truck, compacting 0.37 EASEWASTE
Truck (10 t) 0.19 EASEWASTE
Truck (25 t) 0.09 EASEWASTE
Ship (40,000 t) 0.02 EASEWASTE
Ship (150,000 t) 0.002 EASEWASTE
The above given CO₂ numbers are indicative for the magnitude of CO₂ emissions from different
transportation options, but may vary considerably depending on the specific choice of vehicle or
ship.
Similarly, the CO₂ savings from recycling of plastic given below should only be seen as
examples, since the actual savings may vary considerably depending on the specific recycling
technology and application chosen.
The total savings/emissions from incineration of plastic depends on the specific situation for the
specific incineration plant concerning energy utilisation. Since plastic is based on fossil

31
material, the incineration of plastic will result in a certain emission of fossil CO₂, which is
counted as a netto emission. Only if the produced energy is utilised effectively for electricity
and/or heating substituting fossil energy sources, environmental savings may be obtained in a
magnitude which makes the overall CO₂ accounting for incinerating plastic a netto CO₂ saving.
The CO₂ accounting for incineration of plastic is thus very depending on (1) the efficiency of
the incineration plant and (2) the substituted energy sources (electricity and district heating).
Table 8 CO₂ savings and emissions from different treatment options for plastic
Kg CO₂/tonne plastic
treated
Source
PE, recycling -1,500 Wenzel & Brogaard, 2011
PP, recycling -800 EASEWASTE*
PS, recycling -2,900 Ecoinvent database (production) + EASEWASTE* (reprocessing)
PET, recycling -1,750 Wenzel & Brogaard, 2011
Incineration, direct
emissions
2,500 EASEWASTE (estimate)
Incineration, total 2,500- -680** Specific cases
*)Data from before 1997. Newer data may show better performance of the recycling technologies.
**)New and effective incineration plant with utilisation of electricity and district heating
10. OVERVIEW The table below summarises the findings of the previous sections with respect to the qualities
and applications that can be obtained for plastic waste from different sources and different
treatment options.
Table 9 Connection between source/collection system, treatment technology and quality and
application options. General findings.
Source /collection Treatment Quality Application option
Households
Closed loop (bottle to bottle)
Fine sorting,
washing/hot washing (NaOH), vacuum reactor
Highest Drink bottles
(often PET)
Households Mixed plastic Source separation of mixed plastics (mono-origin or co-mingled)
Positive sorting from stream (NIR), quality control, fine sorting, washing/hot washing (NaOH), vacuum
reactor
Highest (up to 99,9% purity)
Food packaging, e.g. HDPE milk bottles
Households Mixed plastic Source separation of mixed plastics (mono-origin or co-mingled)
Positive sorting from stream (NIR), quality control, fine sorting, washing
Highest (up to 98% purity)
High quality products with high performance criteria
Households Mixed plastic Source separation of mixed
plastics (mono-origin or co-mingled)
NIR sorting. Fine sorting, washing.
85-92 % purity.
Relatively high quality products with lower
performance criteria
Households Mixed dry residual waste
NIR sorting. Fine sorting, washing
80-90 % purity
Products with lower performance criteria
Residual mixed plastic streams
from sorting plants
Low quality Low quality
products

32
The issue is very complicated with almost unlimited possibilities for variations. E.g. the sorting
plant can use different components and run NIR separation several times to improve the results.
However, the table is based on the "general findings" for NIR-based sorting plants (including
other technical components as well). NIR has been included in most of the described
combinations, since the technology is very dominating at the European sorting plants and the
trend is to use this technology more and more.
The table shows that the highest quality of secondary raw materials can be obtained either by
relatively narrow collection systems (e.g. bottle to bottle collection) or by positive sorting (NIR)
from the mixed stream of source separated materials (mono-origin or co-mingled). If the input is
source separated materials, it is possible to generate secondary raw materials of very high
quality provided efficient quality control and efficient "cleaning" of the fine sorted polymers. If
the input for sorting is dry residual waste, the output quality often will be slightly lower. It is
important to note, that efficient quality control is strictly necessary to obtain the highest purity.
Quality control can for the time being be made only manually and might sometimes result in
health impact to involved staff unless strict precautions are made.
The mentioned highest quality is documented via an example from Austria receiving PET
bottles (and other plastic items/types). The plastic reprocessing facility producing secondary
plastic of high quality receives plastic packaging from Austrian sorting plants generating a
purity of up to 98% (ARA quality criteria). The plastic reprocessing facility is equipped with
additional NIR sorters, washing equipment (NaOH) and in the end a Vacuum Reactor, which
can "clean" the regenerate for organic impurities resulting in a purity of 99,9% (according to
received information from Kruschitz Plastics & Recycling, Völkermarkt, Austria). Also other
types of polymers (PP. PE etc) are further fine sorted, washed and further "cleaned" at dedicated
plastic reprocessing facilities .
Often, the sorting plants will have a residual plastic stream, which is a mix of different
polymers. This secondary raw material can be used for low quality products with low
performance specifications (or as a fuel).

33
11. REFERENCES
ADEME (2013). Situation of household dry recyclables sorting facilities in France.[In
French]. Etat des lieux du parc des centres de tri de recyclables secs ménagers en
France. Angers, France.
Alba (2011): Plastic from households and the different way to new products. Dirk Mellem (Alba
Recycling). Presentation at Green Dot Conference. Oslo, 03.03.2011.
Alstrup, Thomas (2012): Materials flow and Stakeholders in Danish Plastic Industry.
ARA System (2011): Power Point Presentation and personal information received at meeting,
ARA office, Wienna, February 2011.(www.ara.at )
Bilitewski, B. (2011): Mechanical Treatment: Unit Processes, in: Christensen, T. H. (red.)
(2011): Solid Waste Technology and Management, Vol. 2, Blackwell Publishing Inc.
Christensen, T. H. & T. Fruergaard (2011): Recycling of Plastic, in: Christensen, T. H. (red.)
(2011): Solid Waste Technology and Management, Vol. 2, Blackwell Publishing Inc.
Danish EPA (2012): Miljøprojekt nr. 1447, 2012. Miljø- og Samfundsøkonomisk vurdering af
muligheder for øget genanvendelse af papir, pap, plast, metal og organisk affald fra
dagrenovation. (Environmental and society cost assessment of increased recycling of paper,
cardboard,plastic, metal and biowaste originating from the household waste stream)
EASEWASTE: Model for environmental assessment (LCA) of waste systems developed by the
Technical University of Denmark.
IUT (IUT Ingenieurgemeinschaft Innovative Umwelttechnik GmbH) (2010): Technologies for
automatic sorting of waste. Powerpoint presentation.
IUT (IUT Ingenieurgemeinschaft Innovative Umwelttechnik GmbH) (2012): Personal
communication. 2012.
JRC (2011): End-of-waste Criteria for Waste Plastic for Conversion - Technical Proposals. First
working document 2011, IPTS Sevilla, Spain
PlasticsEurope (2012): Plastics - the facts 2012. An analysis of European plastics production,
demand and waste data for 2011. PlasticsEurope. 2012.
Swerec (2012): Swerecs homepage: http://www.swerec.se/sv/om-swerec
Wenzel, Henrik & Brogaard, Line Kai-Sørensen (2011): Fastlæggelse af data for
materialegenanvendelse til brug i CO₂-opgørelser. University of Southern Denmark & The
Technical University of Denmark for affald danmark and DAKOFA.