report on food handling practices and microbiological quality … · food handling practices and...
TRANSCRIPT

Report on food handling practices and microbiological quality of sushi in Australia
A survey conducted under the Coordinated Food
Survey Plan with participation from food regulatory jurisdictions in NSW, SA, NT and ACT.
Report prepared by the NSW Food Authority
July 2008

Food handling practices and microbiological quality of sushi in Australia
2
Executive Summary The NSW Food Authority was the lead agency for a national coordinated survey of food handling practices and microbiological quality of sushi. 89 retail sushi outlets across New South Wales (NSW), South Australia (SA), Northern Territory (NT) and the Australian Capital Territory (ACT) were randomly selected to be included in the survey. These businesses were visited between June 2006 and June 2007 and samples of sushi and rice collected and tested for compliance with the Food Standards Australia New Zealand microbiological guidelines for ready-to-eat foods.
In addition, a total of 69 sushi outlets in NSW, SA and NT were surveyed for their handling practices using a questionnaire during the initial visit to the premises (ACT outlets were not surveyed). Food handling survey responses highlighted several potential areas for improvement. It was found that cooling of cooked rice was often uncontrolled and verification of the pH of sushi rice after acidification was rarely undertaken, sometimes resulting in rice with a higher pH than the 4.6 limit identified by the NSW Food Authority. In addition, sushi outlets generally did not have a documented system for identifying how long sushi had been displayed out of temperature control.
The microbiological quality of samples tested was generally very good, with 72/73 (98.6%) of sushi rice samples and 805/851 (94.6%) of sushi samples considered acceptable. Six sushi samples were categorised as potentially hazardous due to elevated levels of Bacillus cereus and sushi was found to have significantly higher levels of faecal coliforms and E. coli in the summer months.
All samples of raw seafood tested were found to be within the Food Standards Code limit for histamine levels.
For all unacceptable results, follow-up action was undertaken commensurate with the level of risk posed.

Food handling practices and microbiological quality of sushi in Australia
3
Table of Contents
1. Introduction .......................................................................................................4 2. Survey Objective ................................................................................................5 3. ISC Coordinated Food Survey............................................................................5 4. Food handling questionnaire .............................................................................5 5. Sample collection ...............................................................................................5 6. Method of analysis .............................................................................................6
Assessing microbiological quality of sushi .................................................................6 7. Results................................................................................................................7
Survey responses...................................................................................................7 Acidification and storage of sushi rice ..................................................................7 Preparation and display of sushi ..........................................................................9
Microbiological and chemical results ........................................................................9 Acidified sushi rice..............................................................................................9 Sushi – winter samples .......................................................................................9 Sushi – summer samples .................................................................................. 10 Combined results ............................................................................................. 10 Histamine testing ............................................................................................. 10
8. Discussion ........................................................................................................ 12 Control measures for sushi rice ............................................................................. 12 Preparation and display of sushi............................................................................ 13 Microbiological quality of sushi .............................................................................. 13
Faecal coliforms and E. coli ............................................................................... 13 Bacillus cereus ................................................................................................. 14 Coagulase positive staphylococci (S. aureus) ...................................................... 14 Salmonella....................................................................................................... 14 Listeria monocytogenes .................................................................................... 14 Vibrio parahaemolyticus.................................................................................... 15
Histamine............................................................................................................ 15 9. Follow up action ............................................................................................... 15 10. Conclusion ........................................................................................................ 15 11. References........................................................................................................ 17 12. Attachments ..................................................................................................... 19 Food Handling questionnaire for sushi businesses .................................................. 20 Summary of questionnaire responses ...................................................................... 23

Food handling practices and microbiological quality of sushi in Australia
4
1. Introduction Sushi consists of cold cooked rice acidified with vinegar that is shaped into bite-sized pieces and topped with raw or cooked fish, or formed into a roll with fish, egg, or vegetables and wrapped in seaweed. The two main types of sushi sold in Australia are:
• Nigiri, normally consisting of a clump of acidified rice, with ingredients such as a piece of seafood or egg omelette placed on top; and
• Maki, consisting of acidified rice and ingredients such as seafood, meat, chicken and/or vegetables rolled inside seaweed, also called nori rolls.
In Australia, sushi is becoming increasingly popular and can be purchased from retail outlets that may either display products inside an enclosed cabinet (e.g. sushi bar) or on a moving conveyor belt where customers select the dish they want (e.g. sushi ‘train’). As sushi can contain perishable ingredients and involves a significant degree of manual handling during preparation, for regulatory purposes it is normally regarded as a potentially hazardous food. As such, it is a requirement for food businesses handling sushi to comply with Standard 3.2.2 – Food safety practices and general requirements of the Food Standards Code by maintaining the temperature of sushi at or below 5˚C during transport, storage and display. Alternatively, businesses may implement the ‘4-hour/2-hour rule’, which allows for food to be held out of temperature control for limited periods of time and thrown out after 4 hours or refrigerated within 2 hours (ANZFA, 2001c).
Many businesses selling sushi commonly display it out of temperature control, as they report that keeping sushi under refrigeration conditions affects the quality of the rice, as it tends to become crunchy, and ingredients lose their flavour.
In Australia, from 2001 to 2007 there have been 10 outbreaks of foodborne illness associated with consumption of sushi, affecting 84 people with 7 hospitalised (OzFoodNet unpublished data, 2008). This accounts for 1.4% of all reported foodborne outbreaks, with the implicated sushi being prepared in restaurants (8/10), a commercial caterer (1/10) and a commercial manufacturer (1/10).
Overseas, the Hong Kong Food and Environmental Hygiene Department (FEHD) reported that from 1997 to 1999 consumption of sushi and sashimi contributed to 45/1481 (3%) of reported food poisoning outbreaks in Hong Kong, affecting 142 people (FEHD, 2000). Outbreaks attributed to consumption of sushi have primarily been due to the presence of pathogenic bacteria such as Vibrio parahaemolyticus, Bacillus cereus, Staphylococcus aureus and Salmonella.
Several studies have assessed the quality and safety of sushi, within Australia (Millard & Rockliff, 2003) and overseas (Adams et al., 1994; Atanassova et al., 2008; Fang et al., 2003; FEHD, 2000). These surveys have generally shown the majority of sushi samples to be satisfactory, with only a small number of samples containing potentially hazardous levels of microorganisms. E. coli have been found at levels of greater than 103 cfu/g (Fang et al, 2003) and 104 cfu/g (FEHD, 2000), while L. monocytogenes was detected by Millard & Rockliff (2003) and Atanassova et al. (2008), the latter also finding Salmonella in a survey of German sushi. These studies also uncovered potential problems associated with temperature control and hygienic practices across the industry.

Food handling practices and microbiological quality of sushi in Australia
5
2. Survey Objective There is limited information regarding the microbiological quality of sushi products sold in Australia. This survey was conducted under the Coordinated Survey Plan of the Implementation Sub Committee (ISC) of the Food Regulation Standing Committee (FRSC) undertaken to observe food handling practices across the industry and determine the current microbiological status of products sold in New South Wales (NSW), South Australia (SA), Northern Territory (NT) and the Australian Capital Territory (ACT). A particular focus was given to sushi containing raw seafood, to assess whether the use of raw seafood resulted in a higher prevalence of bacterial pathogens in the food. In addition, some fish, such as tuna, may contain natural bacteria that convert the amino acid histidine into histamine, resulting in histamine (or Scromboid) poisoning (NSW Food Authority, 2006; Food Safety Victoria, 2008). Raw samples of tuna and salmon were examined in this survey for the presence of histamine.
3. ISC Coordinated Food Survey On 30 October 2003 the Food Regulation Standing Committee’s Implementation Sub-Committee (ISC) agreed to the development of a ‘Coordinated Food Survey Plan’ (the Plan) for the Australian jurisdictions, food regulatory partners and New Zealand. This was in recognition that there were significant advantages in implementing agreed national survey priorities in a prospective and coordinated manner. A national coordinated survey of the microbiological quality of sushi was proposed by the NSW Food Authority and endorsed by ISC for inclusion on the Plan for 2006 and 2007.
4. Food handling questionnaire A questionnaire was prepared to assess the food handling practices of sushi outlets involved in the preparation of sushi (see Attachment A - Food Handling questionnaire for sushi businesses). A total of 69 sushi outlets in NSW, SA and NT were surveyed for their handling practices using the questionnaire during the initial visit to the premises (ACT outlets were not surveyed). Of these outlets, 55 premises displayed sushi in an enclosed cabinet, 13 displayed sushi on a moving conveyor belt and 1 premise displayed sushi in both a cabinet and on a conveyor belt.
The areas covered by the questionnaire included:
• how the sushi rice was acidified and stored; and
• preparation and display of sushi.
The survey responses were collated and analysed using SurveyMonkey™.
5. Sample collection 89 retail sushi outlets in NSW, SA, NT and the ACT were randomly selected to be included in the survey. Participating premises were limited to those where sushi was displayed for sale within enclosed cabinets or on moving conveyor belts. Sushi sold in restaurants, where food is made to order and consumed immediately, were excluded from the survey.
Where possible, each sushi outlet was visited twice between June 2006 to June 2007, once each during the summer months (December – February) and winter months (June – August).
Samples were collected for microbiological and chemical analysis on each visit to a sushi outlet, to determine if a significant seasonal difference was evident between summer and winter samples. A total of 1,000 samples were collected, consisting of 75 samples of cooked acidified sushi rice, 851 sushi (nigiri and maki rolls), and 74 samples of raw fish (salmon or

Food handling practices and microbiological quality of sushi in Australia
6
tuna). At each visit to the sushi outlet, six samples were aseptically collected, placed within an insulated container and transported to the laboratory for testing.
6. Method of analysis Samples of acidified sushi rice were tested for pH using an in-house NATA accredited method (F 50.39) based on the AOAC 981.12 method using pH meter and buffers, or equivalent. The determination of water activity (aw) used an in-house method (M14) based on the AOAC 978.18 method using detector liquid and refractometer, or equivalent.
Samples of raw fish were tested for the presence of histamine using an in-house NATA accredited method (method F25) in which the histamine is extracted from the sample then derivatised with orthophthaldehyde for High Performance Liquid Chromatography (HPLC) analysis using fluorescence detection, or equivalent.
All microbiology samples were analysed within 24 hours of receipt at the laboratory using the appropriate Australian Standard method as detailed in Table 1.
All statistical analysis was conducted using the analysis of variance, T-test and chi square test from JMP® Professional Edition Ver. 5.
Table 1 - Sample type and Australian Standard methods used
Number of samples Sample
Summer Winter Tests undertaken Method
Acidified Rice
39 36 Standard Plate Count Faecal coliforms Bacillus cereus Coagulase positive staphylococci Escherichia coli pH, water activity
AS 1766.2.1 AS 1766.2.3 AS 1766.2.6 AS 1766.2.4 / AS 5013.12.2 AS 1766.2.3 F 50.39, M14 (or equivalent)
All Sushi Faecal coliforms Bacillus cereus Coagulase positive staphylococci Escherichia coli Salmonella spp. Listeria monocytogenes
AS 1766.2.3 AS 1766.2.6 AS 1766.2.4 or AS 5013.12.2 AS 1766.2.3 AS 1766.2.5 / AS 5013.10 AS/NZS 1766.16.1
Sushi containing raw seafood
404 447
In addition to above tests, also tested for Vibrio parahaemolyticus
AS/NZS 1766.2.9
Raw seafood
48 26 Histamine F25 (or equivalent)
Total 491 509
Assessing microbiological quality of sushi Sushi falls into a large category of ready-to-eat foods for which there are no microbiological standards in the Food Standards Code. To assist government and industry interpret microbiological results for these foods, Food Standards Australia New Zealand (then ANZFA) have published microbiological guidelines (ANZFA, 2001a). These guidelines, as shown in

Food handling practices and microbiological quality of sushi in Australia
7
Table 2, were used to assess the quality of the sushi and sushi rice tested in this survey. In the absence of a guideline for faecal coliform results, these were compared against the guideline for Enterobacteriaceae. Samples were considered microbiologically acceptable if they were within the satisfactory and/or marginal categories. Any outlets where samples were found to be unsatisfactory or potentially hazardous were subject to follow-up action by the appropriate food jurisdiction.
Table 2 - Guidelines levels for determining the microbiological quality of ready-to-eat foods (ANZFA, 2001a)
Microbiological quality (cfu/g) Test
Satisfactory Marginal Unsatisfactory Potentially Hazardous
Standard Plate Count Level 2.1 < 106 < 107 ≥ 107 Indicators Enterobacteriaceae2 < 102 102 – 104 ≥ 104
Escherichia coli < 3 3 - 100 ≥ 100 3 Pathogens Bacillus cereus < 102 102 – 103 103 – 104 ≥ 104 Coagulase positive Staphylococci
< 102 102 – 103 103 – 104 ≥ 104 SET +ve
Salmonella not detected in 25g
detected
Listeria monocytogenes not detected in 25g
detected but < 102
≥ 102
Vibrio parahaemolyticus4 < 3 3 – 102 102 – 104 ≥ 104 7. Results
Survey responses
Acidification and storage of sushi rice Responses to the survey indicated that 62/64 (96.9%) of businesses used vinegar to acidify sushi rice. However, only 6/62 (9.7%) responded that they verified this process by measuring the pH of the rice after acidification using either test strips or a pH probe.
Survey responses showed that 49/64 (76.6%) of businesses used the rice within two hours of cooking it (Figure 1). Only 26/64 (40.6%) stored the rice under refrigeration before using it in making the sushi (Figure 2). Questionnaire responses indicated that 55/64 (85.9%) of outlets discarded the sushi rice at the end of the day, while 7/64 (10.9%) re-used leftover rice the next day. A full summary of all survey responses is located in Attachment B - Summary of questionnaire responses.
1 Level 2 applies to ready-to-eat foods which contain some components that have been cooked and then further
handled (stored, sliced or mixed) prior to preparation of the final food or where no cooking process has been used.
2 Enterobacteriaceae testing is not applicable to fresh fruits and vegetables or foods containing these. 3 Pathogenic strains of E. coli should be absent 4 V. parahaemolyticus should not be present in seafood that has been cooked. For raw ready-to-eat seafood, a
higher satisfactory level may be applied (<102 cfu/g).

Food handling practices and microbiological quality of sushi in Australia
8
Figure 1. Maximum time rice is kept before use in sushi.
21.9%
54.6%
12.5% 9.4%1.6%
0%
20%
40%
60%
80%
100%
< 1hr 1 - 2 hr 2 - 4 hr 4 - 8 hr > 8hr
Figure 2. Storage of acidified rice before use in sushi (RT = Room Temperature)
40.6%
7.8%
32.8%
7.8%10.9%
0.0%
20.0%
40.0%
60.0%
80.0%
100.0%
Refrigerator RT - Opencontainer
RT - Closedcontainer
Inside ricecooker
other
Figure 3. Maximum time sushi is displayed.
7.5%11.9%
53.7%
25.4%
1.5%0.0%
20.0%
40.0%
60.0%
80.0%
100.0%
< 1hr 1 - 2 hr 2 - 4 hr 4 - 8 hr > 8hr

Food handling practices and microbiological quality of sushi in Australia
9
Preparation and display of sushi The majority of businesses surveyed, 64/67 (95.5%), prepared some or all of the sushi they sold on site, with some businesses also indicating they bought in pre-cooked or pre-made ingredients such as teriyaki or katsu chicken, egg omelette and prawn tempura.
Where businesses displayed sushi in an enclosed cabinet, 36/56 (64.3%) displayed the sushi pre-packaged within a cabinet that was reported to be chilled. Measurements of the temperature of these display cabinets showed temperatures ranging from 5°C to 19.8°C (mean 9.6 ± 4.7°C).
Where businesses displayed sushi in an enclosed cabinet, 36/56 (64.3%) displayed the sushi pre-packaged within a display cabinet that was reported to be chilled. Measurements of the temperature of these display cabinets showed temperatures ranging from 5°C to 19.8°C (mean 9.6 ± 4.7°C).
Where businesses displayed the sushi on conveyor belts, 13/14 (92.9%) of respondents indicated the sushi was covered.
The length of time businesses kept sushi on display was indicated by 49/67 (73%) of respondents to be up to 4 hours (Figure 3). However, only 9/29 (31.0%) of businesses were able to satisfactorily explain their system for identifying how long the sushi had been on display. In those businesses where systems had been implemented, these included colour coded stickers or plates with different pattern.
The majority, 59/67 (88.1%), of businesses indicated that unsold or left over sushi was discarded at closing, while the remaining businesses commonly gave it away.
Microbiological and chemical results
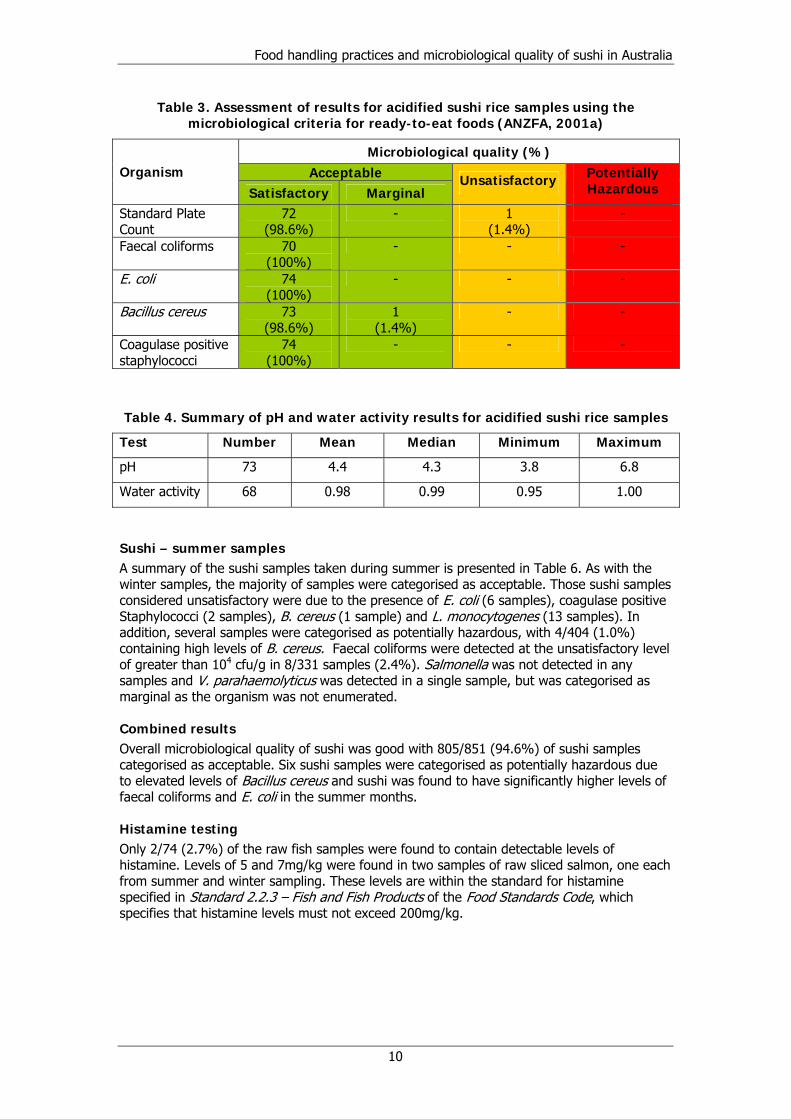
Acidified sushi rice A summary of the microbiological results for sushi rice samples is presented in Table 3. When compared against the microbiological guidelines, 1 sample of sushi rice was categorised as unsatisfactory due to a high standard plate count level of 1.3 x 10⁷ cfu/g. Another sample of sushi rice was categorised as marginal due to the presence of B. cereus at a level of 100 cfu/g, with all remaining samples being satisfactory. Faecal coliforms were isolated from 3 samples, but all at levels which were considered within the satisfactory range (1 sample with 9 cfu/g and 2 samples with 23 cfu/g).
Table 4 summarises the results of pH and water activity testing for acidified sushi rice samples. Results showed that 62/73 (84.9%) acidified rice samples had a pH value of less than or equal to 4.6. However, 11/73 samples (15.1%) had a pH value greater than 4.6, with these samples having an average pH of 5.3 ± 0.8 and a maximum level of 6.8. Water activity values for rice samples showed values between 0.95 and 1.0.
Sushi – winter samples A summary of the sushi samples taken during winter is presented in Table 5. The majority of samples were categorised as acceptable (i.e. within the satisfactory and marginal limits). However, 2 samples contained potentially hazardous levels of B. cereus of 2.0 x 10⁴ and 6.5 x 10⁴ cfu/g, while another sample was categorised as unsatisfactory due to the presence of B. cereus at a level of 4.1 x 10³ cfu/g. A further 13 samples were positive for the presence of L. monocytogenes. Although enumeration of L. monocytogenes was not undertaken for this survey, the presence of this organism at any level in a food that can support its growth is considered unsatisfactory (ANZFA, 2001b). Faecal coliforms were found in 5 samples (1.6%) at the marginal level between 102 and 104 cfu/g and E. coli in 11 samples (2.5%) at levels between 3 and 100 cfu/g. Two of the samples containing detectable levels of E. coli were also positive for L. monocytogenes. Salmonella and V. parahaemolyticus were not detected in any samples.
Food handling practices and microbiological quality of sushi in Australia
10
Table 3. Assessment of results for acidified sushi rice samples using the microbiological criteria for ready-to-eat foods (ANZFA, 2001a)
Microbiological quality (%) Acceptable Organism
Satisfactory Marginal Unsatisfactory Potentially
Hazardous
Standard Plate Count
72 (98.6%)
- 1 (1.4%)
-
Faecal coliforms 70 (100%)
- - -
E. coli 74 (100%)
- - -
Bacillus cereus 73 (98.6%)
1 (1.4%)
- -
Coagulase positive staphylococci
74 (100%)
- - -
Table 4. Summary of pH and water activity results for acidified sushi rice samples
Test Number Mean Median Minimum Maximum
pH 73 4.4 4.3 3.8 6.8
Water activity 68 0.98 0.99 0.95 1.00
Sushi – summer samples A summary of the sushi samples taken during summer is presented in Table 6. As with the winter samples, the majority of samples were categorised as acceptable. Those sushi samples considered unsatisfactory were due to the presence of E. coli (6 samples), coagulase positive Staphylococci (2 samples), B. cereus (1 sample) and L. monocytogenes (13 samples). In addition, several samples were categorised as potentially hazardous, with 4/404 (1.0%) containing high levels of B. cereus. Faecal coliforms were detected at the unsatisfactory level of greater than 104 cfu/g in 8/331 samples (2.4%). Salmonella was not detected in any samples and V. parahaemolyticus was detected in a single sample, but was categorised as marginal as the organism was not enumerated.
Combined results Overall microbiological quality of sushi was good with 805/851 (94.6%) of sushi samples categorised as acceptable. Six sushi samples were categorised as potentially hazardous due to elevated levels of Bacillus cereus and sushi was found to have significantly higher levels of faecal coliforms and E. coli in the summer months.
Histamine testing Only 2/74 (2.7%) of the raw fish samples were found to contain detectable levels of histamine. Levels of 5 and 7mg/kg were found in two samples of raw sliced salmon, one each from summer and winter sampling. These levels are within the standard for histamine specified in Standard 2.2.3 – Fish and Fish Products of the Food Standards Code, which specifies that histamine levels must not exceed 200mg/kg.

Food handling practices and microbiological quality of sushi in Australia
11
Table 5. Assessment of winter sushi samples against microbiological criteria for ready-to-eat foods (ANZFA 2001a)
Microbiological quality – Winter (%) Acceptable Organism No of
samples Satisfactory Marginal
Unsatisfactory Potentially Hazardous
Faecal coliforms 316 311 (98.4%)
5 (1.6%)
E. coli 447 436 (97.5%)
11 (2.5%)
- -
Bacillus cereus 447 439 (98.4%)
5 (1.0%)
1 (0.2%)
2 (0.4%)
Coagulase positive staphylococci
447 440 (98.4%)
7 (1.6%)
- -
Salmonella spp. 446 446 (100%)
- - -
Listeria monocytogenes
446 433 (97.1%)
13 (2.9%)
Vibrio parahaemolyticus
155 155 (100%)
- - -
Table 6. Assessment of summer sushi samples against microbiological criteria for
ready-to-eat foods (ANZFA, 2001a)
Microbiological quality – Summer (%) Acceptable Organism No of
samples Satisfactory Marginal
Unsatisfactory Potentially Hazardous
Faecal coliforms 331 280 (84.6%)
43 (13.0%)
8 (2.4%)
E. coli 404 375 (92.8%)
23 (5.7%)
6 (1.5%)
-
Bacillus cereus 404 388 (96.0%)
11 (2.7%)
1 (0.3%)
4 (1.0%)
Coagulase positive staphylococci
404 398 (98.5%)
4 (1.0%)
2 (0.5%)
-
Salmonella spp. 404 404 (100%)
- - -
Listeria monocytogenes
404 391 (96.8%)
- 13 (3.2%)
Vibrio parahaemolyticus
158 157 (99.4%)
1 (0.6%)
- -

Food handling practices and microbiological quality of sushi in Australia
12
8. Discussion
Control measures for sushi rice Cooling and acidification of cooked rice are considered two of the most important control measures for the safety of sushi rice.
Acidification of sushi rice normally occurs when the rice is warm, to facilitate appropriate mixing. The NSW Food Authority has identified 4.6 as the critical pH level in its Food Safety Guidelines for the Preparation and Display of sushi (NSW Food Authority, 2007). At this pH, the rice is no longer considered a potentially hazardous food as the pH will not allow the growth of pathogens. In the United States, the Hospitality Institute of Technology and Management (HITM) and University of Florida also suggest that cooked rice should be adjusted to a pH less than 4.6 (Snyder, 2000; University of Florida, 2004). The Victorian Department of Human Services (DHS) Food Safety Template - sushi supplement identifies a pH of 4.8 or lower for rice used in sushi (Food Safety Victoria, 2004). While survey responses indicated that the majority of businesses used vinegar to acidify the cooked rice, very few businesses then verified the pH of the sushi rice, using either test strips or a pH probe. Although 92.9% of samples tested in this survey met the pH guidelines value of less or equal to 4.6, these pH values are slightly higher than those found in a Seattle survey reported by Adams et al. (1994), where pH values of acidified sushi rice samples ranged from 3.9 to 4.6 (mean = 4.3 ± 0.2). While a 2003 ACT Health study found pH values in acidified sushi rice ranged from 4.3 to 6.5. The observed variation in acidity levels in the sushi rice may be due to the lack of verification undertaken by outlets.
It is important to note that the pH of the finished sushi will also be dependent on the pH of the other ingredients. The University of Melbourne (1999) measured the pH values for individual ingredients of California rolls after 8 hours of storage and found some variation with carrots (pH range 4.81 – 4.95), cucumber (pH range 4.71 – 5.08), avocado (pH range 4.98 – 5.81), pickles (pH range 4.61 – 4.77), fish (pH range 5.07 – 5.69). Some of the higher pH values observed could potentially sustain slow growth of pathogens. The study also found that the pH and water activity values for sushi remained substantially unchanged over a 72 hour challenge test period at 25°C.
Allowing cooked rice to cool over an extended period of time prior to acidification may provide the opportunity and conditions for growth of B. cereus, which has previously been identified in outbreaks from cooked rice (ICMSF, 1996). Extended holding periods at warmer temperatures may also allow growth of S. aureus, which may be transferred from staff to the rice during the preparation of the acidified rice. Questionnaire responses suggest there is no consistent approach by sushi outlets to storage of rice from the time it is cooked to when it is used in making sushi. Most businesses use the rice within 2 hours of cooking, however less than half the outlets cooled the rice in the refrigerator and 1 business kept the rice (under refrigeration) for more than 8 hours before using it.
Research by the University of Florida (2004) found that properly acidified rice (pH ≤ 4.6) could safely be kept out of temperature control for up to 8 hours. If a sushi outlet intends to store sushi rice out of temperature control, or for prolonged periods of time, it must ensure that the appropriate control measures are applied to minimise the opportunity for growth of the primary pathogens of concern, B. cereus and S. aureus.
Despite some possible improvements identified for how sushi rice is prepared, the microbiological quality of samples in this survey was generally very good. However, one sample was considered unsatisfactory due to a high standard plate count of 1.3 x 10⁷ cfu/g. Samples were compared against ‘Level 2’ standard plate count guidelines as this is applicable for ready-to-eat foods which contain some components that have been cooked and then further handled (mixed) prior to final preparation of the food (ANZFA, 2001a). There was no significant difference between winter and summer samples, and the results are similar to those obtained in a survey conducted in Seattle (USA) as reported by Adams et al. (1994). In that survey, 135 samples of acidified sushi rice were tested and aerobic plate counts were found at levels between 1 x 10³ and 1.2 x 10⁷cfu/g. In addition, low levels of B. cereus and S. aureus were also detected

Food handling practices and microbiological quality of sushi in Australia
13
It is imperative that the sushi rice is:
• cooled rapidly after cooking;
• acidified to a pH of less than or equal to 4.6;
• checked and recorded to ensure the pH is correct for every batch.
Preparation and display of sushi Standard 3.2.2 – Food safety practices and general requirements of the Food Standards Code requires potentially hazardous foods to be kept under temperature control (i.e. less than or equal to 5°C) to prevent growth of pathogenic microorganisms, or implement the ‘4-hour/2-hour rule’ as an alternative. In addition, for potentially hazardous foods that have been cooked and cooled, such as some of the ingredients used in making sushi, businesses that wish to employ the 4-hour/2-hour rule must also be able to demonstrate that the food was cooled safely, in accordance with Standard 3.2.2 and record the time at which the food was removed from refrigeration and the time at which it must be discarded. In all instances businesses must be able to demonstrate that use of alternative times and temperatures for food display will not adversely affect the microbiological safety of the food.
The University of Melbourne (1999) conducted challenge tests on California (maki) rolls at 25°C, and found that levels of B. cereus, S. aureus, Salmonella and L. monocytogenes did not significantly increase over 72 hours. Although it inhibited growth, the low pH level (pH range 4.31 – 4.52) did not kill the pathogens. In addition, standard plate count levels were seen to increase during the corresponding timeframe. The recommendation was made that these products could be safely stored out of temperature control for up to 8 hours.
The majority of sushi outlets in this survey indicated that they displayed sushi for up to 4 hours, however very few could actually demonstrate a system for identifying the length of time sushi was on display. This combined with the observations that most samples were displayed above 5°C and the temperature of some ‘chilled’ display cabinets were as high as 19.8°C (average 9.8°C), would indicate there is potential for growth of microorganisms in the prepared sushi. To demonstrate compliance with the Food Standards Code, sushi outlets intending to display sushi out of temperature control must have a system to track how long the sushi has been out of temperature control. Systems currently used by sushi outlets included displaying sushi with colour coded stickers or on plates with different patterns correlating to a certain time for disposal.
Microbiological quality of sushi The safety of sushi is largely dependent on the initial microbiological quality of the ingredients used in preparing the sushi, and the implementation of good hygienic practice and process control to ensure that contamination does not occur during preparation. A lack of control over any of these factors may contribute to an increase in risk of contamination of the finished product. Despite some areas for improvement identified in the food handling survey, the microbiological results demonstrated that the majority of samples were acceptable when compared to the FSANZ microbiological guidelines for ready-to-eat foods.
Faecal coliforms and E. coli The FSANZ microbiological guidelines only provide levels for Enterobacteriaceae. As this survey enumerated faecal coliforms, a direct comparison was made with the Enterobacteriaceae guideline level. Samples of sushi were found to have significantly higher levels (p < 0.05) of faecal coliforms and E. coli (resulting in more marginal and unsatisfactory samples) in the summer months than the winter months. This may be due to higher ambient temperatures allowing more growth of these organisms in the food during display out of temperature control.

Food handling practices and microbiological quality of sushi in Australia
14
The presence of E. coli at unsatisfactory levels may indicate poor personal hygiene by food handlers preparing sushi. However, the significance of faecal coliforms levels is difficult to determine. Although normally used as indicators of poor personal hygiene, it is not normally applicable to food containing fresh fruits or vegetables, such as sushi (particularly maki rolls) that may contain carrots, lettuce, cucumber and avocado. However, of the 7 sushi samples categorised as unsatisfactory due to high levels of faecal coliforms, 3 samples were also found to have marginal and/or potentially hazardous levels of B. cereus, coagulase positive staphylococci and/or L. monocytogenes. While lower levels of faecal coliforms may be expected in such products, this survey showed that higher levels of faecal coliforms (greater than 104 cfu/g) may be a useful indicator of possible contamination with pathogens.
Bacillus cereus The number of sushi samples categorised as potentially hazardous in this survey due to levels of B. cereus was 6/851 (0.7%). Of these 6 samples, 5 were collected from a single outlet, including 2 samples containing B. cereus at levels of 1.3 x 10⁷ and 5.5 x 10⁷ cfu/g, both considered well above the minimum level required to cause illness, estimated to be more than 105 cfu/g (ICMSF, 1996). The pH of the rice samples containing elevated levels of B. cereus were not tested, however the pH of different rice samples taken from the same sushi outlet showed that proper acidification was taking place.
Such a high level of B. cereus in a cooked ready-to-eat food is generally indicative of very poor temperature control, allowing B. cereus spores, which are naturally present in the uncooked rice and will survive the cooking process, to germinate and grow to high levels (ICMSF, 1996). This outlet was subject to considerable regulatory action and has since rectified deficiencies in their sushi preparation practices.
The prevalence of B. cereus at potentially hazardous levels found in this survey is similar to that previously found by Millard and Rockliff (2003) of 1.8% for sushi sold in the ACT. Although levels in this survey are much higher than those found in the Taiwan survey conducted by Fang et al. (2003), where results ranged within acceptable levels of 199 to 3.2 x 10³ cfu/g.
Coagulase positive staphylococci (S. aureus) The presence of S. aureus at unsatisfactory levels may be indicative of poor personal hygiene by food handlers involved in the preparation of the sushi, and/or poor temperature control. The extensive handling normally associated with the preparation of sushi lends itself to contamination by food handlers if good hygienic practices are not implemented. This survey did identify 2 samples where unsatisfactory levels of S. aureus were present (1.2 x 10³ and 4.0 x 10³ cfu/g). These are well below levels to cause illness. No correlation could be made with food handling questionnaire responses and elevated levels of S. aureus.
Salmonella No Salmonella spp. were detected in any sushi samples tested in this survey. Most outbreaks in Australia associated with the consumption of sushi have been due to Salmonella spp. and investigations have found the use of raw egg mayonnaise on sushi a significant contributing factor (OzFoodNet unpublished data, 2008). Common sources of Salmonella such as poultry and eggs are frequently used as ingredients in sushi. It is therefore important that these ingredients are handled and cooked appropriately to minimise the potential for cross contamination with ready-to-eat foods in the preparation areas of sushi outlets.
Listeria monocytogenes L. monocytogenes was detected in a number of samples (26/850, 3.0%), although this prevalence is less than the previous survey conducted in the ACT, where the organism was found in 7/55 (12.7%) of samples (Millard & Rockliff, 2003). Despite no enumeration being undertaken in this survey, these results were categorised as unsatisfactory, with follow-up action taken at outlets where sushi samples were found to contain L. monocytogenes. Although levels of L. monocytogenes less than 100 cfu/g may be considered to be of low risk, according to the Recall Guidelines for Packaged Ready-to-eat foods found to contain Listeria monocytogenes at point of sale published by FSANZ (ANZFA, 2001b) the possibility of

Food handling practices and microbiological quality of sushi in Australia
15
infection from low numbers of L. monocytogenes, especially among the most susceptible population groups (young, old, pregnant, immunocompromised) cannot be discounted. Because sushi has such a short shelf life, the opportunities for L. monocytogenes to grow to higher number is limited, but it remains advisable for at-risk groups to avoid eating sushi products.
Vibrio parahaemolyticus Although no enumeration was undertaken for V. parahaemolyticus in this survey, its detection in one sample of sushi was considered a marginal result. The microbiological guidelines for ready-to-eat foods state the tolerance for this organism in raw seafood may be up to 102 cfu/g. V. parahaemolyticus is a naturally occurring organism in marine environments, being more prevalent during the warmer summer months. The primary control measure for V. parahaemolyticus is to prevent multiplication of the organism. The ICMSF suggests that dishes such as sushi containing raw seafood that will be consumed raw, should be held at less than or equal to 5°C at all times (ICMSF, 1996), causing the organism to gradually die. Under ideal conditions its doubling time can be extremely fast, in the order of 9-10 minutes (ICMSF, 1996), however under ambient storage conditions of 25°C the doubling time would be around 1 hour. As the infective dose to cause illness is quite high (~106 cfu/g), storage of sushi at room temperature can be safely undertaken, but should be limited to 4 hours in line with the ‘4-hour /2-hour rule’ as discussed in Safe Food Australia (ANZFA, 2001c)
Histamine Bacteria present on some fish species, such as tuna, sardines, mackerel, swordfish and marlin can convert the naturally occurring amino acid histidine in the fish into histamine. This may lead to histamine food poisoning (or Scromboid poisoning).The presence of histamine is normally an indicator of a failure in the cold chain and that the fish has been subject to elevated temperatures.
The low prevalence and low levels of histamine detected in this survey tends to indicate good temperature control of the fish used in the manufacture of sushi. A similar survey conducted by ACT Health in 1997 found a similar prevalence, with a single sample of tuna from 29 fresh fish samples containing detectable level of histamine.
9. Follow up action For all results considered unacceptable or potentially hazardous, follow-up action was undertaken by the respective food regulatory jurisdictions commensurate with the level of risk posed. Where the analysis of test samples indicated a level of bacteria with the potential to cause an adverse health risk, follow-up action included:
• investigation and inspection of the premises where the sushi was prepared to assess compliance with Food Standards Code requirements;
• subsequent testing of additional product to determine compliance with microbiological guidelines.
10. Conclusion Two of the most important control measures for ensuring the safe production of sushi involve using high quality ingredients and ensuring that sushi rice is cooled and acidified appropriately. Investigations into previous Australian outbreaks have found that bare hand contact by food handlers, temperature abuse and the use of raw egg mayonnaise to be significant contributing factors.
Response to the food handling questionnaire indicate a lack of control measures for cooling and acidifying cooked rice, and inadequate verification of the length of time sushi is displayed
Food handling practices and microbiological quality of sushi in Australia
16
out of temperature control. A lack of focus on these areas could potentially lead to hazardous levels of pathogenic organisms in the finished product. Although the majority of samples were categorised as acceptable, microbiological testing did indicate a significant increase in the number of marginal and unsatisfactory samples during the summer months, possibly due to a lack of time/temperature control during warmer temperatures.
The presence of Listeria monocytogenes in 3% of samples confirms the current risk management strategy of communicating that sushi is a high risk food that should be avoided by at-risk groups such as pregnant women.
Outlets wishing to display sushi out of temperature control should ensure that they are able to demonstrate compliance with Food Standards Code requirements. In addition to observing good hygienic practices during preparation, production, storage and transportation of sushi, acidification of cooked rice and cooling of cooked ingredients should be controlled and the highest quality ingredients should be used to minimise risk of microbial contamination.
Assistance from different state food regulatory jurisdictions is available in the form of guidelines and template food safety programs for sushi outlets intending to display sushi out of temperature control. There are two guideline documents that have been issued by state food jurisdictions, providing guidance for displaying sushi out of temperature control:
• Food safety guidelines for the preparation and display of sushi (NSW Food Authority, 2007) allows sushi to be displayed at temperatures greater than 5°C for no longer than 4 hours, provided businesses have a system in place for tracking display time. It is available from www.foodauthority.nsw.gov.au; and
• A supplement to the template food safety program by the Victoria Department of Human Services (Food Safety Victoria, 2004) specific to sushi allows nori (maki) rolls to be stored up to 12 hours and nigiri pieces to be stored up to 8 hours at temperatures at or below 15°C as part of a documented food safety program. The sushi supplement and record sheets are available from www.health.vic.gov.au
This survey has highlighted the key areas where food regulatory jurisdictions should focus future educational activities for food handlers involved in the preparation of sushi. In order to demonstrate compliance with Food Standards Code requirements, sushi businesses must ensure they have the basic tools for implementing systems of pH verification and recording the length of time sushi is on display. A follow-up survey in the future may be beneficial to re-assess the level of compliance and food safety skills and knowledge in sushi outlets.

Food handling practices and microbiological quality of sushi in Australia
17
11. References Adams, A.M., Leja, L.L., Jinneman, K., Beeh, J., Yuen, G.A., & Wekell, M.M. (1994). Anisakid
parasites, Staphylococcus aureus and Bacillus cereus in sushi and sashimi from Seattle area restaurants. Journal of Food Protection 57(4), 311 – 317.
ANZFA (Australia New Zealand Food Authority) (2001a). Guidelines for the Microbiological Examination of Ready-to-eat foods. Retrieved February 11, 2008 from FSANZ Web site: http://www.foodstandards.gov.au/_srcfiles/Guidelines%20for%20Micro%20exam.pdf
ANZFA (Australia New Zealand Food Authority) (2001b). Recall Guidelines for Packaged Ready-to-eat foods found to contain Listeria monocytogenes at point of sale. Retrieved February 11, 2008 from FSANZ Web site: http://www.foodstandards.gov.au/_srcfiles/Listeria%20Recall%20Guidelines.pdf#search=%22listeria%20recall%20guidelines%22
ANZFA (Australia New Zealand Food Authority) (2001c). Safe Food Australia - a guide to the Food Safety Standards. 2nd Edition. Commonwealth of Australia, Canberra.
Atanassova, V., Reich, F. & Klein, G. (2008). Microbiological quality of sushi from sushi bars and retailers. Journal of Food Protection 71(4), 860 – 864.
Fang, T.J., Wei, Q.K., Liao, C.W., Hung, M.J., & Wang, T.H. (2003). Microbiological quality of 18°C ready-to-eat food products sold in Taiwan. International Journal of Food Microbiology, 80, 241 – 250.
Food and Environmental Hygiene Department HKSAR (2000). Risk Assessment Studies Report No. 2 Microbiological Hazards Evaluation. Sushi and Sashimi in Hong Kong. Retrieved February 11, 2008 from http://www.fehd.gov.hk/safefood/report/sashimi/ss_ras2_eng.pdf
Food Safety Victoria. Histamines in fish. Retrieved February 11, 2008. from Health Victoria Web site: http://www.health.vic.gov.au/foodsafety/downloads/histamines_summary.pdf
Food Safety Victoria (2002). Effect of Storage Conditions on Histamine Formation in Fresh and Canned Tune. Retrieved May 2, 2008 from Health Victoria Web site:
http://www.health.vic.gov.au/foodsafety/downloads/histamines_fishstorage2002.pdf
Food Safety Victoria (2004). Food Safety Program Template for Food Service and Retail Businesses (edition 1.1) – Supplement B Sushi. Retrieved May 2, 2008. from Health Victoria Web site:
http://www.health.vic.gov.au/foodsafety/downloads/fsp_supp_sushi.pdf
Food Standard Australia New Zealand (2008). Australia New Zealand Food Standards Code. Retrieved March 20, 2008 from Food Standard Australia New Zealand Web site: http://www.foodstandards.gov.au/_srcfiles/FSC_Standard_2_2_3_Fish_v88.pdf
ICMSF (1996). Microorganisms in Food 5. Microbiological specifications of food pathogens. International Commission on Microbiological Specifications for Foods. Blackie Academic & Professional, London.
Millard, G. & Rockliff, S. (2003). Microbiological Quality of Sushi. ACT Department of Health. Retrieved February 11, 2008 from ACT Health Web site: http://www.health.act.gov.au/c/health?a=da&did=10060511&pid=1094601516
NSW Food Authority (2006). Controlling histamine fish poisoning [Fact Sheet]. Sydney, NSW Food Authority.
NSW Food Authority (2006). Temperature Control of Sushi – A technical report on predicting microbial growth in sushi stored at various temperature.
NSW Food Authority (2007). Food Safety Guidelines for the Preparation and Display of Sushi.

Food handling practices and microbiological quality of sushi in Australia
18
Rigg, A. (1997). Biogenic amines in fish and fish products. Retrieved February 11, 2008 from ACT Health Web site: http://health.act.gov.au/c/health?a=da&did=10017393&pid=1053607839
Snyder, O.P. (2000). Sushi rice HACCP. Hospitality Institute of technology and Management, Minnesota. Retrieved March 20, 2008 from HITM Web site: http://www.hi-tm.com/Documents2000/Sushi-flow-p1.html
University of Florida (2004). Guidance for processing sushi in retail operations. Retrieved March 20, 2008 from Association of Food and Drug Officials Web site: http://www.afdo.org/afdo/upload/Sushi.pdf
University of Melbourne (1999). Challenge tests on selected ready-to-eat foods. Report by the Microbiological Diagnostic Unit, The University of Melbourne for Department of Human Services (Victoria).

Food handling practices and microbiological quality of sushi in Australia
19
12. Attachments Attachment A: Food handling questionnaire for sushi businesses
Attachment B: Summary of questionnaire responses

Attachment A
20
Food Handling questionnaire for sushi businesses
Food Officer Details Name: Company represent: If local council, please specify: Date of survey: Time:
Food Business Surveyed: Trading name of business: Address: Suburb: Describe location (e.g. inside shopping centre, outside etc) Contact Person: Type of premises: sushi bar sushi train Trading times: Food business's number (assigned by jurisdiction e.g. SA1)
Questions -- Please tick/circle the appropriate answer Q1 What proportion of sushi is prepared on site? 0% 25% 50% 75% 100% Question 2 to 6 is for those retailers that prepare sushi on site. Q2 a Where do most of the raw fish/seafood from? - fish market - vendor - importer - other
b Where do you get your ingredients (listed below) from?
cooked onsite
cooked off site
bought pre-made
Do not use ingredients
cooked chicken (including chicken teriyaki/katsu)
egg omelette
prawn tempura
crab stick/seafood extender
Other (specify):

Attachment A
21
Q3 Rice preparation. Is vinegar used in the sushi rice? Yes No What form of vinegar is being used? liquid powder
What percentage of acetic acid is present in the vinegar?
(standard vinegar contains 4% of acetic acid) What is the recipe of sushi rice?
rice (g or cup): vinegar (ml or spoon): sugar (g or cup): salt (g or spoon): other ingredients (when applicable) (g):
Q4 pH measurement Is the pH of rice measured? Yes No N/A (N/A for premises that do not acidify rice or obtain rice from supplier) If Yes, how does the pH get measured?
test
strips pH probe other Q5 Rice storage How far in advance does the rice get cooked before it is used? < 1 hr 1 - 2 hr 2 - 4 hr 4 - 8 hr > 8 hr How does rice get stored before it is used in sushi making? - refrigerator fridge temp: - room temperature - open container - room temperature - closed container
If possible, measure room temp:
- warm (inside rice cooker) - other - specify What happens to remaining sushi rice at closing? - discarded
- stored for the next day If stored, how do you store it? (fridge, room temperature?)
- given away - used in other product - other - specify Q6 Where is sushi being prepared? near display enclosed kitchen

Attachment A
22
Question 7 to 10 are for all retail outlet Q7 a For sushi bars: How is sushi displayed when it is ready to sell?
- room temperature, pre-packaged
- room temperature, un-packaged
- chilled display cabinet, pre-packaged Temp of display cabinet:
- chilled display cabinet, un-packaged
- enclosed refrigerator
- other - specify
b For sushi train restaurant: How does sushi being displayed? - covered - uncovered Q8 What is the maximum time of sushi being displayed? < 1 hr 1 - 2 hr 2 - 4 hr 4 - 8 hr > 8 hr
Q9 Can the business identify how long sushi has been displayed?
Yes No
How does the business know how long the sushi has been in display?
- colour coded stickers - date/time stamp - different pattern of plates Other (please specify)
Q10 What happens to unsold/left over sushi at closing? - discarded
- stored for the next day If stored, how do you store it? (fridge, room temperature?)
- given away - used in different product - other - specify

Attachment B
Summary of questionnaire responses State in which the sushi outlet located Response Percent Response Count
NSW SA NT
67.2% 29.9% 3.0%
45 20 2
Answered question Skipped question
67 2
Describe location Response Percent Response Count
Inside a shopping centre On the street Stand alone shop
66.2% 29.2% 4.6%
43 19 3
Answered question Skipped question
65 4
Type of premises Response Percent Response Count Sushi 'bar' Sushi 'train'
81.2% 18.8%
56 13
Answered question Skipped question
69 0
1. What proportion of sushi is prepared on site? Response Percent Response Count
0% 25% 50% 75% 100%
4.5% 1.5% 0.0% 6.0% 88.1%
3 1 0 4 59
Answered question Skipped question
67 2
2a. Where do most of the raw fish/seafood from? Response Percent Response Count
Fish market Vendor Importer Other
45.3% 46.9% 1.6% 12.5%
29 30 1 8
Answered question Skipped question
64 5
2b. Where do you get your ingredients (listed below) from?
Cooked onsite
Cooked offsite
Bought pre-made
Do not use ingredients
Total Responses
Cooked chicken (teriyaki / katsu) Egg omelette Prawn tempura Crab stick / seafood extender
76.2% 56.1% 68.3% 43.5%
48 32 43 10
19.0% 14.0% 22.2% 47.8%
12 8 14 11
4.8% 10.5% 6.3% 8.7%
3 6 4 2
0.0% 19.3% 3.2% 0.0%
0 11 2 0
63 57 63 23
Answered question Skipped question
64 5

Attachment B
3. Rice preparation Is vinegar used in the sushi rice? Response Percent Response Count Yes No
96.9% 3.1%
62 2
Answered question Skipped question
64 5
What form of vinegar is being used? Response Percent Response Count Liquid Powder
98.3% 1.7%
58 1
Answered question Skipped question
59 10
What percentage of acetic acid is present in the vinegar? Response Percent Response Count
Answered question Skipped question
33 36
What is the recipe of sushi rice? Response Percent Response Count
Rice (g or cup) Vinegar (mL or spoon) sugar (g or cup) Salt (g or spoon) other ingredients (when applicable)
97.1% 74.3% 65.7% 60.0% 5.7%
34 26 23 21 2
Answered question Skipped question
35 34
4. pH measurement Is the pH of rice measured? Response Percent Response Count
Yes No Not applicable
9.7% 82.3% 8.1%
6 51 5
Answered question Skipped question
62 7
If Yes, how does the pH get measured? Response Percent Response Count
Test strips pH probe Other
16.7% 66.7% 16.7%
1 4 1
Answered question Skipped question
6 63

Attachment B
5. Rice storage How far in advance does the rice get cooked before it is used? Response Percent Response Count
Less than 1 hour 1 - 2 hours 2 - 4 hours 4 - 8 hours more than 8 hours
21.9% 54.7% 12.5% 9.4% 1.6%
14 35 8 6 1
Answered question Skipped question
64 5
How does rice get stored before it is used in sushi making? Response Percent Response Count
Refrigerator Room temperature - open container Room temperature - closed container Warm (inside rice cooker) Other (please specify)
40.6% 7.8% 32.8% 7.8% 10.9%
26 5 21 5 7
Answered question Skipped question
64 5
What happens to remaining sushi rice at closing? Response Percent Response Count
Discarded Stored for next day Given away Used in other product Other (please specify)
85.9% 10.9% 0.0% 0.0% 3.1%
55 7 0 0 2
Answered question Skipped question
64 5
6. Where is sushi prepared? Response Percent Response Count Near display Separate, enclosed kitchen
68.3% 31.7%
43 20
Answered question Skipped question
63 6
7a. For sushi bars: How is the sushi displayed when it is ready to sell? Response Percent Response Count
Room temperature, pre-packaged Room temperature, un-packaged Chilled display cabinet, pre-packaged Chilled display cabinet, un-packaged Enclosed refrigerator Other (please specify)
0.0% 1.8% 64.3% 26.8% 0.0% 7.1%
0 1 36 15 0 4
Answered question Skipped question
56 13
Temperature of display cabinet Response Percent Response Count
Answered question Skipped question
52 17

Attachment B
7b. For sushi train: How is sushi displayed when it is ready to sell? Response Percent Response Count Covered Uncovered
92.9% 7.1%
13 1
Answered question Skipped question
14 55
8. What is the maximum time of sushi being displayed? Response Percent Response Count
Less than 1 hour 1 - 2 hours 2 - 4 hours 4 - 8 hours more than 8 hours
7.5% 11.9% 53.7% 25.4% 1.5%
5 8 36 17 1
Answered question Skipped question
67 2
9. Can the business identify how long sushi has been displayed? Response Percent Response Count Yes No
43.3% 56.7%
29 38
Answered question Skipped question
67 2
How does the business know how long the sushi has been on display? Response Percent Response Count
Colour coded stickers Date/time stamp Different pattern of plates Other (please specify)
20.7% 0.0% 10.3% 69.0%
6 0 3 20
Answered question Skipped question
29 40
10. What happens to leftover sushi at closing? Response Percent Response Count
Discarded Stored for next day Given away Used in other product Other (please specify)
88.1% 0.0% 7.5% 0.0% 4.5%
59 0 5 0 3
Answered question Skipped question
67 2