report on european private pension schemes: … · financial stability board . regional...
TRANSCRIPT

Financial Stability Board
Regional Consultative Group for Europe
Working Group on Private Pension Schemes Resilience
Report on European Private Pension Schemes: functioning, vulnerabilities
and future challenges
Notice
This document has been prepared by the Financial Stability Board (FSB) Regional Consultative Group for Europe (RCG-E) and is being published to disseminate information to the public. The views expressed in the document are those of the RCG-E and do not necessarily reflect those of the FSB.
The RCG-E comprises FSB-Member authorities as well as non-FSB member authorities. The Regional Consultative Groups (RCG) have been established as a mechanism for the FSB to consult with non-member jurisdictions and for the RCG members to share amongst themselves and the FSB views on vulnerabilities affecting the financial system, FSB policy initiatives and on other measures to promote financial stability.
A list of members of the RCG for Europe can be found at http://www.fsb.org/wpcontent/uploads/rcgeurope.pdf and the list of members of the WGPS can be found at Annex 5 of this Report.
17 October 2017

2
Report on European Private Pension Schemes: functioning, vulnerabilities and future challenges FSB RCG-E Working Group on Private Pension Schemes Resilience

3
Contents Executive summary ................................................................................................................................. 6
1. Stocktake of RCG-E Private Pension Schemes and Products ............................................................ 11
1.1 Introduction .................................................................................................................................... 11
1.1.1 Objective and deliverables ................................................................................................... 11
1.1.2 FSB RCG-E questionnaire on stocktaking exercise ............................................................... 11
1.1.3 Overview of the data collected ............................................................................................ 12
1.2 Size and nature of private pension products .................................................................................. 14
1.2.1 Assets under management .................................................................................................. 15
1.2.2 Members and contracts ....................................................................................................... 16
1.2.3 Occupational pension schemes and personal pension products......................................... 18
1.2.4 Scheme type ......................................................................................................................... 21
1.2.5 Providers .............................................................................................................................. 23
1.3 IORPs and other pension providers ................................................................................................ 24
1.3.1 IORPs ........................................................................................................................................ 24
1.3.1.1 General information.......................................................................................................... 24
1.3.1.2 Cash flows and funding position ....................................................................................... 27
1.3.1.3 Investment allocation ....................................................................................................... 29
1.3.2 Other pension providers .......................................................................................................... 34
1.3.2.1 General information.......................................................................................................... 34
1.3.2.2 Cash flows and funding position ....................................................................................... 36
1.3.2.3 Investment allocation ....................................................................................................... 36
2. Stocktake of regulatory initiatives .................................................................................................... 39
2.1 Introduction ................................................................................................................................ 39
2.2 Directive on the activities and supervision of institutions for occupational retirement provision (IORP) ................................................................................................................................................ 40
2.2.1 Prudential provisions of IORP II ........................................................................................... 41
2.2.2 Information to members and beneficiaries ......................................................................... 42
2.2.3 Prudential supervision of IORPs ........................................................................................... 42
2.2.4 Explicit reference to financial stability in IORP II ................................................................. 42
2.3 Directive on the taking-up and pursuit of the business of Insurance and Reinsurance (Solvency II) ....................................................................................................................................................... 42
2.4 Regulation on OTC derivatives, central counterparties and trade repositories (EMIR) ............. 45
2.5 International Accounting Standard 19 (IAS 19) .......................................................................... 47

4
2.6 Directive on the protection of employees in the event of the insolvency of their employer .... 47
2.7 Directive for establishing a framework for the recovery and resolution of credit institutions and investment firms (BRRD) ............................................................................................................ 48
2.8 Regulation on Packaged retail and insurance-based investment products (PRIIPs) .................. 50
2.9 Directive on Insurance Distribution (IDD) ................................................................................... 51
2.10 Capital Markets Union (CMU) ................................................................................................... 52
3. Risks and vulnerabilities to and from funded private pension schemes .......................................... 54
3.1 Potential impact of private pension schemes on financial stability ........................................... 54
3.1.1 Introduction ......................................................................................................................... 54
3.1.2 Private pension schemes and financial stability .................................................................. 56
3.2 Analysis of risks and stabilizing factors: FSB RCG-E Survey results ............................................. 62
3.2.1 The FSB RCG-E Survey design ............................................................................................... 62
3.2.2 The main risks factors for financial stability ........................................................................ 64
3.2.3 Overall risk assessment (all risks/all countries) ................................................................... 76
3.3 Transmission mechanisms from private pension schemes to financial stability and real economy ........................................................................................................................................... 82
3.4 Future challenges ........................................................................................................................ 88
Annex 0: Case Studies ........................................................................................................................... 93
A.0.1. The Automatic Enrolment programme in the UK ................................................................... 93
A.0.2. Long term guarantees, low interest rates and the insolvency of the Norwegian life insurance company Silver .................................................................................................................................. 98
Annex 1: Glossary ................................................................................................................................ 103
Annex 2: Overview of pension categories/products in the RCG-E area and main statistics .............. 105
Annex 3: Survey’s replies .................................................................................................................... 119
A.3.1 Some statistics on the coverage of the survey’s replies ........................................................ 119
A.3.2 Some statistics on the coverage of the survey’s replies ........................................................ 120
A.3.3 Description of risk factors and stabilizing factors .................................................................. 122
Annex 4. Methodological issues and additional results ..................................................................... 127
A.4.1 Aggregation methods for multiple country replies ............................................................... 127
A.4.2 Risk factors' impact on financial stability – country’s replies ................................................ 128
A.4.3 Expected impact on the economy from the main risk factors .............................................. 130
A.4.4 Impact of stabilizing factors on the risk assessment ............................................................. 131
Annex 5. List of Members of the FSB RCG–E Working Group on Private Pension Schemes Resilience ............................................................................................................................................................ 133

5

6
Executive summary
Objective
Pensions are a cornerstone of the economy. Countries’ future standard of living and ability to grow depend in great part on the capacity to build up effective, affordable and sustainable pension systems.
At the present time, the financial sustainability of pension systems is increasingly becoming a central issue for households and governments in Europe. The ageing population needs to be provided with a secure source of income for a longer retirement period than in the past. This demographic trend directly impacts the financial equilibrium of traditional pay-as-you-go pension systems based on intergenerational solidarity. Furthermore, the elevated unemployment and the current situation of public finance in some jurisdictions provide further challenge to the sustainability of State pension systems, forcing governments to amend their institutional arrangements and households to increasingly rely on private supplementary pension schemes to maintain adequate retirement income. Yet, the current macroeconomic environment and the low level of interest rates in Europe prove particularly challenging for the entities operating these private pension schemes such as pension funds and life insurers. Finally, these pension providers are key institutional investors, playing an important role in channelling savings to long-term investment. This role - while maintaining the primary objectives of protecting the rights of policyholders and ensuring the stability and soundness of providers and the market as a whole - deserves attention in the current context of on-going regulatory reforms.
The interest of the FSB RCG-E for the functioning and resilience of private pension systems1 concerns their possible interconnectedness with the financial system as a whole and the real economy. Besides, private pension schemes play very diverse roles across Europe and some schemes might be more vulnerable than others in the face of the threats mentioned above. The close links between pension systems, public debt, financial stability and long-term economic growth may bring a systemic dimension to this issue, especially due to its large dimension in some markets and potential concentrated investment allocations across the sector. Financial and economic instability might lead to a change in pension providers’ investments and the funding behaviour of defined benefit (DB) schemes. Additionally, in those countries where pension providers have a heavy equity exposure, the funding level of DB schemes is worst after sharp falls in stock markets and this is just when corporate bankruptcies are likely to peak. As a result, member’s welfare in these countries could be reduced due to lower benefits from DB schemes in the absence of sponsor support and/or pension protection schemes as well as from defined contribution (DC) schemes after a fall in stock markets. Depending on the size of the private pension market this may have an impact on the real economy or governments could decide to bail out the pension providers thereby increasing public debt. Therefore, close monitoring of the pensions sector from financial stability perspective is warranted, especially as its size and role tend to increase over time. At the same time, the current demographic developments (i.e. increasing longevity) and economic environment (i.e. low interest rates) presents an unprecedented opportunity for an in-depth rebalancing of some pension systems to the benefit of financial sustainability. Indeed, pension providers have a high average liability duration making them
1 Occupational and personal pension products, excluding pay-as-you-go-pensions.

7
natural long term investors with limited short term liquidity needs. Hence, well-managed pension providers have the potential to have a stabilizing influence on volatile financial markets given their potential to invest countercyclical and to provide substantial support to the real economy by investing in assets such as equity, property or infrastructure while complying with investment provisions.
In this context, this FSB RCG-E report provides a mapping of the various categories of private pension schemes in RCG-E countries and an analysis of the potential vulnerabilities arising from each category. This should constitute a solid basis for discussions on the features characterizing pension schemes that may impact the functioning and the stability of the financial system and therefore the real economy, along with possible ways to improve their robustness, resilience and efficiency.
Approach
To gather evidence needed to support the analysis, a survey was launched to the FSB RCG-E countries. A first section of the survey was built on EIOPA’s database on Pension Plans and Products in the EEA and EIOPA’s Occupational Pension Statistics. A second part of the survey included a qualitative risk assessment of the private pension sector. It aimed to identify the main risks net of stabilizing factors that may affect providers, sponsors and members of private pension schemes and, more broadly, may affect the financial system and the real economy in a ten years horizon. Respondents to the survey were experts from supervisory authorities including Treasuries and national central banks. It should be noted that the first section of the report only covers pension schemes/products and providers for which respondents provided data.
Heterogeneous private pension market
The data presented in the first section of the report covers 184 funded private pension product categories from 22 countries. These products account for at least 8.1 trillion euro of assets under management (around 50 percent of the GDP on average) and cover at least 193 million members and beneficiaries or contracts. However, there are significant differences in terms of coverage across RCG-E countries as private pensions’ importance and features are often defined nationally, in line with their pension design, regulations and traditions. Private pension products include both occupational and personal pension products. 62 percent of the total assets under management relate to occupational pension schemes, 9 percent to personal pension products and schemes and 29 percent to products that could be classified as both occupational and personal. Institutions for Occupational Retirement Provision (IORPs) account for 36 percent of the total assets and the remaining 64 percent consist of non-IORPs such as insurance companies (48%), pension funds not applying the IORP Directive (5%) and other providers (11%) such as banks and asset managers. For those entities where data was available, investments were mainly allocated to traditional assets such as debt and other fixed income securities and equity. The share of debt and other fixed income further increased in the aftermath of the financial crisis at the expense of investments in equity. However, some opposing trends were recently identifiable in a number of countries. Survey results also showed that IORPs had a tendency to invest more in equity than other

8
pension providers while differences in asset allocation were more correlated to national investment cultures than to differences in scheme type (Defined Benefit (DB) or Defined Contribution (DC)). Nevertheless, the diversity of the pension sector and different data availability - depending on the reporting country and the type of pension provider - make it challenging to obtain a comprehensive picture of the pensions market to fully appreciate its financial stability implications. In addition, most data available is the result of the needs of supervisory authorities to oversee the functioning of pension providers according to their national legislation and, for some types of providers, according to EU legislation. However, for purposes of financial stability analysis other and/or more granular data might be needed.
Different regulations for EU private pension products
A second section of the report sets out the factual content of the various regulatory initiatives at international level that have or may have an impact on the private pension sector of the FSB RCG-E jurisdictions. The majority of the regulatory initiatives covered in this part of the report are European Union initiatives, which apply to the vast majority of, but not all, the RCG-E countries. Additionally, RCG-E jurisdictions often have supplementary or complementary national regulatory initiatives with regard to private pension schemes, which are not covered in this report. For many occupational pension schemes, the EU Directive on the activities and supervision of Institutions for Occupational Retirement Provision (IORP I/II) establishes minimum valuation standards and funding requirements which can be further specified at the national level. For personal pension schemes or products, there exists no European product regulation and these products are mostly regulated at a national level.
This section shows that private pension products are mainly regulated by provider type, rather than by product category. As such, pension products provided by IORPs are regulated according to the IORP I/II Directive, pension products by insurers according to the Solvency II Directive while pension products provided by other providers such as banks and assets managers are often regulated by respectively the Capital Requirements Directive (CRD) or the Undertakings for Collective Investment in Transferable Securities (UCITS) Directive.
For products not covered by any EU regulation, for example, personal pension products regulated at national level, these Directives are sometimes also taken as informal reference for national legislation. In this field, the European Commission has adopted on June 29 a proposal for regulation of a Pan-European Personal Pension Product (PEPP)2. As referred in the Explanatory Memorandum of this proposal, it aims at providing simple, transparent and high quality options to save for retirement, reducing barriers to the provision of pension services across borders and increasing competition between pension providers.
Pension risk factors might affect financial stability and real economy
The survey aimed to identify the main risks net of stabilizing factors which may affect especially the financial system in a ten years horizon. It showed that in the assessment of supervisory authorities based on expert’s judgement, the major risk factors for financial stability are closely related to the
2 Proposal for a Regulation of the European Parliament and of the Council on a pan-European Personal Pension Product (PEPP), 2017/0143 (COD).

9
(current) economic and financial environment, regardless of the scheme type. These can adversely impact investment returns and capital accumulation, leading to an increase in funding costs or, inversely, endangering the value of pension benefits. However, the role of stabilizing factors and the slow and gradual materialization of pension risks may enable regulators and supervisors to mitigate the impact of these risks on financial stability. Taking these stabilizing effects into account, respondents broadly indicated possible financial stability impact of risk factors for about one third of the pension schemes or products. The impact tends to be higher at micro-level (such as sponsors and plan members) than the impact on the macro-economic environment. This lower risk at macro level may reflect the relative small dimension of the pension sector in several countries and the role played by stabilizing factors in the transmission mechanisms. On average, almost half of the European population has access to private pension schemes and their aggregated assets represent around 50% of GDP which have been increasing over the past decade. This implies that risks faced by the pension’s sector are not negligible for the economy as a whole and therefore also relevant for other sectors.
Indeed, adverse developments may lead to sponsors, in particular of large DB schemes, having to reassess capital expenditure plans and to disruptions in the provision of long-term financing to the economy as a whole, not only through a potential reallocation of assets in the households' portfolios as a result of increasing contributions and/or the reduction of benefits, but also by a potential reallocation of assets by pension providers impacting the counterparties of the pension provider (through buying/selling assets). This has implications not only for financial stability but also for the real economy as well. Both persistent low interest rates and higher life expectancy were perceived by respondents as the main risk factors to financial stability. Persistent low interest rates reduce the profitability of investments (DB and DC schemes) and increase the present value of liabilities (in the case of DB schemes). In DB schemes, a fall in interest rates and a flat yield curve result in a decrease of the funding ratio3 and may lead to deficits. If the low interest rate environment persists, sponsors or providers may be called to reinforce contributions to the scheme or pay funds to reduce/eliminate the potential negative impact of the low-interest rate. Pension benefits might be cut down if sponsor support and/or pension protection schemes are absent. Reinvestment risk emerges, which can incentivize a search for yield behaviour.
Higher life expectancy increases the risk that pension providers and/or sponsors may suffer an additional financial gap pressure between the expected and the actual duration in retirement. In both cases, providers and sponsors may transfer risk to other financial intermediaries, increasing the interconnectedness within the financial sector or alleviate some of these vulnerabilities by shifting the risks to the members.
Finally, low interest rates and ageing population also tend to act as a disincentive to the accumulation of pensions savings and aggregate demand might increase now but fall in the future, with the respective implications in terms of aggregate investment and potential economic growth. Equally, savings could move away from pension products into different products. However, tax incentives and possible supplements may play a role in households’ decisions to allocate their savings to voluntary pension schemes and thus potentially reduce the risk of poverty in retirement and related burden on
3 See definition in Annex 1. Glossary.

10
State budgets. In the future, the maintenance of multi-pillar pension systems, where funded pension plans complement PAYG public schemes in providing retirement income and thus diversifying the risk can be also advisable to promote the stabilizing role of the pension systems.

11
1. Stocktake of RCG-E Private Pension Schemes and Products
1.1 Introduction Pensions are a cornerstone of the economy. Countries’ future standard of living and ability to grow depend in great part on the capacity to build up effective, affordable and sustainable pension systems. These represent a significant portion of countries’ public finances either directly or through the sponsorship of the State by offering tax reductions and further support. Pension systems are traditionally organised in three pillars – the public system, complementary occupational pensions and personal pensions. The latter two are considered private pensions and as such are covered in the context of this exercise. Such a multi-pillar system has the advantage of diversifying risks, since the factors that affect labour and retirement variables, and hence the first pillar, are not perfectly correlated with factors that affect financial variables, which mainly determine the performance of second and third pillar retirement systems. However, the importance of public and private pension varies significantly across countries. Private pension products can be offered by a variety of provider types: multi or single employer pension funds, life insurance companies, banks, asset managers, autonomous pension funds, etc. Their structure and characteristics are often determined at the country level taking account of the national pension design, regulations and traditions (see Annex 2).
1.1.1 Objective and deliverables This section of the report follows from the mandate to carry out a stock taking exercise of the distribution of the various categories of private pension schemes and products across the FSB RCG-E jurisdictions, building on the existing work. This initial inventory should include a mapping and ranking by nature of private pension schemes and products, including by size of assets and liabilities, by volumes of pensions paid, by size of population concerned, by market concentration and by category of investors. Almost all private pension products are funded pension products. However, there exist products where part of the second pillar complementary pension scheme is based on the pay-as-you-go principle. Pay-as-you-go products and public schemes are not included in this report4.
1.1.2 FSB RCG-E questionnaire on stocktaking exercise A survey was launched to the FSB RCG-E members to better understand the various categories of private pension schemes and products across RCG-E jurisdictions.
4 Public pension schemes were not considered for this purpose, because their potential externalities and challenges are expected to be more related to a fiscal and macroeconomic perspective (impact on social welfare, recourse to public support in growing debt environment, burden on potential growth, etc.) than to a financial stability one.

12
A first part of this survey was built on European Insurance and Occupational Pensions Authority (EIOPA)’s database on Pension Plans and Products in the EEA5. The EIOPA database on pension plans and products in the EEA is the most extensive pension database at EU level, though incomplete in terms of quantitative information. The results of this section of the survey are described in this chapter of the report. Due to the limited data available for all pension providers, a complement to the survey was developed, based on EIOPA’s occupational pension statistics6 but adding more detail to the asset categorisation, a split by scheme type and issuing countries of the assets. This survey was requested to be completed by Institutions for Occupational Retirement Provision (IORPs), as included in EIOPA’s occupational pension statistics and for which a lot of information was already available, as well as other providers of pension products. In this context, the category ’other pension providers’ encompasses pension funds not covered by the IORP Directive, insurance companies, collective investment funds, banks, asset managers, etc.7 All data were requested as of 2014, unless specified differently.
1.1.3 Overview of the data collected8 The data collected provides an overview of the nature of the private pension sector in terms of general classification (occupational, personal), by scheme type (defined contribution (DC), defined benefit and others (DB))9 and by the providers of private pension products or schemes. Furthermore, the information collected provide further insights in the size of assets and liabilities, the volumes of pensions paid and the population concerned. It has to be borne in mind that the analysis below and in the next sections of this chapter takes into account only those pension products and providers for which respondents provided data. Furthermore, all data refers to funded private pension products10 and the main results are:
• 22 countries11 reported 184 funded private pension product categories.
5 https://eiopa.europa.eu/Pages/Supervision/Database-of-pension-plans-and-products-in-the-EEA.aspx Note that the survey follows the classification of the EIOPA’s database and also includes pension products that in some countries are considered as life insurance. 6 Collected in the context of EIOPA's biannual financial stability reports and the annual market development report on occupational pensions and cross-border IORPs. 7 See Glossary in Annex 1. 8 The data collected included some prefilled fields based on what was already available at EIOPA. 9 See Annex 1. In this report, for practical reasons, the distinction by scheme type is only made between these two categories. 10 Meaning that data for pension regimes based on a pay-as-you-go principle or book reserves and data for first pillar pensions (also called State pensions) were excluded. 11 No response to the survey was received from Greece and Luxemburg. In the case of Luxembourg, the granularity of information asked for by the survey was not available as the private pension schemes represents only a marginal portion of the Luxembourg pension system as a whole. However, as both countries were also included in the EIOPA database on pension plans and products, some data is included for these countries.

13
o 46 percent of the private pension products/schemes are provided by insurance companies, 37 percent by pension funds12 and 17 percent by other providers.
o 68 percent relate to occupational pension schemes, 30 percent to personal and 2 percent to both.
• Those 184 private pension product categories account for at least 8.1 trillion euro of Assets under Management (AuM), representing about 50 percent of the GDP on average, but with high dispersion.
• Those 184 private pension product categories account for at least 193 million members and contracts (close to 50 percent of the population on average, but with high dispersion and including double counting13).
• In 2014, those 184 pension product categories paid at least 220 billion euro in benefits and collected at least 298 billion euro in contributions.
• DC schemes are the largest in terms of number of members/contracts but DB represent the majority in terms of assets, covering almost 88 percent of the total AuM in the case of the occupational schemes.
IORPs count for 36 percent of the total AuM, where available. The remaining 64 percent consisted of non-IORPs such as insurance companies (48 percent), pension funds not applying the IORP Directive (5 percent) and others (11 percent) such as banks and asset managers. From those 63 percent non-IORPs, the asset allocation was available for about half of the AuM (34 percent). For IORPs and other pension providers, where the asset allocation could be determined, the following observations may be made:
• Those entities mainly invest in traditional assets: debt and other fixed income securities, and equity.
• After the financial crisis, the share of debt securities and other fixed income increased (but changing trends identifiable in a number of countries).
• Differences in asset allocation are more correlated with countries than with scheme types14. • Compared to IORPs, other pension providers for which data on the asset allocation was
available (mostly DC) show a lower share of equity and a higher share in debt and other fixed income securities.
The diversity of the pension sector across countries covers advanced life stage needs through a panacea of products, providers and rules. This makes it challenging to assess the dimension and relevance of the pension sector at the European level. This stocktaking exercise showed that quantitative data gaps (see also Annex 3.1) remain in terms of data quality and granularity:
• Information on the amount of assets and number of members or contracts is available for nearly 2/3 of the private pension products. As a result, the figures on total AuM mentioned in this report do not cover the whole private pensions market. About half of the products for which no further information was available are life insurance products. The other half is related to providers subject to the UCITS Directive, the CRD or subject to local legislation.
12 Both IORPs and those pension funds that do not apply the IORP Directive. 13 Individuals can be members of one or more schemes and can hold multiple pension contracts. 14 However, DB are relatively more exposed to equity than DC plans.

14
• The information available on liabilities, contributions received and benefits paid covers 60 percent of the private pension products. About half of the information missing stems from life insurance undertakings, a quarter relates to pension funds (whether or not subject to the IORP Directive) and the remaining quarter relates to products subject to the UCITS Directive, the CRD or subject to local legislation.
• The information available on asset allocation refers to 2/3 of the total AuM and covers 41 percent of the private pension products. The availability of the asset allocation was split equally between IORPs and ‘other pension providers’. In the case of IORPs, the asset allocation was provided for nearly 100 percent of the total IORPs’ assets reported. For ‘other pension providers’, this was the case only for half of the products where assets could be reported.
• For 79 percent of the total AuM there is no information available on counterparties of the assets. Issuing countries were reported by six countries for IORPs and by three countries in the case of ‘other pension providers’.
Pension data availability varies substantially depending on the reporting country and the type of pension provider. For example, pension products provided by insurance companies, banks and asset managers are often covered in general statistics on these providers, but not separately shown for the particular pension schemes or products. Supervisory and reporting requirements also focus on the provider perspective rather than on the product/scheme perspective. As a result, pension data is not available, fragmented or difficult to exploit for all pension schemes and products. In addition, information is reported in various different manners by country or even by product category. For example, the number of members was reported by some countries for some products, whereas for other products, or by other countries, the number of contracts was reported. Therefore, when interpreting and comparing the data it has to be borne in mind that respondents may have different interpretations of pension definitions with varying characteristics and different reporting and validation standards. It has to be stressed that most data available is the result of the needs of supervisory authorities to supervise the functioning of the respective pension providers according to their national legislation and, for some types of providers, according to EU legislation. However, for purposes of financial stability analysis other and/or more granular data might be needed, such as the reporting of pension liabilities and corresponding assets disclosed separately from other products, because pension products often have a different duration than other products and the impact of the financial stability risks often depends on the type of product. The merits of any additional information collection should be assessed against its costs.
1.2 Size and nature of private pension products In the RGC-E countries, private pensions have presented on average an increasing importance over the last 15 years, almost doubling households’ entitlements as a percentage of GDP (Figure 1.1).

15
Figure 1.1. Private pension funds’ entitlements of households
Note: Greece and France did not report on these variables and the figures for Iceland (from 2003 onwards) for Pension funds entitlements correspond to total assets on “Insurance, pension and standardised guarantees”. Data for Israel only from 2009 onwards. The drop in 2008 of pension funds as a percentage of GDP reflects mainly the valuation effects (as these assets are in general valued at market prices) in a context where, on average, GDP was still in an upwards trend.
Source: OECD DB (SNA2008 Financial Accounts, balance sheet data).
On the other hand, private pensions are characterised by high heterogeneity among the RCG-E jurisdictions. As shown in table in Annex 2, RCG-E countries have reported 184 different categories of pension products with divergent product characteristics varying between two to 25 product categories per country. An overview of the private pension schemes or products in their several dimensions is presented in this section. It takes into account all funded pension schemes/products reported but focuses on a limited number of key features such as assets under management, number of members, the scheme type and type of providers. Information on the investment allocation is included in the next section of the report based on the data received from IORPs and other pension providers for which the asset allocation was available. Note that this characterisation is based on the survey’s replies and therefore not complete15.
1.2.1 Assets under management
In total the 184 product categories amounts to at least 8.1 trillion euro of AuM. The size of AuM varies significantly across RCG-E countries. The importance of private pension products in a country’s pension system is often linked to the strength of the first pillar. If the first pillar provides the main retirement income, then private pension schemes or products are generally less developed, whereas the opposite is true when only partial retirement income is provided by the first pillar. In addition, the valuation criteria - market or statutory values - depends also on the reporting country.
15 For details on the coverage of the replies, please see Annex 3.
20
25
30
35
40
45
50
55
60
1999 2001 2003 2005 2007 2009 2011 2013 2015
Households entitlements as a percentage of GDP

16
The largest values of AuM in Europe are located in Denmark, the Netherlands, Sweden, Switzerland, and the UK. However, comparing the amount of private pension assets to the size of the economy, as measured by GDP16, provides a better picture of the relative importance of the funded pension products in a country. In addition to the countries that have large absolute values of private pension assets, funded pension products are also high relative to GDP in Iceland and Israel (Figure 1.2). For the RCG-E area, the ratio of private pension investment to GDP ranges from two percent in Finland to more than 160 percent in Denmark, with a weighted average of 51 percent17. The low asset to GDP ratio for Finland is caused by the compulsory part of Finnish pension system considered being partially pay-as-you-go and therefore outside of the scope of this FSB RCG-E exercise. Eight RCG-E countries have a ratio below 10 percent and three others below 20 percent. In some of these countries, for example in France, funded pension products have only a limited presence in the domestic economy. For others data is only available for a limited part of the private pension sector. Figure 1.2. Funded pension products as percentage of GDP18
Source: FSB RCG-E Survey.
1.2.2 Members and contracts
The 184 product categories cover at least 193 million members19 or contracts of funded pension products. From the 193 million, at least 127 million members or contracts were active at the end of 2014. However, there exist significant differences between countries in the reporting of the number of members. In some countries, members are reported based on the number of contracts and members can be affiliated to more than one pension product, thus holding more than one contract. Other countries report the number of members (see also Annex 2). Furthermore, some countries allow for double counting while others not. Similar to the size of AuM, the number of members/contracts varies significantly across RCG-E countries. The largest numbers can be found in the Netherlands, Poland, Spain and the UK. 16 Based on World Bank data as at 31 December 2014. 17 No asset data were available for Greece. 18 Data for Germany only includes data from IORPs. 19 Active, deferred and retired members.

17
The relative importance of the funded pension products in a country is shown by comparing the number of members/contracts to the size of the population20. The figure below shows that the number of members/contracts of the funded pension products is very high relative to total population, in Denmark21, Israel22, the Netherlands, and Norway and in the Czech Republic23. In the countries where the ratio is close to or above 100 percent, each person is on average engaged or covered by one or more pension product. For the RCG-E area, the ratio of members (or contracts) to population has a weighted average of 41 percent24, with also Iceland, Switzerland, the UK, Luxemburg, Sweden and Poland, showing ratios above the average. Figure 1.3. Total members/contracts of pension products25
Source: FSB RCG-E Survey.
The number of members/contracts often changes in line with normal labour dynamics such as unemployment, wage growth, etc. However, government initiatives to increase participation rates in 20 Based on World Bank data as at 31 December 2014. 21 The number of contracts in Denmark is high relative to population because private occupational pension’s contributions are based on collective agreements between employers and unions. In addition, there are mandatory contributions to the pension fund ATP from all employees and all those of working age receiving social security or social assistance benefits. Hence, almost all working-age Danes contribute at least to two pension funds. 22 Retirement savings are mandatory in Israel. In addition, many Israelis have several accounts with a new one opened at each new workplace and employees not consolidating their accounts. Also, DB pension schemes are closed to new entrants. As a result all DB members which are still active on the labour market have also a DC account for deposits from the incoming salary. The Israel Capital Market, Insurance & Saving Authority (CMISA) is currently trying to reduce the huge number of accounts. Over the recent years, several new regulations have been trying to address this matter. For example, no penalties are applied when closing small accounts and consolidation of inactive accounts. 23 The Czech Republic has a relative low asset to GDP ratio but a high member to population ratio because the State support is maximized for a relatively small volume of contributions. This stimulates many people to join, but de-stimulates higher contributions, leading to a low asset accumulation per person. 24 No members’ data were available for Greece. 25 Please remark that there exist differences in the reporting of the number of members, including double counting. Data for Belgium and Germany only includes data from IORPs.

18
both occupational pension schemes and/or personal pension products have proven to have a positive effect on the number of pension members/contracts. Examples of these initiatives are automatic enrolment in the UK (Box 1.1.) and fiscal incentives in general. Indeed, tax incentives are the most common denominator between all 189 pension products categories, being related to 90 percent of the products.
1.2.3 Occupational pension schemes and personal pension products
The funded private pension products are split in personal and occupational pension schemes (see Annex 1). As shown in Annex 2, the vast majority (68 percent) of pension products included in the responses to the survey are occupational pension schemes. About 30 percent are personal pension products and two percent of the pension schemes or products have the characteristics of both occupational and personal pensions26.
In terms of assets, occupational pension schemes are almost seven times bigger than personal pensions (Figure 1.4). The significant share of pension schemes or products with characteristics of both occupational and personal pensions is explained by the UK Group Personal Pension schemes (GPPs) accounting for almost 28 percent of the total AuM.
Figure 1.4. Occupational and personal pension schemes/products in terms of assets and total members/contracts
Source: FSB RCG-E Survey.
In terms of members/contracts, purely occupational pension schemes cover more than half of the market. On the other hand, the representation of personal pensions is much higher concerning the number of members compared with the amount of assets. Amongst others, due to double counting and smaller pension pots, the average amount of AuM per member/contracts for those products
26 For example, Group Personal Pension schemes (GPPs) in the UK: GPPs are a type of defined contribution pension which some employers offer to their workers. GPP’s have characteristics of both occupational and personal pension schemes. Employers can make contributions to a scheme with a provider of their choice but GPPs contracts are between the employee and the provider. GPPs offer the same features and tax benefits as an individual personal pensions but the employer may be able to negotiate better terms from the provider, such as lower charges than for personal pensions.

19
where both the number of members/contracts and the amount of assets was provided is more than four times smaller for personal pensions compared to occupational pensions.
The importance of occupational pension schemes vis-à-vis personal pensions in terms of asset values is explained further by the fact that employer contributions are mandatory in more than half of the occupational pension schemes and employee contributions in 17 percent of the occupational pension schemes. In contrast, mandatory (employee) contributions are only required in 33 percent of the personal pension products. These observations are independent from the scheme type (DB/DC). Both occupational and personal pensions are provided in most RCG-E countries. Only in Austria, Finland and Greece solely occupational pension schemes and in the Czech Republic and Hungary solely personal pension products are provided/were reported27. Indeed, in some countries the "2nd pillar occupational pensions" is non-existent while in others the differentiation between occupational and personal pension schemes or products is also becoming increasingly ambiguous.
The figure below shows that in terms of assets occupational pensions are predominant across most RCG-E countries. Only in the Czech Republic, Hungary, Israel, Poland and Spain assets of personal pension products outweigh the assets of occupational pension products. However, care should be taken since details on assets were not provided for all products and for all countries.
Figure 1.5. Occupational and personal pension schemes by country in terms of assets28
Source: FSB RCG-E Survey.
27 Even if the product is personal, in Czech Republic, sizable part of members receive contributions by their employers to their pension units. In Hungary, an IORP was set-up in 2011. 28 For Belgium, individual pension arrangements provided by insurance undertakings have been included as occupational pension arrangements. For Germany, the data refers to IORPs.

20
29 A detailed description of the Programme can be found in Annex 0.1. 30 Pensions Act 2008; Pensions Act 2011, sections 4-18; Pensions Act 2014, sections 37-42. 31 At present every three years, with three months flexibility on either side.
Box 1.1. The Automatic Enrolment Programme29 The Automatic Enrolment (“AE”) programme is an important part of the UK Government’s response to the demographic challenge of an ageing population. Together with changes to the State pension and measures to enable an extended working life, automatic enrolment is part of a set of reforms designed to ensure individuals are able to achieve the lifestyle they aspire to in retirement, while minimising burdens on sponsors, the pensions industry and the taxpayer. AE was designed to reverse the decline in the numbers of individuals covered by second or third pillar private pension provision. It aims to harness inertia to bring individuals into pension saving, and to keep them there. The programme was articulated by a series of Acts of Parliament30 and may be summarised as follows:
• a legal obligation for all employers in the UK to automatically enrol their employees into a pension scheme;
• a new master trust pension scheme – NEST – with a public service obligation to accept any employer who wishes to use it to meet their duties, to assist those who struggle to access provision;
• a compliance and enforcement regime run by The Pensions Regulator, to ensure employers comply with their new duties.
A mandatory minimum employer contribution signals to individuals that saving in this way is beneficial, and their contribution rate is increased by tax relief. The individual has the ability to cease saving at any point by “opting out” of the scheme, but their employer must re-assess its workforce at set intervals31 and re-enrol those who have opted out. Automatic enrolment has reversed the long term decline in pensions’ savings in the UK. By mid-2016, 66 percent of all employees were active members of a pension scheme, compared with 47 percent in 2012. Much of this has come from increases in private sector saving, which has increased by 28 percentage points (from 42 percent in 2012 to 70 percent in 2015). Public sector participation increased by three percentage points (from 88 percent in 2012 to 91 percent in 2015). The impact of AE has been greatest on those groups for whom coverage, pre-AE, was lower: private sector employees, lower earners and younger age groups.
As at December 2016, over 7 million workers have been automatically enrolled. Opt out levels by individuals is less than 1 in 10, significantly lower than the UK Government’s original estimate of 1 in 3.
21
1.2.4 Scheme type
Various scheme types exist for pension products. In order to increase the available options and to better address stakeholders’ preferences, including risk aversion of the sponsor, new types of schemes have emerged such as DC with guarantees, contribution-based DB schemes and hybrid schemes introducing flexibility with regard to risk sharing between stakeholders. In the survey, a split was made between 5 categories following an “accountant approach” (employer or provider perspective): DC, DB, DC with guarantees, DB contribution-based and hybrid.32 To reduce the reporting granularity, this report considers ´pure DB´, ‘DC with guarantees’, ‘DB contribution-based’ and ‘hybrid’ altogether as a single type ´DB´.
DC schemes are widespread across all RCG-E countries, with no country where DC products are not available. DB schemes are offered in all countries but two: Hungary and Poland.
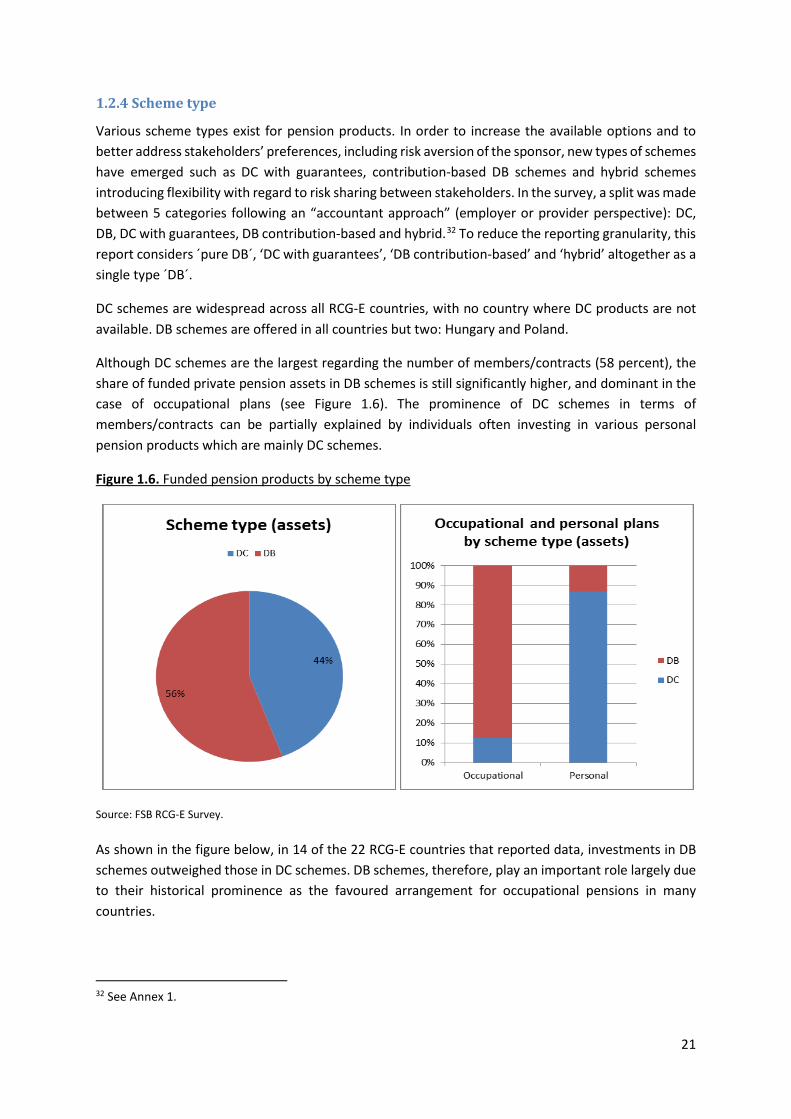
Although DC schemes are the largest regarding the number of members/contracts (58 percent), the share of funded private pension assets in DB schemes is still significantly higher, and dominant in the case of occupational plans (see Figure 1.6). The prominence of DC schemes in terms of members/contracts can be partially explained by individuals often investing in various personal pension products which are mainly DC schemes.
Figure 1.6. Funded pension products by scheme type
Source: FSB RCG-E Survey. As shown in the figure below, in 14 of the 22 RCG-E countries that reported data, investments in DB schemes outweighed those in DC schemes. DB schemes, therefore, play an important role largely due to their historical prominence as the favoured arrangement for occupational pensions in many countries.
32 See Annex 1.

22
Figure 1.7. Countries split by scheme type in terms of assets33
Source: FSB RCG-E Survey.
However, over the past years, numerous DB schemes have struggled to obtain returns in line with the guaranteed levels and have therefore been under pressure in many countries. As a consequence, some of these schemes have lowered their investment promises, for example through benefit reductions. Alternatively, in countries such as the Czech Republic, Italy, Ireland and the UK, many DB occupational schemes were closed to new members and/or have been replaced for future accrual by DC schemes which could be managed by the same IORP or their funds reserves are transferred to another IORP or another type of provider (e.g. insurance company) in order to de-risk from the sponsor perspective.
On a different note, an important feature of pension products is that they postpone consumption and protect households from long-term financial risks and very often longevity risks. Retirement payments can be made in the form of lump sums (a single payment), programmed withdrawals (series of fixed or variable payments generally calculated by dividing the accumulated assets by a fixed number or by the expected life expectancy in each period), and life annuities (a stream of payments for as long as the pensioner lives). The majority of pension products allow members or policyholders to choose between different pay-out options. Only for about a quarter of the products, the pay-out option is pre-defined by the product category. Results from the survey show that the amount of choices available for a product is slightly correlated with the scheme type, with a higher percentage that solely a single pay-out option is available for DB schemes34. In most of the products where no choice is allowed, the sole pay-out option is an annuity because this is the only option covering the full longevity risk. A lump sum is the sole option for the remaining 12 percent of the products where no choice is allowed.
33 For Portugal, with regard to products classified as DC, there could be some cases where the provider offers guarantees. For Germany, the data refers to IORPs. For Austria, no split was available between DB and DC assets for its IORPs (based on liabilities, DC schemes account for about 75 percent of the market). 34 For DB schemes, the choice is limited to a single option in 32 percent of the product categories. For DC schemes, the choice is limited to a single option in only 19 percent of the product categories.

23
On the other hand, when more than one choice is allowed, lump sum payments are almost always an option (92 percent of the products). Annuities and programmed withdrawal are respectively allowed in 82 and 50 percent of the product categories allowing for multiple pay-out options. These choice options are rather related to the reporting countries than to the scheme type. Also classification between occupational or personal pension products does not show a correlation with the available pay-out options. Therefore exposure to longevity risk can only be assessed by country or individual product category, rather than by aggregated information on the scheme types.
1.2.5 Providers This section provides an overview of the private pensions market with respect to the types of providers split between three provider categories: pension funds (whether or not IORPs), insurance undertakings and other providers (for example banks or asset managers)35. 46 percent of the private pension product categories are provided by insurance companies, 37 percent by pension funds and 17 percent by other providers36. In terms of assets, the market share of insurance undertakings and pension funds increases at the expense of the market share of other providers (Figure 1.8, left hand-side graph). Figure 1.8. Pension providers in terms of assets and by scheme type
Source: FSB RCG-E Survey. Note: At the right hand side graph, percentages are computed according to AuM.
35 Please note that the reference to 'other providers' in this section differs from the notion 'other pension providers' in the other sections of this report, for the purpose of the analysis considering the data available. See Annex 1 for more details. 36 ‘Other providers’ also includes data related to product categories for which no distinction between provider types was possible based on the data available. In general, providers such as banks and asset managers do not have a big market share in terms of assets because this data was often not available. Figures in terms of members or contracts confirm this view.

24
As shown in the above Figure 1.8 (right hand-side graph), DB schemes are predominately offered by pension funds providers whereas DC schemes are mainly offered by insurance undertakings. Pension funds37 are the main provider of occupational pension schemes but also manage personal pension products in a number of countries. In many of these countries, pension funds manage only one type of plan, either occupational or personal. When pension fund activities are limited to a specific segment such as occupational pensions, other providers usually provide personal pension products. For instance, in some countries pension funds manage the assets coming from occupational pension schemes for public and private sector employees, while insurance undertakings, banks and asset managers can offer pension products to the whole population. Insurance undertakings are the main providers of personal pension products and a significant provider of occupational pension schemes. Insurers are also the sole providers of products that were categorised as both occupational and personal which represented 29 percent of the total market. As the information available on private funded pensions differs with the provider type, being more complete in the case those provided by IORPs, the following sector presents a more detailed stocktaking analysis for two categories of providers: IORPs and other.
1.3 IORPs and other pension providers
Whereas section 1.2 provides an overview of the overall private pensions sector, this section focusses on the data distinguishing between pension products provided by IORPs and pension products provided by 'other pension providers'38 for which information was collected in the FSB RCG-E Survey.
Timelines are available for IORPs, allowing insights into trends over the last years. For other pension providers, only 2014 data is available.
1.3.1 IORPs
1.3.1.1 General information
Aggregated figures show that IORPs in RCG-E countries39 have more than 3,094 billion euro in assets and provide pensions to over 56 million members and beneficiaries. Two percent of these IORPs (IORPs with more than 100 members) manage more than 99 percent of the total AuM40.
Again, huge variations exist between the countries, both in absolute figures and in terms of economic importance. UK IORPs have most AuM while Dutch IORPs have the largest assets over GDP ratio (Figure 1.9). Measured by absolute figures, the European IORP market is very concentrated with the UK and
37 See Annex 1. 38 The category ’other pension providers’ encompasses pension funds not covered by the IORP Directive, insurance companies, collective investment funds, banks, asset managers, etc. See also Annex 1. 39 Covering Austria, Belgium, Germany, Denmark, Finland, Hungary, Ireland, Italy, the Netherlands, Norway, Poland, Portugal, Spain, Sweden and the UK. 40 EIOPA 2016 Market Development Report.

25
the Netherlands together making up for 84 percent of the total AuM. German IORPs represent seven percent of the total AuM, Italy three percent and Ireland two percent. All other countries account for one percent or less from the total IORPs AuM.
Figure 1.9. IORPs AuM by countries and as percentage of GDP
Source: FSB RCG-E Survey41.
Figures expressed for members and beneficiaries show similar patterns, both in absolute figures and as a ratio of members and beneficiaries over the total population.
Following the global financial crisis where assets values shrank significantly, IORPs assets have grown at an average annual growth rate of 10 percent despite the fluctuating asset returns (Figure 1.10 and Figure 1.13). In terms of members, there was a huge increase in 2009, followed by a drop in 2010. The rise in 2009 was caused by a substantial growth in Austria, Spain, the Netherlands and the UK. In Austria, a significant increase in membership rate has been seen when civil servants switched to the pension fund regime. The drop in 2010 was due to a decrease in Portugal42, the Netherlands and the UK. On average, member’s growth rate was 3 percent in the observed period.
41 In Denmark, most of the occupational pensions are not covered by the IORP Directive. 42 The drop in Portugal was caused by the fact that EIOPA’s occupational pension statistics for Portugal included also members from personal pension funds and not only from IORPs until 2009.

26
Figure 1.10. IORPs, timelines and annual variations for assets (000 euro) and members (000)
Source: EIOPA occupational pension statistics.
The number of members, split by active, deferred and retired (see Annex 1 for the respective definitions) shown in Figure 1.11 provides an indication of the intergenerational differences that exist between countries. For instance, in Finland and Denmark, the majority of members have already retired.
The amount of retirees of a scheme might also provide insight in the maturity of IORPs. Countries with a higher percentage of retirees might point to IORPs having been set up earlier than in those countries where the percentage of retirees is non-existent or very low. However, this only holds for DB schemes. In the case of DC schemes, pensioners often leave the scheme upon reaching retirement as the IORP often pays a lump sum43 or annuities need to be purchased from external providers.
Figure 1.11. Members split by membership categories
Source: FSB RCG-E Survey.
43 In the case of Belgium, most DB schemes also pay out lump sums instead of annuities.

27
As indicated in section 1.2.4, there has been an increasing shift from DB towards DC schemes. In terms of assets, DB scheme remain the most important scheme type (Figure 1.12). However, depending on local definitions, also in some countries where all schemes have been classified as DB schemes, a shift from pure DB to other scheme types with different risk sharing characteristics is happening.
Figure 1.12. IORPs by scheme type
Source: FSB RCG-E Survey.
1.3.1.2 Cash flows and funding position
Cash flows
Asset growth (Figure 1.10) is determined by both return on assets (including investment income and (un)realised gains) and net cash flow (contributions received less benefit payments made).
The average return on assets has varied substantially over the past years (Figure 1.13). However, despite the economic downturn and low interest rate environment, the average return on assets44 from IORPs in the RCG-E area can be considered relatively high. Only during the financial and economic crisis in 2008 and the sovereign debt crisis in 2011 assets increased with less than 5 percent. Especially the returns on bond markets were high due to the decreasing interest rate.
The main income for IORPs are contributions received from members and/or sponsors. In 2014, there was an aggregate inflow of 112 billion euro (3.6 percent of AuM) in contributions received. During the same period, there was an outflow of 108 billion euro (3.5 percent of AuM) in benefit payments.
Looking at the contributions and benefits paid, most countries reported a positive cash flow in 2014 and previous years. Poland, Finland and the UK are the only countries with more benefits paid than contributions received. For Poland, the outflow in 2014 was due to the government decision to
44 The average return on assets is calculated based on the net investment income as a percentage of average market value of assets between the beginning and end of the year (minus net investment income). The net investment income is calculated as the investment income plus changes in market value of assets related to investments (realised and unrealised) minus investment expenses.

28
redirect assets and contributions from the second pillar system, to the State pension pillar, thereby strongly reducing the importance of the second pillar. There was a positive cash-flow in previous years. For Finland, the negative cash flow can be explained by the large amount of retirees and deferred members compared to the number of active employees. For the UK, a negative cash stream has been reported since 2007 because of the high number of old schemes which are closed to new members.
Figure 1.13. Return on assets and net cash flows
Sources: Figure (LHS) EIOPA occupational pension statistics, Figure (RHS) FSB RCG-E Survey.
Funding position
The funding ratio of IORPs in the RCG-E countries has shown huge variations, showing negative aggregated figures in 2009, 2012 and 2013 before recovering in 2014 (Figure 1.14).
Considering the coverage level for DB schemes at a national level in 2014, only the UK and Ireland45 were not fully funded. However, the overall comparability of the data is affected, as not all countries have provided information on their aggregated assets and liabilities and different methods to report on the assets and to calculate the liabilities have been used. National prudential regimes impose – for example - different valuation rules with discount rates ranging from risk-free market rates to the expected return on assets46.
45 Ireland has reached a positive level again in 2015 (EIOPA 2016 Market Development Report). 46 EIOPA (2016), Opinion to EU Institutions on a Common Framework for Risk Assessment and Transparency for IORPs.

29
Figure 1.14. Funding ratios: aggregated (a) and by country (b).
Sources: Figure (a) EIOPA occupational pension statistics, Figure (b) FSB RCG-E Survey.
Note: Assets based on national valuation standards or market values and liabilities based on national valuation standards.
Funding ratios for DB schemes very close to or below 100 percent remain a concern if the low interest rate environment persists. In the case of a situation of underfunding a concrete and realisable recovery plan has to be set up indicating concrete actions and progress towards full funding. In addition, countries may have benefit adjustment and security mechanisms in place that provide further stabilisation.47
1.3.1.3 Investment allocation
Aggregated investment allocation
For this report, IORPs’ investments have been split in 6 categories: equity, debt and other fixed income securities, UCITS, reinsurance recoverable, real estate and other assets.
IORPs direct most of their investments towards equity and debt and other fixed income securities, accounting for more than 75 percent of IORPs portfolios in RCG-E countries without change between 2007 and 2014. As a consequence, IORPs’ investment performance is mostly driven by developments in equity and bond markets.
Due to legal or contractual obligations justified by prudential reasons such as the prudent person rule48, IORPs’ investment mix is generally stable. On the other hand, as shown in Figure 1.15, IORPs in RCG-E countries have been slowly reducing their share allocated to equities compared to their pre-crisis level and reallocated part of these investments to debt and other fixed income securities. This could impact both members and sponsors (in case of DB schemes).
47 For details on the regulatory framework see the section 2.2 on the IORP Directive and on the risk exposure see Chapter 3. 48 Investment policy geared to the membership structure of the institution for occupational retirement provision.

30
At a national level, few countries, for instance Finland, reported an increase in equities in 2014. Based on the latest release of EIOPA’s occupational pension statistics, this trend continued over 2015. Moreover, in 2015 also Belgium and Sweden reported an increase in equity allocation. At the same time, Germany, Luxembourg and Norway reported a decrease in debt and other fixed income securities accompanied by increases in UCITS for Germany and Norway and in reinsured technical provisions in the case of Luxembourg. Going forward, given the backdrop of falling interest rates and higher market volatility, IORPs might be seeking alternative investments49 to find yield, protection from market volatility or a combination of both.
Nevertheless, despite the general reduction, a significant part of the investment portfolio (32 percent) remains allocated to equity. This is likely due to equities’ long-term potential to offer a higher return than bonds. In addition, matching assets with liabilities is not always possible considering the often high duration of DB liabilities. Therefore, dividend income from equity provides an ongoing source of income to the fund. For investments in equity, 90 percent is allocated to listed equity and 10 percent in other variable yield securities.
Survey results showed that with regards to property, only one percent of the investments is allocated to property for own use. The other 99 percent were invested directly or indirectly (excluding UCITS) in real estate.
Figure 1.15. IORPs, development of asset categories over time
Source: EIOPA occupational pension statistics.
49 Alternative investments are investment products other than traditional debt securities and long-only equity portfolios. These could include hedge funds, venture capital, private equity, and investments in infrastructure. Alternative investments often make use of strategies not available to traditional investments such as making use of derivatives, the ability to short, and the ability to hold illiquid assets

31
Investment allocation by countries
There are huge differences considering asset allocations among countries. In 2014 all but two countries (Belgium and Finland) showed IORPs investments in debt and other fixed income securities for minimum 30 percent of the total assets (Figure 1.16). Investments in debt and other fixed income securities, which accounts for 45 percent of IORPs’ AuM, are investments in sovereign bonds (60 percent). 22 percent of the assets in debt and other fixed income are diverted to financial corporate debt and 16 percent is invested in ‘other’ debt and other fixed income categories.
Figure 1.16. Asset categories by country
Source: FSB RCG-E Survey.
A general assumption is that sovereign debt is largely allocated to the home country. However, the limited information received on issuing countries of investments showed that this might be country dependent with the Netherlands and Portugal IORPs investing respectively around 17 and 28 percent of their sovereign debt assets in the home country. The other three countries from which information was received showed investments in debt and fixed income issues by the home country for 42, 51 and 54 percent of total investments.
All other asset categories vary substantially between countries. For example, in Denmark, almost no assets are invested in equity but more than half of the portfolio in debt and other fixed income securities while Finnish IORPs invested more than half of the assets in equity.
Furthermore, countries may invest additionally into debt and equity through UCITS. For example, in Belgium and Germany, a substantial part of IORPs’ assets are invested in UCITS investing in debt and

32
equity UCITS50. In contrast, for Denmark, Finland, Ireland, the Netherlands, Sweden and the UK, there were no investments in UCITS reported51. These are countries with substantial direct investments in debt and equity. The majority of investments in UCITS are also mainly diverted to debt and equity securities with 39 percent and 25 percent respectively. Six percent of the assets are invested in real estate and 30 percent are invested in UCITS outside these categories.
It is also remarkable that the insurance or reinsurance of technical provisions (reinsurance recoverable which are reported as assets) is much more common in Italy and Spain, compared to the rest of the RCG-E countries.
Investment allocation by scheme type
According to the reported data, DB schemes account for equally much debt and other fixed income securities as DC schemes but have more investment exposure to equities. It is remarkable that reinsurance recoverable play a bigger role in DC schemes than in DB schemes52.
As shown in Figure 1.17, in most countries where the majority of the DB assets are linked to promises based on a guaranteed return on the contributions (Belgium, Spain, Italy), rather than a final or average salary (Finland, Ireland, Portugal, UK), there are more investments in debt and other fixed income securities as well as in other products guaranteeing a fixed interest rate. However, there is less equity exposure. The reason may be that in order to provide the underlying guarantee on an annual basis53, volatility needs to be reduced to assure a greater degree of certainty over the asset returns every year.
For DC schemes, asset allocations vary even more between countries. In Spain and Italy, there is more a bias towards debt and other fixed income securities whereas in Ireland and the UK there are more investments in equity.
Differences among asset allocations across countries and schemes are caused by a number of factors. Firstly, there is the nature of the scheme itself. DB schemes typically aim to fulfil a promise whereas DC schemes aim to maximise returns (for a given level of risk). Secondly, as shown below, asset allocations seems to be also closely linked to the country’s investment culture. Thirdly, the asset manager or even the individual making the investment decisions on behalf of the IORP plays a role.
50 Investments of Austrian IORPs are predominantly invested in UCITS. However, for this survey Austria provided information on a look-through basis, i.e. disclosing the underlying assets held by the UCITS. 51 Either no investments in UCITS or no data on investments in UCITS was available. Danish investments in investment fund, including UCITS, were covered in other investments. Using look through (i.e. looking at what the investment funds invest in), the asset allocation from end-2015 was: equity (8.7 %), debt/bonds (75.4 %), properties and buildings (5.2 %) and other (e.g. derivatives, 10.7 %). 52 These conclusions should be put in perspective. Firstly, Austria and the Netherlands could not provide asset categories broken down by scheme type while the UK could only provide data for DB schemes (DC schemes were included under non-IORPs covering both individual and group schemes). As such the comparison between DB and DC schemes does not cover the full market. Secondly, the size of the total IORP assets in a particular Member State plays a huge role here. For example without the split available for the Netherlands, the DB asset classification is hugely dominated by the UK and the DC asset market by Italy. Therefore, it is hard to compare investments by scheme types at an aggregated level. 53 In Belgium the minimum return on contributions is not a yearly guarantee, but for the overall affiliation period.

33
Figure 1.17 (RHS) includes four markets that have reported DB and DC asset categories. It shows that in the case of Italy and Spain, investments for DB and DC schemes are very similar. For Italian DC schemes, the sole difference arises from reinsurance recoverables54 and investments in property (directly or indirectly through non-UCITS). For Ireland, the size of assets provided by DB schemes is only around 20 percent bigger than assets provided by DC schemes, and the investments made by DB schemes are more focussed on debt and other fixed income securities whereas DC schemes invest more in equity. In Portugal, DC schemes are much smaller than DB schemes. Therefore, in this case, a direct comparison between DB schemes and DC schemes might not be entirely conclusive.
Figure 1.17. Investment categories by scheme type: aggregated (17.a) and by country (17.b)
Source: FSB RCG-E Survey.
Notes: In Figure 17.b, the left columns refer to DB and the right columns to DC schemes. Inconsistencies with the aggregated information (see also Figure 1.15) can be explained by some countries providing aggregated information but not being able to provide a split by scheme types. In Germany, only DB schemes are permitted.
More detailed information on the investment categories was not available for most countries. The information collected on issuing countries showed potential concentration risks for the reporting countries, yet the coverage of the data collected was not sufficient to draw conclusions for the RCG-E.
54 In Italy, some pension schemes, though instituted as autonomous entities, regularly transfer the contributions received to an insurance company which runs the money received as a DC pension scheme. In these cases, the technical provisions held by the insurance company are reported for statistical purposes as reinsured accounts.

34
1.3.2 Other pension providers
1.3.2.1 General information
As already mentioned, ‘other pension providers’ include providers of occupational or personal pension products such as pension funds not covered by the IORP Directive, life insurance companies, banks and asset managers. However, the data in this section refers to private pension products for which the assets and liabilities can be separately identified from the other products provided and could therefore be reported as such. No information was received for article 4 entities that follow the IORP Directive. 'Other pension providers' offering occupational pension products were reported by 7 RCG-E countries: Belgium, Denmark, Iceland, Israel, Norway, Switzerland and the UK55 (Figure 1.18). ‘Other pension providers’ offering personal pension products were reported by 12 RCG-E Countries: Belgium, the Czech Republic, Hungary, Ireland, Iceland, Israel, Italy, Norway, Poland, Portugal, Switzerland, Spain and the UK.
Figure 1.18. Other pension providers in assets and members/contracts 56
Source: FSB RCG-E Survey.
Aggregated figures show that other pension providers in RCG-E countries have more than 2,849 billion euro in assets and provide services to over 99 million members and beneficiaries. As such, while the asset size is only slightly smaller than the AuM of IORPs, the number of members is 70 percent larger. This might be explained by double counting which more affects these products than IORPs. Equally to the information covering all pension products and IORPs, huge variations exist between the countries, in absolute figures and in terms of economic importance.
55 For the UK there is no split available between occupational and personal pension products and all data is considered as occupational. Furthermore, where available, the split was made between occupational and individual/group personal pension products. 56 For Belgium, figures included in the occupational pension statistics include both occupational and personal pensions provided by insurance undertakings. In addition, in terms of members, Belgian personal pension providers also include non-pension insurance contracts.

35
‘Other pension providers’ providing occupational pension products are far bigger than other those providing personal pension products with 90 percent of the AuM invested by occupational ‘other pension providers’57. However, in terms of members or contracts, the personal pension market is the largest having 57 percent of the market share. At a national level, the biggest market share in terms of assets or of members/contracts comes from either occupational or personal other pension providers depending on the country.
Most countries also have ‘active’ members/contracts accounting for 50 percent of the total number of members. Only in Israel, Norway, Poland and Spain this was not the case58. In those countries, this was due to the high number of deferred members/contracts. In Israel and Norway, many employees open (Israel) or are obligated to open (Norway) a new scheme each time they change the employer. In addition, in Israel, many employees are also deferred members/contracts in the closed DB schemes. For personal pensions in Norway, the high number of deferred members/contracts resulted from a change in tax-regulation, leading to a run-off situation for related pension plans at that time. For Polish pensions, member’s savings are transferred gradually to the Social Insurance Institution (ZUS). Since 2014, contributions to open pension funds were made voluntary. For Spain, contributions to civil servant´s pension schemes were cancelled for austerity reasons so all those members/contracts to theses pension schemes had become deferred members/contracts.
In contrast to IORPs, there is no country in which the number of retired members/contracts exceeds 30 percent of total membership. This might be partially explained by the fact that the decumulation phase is not always part of the products provided by these entities (most products are DC) and members/contracts tend to choose lump sum over annuities where possible.
Occupational pension providers offer mostly DC schemes, both in terms of assets (Figure 1.19) and in terms of members/contracts. In Denmark, only occupational DC schemes exist. The opposite is true for Israel and Switzerland where ‘other pension providers’ only provide DB schemes.59 In Norway and Switzerland both DB and DC schemes exist. Where DB schemes generally predominate in assets, DC schemes predominate in terms of members/contracts.
For ‘other pension providers’ providing personal pension products, only Italy, Norway and Portugal provide both DB and DC schemes.60 In all other countries, personal other pension providers only offer DC schemes. In Italy, Norway and Portugal, DB schemes predominate both in terms of assets and members/contracts. 61
57 All information from the UK is categorised as occupational. For Norway, a split is not possible for assets; all assets are therefore considered as occupational. 58 No information on splits between active, deferred and retirees was received from Belgium for occupational and personal pension providers and Switzerland for personal pension providers. 59 More precisely, many schemes in these countries are DC with guarantees or of a hybrid type between DB and DC. As referred in the first paragraph in section 1.2.4, this reports names those schemes collectively as DB. 60 More precisely, most schemes in Italy are DC with return or capital guarantees. As referred in the first paragraph in section 1.2.4, this reports names those schemes collectively as DB. 61 For Norway a split is only available in terms of members.

36
Figure 1.19. Other pension providers by scheme types
Source: FSB RCG-E Survey.
1.3.2.2 Cash flows and funding position
Regarding cash flows, there is an aggregate inflow of 418 billion euro in contributions received and an outflow of 307 billion euro in benefit payments made over 201462. These amounts are a lot higher than the contributions and benefit payments made by IORPs.
Considering the net cash flows, occupational pension providers in Israel and Belgium note a significant net negative cash flow. In Israel, the negative cash flow is caused by the former closed DB schemes. In contrast, the cash flow stream for Denmark accounted 28 percent of the total assets.
Most entities solely provide DC schemes while others did not make a split by scheme type. However, for those countries that did provide liabilities and also provide DB schemes63, only Iceland reported a negative funding ratio. In this case, those funds are civil servants pension funds guaranteed by the state and the municipalities.
1.3.2.3 Investment allocation
Aggregated investment allocation
Like IORPs, other pension providers have a preference to invest in traditional asset classes such as debt securities and equity. Investments in these two asset classes accounted for 61 percent for other occupational pension providers and 78 percent for other personal pension providers.
62 Differences between the aggregated contributions mentioned in section 1.1.3 occur because for some products contributions and benefit payments have been reported in pension providers and IORPs but not in the sheet where key information on all product categories was requested. For example, the UK reported 238 billion EUR contributions for IORPs and pension providers and 254 billion EUR benefit payments but no figures were provided in the overview of the market described in section 1.1.3. 63 Iceland, Italy, Norway, Spain and Switzerland.

37
In 2014, other occupational pension providers in the RCG-E Countries invested, on average, less in debt and other fixed income and in equity compared to personal pension providers (Figure 1.20). This is remarkable as, one could expect that in the case of a higher percentage of investments in equity, investments in debt securities would be lower since there are more DC schemes in personal pension products. A possible explanation is that the members (at least in some countries) are risk averse and have a preference for safer portfolios if they bear the risk in DC schemes.
In addition, it should be taken into account that there are no reinsured technical provisions reported for personal other pension providers. This has impacted the asset allocation in percentage of total assets. This is solely due to the UK reporting 22 percent of its occupational other pension provider assets as reinsured technical provisions.
Finally, it is noteworthy that the relative high amount of other assets that are allocated by both categories.
Figure 1.20 Other pension providers: assets
Source: FSB RCG-E Survey.
Investment allocation by countries
Huge differences are reported in the asset data by country in 2014. Equity investments are limited to 30 percent for all occupational ‘other pension providers’ and for most of personal ‘other pension providers’. Only in Belgium, Ireland and Poland a higher exposure to equity risk can be found, and only for personal pensions. Their equity investments constitute more than 50 percent of the total investments.
17%
44%
6% 6% 8%
19%
0%
10%
20%
30%
40%
50%
60%
Occupational pension providers, split by asset categories
23%
55%
6%3%
0%
13%
0%
10%
20%
30%
40%
50%
60%
Personal pension providers, asset categories

38
Not surprising, given the aggregated data, most RCG-E countries also show substantial investments in debt and other fixed income securities (Figure 1.21). Only for Irish and Polish ‘other pension providers’ offering personal pensions, debt and other fixed income securities are less than 30 percent. On the other hand, investment in debt and other fixed income securities reach to over 70 percent for Belgian and Israeli occupational ‘other pension providers’ and for Czech, Hungarian, Italian, Portuguese and Spanish personal ‘other pension providers’. This can be explained for the Czech Republic as there is sometimes a shortage of domestic currency denominated equities. Therefore, funds could accept lower returns on fixed income, rather than taking currency risk on top of the equity risk from foreign denominated equities.
Compared to IORPs, there is a lower share of equity. This is compensated by a slightly higher share in debt and fixed income securities, real estate and other assets. Unlike investments by IORPs, there are in general few investments in UCITS by other pension providers. Only Hungarian and Icelandic personal other pension providers have invested 20 percent of their total AuM in UCITS.
The category “other” is remarkably high in Denmark64 and Norway65 for occupational other pension providers and in Iceland66 and Switzerland67 for personal other pension providers.
Figure 1.21 Other pension providers, assets by country68
Source: FSB RCG-E Survey.
64 For Denmark, other assets include investment funds, including UCITS. When using look-through the investment split by end-2015 was: equity (24.5%), bonds (64.6 %), properties and buildings (6.3 %) and other (4.5 %). 65 Also for Norway, ‘other assets’ include investment funds, this also UCITS, which were not reported separately. 66 In Iceland most of the bank deposit for personal pension falls under the category “other assets”. 67 Around 55 percent of the Swiss ‘other assets’ were investments in cash and deposits. The remainder was invested in mortgages, deferred assets and other assets. 68 For Belgium, see reference 36.
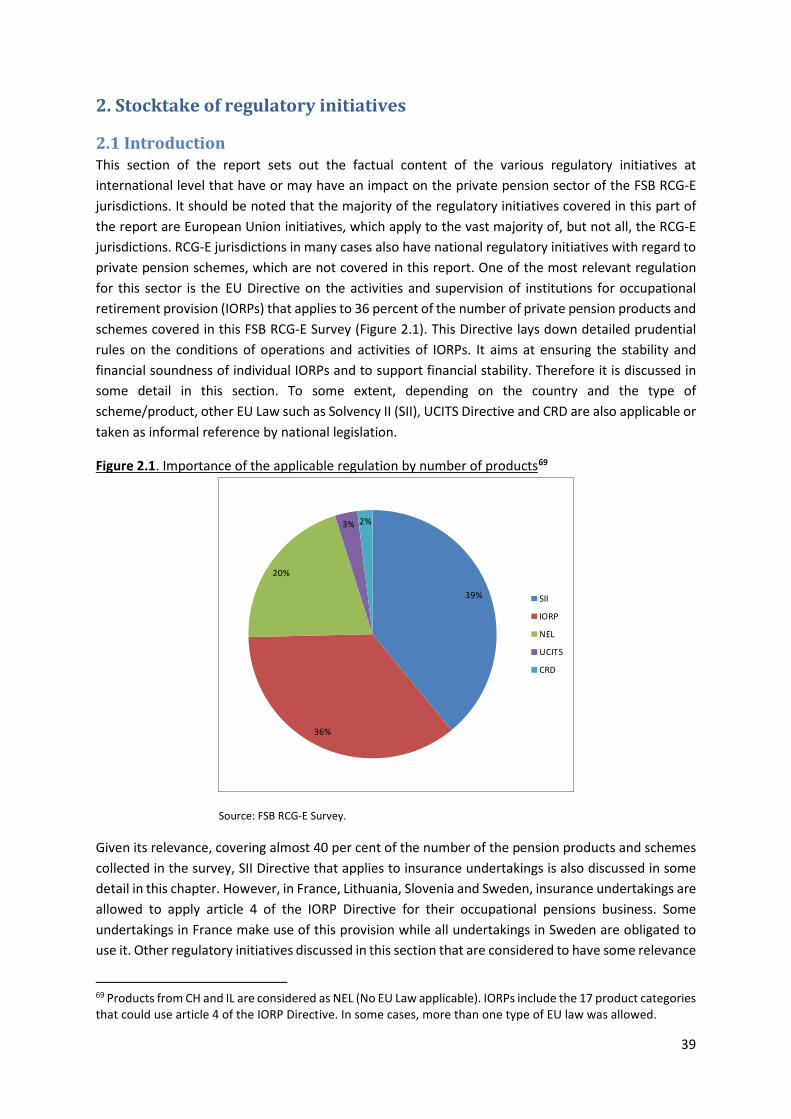
39
2. Stocktake of regulatory initiatives
2.1 Introduction This section of the report sets out the factual content of the various regulatory initiatives at international level that have or may have an impact on the private pension sector of the FSB RCG-E jurisdictions. It should be noted that the majority of the regulatory initiatives covered in this part of the report are European Union initiatives, which apply to the vast majority of, but not all, the RCG-E jurisdictions. RCG-E jurisdictions in many cases also have national regulatory initiatives with regard to private pension schemes, which are not covered in this report. One of the most relevant regulation for this sector is the EU Directive on the activities and supervision of institutions for occupational retirement provision (IORPs) that applies to 36 percent of the number of private pension products and schemes covered in this FSB RCG-E Survey (Figure 2.1). This Directive lays down detailed prudential rules on the conditions of operations and activities of IORPs. It aims at ensuring the stability and financial soundness of individual IORPs and to support financial stability. Therefore it is discussed in some detail in this section. To some extent, depending on the country and the type of scheme/product, other EU Law such as Solvency II (SII), UCITS Directive and CRD are also applicable or taken as informal reference by national legislation.
Figure 2.1. Importance of the applicable regulation by number of products69
Source: FSB RCG-E Survey.
Given its relevance, covering almost 40 per cent of the number of the pension products and schemes collected in the survey, SII Directive that applies to insurance undertakings is also discussed in some detail in this chapter. However, in France, Lithuania, Slovenia and Sweden, insurance undertakings are allowed to apply article 4 of the IORP Directive for their occupational pensions business. Some undertakings in France make use of this provision while all undertakings in Sweden are obligated to use it. Other regulatory initiatives discussed in this section that are considered to have some relevance
69 Products from CH and IL are considered as NEL (No EU Law applicable). IORPs include the 17 product categories that could use article 4 of the IORP Directive. In some cases, more than one type of EU law was allowed.
39%
36%
20%
3% 2%
SII
IORP
NEL
UCITS
CRD

40
for the private pension sector are European Market Infrastructure Regulation (EMIR), the International Accounting Standard 19 (IAS 19), the Directive on the protection of employees, the Bank Recovery and Resolution Directive (BRRD), the Packaged retail and insurance-based investment products regulation (PRIIPs), the Insurance Distribution Directive (IDD) and the Capital Markets Union initiative (CMU).
2.2 Directive on the activities and supervision of institutions for occupational retirement provision (IORP) Directive 2003/41/EC of the European Parliament and of the Council on the activities and supervision of institutions for occupational retirement provision (IORP I) lays down prudential rules for the conditions of operations and activities of IORPs.70 IORP I has been revised to enhance the governance, risk management, transparency and information provision of IORPs and to facilitate cross-border activity, strengthening the single market. The recast Directive (EU) 2016/2341 (IORP II) entered into force on 12 January 2017 and has to be transposed into national law by 13 January 2019. Therefore, the analysis below focuses especially on the new requirements under IORP II. Significant amendments with regards to IORP I are highlighted.
IORP II71 aims at guaranteeing a high level of security for members and beneficiaries and enabling a sound, prudent and efficient management of IORPs. IORPs differ significantly across the European Union and therefore Member States face different challenges. Consequently, IORP II follows a “minimum harmonisation” approach in order to give the Member States the possibility to set additional rules for protecting members and beneficiaries, based on their specific national circumstances.
The prudential rules covered by IORP II refer, inter alia, to the conditions of operations, technical provisions and their funding, regulatory own funds including the available and required solvency margin, the investment rules and management, governance and information to members and beneficiaries.
The main revisions with regards to IORP I aim at 1) improving the financial soundness of IORPs and protection of members and beneficiaries, 2) facilitating cross-border activities and 3) increasing information provisions to members and beneficiaries. The quantitative rules on technical provisions, funding, regulatory own funds and investment remain nearly unchanged. The revision especially takes into account the increasing trend in a lot of Member States from defined benefit towards defined contribution schemes where members and beneficiaries have to bear risks.
Social, labour, tax and contract law is out of the scope of IORP II. IORPs, even if operating cross-border, have to operate their pension schemes according to these national legislations, which may be very important in terms of design and functioning of the pension schemes.
70 Member States may also apply particular rules of the IORP Directive to the occupational retirement business of life insurance undertakings, if certain conditions are met. 71 To note that not all features discussed for IORP II are new compared to IORP I.

41
2.2.1 Prudential provisions of IORP II According to IORP II, the two main objectives of prudential supervision are the protection of members and beneficiaries and the assurance of the stability and soundness of IORPs. IORP II sets requirements to identify, measure, monitor and manage risks. However, the risk distribution between IORPs, sponsoring undertakings, members and beneficiaries and (where applicable) pension protection schemes differs significantly between the Member States.
In general, the main risks are financial market and biometric risks, in particular, interest rate, equity and longevity risk. This section outlines the quantitative and qualitative prudential rules in IORP II that are designed to address these risks. However, Member States may have additional provisions in place to protect members and beneficiaries.
Technical provisions, investment rules and funding
IORP II contains prudential rules on the technical provisions and their calculation, including the maximum interest rate and biometric tables (where applicable), the investment of assets, including the application of the prudent person principle, and the funding of technical provisions. In general, technical provisions of IORPs have to be fully funded at all times. Risks that may impact the assets and technical provisions may lead to underfunding, in which case the IORP has to set up a concrete and realisable recovery plan with a timeline to become fully-funded again. Underfunding does not have to be eliminated immediately. Since recovery plans may last several years, IORPs do not have to immediately change asset allocation in a situation of stress. This mitigates a potential source of cyclical behaviour, especially fire sales as a potential source of downward spirals. They can act countercyclical and, as a consequence, contribute to the stability of financial markets. Finally, IORP II does not require the valuation of technical provisions and assets according to market values. Valuation methods that do not automatically reflect high volatility on financial markets may therefore be used by Member states. However, the economic and actuarial assumptions of technical provisions need to be prudent and take into account, if applicable, an appropriate margin for adverse deviation.
Buffers
IORP II requires that if an IORP itself and not the sponsoring undertaking covers against biometric risks and/or guarantees a given investment performance or a given level of benefits, it must hold on a permanent basis additional assets above the technical provisions. These additional assets amount to ca. 4.5 percent of technical provisions and may serve as a buffer in a situation of stress. Member States may require other IORPs to hold such buffers as well. IORP II lays down detailed rules on the available and required solvency margin.
Additional measures
Member States may have additional measures in place that stabilise a situation of stress. Recent work by EIOPA72 has shown that benefit adjustment mechanisms such as benefit reductions and security mechanisms such as sponsor support and pension protection schemes may exist in the Member States providing further stabilisation. IORP II requires IORPs to consider these additional measures in their own risk assessment in a qualitative way.
72 EIOPA IORPs stress test report 2015 and EIOPA Opinion to the EU institutions on a Common Framework for Risk Assessment and Transparency of IORPs.

42
Governance
IORP II introduces new rules to enable the efficient management of risks connected to governance and therefore, supports the stability and soundness of IORPs. These extend the governance requirements and responsibilities of the management or supervisory body and persons carrying out key functions (risk management, internal audit and actuarial). This includes: requirements for fit and proper management, remuneration policies, and a requirement to carry out an own risk assessment. The latter includes an assessment of the overall funding needs of the IORP, including a description of the recovery plan, where applicable, and an assessment of the risks to members and beneficiaries relating to the paying of benefits. Further prudential provisions refer to outsourcing, investment management and the depository.
2.2.2 Information to members and beneficiaries In comparison to the current Directive, IORP II introduces further information requirements to members and beneficiaries. IORP II takes note of the increasing shift towards defined contribution schemes and contains particular information requirements where members and beneficiaries bear risks in order to help them to take informed decisions.
2.2.3 Prudential supervision of IORPs In order to cope with stress situations and to fulfil the objectives of prudential supervision, IORP II requires authorities competent for the supervision of IORPs to have the necessary means and adequate powers. Detailed rules are laid down on: the powers of intervention and duties of the authorities, information to be provided to supervisors, transparency and accountability, professional secrecy and exchange of information. Supervisory authorities must e.g. have monitoring tools in place, including stress tests, in order to identify deteriorating financial conditions and to monitor how deterioration is remedied.
2.2.4 Explicit reference to financial stability in IORP II IORP II states that the main objective of prudential supervision of IORPs is the protection of members and beneficiaries and the stability and soundness of individual IORPs. Supervisory authorities will also be required under IORP II to consider the potential impact their activities may have on financial stability in the EU. It also introduces provisions on an information exchange with macroprudential authorities.
2.3 Directive on the taking-up and pursuit of the business of Insurance and Reinsurance (Solvency II) The Directive 2009/138/EC of 25 November 2009 on the taking-up and pursuit of the business of Insurance and Reinsurance (“Solvency II”), as amended by the “Omnibus II” Directive 2014/51/EU of 16 April 2014, and complemented by various Commission delegated acts, namely the Delegated Regulation (EU) 2015/35 of 10 October 2014, sets out for insurance and reinsurance undertakings established in the European Union (and for EU branches of third-country insurance undertakings, to a lesser extent) a new prudential framework, applicable since 1 January 2016.
The regime is based on three pillars: quantitative requirements (pillar 1), governance requirements (pillar 2) and reporting and public disclosure (pillar 3), those three pillars underpinning comprehensive

43
group supervision. Its objectives are: the achievement of the EU single market in insurance through a harmonised framework, the protection of policyholders, beneficiaries and claimants, and the reinforcement of competitiveness of European actors at international level.
All three pillars are applicable both at undertaking (“solo”) and group level, the latter possibly cross-border. In this case, the national supervisor of the headquarters of the group shall cooperate with the supervisors of the solo entities, with a binding mediation of EIOPA if necessary for some specific decisions. As a whole, the regime foresees free access to the EU single market to the entities it covers and allows cross-border activities and organisation without the possibility of regulatory arbitrage, allowing thus a harmonised high level of policyholder protection.
Quantitative requirements (pillar 1)
The first pillar is often described as risk-based, which means that assets and liabilities are taken into account at their economic value (market or model value, for assets, best estimate and risk margin as a transfer value of liabilities). This has an effect on financial stability in the short-term, to the extent that the market consistent valuation of assets and liabilities is sensitive to asset price volatility which affects the solvency of the undertaking and in turn may contribute to a feedback loop. Solvency II seeks to mitigate the risk of insurance companies behaving procyclically via a number of dampening mechanisms: the volatility adjustment for discount rates, the matching adjustments for cash-flow matched liabilities and a countercyclical “through the cycle” adjustment for equity risk.
Also, transitional measures from the previous, less-demanding Solvency I regime have been taken for discount rates and technical provisions, as well as the phasing-in of the capital charge for certain equity positions. These transitional measures will spread the impact over a period of sixteen years73.
Undertakings shall hold at all times a level of eligible own funds sufficient to cover the Solvency Capital Requirement (SCR), defined as the capital needed to limit the probability of failure of the undertaking to 0.5 percent on a one-year horizon, which corresponds to a 1 in 200 years event. If the undertaking breaches the SCR, it shall implement a recovery plan within 6 months. Longer recovery periods are possible up to 7 years, in exceptional adverse situations and depending on the long-term nature of the undertaking’s business model. The SCR can be calculated on the basis of a modular standard formula, applying various stresses to each class of assets or liabilities and taking into account the risk mitigating effect of diversification, or on the basis of an internal model approved by the supervisor(s). As a counterpart, the investment allocation on the asset side is free, based on the prudent person principle: all previous Solvency I restrictions have been abolished since market risk is now captured in Solvency II capital requirements. The eligible own funds are classified in three tiers, depending on their level of subordination and availability. The regime foresees as well a Minimum Capital Requirement (MCR) based on a probability of failure of 15% on a one-year horizon, and whose breach implies termination of the undertaking’s authorisation to operate.
73 To note that this is the maximum phasing-in period possible in the Directive. The usage is not automatic. National supervisory authorities decide if they grant the transitional option to the insurance companies established in their country. There is variation in the national authorities’ approaches on allowing such usage.

44
Governance requirements (pillar 2)
The second pillar covers reinforced governance requirements for undertakings and competence rules for the top management and the board. This aspect of the regime is backed on the conviction that sound governance, covering both executive and non-executive supervisory functions, increases resilience to economic shocks and reduces micro-prudential risk. The SII Directive requires thus the development and compliance with the risk management and internal control policies and delineates four “key functions” (risk management, compliance, internal audit and actuarial) which shall refer directly to the board. The top management and the board members shall be “fit and proper”, with a supervisory check, and the executive missions shall be followed by two persons (“four eyes rule”). Moreover, the undertaking has to develop its own internal risk and solvency assessment document (ORSA), submitted to the board and serving as a guideline for internal strategic decision making.
Reporting and public disclosure (pillar 3)
The third pillar of requirements covering public disclosure, reporting and information is the natural complement to the second pillar in terms of accountability and transparency for markets as well as policyholders. A solvency and financial conditions report (SFCR) shall be disclosed annually by the undertaking, even if not listed, and shall reflect its situation under the first pillar. It covers the undertaking’s activity and results, its governance system, its risk profile, the valuation methods used and details on own funds requirements and capital management. Other more detailed, quarterly reports are sent to the supervisory authority. The requirement to disclose SFCR will enter into force in 2017.
Pensions risks covered by insurers
While occupational pension funds are most of the time covered by the IORP Directive in the EU, occupational and personal pensions provided by insurers are regulated by Solvency II. However, Member States may choose to apply certain provisions of the IORP Directive to the occupational pension business of insurers, if the business is ring-fenced, in line with article 4 of the IORP Directive. The application of article 4 for insurers was recognised as a transitional measure in article 308b of the Solvency II Directive and the end of the transitional has been set to 31 December 2022 in the IORP II recast. Only four countries make use of this provision: France, Slovenia, Sweden and Lithuania.
Member States may also authorise under Article 304 life insurance undertakings providing occupational retirement provision business in accordance with article 4, and for life insurance undertakings that have ring-fenced their retirement business and which benefit payments have a tax reduction under national law, to apply a more favourable calibration for equity risk, subject to supervisory approval. In order to apply this calibration, all assets and liabilities corresponding to the business have to be ring-fenced, the pension liabilities should have a duration of at least 12 years on average and activities should be limited to the Member State of authorisation. In addition, these insurance undertakings that want to make use of this favourable calibration should demonstrate to the supervisory authorities that policyholders and beneficiaries are adequately protected by providing the confidence level needed for the new calibration to have an equivalent protection as under the calculation of the SCR. Until now, the use of this provision (cf. Article 304 of the Solvency II Directive)

45
in the European market has been limited74. However, it must also be noted that the data on the use of this provision is based only on the first year of implementation of Solvency II and therefore it may be too early to draw any firm conclusions.
The appropriateness of an application of first-pillar rules under the Solvency II regime to long-term pension business is sometimes debated. It is argued by some that an application of the SCR capital cost is or would be too high for the long term or very long term held to maturity assets backing pension liabilities, even under the derogation of Article 304. It is argued that the 99.5% VaR model with a one-year horizon makes less sense for long-term pension business. Increased volatility on the asset and liability sides could thus affect the coverage ratio and potentially create incentives for undesirable management actions.
In addition, it is argued that pension funds differ in nature from insurance companies due to the possibility to consider the existence of benefit adjustment and security mechanisms and that these mechanisms speak against the application of Solvency II. Furthermore, pension funds are unlikely to fail in the timeframe considered in Solvency II given the very stable nature of the liabilities.
Others argue in the opposite way, stating that an application of first-pillar Solvency II rules to pension funds would avoid potential recourse to (for private firms) sponsor support or benefit cuts in case pension schemes are not fully funded, and as it is a fully harmonised regime, carries no risks of cross-border regulatory arbitrage.
2.4 Regulation on OTC derivatives, central counterparties and trade repositories (EMIR) EMIR75 has been introduced to regulate over-the-counter derivative contracts (OTC derivatives) as they have been identified as a risk factor exacerbating the 2007 financial crisis. The nature of OTC derivatives as individually negotiated contracts between two (or more) counterparties does not provide for the same level of transparency as derivatives traded in liquid, regulated markets. Furthermore, due to the lack of any intermediary, contractual performance has been dependent on the individual counterparties. In the past OTC derivatives have therefore contributed to a complex system of interdependence, interconnectedness and counterparty credit (or default) risk between counterparts, hindering transparent risk assessment, measurement and risk mitigation. This may lead to uncertainties and increase risks for the parties involved and the financial markets.
EMIR is based on an international agreement76 that all standardised OTC derivatives should be cleared through a central counterparty (CCP) and should be reported to trade repositories. The approaches and risk-mitigation techniques used (such as margining) should be internationally consistent.
The provisions of EMIR aim at improving the transparency, efficiency and reliability of the OTC derivative market in the EU by uniformly applying the clearing and reporting obligation. This should mitigate systemic risk and ensure a high level of investor protection and level playing field for market
74 Cf. EIOPA LTG Report 2016. 75 Regulation (EU) No 648/2012 of the European Parliament and the Council of 4 July 2012 on OTC derivatives, central counterparties and trade repositories; OJ L 201, 27.7.2012, p. 1-59. 76 G20 resolution, September 2009, Pittsburgh; and confirmed in June 2010, Toronto.

46
participants. As a matter of principle, exemptions from the clearing obligation should be as limited as possible not to impede the effectiveness of the clearing system and to minimise opportunities for regulatory arbitrage. EMIR applies to financial counterparties as defined by European Directives, including IORPs77 and (re)insurance undertakings78, and non-financial counterparties, which includes other pension scheme arrangements than those provided by IORPs or insurance undertakings.
However, weighing the merits and disadvantages of the clearing obligation, the co-legislator decided to temporarily exempt pension scheme arrangements from the clearing obligation79. The indicated reasons were that entities with the primary purpose of providing benefits at retirement – usually in the form of annuities or as lump sum – typically minimise their investment allocation in cash in order to maximise the efficiency and investment return for the benefit of members and beneficiaries, pension savers or policyholders. Requiring these funds to change their investment allocation to the effect of holding more cash to meet the ongoing margin requirements, seemed to lead to disadvantages for those activities that could not outweigh the benefits of the central clearing obligation. The exemption could be temporary until solutions are found so that non-cash collaterals could be accepted by CCPs and applies only to OTC derivatives that are contracted to decrease investment risk directly related to the financial solvency of pension scheme arrangements. The exemption was originally set until 16 August 2017 and has been extended to 16 August 2018. The Commission will consider the possible long-term solutions to this issue as part of the EMIR review.
IORPs are anyway prevented by the IORP Directive from using derivatives for any other reasons than to contribute to a reduction of investment risks − IORPs often use derivatives to hedge against interest rate risk, foreign exchange risk and inflation risk − or to facilitate efficient portfolio management.
Pension scheme arrangements that can use the temporary exemption are defined in EMIR as:
• IORPs, including any authorised entity acting on behalf of or managing the investments of IORPs;
• Occupational retirement provision business of non-compulsory social security schemes;
• Other arrangements upon express approval by the national competent authority if matching certain conditions:
o Occupational retirement provision businesses of insurance undertakings, if the business is ring-fenced;
o Nationally authorised and supervised entities or arrangements that provide retirement benefits.
77 As defined by Directive 2003/41/EC of the European Parliament and the Council of 3 June 2003 on the activities and supervision of institutions for occupational retirement provision; OJ L 235, 23.9.2003, p. 10. 78 As defined by Directive 2009/138/EC of the European Parliament and the Council of 25 November 2009 on the taking-up and pursuit of the business of Insurance and Reinsurance (Solvency II); OJ L 335, 17.12.2009, p. 1 79 These pension scheme arrangements are, however, not totally exempted from all EMIR requirements, they are still subject to risk-mitigation and reporting obligations.

47
2.5 International Accounting Standard 19 (IAS 19) IAS 19 is an accounting rule concerning employee benefits under the International Financial Reporting Standards (IFRS) set by the International Accounting Standards Board for those employers that are required to use IFRS. In this case, "employee benefits" includes wages and salaries as well as pensions, life insurance, and other perquisites.
IAS 19 Employee Benefits outlines the accounting requirements for employee benefits, including short-term benefits (e.g. wages and salaries, annual leave), post-employment benefits such as retirement benefits, other long-term benefits (e.g. long service leave) and termination benefits.
The standard establishes the principle that the cost of providing employee benefits should be recognised in the period in which the benefit is earned by the employee, rather than when it is paid or payable and outlines how each category of employee benefits are measured, providing detailed guidance in particular about post-employment benefits.
Under this standard, the accounting treatment for a post-employment benefit plan depends on the economic substance of the plan and results in the plan being classified as either a defined contribution plan or a defined benefit plan.
IAS 19 requires to set up sufficient provisions in the accounts of the employer. In this way, pension liabilities are disclosed.
These pension liabilities should be calculated using “best estimate” assumptions, where applicable taking into account market information, in order to obtain a realistic value of the actual liabilities. The mere fact that the information is available may increase the guarantee of the pension rights as all stakeholders know this pension liability will ultimately need to be settled.
2.6 Directive on the protection of employees in the event of the insolvency of their employer The Directive 2008/94/EC on the protection of employees in the event of the insolvency of their employer ensures payment of employees’ outstanding claims in the event of employer insolvency and therefore is an important initiative with regards to private pensions.
Article 8 of this Directive provides that the Member States must “ensure that the necessary measures are taken to protect the interests of employees [and former employees]…..in respect of rights conferring on them immediate or prospective entitlement to old-age benefits, including survivors’ benefits, under supplementary occupational or inter-occupational pension schemes”.
The objective of Article 8 is to protect the supplementary pension rights of employees and former employees whose employers are in a state of insolvency. When a pension insurance is the direct responsibility of a company, its employees and former employees may be at a greater risk of losing their immediate or prospective pension entitlements in the event of an insolvency of the employer than when a pension insurance is independent of the employer.
Article 8 of the Directive, therefore, attempts to minimise the risk by placing an obligation on the Member States to give immediate and prospective entitlements to old-age pension a certain amount

48
of protection in the event of insolvency of the employer, regardless whether or not the beneficiaries in question are still employed by the insolvent employer.
Article 8 covers employees and also persons who have already left the employer’s undertaking or business at the date of the onset of the employer’s insolvency. Article 8 covers pension schemes which are “outside the national statutory social security schemes”, that is to say, any pension scheme which is in addition to the statutory social security scheme and which is based on an employment relationship.
The way in which the objective of Article 8 is achieved is left to the Member States. Therefore, Member States have flexibility when deciding the content of measures to ensure protection. However, to comply with this provision, Member States must provide for regulations, covering the private sector, ensuring that the fate of supplementary pension schemes is not bound up with the fate of the insolvent companies.
The main obligation on the Member States is to adopt measures which protect not only the existing but also the future pension claims of employees and former employees. However, no implicit guarantee that the pensions will always be paid out in full can be derived from Article 8.
The European Commission in 2010 has published a study looking at the implementation of measures under Article 8 for some Member States80. The study concludes that ‘In general, in the countries surveyed, the measures in force aiming at the protection of supplementary pensions in case of insolvency of the sponsoring employer when a pension scheme is underfunded are of a tolerable level taking into account the actual promises made to the employees, which differ enormously between countries.’
The measures used by Member States range from funding requirements, external guarantee schemes, additional asset requirements and other measures such as accounting requirements. While the benefit of this Directive in ensuring the protection of employee rights is clear, there is no direct impact on financial stability.
2.7 Directive for establishing a framework for the recovery and resolution of credit institutions and investment firms (BRRD) The financial crisis revealed that crisis management tools both at an international and European level were not adequate enough, leading to bail-out of financial institutions using public funds. As a response to this, legislative instruments, standards and guidelines both at an international and European level were introduced to establish a more efficient crisis management framework. In particular, in 2011, FSB published international standards for effective resolution regimes, known as “Key Attributes of Effective Resolution Regimes for Financial Institutions”.
Following international developments, in 2014, the EU introduced the Bank Recovery and Resolution Directive (BRRD). This harmonised framework for EU-wide crisis management of banks and investment firms includes four key elements:
80 http://ec.europa.eu/social/main.jsp?catId=706&intPageId=198&langId=en

49
• Preparation of: (i) recovery plans, describing measures to be taken by the institution to restore its financial position in distressed scenarios; and (ii) resolution plans, establishing resolution actions which the authority may take when the institution meets the conditions for resolution, and without the use of public funds.
• Early intervention to empower competent authorities with a range of measures to be used under certain conditions, with the aim of preventing further deterioration of the financial position of institutions in distress.
• The Directive, which –among others– lays down the objectives of the resolution to be pursued, establishes conditions to be met, provides a range of resolution tools and mechanisms that should be available to the respective authorities, and describes the legal powers that these authorities have at their disposal.
• Cross-border group resolution, which sets the ground for an adequate cooperation between the Member States in cross-border cases. The aim is to facilitate a smooth functioning of cross-border resolution proceedings in order to achieve the resolution objectives and the best possible outcome in resolution.
The BRRD provides the appointment of one or more resolution authorities in each Member State that is empowered to apply the resolution tools and exercise the resolution powers.
Additionally, the BRRD assigns to the European Banking Authority (EBA) the task of ensuring effective and consistent procedures for key aspects of the Directive, by means of further developing and issuing e.g. a range of binding Technical Standards, Guidelines and reports. This goes in particular with regards to recovery and resolution planning, resolution strategies and tools, and concerning cross-border financial institutions.
Although in 2012 the European Commission launched a Consultation on a possible framework for the recovery and resolution of non-bank financial institutions (which also included insurance), so far no similar legal framework has been developed for the insurance sector81.
The European Systemic Risk Board (ESRB) is also looking into the non-bank sector, with different initiatives in recovery and resolution and macroprudential policy.
Overall, the pension funds sector is not directly part of the mentioned initiatives. Pension funds might, however, be affected indirectly by the BRRD framework to the extent that they may be holding non-protected deposits and/or investing in potentially bail-in-able instruments of credit institutions.
81 On this regard, EIOPA published a Discussion Paper on Potential Harmonisation of Recovery and Resolution Frameworks for Insurers, in December 2016. The Discussion paper is composed of four chapters: (i) introduction; (ii) overview of existing national recovery and resolution frameworks in the EU; (iii) rationale for harmonisation; and (iv) possible building blocks of recovery and resolution.

50
2.8 Regulation on Packaged retail and insurance-based investment products (PRIIPs) Packaged retail investment products are investments, wherein the refundable part to the retail investor is subject to fluctuations due to exposure to certain reference values or the return of one or more assets not acquired directly by the investor (e.g. structured products). Insurance-based investment products are insurance products that offer a maturity or surrender value that is exposed in total or in part, directly or indirectly, to the fluctuations of the market (for example, unit-linked insurance).
The purpose of the packaged retail and insurance-based investment products (PRIIPS) Regulation82 pursued is that the manufacturers apply identical rules regarding key product information in the distribution of their products to retail clients, regardless of their nature, whether it is a bank, fund manager, investment firm or insurance undertaking, when those have a component of investment.
Excluded from the scope of this Regulation, in consideration of their peculiarities and objectives are:
• pension products which, under national law, are recognised as having the primary purpose of providing the investor with an income in retirement and which entitle the investor to certain benefits;
• officially recognised occupational pension schemes within the scope of Directive 2003/41/EC (IORP) or Directive 2009/138/EC (Solvency II) and;
• individual pension products for which a financial contribution from the employer is required by national law and where the employer or the employee has no choice as to the pension product or provider.
Since the PRIIPs Regulation explicitly excludes a wide range of pension products from its scope, it is only relevant for a limited number of pension products.
Since the PRIIPs Regulation mainly deals with information requirements and explicitly excludes a wide range of pension products, it plays no role when considering private pensions and financial stability and is therefore not examined in more detail. Moreover, information requirements to members and beneficiaries are dealt with in the respective regulations of the institutions that operate pension schemes and products.
The Commission will be reviewing PRIIPs in 2018 to assess whether to maintain the exclusion of pension products which, under national law, are recognised as having the primary purpose of providing the investor with an income in retirement, and which entitle the investor to certain benefits. In making its assessment, the Commission will consider whether this Regulation is the best legislative mechanism for ensuring the disclosure relating to pension products, or whether other disclosure mechanisms would be more appropriate
82 See EC: http://eur-lex.europa.eu/legal-content/en/TXT/?uri=CELEX:32014R1286

51
2.9 Directive on Insurance Distribution (IDD) The Directive on Insurance Distribution (Directive 2016/97/EC) (the “IDD”) came into force on 22 February 2016. The IDD repeals and replaces the Insurance Mediation Directive (2002/92/EC) (the “IMD”) and must be brought into effect in the Member States by 23 February 2018.
IDD aims to improve the way insurance products are sold in order to bring benefits to consumers and retail investors in the EEA. The key benefits are seen as greater transparency of insurance distributors in regard to the price and the costs of their products and better and more comprehensible information so that consumers can take more informed decisions.
At a high level, the requirements in the IDD that apply to all insurance distributors are:
• Duty to act in customers' best interest
• Provision of general information
• Requirements on conflicts of interest and transparency
• Requirements on advised and non-advised sales standards
The IDD includes additional specific and stricter requirements on the distribution of insurance-based investment products. Such products are defined as those that offer a maturity or surrender value and which has an 'investment element' i.e. where that maturity or surrender value is wholly or partially exposed, directly or indirectly, to market fluctuations. The additional requirements include:
• Requirement to maintain and operate effective arrangements to manage conflicts of interests
• Requirement to provide the customer with risk warnings regarding the product/investment strategy proposed, (where advice is given) whether the firm will provide the customer with a periodic assessment of suitability and detailed information about costs and related charges associated with both the product, and the method of distribution (i.e. the cost of investment advice given and any third party payments) and their effect on the investment return.
• Requirements that such firms can only receive or pay fees, commissions or soft commissions from or to third parties in connection with the distribution of insurance-based investment products, if such payment does not have a detrimental impact on the service received by the customer and does not impair compliance with the duty to act in the customer’s best interest.
• The requirement that firms providing advice must carry out a suitability assessment and non-advised sales must be subject to an appropriateness test.
However, the IDD expressly excludes the following pension products (among other products) from the definition of insurance-based investment products for the purpose of these additional requirements:
• pension products which, under national law, are recognised as having the primary purpose of providing the investor with an income in retirement, and which entitle the investor to certain benefits;

52
• officially recognised occupational pension schemes falling under the scope of the Occupational Pension Funds Directive 2003/41/EC or the Solvency II Directive 2009/138/EC;
• individual pension products for which a financial contribution from the employer is required by national law and where the employer or the employee has no choice as to the pension product or provider.
Since the IDD mainly deals with general information requirements, it plays no role when considering private pensions and financial stability and is therefore not examined in more detail.
2.10 Capital Markets Union (CMU) At the establishment of the 2014-2019 European Commission’s outline of actions, the idea of a Capital Markets Union (CMU), enabling currently unexploited capital sources to promote a diversified and effective financing of the real economy, was introduced. The European Commission has developed a number of policy initiatives to facilitate the CMU.83 Important aspects are the ability to finance long-term projects, to diversify the financiers and herewith achieve more independence from bank lending.
The business of providing for retirement income is characterised by long, often extremely long, durations of the liabilities and generally low liquidity needs as the risk of a “pensions run” is close to nil.84 In that sense, providers of pension products are naturally suited to invest long-term85.
To make it possible for such providers of pension products to invest long-term capital in advantageous long-term investments, investment rules for pension providers must enable them to invest in such projects or instrument types, e.g. SME equity. Transparency requirements, listing benchmarks, frameworks for (The European Long-term Investment Fund) ELTIFs86, Simple, Transparent and Standardized (STS) securitisations and recognition of sustainable investments are just a few examples to make such long-term investments a reasonable option for pension providers.87
However, at the same time, the objective of providing beneficial and safe outcomes for the individuals saving for their pensions has to be secured.
One potential tool for the CMU in the pensions’ area is to promote a European initiative on personal pensions. EIOPA recently issued its final advice88 on how to develop an EU Single Market for Personal
83 See Green Paper Building a Capital Markets Union, COM/2015/063, http://eur-lex.europa.eu/legal-content/EN/TXT/HTML/?uri=COM:2015:63:FIN&from=EN. 84 However, Feodoria/Förstemann (2015) show that personal pension products with fixed surrender values expose their providers to liquidity risk if interest rates hike. 85 See: Green Paper on long-term financing (LTF) of the European economy, European Commission, 25 March 2013. The financial crisis has affected the ability of the financial sector in Europe to channel savings to long-term investment. In the Green Paper, IORPs are explicitly mentioned as “suitable” long-term investors. 86 See http://eur-lex.europa.eu/legal-content/EN/TXT/?uri=CELEX%3A32015R0760 87 See in particular the European Commission’s Action Plan on Building a Capital Markets Union: http://eur-lex.europa.eu/legal-content/EN/TXT/?uri=CELEX%3A52015DC0468, 2015. 88 EIOPA: EIOPA's advice on the development of an EU Single Market for personal pension products (PPP): https://eiopa.europa.eu/Publications/Consultations/EIOPA%27s%20advice%20on%20the%20development%20of%20an%20EU%20single%20market%20for%20personal%20pension%20products.pdf, 2016.

53
Pension Products (PPP) against the background of the Capital Markets Union to increase long-term savings for future retirement income and to enable further long-term investments by providers. However, it must be noted that the proposal faces many challenges ahead, such as:
• Differentiation from other local pension products or from other retail investment products (offered by UCITS);
• High heterogeneity of fiscal regimes/tax benefits in the EU;
• Operational questions, like agreement on investment rules, distribution channels, main pension providers.
EIOPA developed the idea and the regulatory outline to create a potent and attractive Pan-European Personal Pension Product (PEPP). EIOPA's analysis and research confirmed its views on beneficial outcomes of a 2nd regime standardised personal pension product. This PEPP would exhibit standardised features, such as limited investment options, including a default investment option, taking into account the specific objective of a personal pension product to provide for future retirement income, and also in what concerns information provision, alongside with some flexible elements, such as guarantees, caps on cost and charges and switching.
Based on the outcome of a public consultation carried out in 2016, the European Commission has adopted on June 29 a proposal for regulation of a PEPP 89. As referred in the Explanatory Memorandum of this proposal, it aims at providing simple, transparent and high quality options to save for retirement, reducing barriers to the provision of pension services across borders and increasing competition between pension providers.
89 Proposal for a Regulation of the European Parliament and of the Council on a pan-European Personal Pension Product (PEPP), 2017/0143 (COD).

54
3. Risks and vulnerabilities to and from funded private pension schemes
3.1 Potential impact of private pension schemes on financial stability
3.1.1 Introduction Institutional investors – private pension schemes or products providers included - play an increasing role as financial intermediaries pooling savings from households and/or employers (in the case of the contributions to occupational pension schemes) and financing private and public entities either directly in the capital markets or via other financial intermediaries (Figure 3.1).
Figure 3.1. Simplified financial flows between pension schemes/products providers and their counterparts
One key specificity of private pension schemes and products is their long-term nature. It enables their providers to finance long term investment projects. Private pension schemes and products have the potential to support economic growth while setting aside reserves to ensure the payment of pension provisions in the near and in the distant future. They reduce public expenditure pressure in the future and may also contribute to smoothing inter-generational income. Hence, private pension systems fulfil an important role in the economy by providing resources to support the economic well-being of members and policyholders at retirement, when they are no longer economically active.
All funded pension schemes have an ‘accumulation phase’ where pension savings or entitlements are accrued during members’ working life. This is followed by a ‘decumulation phase’ when the pension savings are converted into a retirement income or the entitlements are paid. These retirement benefits may take the form of lump sum and/or regular payments (a life-long or a temporary annuity) and/or flexible payments (drawdown or payments directly from the pension scheme, i.e. UFPLS).
Accumulation phase /contributions Investments
Decumulation phase/ benefits Investment returns
NFC- non financial corporations FC – financial corporations
Pension schemes/products
Providers Employers
(NFC and FC)
Households Corporations
Banks and other financial intermediaries
Government
Capital markets
SAVI
NG
INVESTM
ENT

55
Given the long period duration of the accumulation phase, often prolonged with the decumulation phase pension schemes and products providers hold large quantities of assets, being an important investor group from a financial stability perspective. Pension providers tend to invest in long-term securities and equity, channelling funds for long term investment.
Private pension schemes can take different forms and there can be significant variation in whether risks lie with sponsors, members or with the provider itself. Within this framework, various factors such as the type of pension scheme and the profile of the scheme membership90 will impact investment and risk management strategies of pension providers.
Risk sharing differs according to the various types of private pension schemes described in Chapter 1:
a) Defined Contribution pension schemes (Pure) - is the category of product where the risks are borne by the members. As no promises or guarantees on payouts are made by the provider or the pension scheme sponsor, members of pure DC pension schemes –when they are requested to choose among different investment options - should have a basic understanding of the risk-reward relationship of diverting some of their savings to pension schemes/products and investing to ensure a retirement income in the future.
b) Defined Benefit pension schemes (Pure) - in this category the sponsor or provider promises a specific annual benefit on retirement. Therefore the risk of poor investment returns, increases in longevity or changes in interest rate expectations are borne by the individual sponsor, or the pension provider depending on the type of agreement between the sponsor and the provider. Usually, the asset allocation is determined by the scheme managers, often with input from the sponsor and external experts such as investment consultants and asset managers. Managers and trustees running DB schemes are usually required by law to have adequate knowledge and understanding of the mechanics of funding, investments, governance and any other area which may pose a risk to a DB pension scheme. In many countries, undertakings operating DB schemes are required to have risk management processes in place which provide clear procedures for identifying, managing and mitigating the risks present in their schemes. In countries where pension protection schemes exist (such as the Pension Protection Fund in the UK and Pensions-Sicherungs-Verein in Germany) the risk may also be borne to some extent collectively by all sponsors whose occupational pension schemes fall under the scope of the pension protection scheme by way of a levy or contribution paid to take on DB schemes where the sponsor has become insolvent.
c) Other schemes91 - DC with guarantees and DB contribution based, Hybrid DB / DC pension schemes – Certain schemes also include some element of spreading the risk between the member and the sponsor or the provider. These can include e.g. some level of guarantees during accumulation (e.g. minimum return guarantees), a guaranteed minimum size of pension pot at retirement (e.g. defined ambition), or a guarantee of a certainty annuity purchase price at decumulation (e.g. guaranteed annuity rate).
90 As pensions schemes and products can be set on a mandatory or voluntary basis. 91 Around one third of pensions schemes deviate from the pure DC or DB design.

56
Risk management ranges from hedging against currency and interest rate risks, to assigning longevity and investment risks. In the last decade, it has become more complex through the use of derivatives (even regulated), securities lending or transfer of longevity risk to innovative markets solutions, which tend to increase the interconnectedness within the financial sector.
A number of strategies exist for DB, DC and other pension schemes for reducing the different sources of risk. These include:
• Life-cycling strategies: Assets held during the accumulation phase tend to be invested in more volatile assets such as equities, as these promise a higher rate of return over time. As the member approaches the decumulation stage, assets are re-allocated to lower risk income streams, such as fixed income instruments. For DB schemes, because assets are pooled, these life cycle shifts in assets tend to be at aggregate level, whereas for DC and other schemes this may occur in the assets associated with an individual’s pension pot.
• Liability-driven investments: The liabilities of DB and other schemes can be matched through liability-driven investment strategies which make use of assets with long-dated cash flows, such as government or corporate bonds. To remove the risk of financial statement volatility, scheme sponsors (or in the case of Guaranteed Life Insurance Products providers) can buy fixed-income assets which match the cash flows (or duration) of the liabilities (liability driven investment)92.
• Derivatives: The use of derivatives by pension providers is mainly related to fixed-income investments, to hedge against inflation and interest rate risks. Longevity swaps are also used to offset the risk of pension scheme members living longer than expected.93 Given their longer-term investment horizon, pension providers are less likely to utilise derivatives for purposes other than hedging market risks94.
• Buyouts: Pension schemes providers may partially transfer pension scheme risks to an (re)insurance company through the purchase of annuities or the establishment of a (re)insurance contract.
3.1.2 Private pension schemes and financial stability In this section we will examine the potential role of private pension schemes for financial stability among various dimensions. They mainly consist of:
a. Resilience of private pension schemes to shocks and their potential stabilizing role in financial markets
Institutional investors such as pension funds and life insurance companies are important financial intermediaries managing the savings of individuals and providing investment to the real economy. Members or policyholders of long-term pension products are typically less able, if at all, to withdraw funds when compared with for instance investment funds because
92 This de-risking strategy is particularly important to DB schemes oriented towards fixed-income investments, where it lowers the risks borne by the provider/sponsor. 93 Longevity swaps mirror the structure of an inflation or interest rate swap. The buyer makes regular payments based on agreed mortality assumptions to an investment bank or insurer and, in return, the bank or insurer pays out amounts based on the scheme’s actual mortality rates. 94 In the case of IORPs, EU legislation stipulates that derivatives can only be used for hedging purposes or for the efficiency of the investment portfolio.

57
withdrawals typically incur a tax penalty or may not be allowed before a certain age (close or at retirement age) under scheme rules or national law. In addition, pension schemes usually receive a regular flow of contributions, regardless of financial market conditions. Therefore, pension funds can play an important stabilizing role in financial markets given their long term investment horizon, potential to invest countercyclically and also due to the fact that they could have several years to eliminate a possible situation of underfunding. Pension schemes providers are less likely to find themselves in a position where they are forced to sell significant portions of their assets at the trough of the business or financial cycle to meet unexpected pay-outs.95
Pension providers can therefore take a long term approach to most of their investment portfolio and provide important financing to the economy by investing in assets such as stocks, property or infrastructure projects while complying with investment provisions. The European Commission96 acknowledged that pension funds did not experience the same problems as other financial institutions during the global financial crisis and that they did not require any support in terms of funding from public finances. It concluded that this was because the long term nature of the liabilities and approach towards much of their investment portfolio meant they could ride out even significant market turbulences.
Providers of pension schemes and pension products are often assumed to look through short-term market volatility, being resilient to shocks and providing a crucial stabilising influence on the financial system by investing in a way that moderates market movements and reduces asset price volatility.
A recent European Systemic Risk Board (ESRB) working paper finds that German insurance companies and pension funds buy securities when prices are dropping and sell securities when the prices are rising in their directly managed portfolios.97 It also presented evidence that insurance companies and pension funds have a preference for buying bonds that are trading at a discount. COVIP (2009) finds clear countercyclical behaviour of Italian pension funds with strict target asset allocation rules based on market values 98 (see Box 3.1.). Based on the case of Chile, Larrain, Munoz and Tessada (2017) support the view that similar asset allocation rules force pension funds to reallocate investments from asset classes which perform best to those asset classes which perform worst.99 Making reference to a change in the constraints that apply to pension fund portfolios in Chile, they show that this change triggered fire sales that were indeed countercyclical, but may also have decoupled asset allocation from fundamentals. Still, empirical evidence remains mixed across the financial sector. The results from regression analysis over a long time horizon conducted by Duijm and Steins Bisschop (2015)100 suggest procyclical behaviour by Dutch insurers whereas for pension funds no evidence was found for procyclical or countercyclical investment behaviour, while Boermans,
95 However, Feodoria/Förstemann (2015) show that personal pension products with fixed surrender values expose their providers to liquidity risk if interest rates hike. 96 http://europa.eu/rapid/press-release_MEMO-09-99_en.htm 97 https://www.esrb.europa.eu/pub/pdf/wp/esrbwp18.en.pdf?e853a4ba16e926921a9c72b46a427b4a. The paper analyses direct holdings of banks, insurers, pension funds and investment funds. Because German pension funds are heavily invested in investment funds which are shown to be managed pro-cyclically, the net effect of pension funds’ investment remains unclear. 98 COVIP (Commissione Di Vigilanza Sui Fondi Pensione), Relazione Per L’Anno 2009, Pension Funds Supervision Commission (COVIP), http://www.covip.it/?cat=35 99 Larrain, Munoz and Tessada (2017), Asset fire sales in equity markets: Evidence from a quasi-natural experiment, Journal of Financial Intermediation, Volume 30, April 2017, Pages 71-85 100 https://www.dnb.nl/en/binaries/Working%20Paper%20489_tcm47-335347.pdf

58
Frost and Steins Bisschop (2016)101 find countercyclical behaviour of European banks and investment funds.
EIOPA found as part of its study on IORPs' investment behaviour102 that the investment behaviour of IORPs varied within and between countries during the financial crisis of 2008. Around half of the IORPs were net buyers of equities, around half were net sellers.
According to the EIOPA report, this variation in behaviour may be related to different investment policies which IORPs have to follow according to their Statement of Investment Policy Principles (as required by the IORP Directive). This Statement must contain a strategic asset allocation with respect to the nature and obligation of pension liabilities. Therefore IORPs may be net buyers or net sellers of certain asset categories in order to maintain their target investment strategy. This is necessary when receiving contributions, paying out benefits, reinvesting investment proceeds or in case of major market movements.
The EIOPA 2015 IORPs Stress Test103 concluded that there is likely to be a variety of responses from IORPs to the adverse scenarios that were tested in the DB/hybrid part of the stress test. While, in terms of number of IORPs, most IORPs expected to follow a passive buy-and-hold investment strategy, the IORPs that represented the majority of pension assets expected to rebalance allocations to assets that have suffered the steepest price falls. Therefore, these IORPs might support the stabilisation of financial markets.
However, regulatory incentives may also decouple the investment decisions from fundamental values with a potential negative impact on market efficiency.104
Finally, pension funds exhibit relatively little leverage which supports their countercyclical behaviour. Borrowing is generally not done or not allowed105 with a view to magnify gains (and if things go wrong, losses) as other financial institutions may do. Pension funds therefore do not face unexpected claims brought about by leverage, neither have to sell assets to meet such claims.
Box 3.1. Countercyclical behaviour of Italian pension funds during the financial crisis of 2008-09
Evidence produced by the Italian Pension Regulator shows a clear countercyclical investment behaviour of Italian pension funds during the 2008-09 crisis. The evidence refers to the so-called fondi pensione negoziali, a group of about forty occupational, mostly industry-wide pension funds that make for the bulk of the Italian supplementary pension system. The Italian law requires these funds to be defined contribution. Typically, members are offered a limited number of investment choices, each characterized by a different strategic asset allocation (SAA). In order to choose between different investment options, individual members look at their SAAs. Indeed, the actual asset allocation is expected to diverge from SAA only up to a certain point. Limits, usually defined in terms of tracking error volatility with respect to a benchmark portfolio set consistently with the SAA, are defined in the pension fund internal rules and are described in the
101 https://www.dnb.nl/binaries/1600019_WEB_tcm46-337345.pdf 102 In preparation of the IORP stress test of 2015, EIOPA carried out a data collection to study the actual investment behaviour of IORPs, especially during the 2008 financial crisis, "IORPs Stress Test Report 2015". 103 https://eiopa.europa.eu/Publications/Surveys/EIOPA%20IORPs%20Stress%20Test%20Report%202015%20bookmarks.pdf 104 Andonov, Bauer and Cremers (2017) find that pension funds whose regulatory discount rate for liabilities is linked to expected returns of assets act on this incentive and invest more risky. Interestingly, this increased risk-taking does not materialize in a higher performance of these funds. 105 This is not allowed for EU IORPs (according to the IORP Directive, only for liquidity reasons and for a limited period).

59
Statement of investment policy principles. SAAs thus become a sort of binding commitment for the pension fund with respect to the individual members. The described setting implies an almost mechanical rebalancing of investments as a response to the change of asset prices, just in order to limit the divergence from SAA: ceteris paribus, pension funds buy the asset classes which experience falls in prices, and sell asset classes that experience price increases. In other words, in the institutional setting of Italian pension plans there is a built-in countercyclical mechanism with respect to the behaviour of asset prices. In the financial crisis of 2008-09, asset prices showed violent changes. Focussing on a composite index of world equity prices that represented the geographical distribution of investments of Italian pension funds, equity prices fell around 45 percent in 2008 and recovered about 30 percent in 2009. The inversion of the market trend actually took place during the first quarter of 2009. At the beginning of 2008, in the aggregate Italian pension funds held in equities a share of 26 percent of their portfolio. At the end of 2008, the actual holdings fell at about 21 percent. This was a significant reduction but lower than the one that would be determined only as a result of the fall in equity prices. If the pension fund managers had performed no rebalancing, the equity exposure at the end of 2008 would have fallen down to 14 percent.
In fact, in 2008, the pension funds were net buyers of shares. Purchases of equity securities, net of sales, amounted to approximately EUR 1.3 billion. The amount of net purchases of shares was the highest in the last two quarters of 2008 in which, at the intensification of the crisis, managers had found themselves in strong need of having to rebalance their portfolio to avoid a significant deviation from the constant composition of the external benchmark. The opposite evolution occurred in 2009, when prices recovered. Italian pension funds were net sellers of equities. The investment behaviour of Italian pension funds during the 2008-09 crisis was clearly countercyclical, and therefore gave a positive contribution to financial stability. As the mechanisms that gave rise to this behaviour are of a structural nature, a similar pattern is most likely to be replicated in similar circumstances.
b. Changing investment behaviour of private pension schemes
The combination of challenging financial market conditions, regulation, changes to accounting standards and longevity, has driven some DB sponsors and pensions providers to rethink their investment strategies. In many countries, DB investment strategies have traditionally relied on holdings of return-seeking assets such as equities as investments with high expected returns and risks in their portfolios, though the extent to which this is the case does depend also on jurisdictions and circumstances.

60
However, in many countries there has been a marked shift away from return-seeking assets towards bonds and other assets which will more closely align with their liability profile. The EIOPA Financial Stability Report 2016106 found that, across 16 European countries, IORP investment in equities declined between 2007 and 2016, from 46 percent to 28 percent. Over the same period, investment in bonds increased from 32 percent to 47 percent. This may be particularly the case that DB pension funds are actively choosing to reduce their risk exposure in order to minimise volatility. Notwithstanding, to some degree the trends in asset reallocation may also reflect life-styling strategies as the average age of scheme members increases, because scheme members become older or schemes will be closing down for future accrual107.
In aggregate, DB pension funds are more likely to conduct liability-matching investment strategies. As many DB schemes are also closed to new members, life-cycling strategies are employed as the average age of scheme members increases. This encourages portfolio re-allocations towards fixed-income products and possible increased use of hedging instruments and may support countercyclical behaviour.
On the same direction, commitment taken by pension providers towards DC members to follow a certain strategic asset allocation, with the consequent rebalancing of investments when prices change, may translate in a countercyclical behaviour too. However, because the investment risk lies with individual members and there may be an incentive for pension schemes to engage in search for yield strategies in order to maximize returns in the short term too, thus hampering the countercyclical behaviour of DC investment strategies. In fact, in pure DC there is no need for liability driven investment.
Where available, the presence of the default fund plays a significant part in DC investment strategies. This is because the majority of members and policyholders opt for the default and do not switch investment options108. When members and policyholders do switch, behavioural economics indicates that they are likely to use decision-making rules of thumb by, for example, allocating their pension savings equally over a number of investment options rather than making a careful allocation decision based on their attitude to risk109.
Overall, there is no evidence for member/policyholder switching towards safer investment options during crisis and towards riskier options during the upward phase of the financial cycle. This lack of engagement and switching to safer assets during a downturn by members/policyholders with investment options partially explains the similar investment attitude across pension investors (see Box 3.2.).
Box 3.2. Empirical evidence for pension fund herding110
Broeders, Chen, Minderhoud and Schudel (2016) find empirical evidence for pension fund herding in the Dutch pension fund market. They use monthly holdings and transaction data of 39 large Dutch pension funds over the period 01/2009 through 01/2015. These holdings are uniquely identified according to their International Securities Identification Number (ISIN). Their key findings are the following. Pension funds rebalance their asset allocation in the short run and, hence, they react similar to market information.
106 EIOPA Financial Stability Report, December 2016. 107 In many countries, the last decade has seen a trend towards DB pension funds either closing to all members, or closing to new members but remaining open to future accrual. 108 Individual investment behaviour: A brief review of research. University of Bristol. 109 FCA Occasional Paper No.1 Appling behavioural economics at the Financial Conduct Authority, April 2013. 110 Broeders et al (2016) https://papers.ssrn.com/sol3/papers.cfm?abstract_id=2741011

61
The authors document robust evidence that more than 20 percent of the passive changes in the equity allocation are offset by active changes during the month. For bonds this rebalancing of the asset allocation accounts for almost 25 percent. Since rebalancing implies a buy low and sell high strategy, pension funds contribute to financial market stability. In addition, they find multiple examples where pension funds adjust their equity and bond allocation similarly around (the announcements of) changes in pension fund regulation.
The main results relate to changes in Dutch pension regulation and developments in the Dutch pension system. In addition there is also evidence of (small) changes in asset allocation in response to exceptional monetary policy operations.
Finally, they show that pension funds follow changes in strategic asset allocations. The most robust evidence for this is obtained for pension funds with similar size over a 15 to 18 month period. If pension funds increase their equity allocation with 1 percentage point on average, then pension funds with a similar size typically increase their equity allocation by 0.35 to 0.47 percentage points with a lag of 15–18 months. The 18 month period is halfway the typical three year cycle at which the strategic asset allocation is reviewed and adjusted.
These results indicate support for different motives for herding, including information, regulation and reputation motives of herding.
c. Risk and impact of a pension scheme sponsor failing to meet pension obligations
The long term nature of pension scheme assets and liabilities mean that the impact of shocks in financial markets may be spread over time. For example, the long term low interest rate environment has caused DB pension deficits, where they exist, to increase significantly. This could ultimately lead to default on the promised future payouts to scheme members. However, many of the risks associated with these deficits will crystalize in the medium or longer term which can give pension scheme sponsors, regulators and policy-makers time to address some of the risks. So, potential systemic risks from a pension fund failure are relatively low, if it exist at all, but this failure may adversely impact the fund's creditors and could have a knock on impact on wider confidence in the system, depending on the size of the potential failure.
In the case of DB occupational pension schemes, there are generally mechanisms in place, such as sponsor support or benefit reductions mechanisms that enable the absorption of losses over time. Furthermore, countries may have protection schemes that take over failing DB schemes in the case of a sponsor default.
Notwithstanding, rising pension deficits could weaken the financial position of sponsors, in particular of large DB pension schemes and may even hinder their investment ability or compromise the business viability (sponsors’ credit risk may increase, resulting in losses to banks and other creditors). Conversely, the failure of a large DB scheme or a large number of smaller DB schemes may have spill-over effect to the economy via their members.
Other spill-overs to the real economy, even if not posing a financial stability risk, are also possible. The default of a large pension scheme sponsor is likely to be a high-profile event. If insufficient funding were available to cover pension scheme payouts, some members would also be likely to face haircuts to their pensions which may ultimately have some impact on consumer spending levels. In addition, a reduction of consumer trust in pension sector long term guarantees could lead to changes in household’s current saving (or consumption) levels.
DB schemes are declining across Europe and participation in DC schemes has been supported by the desire of sponsors to reduce their pension liabilities and exposure to pension risks. The

62
shift of longevity and investment risk to individuals could have long term implications for future levels of income at retirement and hence impacting the economy.
In these conditions, current retirees and those due to retire over the next few years appear better placed to have more resources in retirement compared with future generations. Current retirees and those due to retire over the next few years have benefitted from higher investment returns and interest rates, guaranteed DB incomes, strong increases in property wealth and sustainable state pensions. In the EU-28, the median gross pension of people aged 65-74 amounted to 56 percent of average gross earnings111. It is not clear that these circumstances will be replicated for future generations, which could create longer term risks to consumption and therefore the wider economy.
d. Increased interconnectedness through risk transfer instruments
In line with reasons already outlined above and given their relatively low risk to global financial stability, the FSB has previously decided to exclude pension funds from the Non-Bank Non-Insurer G-SIFIs methodology. EIOPA112 has also found that the extent to which institutions for occupational retirement provision transmit shocks to the financial sector is small. However, vulnerabilities could still arise due to pension funds’ interconnectedness in the financial system.
Pension funds and insurance companies in Europe are major “buy-side” players, therefore any structural changes in their investment strategy (focus on the long term), pooling ability or benefits delivery have the potential for impacting market functioning and financial stability. The functioning and the resilience of private pension schemes are based on their interconnections with the entire financial system. In this context, some types of pension schemes might be more vulnerable than others, facing different potential threats. The increased usage of risk transfer instruments raises interconnectedness of pension schemes with other constituents of the financial system, which could pass some of the risks faced by the pension funds sector, such as longevity risks, to other financial intermediaries. This opens a door for a possible contagion. For example, shifting longevity risk to an insurer enables the pension scheme to get rid of longevity risk at the expense of taking on counterparty credit risk.
These factors and the large size of certain countries pensions sectors, characterize the current moment as crucial for FSB RCG-E to examine the potential financial stability risks emerging from private pension schemes.
3.2 Analysis of risks and stabilizing factors: FSB RCG-E Survey results
3.2.1 The FSB RCG-E Survey design One of the objectives for this report is to conduct an analysis of the possible systemic relevance of vulnerabilities of different categories of private pension schemes.
With this purpose, an overall qualitative risk assessment was conducted through a questionnaire filled in by experts from the RCG-E countries (from authorities supervising pension funds and insurance companies including Treasuries and national central banks). The questions aimed at identifying the main risks and stabilizing factors that may affect the stakeholders of private pension schemes
111 European Commission (2015), Pension Adequacy Report: current and future income adequacy in old age in the EU. 112 EIOPA (2015), IORPs Stress Test Report 2015.

63
(members, pension providers, sponsors) and, more broadly, may affect the financial system and the real economy.
In the survey, the pre-identified risks factors were listed under five broad categories according to the source of risks: macroeconomic environment and financial markets, demographic trends, political and regulatory environment, behavioural factors and operational and governance factors.
The respondents were asked to provide a risk assessment for a time-horizon of 10 years net of stabilizing factors. Though, private pension systems are subject to various risks, those risks might be counterbalanced by stabilizing factors that mitigate their potential adverse effects.
To provide insight in this matter, respondents were asked to give, for each of the risk factors, information about existing stabilizing factors or that are likely to be implemented in practice. In order to support respondents, a non-exhaustive list of potential stabilizing factors was available too, such as improving prudential regulation, better governance rules, enhanced risk transfer mechanisms, and countercyclical aspects. This list was illustrative, and respondents could freely added any other factor that they considered relevant for the risk under consideration.
Overall, 31 risk factors and 13 potential stabilizing factors were pre-identified113. After a first round of answers, three new risk factors that were suggested by some respondents were then added in a revised questionnaire, leading to a total of 34 risk factors.
Such risks are often interrelated and their impacts on consumer/beneficiary, pension provider, sponsors, financial stability and the real economy were assessed only through the expected negative impact following the materialization of such risks at the private pension sector level. For each risk factor, the impact was evaluated assuming that everything else remained constant and also taking into account potential stabilizing factors. Overall, the pre-identified risks' outcome was conceived to be either an increase in financing costs or, alternatively, a decrease in pension benefits. The magnitude of such impact, identified for each category, depended upon the assumed predominant effect.
The respondents evaluated each risk as having one out of three possible impacts on each of stakeholders, on financial stability and on the real economy: HIGH, LOW or NEUTRAL (the later meaning that the risk factor has no negative impact or even has a positive impact). Risks that were considered not relevant had to be answered NA (Not Applicable). When assessing a risk the experts considered both the probability that the event will occur and the severity of the event occurring.
Additionally, each member was asked to rank the top 3 main risks to financial stability. Risk factors were ranked according to the highest number of country replies.
The survey aimed to capture risks associated with the most significant pension schemes, so countries were allowed to complete several replies according to the predominant pension schemes114, covering all kinds of pensions products/schemes or providers (such as IORPs, insurance companies and autonomous pension funds). This survey intended to cover at least 50 percent of the assets under management in the private pension system of each country. Hence, to have an overall risk assessment for Europe, country replies were aggregated to avoid bias toward the countries with a higher number of replies115.
113 Please see Annex 3.3 for the full description of risk factors and stabilizing factors. 114 Please see in Annex 4.2 the number of replies to the survey for each scheme type by RCG-E country. 115 Please see Annex 4.1 for further details on the aggregation methods.

64
Like in Chapter 1, in the remainder of this report 'DC schemes' refers to DC schemes (pure), and 'DB schemes' to all types of schemes with some kind of guarantee.
3.2.2 The main risks factors for financial stability 3.2.2.1 The three main risk factors Respondents ranked the top 3 main risk factors for financial stability (1 being the riskiest). Risk factors were then ordered according to the highest number of replies considering all replies equally important. This allows an identification of risks factors that most countries consider of key importance.
According to the survey results, the persistent low interest rate risk stands as the main risk factor for financial stability for more than one half of the country replies (Figure 3.2).
The increasing longevity risk and subdued economic growth resulting in sponsor default, were respectively the second and the third most appointed risk factors, gathering around 32 and 18 percent of the country replies.
However, it should be stressed that replies were highly concentrated regarding the identification of the first main risk factor and more dispersed regarding the second and third main risks.
Figure 3.2. Risk factors identified by RCG-E countries as being one of the 3 main risks for financial stability – all schemes
Source: FSB RCG-E Survey.
A separate analysis for scheme type shows some differences in the risk scoring. However, in both cases persistent low interest rate and increasing longevity risks remain the top main risk factors (Figure 3.3). The third main risk factor is occupied by high and long duration unemployment in DC schemes and by sudden reversion of interest rate in DB and other schemes.
0% 10% 20% 30% 40% 50% 60%
persistent low interest rate
increasing longevity
subdued economic growthresulting in sponsor defaults
high and long duration unemployment
investments in traditional assets
search for yield
sudden reversion interest rate
negative interest rate
unfavourable tax move
nationalisation
% country replies1st Risk 2nd Risk 3rd Risk

65
Figure 3.3. Risk factors identified by RCG-E countries as being one of the 3 main risks for financial stability, by scheme type
Source: FSB RCG-E Survey.
0% 10% 20% 30% 40% 50% 60%
persistent low interest rate
increasing longevity
high and long duration unemployment
unfavourable tax move
investments in traditional assets
subdued economic growth resulting insponsor defaults
nationalisation
search for yield
high debt level of private sector
EU bail-in resolution for banks
% of country replies
- DC schemes -
1st Risk 2nd Risk 3rd Risk
0% 20% 40% 60% 80%
persistent low interest rate
increasing longevity
sudden reversion interest rate
subdued economic growth resulting insponsor defaults
negative interest rate
search for yield
investments in traditional assets
changing labor regulation
deflation
herding in DB type of schemes
% of country replies
- DB schemes -
1st Risk 2nd Risk 3rd Risk
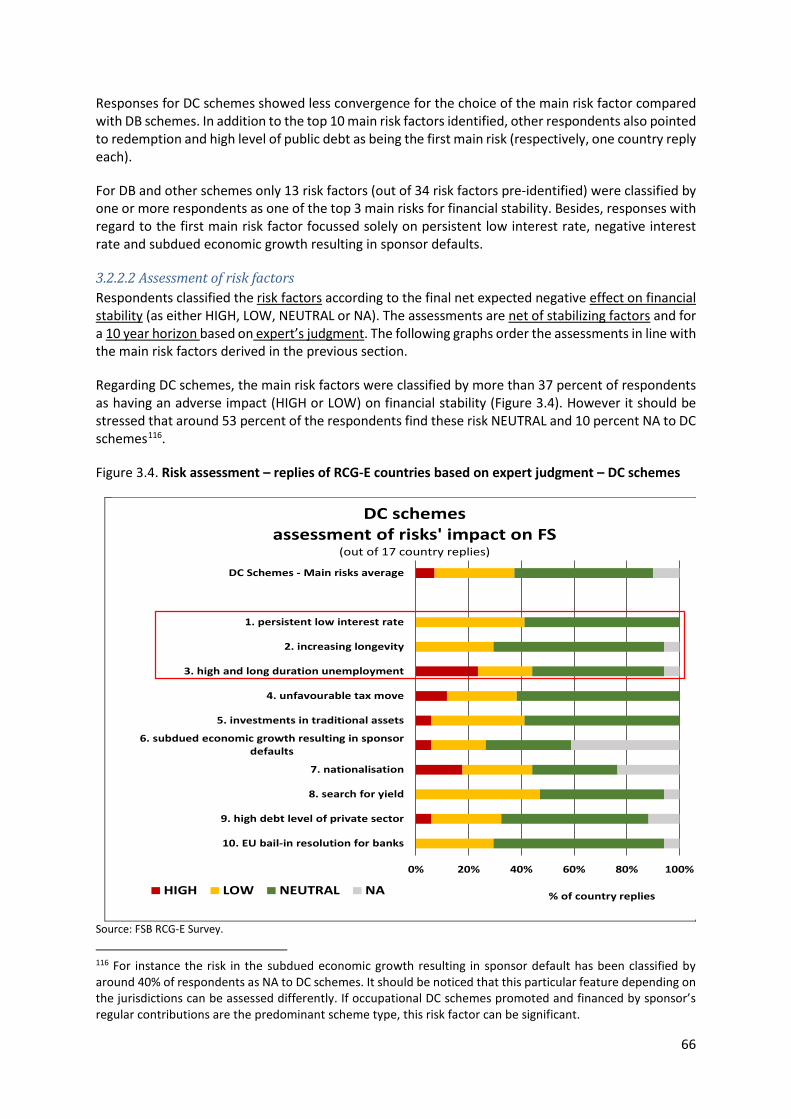
66
Responses for DC schemes showed less convergence for the choice of the main risk factor compared with DB schemes. In addition to the top 10 main risk factors identified, other respondents also pointed to redemption and high level of public debt as being the first main risk (respectively, one country reply each).
For DB and other schemes only 13 risk factors (out of 34 risk factors pre-identified) were classified by one or more respondents as one of the top 3 main risks for financial stability. Besides, responses with regard to the first main risk factor focussed solely on persistent low interest rate, negative interest rate and subdued economic growth resulting in sponsor defaults.
3.2.2.2 Assessment of risk factors Respondents classified the risk factors according to the final net expected negative effect on financial stability (as either HIGH, LOW, NEUTRAL or NA). The assessments are net of stabilizing factors and for a 10 year horizon based on expert’s judgment. The following graphs order the assessments in line with the main risk factors derived in the previous section.
Regarding DC schemes, the main risk factors were classified by more than 37 percent of respondents as having an adverse impact (HIGH or LOW) on financial stability (Figure 3.4). However it should be stressed that around 53 percent of the respondents find these risk NEUTRAL and 10 percent NA to DC schemes116.
Figure 3.4. Risk assessment – replies of RCG-E countries based on expert judgment – DC schemes
Source: FSB RCG-E Survey.
116 For instance the risk in the subdued economic growth resulting in sponsor default has been classified by around 40% of respondents as NA to DC schemes. It should be noticed that this particular feature depending on the jurisdictions can be assessed differently. If occupational DC schemes promoted and financed by sponsor’s regular contributions are the predominant scheme type, this risk factor can be significant.
0% 20% 40% 60% 80% 100%
10. EU bail-in resolution for banks
9. high debt level of private sector
8. search for yield
7. nationalisation
6. subdued economic growth resulting in sponsordefaults
5. investments in traditional assets
4. unfavourable tax move
3. high and long duration unemployment
2. increasing longevity
1. persistent low interest rate
DC Schemes - Main risks average
% of country replies
DC schemes assessment of risks' impact on FS
(out of 17 country replies)
HIGH LOW NEUTRAL NA

67
In the case of the DC schemes, the two main risks identified by the majority of countries – persistent low interest rate and increasing longevity – are assessed as having a smaller impact on financial stability than the high and long duration unemployment. High and long duration unemployment often lead to a disruption on contributions flow, compromising the scheme purpose – the benefits delivery. The impact of persistent low interest rate and increasing longevity is largely limited to the reduction of the final benefit. Additionally, low interest rate and increasing longevity are already materialising in some countries while high and long duration unemployment occurs less frequently.
The persistent low interest rate exhibits a slightly higher percentage of replies for HIGH and LOW for DB schemes vis-à-vis DC schemes (Figure 3.4 and Figure 3.5). This probably reflects the increasing difficulty of DB schemes (sponsors or pension providers) to fulfil the pension benefits promises. However, it has to be noticed that over 50 percent of the replies assess the impact on financial stability as being NEUTRAL.
Figure 3.5. Risk assessment – replies of RCG-E countries based on expert judgment- DB schemes
Source: FSB RCG-E Survey.
Regardless of the scheme type, the major risk factors are, as expected, closely related to the (current) economic and financial environment, which adversely impact investment returns and capital accumulation, leading to an increase in funding costs or, inversely, endangering the value of pension benefits (with an ultimate overall expected higher impact at members). Even though the overall adverse impact on financial stability seems somehow contained according to the survey results (a reduced percentage of respondents classified risk factors as having a high impact on financial stability).
0% 20% 40% 60% 80% 100%
10. herding in DB type of schemes
9. deflation
8.changing labor regulation
7. investments in traditional assets
6. search for yield
5. negative interest rate
4. subdued economic growth resulting in sponsordefaults
3. sudden reversion interest rate
2. increasing longevity
1. persistent low interest rate
DB and other schemes - main risks average
% of country replies
DB schemes assessment of risks' impact on FS
(out of 13 country replies)
HIGH LOW NEUTRAL NA

68
3.2.2.3 Risk transmission from stakeholders to financial stability for the 3 main risks factors The next figures show the differences by scheme type in risk factors’ effects at micro level and identify possible risk transmission channels from stakeholders to financial stability.
Under DC schemes, the 3 main risk factors are mostly classified as HIGH for members, followed by pension providers, and are mostly NEUTRAL or NA to sponsors (Figure 3.6).
Figure 3.6 Risk assessment – replies of RCG-E countries based on expert judgment – DC schemes
Source: FSB RCG-E Survey.
Under DB schemes, the persistent low interest rate and the sudden reversion of interest rate risk are mostly classified as HIGH for pension providers, followed by sponsors and members (Figure 3.7). Hence, members seem to be better protected against investment risk under DB schemes compared with DC schemes.
Regarding the second main risk factor, increasing longevity is mostly classified as high risk for members and pension providers of DB schemes.
Generally, DB schemes have the highest percentage of replies for HIGH and LOW impact replies vis-à-vis DC schemes, for sponsors and pension providers across the three main risks.
0% 20% 40% 60% 80% 100%
member
pension provider
sponsor
member
pension provider
sponsor
member
pension provider
sponsor
high
and
long
dura
tion
unem
ploy
men
tin
crea
sing
long
evity
pers
iste
nt lo
win
tere
st ra
te
% of country replies
Transmission channels of the 3 main risks - DC schemesassessment of risks' impact at stakeholders
HIGH LOW NEUTRAL NA

69
Figure 3.7. Risk assessment – replies of RCG-E countries based on expert judgment – DB schemes
Source: FSB RCG-E Survey.
According to the survey replies and as expected, DC schemes’ risks are mainly borne by the members, because reducing investment returns or contributions will ultimately hamper the pension value (see section 3.1). However, the decrease of savings allocation to voluntary (either occupational or personal) pension products or schemes may also threaten future activity117 of pension providers (if a significant reduction of assets under management occur), and cannot be neglected in the current low interest rate environment or in the event of a sudden reversion of interest rates.
For DB schemes, the adverse impact of risk factors (measured by the high percentage of replies with high and low impact) appears across all stakeholders. One possible interpretation is that DB schemes spread the risk among all stakeholders while DC schemes concentrate risks at the member level. This asymmetric risk allocation might be seen as unfavourable from the long-term economy and financial stability perspective, in particular in a context increasing importance of DC schemes vis-à-vis DB schemes.
For DB schemes, risk factors may affect pension providers or sponsors as liabilities owners. In pension schemes or products entailing some kind of guarantee (financial or whole life guarantee), sponsors or providers may be called to reinforce contributions to the scheme or pay funds to reduce/eliminate the potential negative impact of risk factors on pension benefits. Notwithstanding, even under DB schemes, members may be adversely impacted by the above identified risk factors. In case funding ratios are poor, pension benefits might be cut down if sponsor support and/or pension protection schemes are absent.
117 Pension sector intermediation function: pooling private entities savings and financing the whole economy.
0% 20% 40% 60% 80% 100%
member
pension provider
sponsor
member
pension provider
sponsor
member
pension provider
sponsorsu
dden
reve
rsio
nin
tere
st ra
tein
crea
sing
long
evity
pers
iste
nt lo
win
tere
st ra
te
% of country replies
Transmission channels of the 3 main risks - DB schemesassessment of risks' impact at stakeholders
HIGH LOW NEUTRAL NA

70
3.2.2.4 Stabilizing factors at macro-level Respondents were asked to provide a risk assessment net of stabilizing factors while mentioning, for each risk factor, the possible stabilizing factors. In order to make the analysis more transparent and comparable, all stabilizing factors mentioned by respondents have been assigned to the following main categories118:
• prudential regulation: valuation rules, buffer requirements, recovery plans, governance, prudent person rule, investment rules and transitional measures
• benefit adjustment and security mechanisms: sponsor support, protection schemes and benefit adjustments
• investment behaviour: risk transfer mechanisms, countercyclicality and investment strategy • pension design: variable decumulation, pension scheme or product design and retirement age • other: for example fiscal rules, transparency and transfer regulation.
Given that respondents were asked to provide their risk assessment net of stabilizing factors, the positive effect of the stabilizing factors should already be reflected in the final risk assessment. A full cause and effect analysis is hence not possible.
The analysis of the stabilizing factors has been conducted along the lines of the 5 risk categories defined in Section 3.2.1. The other risk factors that respondents additionally identified have been allocated to one of the 5 predefined categories.
The figures in this section show the type of stabilizing factors119, separately for DB and DC schemes, for each of the top 3 risks that have been highlighted by most respondents as one of the main risks for financial stability.
It was analysed if these risks are being or could be mitigated by the existence of stabilizing factors. Therefore we have looked into the differences of risk assessment between the replies where stabilizing factors were mentioned and those where no stabilizing factors were mentioned120. Irrespective of the focus on financial stability, the impact at micro-level is mentioned as well.
Stabilizing factors for persistent low interest rate: first main risk for DB and DC schemes
For DC schemes: Seven countries have indicated the existence of stabilizing factors for the risk of persistent low interest rate. The most important stabilizing factors are related to the investment behaviour (4 countries), especially the countercyclical behaviour and risk transfer mechanisms. Several other factors have been mentioned pertaining to the categories prudential regulation (3 countries), pension design (2 countries) and benefit adjustment and security mechanisms (2 countries). Six countries have also mentioned other stabilizing factors such as fiscal rules (2 countries), increase savings (2 countries) and transparency rules, state pensions as a fall back, higher contributions/premiums and no obligatory guarantees for sponsors and providers (each time 1 country) (Figure 3.8, left column).
118 For a detailed description of each of these stabilizing factors please see Annex 3.3. 119 The graphs show the average amongst countries of the number of times a country has indicated the existence of a certain stabilizing factor (grouped by category) divided by the number of times a country has indicated a stabilizing factor at all. It thus shows the relative importance, amongst countries, of the different stabilizing categories. 120 More complete data is available in Annex 4.4.

71
Figure 3.8. Stabilizing factors for persistent low interest rate
Source: FSB RCG-E Survey.
These seven countries have scored this risk especially HIGH for members at micro-level, whereas mostly LOW at macro-level.
For this risk factor, 10 countries did not indicate the existence of any stabilizing factor. These countries have scored this risk especially HIGH for members at micro-level, whereas mostly NEUTRAL at macro-level.
The existence of stabilizing factors shows no or even an increasing negative impact on the risk assessment for the pension provider comparing countries of respondents providing stabilizing factors and those without.121 However, the impact on economy was assessed much lower by those countries that did not provide stabilizing factors for this risk. This confirms the same conclusion as for DB schemes, i.e. it could mean that the latter countries did not consider pertinent to mention any stabilizing factors, probably because they considered the impact at macro-level anyway as NEUTRAL.
For DB schemes: In total 11 countries have indicated the existence of stabilizing factors for persistent low interest rate risk, of which the most important is prudential regulation (mentioned by 8 countries), and more precisely governance rules, such as risk management requirements (4 countries) and the possibility to
121 There are more responses HIGH and LOW for the impact on the pension provider by countries with stabilizing factors compared to the countries without stabilizing factors. The latter have more responses NEUTRAL. See tables in Annex 4.

72
spread the impact over time through recovery plans (5 countries). The valuation of liabilities has also been marked as an important stabilizing factor (6 countries). Within the considered ten year horizon, respondents have indicated that the risks from a persistent low interest rate environment can be mitigated by deviating from the market consistent valuation as allowed by the IORP Directive, such as setting a discount rate independent from the risk-free rate, flexibility in determining the discount rate or using an ultimate forward rate. Also the existence of benefit adjustment and security mechanisms (8 countries), such as sponsor support (7 countries), protection schemes (2 countries) or benefit adjustment mechanisms (3 countries) have been mentioned, as well as investment behaviour (6 countries), specifically risk transfer mechanisms, e.g. by means of interest rate hedging and other types of derivatives (5 countries) (Figure 3.8, right column).
These 11 countries have scored this risk especially HIGH for providers and sponsors at micro-level, although the stabilizing factors mentioned serve especially the pension providers. Members were scored mostly LOW to NEUTRAL, which could be explained by the fact that mitigating the immediate financial impact for the pension provider, the member is also partly protected from this impact.
The countries that did not mention stabilizing factors (in total only 3 countries) mostly scored this risk as a high impact for members.
The 11 countries that have provided stabilizing factors for this risk have assessed the impact on the financial stability and the economy higher than the 3 countries that did not provide stabilizing factors122. Given the small sample size it is not possible to draw any firm conclusions on this. It could mean that the latter countries did not consider pertinent to mention any stabilizing factors, probably because they considered the impact at macro-level anyway as NEUTRAL123.
Stabilizing factors for increasing longevity: second main risk for DB and DC schemes
For DC schemes: In total 10 countries have indicated the existence of stabilizing factors for longevity risk, of which the most important are pension design (4 countries), such as postponing retirement (3 countries) and variable decumulation (1 country). 3 countries have mentioned investment behaviour as stabilizing factor, referring to countercyclical behaviour (2 countries) and risk transfer mechanisms (2 countries) and 3 countries have mentioned prudential regulation, such as governance rules (2 countries), buffers (1 country) and recovery plans (1 country) (Figure 3.9, left column).
122 There are more responses HIGH and LOW for the countries with stabilizing factors compared to the countries without stabilizing factors. The latter have more responses NEUTRAL. See tables in Annex 4. 123 E.g. one of the countries did not provide any stabilizing factors for any risk factor and mentioned that due to the small size of the pensions sector the impact would be considerably less important than in some other countries.

73
Figure 3.9. Stabilizing factors for increasing longevity
Source: FSB RCG-E Survey.
These 10 countries have scored this risk especially HIGH for the members at micro-level, whereas mostly LOW to NEUTRAL at macro-level124.
The countries that did not mention stabilizing factors (in total 7 countries) mostly scored longevity risk as a high impact for members, but also in a lesser extent for pension providers. Again, it seems that the countries that did not mention any stabilizing factors, assess the risks at macro-level lower than the countries that did mention stabilizing factors.
For DB schemes: In total 11 countries have indicated the existence of stabilizing factors for longevity risk, of which the most important are benefit adjustment and security mechanisms (7 countries), such as sponsor support (6 countries), pension protection schemes (2 countries) and benefit adjustment mechanisms (3 countries). Also prudential regulation has been mentioned by 6 countries, such as recovery plans (4 countries), governance rules (3 countries) and valuation rules and safety margins in mortality tables (2 countries) (Figure 3.9, right column).
These 11 countries have scored this risk relatively HIGH for the members at micro-level, whereas mostly LOW to NEUTRAL at macro-level.
124 See tables in Annex 4 providing figures for countries with and without stabilizing factors.

74
The countries that did not mention stabilizing factors (in total only 4 countries) mostly scored this risk as a high impact for pension providers, and also relatively high for members. The risk assessment does not differ much though at macro-level. The countries that have provided stabilizing factors for this risk have assessed the impact on the financial stability125 and especially the economy126 higher than those that did not provide stabilizing factors. Given the small sample size of the latter (4 countries) it is not possible to draw any final conclusions on this. It could mean that the latter countries did not consider pertinent to mention any stabilizing factors, probably because they considered the impact at macro-level anyway as NEUTRAL.
Stabilizing factors for sudden reversion interest rate: third main risk for DB schemes
In total 10 countries have indicated the existence of stabilizing factors for the risk of a sudden reversion of interest rates, of which the most important is prudential regulation (mentioned by 8 countries), and more precisely valuation rules (5 countries), recovery plans (5 countries), governance rules (3 countries) and buffers (2 countries) (Figure 3.10, right column).
Figure 3.10. Stabilizing factors for sudden reversion interest rate
Source: FSB RCG-E Survey.
125 There are slightly more responses LOW for the impact on financial stability by countries with stabilizing factors compared to the countries without stabilizing factors. The latter have slightly more responses NEUTRAL. See tables in Annex 4. 126 There are more responses LOW for the impact on economy by countries with stabilizing factors compared to the countries without stabilizing factors. The latter have more responses NEUTRAL. See tables in Annex 4.

75
Stabilizing factors for high and long duration unemployment: third main risk for DC schemes
Only 3 countries have indicated the existence of stabilizing factors for the impact of high and long duration unemployment. Given the small sample size it is not possible to draw firm conclusions. Furthermore the stabilizing factors mentioned are from a varying nature (Figure 3.11, left column).
Figure 3.11. Stabilizing factors for high and long duration unemployment
Source: FSB RCG-E Survey.
These 3 countries have scored this risk relatively HIGH for providers and members at micro-level, whereas mostly LOW to NEUTRAL at macro-level127.
In total 13 countries did not mention stabilizing factors. They mostly scored this risk as a high impact for members at micro-level and relatively high at macro-level. In fact, they have assessed the impact on financial stability and economy higher than those that did provide stabilizing factors.
127 See tables in Annex 4 providing figures for countries with and without stabilizing factors.

76
3.2.3 Overall risk assessment (all risks/all countries) 3.2.3.1 Risk assessment for micro & macro-level The classification of all pre-defined risks factors128 by all respondents of the survey (19 countries) indicates that the pension schemes pose high risks to financial stability and/or the economy risks only in a small number of countries (Figure 3.12). Thus, the overall impact for all risk factors is considered HIGH by 4 percent of respondents and LOW for 28 percent of respondents, while the majority of respondents (51 percent) assessed risks as NEUTRAL and 22 percent classified them as NA 129.
Similarly, regarding the overall impact on the economy, on average, less than 3 percent of respondents scored risk impacts as HIGH and 35 percent of respondents as LOW, while again the majority of respondents (41 percent) assessed risks as NEUTRAL and 21 percent of respondents classified the risks as NA.
Figure 3.12. Overall risks classification – replies of RCG-E countries based on expert judgment
Source: FSB RCG-E Survey.
128 It is important to note that this graph adds up the risk assessments for all risk factors not considering the importance or the impact of each risk factor related to another risk factor. In fact respondents were asked to assess each of the risk factors independently from each other. This graph can therefore not be interpreted as providing an estimate of the current level of risk imposed on the financial system, the economy or on the stakeholders. 129 See Annex 4. Individual Country Replies.
0%
10%
20%
30%
40%
50%
60%
70%
80%
90%
100%
FinancialStability
Economy Members P.Providers Sponsors
Macro level Micro level
all risks' impact classification - all schemes(average % of country replies by risk impact category)
HIGH LOW NEUTRAL NA

77
It should be mentioned that some of the reasons behind the high percentage of neutral impact replies, as noted by some countries, could be related with the sector dimension (see section 1.3.1) or with the existence of stabilizing factors. Furthermore while the non-applicable responses seem often associated with the idiosyncratic nature of different pension benefits, being some of the predefined risk factors non relevant for some of the scheme types/products or with the lack of empirical analysis on private pension schemes that support empirical judgment (and the survey’s replies). The recognized heterogeneity amongst predominant pension schemes across countries could also be closely linked to the high dispersion on risk assessment.
Nevertheless, in order to investigate the most important risk transmission channels from micro to macro level, the impact at stakeholders was also classified by respondents:
- Members are expected to be the most distressed group amongst stakeholders with HIGH risk impact reaching 25 percent of the respondents and LOW risk impact reaching 31 percent of respondents. Yet, 26 percent of the respondents assessed the risk factors as NEUTRAL.
- Providers follow, with HIGH risk impact reaching 18 percent of respondents and LOW risk impact selected by 26 percent of respondents. However, around 29 percent of the respondents perceived this risks factors associated to pensions sector as NEUTRAL for financial stability.
- Less than 19 percent of respondents scored risk factors as significant, HIGH or LOW impact, for Sponsors. While 81 percent of respondents score predefined risk factors NEUTRAL or NA for Sponsors.
3.2.3.2 Overall impact on Financial Stability by scheme type130 On average the financial stability implications by scheme type are similar, though a slightly higher risk impact is observed from DC schemes (on average, 4 percent of respondents signal HIGH impact risks for DC schemes compared to 1 percent for DB schemes) (Figure 3.13 and Figure 3.14). Likewise, the percentage of LOW impact responses is similar regardless of the scheme types (on average, 28 percent for DC schemes compared to 27 percent of respondents for DB schemes).
Although these overall results do not show much difference between DC schemes and DB schemes, it is worth investigating the impact separately as there are major functional differences between these categories, e.g. regarding the risk sharing mechanisms, entailing different risks, in particular for members and sponsors (such as, but not limited to, financial or longevity risks).
130 As presented in the Annex 3, the DC schemes represent 42% of the replies and the DB schemes the remaining 58%.

78
Figure 3.13. Overall risks classification of RCG-E countries based on expert judgment– DC schemes (out of 17 country replies)
Source: FSB RCG-E Survey.
Regarding micro-level impact, respondents considered a higher percentage of members in DC schemes percent or products to be exposed to some of the pre-identified risks in the assessment than in DB schemes or products (around 2/3 and 46 percent, respectively). In the case of DB, respondents classified the risk impact as HIGH in 19 percent of the cases and 27 percent as LOW risk impact.
While for DB schemes pension providers and members exhibit a similar percentage of replies for significant impact, pension provider are expected to be slightly more impacted (21 percent with HIGH risk impact and 25 percent with LOW). Regarding sponsors of DC schemes, the percentage of HIGH and LOW impact responses is very small, with HIGH impact responses associated to DB schemes having a higher percentage of replies (16 percent percent).
0%
10%
20%
30%
40%
50%
60%
70%
80%
90%
100%
FinancialStability
Economy Members P.Providers Sponsors
Macro level Micro level
all risks' impact classification - DC schemes(average of country replies by risk impact category)
HIGH LOW NEUTRAL NA

79
Figure 3.14. Overall risks classification of RCG-E countries based on expert judgment– DB schemes (out of 13 country replies)
Source: FSB RCG-E Survey.
3.2.3.3 Overall picture of stabilizing factors On an aggregated European level that there exist at least 1 or more stabilizing factors for each of the risk factors. However, the same is not true at national level. This does not necessarily mean that risks are not being mitigated in those countries. In fact it seems from the responses that the relative size of the pensions sector is in itself a reason why many risks are currently not predominant at macro-level.
The following figures show the average share of responses with no stabilizing factors mentioned compared to responses where one (or more) stabilizing factor(s) has been mentioned. For comparison the figures show the relative averages131.
Figure 3.15 shows that there are more stabilizing factors for DB schemes. For DB schemes, a majority of respondents observed stabilizing factors in relation to economic & financial risk factors, behavioural factors and operational & governance factors.
131 100% stacked columns.
0%
10%
20%
30%
40%
50%
60%
70%
80%
90%
100%
FinancialStability
Economy Members P.Providers Sponsors
Macro level Micro level
all risks' impact classification - DB schemes(average of country replies by risk impact category)
HIGH LOW NEUTRAL NA

80
Figure 3.15 Relative importance of the existence of stabilizing factors by risk factor and scheme type
Source: FSB RCG-E Survey.
Figure 3.16 shows that prudential regulation is the most important stabilizing factor for both scheme types. For DB schemes the 2nd major stabilizing factor is ‘benefit adjustment and security mechanisms’. This is logic considering its purpose and design (see Chapter 2). A variety of other stabilizing factors are important to mitigate risks for especially DC schemes, in order of importance: increase of savings132, transparency rules, fiscal rules and transfer regulation. The same factors can be seen in the same order for DB schemes. For a full description of the stabilizing factors we refer to Annex 3.3.
It should be noted that most stabilizing factors mitigate in first instance risks at micro-level, by limiting the impact on either the member, the sponsor or the pension provider. The fact that risks are mitigated at this level means that less risk is being channelled to the macro-level.
132 Increase of savings may, however, represent a mere shift in private savings towards the pension scheme, and could hence have a negative impact on consumption, and thus the economy.

81
Figure 3.16 Relative importance of stabilizing factors by scheme type
Source: FSB RCG-E Survey.
Looking into the stabilizing factors for each of the risk categories separately shows a more distinct picture, especially for DC schemes: prudential regulation is not so important to mitigate risks from a demographic nature (Figure 3.17). In fact, especially pension design (such as increasing the retirement age and changing the design of the plan) becomes important to mitigate demographic risks (e.g. pension benefits related to demographic characteristics of subscribers), and a variety of other factors play especially a role in stabilizing risks from a political or regulatory nature.
Security mechanisms are able to mitigate all type of risks for DB schemes, whereas pension design is also important for demographic risks.
Finally, investment behaviour is important for both DB and DC schemes. For DB schemes, respondents essentially mentioned the use of risk transfer mechanisms (financial instruments or via insurance) to transfer risks to a third party. Such risks maybe transferred out of the pension schemes but remains in the financial system. It also exposes the pension provider to counterparty risk. For DC schemes, respondents mostly mentioned countercyclical behaviour as a stabilizing factor.

82
Figure 3.17 Relative importance of the stabilizing factors by risk factor and scheme type
Source: FSB RCG-E Survey.
3.3 Transmission mechanisms from private pension schemes to financial stability and real economy As mentioned before, private pension schemes - occupational or personal - have presented, on average, a growth of importance in the last decades in the RCG-E jurisdictions (see section 1.2), though the relative importance of private pension schemes' providers as financial intermediaries differentiates among countries of the RCG-E region. On average, almost half of the population has access to private pension schemes and their aggregated assets represent around 50 percent of the GDP133. This implies that risks faced by the pension’s sector are not negligible for the economy as a whole and therefore also relevant for other sectors.
The FSB RCG-E Survey results (see section 3.2) show that in particular pension scheme members are expected to be most affected by the risks analysed (Figure 3.12). In conjunction with the size of private pension schemes in households’ financial assets − counting for about 21 percent on average in the RCG-E countries, but again with high heterogeneity among countries (Figure 3.18) − this means that any adverse development may lead to potential disruptions in the provision of long-term financing, not only through a potential reallocation of assets in the households' portfolios as a result of increasing contributions and/or the reduction of benefits in the pensions part of their portfolio, but also by a
133 See figures 1.3 and 1.2, respectively, in Chapter 1.

83
potential reallocation of assets by pension providers impacting the counterparties of the pension provider (through buying/selling assets) 134. Furthermore, the pension schemes' stakeholders will also be impacted by such changes (through a change in risk/return profile).
Figure 3.18. Households’ financial assets in 2014
Note: France did not report on the pensions’ entitlements and the figure for Iceland correspond to total assets on “Insurance, pension and standardised guarantees”. Source: OECD DB (SNA2008 Financial Accounts, balance sheet data).
This has implications not only for financial stability but also for the real economy as well. The several stakeholders of the pension plans - members, providers and sponsors - may act as direct or indirect transmission channels to the real economy.
For pension schemes’ members, potential adjustments in contributions or in benefits lead to a change of their disposable income and that may occur in a scenario of misaligned saving decisions, where individuals consume too much or save too little considering their expected pension benefits. Such behaviour from a group of individuals may have negative implications in terms of households saving, economy investment, capital accumulation and potential growth. In addition to a direct adjustment in contributions or in benefits, disposable income will also be impacted by a possible increase in fees charged135. Such increase in fee charges could be the result of pension providers' changing business profile136 and/or by individuals changing type of pension provider.
134 The counterparties refer in this context to the issuers of securities in which the pension provider invests. 135 The fee level is not trivial in pension savings due to the long horizon. Studies referred in EP (2014) found that an annual management fee of 0.75% can consume around 12% of total saving over a 30-year period or a 1% fee can lower pensions by 20% over a 40-year working life. As they are subject to large economies of scale management fees tend to be higher in individual plans than in occupational or pooled ones. 136 Because of changes in profitability and cost structures.
31.7
30.9
6.4 6.56.6
21.0
8.1
0.0
14.3
3.6
73.930.4 29.9
6.13.0
58.5
27.210.0 6.1
8.2
29.6 34.1
50.2
20.7
12.6
4.1
-20.0
0.0
20.0
40.0
60.0
80.0
100.0
120.0HH portfolio composition (% total financial assets)
Currency and deposits Securities and equity
Pension entitlements, claims of PF on pens. Managers… Other insurance and standardised guarantees
Other

84
Where members have the choice, reputational risk of the pension sector may lead households to redirect their savings from voluntary private pension schemes or products to alternative assets typically with lower diversification and returns and/or higher risk. This may increase households’ exposure to pension risks such as longevity or investment risk. As a result, the asset allocation may turn less efficient with implications for both financial stability and potential growth. In addition, the demand for real estate assets may increase, leading to a decrease in capital flows in financial market. However, it should be borne in mind that tax incentives and possible supplements may play a role in households’ decisions to allocate their savings to voluntary pension schemes.
Pension providers, may become financially constrained and may reduce their net lending capacity to the other sectors of the economy - corporations (directly in capital markets or via financial intermediaries), general government - and therefore hampering private and public investment.
In their search for increased profitability providers may tend to shift their investment allocation to less costly investment strategies such as passive index funds offered by asset management firms. The strong growth of index investing could entail new financial stability challenges, because of less diversity on the buy side and higher propensity of investors to respond in the same way to shocks.
Providers or sponsors may also have difficulties to meet cash outflows on large stocks of existing liabilities contracted in past periods of higher interest rates by only altering asset portfolios. Such situation might require additional capital and, in order to increase their contributions, sponsors will tend to reduce the cash flows available for investment and/or increase the funding costs to the economy. This may concur to the so-called “savings glut” or “investment drought” in the corporate sector in some countries, where the expected need to cover gaps in pension schemes may have decreased investment and increased cash buffers.
At the extreme, providers’ and/or sponsors’ financial support to pension schemes may threaten the solvency and sustainability of these entities. In turn, this incentivizes the closure of current pension schemes or inhibit sponsors to set-up new pension schemes as they become unaffordable.
Such changes may entail considerable implications on financial stability, depending on the dimension of the scheme(s) and its (their) inter-linkages with the other financial entities (banks and other creditors or issuers of assets held by pension funds).
Depending on the regulatory framework in which providers operate and the type of pension scheme (DB/DC), the level of risk sharing differs among stakeholders and hence the transmission mechanisms to financial stability and real economy. However, irrespective of the regulatory framework or the type of pension scheme, stakeholders are not immune to what happens to the other stakeholders of the pension scheme. This means that there is also transmission of risks possible at scheme level. There could even be creation of risks for one of the stakeholders by attempting to contain risks for one of the other stakeholders.
However, as laid down in the previous sections the potential impact on financial stability depends on the size of the schemes and the potential stabilizing factors that exist in a country and that mitigate potential risks.

85
The cases of the two main risks identified in the survey
As discussed in section 3.2.2., on the assessment of the three main risks for the financial stability, some dispersion of the results was observed but the two main risks identified for both DC and DB schemes were persistent low interest rates (selected as the 1st and a 2nd major risk by 10 countries) and increasing longevity (selected as a top three main risk by 6 countries).
The combination of population ageing and slower productivity growth common to many advanced countries may conceptually generate a steady state of lower growth and lower nominal and real interest rates in these countries. In such a scenario, yield curves would likely flatten posing long-lasting challenges to financial intermediaries, including pension schemes (especially DB).
Persistent low interest rates
- Impact on financial stability Fixed income securities constitute a significant share of pension fund’s portfolio (more than 40 percent on average). Persistent low interest rates not only reduces the profitability of investments but increases the present value of liabilities. In DB schemes, a fall in interest rates and a flat yield curve result in a decrease of the funding ratio and may lead to deficits. If the low interest rate environment persists, such deficits need to be funded. Sponsors or providers may be called to reinforce contributions to the scheme or pay funds to reduce/eliminate the potential negative impact of the low interest rate. In addition or alternatively, pension benefits might be cut down if sponsor support and/or pension protection schemes are absent. Reinvestment risk emerges, which can incentivize a search for yield behaviour, in particular in the case of the DB plans137. This may lead to an excessive risk taking of the pension provider, whether or not urged by the sponsor.
Moreover, providers may transfer market risk to other financial intermediaries (via reinsurance, bank deposits, derivatives, other investments), potentially with some efficiency losses in its management and increasing the interconnectedness within the financial sector, especially as financial innovation develops in this domain138.
Another movement of risk transfer that is already taking place – at different paces and extents across countries – is the move towards DC plans that may alleviate some of these vulnerabilities for the financial intermediaries while households will bear most of the risks related to their future pension income. For young employees, who value labour mobility, the portability may turn DC more attractive. However, this may result in a suboptimal allocation of risk in the economy as households tend to be more risk-averse than financial intermediaries. Household’s future pension will depend upon the evolution of financial markets which may also result in a more volatile or even reduced income at retirement. But
137 On aggregate terms, DB still account for almost 60% of AuM while DC plans account for about 40%. 138 Interconnectedness within financial entities, sectors, geographies arises from several mechanisms, such as: i) direct financial exposures such as cross-holdings of assets between them; ii) price contagion, i.e. the reaction of assets prices to each other; and iii) contingent exposures resulting from the use of derivatives, securities lending and similar instruments. Higher interconnectedness increases the potential for materialization of systemic risks.

86
as a result of the sub-optimal management of risk by households, in times of financial market stress, their pension assets may be subject to large realization of losses, which could have negative wealth effects and could reinforce the downturn.
- Impact on real economy Low interest rates have direct implications in pension schemes returns irrespective of the scheme type.
In the case of DC plans, low interest rates reduce the expected income at retirement and households (when they become aware of that) may adjust smoothly by increasing their precautionary savings in the active phase, with impact in terms of spending and well-being. Alternatively, if they are already in a pre-retirement phase, they may adjust abruptly by increasing contributions/premia or will be faced with lower benefits at retirement. This will have an effect on the wider economy due to the negative impact on aggregated demand in the future. Equally, members might choose alternative forms of retirement provision for example by investing in real estate, thereby increasing housing prices, or may decide not to save for retirement at all, thereby increasing the poverty risk and thus the burden on State budgets.
The income gap can partially be offset through increasing working hours or postponing retirement. Such increased labour supply could mitigate the impact in terms of economic growth. However, the reaction of members to such events that lower the expected pension income and the impact thereof will greatly depend on the remaining time until retirement.
In the case of DB plans, though the first impact of persistent low interest rates (as with most pension schemes' risks) may be faced by sponsors, on a second stage, the risks may be transmitted to members (via potential benefit reductions, if sponsor support and/or pension protection schemes are absent, potential higher contributions or fees and lower pension promises), and more broadly to employees (via lower wages), shareholders (via lower profits) and the economy in general (via effects on prices). One example of the possible via of adjustment in case of insolvent issuers of long term guarantees in a low interest rate environment is presented in Box 3.3.
Increasing longevity
- Impact on financial stability Individual lifespan is uncertain but the recent trends point to a sustained increase in life expectancy139. There is a risk that one may outlive pension means and/or the pension providers and/or sponsors may suffer an additional financial gap pressure, in particular in the case of life-long annuity payments. They may increase the risk exposure and may also transfer longevity risk to other financial intermediaries, increasing the financial interconnectedness. Rising longevity would likely boost the demand for health and long-term care insurance while
139 Between 1960 and 2012 life expectancy at birth had increased by almost 10 years on average in the EU countries and, according to Eurostat projections, until 2060, 6.5 additional years are expected on average. For life expectancy at 65, the projected increase is of about 4.5 years.

87
the pension schemes and saving products offered by pension providers could be expected to change in the long run. Another consequence is the increasing tendency to link the statutory pension age to longevity gains to partially offset the longevity risk faced by DB (and PAYG public) schemes. This demographic trend may also favour precautionary savings through personal pension products set on a voluntary basis with the implications mentioned above.
- Impact on real economy Ageing population is expected to significantly reduce labour supply at the European level, ceteris paribus, impacting negatively on the economic potential growth. Apart from the extension of active life (by postponing retirement), one possible way to overcome this reduction in labour supply would be through an increase in productivity but that can be constrained as well by lower funds available for investment.
Especially in the case of DC plans, the individual behaviour of members depends very much on their awareness of the uncertainty of their future pension income, not only related to the growth of their pension assets during the active phase (via volatile investment returns), but also related to the annuities that might be bought at the time of retirement (increased pricing) or the number of years their savings will last. Individuals may decide to increase their contributions to the pension schemes or reallocate their savings to other financial assets, with or without a minimum income guaranteed, or even to non-financial assets.
However, the observed downwards trend of households saving rate at the European level suggests that individuals may be taking suboptimal decisions of consumption/saving by consuming too much and saving too little, with, on aggregate, impact on capital accumulation and therefore on the potential future growth of the economy.
In this scenario, the pooled management of household life cycle risks would likely decline, the role of pension schemes as long term investment financing vehicles, while smoothing inter-generational income may diminish. As explained above, the increased risks faced by the households are not neutral for financial or real economy developments either.

88
Box 3.3 Case Study: Long term guarantees, low interest rates and the insolvency of the Norwegian life insurance company Silver140
The insolvency of the life insurance company Silver Pensjonsforsikring AS (“Silver”) is an example of the challenges facing issuers of long term guarantees in a low interest rate environment. Silver was founded in 2005 and the company was specialising in receiving from other life insurance companies individual paid-up policies from defined benefit occupational pension schemes organized in Norway. When the Norwegian Ministry of Finance (MOF) put Silver under public administration in February 2017 the company had about NOK 10 bn (EUR 1 bn) in total assets and about 20 000 customers (individuals) and about 2 000 pensioners were receiving monthly pension payments. Solvency II was introduced in Norway 1 January 2016, but Silver had been given an exemption from Solvency II until 15 February 2017. The exemption period was not prolonged and when public administration was initiated two days later, the MOF stated that Silver did not comply with the minimum solvency capital ratio and that there was no realistic plan for how to comply with the requirement.
The estimated capital shortfall in Silver necessary to comply with Solvency II at the end of 2016 was about NOK 3 bn. Long term guarantees require more regulatory capital under a risk based regulatory regime, especially when interest rates are low. Other Norwegian insurance companies are more diversified than Silver and have been able to comply with Solvency II.
The administration board will evaluate alternative solutions that best serve the interest of the insurance claimants. Pensions under payment were reduced by 50 percent until a final solution is found. According to law, one of the options is to transfer the claims with accompanying assets to one or several other insurance companies. This will typically take place after a haircut has been made to the claims. The administration board may propose to change the terms of the paid-up policies to paid-up policies with investment choice. Contracts with investment choice resemble defined contribution contracts, where the policy holder is carrying the investment risk. The administration board’s proposal may be rejected by claimants representing at least 20 percent of total claims. In that case, a haircut will be made to the claims and the company will continue as a mutual insurance company where the claimants are the owners of the company.
3.4 Future challenges The combination of population ageing and (the related) slower productivity growth common to many advanced countries may conceptually generate a steady state of lower growth and lower nominal and real interest rates in these countries. In such a scenario, yield curves would likely flatten posing long-lasting challenges to financial intermediaries, including pension schemes (especially DB).
At the current stage, low yield environment continues to support the change from DB to DC schemes, leaving members increasingly exposed to pension risks, broadly investment and longevity risks. In the long term, this trend may divert household savings from pension products to other financial and non-financial assets, like deposits or real estate investments, which may be perceived as substitutes with a better risk-return profile, in absence of products that protect households from pensions risk (with or without tax incentives).
Besides the level of the interest rate, the changes in its level, i.e. volatility, may also constitute a risk factor. For instance, a sudden increase in interest rates will imply a drop in prices and, if this is sustained, could lead to the realization of losses if providers need to sell assets to meet payouts. Abrupt repricing in fixed income markets is currently evaluated as a significant risk. In a context of increasing importance of pension providers, those movements have the potential to amplify financial
140 A detailed description of this case study can be found in Annex 0.1.

89
stability risks. In particular, they may have implications in terms of increasing the overall market financing costs posing debt sustainability challenges in sovereign, corporate and household sectors as well.
Private pension schemes and the context in which they are operated differ significantly across the European region and therefore countries and stakeholders face different challenges. Depending on the regulatory framework in which providers operate and the type of pension scheme (DB/DC), the level of risk sharing differs among stakeholders and hence the transmission mechanisms to financial stability and real economy. However, irrespective of the regulatory framework or the type of pension scheme, stakeholders are not immune to what happens to the other stakeholders of the pension scheme and whenever necessary adjustments in the pension systems should take place to maintain their sustainability. In countries facing a decline in pensions' savings, automatic enrolment schemes – as the example from the UK presented in this report – could fill the gap, increasing the population coverage by pension schemes, because they may potentially cover self-employed persons too. Fiscal incentives may play a role here. In relation to the scheme type, considering the increasing role of DC schemes, members’ information needs to be improved, in particular regarding risk mutualisation and asset management.
In the future, promotion of pension products should reflect their potential stabilizing role for financial markets. The maintenance of multi-pillar pension systems, where funded pension plans complement PAYG public schemes in providing retirement income, while diversifying the risk can be also advisable to promote the stabilizing role of the pension systems.
Furthermore, pension schemes/products valuation and prudential rules should be consistent with the long term nature of the pension promise/product, while ensuring that members and beneficiaries will be protected and regulatory provisions will be complied with.

90
References:
Aleksandar Andonov, Rob M.M.J. Bauer, K.J. Martijn Cremers (2017), Pension Fund Asset Allocation and Liability Discount Rates, Review of Financial Studies (2017), Volume 30 (8), Pages 2555-2595 Boermans, M., J. Frost and S. Steins Bisschop (2016), A shock to the system? Market illiquidity and concentrated holdings in European bond markets, DNB Occasional Studies https://www.dnb.nl/binaries/1600019_WEB_tcm46-337345.pdf Broeders, D., D. Chen, P. Minderhoud and W. Schudel (2016), Pension funds’ herding, DNB Working Paper no. 503. https://www.dnb.nl/en/binaries/Working%20paper%20503_tcm47-338351.pdf COVIP (Commissione Di Vigilanza Sui Fondi Pensione), Relazione Per L’Anno 2009, Pension Funds Supervision Commission (COVIP). http://www.covip.it/?cat=35. Directive 2003/41/EC of the European Parliament and the Council of 3 June 2003 on the activities and supervision of institutions for occupational retirement provision; OJ L 235, 23.9.2003, p. 10 Directive 2009/138/EC of the European Parliament and the Council of 25 November 2009 on the taking-up and pursuit of the business of Insurance and Reinsurance (Solvency II); OJ L 335, 17.12.2009 Discussion Paper on Potential Harmonisation of Recovery and Resolution Frameworks for Insurers, December 2016 Duijm, P. and S. Steins Bisschop (2015), Short-termism of long-term investors? The investment behaviour of Dutch insurance companies and pension funds, DNB Working Paper no. 489 https://www.dnb.nl/en/binaries/Working%20Paper%20489_tcm47-335347.pdf EIOPA (2015), IORPs Stress Test Report, retrieved from: https://eiopa.europa.eu/Publications/Surveys/EIOPA%20IORPs%20Stress%20Test%20Report%202015%20bookmarks.pdf
EIOPA (2016), Market Development Report on Occupational Pensions and Cross-border Institutions for Occupational Retirement Provisions. Retrieved from: https://eiopa.europa.eu/Publications/Reports/EIOPA-BoS-16-222_2016%20market%20development%20report%202016.pdf
EIOPA (2016), Financial Stability Report. Retrieved from: https://eiopa.europa.eu/Publications/Reports/Financial_Stability_Report_December%202016.pdf EIOPA (2016), Report on long-term guarantees measures and measures on equity risk 2016. EIOPA-BoS-16/279. Retrieved from: https://eiopa.europa.eu/Publications/Responses/EIOPA-BoS-16-279_LTG_REPORT_2016.pdf

91
EIOPA (2016), Opinion to EU Institutions on a Common Framework for Risk Assessment and Transparency for IORPs, EIOPA-BoS-16/075, 14 April 2016. Retrieved from: https://eiopa.europa.eu/Publications/Opinions/EIOPA-BoS-16-075-Opinion_to_EU_Institutions_Common_Framework_IORPs.pdf EIOPA (2016), EIOPA's advice on the development of an EU Single Market for personal pension products (PPP). Retrieved from: https://eiopa.europa.eu/Publications/Consultations/EIOPA%27s%20advice%20on%20the%20development%20of%20an%20EU%20single%20market%20for%20personal%20pension%20products.pdf EIOPA Database of pension plans and products in the EEA. Retrieved from: https://eiopa.europa.eu/Pages/Supervision/Database-of-pension-plans-and-products-in-the-EEA.aspx ESRB (2016), Cyclical investment behavior across financial institutions, Working Paper Series, No 18 / July https://www.esrb.europa.eu/pub/pdf/wp/esrbwp18.en.pdf?e853a4ba16e926921a9c72b46a427b4a EU Directive (2008/94/EC) DIRECTIVE 2008/94/EC OF THE EUROPEAN PARLIAMENT AND OF THE COUNCIL of 22 October 2008 on the protection of employees in the event of the insolvency of their employer. http://ec.europa.eu/social/main.jsp?catId=706&intPageId=198&langId=en European Commission. Press release. The economic crisis and pensions in the EU, http://europa.eu/rapid/press-release_MEMO-09-99_en.htm
European Commission (2014), “The 2015 Ageing Report – Underlying Assumptions and Projection Methodologies”, European Economy 8
European Commission (2015), “The 2015 Ageing Report – Economic and Budgetary Projections for the 28 EU Member States (2013-2060)”, European Economy 3
European Commission, 2015. Pension Adequacy Report: current and future income adequacy in old age in the EU European Commission’s Action Plan on Building a Capital Markets Union: http://eur-lex.europa.eu/legal-content/EN/TXT/?uri=CELEX%3A52015DC0468, 2015
European Parliament (2014), “Pension Schemes”, Study for the EMPL Committee
FCA (2013), Occasional Paper No.1 Appling behavioural economics at the Financial Conduct Authority, April
Feodoria, M. and Förstemann, T. (2015), “Lethal lapses: how a positive interest rate shock might stress German life insurers”, Bundesbank Discussion Paper 12/2015

92
Green Paper Building a Capital Markets Union, COM/2015/063, http://eur-lex.europa.eu/legal-content/EN/TXT/HTML/?uri=COM:2015:63:FIN&from=EN Green Paper on long-term financing (LTF) of the European economy, European Commission, 25 March 2013. http://eur-lex.europa.eu/legal-content/EN/TXT/?uri=CELEX%3A32015R0760 https://eiopa.europa.eu/Publications/Surveys/EIOPA%20IORPs%20Stress%20Test%20Report%202015%20bookmarks.pdf
Hufeld, F., Koijen, R.S.J. and Thimann, C. (2017), “The economics, regulation, and systemic risk of insurance markets”, Oxford
International Monetary Fund (2017), Global Financial Stability Report, April
Larrain, Munoz and Tessada (2017), Asset fire sales in equity markets: Evidence from a quasi-natural experiment, Journal of Financial Intermediation, Volume 30, April 2017, Pages 71-85
OECD Database
Parliament of the United Kingdom. Pensions Act 2008; Pensions Act 2011, sections 4-18; Pensions Act 2014, sections 37-42 Regulation (EU) No 648/2012 of the European Parliament and the Council of 4 July 2012 on OTC derivatives, central counterparties and trade repositories; OJ L 201, 27.7.2012

93
Annex 0: Case Studies
A.0.1. The Automatic Enrolment programme in the UK Background The Automatic Enrolment programme is an important part of the UK Government’s response to the demographic challenge of an ageing population. Together with changes to the state pension and measures to enable an extended working life, automatic enrolment is part of a set of reforms designed to ensure individuals are able to achieve the lifestyle they aspire to in retirement, while minimising burdens on sponsors, the pensions industry and the taxpayer. Analysis published by the UK Government in May 2006141 estimated that at least seven million people were under-saving for retirement. Their savings behaviour and wealth holdings were such that they would be unable to smooth consumption in a way to maximise utility over their lifetimes. The main drivers for this under-saving were found to be: • Limited understanding of the UK’s complex private pension market and of the benefits of
saving for retirement.
• Where these informational barriers are overcome and individuals recognise the need to save, myopia means current spending pressures take precedence. Individuals face ever higher discount rates the closer they get to the point of receiving their benefits.
• Inertia. Those already saving tend to continue, but those not saving tend not to start. Saving behaviour is rarely reviewed as an individual’s circumstances change.
• Difficulty in accessing pension provision, especially for those on lower earnings or working for smaller employers.
A Pensions Commission was established by the UK Government in 2002 to address under-saving and to explore ways in which the existing three pillar pension provision system could be made fit for the future. At that time, state pension provision was complex, with the amount paid out dependent on decisions made by individuals and on the type of scheme offered by their employers, if any. Individuals had to volunteer to save into the second and/or third pillar and there was no obligation for employers to make any contributions into these arrangements. The Commission’s reports142, issued between 2004 and 2006, presented choices for the UK: to save more, to work longer and/or to pay higher taxes. There was strong cross-party political support for a policy response that enabled individuals to “save more” by replacing the existing voluntary system with an Automatic Enrolment regime. The Commission also recommended that the state intervene to address the supply side issues in the market, and to reform the state pension to make it simpler and easier to understand. Alongside this, legislation was enacted to enable and encourage the extension of the “in work” phase of individuals’ lives.
141 Security in Retirement: Towards a New Pension System; Department of Work & Pensions, 2006. 142 Pensions: Challenges and Choices: The First Report of the Pensions Commission, 2004; A New Pension Settlement for the Twenty-First Century: The Second Report of the Pensions Commission, 2005.

94
The Automatic Enrolment Programme Automatic Enrolment (“AE”) was designed to reverse the decline in the numbers of individuals covered by second or third pillar private pension provision. It aims to harness inertia to bring individuals into pension saving, and to keep them there. The programme was articulated by a series of Acts of Parliament143 and may be summarised as follows: • A legal obligation for all employers in the UK to automatically enrol their employees into
a pension scheme
• A new master trust pension scheme – NEST –with a public service obligation to accept any employer who wishes to use it to meet their duties, to assist those who struggle to access provision.
• A compliance and enforcement regime run by The Pensions Regulator, to ensure employers comply with their new duties
A mandatory minimum employer contribution signals to individuals that saving in this way is beneficial, and their contribution rate is increased by tax relief. The individual has the ability to cease saving at any point by “opting out” of the scheme, but their employer must re-assess its workforce at set intervals144 and re-enrol those who have opted out. Second or third pillar retirement saving may not be optimal for all employees AE is also built around the concept of “eligible workers” – an attempt to define a broad class of individuals for whom retirement saving is more likely to deliver value in terms of income or consumption smoothing. An earnings threshold (£10,000 in 2016) exempts145 the lowest earners from the policy and an age threshold exempts those very close to retirement age. One benefit of AE over a fully compulsory system is that for some individuals, relying on state benefits in retirement could be enough to provide an adequate retirement income. Not all of those who are not saving are behaving irrationally. These are likely to be individuals who have had consistently low earnings during their working life - but is not straightforward to define this group. Relying on individual replacement rates is unsatisfactory. Most very low earners, for example, live in households with those who earn more, and earnings are subject to fluctuations over working life. Social and labour laws are also subject to change, making it hard to predict who would be eligible for which kind of means-tested benefits at any given time. The ability for such individuals to opt out helps mitigate this. And re-enrolment ensures individuals are regularly swept back into saving unless they make an active choice to leave. State intervention in the market and the role of NEST AE places a legal obligation on employers to find a pension scheme for their staff. The Pensions Commission highlighted a supply gap in the existing market. Providers would be unable to meet the mass demand AE would generate, and in particular would struggle to serve employers who would not bring in profitable levels or persistency of contributions from their workforce. The conclusion was that competition alone would be insufficient to address this gap and that without state intervention the burden on employers attempting to comply with the law, and the high charges that would be levied on individuals to make them palatable to providers, would be too great. It was proposed that the state should establish NEST as a
143 Pensions Act 2008; Pensions Act 2011, sections 4-18; Pensions Act 2014, sections 37-42. 144 At present every three years, with three months flexibility on either side. 145 Those below the threshold must be permitted to join scheme their employer if they request to do so. Those earning above a lower threshold must also receive an employer contribution if they join.

95
provider of last resort, with a public service obligation to serve any employer wishing to discharge their automatic enrolment duties. The impact on sponsors In addition to the cost of employer contributions, which in economic terms represents a transfer to the individual rather than a pure cost, employers face administrative costs to comply with the process. The existence of NEST has reduced some of the cost of finding a scheme, but for employers whose business would be attractive to a range of providers, selecting a product to use can be daunting, particularly if they are new to pensions. The implementation of automatic enrolment was phased over several years, beginning in 2012 with the very largest employers. This was termed “staging”, and every employer in the UK was given a “staging date” by which they needed to comply. This requires them to assess who in their workforce is eligible to be automatically enrolled, to select a pension scheme, to make any necessary changes to their payroll systems, and to provide certain communications to their employees. Another important implementation decision was to ‘phase in’ contributions levels. The percentage required has been increased gradually, and will only reach the minimum set out in legislation in April 2019. This has minimised the impact on sponsors, and on individuals’ take-home pay. Employers also need to submit a declaration of compliance with The Pensions Regulator. Role of The Pensions Regulator (“TPR”) TPR’s role has never been to simply enforce the law. It also works closely with the UK Government in the development of pension policy, and educates and enables its regulated community to comply. This approach was essential for making the AE programme work in the UK. TPR was responsible for ensuring an estimated 1.3 -1.4m UK employers complied with their new legal duties, with approximately 11m workers directly affected by the change. Staging the implementation of the programme by starting with the largest employers meant that those who were more likely to have the organisational capacity to comply, and may already have a suitable pension scheme in place, would set the tone for the rest of the programme. Larger employers also employ a disproportionate amount of the UK’s workforce which would enable millions of the target population to benefit from pension saving as early as possible. For example, over a hundred thousand individuals were automatically enrolled by just four employers in the early months of the programme. In addition to increasing the demand for pension schemes, the AE programme also challenged the capacity of the market to provide advice, payroll services and other professional assistance for employers. TPR recognised the importance of the supply side of the market early in the programme and set up a specialist team that travelled around the UK educating employers and a range of suppliers about the legislative regime, advising and supporting technical and front line staff within industry and for product development. While both the pensions and payroll industries are relatively concentrated, there is a long tail of small suppliers. As staging moved steadily towards smaller and smaller employers, TPR needed to stay well ahead of the process to ensure that those to whom employers would rely on for support were able to provide it. Smaller employers are more likely to refer to an accountant or bookkeeper for help, and if they outsource their payroll it would be to a bureau. TPR’s education material, practical tools and support were based on extensive research and analysis to ensure it met the needs of each cohort of employers and suppliers. The AE duties

96
apply to the very largest employers in the UK right through to those who only employ one individual – for example a carer or personal assistant – which illustrates the importance of a strong and coherent communications strategy to run alongside the compliance and enforcement regime. The compliance and enforcement regime has also adapted in order to maintain high levels of compliance as staging has continued. Over 99% of medium and large organisations are compliant, and over 97% of the micro and small employers who have been subject to the duties so far are compliant. TPR has taken a firm stance and to date has issued over 27,000 compliance notices (official warnings) and 7,500 penalties. Outcomes Automatic enrolment has reversed the long term decline in pensions’ savings in the UK. By mid-2016, 66% of all employees were active members of a pension scheme, compared with 47% in 2012. Much of this has come from increases in private sector saving, which has increased by 28 percentage points (from 42% in 2012 to 70% in 2015). Public sector participation increased by three percentage points (from 88% in 2012 to 91% in 2015). The impact of AE has been greatest on those groups for whom coverage, pre-AE, was lower: private sector employees, lower earners and younger age groups.
As at December 2016, over 7 million workers have been automatically enrolled. Opt out levels by individuals is less than 1 in 10, significantly lower than the UK Government’s original estimate of 1 in 3. Of those that have been enrolled into a defined contribution scheme, 35% are in contract based group personal pensions, and 65% in trust based schemes. 83% of those in a trust based scheme are in a master trust146 arrangement. The AE programme has led to a rapid expansion of the master trust market in the UK. The income newly saved through AE is under management of large institutions rather than individual households, which is a stabilising factor for the wider economy. The UK government is in the process of passing legislation (due to be laid by end April 2017) that will require those running master trusts to meet stricter
146 A money purchase IORP used by or retailed to more than one employer (distinct from IORPs established by a group of connected employers for their own use). They are designed and marketed as large scale products.

97
authorisation criteria and submit to more intensive ongoing supervision, in recognition of their growing significance in the market Future considerations • Moving the compliance and enforcement regime from signposting and enforcing a new
duty, to reinforcing AE as business as usual
• Enabling the self-employed to better access second and third tier pension provision
• Adapting the system to better serve individuals in informal employment, with multiple employers and/or multiple changes in career
• Further and better alignment of data and improved automation to enable cost effectiveness and increase accuracy

98
A.0.2. Long term guarantees, low interest rates and the insolvency of the Norwegian life insurance company Silver
The insolvency of the life insurance company Silver Pensjonsforsikring AS (“Silver”) is an example of the challenges facing issuers of long term guarantees in a low interest rate environment. Silver was founded in 2005 and the company was specialising in receiving from other life insurance companies individual paid-up policies from defined benefit occupational pension schemes organized in Norway. When the Norwegian Ministry of Finance (MOF) put Silver under public administration in February 2017 the company had about NOK 10 bn (EUR 1 bn) in total assets and about 20 000 customers (individuals) and about 2 000 pensioners were receiving monthly pension payments. Solvency II was introduced in Norway 1 January 2016, but Silver had been given an exemption from Solvency II until 15 February 2017. The exemption period was not prolonged and when public administration was initiated two days later, the MOF stated that Silver did not comply with the minimum solvency capital ratio and that there was no realistic plan for how to comply with the requirement.
Norwegian defined benefit (DB) occupational pension schemes fall broadly into two categories – DB pension schemes for those working in the public sector (“public sector schemes”) and DB schemes for those working in the private sector (“private sector schemes”). In the private sector these schemes are obliged to be organized as insurance contracts where the pension provider is a life insurance company, and the system is such that when a worker leaves a defined benefit scheme, either because he leaves his job or because the scheme is closed down, a paid-up policy (insurance contract) is issued covering the pension claims based on premiums already paid into the scheme. The employer (sponsor) does not have any further obligations related to the future fulfillment of the contract. The obligation to fulfill the defined benefit contract therefore lies with the pension provider147.
Occupational pension schemes may be provided by life insurance companies or pension funds. Norwegian regulators have aimed at imposing similar regulation for pension funds and life insurance companies in order not to favour one type of provider. Life insurance companies are, however, largest in terms of size.
Lower interest rates in recent years have increased premiums in defined benefit schemes. This has contributed to a shift towards defined contribution schemes handled by life insurance companies (Chart 1) and to an increase in the volume of paid-up contracts (Chart 2).
147 In public sector schemes, however, no paid-up contracts are issued upon a worker leaving the scheme and the employer still have obligations for the future fulfillment of the defined benefit contract.

99
The paid-up private sector pension contracts come with an annual minimum return guarantee. If the return on the funds backing the pension obligation is higher than the guaranteed return, the provider receives a percentage of the excess return (profit sharing). If the realised return is below the guaranteed, however, the provider must cover the deficit (no downside risk sharing). Silver’s average guaranteed rate of return was about 3.7 percent during the years 2008-2015 (Chart 3). The regulatory maximum guaranteed return for new pension saving was below this (red line in Chart 3). The high level of average guaranteed return reflects the long term horizon for pension savings and that a large share of the contracts was issued at a time when interest rates were higher. With the exemption of 2008 Silver managed to achieve a
0
20
40
60
80
100
0
20
40
60
80
100
2007 2008 2009 2010 2011 2012 2013 2014 2015 2016¹
Defined contribution pensions Defined benefit pensions
Chart 1 Gross premium due in private defined benefit and defined contribution pension schemes. Percent. 2007 – 2016
1) At 30 June 2016. Source: Finance Norway
0
50
100
150
200
250
300
0
50
100
150
200
250
300
2009 2010 2011 2012 2013 2014 2015 2016¹
With investment choice
Without investment choice
Chart 2 Liabilities of paid-up policies. In billions of NOK. 2009 – 2016
1) At 30 June 2016.Source: Finance Norway

100
positive excess return. Long term Norwegian bond yield fell during the period 2007-2016 (Chart 3) and made it difficult for providers to earn the guaranteed return through new bond investments. The lower interest rates also lead to a higher valuation of the pension obligations under Solvency II.
New life expectancy assumptions were introduced in January 2014. Increased longevity increased the pension liabilities which again made it necessary for insurance companies to increase the volume of assets backing the liabilities. The increase in reserves could be distributed over a period of maximum 7 years. Return above the guaranteed return could be used to increase reserves, but a minimum of 20 percent was to be covered by the provider.
Under the regulation in place before Solvency II (Solvency I), the solvency requirement did not depend on the market level of interest rates. Silver’s reported solvency ratio was above the regulatory requirements for the years 2006-2015 (Chart 4).
0
2
4
6
8
10
0
2
4
6
8
10
2006 2007 2008 2009 2010 2011 2012 2013 2014 2015 2016
10 year NOK swap rateRegulatory maximum guaranteed returnSilver's book return on managed assetsAverage guaranteed return in Silver
Chart 3 Silver's return on managed assets, guaranteed return, regulatory maximum return1, and long term bond return in NOK.Percent. 2006-2016
1) Applies to new pension saving.
Source: Norges Bank, Silver's annual statements

101
Silver informed the MOF in a meeting June 2015 that the company would not be able to meet the Solvency II requirements to be introduced 1 January 2016 and that the company would apply for an exemption from Solvency II148. The MOF rejected in November 2015 Silver’s application to be regulated by the IORP regulation instead of the Solvency II regulation. Silver was granted one year exemption from Solvency II, until 1 January 2017. It became publicly known that Silver was working for a solution involving the transferal of the paid-up policies, together with the accompanying assets, to a company in Liechtenstein with the aim of being regulated by IORP rules. Silver applied in December 2016 for a prolongation of the exemption from Solvency II and this was granted until 15 February 2017. The portfolio transfer to Liechtenstein did not materialise.
The estimated capital shortfall in Silver necessary to comply with Solvency II at the end of 2016 was about NOK 3 bn149. Long term guarantees require more regulatory capital under a risk based regulatory regime, especially when interest rates are low. Other Norwegian insurance companies are more diversified than Silver (Chart 5) and have been able to comply with Solvency II.
148 Source: Information from the MOF’s webpage published 17 February 2017 describing the timeline of events related to Silver. 149 This estimate was made by the Norwegian Financial Supervisory Authority and is cited in the MOF’s published letter to Silver declaring public administration.
0
100
200
300
400
500
600
0
2000
4000
6000
8000
10000
12000
2006 2007 2008 2009 2010 2011 2012 2013 2014 2015
Total assets (lhs)Solvency ratio (rhs)Regulatory minimum solvency ratio (rhs)
Chart 4 Silver's total assets and solvency ratio (Solvency I).Mill NOK and percent. 2006-2015
Source: Norges Bank, Silver's annual statements

102
The administration board will evaluate alternative solutions that best serve the interest of the insurance claimants. Pensions under payment were reduced by 50 percent until a final solution is found. According to law, one of the options is to transfer the claims with accompanying assets to one or several other insurance companies. This will typically take place after a haircut has been made to the claims. The administration board may propose to change the terms of the paid-up policies to paid-up policies with investment choice. Contracts with investment choice resemble defined contribution contracts, where the policy holder is carrying the investment risk. The administration board’s proposal may be rejected by claimants representing at least 20 percent of total claims. In that case, a haircut will be made to the claims and the company will continue as a mutual insurance company where the claimants are the owners of the company.
0
50
100
150
200
250
0
50
100
150
200
250
Storebrand DNB Liv Nordea Liv Sparebank 1 Silver
Paid-up policies without investment choicePaid-up policies with investment choiceDefined benefit insuranceDefined contribution insurance
Chart 5 Selected life insurance companies'1 liabilities for private sector grouppension schemes. In billions of NOK. At 31 December 2015
1) Storebrand Livsforsikring, DNB Livsforsikring, Nordea Liv, SpareBank 1 Livsforsikring and Silver Pensjonsforsikring.2) Liabilities for defined benefit insurance are estimated as liabilites for defined benefit insurance less paid-up policies. Source: Finance Norway

103
Annex 1: Glossary
Article 4 entities: In the context of this report are insurance undertakings covered by Directive 2009/138/EC which, as foreseen in Article 4 of the IORP Directive, are allowed under national law to apply certain provisions of the IORP Directive for their occupational retirement provision business of life insurance undertakings in accordance with points (a)(i) to (iii) of Article 2(3) and points (b)(ii) to (iv) of Article 2(3) of Directive 2009/138/EC.
Beneficiary: A person receiving retirement benefits from a pension plan or scheme.
Funding ratio (or Cover ratio): is defined as net assets covering the schemes’ liabilities (technical provisions) divided by schemes’ liabilities (technical provisions). Funding ratio refers to DB schemes only. IORPs: Institutions for Occupational Retirement Provision falling under the scope of the IORP Directive. IORPs are pension institutions that operate occupational pension schemes for sponsoring undertakings on a funded basis in order to provide occupational benefits to members and beneficiaries, and therefore they fulfil a social function. They are established separately from any sponsoring undertaking which strengthens the protection of members’ entitlements in the case of insolvency of the sponsoring undertaking. Member: A person who is covered by a pension plan or scheme.
• Active member: A member of an occupational pension scheme who is at present accruing benefits under that scheme in respect of current service.
• Deferred member: A member entitled to a deferred pension (sometimes known as 'preserved benefits').
• Retired member (or beneficiary): A person receiving retirement benefits from a pension plan or scheme.
Occupational pension schemes: Pension schemes where the employer (sponsoring undertaking) has a role in the establishment and/or funding of the scheme itself. Self-employed persons can be considered to be sponsoring undertakings.
Other pension providers: For reasons of data availability in the context of the FSB RCG-E Survey (see chapter 1), other pension providers cover non-IORPs (including Article 4 entities) providing occupational pension schemes and/or personal pension products for which the assets and liabilities can be separately identified from their other products.
Pension fund: in the context of this report pension funds are providers of occupational pension schemes or of personal pension products. It refers to IORPs or to financial institutions that manage the assets dedicated to the pension schemes liabilities coverage, excluding life insurance companies and other pension providers.
Pension contract: A contract that specifies pension plan contributions to an insurance undertaking, bank or other pension provider in exchange for which the pension plan benefits will be paid when the members reach a specified retirement age or on earlier exit of members from the plan.

104
Pension schemes types:
• [‘Pure’ DB] Defined benefit pension scheme: In this category, the sponsor (generally the employer, but in the case of a guaranteed life insurance product the pension provider) promises a specified annual benefit on retirement. The amount to be paid is determined by reference to a formula usually based on employees' earnings and/or years of service.
• [DB]: in this report includes ‘pure DB’, ‘DC with guarantees’, ‘DB contribution-based’ and ‘hybrid’ pension schemes types.
• [DB contribution-based]: A scheme in which benefits are mostly determined by the contributions paid and the results of their investment, but that offers minimum guarantees and in the case of occupational pensions the employer has the final responsibility for the minimum guarantees.
• [DC] defined contribution: a pension scheme where the only obligation of the scheme sponsor is to pay a specified contribution (normally expressed as a percentage of the employee’s salary) to the scheme on the employee behalf. There are no further promises or ‘guarantees’ made by the sponsor. DC schemes exist in occupational as well as personal pensions. For personal pensions, DC schemes are characterised by the fact that no promises or guarantees are given by the provider. The size of the pot is dependent on the total contributions, the performance over time and the tax treatment of the investments made with these contributions.
• [DC with guarantees]: A scheme which operates like a DC scheme but which targets a specified level of benefits at retirement or guarantees a minimum rate of investment return on contributions paid, or a certain annuity purchase price (annuity conversion factor). In some cases, a DC scheme where at least the sum of contributions paid is returned.
• [Hybrid]: A scheme which has two separate DB and DC components but which are treated as part of the same scheme.
Pension provider: pension providers are entities that operate private pension. It includes pension funds (subject to IORP Directive and others), insurance undertakings (life insurance) and other like banks, collective investment funds, asset managers, etc.,.
Personal pension products: Pension products that host members only on an individual basis.
Policyholder: A person or group in whose name an insurance policy is held.
For more details and further definitions please access: EIOPA Database of pension plans & products in EEA: Guide for compilation & methodology150.
150 https://eiopa.europa.eu/Publications/Reports/EIOPA-OPC-14-058_Database_of_pension_plans_product_in_EEA-guide_for_compilation.pdf

105
Annex 2: Overview of pension categories/products in the RCG-E area and main statistics
Functional classification
Scheme type
Organisation Number of different product
categories
Coverage (number of members/c
ontracts)
Total assets (in million €)
Contributions (in million €)
Benefits Paid (in
million €)
Membership employer contribution
employee contribution
Payout method
AT 4 848,683 20,000 2,928 1,021
Pensionskasse Occupational DB or DC IORPs 1 848,683 19,171 1,882 1,021 Voluntary Voluntary Voluntary Annuities, lump sum
Betriebliche Kollektivversicherung
Occupational DB Insurance companies
1 N/A 829 79 N/A Voluntary Voluntary Voluntary Annuities, lump sum
Lebensindividual- und Gruppenrentenversicherung
Occupational DB Insurance companies
1 N/A N/A 967 N/A Voluntary Voluntary Voluntary Annuities
Direkte Leistungszusagen
Occupational DB employers 1 N/A N/A N/A N/A Voluntary Voluntary Not possible
Annuities
BE 25 1,461,805 282,303 6,410 4,577
Occupational pension plans operated by IORPs
Occupational Mostly DB (DC only possible for self-employed)
IORPs 10 1,461,805 20,707 1,070 703 Mostly mandatory (voluntary in case of self-employed)
Voluntary, if possible
Voluntary Annuities, lump sum, programmed withdrawal
Occupational pension plans operated by insurance undertakings (1)
Mostly occupational (occupational and personal possible for self-employed)
Mostly DB (DC only possible for self-employed)
Insurance companies
12 N/A 246,000 4,967 3,631 Mostly mandatory (voluntary in case of self-employed)
Voluntary, if possible
Voluntary Annuities, lump sum, programmed withdrawal
Personal pension plans (2)
Personal DB or DC Insurance companies
2 N/A N/A N/A N/A Voluntary Not possible Voluntary Annuities, lump sum, programmed withdrawal
Fonds d'épargne-pension Pensioenspaarfonds
Personal DC Banks 1 N/A 15,596 373 243 Voluntary Not possible Voluntary Lump sum

106
Functional classification
Scheme type
Organisation Number of different product
categories
Coverage (number of members/c
ontracts)
Total assets (in million €)
Contributions (in million €)
Benefits Paid (in
million €)
Membership employer contribution
employee contribution
Payout method
CH 2 6,423,000 726,381 51,314 32,768
Second pillar Occupational DB multiple providers
1 4,923,000 646,208 44,827 26,031 Mandatory Mandatory Mandatory Annuities, lump sum
Third pillar Personal DC Insurance companies
1 1,500,000 80,173 6,487 6,737 Voluntary Not possible Voluntary Annuities, lump sum
CZ 5 10,436,616 22,986 3,866 2,417
Transformovaný penzijní fond | Transformed pension fund
Personal DB Pension management companies
1 4,569,436 11,991 1,639 609 Voluntary Voluntary Mandatory Annuities, lump sum
Doplňkové penzijní spoření |Supplementary pension savings
Personal DC Pension management companies
1 224,347 179 102 3 Voluntary Voluntary Voluntary Annuities, lump sum or programmed withdrawal
Důchodové spoření |Retirement savings
Personal DC Pension management company
1 83,222 62 45 0 Mandatory Not possible Mandatory Annuities or programmed withdrawal
Soukromé životní pojištění na důchod |Private life assurance on pension
Personal DC or DB Insurance companies
2 5,559,611 10,754 2,080 1,805 Voluntary Voluntary Voluntary Annuities, lump sum or programmed withdrawal
DE 17 9,404,465 202,812 7,854 6,391
Pensionskasse Occupational DB IORPs 2 8,531,669 171,976 6,711 4,195 Voluntary Voluntary Voluntary Annuities, lump sum, programmed withdrawal, other pay-out options
Pensionsfonds Occupational DB IORPs 2 872,796 30,836 1,143 2,196 Voluntary Voluntary Voluntary Annuities, lump sum, programmed withdrawal, other pay-out options

107
Functional classification
Scheme type
Organisation Number of different product
categories
Coverage (number of members/c
ontracts)
Total assets (in million €)
Contributions (in million €)
Benefits Paid (in
million €)
Membership employer contribution
employee contribution
Payout method
Direktzusage|Book-Reserve schemes
Occupational DB Employers 1 N/A N/A N/A N/A Mandatory Voluntary Not possible
Annuities, lump sum, programmed withdrawal, other pay-out options
Unterstuetzungskasse Occupational DB Unterstuetzungskasse
1 N/A N/A N/A N/A Mandatory Voluntary Not possible
Annuities, lump sum, programmed withdrawal, other pay-out options
Direktversicherung|Direct insurance
Occupational DB Insurance companies
2 N/A N/A N/A N/A Voluntary Voluntary Voluntary Annuities, lump sum, programmed withdrawal, other pay-out options
Riester-Rente|Riester pension
Personal DB Insurance companies, banks, asset managers, building societies, cooperative societies
5 11.033.000 insurance contracts,
814,000 bank
savings contracts, 3,071,000
investment savings
contracts, 1,377,000
Wohn-Riester
contracts
N/A N/A N/A Voluntary Not possible Voluntary Partially mandatory annuitisation, programmed withdrawal, other pay-out options for cooperative societies
Basis-Rente | Basic pension
Personal DB Insurance companies, asset managers
2 N/A N/A N/A N/A Voluntary Not possible Voluntary Mandatory annuitisation
Kapitallebens- und Rentenversicherungsprodukte|Individual life insurance products
Personal DC or DB Insurance companies
2 N/A N/A N/A N/A Voluntary Not possible Voluntary Annuities, lump sum, programmed withdrawal,

108
Functional classification
Scheme type
Organisation Number of different product
categories
Coverage (number of members/c
ontracts)
Total assets (in million €)
Contributions (in million €)
Benefits Paid (in
million €)
Membership employer contribution
employee contribution
Payout method
other pay-out options
DK 6 11,472,759 660,147 18,727 18,954
Firmapensionskasse Occupational DB IORPs 1 13,765 7,977 47 232 Mandatory Mandatory Mandatory Partially mandatory annuitisation, lump sum, programmed withdrawal
Livsforsikringsselskab Occupational, personal
DC Insurance companies
2 4,846,111 414,886 14,565 14,098 Mandatory and Voluntary
Mandatory or voluntary (not possible for personal pension products)
Mandatory or voluntary (always voluntary for personal pension products)
Partially mandatory annuitisation, lump sum, programmed withdrawal (for personal pension products, annuitisation is not mandatory and also other pay-out options possible)
Arbejdsmarkedsrelateret livsforsikringsselskab
Occupational DC Insurance companies
1 973,791 41,341 N/A N/A Mandatory Mandatory Mandatory or voluntary
Partially mandatory annuitisation, lump sum, programmed withdrawal
Tværgående pensionskasse
Occupational DC Insurance 1 739,092 86,798 2,899 2,787 Mandatory Mandatory Mandatory or voluntary
Partially mandatory annuitisation, lump sum, programmed withdrawal

109
Functional classification
Scheme type
Organisation Number of different product
categories
Coverage (number of members/c
ontracts)
Total assets (in million €)
Contributions (in million €)
Benefits Paid (in
million €)
Membership employer contribution
employee contribution
Payout method
ATP Occupational DB ATP 1 4,900,000 109,145 1,216 1,837 Mandatory Mandatory Mandatory Mandatory annuitisation
EL
GR-1.1 ΤΑΜΕΙΑ ΕΠΑΓΓΕΛΜΑΤΙΚΗΣ ΑΣΦΑΛΙΣΗΣ (Τ.Ε.Α.)
Occupational DC IORPs 1 Voluntary Mandatory and voluntary both possible
Mandatory and voluntary both possible
Annuity, lump sum
GR- 1.2 ΤΑΜΕΙΑ ΕΠΑΓΓΕΛΜΑΤΙΚΗΣ ΑΣΦΑΛΙΣΗΣ (Τ.Ε.Α.)
Occupational DB IORPs 1 Mandatory Mandatory Mandatory Annuity
GR-2.1 ΑΣΦΑΛΙΣΤΙΚΕΣ ΕΠΙΧΕΙΡΗΣΕΙΣ
Occupational DC Insurance companies
1 Voluntary Voluntary Voluntary Annuity, lump sum
GR-2.2 ΑΣΦΑΛΙΣΤΙΚΕΣ ΕΠΙΧΕΙΡΗΣΕΙΣ
Occupational DB Insurance companies
1 Voluntary Voluntary Voluntary Annuity, lump sum
ES 7 18,370,678 139,703 89,714 71,097
Fondo de Pensiones de empleo |Occupational pension funds
Occupational DC or DB IORP 3 2,096,733 36,254 10,997 11,451 Automatic enrolment
Voluntary or mandatory
Voluntary or mandatory
Annuities, lump sum or other pay-out options
Fondo de Pensiones personal |Personal pension fund
Personal DC managing entity
1 7,845,537 64,048 34,962 19,146 Voluntary Not possible Voluntary Annuities, lump sum or other pay-out options
Seguros colectivos |Collective insurances
Occupational DB Insurance company
1 7,361,942 26,567 19,325 27,992 Automatic enrolment
Mandatory Mandatory Annuities, lump sum or other pay-out options
PPSE | Employer Social Prevision Plan
Occupational DB Insurance company
1 36,016 214 383 47 Automatic enrolment
Mandatory Mandatory Annuities, lump sum or other pay-out options
PPA |Prevision Plan Assured
Personal DB Insurance company
1 1,030,450 12,619 24,048 12,462 Voluntary Not possible Mandatory Annuities, lump sum or other pay-out options
FI 3 72,568 4,627 27 256

110
Functional classification
Scheme type
Organisation Number of different product
categories
Coverage (number of members/c
ontracts)
Total assets (in million €)
Contributions (in million €)
Benefits Paid (in
million €)
Membership employer contribution
employee contribution
Payout method
Lisäeläkesäätiöt|Company pension funds
occupational DB IORPs 1 67,316 3,948 26 227 Automatic enrolment
Mandatory Not possible
Mandatory annuitisation
Lisäeläkekassat|Industry-wide pension funds
occupational DB IORPs 1 5,177 678 1 29 Automatic enrolment
Mandatory Voluntary and mandatory
Mandatory annuitisation
Maksuperusteiset lisäeläkejärjestelyt|DC pension funds
occupational DC IORPs 1 75 1 0 0 Automatic enrolment
Mandatory Voluntary and mandatory
Mandatory annuitisation
FR 15 12,488,000 184,732 12,046 2,975
Schemes under article 39 of the French General Tax Code
occupational DB Insurance companies
1 201,000 39,269 1,656 1,116 Mandatory Mandatory Not possible
Lump sum
Schemes under article 82 of the French General Tax Code
occupational DB Insurance companies
2 285,000 3,962 204 53 Voluntary Mandatory Voluntary Annuity, lump sum
Schemes under article 83 of the French General Tax Code
occupational DB Insurance companies
2 4,703,000 57,125 2,712 1,349 Mandatory Mandatory Mandatory Annuity
PERCO occupational DC IORPs or asset managers
2 1,875,000 10,300 1,800 N/A Voluntary Mandatory voluntary Annuity, lump sum
Madelin law schemes occupational DB Insurance companies
2 1,772,000 37,532 3,031 432 Voluntary Mandatory Mandatory Annuity
PERE occupational DB Insurance companies
2 117,000 504 55 2 Mandatory Mandatory Voluntary and mandatory
Annuity, lump sum
Indemnites de fin de carriere (IFC)
occupational DB Insurance companies
2 N/A N/A N/A N/A Mandatory Mandatory Not possible
Lump sum
PERP personal DB Insurance companies or employers
1 2,289,000 12,380 1,831 21 Voluntary Not possible Voluntary Annuity, lump sum
Schemes under Article L.441-1 of Insurance Code|L.932-24 of Social Security Code|L. 222-2 of Mutual Code
personal DB
Insurance companies
1 1,246,000 23,660 757 N/A Voluntary Not possible Voluntary Annuity
HU 5 1,452,564 5,823 68 245

111
Functional classification
Scheme type
Organisation Number of different product
categories
Coverage (number of members/c
ontracts)
Total assets (in million €)
Contributions (in million €)
Benefits Paid (in
million €)
Membership employer contribution
employee contribution
Payout method
Magánnyugdíjpénztár voluntary privatly managed pension funds (ex-mandatory)
personal DC Private pension funds
1 61,498 663 0 1 Voluntary Not possible Voluntary Annuity, lump sum
önkéntes nyugdíjpénztár |Voluntary pension fund
personal DC Voluntary pension funds
1 1,169,625 3,487 68 244 Voluntary Voluntary Voluntary Annuity, lump sum, programmed withdrawal
Nyugdíjbiztosítás |Pension insurance products of life assurance companies
personal DB Insurance companies
1 70,086 N/A N/A N/A Voluntary Not possible voluntary Annuity
IORP-Foglalkoztatói nyugdíjszolgáltatás
occupational DC IORPs 1 610 1 0 0 Voluntary Voluntary Voluntary Annuity
Retirement Saving Account (RSA - Hungarian definition is Nyugdíj-előtakarékossági Számla - NYESZ)
personal DC Credit institutions, investment managing companies
1 150,745 1,673 N/A N/A Voluntary Not possible Voluntary Lump sum
IE 5 635,828 88,990 0 0
Occupational Pension Scheme
Occupational DB or DC IORPs 3 419,936 85,000 N/A N/A Voluntary Voluntary Mandatory and voluntary both possible
Annuities, lump sum and other pay-outs options
Personal pension Personal DC Insurance companies
1 N/A N/A N/A N/A Voluntary Mandatory and voluntary both possible
Mandatory and voluntary both possible
Annuities, lump sum, other pay-out options
Personal Retirement Savings Accounts
Personal DC Insurance companies
1 215,892 3,990 N/A N/A Voluntary Voluntary Voluntary Annuities, lump sum, other pay-out options
IL 5 13,828,143 319,603 19,501 12,848

112
Functional classification
Scheme type
Organisation Number of different product
categories
Coverage (number of members/c
ontracts)
Total assets (in million €)
Contributions (in million €)
Benefits Paid (in
million €)
Membership employer contribution
employee contribution
Payout method
Private pension: pension funds, life insurance policies and provident funds
Occupational, Personal
DB or DC Pension funds, insurance companies, others
4 13,674,121 318,736 19,341 12,840 Mandatory N/A N/A Annuities, lump sum
Personal pension Personal DC Pension funds 1 154,022 867 160 8 Voluntary N/A N/A N/A
IS 32 328,000 20,089 1,040 655
Séreignasparnaður|Personal pension scheme
personal DC Insurance companies
2 41,000 4,671 238 293 voluntary mandatory voluntary lump sum, programmed withdrawal
Lífeyrissjóður|Mutual insurance division
occupational DC Pension funds 20 160,000 12,526 584 305 mandatory mandatory mandatory Annuity
Lífeyrissjóður-public sector|Mutual insurance division guaranteed by the state and municipalities
occupational DB Pension funds 10 127,000 2,892 218 57 mandatory mandatory mandatory Annuity
IT 11 6,214,605 124,026 12,569 2,096
Fondi pensione negoziali |Contractual pension funds
Occupational DC IORPs 1 1,944,276 39,644 4,399 245 Automatic enrolment
Mandatory or voluntary
Mandatory Partially mandatory annuitisation, lump sum
Fondi pensione aperti |Open pension funds
Occupational, personal
DB or DC Insurance companies, banks, assets managers
2 1,055,716 13,980 1,428 135 Automatic enrolment (occupational), voluntary (personal)
Mandatory or voluntary (occupational), voluntary (personal)
Mandatory or voluntary (occupational), voluntary (personal)
Partially mandatory annuitisation, lump sum
Piani pensionistici individuali (Pip) |Personal retirement plans implemented through insurance policies
Personal DB or DC Insurance companies
2 2,356,674 16,369 2,945 180 Voluntary Voluntary Voluntary Partially mandatory annuitisation, lump sum

113
Functional classification
Scheme type
Organisation Number of different product
categories
Coverage (number of members/c
ontracts)
Total assets (in million €)
Contributions (in million €)
Benefits Paid (in
million €)
Membership employer contribution
employee contribution
Payout method
Fondi pensione preesistenti autonomi |"Old" autonomous contractual pension funds
Occupational DB or DC IORPs 2 816,885 50,705 3,509 1,113 Automatic enrolment (for DC schemes), mandatory (for DB schemes)
Mandatory Mandatory Partially mandatory annuitisation, lump sum
Fondi pensione preesistenti (non autonomi) | "Old" non-autonomous contractual pension funds
Occupational DB or DC Insurance companies, banks, employers
2 41,054 3,328 288 423 Voluntary (for DC schemes), mandatory (for DB schemes)
Mandatory Mandatory Partially mandatory annuitisation, lump sum
Enti previdenziali privati di base
Occupational DB or DC N/A 2 N/A N/A N/A N/A Mandatory Not possible Mandatory Mandatory annuitisation
LU 12 286,067 1,176 0 0
Fonds de pension (CSSF)
Occupational DB or DC IORPs 3 13,721 854 N/A N/A Automatic enrolment
Mandatory Voluntary Annuities, lump sum, programmed withdrawal
Funds de pension (CAA)
Occupational DB or DC IORPs 2 6,832 322 N/A N/A Automatic enrolment
Mandatory Voluntary Annuities, lump sum
Assurances de groupe Occupational DB or DC Insurance companies
2 206,219 N/A N/A N/A Automatic enrolment
Mandatory or voluntary
Voluntary Annuities, lump sum
Régime interne de pension
Occupational DB or DC N/A 3 N/A N/A N/A N/A Automatic enrolment
Mandatory Voluntary Annuities, lump sum, programmed withdrawal
Contrat de prévoyance-vieillesse
Personal DB or DC Insurance companies
2 59,295 N/A N/A N/A Voluntary Not possible Mandatory or voluntary
Partially mandatory annuitisation, lump sum
NL 8 19,655,887 1,175,561 31,702 27,797
Pensioenfonds Occupational DB or DC IORPs 2 17,842,000 1,160,652 31,702 27,797 Mandatory Mandatory or voluntary
Mandatory or voluntary
Mandatory annuitisation
Premiepensioeninstelling
Occupational DC IORPs 1 155,161 1,313 N/A N/A Voluntary Mandatory or voluntary
Mandatory or voluntary
Mandatory annuitisation

114
Functional classification
Scheme type
Organisation Number of different product
categories
Coverage (number of members/c
ontracts)
Total assets (in million €)
Contributions (in million €)
Benefits Paid (in
million €)
Membership employer contribution
employee contribution
Payout method
Rechtstreeksverzerkerde regeling Verzekeraar
Occupational DB or DC Insurance companies
2 971,001 44 N/A N/A Mandatory Mandatory or voluntary
Mandatory or voluntary
Mandatory annuitisation
Kapitaalverzekering Personal DB or DC Insurance companies
2 N/A N/A N/A N/A Mandatory Not possible Mandatory Lump sum
Banksparen (2014) Personal DC Banks 1 687,725 13,552 N/A N/A Voluntary Mandatory or voluntary
Mandatory Annuities, lump sum
NO 7 5,774,300 136,079 9,841 5,852
Foretakspensjonsordninger|Company pensions (Defined-Benefit Pension schemes)
Occupational DB Insurance companies, IORPs
2 1,317,000 58,096 2,766 3,669 Mandatory Mandatory Voluntary Mandatory annuitisation
Innskuddspensjons-ordninger|Defined-Contribution Pensions schemes
Occupational DC Insurance companies
1 2,338,000 13,183 1,858 96 Mandatory Mandatory Voluntary Annuities or programmed withdrawal
Old personal pension portfolio (in run-up); IPS|Individual pension schemes
Personal DB Insurance companies; Banks
2 845,300 5,960 36 N/A Voluntary Not possible Mandatory Mandatory annuitisation; Annuities or programmed withdrawal
Kommunale pensjonsordninger|Municipal Pension schemes
Occupational DB IORPs 2 1,274,000 58,840 5,181 2,087 Mandatory Mandatory Mandatory Mandatory annuitisation
PL 7 17,715,117 38,633 3,351 96
Pracowniczy program emerytalny w formie pracowniczego funduszu emerytalnego|Occupational pension scheme in the form of occupational pension fund
Occupational DC IORPs (domestic)
1 45 418 37 N/A Voluntary Mandatory Voluntary Lump sum or programmed withdrawal

115
Functional classification
Scheme type
Organisation Number of different product
categories
Coverage (number of members/c
ontracts)
Total assets (in million €)
Contributions (in million €)
Benefits Paid (in
million €)
Membership employer contribution
employee contribution
Payout method
Pracowniczy program emerytalny w formie umowy z zakładem ubezpieczeń na życie|Occupational pension scheme in the form of agreement concluded with life insurance company
Occupational DC Insurance companies
1 117 651 81 N/A Voluntary Mandatory Voluntary Lump sum or programmed withdrawal
Pracowniczy program emerytalny w formie umowy z funduszem inwestycyjnym|Occupational pension scheme in the form of agreement concluded with investment fund
Occupational DC Open-end investment funds
1 219 1,343 166 N/A Voluntary Mandatory Voluntary Lump sum or programmed withdrawal
Pracowniczy program emerytalny w formie zarządzania zagranicznego|Occupational pension scheme in the form of foreign management
Occupational DC IORPs (from other than PL Member States)
1 N/A N/A N/A N/A Voluntary Mandatory Voluntary Lump sum or programmed withdrawal
Otwarty fundusz emerytalny (OFE)|Open pension fund
Personal DC Unknown 1 16,621,686 34,970 2,224 N/A Voluntary Mandatory Mandatory Other (3)
Indywidualne konto emerytalne (IKE)|Individual retirement account
Personal DC Multiple providers (4)
1 824,485 1,180 734 91 Voluntary Not possible Voluntary Lump sum or programmed withdrawal
Indywidualne konto zabezpieczenia emerytalnego (IKZE)|Individual retirement savings account
Personal DC Multiple providers (4)
1 268,565 69 110 4 Voluntary Not possible Voluntary Lump sum or programmed withdrawal
PT 11 2,856,699 32,041 4,424 2,117

116
Functional classification
Scheme type
Organisation Number of different product
categories
Coverage (number of members/c
ontracts)
Total assets (in million €)
Contributions (in million €)
Benefits Paid (in
million €)
Membership employer contribution
employee contribution
Payout method
Fundos de pensões fechados|Closed pension funds
Occupational DB; DC Pension fund management companies, insurance companies
2 234,310 15,651 1,527 494 Automatic enrolment
Mandatory and voluntary both possible
Mandatory, voluntary or not possible
Partially mandatory annuitisation and possible lump sum
Adesões coletivas a fundos de pensões abertos|Collective membership of open pension funds
Occupational DB; DC Pension fund management company, Life insurance company
2 53,796 766 60 13 Automatic enrolment
Mandatory and voluntary both possible
Mandatory, voluntary or not possible
Partially mandatory annuitisation and possible lump sum
Adesões individuais a fundos de pensões abertos|Individual membership of open pension funds
Personal DC Pension fund management company, Life insurance company
1 83,012 666 279 19 Voluntary Voluntary Mandatory Annuities, lump sum
Contratos de seguro de grupo|Group insurance policies
Occupational DB; DC Insurance companies
2 25,485 282 27 N/A Automatic enrolment
Mandatory Mandatory, voluntary or not possible
Annuities, lump sum
Planos poupança-reforma|Retirement saving schemes|Insurance contracts
Personal DB; DC Multiple providers (5)
3 2,460,096 14,675 2,532 1,592 Voluntary Voluntary Mandatory Annuities, lump sum or programmed withdrawal
Planos de pensões financiados no balanço da empresa|Book-reserve schemes
Occupational DB Employers 1 N/A N/A N/A N/A Automatic enrolment
Mandatory Not possible
Annuities, lump sum
SE 17 4,850,000 383,372 23,000 28,000
Livförsäkringsaktiebolag | Participating life insurance company
Occupational, personal
DB, DC Life Insurance Undertakings
5 N/A N/A
N/A N/A Partly automatic enrolment for occ. pensions; voluntary for personal p.
Mandatory for occupational pensions;
Not possible for occ.pensions
Mainly mandatory annuitisation

117
Functional classification
Scheme type
Organisation Number of different product
categories
Coverage (number of members/c
ontracts)
Total assets (in million €)
Contributions (in million €)
Benefits Paid (in
million €)
Membership employer contribution
employee contribution
Payout method
Ömsesidiga Livförsäkringsbolag | Mutual life insurance company
Occupational, personal
DB, DC Life Insurance Undertakings
5 N/A N/A N/A N/A Partly automatic enrolment for occ. pensions; voluntary for personal p.
Mandatory; not possible
Not possible;
Mainly mandatory annuitisation
Tjänstepensionskassa | Occupational pension fund
Occupational DB IORPs 2 1,700,000 17,000 8,000 6,000 Automatic enrolment
Mandatory Not possible
Mainly mandatory annuitisation
Pensionsstiftelse > 100 medlemmar | Pension foundation > 100 members
Occupational DB Pension Foundation
2 150,000 21,000 N/A N/A Automatic enrolment
Mandatory Not possible
Mandatory annuitisation but mainly coverage of employers’ pension costs
Särskild redovisning av pensionsskuld | Book reserves
Occupational DB Employers, backed by credit insurance or equivalent guarantees
2 1,000,000 N/A 10,000 12,000 Mandatory Mandatory when employer chooses this alternative
Not possible
Mandatory annuitisation
Individuellt Pensions Sparande (IPS) | Individual Pension
Both occupational and personal
DC Banks, investment firms
1 2,000,000 115,372 5,000 10,000 Voluntary Possible for occ.pensions
Not possible for occ. pensions
Annuities
UK 5 49,157,000 3,695,282 0 0
Occupational scheme Occupational Either DB, DC or Hybrid scheme (6)
IORPs 3 18,657,000 1,411,080 N/A N/A Automatic enrolment
Mandatory and voluntary both possible
Voluntary Lump sum or programmed withdrawal; Annuities or other possible
Group Personal Pension [GPP]
Both occupational and personal
DC Insurance companies
1 30,500,000 2,284,202 N/A N/A Automatic enrolment
Mandatory and voluntary both possible
Voluntary Annuities, lump sum or programmed withdrawal
Personal pension scheme [LAD]
Personal DC Insurance companies
1 N/A N/A N/A N/A Voluntary Mandatory and voluntary both possible
Voluntary Annuities, lump sum or programmed withdrawal

118
(1) Assets also include biometric risk life insurance products. Assets include both personal and occupational insurance products (2) Members refer to all insurance contracts, both personal and individual non pension life insurance products (3) 10 years before retirement age, funds accumulated in OFE start to be gradually transferred into Social Security Fund (PAYG) managed by ZUS
(Social Insurance Institution) until reaching retirement age. The decumulation phase is provided by ZUS. (4) Open-end investment funds, Voluntary pension funds, Entities engaged in brokerage activities, Insurance undertakings and Banks (5) (Life) Insurance company, Pension fund management company, Investment fund management company (6) Legally classified in UK as DB but has some guarantees and some money purchase elements

119
Annex 3: Survey’s replies
A.3.1 Some statistics on the coverage of the survey’s replies
IORP
Total market IORP Art. IV Pension entitiesOccup. Personal
A Member countries FSB 22 A Member countries 17 2Products 184 Responses received 15 0 7 12
C As a % of the number of products C representation by total country assets (1)
Members/policyholders/contracts 64% Members/policyholders/contracts 100% 0% 100% 100%...of which active 58% - split active/deferred/retired available 100% 0% 72% 68%
AuM 61% AuM 100% 0% 100% 100%- DB and other: AuM/split 31%/56% - split by scheme type 61% 0% 53% 74%- DC: AuM/split 29%/42% - split beyond main investment categories
... property 100% 0% 62% 51% ... debt 100% 0% 37% 69% ... equity 100% 0% 36% 62% ... UCITs 100% 0% 52% 62% ... other assets 9% 0% 44% 60%- split by issuing country 45% 0% 5% 32%
Liabilities 51% Liabilities 100% 0% 96% 100%Benefits paid 51% Benefits paid 98% 0% 100% 97%Contributions received 58% Contributions received 98% 0% 100% 75%
(1) For IORPs, missing countries Greece and Luxembourg account for 0,1% of the total assets under management following EIOPA's occupational pension statistics For pension entitites, asset percentages are based on the assets received from reporting countries. For bot categories this does not mean that for all items, the input received was 100% complete. For example, a detailed split of assets or the issuing country of assets might only be available for a limited part of the countries' assets.
Some statistics on the of replies to the questionnaire
Other pension providers

120
A.3.2 Some statistics on the coverage of the survey’s replies Number of replies
AT BE CZ DE DK ES FI FR HU IE IL IS IT NL NO PL PT SE UK Total in % # DB (pure defined benefit) 2 2 2 1 2 2 1 1 2 1 1 1 18 34% 12
occupational pensions 2 2 2 1 2 2 1 1 2 1 1 1 18 12 pension fund (IORP) 1 1 1 1 1 1 1 1 1 1 10 10 insurance company (guaranteed) 1 1 1 1 1 1 1 7 7 insurance company (unit-linked) 1 1 1
DB contribution-based 2 3 1 6 11% 3 occupational pensions 2 2 1 5 3
pension fund (IORP) 1 1 2 2 insurance company (guaranteed) 1 1 2 2 insurance company (unit-linked) 1 1 1
personal pensions 1 1 1 insurance company (guaranteed) 1 1 1
DC with guarantees 1 1 3 1 6 11% 4 occupational pensions 2 2 1
insurance company (guaranteed) 1 1 1 insurance company (unit-linked) 1 1 1
personal pensions 1 1 1 1 4 4 autonomous PF (non IORP) 1 1 1 insurance company (guaranteed) 1 1 1 3 3
hybrid 1 1 2% 1 occupational pensions 1 1 1
pension fund (IORP) 1 1 1 DC (pure defined contribution) 1 2 1 1 1 1 1 1 2 1 1 1 1 1 1 3 2 22 42% 17
occupational pensions 1 1 1 1 1 1 1 1 1 2 1 12 11 pension fund (IORP) 1 1 1 1 1 5 5 autonomous PF (non IORP) 1 1 1 insurance company (guaranteed) 1 1 1 3 3 insurance company (unit-linked) 1 1 1 3 3
personal pensions 2 1 1 1 1 1 1 1 1 10 9 pension fund (IORP) 1 1 2 2 autonomous PF (non IORP) 1 1 1 1 4 4 insurance company (guaranteed) 1 1 2 2 insurance company (unit-linked) 1 1 2 2
Total 3 7 2 5 1 3 3 7 1 3 1 1 1 2 3 1 2 4 3 53 19
DB type of plans 2 5 1 5 0 2 2 6 0 1 0 0 0 1 2 0 2 1 1 31 58% 13 pure DC plans 1 2 1 0 1 1 1 1 1 2 1 1 1 1 1 1 0 3 2 22 42% 17
pension funds (IORP and non IORP) 2 3 2 2 0 3 1 0 1 2 1 1 1 2 1 1 1 0 2 26 49% 17 insurance companies 1 4 0 3 1 0 2 7 0 1 0 0 0 0 2 0 1 4 1 27 51% 17
Relevance of replies in terms of % of AUM

121
AT BE CZ DE DK ES FI FR HU IE IL IS IT NL NO PL PT SE UK DB (pure defined benefit) NA 28% NA 1% NA NA 54% 99% 89% 47% 20% NA
occupational pensions NA 28% NA 1% NA NA 54% 99% 89% 47% 20% NA pension fund (IORP) NA 7% NA 1% NA 54% 99% 22% 47% NA insurance company (guaranteed) NA 21% NA NA NA 67% 20% insurance company (unit-linked) NA
DB contribution-based 12% NA NA occupational pensions 12% NA NA
pension fund (IORP) 3% NA insurance company (guaranteed) 9% NA insurance company (unit-linked) NA
personal pensions NA insurance company (guaranteed) NA
DC with guarantees 44% 52% NA 39% occupational pensions NA
insurance company (guaranteed) NA insurance company (unit-linked) NA
personal pensions 44% 52% NA 39% autonomous PF (non IORP) 52% insurance company (guaranteed) 44% NA 39%
hybrid 72% occupational pensions 72%
pension fund (IORP) 72% DC (pure defined contribution) NA 16% 1% 77% 26% NA NA 68% 46% 63% 65% 50% 1% 11% 89% 60% NA
occupational pensions NA 77% NA NA 41% 65% 50% 1% 11% 50% NA pension fund (IORP) NA 41% 50% 1% NA autonomous PF (non IORP) 65% insurance company (guaranteed) 77% NA 30% insurance company (unit-linked) NA 11% 20%
personal pensions 16% 1% 26% 68% 5% 63% 89% 10% NA pension fund (IORP) 26% 63% autonomous PF (non IORP) 7% 1% 68% 89% insurance company (guaranteed) 10% NA insurance company (unit-linked) 9% 5%
Total NA 100% 53% NA 77% 99% NA NA 68% 100% 63% 65% 50% 100% 100% 89% 86% 80% NA

122
A.3.3 Description of risk factors and stabilizing factors
The reader will find hereunder the description of the risk factors and stabilizing factors identified in the survey. This description was provided in the survey as a guide for respondents on how to interpret the different factors.
Economic and financial factors
Risks stemming from the economic and financial factors could trigger lowering investment returns, increased valuation of debts, deterioration of funding levels, increase in financing costs, decrease in contribution, increase in pension costs, decrease in disposable income, etc.:
1.1 persistent low interest rate Risks stemming from a prolonged period of low levels of interest rates (possible consequences: lowering investment returns, increased valuation).
1.2 sudden reversion of interest rate
Risks stemming from a scenario that combines a decrease in asset values, a current low level of interest rates and a sudden jump in interest rate (possible consequences: deterioration of funding levels or current duration gap).
1.3 negative interest rate Risks stemming from interest rates becoming negative, incl. for the longer durations.
1.4 high inflation rate (above ECB target)
Risks related to an increase in inflation rates, all other things being equal (possible consequences: decrease in pension adequacy, when benefits indexation is not foreseen in the pension scheme; increase in financing costs, when benefits indexation is foreseen).
1.5 deflation Risks related with a foreseen impact in expenses and saving decisions of private sector entities (possible consequences: decrease in contributions and assets under management).
1.6 high and long duration unemployment
Risks stemming from the reduction of pension sector coverage or in working life span (possible consequences: for DC personal plan, set on a voluntary basis, if the employee can no longer pay the contributions the pension adequacy will be hampered).
1.7 high debt level of private sector Risks stemming from high debt service ratio that hamper saving ability of private sector entities (of sponsors and members), incl. the ability to cover increasing pensions costs.
1.8 high level of public debt Risks related to an increase in taxes (and a consequent decrease in disposable income), a decrease in government spending or to an increase in sovereign financing costs in severe situations (leading to the re-pricing of public debt).
1.9 subdued economic growth resulting in sponsor defaults
Risks related to sponsor default due to decreased economic activity. Whenever sponsors can no longer pay the pension premiums/ contributions due (which compromises future accrual) or cover existing deficits (which compromises accrued benefits).
1.10 investments in traditional assets
Risks (loss of value) stemming from shocks affecting traditional assets (stocks, corporate bonds, government bonds).
1.11 investments in non-traditional assets
Risks stemming from shocks affecting non-traditional assets (direct real estate, private equity, hedge funds, infrastructure, loan origination ...). Those risks are compounded by potential higher valuation, liquidity or counterparty risk related to those specific assets.
1.12 mishedging Risks stemming from unfavorable moves leading to losses in hedging positions.

123
Demographic factors
The demographic factors could lead to increases in pension costs / annuities, underestimation of people long-term needs, more vulnerabilities to market fluctuations, etc.
2.1 increasing longevity The fact that people live longer may have an impact at several levels: (i) pension plans where pay-outs take the form of annuities may be confronted with insufficient reserves due to an increase in pension costs/ annuities (if longevity was underestimated during the build-up phase); (ii) where pay-outs take the form of lump sums or programmed withdrawal, people may underestimate their long-term needs and more rapidly fall in poverty; and (iii) where the PPP is closed (no new entrants and often no new service years), the PPP may be more vulnerable to market fluctuations and other risks, since there is less possibility to spread the risks in time, and between generations, because of the absence of or lowering cash inflows (contributions) and an increasing outflow of cash (pension pay-outs).
2.2 baby boom retirement As most of the baby boom generation is in the process of retiring, the entry flow of young working people seems unable to compensate this trend (in terms of numbers), as such it might happen that private pension entities experience more outflows than inflows, so they can become net sellers of financial assets. Nevertheless, the fears of seeing the first pillar becoming not viable (at least in its current form) may direct people towards more private pensions, thus rebalancing that movement.
Political and regulatory factors
Impacts stemming from political and regulatory factors could refer to less tax advantages for investing/ paying pension premiums/ paying out pensions. They may also determine changes in funding requirements, modify investment behaviour, impact the financing cost, the products offered and the benefits received, etc.
3.1 unfavourable tax move Risk that fiscal authorities, due to budgetary pressures, change their tax policy which may lead to f.i. less tax advantages for investing, for paying pension premiums, for paying out pensions, …
3.2 nationalisation (reversal) Risk that the national government nationalizes existing private pension entities, f.i. to cover budgetary deficits.
3.3 prudential regulation The impact of a change/increase in funding requirements on investment behavior, on the types of pension products offered, on premiums.
3.4 changing labor regulation The impact of changing legislation with regard to the pension design and/or rights that might impact the financing cost, the products offered and the benefits received.
3.5 reduced social security benefits The risk that reduced social security benefits will be compensated by second pillar benefits (in off-set type of final salary DB-plans).
Behavioral factors

124
Behavioural factors may have several impacts regarding concentration, counterparty and liquidity risks, solvency requirements, potential pressure for government intervention, increase in the risk profile of the pension vehicle, intensify effects in times of market turbulence, etc.
4.1 search for yield Investors behavior in a low yield environment looking for extra return (or to match liabilities or contributions discount rate assumptions), may lead to an increase in overall risk profile of pension funds (concentration, counterparty and liquidity risks, amongst others).
4.2 procyclicality PPP are likely to behave in a pro-cyclical manner to asset price moments, by selling risky assets to meet solvency requirements, when markets and projected returns are low. Additionally they may behave pro-cyclically in the adjustment of pension benefits (where this is allowed) during economic downturns.
4.3 redemption Risks related with a sudden increase in the lapse rate, whenever lapse is possible/foreseen, may give rise to liquidity risks.
4.4 unrealistic expectations of the benefits
The risk that members overestimate their expected retirement benefits, and therefore do not anticipate a possible too low retirement income, thus reducing savings incentives. This risk may also create pressure for government intervention (to fill the gap).
Operational and governance factors
The risks related to operational and governance factors may affect liquid returns in a low yield environment, sensitivity to changes in interest rates, early retirement before the flight path has commenced, etc.
5.1 valuation processes (assets & liabilities)
In case of liabilities and for non-quoted assets the value might be based on a model and/or expert opinion. Therefore, risks may arise from model error, the choice of parameters, outdated figures and even fraud. Also the valuation might be inflated by the current low to negative interest rate environment.
5.2 high costs The risk of costs pressuring liquid returns in a low yield environment. Cost related to investment management fees, administration fees, supervisory fees, consultant fees, (re)insurance premiums, marketing fees. Cost reduction strategies may postpone strategic investments, in IT outdated infrastructures, for instance, or hinder the improvement of governance practices.
5.3 ALM (duration matching) The risk that duration matching is not possible due to a shortage of long-term bonds (and absence of very long-term bonds). A duration gap between the asset and liability sides of pension entities makes them sensitive to changes in interest rates.
5.4 incentives of PPP managers Risks related with a principal-agent problem, as the performance and rewards of PPP managers are often defined in relative terms towards a given benchmark in a short term approach (which may disregard ALM and absolute returns over the medium term).
5.5 unsatisfactory flightpaths In case of DC plans with life styling strategies, there is a risk that the flight path/glide path (the change in asset allocation becoming more conservative when approaching the target retirement age) is not appropriate to the choices to be made by the member (e.g. if the members choose to retire early before the flight path has commenced, when high proportion of investments are still in equities, leading to liquidations from equity holdings. Or conversely, if the flight path derisks members into bonds too early and they do not wish to access the pot for several years/prefer to drawdown).

125
Other risk factors
The respondents identified other factors that could have negative impacts, especially regarding risks stemming from adverse events, potential market vulnerabilities for closed PPPs and credit risk related to potential banking resolution.
6.1
reputational risk Risk stemming from adverse events (e.g. in terms of ethics, safety, security, sustainability, quality and innovation) with a negative impact on the pension provider’s reputation that damage the trust of sponsors / members and potentially lead to a decrease of premiums / increase of withdrawals situation. For the analysis of the stabilizing factors this risk has been allocated to the category of behavioral factors.
6.2. Increasing maturity of closed PPP A closed PPP (no new entrants and often no new service years) is characterized by absence or lowering of cash inflows (contributions) and an increasing cash outflows (pension pay-outs), following the aging of scheme’s members. Over time, such PPP become more vulnerable to market fluctuations and other risks, since there is less possibility to spread the risks in time, and between generations. Such PPP will probably also derisk completely its investment strategy, which may lead to an increasing demand in bonds and selling pressures on equity. For the analysis of the stabilizing factors this risk has been allocated to the category of demographic factors.
6.3. EU bail-in resolution for banks PPP's deposits and unsecured debt instruments issued by banks submitted to resolution are exposed to bail-in. This mechanism increases the investment risk related with banking financial exposure. In addition, regarding PPP’s deposits, this mechanism risks to hinder the confidence in private pension schemes, especially of the DC kind, as all their members would be indirectly affected, regardless of the size of their pension reserves (while banking deposits of individual savers up to 100.000 euro are fully protected under the resolution of Banks' regime). For the analysis of the stabilizing factors this risk has been allocated to the category of political and regulatory factors.
Stabilizing factors
For the risks identified, potential stabilizing factors were considered, related to amending fiscal policy, improving prudential regulation, better governance rules, enhanced risk transfer mechanisms, counter-cyclically aspects, increase in the number of personal and occupational schemes savings, in contributions and in assets under management, the intervention from the sponsor, the existence of a protection scheme, setting a mechanism to reduce benefits, a change from DB to DC, lowering guarantees, etc.
favourable tax move The possibility of fiscal authorities to stabilize certain trends by amending their tax policy.
prudential regulation - valuation The possibility provided by regulation to deviate from market consistent valuation for assets and/or liabilities, either in all circumstances or only in specific circumstances. The fact that regulation does not impose market consistent valuation is covered by this factor as well. Please explain in the comments column which types of valuation rules apply.

126
prudential regulation - buffers Requiring the buildup of (risk-based and macro/micro) buffers to cater for future financial difficulties and to avoid the default of the pension entity.
prudential regulation - recovery plans The allowance for temporary underfunding to spread the costs of eliminating deficits.
regulation - governance Product governance rules (market conduct), provider governance rules and any other regulation that help create well run pension schemes which can help in mitigating some of the identified risks.
use of risk transfer mechanisms The use of financial or other instruments (such as insurance) to transfer risks such as investment risk (options), interest rate risks (swaps), longevity (longevity bonds or (re)insurance), …
countercyclicality Pension schemes may behave counter-cyclically. When prices fall, they may see an opportunity to purchase long term debt instruments (e.g. corporate or government bonds) as soon as these can be used to match future liabilities; or buying of equity in falling stock markets.
increase in precautionary savings Raising awareness about average expected income replacement rates at retirement may boost savings, leading to an increase in the number of personal and occupational schemes savings, in contributions and in assets under management.
sponsor support The intervention from the sponsor (including group guarantees) if the pension provider can no longer fulfill its promises or to restore the financial position of the pension provider.
protection scheme The existence of a protection scheme that mitigates (partially or fully) the possible losses due to default of the pension provider or the sponsoring employer.
variable decumulation In the DC world drawdown products allow for ongoing search for yield and mitigate some of the risk of low interest rates crystallizing a loss in an annuity. Annuity products such as deferred annuities, variable annuities may also mitigate such risks.
benefit adjustment mechanisms Often pension schemes have embedded options to reduce pension promise (such as, setting a mechanism to reduce benefits when an increase in life expectancy at retirement age occurs). By potentially reducing the related pension cost increase it may incentivize employers to set up new PPP.
change in pension plan design A change from DB to DC, lowering the level of guarantees provided or introducing more flexible mechanisms, such as periodically defined guarantees as opposed to a lifelong guarantee. Such changes may mitigate some of the identified risks. Please explain in the comments column which changes could happen in practice

127
Annex 4. Methodological issues and additional results
A.4.1 Aggregation methods for multiple country replies
Top 3 main risks to financial stability:
In order to rank risk factors according to the highest number of country replies, whenever there existed more than one country reply151 for one of the three main risks - 1st, 2nd, 3rd -, the procedure was the following:
i) Country replies under each risk factor were counted and divided by the total number of country replies.
As such, for each of the three main risk factors, the result becomes 1 country → 1 risk (unless no reply was provided).
ii) For each risk factor, all country replies were added and risk factors with the highest scores identified.
Risk factors expected impact (HIGH, LOW, NEUTRAL or NA):
Regarding the overall impact assessment of potential risk in the pension sector and from the pension sector to the financial stability and/or the economy, country replies and risk factors were aggregated according to the following methodology:
i) First, for each country the number of respective replies under high, low, neutral or non-applicable categories was counted and expressed as a percentage of total number of replies for that country – Country aggregation level;
ii) Second, by risk factor the potential risk impact on European level was calculated as a simple average of each country's risk impact (derived from step 1) – European average level152;
iii) Finally, the overall assessment of potential risk impact for all risks factors results from a simple average of each risk factor's impact at European level (derived from step 2) – Overall average level.
These aggregation rules for multiple country replies were adopted at a global and granular level to assess both risks and stabilizing factors.
151 For countries that completed more than one reply to cover at least 50% of pension sector AuM. 152 Taking a simple average across all pension funds would (not) change the overall assessment.
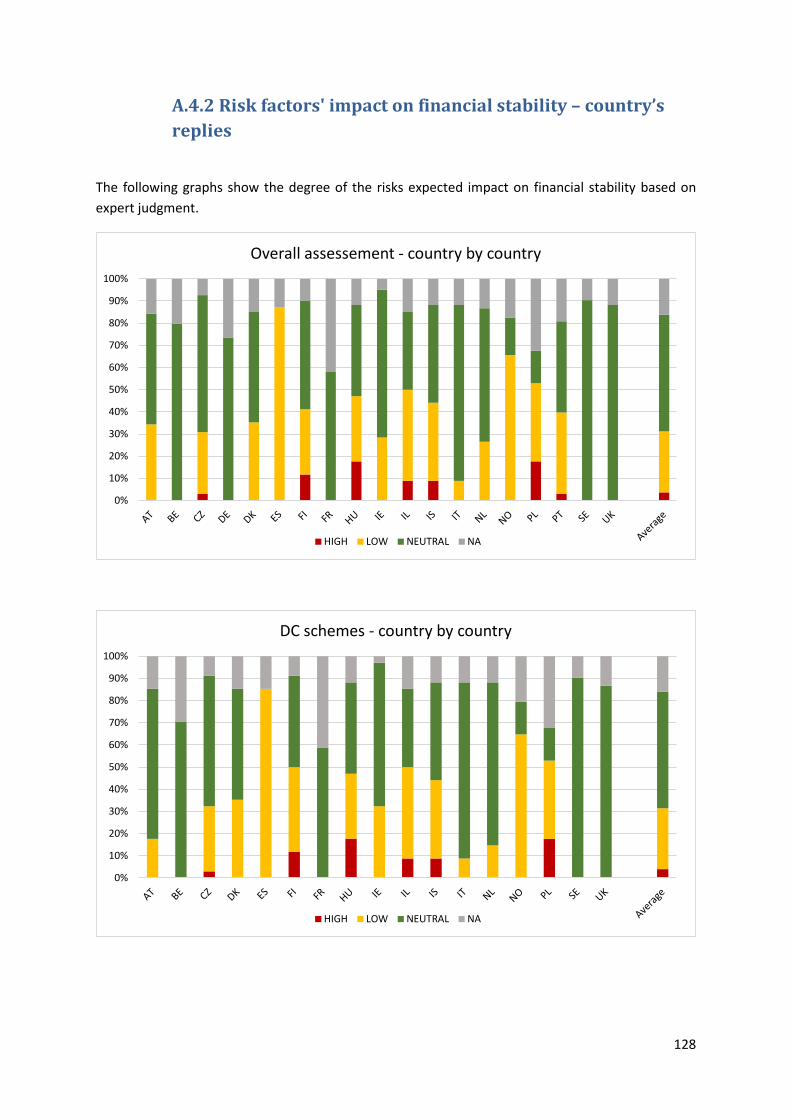
128
A.4.2 Risk factors' impact on financial stability – country’s replies
The following graphs show the degree of the risks expected impact on financial stability based on expert judgment.
0%
10%
20%
30%
40%
50%
60%
70%
80%
90%
100%
Overall assessement - country by country
HIGH LOW NEUTRAL NA
0%
10%
20%
30%
40%
50%
60%
70%
80%
90%
100%
DC schemes - country by country
HIGH LOW NEUTRAL NA

129
0%
10%
20%
30%
40%
50%
60%
70%
80%
90%
100%
AT BE CZ DE ES FI FR IE NL NO PT SE UK Average
DB and other schemes - country by country
HIGH LOW NEUTRAL NA

130
A.4.3 Expected impact on the economy from the main risk factors
0% 20% 40% 60% 80% 100%
10. EU bail-in resolution for banks
9. high debt level of private sector
8. search for yield
7. nationalisation
6. subdued economic growth resulting in sponsor…
5. investments in traditional assets
4. unfavourable tax move
3. high and long duration unemployment
2. increasing longevity
1. persistent low interest rate
DC Schemes - Overall Average
DC schemes expected impact on Economy from the 10 top FS risk factors
(out of 17 country replies)
HIGH LOW NEUTRAL NA
0% 20% 40% 60% 80% 100%
10. herding in DB type of schemes
9. deflation
8.changing labor regulation
7. investments in traditional assets
6. search for yield
5. negative interest rate
4. subdued economic growth resulting in sponsor…
3. sudden reversion interest rate
2. increasing longevity
1. persistent low interest rate
DB and other schemes - Overall Average
DB schemes expected impact on Economy from the 10 top FS risk factors
(out of 13 country replies)
HIGH LOW NEUTRAL NA

131
A.4.4 Impact of stabilizing factors on the risk assessment First main risk for DB and DC schemes: persistent low interest rate
DC 7 countries for in total 10 replies 10 countries for in total 12 replies where stabilizing factors are in place where stabilizing factors are not in place impact on impact on micro-level macro-level micro-level macro-level
pension provider sponsor member financial
stability economy pension provider sponsor member financial
stability economy
HIGH 38% 0% 86% 0% 0% 20% 0% 90% 0% 0% LOW 43% 0% 14% 43% 81% 10% 0% 10% 40% 50%
NEUTRAL 19% 31% 0% 57% 19% 55% 40% 0% 60% 50% NA 0% 69% 0% 0% 0% 15% 60% 0% 0% 0%
DB 11 countries for in total 23 replies 3 countries for in total 8 replies where stabilizing factors are in place where stabilizing factors are not in place impact on impact on micro-level macro-level micro-level macro-level
pension provider sponsor member financial
stability economy pension provider sponsor member financial
stability economy
HIGH 55% 53% 29% 9% 0% 56% 6% 83% 0% 0% LOW 22% 8% 35% 41% 65% 0% 39% 0% 33% 33%
NEUTRAL 18% 13% 36% 50% 25% 11% 50% 17% 67% 67% NA 5% 26% 0% 0% 9% 33% 6% 0% 0% 0%
Second main risk for DB and DC schemes: increasing longevity
DC 10 countries for in total 13 replies 7 countries for in total 8 replies where stabilizing factors are in place where stabilizing factors are not in place impact on impact on micro-level macro-level micro-level macro-level
pension provider sponsor member financial
stability economy pension provider sponsor member financial
stability economy
HIGH 20% 0% 70% 0% 0% 43% 0% 86% 0% 0% LOW 50% 10% 30% 40% 67% 0% 0% 14% 14% 43%
NEUTRAL 20% 42% 0% 60% 33% 57% 57% 0% 86% 57% NA 10% 48% 0% 0% 0% 0% 43% 0% 0% 0%
DB 11 countries for in total 18 replies 4 countries for in total 13 replies where stabilizing factors are in place where stabilizing factors are not in place impact on impact on micro-level macro-level micro-level macro-level
pension provider sponsor member financial
stability economy pension provider sponsor member financial
stability economy
HIGH 36% 32% 41% 0% 0% 50% 8% 38% 0% 0% LOW 27% 26% 27% 27% 73% 0% 0% 25% 25% 60%
NEUTRAL 18% 22% 32% 73% 18% 50% 58% 38% 75% 40% NA 18% 20% 0% 0% 9% 0% 34% 0% 0% 0%
Third main risk for DB schemes: sudden reversion interest rate
DB 10 countries for in total 21 replies 4 countries for in total 10 replies where stabilizing factors are in place where stabilizing factors are not in place impact on impact on micro-level macro-level micro-level macro-level
pension provider sponsor member financial
stability economy pension provider sponsor member financial
stability economy
HIGH 40% 37% 5% 5% 0% 42% 4% 38% 0% 0% LOW 8% 2% 20% 25% 40% 0% 4% 0% 25% 25%
NEUTRAL 47% 37% 75% 70% 50% 33% 75% 63% 75% 75% NA 5% 24% 0% 0% 10% 25% 17% 0% 0% 0%

132
Third main risk for DC schemes: high and long duration unemployment
DC 3 countries for in total 4 replies 13 countries for in total 17 replies where stabilizing factors are in place where stabilizing factors are not in place impact on impact on micro-level macro-level micro-level macro-level
pension provider sponsor member financial
stability economy pension provider sponsor member financial
stability economy
HIGH 50% 0% 50% 0% 0% 23% 0% 62% 31% 23% LOW 50% 0% 50% 33% 67% 42% 0% 23% 19% 44%
NEUTRAL 0% 50% 0% 67% 33% 23% 28% 8% 50% 33% NA 0% 50% 0% 0% 0% 12% 72% 8% 0% 0%

133
Annex 5. List of Members of the FSB RCG–E Working Group on Private Pension Schemes Resilience
Chair Pedro Duarte Neves Deputy Governor Banco de Portugal
Vice-Chair Patrick Hoedjes Head of Oversight and Operations EIOPA
Belgium Henk Becquaert Member of the Management Committee Financial Services and Market Authority Ann Devos (Drafting Team Member) Co-ordinator Prudential Supervision of Pensions Financial Services and Market Authority
Czech Republic Jan Frait Head, Financial Stability Department Czech National Bank Michal Dvoøák Senior Analyst,Financial Stability Department Czech National Bank (alternate to Jan Frait)
Denmark Oliver Juhler Grindeslev Financial Stability, Systemic Risk - Analysis and Policy Danmarks Nationalbank
France Aymeric Pontvianne Head of Unit Insurance Companies and Intermediaries Directorate General of the Treasury Ministry of Economy and Finance

134
Germany Maria Hüntelmann Deputy Head of Division International Policy, Financial Stability and Regulation - Insurance and Pension Funds Supervision BaFin Till Förstemann Senior Expert Macroprudential Surveillance, Non-Banking System Division Bundesbank Anke Kablau Senior Expert Macroprudential Surveillance, Non-Banking System Division Bundesbank Petra Faber-Graw Head of International Policy, Financial Stability and Regulation – Insurance and Pension Funds Supervision BaFin
Iceland Björn Z. Asgrimsson Senior Risk Analysist Oversight Department Financial Supervisory Authority
Ireland Oliver Gilvarry Principal Officer Financial Services and Legal Division Department of Finance
Italy Ambrogio Rinaldi Director Supervisory Commission COVIP Gian Paolo Ruggiero Division Chief International Affairs, Private Pensions, Accounting Principles Directorate Banking and Financial System – Legal Affairs Ministry of the Economy Finance

135
Netherlands Norway Poland
John Landman Head Pensions Department Supervision Policy Division Dutch National Bank Rick Hoogendoorn Policy Advisor Supervision Policy Division Dutch National Bank (alternate to John Landman) Allard Bruinshoofd Supervision Policy Division Dutch National Bank (alternate to John Landman) Kjell Bjørn Nordal Special Adviser Financial Stability Department Norges Bank Wojciech Wyszyński Deputy Diretor Polish Financial Supervision Authority
Portugal Ana Margarida Ramos (Drafting Team Member) Senior Advisor Financial Stability Department Banco de Portugal Vanda Geraldes Cunha (Drafting Team Member) Senior Advisor Economics and Research Department Banco de Portugal Sofia Frederico (Drafting Team Member) Insurance and Pension Funds Supervisory Authority (ASF)
Romania Lavinia Cristescu Financial Supervisory Authority
Spain Patricia Díez Busto Insurance Supervisor International Department Deputy Directorate for Plans and Pension Funds

136
UK Umair Choudhry Head of Prudential Regulation HM Treasury Philip Diamond Senior Associate Pensions Policy Team Financial Conduct Authority Eiko Sievert Senior Associate Financial Stability Policy Team Financial Conduct Authority (alternate to Philip Diamond) Catherine Cunningham EU Policy Manager The Pension Regulator Donna Hardcastle Policy Lead Europe and International Regulatory Policy Directorate
ECB Giuseppe Cappelletti Financial Stability Expert Cosimo Pancaro Financial Stability Expert (alternate to Giuseppe Cappelletti)
EIOPA Cecilia Melo Fernandes (Drafting Team Member) Paola Magnetti Frederick Van Den Weghe (Drafting Team Member) Sandra Hack Barthold Kuipers