report on economic position - merck annual report...
TRANSCRIPT

86 Combined Management Report Report on Economic Position Macroeconomic and Sector-Specific Environment
REPORT ON ECONOMIC POSITION
Macroeconomic and Sector-Specific Environment
The development of our net sales in 2015 was influenced by general global trends and by the growing importance of the Asia-Pacific region (APAC). In 2015, the APAC region accounted for approximately 56% of the organic growth in Group sales. All business sectors made positive contributions to the overall organic sales growth of the APAC region. In 2015, Healthcare and Performance Materials generated the APAC region’s larg-est share of sales in absolute terms. At 10.4%, the highest organic sales growth in the region was achieved by Healthcare. Life Science and Performance Materials followed far behind, with organic growth rates of 5.5% and 0.8%, respectively.
According to the most recent report by the International Monetary Fund (IMF), the recovery in industrialized countries continued in 2015, whereas economic activity in emerging economies and developing countries weakened for the fifth year in a row. The IMF reported that global gross domestic product (GDP) rose by 3.1% in 2015, representing a decrease of 0.3 percentage points compared with 2014. While indus-
trialized countries generated an increase of 1.9%, at 4.0% emerging economies again made the largest contribution to global growth.
According to the latest information, in 2015 the GDP of the United States, the world’s largest economy, grew by 2.5% (2014: 2.4%), which was 0.6 percentage points short of the 2014 forecast. Growth in the United States slowed down in 2015 due to a decline in investment spending by the oil indus-try and a harsh winter. For the eurozone, the IMF noted a 1.5% increase in GDP in 2015 (2014: 0.9%). In Asia (exclud-ing Japan), GDP grew in 2015 by 6.6% (2014: 6.8%). India (7.3%) and China (6.9%) made noteworthy contributions to this development. Japan, South Korea and Taiwan remained behind the previous year’s growth expectations. However, with GDP growth of 0.6%, Japan returned to positive territory (2014: 0.0%). By contrast, economic activity slightly weak-ened in South Korea, with GDP growth of 2.7% (2014: 3.3%) and in Taiwan, with growth of 2.2% (2014: 3.8%).
Development in
20151
Development in 2014
Healthcare
Global pharmaceutical market 8.9% 8.7%
Market for multiple sclerosis therapies2 8.0% 19.0%
Market for type 2 diabetes therapies2 2.0% 9.0%
Market for infertility treatment2 – 7.0% 1.0%
Market for the treatment of colorectal cancer2 – 1.7% – 5.8%
Market for OTC pharmaceuticals 4.9% 4.0%
Life Science
Market for laboratory products 3.0% 2.8%
Share of biopharmaceuticals in the global pharmaceutical market 24.0% 23.0%
Performance Materials
Growth of LC display surface area
declining growth
dynamics 13.8%
Global automobile sales volumesslightly weaker
growth 4.0%
Materials for production of cosmetics 2.0% 1.8%
Semiconductor industry sales
sales at the previous year’s
level 8.0%
1 Predicted development. Final development data for 2015 were not available for all industries when this report was prepared. 2 Growth figures are based on market data stated in U.S. dollars. Market data from EvaluatePharma on the growth of indications are based on published company reports and are subject to exchange rate fluctuations. Owing to the development of the € / US$ exchange rate in 2014 – 2015, market growth in U.S. dollars is weaker than when viewed in terms of euros.

Macroeconomic and Sector-Specific Environment Report on Economic Position Combined Management Report 87
Healthcare The IMS Health Global Market Prognosis 2015 – 2019, a study published by IMS Health, expects an 8.9% increase in sales for the global pharmaceutical market in 2015 (2014: 8.7%). This sales increase is primarily attributable to Latin America and the United States. The U.S. pharmaceutical market saw growth of 11.4% (2014: 12.6%) and in Latin America, growth was as high as 15.8% (2014: 11.6%). At 7.0%, growth of the Chinese market was weaker compared with the previous year (2014: 11.2%). However, at 5.8%, European market growth continued (2014: 4.1%).
Not only the growth of the pharmaceutical sector as a whole, but also in particular the development of the biophar-maceutical market are relevant for our business. According to EvaluatePharma, the share of sales accounted for by bio-pharma ceuticals as a proportion of the overall pharmaceutical market has steadily increased since 2006, amounting to 24.0% in 2015. In absolute terms, global biopharmaceutical sales amounted to around US$ 183 billion in 2015. For the coming years, EvaluatePharma continues to expect increasing sales of biopharmaceuticals. It is also likely that the trend towards biopharmaceuticals making up an ever greater share of the overall pharmaceutical market will continue.
According to EvaluatePharma, among our therapeutic areas of focus, particularly the markets for multiple sclerosis thera-pies and type 2 diabetes treatments showed the highest growth, increasing by 8.0% (2014: 19.0%) and 2.0% (2014: 9.0%), respectively. Moreover, it should be emphasized that the market for infertility treatments recorded a sales decline of – 7.0% (2014: 1.0%). Despite this difficult environment, the Biopharma business generated an organic sales increase of around 3.7% with Gonal-f®, a hormone used in the treat-ment of infertility. In 2015, the market for oncology drugs to treat colorectal cancer declined by a further 1.7% in compari-son with the previous year (2014: -5.8%).
In a market study, the company Nicholas Hall quantified growth of the global over-the-counter pharmaceutical market at 4.9% in 2015 (2014: 4.0%). The market growth drivers were India at 8.9% (2014: 9.0%) as well as Latin America at 7.0% (2014: 8.2%). The Japanese and western European markets showed the weakest growth dynamics of 0.2% and 3.3%, respectively.
Life ScienceOur Life Science business sector is a leading supplier of prod-ucts and services for general laboratory applications, as well as researching, developing and producing drug therapies of biological and chemical origin.
For the global laboratory product market relevant to Bio-science and Lab Solutions, the market research firm Frost & Sullivan calculated growth of 3.0% for 2015 (2014: 2.8%). Growth was primarily driven by biopharmaceutical industry customers, specifically emerging biotech start-ups. The stabi-lization of U.S. academic funding also helped to improve the
performance and prospects of research tools markets. In com-parison with 2014, the European market grew by 1.9% (2014: 1.6%), especially as a result of positive market developments from the EU Research and Innovation program Horizon 2020. Growth of the U.S. market improved to 3.2% (2014: + 3.0%) thanks to the robust performance of the biotech industry. Emerging economies delivered higher growth; however, a slowdown in China was visible.
The demand for Process Solutions products depends heavily on the volume of biological product sales as well as the research & development activities of biopharmaceutical com-panies. Global biopharmaceuticals are approaching US$ 200 bil-lion in sales and are expected to double by 2020. According to EvaluatePharma, there are more than 7,500 active biologics projects in the pipeline, 25% of which are monoclonal anti-bodies. Biosimilars are a small, but fast-growing part of the pharmaceutical market. In 2015, IMS expects spending on bio-similars to reach US$ 2 billion annually, or approximately 1% of total global spending on biologics.
Performance MaterialsWith its Liquid Crystals business, Merck is the leading pro-ducer of liquid crystal mixtures for the display industry. Based on data collected by market researchers at DisplaySearch, in recent years the display industry has achieved growth rates in display surface areas averaging 10%. This dynamic growth was driven by higher sales volumes and increasing average display sizes. Owing to weak demand for televisions, 2015 saw waning growth dynamics. The display industry remains a growth sector in which the leading display technology is based on liquid crystals. OLED technology, for which Merck also ranks among the leading material suppliers, is gaining importance in the high-quality display sector.
The markets for automotive coatings and cosmetics are crucial to Merck’s Pigments business. As reported by the German Automobile Industry Association (VDA), global auto-mobile sales increased by 4% in 2014. The growth drivers were China (+ 13%), the United States (+ 6%) and western Europe (+ 5%), whereas automotive sales volumes declined in Latin America and eastern Europe. Owing to the weakening of economic activity in China, global growth of the automo-tive industry is expected to come in slightly weaker in 2015. According to Euromonitor International, global consumption of materials used to produce cosmetics grew by 2%, with Asia reporting the highest growth rate of 5%.
The semiconductor industry is the most important sales market for the business with integrated circuit materials (IC Materials). The long-term growth of the semiconductor industry has a cyclical demand pattern. According to Gartner, a market research institute specializing in the technology and electronics markets, in 2015 the industry’s sales were at the previous year’s level as a result of declining demand in the PC business. In 2014, dynamic growth of 8% was recorded.

88 Combined Management Report Report on Economic Position Review of forecast against actual business developments
REVIEW OF FORECAST AGAINST ACTUAL BUSINESS DEVELOPMENTS
In the Annual Report for 2014, we gave forecasts of the key financial performance indicators for the Merck Group and our business sectors for 2015. At the time of the forecast, the acquisition of Sigma- Aldrich was still pending due to outstand-ing antitrust clearances. We therefore provided a separate forecast in the event of the successful acquisition of Sigma- Aldrich, in which we expected the first-time consolidation of Sigma- Aldrich in mid-2015. The following report reviews the forecast against the actual business developments, including the first-time consolidation of Sigma- Aldrich on November 18, 2015.
Net salesWe predicted slight organic sales growth for the Merck Group in 2015, supplemented by a slight portfolio effect and a mod-erately positive exchange rate effect. All business sectors contributed significantly to the moderate 2.6% organic increase in the net sales of the Merck Group, thus exceeding the fore-cast. In addition, despite the delay in the acquisition of Sigma- Aldrich owing to antitrust reviews, we recorded a solid port-folio effect of 4.3%, in part due to the good performance of AZ Electronic Materials, a company we acquired in 2014. The strengthening of the U.S. dollar and major Asian currencies against the euro in 2015 contributed significantly to the strong positive currency effect of 6.2% on net sales.
Our Healthcare business sector generated slight organic sales growth of 1.6% in 2015, thus slightly exceeding the guidance provided in the Annual Report for 2014. In addition to the performance of Rebif® in North America, which exceeded our expectations, this was due to the organic increase in sales of our products to treat diabetes ( Glucophage®), cardiovascu-lar diseases ( Concor®), infertility ( Gonal-f®), and thyroid dis-orders ( Euthyrox®), as well as Neurobion®, a brand marketed by the Consumer Health business.
For the Life Science business sector, we forecast a moderate organic increase in sales in the Annual Report for 2014. Posting strong organic sales growth of 6.5% in 2015, the Life Science business sector exceeded this forecast. Process Solutions made a significant contribution to this development with organic sales growth of 11.6%. In addition, the Life Science business sector saw a portfolio effect of 10.2% due to the acquisition of Sigma- Aldrich.
For the Performance Materials business sector, we pre-dicted slight organic sales growth, supplemented by a strong portfolio effect. At 0.6%, the actual organic growth was only slightly below this forecast. Special mention should be made of the dynamic development of the OLED materials business, as well as the energy-saving UB-FFS technology from the Display Materials business unit. However, the mature LC technology TN-TFT suffered from an accelerated decline in volumes. The portfolio effect of the revenues from acquired businesses was 10.4%.
EBITDA pre exceptionalsIn 2015, excluding the acquisition of Sigma- Aldrich, EBITDA pre exceptionals of the Merck Group saw a solid increase over the previous year, thus exceeding the forecast we gave in the Annual Report for 2014. In addition, apart from operating per-formance, positive foreign exchange effects of the U.S. dollar and major Asian currencies contributed to this development. Including Sigma- Aldrich, we generated a strong EBITDA pre exceptionals increase of 7.1% to € 3,630 million for the Merck Group in 2015.

Review of forecast against actual business developments Report on Economic Position Combined Management Report 89
For the Healthcare business sector, we predicted a slight decline in EBITDA pre exceptionals in the Annual Report for 2014. The good development of organic sales helped us to exceed this forecast, achieving the year-earlier level with EBITDA pre exceptionals of € 2,002 million.
In the Annual Report for 2014, we predicted a moderate increase for the Life Science business sector. Excluding Sigma- Aldrich, EBITDA pre exceptionals of the Life Science business sector saw a low double-digit increase, thus exceeding our guidance provided in the Annual Report for 2014. In addition to positive exchange rate effects, this development was also attributable to a favorable product mix.
We forecast a low double-digit increase in EBITDA pre exceptionals for the Performance Materials business sector in 2015. With medium double-digit growth (excluding Sigma- Aldrich), we significantly exceeded this forecast. Both good operating business performance and positive exchange rate effects were responsible for this development.
For EBITDA pre exceptionals of Corporate and Other, we expected a low double-digit percentage decline. Owing to expenses for currency hedging transactions as a result of the global exchange rate movements against the euro and the intensification of future-oriented Group initiatives (e.g. new branding), the Corporate and Other expense of EBITDA pre exceptionals more than doubled overall. Consequently, we did not meet our forecast.
Business free cash flowFor 2015, we had forecast a slight improvement in business free cash flow of the Merck Group. Excluding the contribution from Sigma- Aldrich, we can confirm this forecast. While busi-ness free cash flows of the Life Science and Performance Materials business sectors showed a sharp increase over 2014, both the Healthcare business sector and Corporate and Other saw a decline. The decrease in Healthcare is attributable to higher investments and the high amount of capital tied up in receivables. In Corporate and Other, expenses for the ONE Global Headquarters and strategic Group initiatives in particu-lar led to a decrease in business free cash flow. Including Sigma- Aldrich, our Group business free cash flow increased sharply by 6.2%.

90 Combined Management Report Report on Economic Position Review of forecast against actual business developments
Review of forecast against actual business developments in 2015
Forecast for 2015 in:
Actual results 2014 in € million
Forecast for 2015 in the Annual Report for 2014 Q1 / 2015 Interim Report Q2 / 2015 Interim Report Q3 / 2015 Interim Report Results 2015 in € million (% YoY)
Merck Group
Net sales1 11,363
Slight organic growth, slight portfolio effect, moderately
positive foreign exchange effect
Forecast incl. Sigma- Aldrich: Double-digit growth rates
€ 12.3 – 12.5 billion
Forecast incl. Sigma- Aldrich: Double-digit growth rates
€ 12.3 – 12.5 billion
Forecast incl. Sigma- Aldrich: Low double-digit
percentage growth
€ 12.6 – 12.8 billion,
of which Sigma- Aldrich: € 300 million
12,845 (+ 13.0%
+ 2.6% org. + 4.3% portfolio, + 6.2% currency)
EBITDA pre exceptionals 3,388
Slight increase due to operating business developments and
positive foreign exchange effects; at least at the 2014 level
Forecast incl. Sigma- Aldrich: Very strong growth
€ 3.45 – 3.55 billion
Forecast incl. Sigma- Aldrich: Double-digit growth rates
€ 3.45 – 3.55 billion
Forecast incl. Sigma- Aldrich: Low double-digit
percentage growth
€ 3.58 – 3.65 billion,
of which Sigma- Aldrich: € 80 – 95 million
3,630 (+ 7.1%)
Business free cash flow 2,605
Slight increase
Forecast incl. Sigma- Aldrich: Very strong growth
€ 2.4 – 2.5 billion
Forecast incl. Sigma- Aldrich: Strong growth
€ 2.4 – 2.5 billion
Forecast incl. Sigma- Aldrich: Stable development
€ 2.6 – 2.7 billion,
of which Sigma- Aldrich: € 50 – 70 million
2,766 (+ 6.2%)
Healthcare
Net sales1 6,621Organic at the
previous year’s levelOrganic at the
previous year’s levelOrganic at the
previous year's levelOrganic at the
previous year's level
6,934 (+ 4.7%
+ 1.6% org. + 3.1% currency)
EBITDA pre exceptionals 2,000 Slight decline € 1.9 – 2.0 billion € 1.9 – 2.0 billion € 1.93 – 2.0 billion 2,002
(+ 0.1%)
Business free cash flow 1,701 Slight decline € 1.5 – 1.55 billion € 1.5 – 1.55 billion € 1.5 – 1.55 billion1,581
(– 7.1%) Life Science
Net sales1 2,682
Moderate organic growth
Forecast incl. Sigma- Aldrich: Double-digit growth rates
Moderate organic growth
Forecast incl. Sigma- Aldrich: Double-digit growth rates
Moderate organic growth
Forecast incl. Sigma- Aldrich: Double-digit growth rates
Solid organic growth,
portfolio effect in the low double-digit percentage range
3,355 (+ 25.1%
+ 6.5% org. + 10.2% portfolio, + 8.4% currency)
EBITDA pre exceptionals 659
Moderate increase
Forecast incl. Sigma- Aldrich: Double-digit growth rates
€ 730 – 760 million
Forecast incl. Sigma- Aldrich: Double-digit growth rates
€ 740 – 760 million
Forecast incl. Sigma- Aldrich: Double-digit growth rates
€ 760 – 780 billion,
in addition from Sigma- Aldrich: € 80 – 95 million
856 (+ 30.0%)
Business free cash flow 419
Strong increase
Forecast incl. Sigma- Aldrich: Double-digit growth rates € 450 – 480 million € 450 – 480 million
€ 530 – 560 million,
in addition from Sigma- Aldrich: € 50 – 70 million
676 (+ 61.2%)
Performance Materials
Net sales1 2,060
Slight organic increase,
strong portfolio effect
Slight organic increase,
strong portfolio effect
Slight organic increase,
strong portfolio effect
Slight organic increase,
strong portfolio effect
2,556 (+ 24.1%
+ 0.6% org. + 10.4% portfolio, + 13.1% currency)
EBITDA pre exceptionals 895Low double-digit
percentage increase € 1.05 – 1.1 billion € 1.06 – 1.1 billion € 1.1 – 1.14 billion1,132
(+ 26.5%)
Business free cash flow 700Low double-digit
percentage increase € 850 – 900 million € 850 – 900 million € 890 – 940 million931
(+ 33.0%) Corporate and Other
EBITDA pre exceptionals – 166Double-digit
percentage decline € – 330 – – 280 million € – 350 – – 300 million € – 360 – – 340 million – 360
(+ 116.9%)
Business free cash flow – 215 – € – 420 – – 390 million € – 420 – – 390 million € – 440 – – 410 million– 421
(+ 96.2%)
1 The composition of net sales has changed, see ‟Changes to accounting and measurement principles and disclosure changes” in the Notes to the Group accounts.

Review of forecast against actual business developments Report on Economic Position Combined Management Report 91
Review of forecast against actual business developments in 2015
Forecast for 2015 in:
Actual results 2014 in € million
Forecast for 2015 in the Annual Report for 2014 Q1 / 2015 Interim Report Q2 / 2015 Interim Report Q3 / 2015 Interim Report Results 2015 in € million (% YoY)
Merck Group
Net sales1 11,363
Slight organic growth, slight portfolio effect, moderately
positive foreign exchange effect
Forecast incl. Sigma- Aldrich: Double-digit growth rates
€ 12.3 – 12.5 billion
Forecast incl. Sigma- Aldrich: Double-digit growth rates
€ 12.3 – 12.5 billion
Forecast incl. Sigma- Aldrich: Low double-digit
percentage growth
€ 12.6 – 12.8 billion,
of which Sigma- Aldrich: € 300 million
12,845 (+ 13.0%
+ 2.6% org. + 4.3% portfolio, + 6.2% currency)
EBITDA pre exceptionals 3,388
Slight increase due to operating business developments and
positive foreign exchange effects; at least at the 2014 level
Forecast incl. Sigma- Aldrich: Very strong growth
€ 3.45 – 3.55 billion
Forecast incl. Sigma- Aldrich: Double-digit growth rates
€ 3.45 – 3.55 billion
Forecast incl. Sigma- Aldrich: Low double-digit
percentage growth
€ 3.58 – 3.65 billion,
of which Sigma- Aldrich: € 80 – 95 million
3,630 (+ 7.1%)
Business free cash flow 2,605
Slight increase
Forecast incl. Sigma- Aldrich: Very strong growth
€ 2.4 – 2.5 billion
Forecast incl. Sigma- Aldrich: Strong growth
€ 2.4 – 2.5 billion
Forecast incl. Sigma- Aldrich: Stable development
€ 2.6 – 2.7 billion,
of which Sigma- Aldrich: € 50 – 70 million
2,766 (+ 6.2%)
Healthcare
Net sales1 6,621Organic at the
previous year’s levelOrganic at the
previous year’s levelOrganic at the
previous year's levelOrganic at the
previous year's level
6,934 (+ 4.7%
+ 1.6% org. + 3.1% currency)
EBITDA pre exceptionals 2,000 Slight decline € 1.9 – 2.0 billion € 1.9 – 2.0 billion € 1.93 – 2.0 billion 2,002
(+ 0.1%)
Business free cash flow 1,701 Slight decline € 1.5 – 1.55 billion € 1.5 – 1.55 billion € 1.5 – 1.55 billion1,581
(– 7.1%) Life Science
Net sales1 2,682
Moderate organic growth
Forecast incl. Sigma- Aldrich: Double-digit growth rates
Moderate organic growth
Forecast incl. Sigma- Aldrich: Double-digit growth rates
Moderate organic growth
Forecast incl. Sigma- Aldrich: Double-digit growth rates
Solid organic growth,
portfolio effect in the low double-digit percentage range
3,355 (+ 25.1%
+ 6.5% org. + 10.2% portfolio, + 8.4% currency)
EBITDA pre exceptionals 659
Moderate increase
Forecast incl. Sigma- Aldrich: Double-digit growth rates
€ 730 – 760 million
Forecast incl. Sigma- Aldrich: Double-digit growth rates
€ 740 – 760 million
Forecast incl. Sigma- Aldrich: Double-digit growth rates
€ 760 – 780 billion,
in addition from Sigma- Aldrich: € 80 – 95 million
856 (+ 30.0%)
Business free cash flow 419
Strong increase
Forecast incl. Sigma- Aldrich: Double-digit growth rates € 450 – 480 million € 450 – 480 million
€ 530 – 560 million,
in addition from Sigma- Aldrich: € 50 – 70 million
676 (+ 61.2%)
Performance Materials
Net sales1 2,060
Slight organic increase,
strong portfolio effect
Slight organic increase,
strong portfolio effect
Slight organic increase,
strong portfolio effect
Slight organic increase,
strong portfolio effect
2,556 (+ 24.1%
+ 0.6% org. + 10.4% portfolio, + 13.1% currency)
EBITDA pre exceptionals 895Low double-digit
percentage increase € 1.05 – 1.1 billion € 1.06 – 1.1 billion € 1.1 – 1.14 billion1,132
(+ 26.5%)
Business free cash flow 700Low double-digit
percentage increase € 850 – 900 million € 850 – 900 million € 890 – 940 million931
(+ 33.0%) Corporate and Other
EBITDA pre exceptionals – 166Double-digit
percentage decline € – 330 – – 280 million € – 350 – – 300 million € – 360 – – 340 million – 360
(+ 116.9%)
Business free cash flow – 215 – € – 420 – – 390 million € – 420 – – 390 million € – 440 – – 410 million– 421
(+ 96.2%)
1 The composition of net sales has changed, see ‟Changes to accounting and measurement principles and disclosure changes” in the Notes to the Group accounts.

92 Combined Management Report Report on Economic Position Merck
COURSE OF BUSINESS AND ECONOMIC POSITION
Merck
Overview of 2015
• Sales increase by 13.0% to € 12.8 billion • All business sectors report organic sales growth• EBITDA pre exceptionals up 7.1% to around € 3.6 billion • Earnings per share pre exceptionals rise 5.9% to € 4.87 • Business free cash flow increases by 6.2% to € 2.8 billion • Healthcare: Robust base business; cooperation with Pfizer
developing according to plan
• Life Science: Strong and profitable organic sales growth amid successful completion of the Sigma- Aldrich acquisition
• Performance Materials: Market positions in all businesses successfully defended with organic sales at 2014 level
• Corporate objectives for 2015 met in full
MERCK GROUPKey figures
€ million 2015 2014Change
in %
Net sales1 12,844.7 11,362.8 13.0
Operating result (EBIT) 1,843.2 1,762.0 4.6
Margin (% of net sales)1 14.3 15.5
EBITDA 3,354.1 3,122.9 7.4
Margin (% of net sales)1 26.1 27.5
EBITDA pre exceptionals 3,629.8 3,387.7 7.1
Margin (% of net sales)1 28.3 29.8
Earnings per share (€) 2.56 2.66 – 3.8
Earnings per share pre exceptionals (€) 4.87 4.60 5.9
Business free cash flow 2,766.2 2,605.1 6.2
1 The composition of net sales has changed, see ‟Changes to accounting and measurement principles and disclosure changes” in the Notes to the Group accounts.
Development of net sales and results of operationsIn 2015, we generated net sales of € 12,845 million (2014: € 11,363 million), representing an increase of 13.0% or € 1,482 million over 2014. This positive sales development was due to organic growth, positive exchange rate effects and acquisition- related increases. In 2015, the organic increase in sales amounted to 2.6% or € 293 million. As a consequence of the weaker value of the euro against the most important cur-rencies, this led to net positive exchange rate effects of 6.2% or € 702 million. This was primarily due to the U.S. dollar and Asian currencies, especially the Chinese renminbi and the Taiwan dollar. Negative exchange rate effects resulted mainly from Latin American currencies, for instance the Venezuelan
bolivar and the Brazilian real. Acquisitions / divestments increased net sales overall by 4.3% or € 487 million. The acquisition- related effect from the first-time consolidation of AZ Electronic Materials (AZ) on May 2, 2014 amounted to € 203 million. The increase in sales due to the consolidation of Sigma- Aldrich since November 18, 2015 totaled € 289 million. Of this amount, € 279 million was generated by the Life Science business sector and € 10 million by the Performance Materials business sector. Subsequent to the divestment of the Discovery and Development Solutions business field in the Life Science business sector as of March 31, 2014, net sales declined by € 5 million compared with the previous year.

Merck Report on Economic Position Combined Management Report 93
MERCK GROUPNet sales and organic growth by quarter1
€ million / organic growth in %
1 Quarterly breakdown unaudited.
Q1
2015
2014
3,041 3,219 3,120 3,464
2,628 2,815 2,921 2,999
Q2 Q3 Q4
% 1.3 2.2 3.3 3.3
MERCK GROUPNet sales by business sector – 2015
€ million / % of net sales
54% Healthcare
6,933.8
20% Performance Materials
2,555.6
26% Life Science
3,355.3
The development of net sales in the individual quarters in comparison with 2014 as well as respective organic growth rates are presented in the following overview:
In 2015, Healthcare accounted for 54% (2014: 58%) of our total Group sales and thus remained our largest business sec-tor in terms of sales. Life Science and Performance Materials followed behind, contributing 26% (2014: 24%) and 20% (2014: 18%) to Group sales, respectively. The respective two percentage-point increases in the share of sales accounted for by both Life Science and Performance Materials were mainly related to the acquisitions of Sigma- Aldrich and AZ.
MERCK GROUPNet sales components by business sector – 2015
€ million / change in % Net sales Organic growthExchange rate
effectsAcquisitions / divestments Total change
Healthcare 6,933.8 1.6 3.1 – 4.7
Life Science 3,355.3 6.5 8.4 10.2 25.1
Performance Materials 2,555.6 0.6 13.1 10.4 24.1
Merck Group 12,844.7 2.6 6.2 4.3 13.0

94 Combined Management Report Report on Economic Position Merck
MERCK GROUPNet sales by region – 2015
€ million / % of net sales
32% Europe
4,102.733% Asia-Pacific (APAC)
4,240.821%
North America
2,722.9
10% Latin America
1,265.3
4% Middle East and Africa (MEA)
513.0
All our business sectors recorded organic sales increases and positive exchange rate effects in 2015. Achieving an organic growth rate of 6.5%, which corresponded to an absolute increase of € 173 million, Life Science made the strongest absolute contribution to organic sales growth, followed by Healthcare with organic sales growth of € 106 million, equiva-lent to a growth rate of 1.6%, and Performance Materials with € 13 million, or 0.6%. The overall change in net sales reflects the benefits of positive exchange rate effects and sales contri-butions from the acquired businesses. Driven mainly by the first-time consolidation of Sigma- Aldrich, Life Science deliv-ered a growth rate of 25.1% or € 673 million, the strongest sales increase among our business sectors.
Driven by positive exchange rate movements and acquisition- related growth, sales in the Asia-Pacific region rose by 23.2% or € 798 million to € 4,241 million (2014: € 3,443 million). Asia-Pacific thus became our top-selling region and the growth engine of the Group; more than half of total sales growth in 2015 was generated in this region. In particular, Performance Materials benefited in this region from positive currency effects and the consolidation of AZ Electronic Materials. All business sectors contributed to organic growth of 4.7%, although this development was mainly attributable to Healthcare, which reported organic growth of 10.4%. The contribution to Group sales by the Asia-Pacific region rose by three percentage points to 33% (2014: 30%).
Sales generated in Europe grew by 2.1% to € 4,103 mil-lion (2014: € 4,017 million). While the Life Science (+ 12.7%) and Performance Materials (+ 6.5%) business sectors achieved sales growth, Healthcare posted a sales decline (– 2.1%). Over-all, this region’s contribution to Group sales in 2015 declined to 32% (2014: 36%).
Sales in North America amounted to € 2,723 million (2014: € 2,152 million), which represents a year-on-year increase of 26.5%. This was due in particular to favorable currency effects from the strong U.S. dollar and acquisition-related sales increases that were primarily attributable to the acquisition of Sigma- Aldrich. The organic growth generated by the Life Science business sector (+ 8.5%) was canceled out by the organic sales declines in the other two business sectors. The contribution to Group sales by this region in 2015 was 21%, representing an increase of two percentage points (2014: 19%).
In Latin America, Group sales decreased slightly owing to currency effects to € 1,265 million (2014: € 1,285 million). Negative exchange rate effects stemmed mainly from the change in the translation of the Venezuelan bolivar into the reporting currency, euros. In this connection, reference is made to the explanations in Note [7] ‟Management judgments and sources of estimation uncertainty” in the Notes to the Group accounts. All business sectors contributed to organic sales growth of 8.6%. In 2015, Latin America generated 10% (2014: 11%) of Group sales.
Net sales in the Middle East and Africa region rose in 2015 by 10.1%, amounting to € 513 million (2014: € 466 million). Organic sales growth of 6.8% was mainly attributable to the Healthcare business sector. This region accounted for an unchanged 4% of Group sales.
MERCK GROUPNet sales components by region – 2015
€ million / change in % Net sales Organic growthExchange rate
effectsAcquisitions / divestments Total change
Europe 4,102.7 0.2 0.2 1.8 2.1
North America 2,722.9 – 0.9 17.9 9.6 26.5
Asia-Pacific (APAC) 4,240.8 4.7 12.6 5.9 23.2
Latin America 1,265.3 8.6 – 10.5 0.4 – 1.5
Middle East and Africa (MEA) 513.0 6.8 2.5 0.8 10.1
Merck Group 12,844.7 2.6 6.2 4.3 13.0

Merck Report on Economic Position Combined Management Report 95
MERCK GROUPResearch and development costs by business sector – 2015
€ million / in %
77% Healthcare
1,310.1
12% Life Science
197.5
11% Performance Materials
197.0
The consolidated income statement of the Merck Group is as follows:
MERCK GROUPConsolidated Income Statement1
Change
€ million 2015 in % 2014 in % in € million in %
Net sales 12,844.7 100.0 11,362.8 100.0 1,481.9 13.0
Cost of sales – 4,076.3 – 31.7 – 3,526.4 – 31.0 –549.9 15.6
(of which: amortization of intangible assets)2 (– 166.6) (– 94.0) (– 72.6) (77.3)
Gross profit 8,768.4 68.3 7,836.4 69.0 932.0 11.9
Marketing and selling expenses – 4,049.5 – 31.5 – 3,589.1 – 31.6 – 460.4 12.8
(of which: amortization of intangible assets)2 (– 778.9) (– 719.0) (– 59.9) (8.4)
Administration expenses – 719.9 – 5.6 – 608.6 – 5.4 – 111.3 18.3
Research and development costs – 1,709.2 – 13.3 – 1,703.7 – 15.0 – 5.5 0.3
(of which: amortization of intangible assets)2 (– 2.7) (– 3.8) (1.1) (– 30.5)
Other operating expenses and income – 446.6 – 3.5 – 173.0 – 1.5 – 273.6 158.2
Operating result (EBIT) 1,843.2 14.3 1,762.0 15.5 81.2 4.6
Financial result – 356.7 – 2.8 – 205.0 – 1.8 – 151.7 74.0
Profit before income tax 1,486.5 11.6 1,557.0 13.7 – 70.5 – 4.5
Income tax – 368.0 – 2.9 – 392.2 – 3.5 24.2 – 6.2
Profit after tax from continuing operations 1,118.5 8.7 1,164.8 10.3 – 46.3 – 4.0
Profit after tax from discontinued operations 5.6 – – – 5.6 –
Profit after tax 1,124.1 8.8 1,164.8 10.3 – 40.7 – 3.5
Non-controlling interests – 9.3 – 0.1 – 7.5 – 0.1 – 1.8 25.1
Net income 1,114.8 8.7 1,157.3 10.2 – 42.5 – 3.7
1 The reporting structure has changed, see ‟Changes to accounting and measurement principles and disclosure changes“ in the Notes to the Group accounts. 2 Excluding amortization of internally generated or separately acquired software.
The increase in cost of sales as well as other functional costs, for example marketing and selling expenses and administra-tion expenses, was significantly influenced by exchange rate effects and the first-time consolidation of Sigma- Aldrich. Despite the rise in cost of sales to € 4,076 million (2014: € 3,526 million), gross profit saw a double- digit increase (+ 11.9%) to € 8,768 million. Gross margin, i.e. gross profit as a percentage of sales, declined slightly to 68.3% (2014: 69.0%).
In 2015, research and development costs were at the previous year’s level. Healthcare, which is the Group’s most research-intense business sector, accounted for 77% (2014: 80%) of Group-wide R&D spending. The Group research spending ratio (research and development costs as a percent-age of sales) declined to 13.3% (2014: 15.0%). Our research spending ratio in the Healthcare business sector was 18.9% (2014: 20.6%).
96 Combined Management Report Report on Economic Position Merck
MERCK GROUPEBITDA pre exceptionals and change by quarter1
€ million / change in %
1 Quarterly breakdown unaudited.
Q1 Q2 Q3 Q4
2015
2014
% 5.7 6.3 10.2 6.3
853 899 944 933
807 846 857 878
In 2015, other operating expenses and income (net) amounted to € – 447 million (2014: € – 173 million) and comprised expenses of € 917 million (2014: € 737 million) as well as income of € 471 million (2014: € 564 million). The increase in other operating expenses was primarily due to exchange rate losses in operating business and higher allowances for receiv-ables. The decrease in other operating income was mainly due to one-time income in 2014 from the adjustment of provisions for litigation with Israel Bio-Engineering Project Limited Part-nership (‟IBEP”). This effect could not be offset by higher income from milestone payments largely attributable to the alliance entered into with Pfizer in November 2014 to co- develop and co-commercialize active ingredients in immuno- oncology. Further information about the development and composition of other operating expenses and income can be found in Note [12] ‟Other operating income” and Note [13] ‟Other operating expenses” in the Notes to the Group accounts.
Overall, our operating result (EBIT) increased by 4.6% to € 1,843 million.
In 2015, the negative financial result grew by € 152 million to € – 357 million (2014: € – 205 million), particularly owing to higher interest expenses in connection with the financing measures for the Sigma-Aldrich acquisition. Furthermore, we incurred higher exchange rate losses from financial trans-actions that burdened the financial result more strongly than in 2014 (see Note [14] ‟Financial result” in the Notes to the Group accounts).
Income tax expenses of € 368 million (2014: € 392 million) led to a tax ratio of 24.8% (2014: 25.2%). Further informa-tion about income taxes can be found in Note [15] ‟Income taxes” in the Notes to the Group accounts.
Profit after tax of discontinued operations comprises the business activities of Sigma- Aldrich acquired with a view to resale. As a consequence of the antitrust commitments imposed by the European Commission, Merck and Sigma- Aldrich had agreed to sell parts of Sigma- Aldrich’s solvents and inorganics business in Europe (see also Note [4] ‟Acquisi-tions, assets held for sale and disposal groups” in the Notes to the Group accounts).
Net income, i.e. profit after tax attributable to Merck shareholders, for 2015 was € 1,115 million (2014: € 1,157 mil-lion), resulting in earnings per share of € 2.56 (2014: € 2.66).
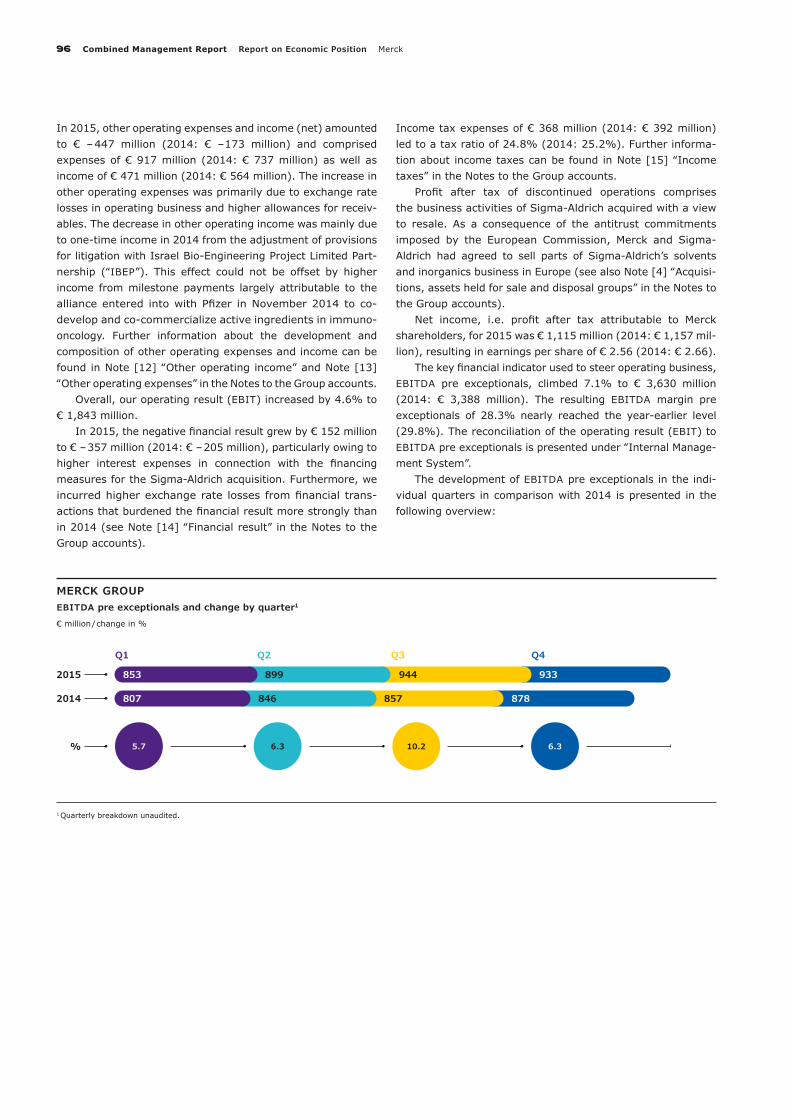
The key financial indicator used to steer operating business, EBITDA pre exceptionals, climbed 7.1% to € 3,630 million (2014: € 3,388 million). The resulting EBITDA margin pre exceptionals of 28.3% nearly reached the year-earlier level (29.8%). The reconciliation of the operating result (EBIT) to EBITDA pre exceptionals is presented under ‟Internal Manage-ment System”.
The development of EBITDA pre exceptionals in the indi-vidual quarters in comparison with 2014 is presented in the following overview:

Merck Report on Economic Position Combined Management Report 97
Not presented: Decline in Group EBITDA pre exceptionals by € – 360 million due to Corporate and Other.
MERCK GROUPEBITDA pre exceptionals by business sector – 2015
€ million / in %
50% Healthcare
2,001.7
28% Performance Materials
1,132.1
22% Life Science
856.1
The increase in Group EBITDA pre exceptionals was driven by the Life Science and Performance Materials business sectors. Life Science improved this key performance indicator by € 198 million or 30.0%, and Performance Materials delivered an increase of € 237 million or 26.5%. At € 2,002 million, EBITDA pre exceptionals of the Healthcare business sector remained at the level of 2014, accounting for a 50% share (2014: 56%) of Group EBITDA pre exceptionals (excluding the € – 360 million decline due to Corporate and Other). The per-centage shares of EBITDA pre exceptionals attributable to Life Science and Performance Materials rose to 22% (2014: 19%) and 28% (2014: 25%), respectively.

98 Combined Management Report Report on Economic Position Merck
Net assets and financial position
MERCK GROUPBalance sheet structure1
Dec. 31, 2015
Dec. 31, 2014 Change
€ million in % € million in % € million in %
Non-current assets 30,657.0 80.7 15,529.7 59.7 15,127.3 97.4
of which:
Intangible assets 25,339.0 11,395.5 13,943.5 Property, plant and equipment 4,009.1 2,990.4 1,018.7 Other non-current assets 1,308.9 1,143.8 165.1
Current assets 7,350.2 19.3 10,480.4 40.3 – 3,130.2 – 29.9
of which:
Inventories 2,619.8 1,659.7 960.1 Trade accounts receivable2 2,738.3 2,219.5 518.8 Current financial assets 227.0 2,199.4 – 1,972.4 Other current assets2 932.9 1,523.3 –590.4 Cash and cash equivalents 832.2 2,878.5 – 2,046.3
Total assets 38,007.2 100.0 26,010.1 100.0 11,997.1 46.1
Equity 12,855.3 33.8 11,801.0 45.4 1,054.3 8.9
Non-current liabilities 15,768.9 41.5 7,607.7 29.2 8,161.2 107.3
of which:
Provisions for pensions and other post-employment benefits 1,836.1 1,820.1 16.0 Other non-current provisions 855.3 626.1 229.2 Non-current financial liabilities 9,616.3 3,561.1 6,055.2 Other non-current liabilities 3,461.2 1,600.4 1,860.8
Current liabilities 9,383.0 24.7 6,601.4 25.4 2,781.6 42.1
of which:
Current provisions 535.4 561.7 – 26.3 Current financial liabilities 4,096.6 2,075.9 2,020.7 Trade accounts payable 1,921.2 1,539.4 381.8 Other current liabilities 2,829.8 2,424.4 405.4
Total liabilities and equity 38,007.2 100.0 26,010.1 100.0 11,997.1 46.1
1 Since January 1, 2015, the consolidated balance sheet has been structured in descending order of maturity. 2 Previous year’s figures have been adjusted, see ‟Changes to accounting and measurement principles and disclosure changes” in the Notes to the Group accounts.

Merck Report on Economic Position Combined Management Report 99
As of December 31, 2015, total assets amounted to € 38,007 million. This represents an increase of € 11,997 million or 46.1% over December 31, 2014 (€ 26,010 million). Both this very strong increase and the change in the balance sheet structure were mainly due to the acquisition of Sigma- Aldrich, which closed in November 2015. As part of the pre-liminary purchase price allocation for this transaction, the acquired assets and liabilities were measured at fair values in the balance sheet. On the date of first-time consolidation, this increased intangible assets (excluding goodwill) by € 5,873 million. The goodwill from the acquisition amounted to € 8,613 million. Further information on the purchase price allocation for the Sigma- Aldrich acquisition can be found in
Note [4] ‟Acquisitions, assets held for sale and disposal groups” in the Notes to the Group accounts. The purchase price of € 15,974 million was financed through cash on our balance sheet, bank loans and bonds. Following the issuance of a hybrid bond (€ 1.5 billion) in December 2014, we issued a further bond with a volume of US$ 4 billion in March 2015. Lastly, in August 2015, we issued a euro bond amounting to € 2.1 billion. Moreover, credit lines totaling € 2.95 billion were utilized for the purchase price payment. An overview of the outstanding bonds can be found in Note [28] ‟Financial liabili-ties / Capital management” in the Notes to the Group accounts.
The composition and the development of net financial debt were as follows:
MERCK GROUPNet financial debt
Dec. 31, 2015
Dec. 31, 2014 Change
€ million € million € million in %
Bonds and commercial paper 9,851.4 4,624.2 5,227.2 113.0
Loans to banks 3,006.0 267.4 2,738.6 –
Liabilities to related parties 577.8 501.4 76.4 15.2
Loans from third parties and other financial liabilities 89.2 84.5 4.7 5.6
Liabilities from derivatives (financial transactions) 183.7 153.0 30.7 20.1
Finance lease liabilities 4.8 6.5 – 1.7 – 26.2
Total financial liabilities 13,712.9 5,637.0 8,075.9 143.3
less
Cash and cash equivalents 832.2 2,878.5 – 2,046.3 – 71.1
Current financial assets 227.0 2,199.4 – 1,972.4 – 89.7
Net financial debt 12,653.7 559.1 12,094.6 –
MERCK GROUPReconciliation of net financial debt
€ million 2015
January 1 559.1
Currency translation – 737.2
Dividend payments to shareholders and to E. Merck1 567.8
Acquisitions1 13,482.3
Assumption of financial liabilities from Sigma-Aldrich 425.3
Payment from the disposal of assets held for sale1 – 86.0
Free cash flow – 1,538.5
Other – 19.1
December 31 12,653.7
1 According to the consolidated cash flow statement.

100 Combined Management Report Report on Economic Position Merck
Thanks to the strong internal financing power of the Merck Group, the increase in net financial debt in 2015 was signifi-cantly lower than the cash outflow in connection with the acquisition of Sigma- Aldrich.
MERCK GROUPWorking capital
Change
€ million Dec. 31, 2015 Dec. 31, 2014 in € million in %
Trade accounts receivable 2,738.3 2,219.5 518.8 23.4
Receivables from royalties and licenses 11.5 16.1 – 4.6 – 28.6
Inventories 2,619.8 1,659.7 960.1 57.8
Trade accounts payables – 1,921.2 – 1,539.4 – 381.8 24.8
Working capital 3,448.4 2,355.9 1,092.5 46.4
The increase in working capital was likewise due to the first-time consolidation of Sigma- Aldrich and to exchange rate effects. Excluding these effects, working capital would have been at the level of 2014.
Our equity increased by € 1,054 million, amounting to € 12,855 million on December 31, 2015 (December 31, 2014: € 11,801 million). This strong increase of 8.9 % was mainly driven by profit after tax generated in 2015 amounting to € 1,124 million and the development of currency translation differences from the translation of assets held in foreign cur-rencies into euros, the reporting currency. This was countered by the reclassification of the Sigma- Aldrich purchase price
hedging gains, dividend payments, and the profit transfer to E. Merck KG (see ‟Consolidated Statement of Comprehensive Income” and ‟Consolidated Statement of Changes in Net Equity” in the Consolidated Financial Statements). Owing to the sharp increase in total assets, the equity ratio decreased by 11.6 percentage points, amounting to 33.8% as of Decem-ber 31, 2015 (December 31, 2014: 45.4%).
Free cash flow was € 1,539 million in 2015, which did not meet the high level achieved in 2014. The composition and the development of the relevant items are presented in the follow-ing table:
MERCK GROUPFree cash flow
€ million 2015 2014Change
in %
Cash flow from operating activities according to the cash flow statement 2,195.2 2,705.5 – 18.9
Payments for investments in intangible assets – 179.1 – 143.3 25.0
Payments from the disposal of intangible assets 27.4 2.1 –
Payments for investments in property, plant and equipment – 513.9 – 480.9 6.9
Payments from the disposal of property, plant and equipment 8.9 14.0 – 36.3
Free cash flow 1,538.5 2,097.4 – 26.6
Driven by the development of EBITDA pre exceptionals, busi-ness free cash flow of the Merck Group rose in 2015 by 6.2% to € 2,766 million (2014: € 2,605 million). The composition of this financial indicator is presented under ‟Internal Manage-ment System”.

Merck Report on Economic Position Combined Management Report 101
MERCK GROUPBusiness free cash flow and change by quarter1
€ million /change in %
1 Quarterly breakdown unaudited.
Q1 Q2 Q3 Q4
2015
2014
% – 47.3 31.2 37.0 8.9
361 830 841 735
684 632 614 675
Not presented: Decline in Group business free cash flow by € – 421 million due to Corporate and other.
MERCK GROUPBusiness free cash flow by business sector – 2015
€ million / in %
50% Healthcare
1,581.0
29% Performance Materials
930.8
21% Life Science
675.6
The distribution of business free cash flow across the individual quarters and the percentage changes in comparison with 2014 were as follows:
The increase in Group business free cash flow in 2015 was attributable to the two operating business sectors Life Science and Performance Materials. Healthcare generated business free cash flow amounting to € 1,581 million (2014: € 1,701 mil-lion). Consequently, with a 50% share (2014: 60%) of Group business free cash flow (excluding the decline of € – 421 mil-lion due to Corporate and Other), Healthcare was once again the business sector with the highest cash flows. In 2015, the Life Science business sector achieved a 61.2% increase in business free cash flow to € 676 million (2014: € 419 million), thus also increasing its share of Group business cash flow to 21% (2014: 15%). Performance Materials contributed € 931 million (2014: € 700 million) to this Group financial indi-cator, equivalent to 29% (2014: 25%).
The investments in property, plant, equipment and software included in the calculation of business free cash flow as well as advance payments for intangible assets increased in 2015 by 15.4% to a total of € 609 million (2014: € 528 million). The investments in property, plant and equipment included therein amounted to € 564 million in 2015 (2014: € 485 million), of which € 262 million was attributable to strategic investment projects each with a project volume of more than € 2 million; the remainder was attributable to smaller capital spending projects.
In 2015, strategic investments of € 83 million were made to expand the Darmstadt site. Of this amount, € 29 million was used to upgrade global headquarters; the projects include an Innovation Center, a Visitor Center and an employee cafeteria, among other things. Moreover, in the Performance Materials business sector, OLED production capacity was expanded with an investment of € 13 million in order to better meet growing demand. In the Healthcare business sector, € 8 million was invested in a new laboratory research building.
Globally, strategic investments were made in the Healthcare business sector. Special mention should be made of the pro-duction facility in Nantong, China (€ 50 million), a new pro-duc tion plant for the Allergy business in Reinbek, Germany (€ 17 million), an expansion of the existing filling plant at the Bari site in Italy (€ 18 million), and the construction of a new packaging unit at the Aubonne site in Switzerland (€ 8 mil-lion). Within the Life Science business sector, € 7 million was invested in a new production unit in Spain.
In 2015, there were no changes to our long-term credit ratings by the two rating agencies Moody’s and Standard & Poor’s. The latter continues to issue a rating of ‟A” with a neg-ative outlook and Moody’s a ‟Baa1” rating with a negative out-look. An overview of the development of our rating in recent years is presented in the Report on Risks and Opportunities.

102 Combined Management Report Report on Economic Position Review of forecast against actual business developments
The development of key balance sheet figures was as follows:
MERCK GROUPKey balance sheet figures
in % Dec. 31, 2015 Dec. 31, 2014 Dec. 31, 2013 Dec. 31, 2012 Dec. 31, 2011
Equity ratioEquity
33.8 45.4 53.2 48.1 47.4Total assets
Asset ratioNon-current assets
80.7 59.7 64.5 69.4 71.1Total assets
Asset coverageEquity
41.9 76.0 82.4 69.4 66.7Non-current assets
Finance structureCurrent liabilities
37.3 46.5 40.0 40.6 37.5Liabilities (total)
Overall assessment of business performance and economic situationWe again achieved very good operational success with our strong businesses in 2015. At the same time, we also realized important strategic objectives concerning the long-term direc-tion of the Group. Net sales grew by 13% to € 12,845 million and EBITDA pre exceptionals, our key financial indicator to assess operational performance, rose by 7.1% to € 3,630 mil-lion. All our business sectors contributed to this success.
The successful acquisition of Sigma- Aldrich in Novem-ber 2015, through which our Life Science business sector has become a leading supplier in the lucrative Life Science market, was of major significance to us. We thus achieved an impor-tant step in the implementation of our long-term strategy, through which we want to secure future growth and profitability. Additionally, we made progress with the further development
of our pharmaceutical pipeline in 2015. The operating busi-ness of the Performance Materials business sector benefited from the successful integration of AZ Electronic Materials.
The solid accounting and finance policy of the Merck Group is again reflected by the very good key balance sheet figures. The equity ratio as of December 31, 2015 was 33.8%, thus remaining at a good level. As expected, net financial debt rose massively owing to the acquisition of Sigma- Aldrich. We assume that our strong internal financing power will enable us to quickly reduce our financial liabilities. This is underscored by the unchanged long-term ratings from Moody‘s and Stand-ard & Poor‘s. Against the backdrop of our solid net assets and financial position as well as the earning strength of our busi-nesses, we assess the economic position of the Merck Group positively overall. It represents a superb starting basis for future organic growth of the Group.
Healthcare Report on Economic Position Combined Management Report 103
HEALTHCARENet sales and organic growth by quarter1
€ million / organic growth in %
1 Quarterly breakdown unaudited.
2015
2014
Q1 Q2 Q3 Q4
1,686 1,803 1,708 1,737
1,569 1,651 1,684 1,717
% 0.3 1.5 1.9 2.6
Healthcare
HEALTHCAREKey figures
€ million 2015 2014Change
in %
Net sales1 6,933.8 6,620.5 4.7
Operating Result (EBIT) 1,096.7 1,106.4 – 0.9
Margin (% of net sales)1 15.8 16.7
EBITDA 1,970.4 1,946.4 1.2
Margin (% of net sales)1 28.4 29.4
EBITDA pre exceptionals 2,001.7 2,000.3 0.1
Margin (% of net sales)1 28.9 30.2
Business free cash flow 1,581.0 1,701.2 – 7.1
1 The composition of net sales has changed, see ‟Information on segment reporting” in the Notes to the Group accounts.
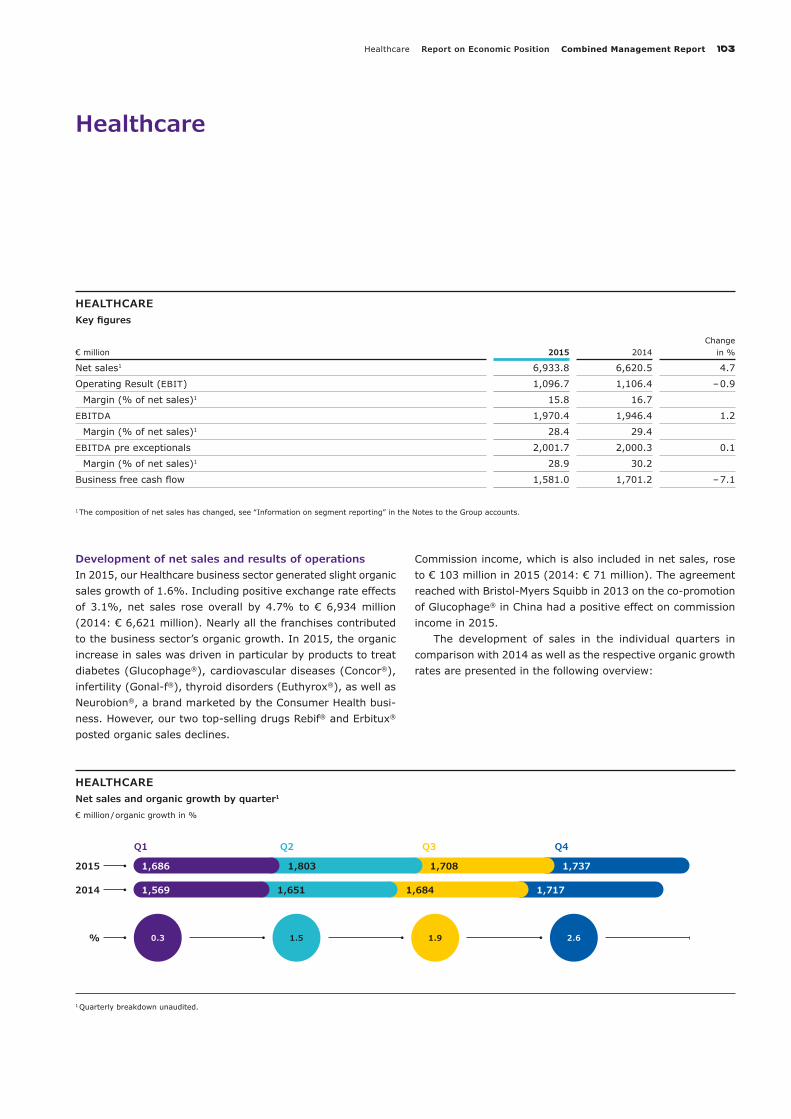
Development of net sales and results of operationsIn 2015, our Healthcare business sector generated slight organic sales growth of 1.6%. Including positive exchange rate effects of 3.1%, net sales rose overall by 4.7% to € 6,934 million (2014: € 6,621 million). Nearly all the franchises contributed to the business sector’s organic growth. In 2015, the organic increase in sales was driven in particular by products to treat diabetes ( Glucophage®), cardiovascular diseases ( Concor®), infertility ( Gonal-f®), thyroid disorders ( Euthyrox®), as well as Neurobion®, a brand marketed by the Consumer Health busi-ness. However, our two top-selling drugs Rebif® and Erbitux® posted organic sales declines.
Commission income, which is also included in net sales, rose to € 103 million in 2015 (2014: € 71 million). The agreement reached with Bristol-Myers Squibb in 2013 on the co-promotion of Glucophage® in China had a positive effect on commission income in 2015.
The development of sales in the individual quarters in comparison with 2014 as well as the respective organic growth rates are presented in the following overview:

104 Combined Management Report Report on Economic Position Healthcare
HEALTHCARENet sales by region – 2015
€ million / % of net sales of the business sector
39% Europe
2,729.419% Asia-Pacific (APAC)
1,302.221%
North America
1,430.4
15% Latin America
1,021.7
6% Middle East and Africa (MEA)
450.1
Europe, the Healthcare business sector’s largest region, accounting for 39% of net sales (2014: 42%), recorded a slight organic sales decline of – 1.7%. Consequently, net sales totaled € 2,729 million (2014: € 2,787 million). The good sales performance by other franchises could not fully offset the organic decline in sales of Rebif®, which was particularly due to the difficult competitive environment.
In North America, the second-largest region in terms of sales, net sales amounted to € 1,430 million in 2015 (2014: € 1,292 million). This was due to an organic decline of – 6.1%, offset by positive currency effects of 16.8%. Sales of Rebif®, which increased to € 1,042 million (2014: € 971 million) owing to currency effects, contributed significantly to the business sector’s sales performance in North America. The share of Healthcare sales attributable to this region thus rose by one percentage point to 21% in 2015.
In the Asia-Pacific region, organic sales growth of 10.4% was recorded in 2015. Including positive exchange rate effects of 10.7%, sales thus rose to € 1,302 million (2014: € 1,075 mil-lion). Organic growth was driven in particular by the Fertility and CardioMetabolic Care franchises. This region’s share of the business sector’s net sales increased from 16% in 2014 to 19% in 2015.
Sales in Latin America amounted to € 1,022 million in 2015 (2014: € 1,059 million). This reflects an organic sales increase of 8.4% and negative exchange rate effects of – 11.8%. Organic sales growth was mainly attributable to the develop-ment of sales in the CardioMetabolic Care franchise and of the Neurobion® brand. The negative currency effects mainly stemmed from the translation of the Venezuelan bolivar into the reporting currency, euros. In this connection, reference is made to the explanations in Note [7] ‟Management judgments and sources of estimation uncertainty” in the Notes to the Group accounts. The contribution by the Latin America region to net sales of the Healthcare business sector fell by one per-centage point to 15%.
With net sales of € 450 million (2014: € 408 million), the Middle East and Africa region recorded an organic sales increase of 7.6%, mainly in the CardioMetabolic Care franchise. Positive currency effects increased sales by 2.8%.
HEALTHCARENet sales components by region – 2015
€ million / change in % Net sales Organic growthExchange rate
effectsAcquisitions / divestments Total change
Europe 2,729.4 – 1.7 – 0.4 – – 2.1
North America 1,430.4 – 6.1 16.8 – 10.7
Asia-Pacific (APAC) 1,302.2 10.4 10.7 – 21.2
Latin America 1,021.7 8.4 – 11.8 – – 3.5
Middle East and Africa (MEA) 450.1 7.6 2.8 – 10.5
Healthcare 6,933.8 1.6 3.1 – 4.7

Healthcare Report on Economic Position Combined Management Report 105
HEALTHCAREProduct sales and organic growth
€ million / organic growth in % %
– 10.7
– 1.5
3.7
8.9
20.0
5.3
17.3
Rebif®
Erbitux®
1,798
Gonal-f®
Concor®
Glucophage®
Euthyrox®
Neurobion®
1,840
899
904
685
628
463
428
437
378
312
296
2014
2015
278
240
15.8Saizen®
261
237
Net sales and organic growth rates of the key products devel-oped in 2015 as follows:
Sales of Rebif®, which is used to treat relapsing forms of multiple sclerosis, declined organically by – 10.7% in 2015 due to continued competitive pressure from oral formulations. Amid currency tailwinds of 8.5%, Rebif® sales amounted to € 1,798 million (2014: € 1,840 million).
North America generated 58% of Rebif® sales (2014: 53%) and is the largest market for this product. Owing to the strength of the U.S. dollar (currency effect: + 16.7%), this region reported a strong increase in Rebif® sales to € 1,042 mil-lion (2014: € 971 million). Despite price increases in 2015, sales declined organically by – 9.4% compared with 2014 due to the difficult market environment.
In Europe, which accounts for 34% of sales (2014: 38%) and is the second-largest region for the product, sales of Rebif® declined organically by – 13.0% to € 605 million due to competition (2014: € 698 million).
Together, the remaining regions Latin America, Middle East and Africa, and Asia-Pacific accounted for an 8% share of sales (2014: 9%).
At € 899 million, Group sales of the oncology drug Erbitux® in 2015 were at the previous year’s level (2014: € 904 mil-lion). The slight organic sales decline of – 1.5% was partly off-set by positive exchange rate effects of 0.9%.
In Europe, which accounted for 55% (2014: 56%) of Erbitux® sales and is thus the top-selling region for this prod-uct, sales declined organically by – 1.4%, mainly owing to the competitive situation and customary price decreases. Includ-ing negative currency effects (– 0.1%), sales amounted to € 496 million (2014: € 504 million).

106 Combined Management Report Report on Economic Position Healthcare
The Asia-Pacific region, which contributed a 29% (2014: 27%) share of Erbitux® sales, generated an increase in sales to € 265 million (2014: € 240 million). Both organic growth of 1.6% and currency tailwinds of 9.0% had a positive impact on the development of sales.
In Latin America, the business sector generated net sales of € 87 million with Erbitux® (2014: € 112 million). The overall
– 22.2% decline in sales was mainly attributable to the nega-tive currency effects in Venezuela and an organic sales decline in Brazil. This region’s contribution to total Erbitux® sales thus decreased to 10% (2014: 12%).
In the Middle East and Africa region, sales amounted to € 50 million and were thus slightly higher than in 2014.
HEALTHCAREProduct sales and organic growth of Rebif® and Erbitux® by region – 2015
Total Europe North AmericaAsia-Pacific
(APAC) Latin AmericaMiddle East and
Africa (MEA)
Rebif®
€ million 1,798.1 605.3 1,041.5 16.3 76.5 58.5
Organic growth in % – 10.7 – 13.0 – 9.4 – 9.0 – 7.4 – 11.4
% of sales 100 34 58 1 4 3
Erbitux®
€ million 898.7 496.4 – 265.2 87.3 49.8
Organic growth in % – 1.5 – 1.4 – 1.6 – 10.0 1.1
% of sales 100 55 – 29 10 6
In 2015, the Healthcare business sector generated organic sales growth of 3.7% with Gonal-f®, the leading recombinant hormone used in the treatment of infertility. Including positive currency effects, sales rose to € 685 million (2014: € 628 mil-lion). Sales of this medicine showed the strongest growth in the Asia-Pacific region. The other products in the Fertility fran-chise also developed positively.
Sales by the Endocrinology franchise, which mainly con-sists of products to treat metabolic and growth disorders, amounted to € 461 million, thus considerably exceeding the year-earlier figure of € 394 million. The reported sales increase reflected good organic growth of 9.9% and a positive foreign exchange impact of 7.2%. Sales of the growth hormone Saizen®, the top-selling product of this franchise, saw an organic increase of 6.7% and positive foreign exchange effects of 3.4%. Consequently, sales amounted to € 261 million (2014: € 237 million).
General Medicine (including CardioMetabolic Care), which commercializes products to treat cardiovascular diseases and diabetes, among other things, generated organic sales growth of 7.4%. Including negative foreign exchange effects of – 1.2%, mainly in Venezuela, sales amounted to € 1,849 mil-lion (2014: € 1,742 million).
Glucophage®, which is used for the treatment of diabetes, also delivered a strong organic sales increase of 20.0%. Including negative foreign exchange effects, sales climbed to € 437 million (2014: € 378 million). Organic sales growth was mainly achieved in Europe and the Middle East and Africa region.
In 2015, the Consumer Health business delivered a very strong organic increase of 10.2% with sales of over-the- counter pharmaceuticals. Including negative exchange rate effects of – 1.4%, sales amounted to € 833 million (2014: € 766 million). Organic sales growth was mainly generated in Latin America. Here, the growth rate was 11.6% and was especially bolstered by demand for the strategic brands Neurobion® and Dolo- Neurobion®, as well as local brands.
Healthcare Report on Economic Position Combined Management Report 107
The results of operations developed as follows:
HEALTHCAREResult of operations1
Change
€ million 2015 in % 2014 in % € million in %
Net sales 6,933.8 100.0 6,620.5 100.0 313.3 4.7
Cost of sales – 1,442.4 – 20.8 – 1,370.5 – 20.7 – 71.9 5.3
(of which: amortization of intangible assets)2 (– 0.9) (–) (– 0.9) (–)
Gross profit 5,491.4 79.2 5,250.0 79.3 241.4 4.6
Marketing and selling expenses – 2,801.3 – 40.4 – 2,550.8 – 38.5 – 250.5 9.8
(of which: amortization of intangible assets)2 (– 565.8) (– 555.4) (– 10.4) (1.9)
Administration expenses – 259.4 – 3.7 – 246.9 – 3.7 – 12.5 5.1
Research and development costs – 1,310.1 – 18.9 – 1,366.0 – 20.6 55.9 – 4.1
(of which: amortization of intangible assets)2 (– 1.5) (– 1.0) (– 0.5) (50.0)
Other operating expenses and income – 23.9 – 0.3 20.1 0.3 – 44.0 –
Operating result (EBIT) 1,096.7 15.8 1,106.4 16.7 – 9.7 – 0.9
Depreciation / amortization / impairment losses / reversals of impairment losses 873.7 12.6 840.0 12.7 33.7 4.0
(of which: exceptionals) (90.3) (4.7) (85.6) –
EBITDA 1,970.4 28.4 1,946.4 29.4 24.0 1.2
Restructuring costs 30.4 51.5 – 21.1 – 40.8
Integration costs / IT costs 0.9 2.4 – 1.5 – 61.6
Gains / losses on the divestment of businesses – – – –
Acquisition-related exceptionals – – – –
Other exceptionals – – – –
EBITDA pre exceptionals 2,001.7 28.9 2,000.3 30.2 1.4 0.1
1 The reporting structure has changed, see ‟Information on segment reporting” in the Notes to the Group accounts. 2 Excluding amortization of internally generated or separately acquired software.
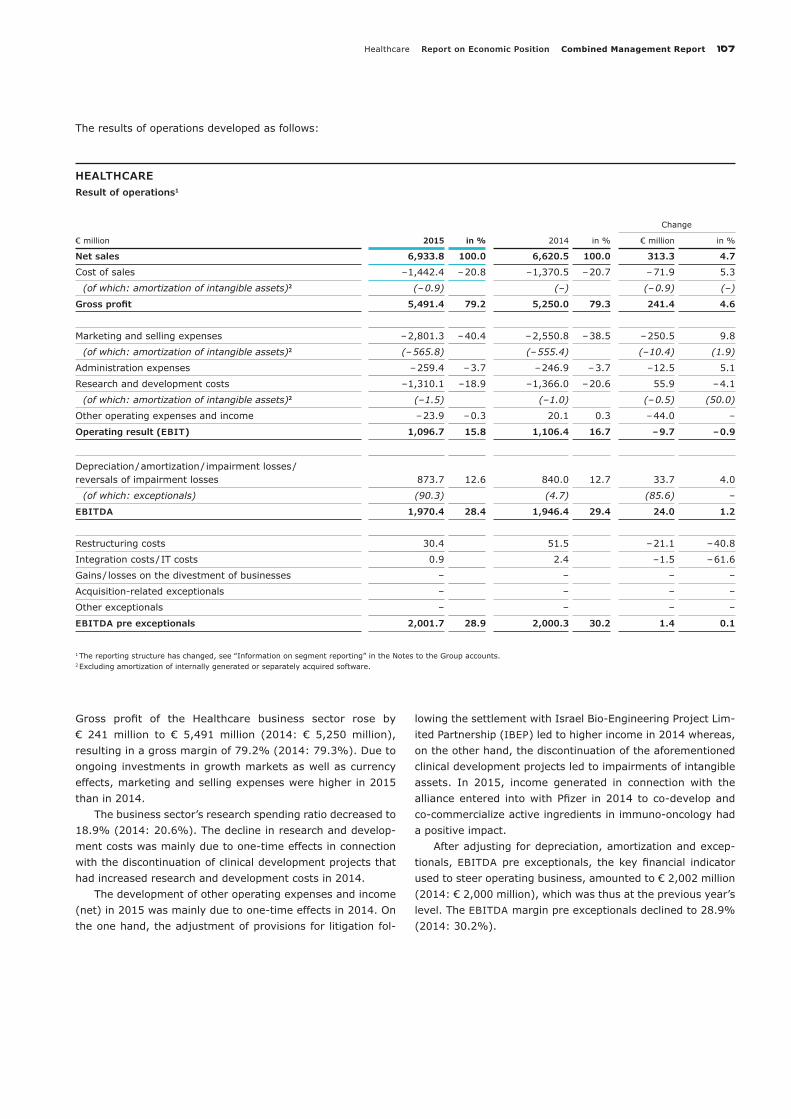
Gross profit of the Healthcare business sector rose by € 241 million to € 5,491 million (2014: € 5,250 million), resulting in a gross margin of 79.2% (2014: 79.3%). Due to ongoing investments in growth markets as well as currency effects, marketing and selling expenses were higher in 2015 than in 2014.
The business sector’s research spending ratio decreased to 18.9% (2014: 20.6%). The decline in research and develop-ment costs was mainly due to one-time effects in connection with the discontinuation of clinical development projects that had increased research and development costs in 2014.
The development of other operating expenses and income (net) in 2015 was mainly due to one-time effects in 2014. On the one hand, the adjustment of provisions for litigation fol-
lowing the settlement with Israel Bio-Engineering Project Lim-ited Partnership (IBEP) led to higher income in 2014 whereas, on the other hand, the discontinuation of the aforementioned clinical development projects led to impairments of intangible assets. In 2015, income generated in connection with the alliance entered into with Pfizer in 2014 to co-develop and co-commercialize active ingredients in immuno-oncology had a positive impact.
After adjusting for depreciation, amortization and excep-tionals, EBITDA pre exceptionals, the key financial indicator used to steer operating business, amounted to € 2,002 million (2014: € 2,000 million), which was thus at the previous year’s level. The EBITDA margin pre exceptionals declined to 28.9% (2014: 30.2%).

108 Combined Management Report Report on Economic Position Healthcare
HEALTHCAREBusiness free cash flow and change by quarter1
€ million / change in %
1 Quarterly breakdown unaudited.
Q1 Q2 Q3 Q4
2015
2014
256 427 460 438
496 374 391 441
% – 48.5 14.4 17.9 – 0.7
HEALTHCAREEBITDA pre exceptionals and change by quarter1
€ million / change in %
1 Quarterly breakdown unaudited.
Q1 Q2 Q3 Q4
2015
2014
% – 3.8 – 2.8 8.1 – 1.3
461 480 537 524
479 493 497 530
The development of EBITDA pre exceptionals in the individual quarters in comparison with 2014 is presented in the following overview:
Development of business free cash flowIn 2015, business free cash flow of the Healthcare business sector amounted to € 1,581 million, falling short of the previous
year’s level of € 1,701 million. The decline of € 120 million was mainly due to higher investments and the high amount of cap-ital tied up in receivables.
HEALTHCAREBusiness free cash flow
€ million 2015 2014Change
in %
EBITDA pre exceptionals 2,001.7 2,000.3 0.1
Investments in property, plant and equipment, software as well as advance payments for intangible assets – 289.1 – 240.0 20.4
Changes in inventories – 26.7 – 42.4 – 37.0
Changes in trade accounts receivables as well as receivables from royalties and licenses – 104.9 – 16.7 –
Business free cash flow 1,581.0 1,701.2 – 7.1
The development of business free cash flow in the individual quarters in comparison with 2014 is presented in the following overview:

Life Science Report on Economic Position Combined Management Report 109
LIFE SCIENCENet sales and organic growth by quarter1
€ million / organic growth in %
1 Quarterly breakdown unaudited.
2015
2014
Q1 Q2 Q3 Q4
738 773 759 1,085
657 659 661 706
% 3.4 6.2 8.1 8.1
Life Science
LIFE SCIENCEKey figures
€ million 2015 2014Change
in %
Net sales1 3,355.3 2,682.5 25.1
Operating Result (EBIT) 300.8 289.2 4.0
Margin (% of net sales)1 9.0 10.8
EBITDA 674.3 598.9 12.6
Margin (% of net sales)1 20.1 22.3
EBITDA pre exceptionals 856.1 658.6 30.0
Margin (% of net sales)1 25.5 24.6
Business free cash flow 675.6 419.0 61.2
1 The composition of net sales has changed, see ‟Information on segment reporting” in the Notes to the Group accounts.
Development of sales and results of operations2015 was another successful year for our Life Science busi-ness sector. Net sales grew by 25.1% to € 3,355 million (2014: € 2,682 million), stemming from strong organic growth of 6.5%; positive exchange rate effects of 8.4% primarily related to the development of the U.S. dollar; and 10.2% from acqui-sitions and divestments.
All three business areas contributed to the organic growth of the Life Science business sector in 2015. In particular, Pro-cess Solutions generated double-digit organic sales growth of 11.6% owing to price increases and higher sales volumes. Lab Solutions continued to perform well, posting organic growth of
3.1%. The Bioscience business area, which provides products and services to support life science research for pharma-ceutical, biotechnological and academic research laboratories, reported an organic increase of 0.7%.
During the period from November 18, 2015 to Decem-ber 31, 2015, Sigma- Aldrich contributed sales of € 279 mil-lion. This was slightly lowered by the divestment of the Dis-covery and Development Solutions business field in the first quarter of 2014.
The development of net sales in the individual quarters in comparison with 2014 as well as the respective organic growth rates are presented in the following overview:
110 Combined Management Report Report on Economic Position Life Science
LIFE SCIENCENet sales by region – 2015
€ million / % of net sales of the business sector
35% Europe
1,167.825% Asia-Pacific (APAC)
831.1
33% North America
1,098.4
6% Latin America
203.3
1% Middle East and Africa (MEA)
54.7
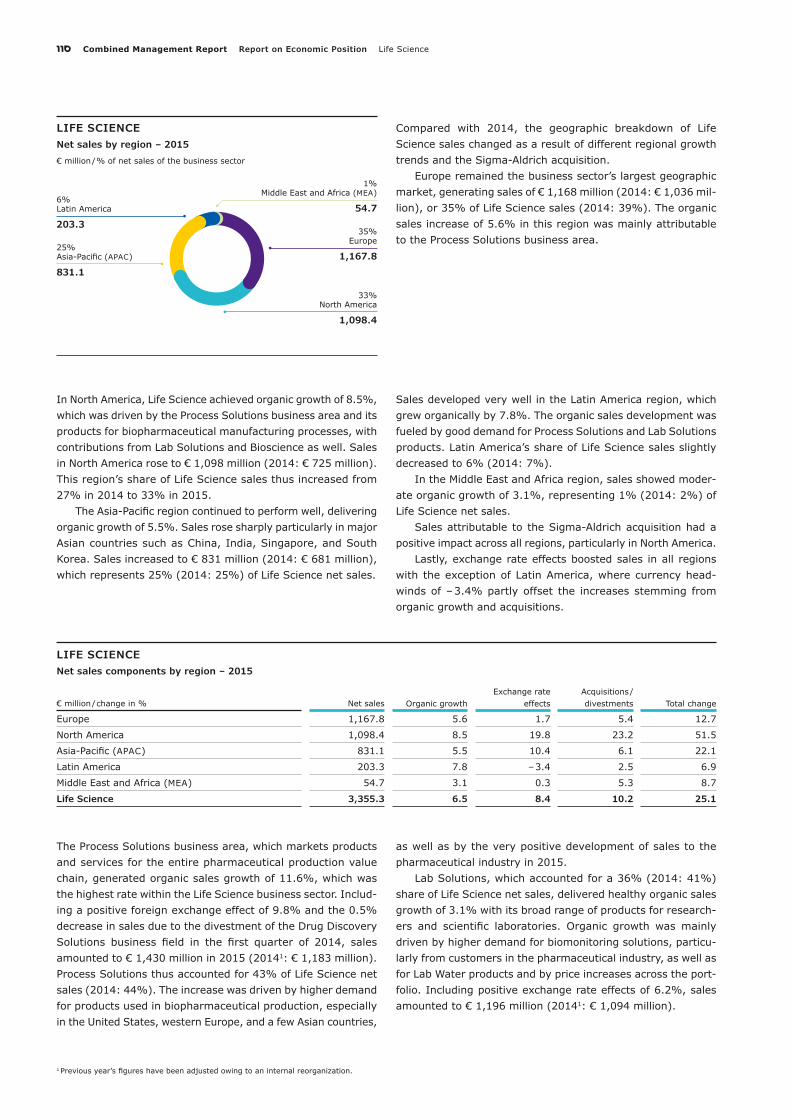
Compared with 2014, the geographic breakdown of Life Science sales changed as a result of different regional growth trends and the Sigma- Aldrich acquisition.
Europe remained the business sector’s largest geographic market, generating sales of € 1,168 million (2014: € 1,036 mil-lion), or 35% of Life Science sales (2014: 39%). The organic sales increase of 5.6% in this region was mainly attributable to the Process Solutions business area.
In North America, Life Science achieved organic growth of 8.5%, which was driven by the Process Solutions business area and its products for biopharmaceutical manufacturing processes, with contributions from Lab Solutions and Bioscience as well. Sales in North America rose to € 1,098 million (2014: € 725 million). This region’s share of Life Science sales thus increased from 27% in 2014 to 33% in 2015.
The Asia-Pacific region continued to perform well, delivering organic growth of 5.5%. Sales rose sharply particularly in major Asian countries such as China, India, Singapore, and South Korea. Sales increased to € 831 million (2014: € 681 million), which represents 25% (2014: 25%) of Life Science net sales.
Sales developed very well in the Latin America region, which grew organically by 7.8%. The organic sales development was fueled by good demand for Process Solutions and Lab Solutions products. Latin America’s share of Life Science sales slightly decreased to 6% (2014: 7%).
In the Middle East and Africa region, sales showed moder-ate organic growth of 3.1%, representing 1% (2014: 2%) of Life Science net sales.
Sales attributable to the Sigma- Aldrich acquisition had a positive impact across all regions, particularly in North America.
Lastly, exchange rate effects boosted sales in all regions with the exception of Latin America, where currency head-winds of – 3.4% partly offset the increases stemming from organic growth and acquisitions.
LIFE SCIENCENet sales components by region – 2015
€ million / change in % Net sales Organic growthExchange rate
effectsAcquisitions / divestments Total change
Europe 1,167.8 5.6 1.7 5.4 12.7
North America 1,098.4 8.5 19.8 23.2 51.5
Asia-Pacific (APAC) 831.1 5.5 10.4 6.1 22.1
Latin America 203.3 7.8 – 3.4 2.5 6.9
Middle East and Africa (MEA) 54.7 3.1 0.3 5.3 8.7
Life Science 3,355.3 6.5 8.4 10.2 25.1
The Process Solutions business area, which markets products and services for the entire pharmaceutical production value chain, generated organic sales growth of 11.6%, which was the highest rate within the Life Science business sector. Includ-ing a positive foreign exchange effect of 9.8% and the 0.5% decrease in sales due to the divestment of the Drug Discovery Solutions business field in the first quarter of 2014, sales amounted to € 1,430 million in 2015 (20141: € 1,183 million). Process Solutions thus accounted for 43% of Life Science net sales (2014: 44%). The increase was driven by higher demand for products used in biopharmaceutical production, especially in the United States, western Europe, and a few Asian countries,
as well as by the very positive development of sales to the pharmaceutical industry in 2015.
Lab Solutions, which accounted for a 36% (2014: 41%) share of Life Science net sales, delivered healthy organic sales growth of 3.1% with its broad range of products for research-ers and scientific laboratories. Organic growth was mainly driven by higher demand for biomonitoring solutions, particu-larly from customers in the pharmaceutical industry, as well as for Lab Water products and by price increases across the port-folio. Including positive exchange rate effects of 6.2%, sales amounted to € 1,196 million (20141: € 1,094 million).
1 Previous year’s figures have been adjusted owing to an internal reorganization.

Life Science Report on Economic Position Combined Management Report 111
The Bioscience business area recorded a slight organic increase of 0.7%. Including a positive foreign exchange effect of 10.4%, sales amounted to € 450 million (20141: € 405 million). This growth was primarily driven by a recovery in demand in the United States and good sales performance of Separation & Preparation products, as well as hardware demand in Molecular
Cell Biology. The share of sales accounted for by Bioscience in 2015 was 13% (2014: 15%).
The first-time consolidation of Sigma- Aldrich on Novem-ber 18 boosted Life Science sales by € 279 million, accounting for 8% of the business sector’s net sales.
LIFE SCIENCENet sales components by business area – 2015
€ million / change in % Net sales Organic growthExchange rate
effectsAcquisitions / divestments Total change
Bioscience 450.3 0.7 10.4 – 11.1
Lab Solutions 1,196.3 3.1 6.2 – 9.3
Process Solutions 1,429.7 11.6 9.8 – 0.5 20.9
Sigma- Aldrich 279.0 – – – –
The results of operations developed as follows:
LIFE SCIENCEResult of operations2
Change
€ million 2015 in % 2014 in % € million in %
Net sales 3,355.3 100.0 2,682.5 100.0 672.8 25.1
Cost of sales – 1,482.8 – 44.2 – 1,168.7 – 43.6 – 314.1 26.9
(of which: amortization of intangible assets)3 (– 50.7) (– 47.6) (– 3.1) (6.6)
Gross profit 1,872.5 55.8 1,513.8 56.4 358.7 23.7
Marketing and selling expenses – 1,038.5 – 31.0 – 859.8 – 32.1 – 178.7 20.8
(of which: amortization of intangible assets)3 (– 197.2) (– 151.8) (– 45.4) (29.9)
Administration expenses – 151.1 – 4.5 – 110.4 – 4.1 – 40.7 36.9
Research and development costs – 197.5 – 5.9 – 162.6 – 6.1 – 34.9 21.4
(of which: amortization of intangible assets)3 (– 0.5) (–) (– 0.5) (–)
Other operating expenses and income – 184.6 – 5.5 – 91.8 – 3.4 – 92.8 101.1
Operating result (EBIT) 300.8 9.0 289.2 10.8 11.6 4.0
Depreciation / amortization / impairment losses / reversals of impairment losses 373.5 11.1 309.7 11.5 63.8 20.6
(of which: exceptionals) (0.6) (–) (0.6) (–)
EBITDA 674.3 20.1 598.9 22.3 75.4 12.6
Restructuring costs 6.8 11.9 – 5.1 – 43.0
Integration costs / IT costs 43.0 31.6 11.4 35.9
Gains / losses on the divestment of businesses – – 0.4 0.4 –
Acquisition-related exceptionals 132.0 16.6 115.4 –
Other exceptionals – – – –
EBITDA pre exceptionals 856.1 25.5 658.6 24.6 197.5 30.0
1 Previous year’s figures have been adjusted owing to an internal reorganization. 2 The reporting structure has changed, see ‟Information on segment reporting“ in the Notes to the Group accounts. 3 Excluding amortization of software either produced in-house or purchased individually.

112 Combined Management Report Report on Economic Position Life Science
LIFE SCIENCEEBITDA pre exceptionals and change by quarter1
€ million / change in %
1 Quarterly breakdown unaudited.
2015
2014
Q1 Q2 Q3 Q4
% 8.5 20.6 25.2 66.7
184 200 201 271
170 166 161 163
Gross profit amounted to € 1,872 million (2014: € 1,514 mil-lion), equivalent to an increase of 23.7%. This very strong increase was driven by a manufacturing site optimization pro-gram, a price increase initiative and a favorable product mix. This development was also positively impacted by exchange rate effects and the Sigma- Aldrich acquisition.
In addition to the Sigma- Aldrich acquisition, Life Science continued to execute its growth strategy by investing in com-mercial operations and developing new products. Marketing and selling expenses increased by 20.8% to € 1,038 million (2014: € 860 million) while R&D expenses grew by 21.4%. Part of this increase was also driven by the stronger U.S. dollar since a significant portion of our Life Science operations is located in the United States. Other operating expenses and income increased significantly to € 185 million (2014: € 92 mil-lion) due to the Sigma- Aldrich acquisition, integration costs and restructuring activities.
After eliminating depreciation and amortization, EBITDA rose by 12.6% to € 674 million (2014: € 599 million).
Adjusted for exceptionals, EBITDA pre exceptionals rose by 30.0% to € 856 million, or 25.5% of net sales (2014: € 659 million, 24.6% of net sales). Consequently, the key financial indicator rose more sharply than sales (+ 25.1%) thanks to the execution of efficiency initiatives, leveraging of Life Science capabilities and competencies, and the Sigma- Aldrich acquisition. The improvement in the EBITDA margin pre exceptionals reflects strong organic sales growth, a favora-ble product mix, exchange rate effects, and strict cost control.
The development of EBITDA pre exceptionals in the indi-vidual quarters in comparison with 2014 is presented in the following overview:
Development of business free cash flowIn 2015, business free cash flow of the Life Science business sector rose by 61% or € 257 million to € 676 million. This very strong increase was primarily due to the positive development of EBITDA pre exceptionals.
LIFE SCIENCEBusiness free cash flow
€ million 2015 2014Change
in %
EBITDA pre exceptionals 856.1 658.6 30.0
Investments in property, plant and equipment, software as well as advance payments for intangible assets – 149.9 – 141.0 6.3
Changes in inventories – 850.1 – 44.2 –
Changes in trade accounts receivables as well as receivables from royalties and licenses – 375.4 – 54.4 –
Adjustments first-time consolidation of Sigma- Aldrich 1,194.8 – –
Business free cash flow 675.6 419.0 61.2

Life Science Report on Economic Position Combined Management Report 113
LIFE SCIENCEBusiness free cash flow and change by quarter1
€ million / change in %
1 Quarterly breakdown unaudited.
2015
2014
%
Q1 Q2 Q3 Q4
– 58.1 60.7 96.6 82.1
23 202 213 238
54 125 109 131
The development of business free cash flow items in the indi-vidual quarters in comparison with 2014 is presented in the following overview:

114 Combined Management Report Report on Economic Position Performance Materials
Performance Materials
PERFORMANCE MATERIALSKey figures
€ million 2015 2014Change
in %
Net sales1 2,555.6 2,059.8 24.1
Operating Result (EBIT) 878.0 611.5 43.6
Margin (% of net sales)1 34.4 29.7
EBITDA 1,120.4 803.6 39.4
Margin (% of net sales)1 43.8 39.0
EBITDA pre exceptionals 1,132.1 894.8 26.5
Margin (% of net sales)1 44.3 43.4
Business free cash flow 930.8 699.6 33.0
1 The composition of net sales has changed, see ‟Information on segment reporting” in the Notes to the Group accounts.
Development of net sales and results of operationsIn 2015, net sales of the Performance Materials business sec-tor grew by 24.1% to € 2,556 million (2014: € 2,060 million). This double-digit sales increase was mainly due to the signifi-cantly positive currency effect of 13.1%, stemming primarily from the strong U.S. dollar, the leading transaction currency in the Performance Materials business. Revenues from acquired businesses also contributed considerably to the strong sales growth (+ 10.4%). These acquisition-related sales effects were largely attributable to AZ Electronic Materials (AZ), acquired in May 2014. In addition, the first-time consolida-tion of the SAFC Hitech business of Sigma- Aldrich acquired in November 2015 contributed around € 10 million to the sales increase in the Performance Materials business sector. Organ-ically, sales were at the previous year’s level (+ 0.6%), based on stable business performance, to which all business units contributed.
The Display Materials business unit, which was established at the beginning of 2015 and consists of Merck’s liquid crystals business and the business with the complementary display materials from the acquisition of AZ, represents more than 60% of the net sales of Performance Materials. In 2015, this business unit recorded a slight organic sales decline, however
it solidified its global market leadership position. The doubling of the business with the energy-saving UB-FFS technology could not fully compensate for the accelerated decline in volumes of the mature LC technology TN-TFT. The leading active-matrix technologies PS-VA and IPS generated stable sales.
For the Pigments & Functional Materials business unit, 2015 was a stable year with sales at the previous year’s level. In contrast to the continuing success story of the high-quality Xirallic® pigments for automotive coatings, a comparatively sharp decline in sales was recorded for Iriodin® pigments used in plastics and printing applications.
The Integrated Circuit Materials (ICM) business unit includes the former AZ business with materials used to manu-facture integrated circuits and the SAFC Hitech business of Sigma- Aldrich acquired in November 2015. The business unit recorded a slight organic sales increase – mainly fueled by strong growth of the business with dielectric materials for chip manufacture.
The Advanced Technologies business unit achieved the highest growth rates within the Performance Materials busi-ness sector. Special mention should be made of the dynamic development of the OLED materials business.

Performance Materials Report on Economic Position Combined Management Report 115
PERFORMANCE MATERIALSNet sales and organic growth by quarter1
€ million / organic growth in %
1 Quarterly breakdown unaudited.
2015
2014
Q1 Q2 Q3 Q4
617 643 653 642
402 506 576 576
% 1.6 – 0.4 2.2 – 0.8
PERFORMANCE MATERIALSNet sales by region – 2015
€ million / % of net sales of the business sector
82% Asia-Pacific (APAC)
2,107.5
8% North America
194.1
0% Middle East and Africa (MEA)
8.1
8% Europe
205.5
2% Latin America
40.4
Accounting for a stable 82% share, the Asia-Pacific region again generated the vast majority of the business sector’s net sales. This is attributable to the concentration of customers for display and integrated circuit materials in Asia. In this region, the business sector achieved significant sales growth of 24.9%, mainly due to acquisition and currency effects. Organ-ically, sales were stable (+ 0.8%); however, increases in OLED and dielectric IC materials were almost canceled out by declines in the Display Materials business unit. This led to net sales of € 2,107 million (2014: € 1,688 million), underscoring the sustainable strength of the Performance Materials busi-ness sector in the strategically important Asia-Pacific region.
In Europe, Performance Materials generated net sales of € 206 million (2014: € 193 million). The rise in sales was mainly attributable to acquisition-related effects due to the first-time consolidation of AZ on May 2, 2014. Organically, sales declined slightly in 2015, mainly as a result of weaker demand for cosmetic actives as well as pigments for plastics and printing applications.
In North America, due to acquisition and exchange rate effects, net sales climbed to € 194 million (2014: € 135 mil-lion). Organically, regional sales decreased by – 2.2%. This
was mainly attributable to the weaker demand in Pigments & Functional Materials, particularly pigments for plastics and printing applications.
Since they account for a low proportion of sales, the two regions Latin America and Middle East and Africa (MEA) only played a subordinate role. Latin America recorded double- digit organic growth, albeit a low level of net sales. Organic growth was generated by strong increases in the Pigments & Functional Materials business unit.
The development of net sales in the individual quarters in comparison with 2014 as well as the respective organic growth rates are presented in the following overview:

116 Combined Management Report Report on Economic Position Performance Materials
PERFORMANCE MATERIALSNet sales components by region – 2015
€ million / change in % Net sales Organic growthExchange rate
effectsAcquisitions / divestments Total change
Europe 205.5 – 1.6 0.5 7.6 6.5
North America 194.1 – 2.2 18.1 28.0 43.9
Asia-Pacific (APAC) 2,107.5 0.8 14.6 9.5 24.9
Latin America 40.4 20.7 – 10.1 0.6 11.1
Middle East and Africa (MEA) 8.1 – 10.0 2.2 10.4 2.6
Performance Materials 2,555.6 0.6 13.1 10.4 24.1
The results of operations developed as follows:
PERFORMANCE MATERIALSResult of operations1
Change
€ million 2015 in % 2014 in % € million in %
Net sales 2,555.6 100.0 2,059.8 100.0 495.8 24.1
Cost of sales – 1,151.4 – 45.1 – 983.2 – 47.7 – 168.2 17.1
(of which: amortization of intangible assets)2 (– 114.9) (– 46.4) (– 68.5) (147.8)
Gross profit 1,404.2 54.9 1,076.6 52.3 327.6 30.4
Marketing and selling expenses – 207.8 – 8.1 – 178.8 – 8.7 – 29.0 16.2
(of which: amortization of intangible assets)2 (– 16.0) (– 11.7) (– 4.3) (36.4)
Administration expenses – 63.1 – 2.5 – 56.1 – 2.7 – 7.0 12.6
Research and development costs – 197.0 – 7.7 – 170.6 – 8.3 – 26.4 15.4
(of which: amortization of intangible assets)2 (– 0.7) (– 2.8) (2.1) (– 76.4)
Other operating expenses and income – 58.3 – 2.3 – 59.6 – 2.9 1.3 – 2.3
Operating result (EBIT) 878.0 34.4 611.5 29.7 266.5 43.6
Depreciation / amortization / impairment losses / reversals of impairment losses 242.4 9.5 192.1 9.3 50.3 26.2
(of which: exceptionals) (–) (–) (–) (–)
EBITDA 1,120.4 43.8 803.6 39.0 316.8 39.4
Restructuring costs 1.8 6.0 – 4.2 – 70.3
Integration costs / IT costs 15.0 12.2 2.8 24.4
Gains / losses on the divestment of businesses – 5.8 4.6 – 10.4 –
Acquisition-related exceptionals 0.7 68.4 – 67.7 – 99.0
Other exceptionals – – – –
EBITDA pre exceptionals 1,132.1 44.3 894.8 43.4 237.3 26.5
1 The reporting structure has changed, see ‟Information on segment reporting” in the Notes to the Group accounts. 2 Excluding amortization of internally generated or separately acquired software.
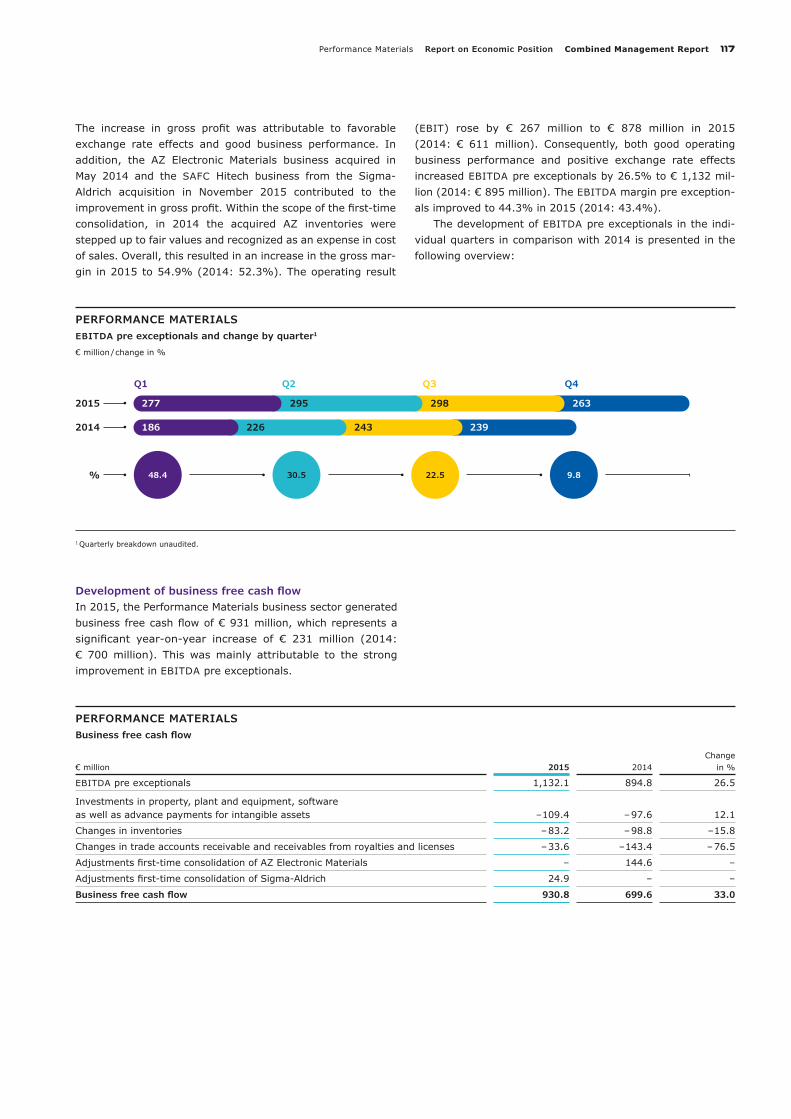
Performance Materials Report on Economic Position Combined Management Report 117
PERFORMANCE MATERIALSEBITDA pre exceptionals and change by quarter1
€ million / change in %
1 Quarterly breakdown unaudited.
Q1 Q2 Q3 Q4
2015
2014
% 48.4 30.5 22.5 9.8
277 295 298 263
186 226 243 239
The increase in gross profit was attributable to favorable exchange rate effects and good business performance. In addition, the AZ Electronic Materials business acquired in May 2014 and the SAFC Hitech business from the Sigma- Aldrich acquisition in November 2015 contributed to the improvement in gross profit. Within the scope of the first-time consolidation, in 2014 the acquired AZ inventories were stepped up to fair values and recognized as an expense in cost of sales. Overall, this resulted in an increase in the gross mar-gin in 2015 to 54.9% (2014: 52.3%). The operating result
(EBIT) rose by € 267 million to € 878 million in 2015 (2014: € 611 million). Consequently, both good operating business performance and positive exchange rate effects increased EBITDA pre exceptionals by 26.5% to € 1,132 mil-lion (2014: € 895 million). The EBITDA margin pre exception-als improved to 44.3% in 2015 (2014: 43.4%).
The development of EBITDA pre exceptionals in the indi-vidual quarters in comparison with 2014 is presented in the following overview:
Development of business free cash flow In 2015, the Performance Materials business sector generated business free cash flow of € 931 million, which represents a significant year-on-year increase of € 231 million (2014: € 700 million). This was mainly attributable to the strong improvement in EBITDA pre exceptionals.
PERFORMANCE MATERIALSBusiness free cash flow
€ million 2015 2014Change
in %
EBITDA pre exceptionals 1,132.1 894.8 26.5
Investments in property, plant and equipment, software as well as advance payments for intangible assets – 109.4 – 97.6 12.1
Changes in inventories – 83.2 – 98.8 – 15.8
Changes in trade accounts receivable and receivables from royalties and licenses – 33.6 – 143.4 – 76.5
Adjustments first-time consolidation of AZ Electronic Materials – 144.6 –
Adjustments first-time consolidation of Sigma- Aldrich 24.9 – –
Business free cash flow 930.8 699.6 33.0

118 Combined Management Report Report on Economic Position Performance Materials
PERFORMANCE MATERIALSBusiness free cash flow and change by quarter1
€ million / change in %
1 Quarterly breakdown unaudited.
Q1 Q2 Q3 Q4
2015
2014
% – 1.8 61.2 58.7 14.0
162 289 265 214
165 179 167 188
The development of business free cash flow items in the indi-vidual quarters in comparison with 2014 is presented in the following overview:

Corporate and Other Report on Economic Position Combined Management Report 119
Corporate and Other
Corporate and Other comprises Group administration expenses for Group functions that cannot be directly allocated to the busi-ness sectors, such as Finance, Procurement, Legal, Commu-nications, and Human Resources. Corporate costs additionally
encompass expenses for central, non-allocated IT functions, including expenses related to the expansion and harmonization of IT systems within the Merck Group.
CORPORATE AND OTHERKey figures
€ million 2015 2014Change
in %
Operating result (EBIT) – 432.3 – 245.1 76.3
EBITDA – 411.0 – 226.0 81.8
EBITDA pre exceptionals – 360.1 – 166.0 116.9
Business free cash flow – 421.2 – 214.7 96.2
In 2015, administration expenses reported under Corporate and Other amounted to € 246 million (2014: € 195 million). Other operating expenses (net) rose to € – 180 million (2014: € – 42 million). This was due primarily to the develop-ment of the foreign currency result from operating activities. Whereas foreign currency gains of € 53 million were reported in 2014, a loss of € – 72 million was incurred in 2015. Taking
these effects into account, in 2015 EBIT amounted to € – 432 million (2014: € – 245 million) and EBITDA was € – 411 million (2014: € – 226 million). Adjusted for one-time effects, EBITDA pre exceptionals totaled € – 360 mil-lion (2014: € – 166 million). This had a significant impact on the development of business free cash flow, which dropped to € – 421 million in 2015 (2014: € – 215 million).