report on alternative fashion e-commerce brands on social media
TRANSCRIPT

Read time: 25 Minutes
Alternative Fashion E-Commerce Brandson Social Media
February 10th - 25th, 2016Channels in this report: Facebook, Twitter & Instagram

Brands Analyzed In This Report
*Note: Being Human Clothing has been abbreviated as BHC & Wear Your Opinion as WYO throughout this report.

Contents
The Big PictureAudience Analysis
● Total Social Media Audience● Growth in Social Media Audience● Facebook Audience Breakdown● Twitter Audience Breakdown● Instagram Audience Breakdown● Facebook Conversation
Sl. 4 Sl. 5 - 9
Content Analysis● Facebook Content Dissemination● Facebook Engagement Analysis● Twitter Content Dissemination● Twitter Engagement Analysis● Instagram Content Dissemination● Instagram Engagement Analysis
Sl. 10 - 15
Response Analysis - Facebook Sl. 16
Best Performing Content● Facebook● Instagram● Twitter
Sl. 17 - 19
Promoted (Boosted) Post Detection● Boosted Post Breakdown● Boosting Efficiency
Brandwise: Audience Geo Location & Best Performing Content
Sl. 20 - 21
Sl. 22 - 58

The Big Picture
4
1. Social Audience:a. WYO leads the competitive set in terms of total social media audience [1.7M], of which 99%
of the brand’s fans stem solely from Facebook. b. WYO also led the set in terms of new fans acquired across social media platforms [+ 83.6
K].c. Freecultr & Voxpop has witnessed a consistent loss in fans across social media channels.d. WYO is currently leading in terms of Facebook Conversation, outperforming the closest
competitor (Happily Unmarried) by nearly 70x. 2. Content:
a. WYO shares the most content among all competitors & yields the highest average interactions per post shared on Facebook.
b. BHC shares the most Tweets among all competitors & yields the highest average interactions per Tweet.
c. Quirk box shares the most content among all competitors & BHC yields the highest average interactions per post shared on Instagram.
3. Kulture Shop has responded to the most customer queries on Facebook (50%) with the lowest average response time [55 hours] among competitors in this set.
4. WYO leads in terms of best performing content shared on FB, Chumbak leads on Instagram followed by BHC. BHC leads in terms of best performing Tweets shared.
5. BHC likely boosted the most posts (4 posts; 20% of their total posts on FB), followed by Voxpop (2 posts; 17% of total posts shared).
a. Quirk box follows the most efficient boosting strategy.b. Vox pop yielded the highest share of Promoted engagements garnered from boosted posts
[68% of total engagements]c. Kulture Shop was the only brand in this set that boosted no content this reporting period.
Please note, this report contains a short section with key highlights on Promoted Post Detection (PPD). PropheSee’s PPD report contains several other metrics & breakdowns that are beyond the scope of this report.
Total Social Media Audience
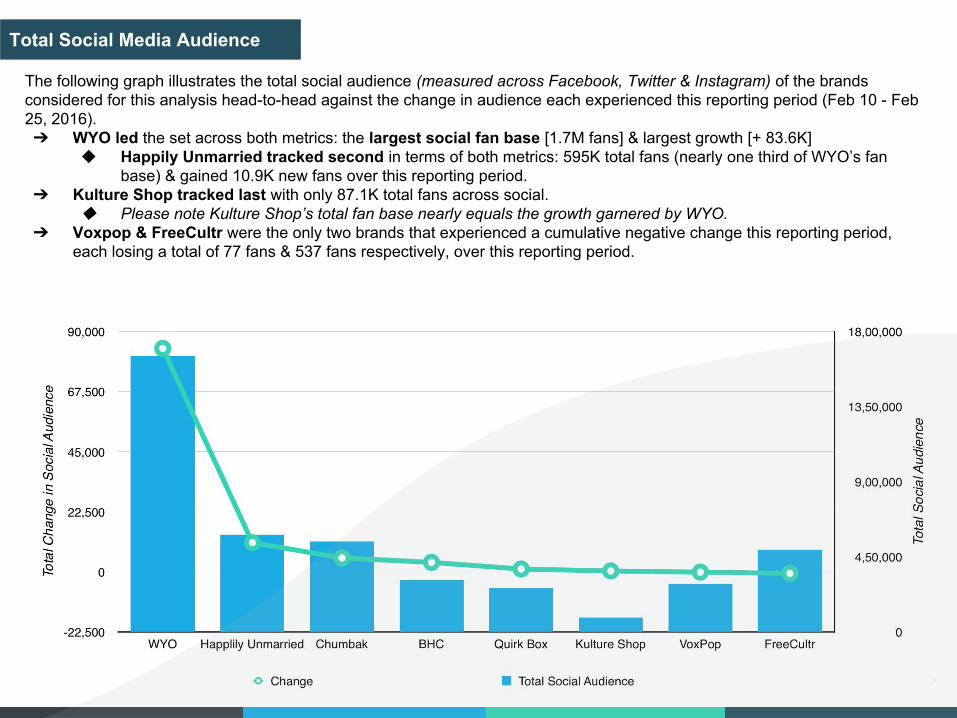
The following graph illustrates the total social audience (measured across Facebook, Twitter & Instagram) of the brands considered for this analysis head-to-head against the change in audience each experienced this reporting period (Feb 10 - Feb 25, 2016).➔ WYO led the set across both metrics: the largest social fan base [1.7M fans] & largest growth [+ 83.6K]
◆ Happily Unmarried tracked second in terms of both metrics: 595K total fans (nearly one third of WYO’s fan base) & gained 10.9K new fans over this reporting period.
➔ Kulture Shop tracked last with only 87.1K total fans across social. ◆ Please note Kulture Shop’s total fan base nearly equals the growth garnered by WYO.
➔ Voxpop & FreeCultr were the only two brands that experienced a cumulative negative change this reporting period, each losing a total of 77 fans & 537 fans respectively, over this reporting period.
5

Daily Change in Facebook Likes
The following graph illustrates the daily change in Facebook Likes of the brands considered for this analysis. ➔ WYO led the set with an average daily growth rate of + 5.7K new Likes/day, followed by Happily Unmarried with + 689
new Likes/day. ◆ WYO yielded the largest peak daily fan acquisition [Feb 19th] among competitors in this set, the day the brand
shared this post on Facebook, that garnered over 2K shares. ➔ Please note, the following three brands tracked with fan loss:
Brand Average Daily Loss Total Loss
Freecultr -27 411 Likes
Voxpop -11 196 Likes
Quirk Box -4 118 Likes
6

Daily Change in Twitter Followers
The following graph illustrates the daily change in Twitter Followers of the brands considered for this analysis. ➔ BHC led the competitive set with an average daily acquisition of 22 New Followers/day.
◆ BHC garnered peak new Followers on Feb 11th [+ 38]. The brand was running the #LoveCareShare campaign & this was the most engaging Tweet [141 engagements] shared by the brand the same day.
➔ Please note, the following three brands tracked with the largest cumulative total loss in Followers:
Please note, the Kulture Shop, Chumbak & Happily Unmarried also experienced cumulative Follower loss this reporting period with -3, -1 & -2 respectively.
Brand Total Loss
Freecultr -7
Quirk Box -7
Voxpop -5
7

Daily Change in Instagram Followers
The following graph illustrates the daily change in Instagram Followers of the brands considered for this analysis. ➔ BHC gained the most Followers over this reporting period [+ 2.7K], followed by Chumbak [+ 2.2K].
◆ BHC also garnered the largest single day Follower acquisition [+ 261] on Feb 12th, the day the brand was running the #BHSpirit campaign (see here for example).
➔ Freecultr was the only brand that experienced a daily loss in Followers (average of 12 Followers lost/day) for a total loss of 177 Followers this reporting period.
8

Facebook Conversation
The following graph illustrates the level of conversation & engagement driven by each brand’s Facebook presence. ➔ With an average daily Facebook engagement rate of 70%, WYO far outperformed any brand in this competitive set.
◆ Please note, this is despite the fact that WYO also has the largest FB audience base in this set. ➔ Among the remaining brands, only BHC & Happily Unmarried tracked with engagement rates greater than 1%: 1.56% &
1.73% respectively. ◆ All other brands tracked with engagement rates that were less than 1%.◆ Freecultr tracked with the lowest engagement rate of 0.07%.
9

Facebook Content Dissemination
The following graphs illustrate a day wise & hour wise breakdown of the content dissemination strategies followed by the brands in this report. ➔ WYO shares the most content on a weekly basis, with the least content shared on Sundays.➔ Happily Unmarried follows the most consistent content strategy with nearly the same number of posts shared daily. ➔ Kulture Shop shares no content on Sundays, likely indicating that the brand does not schedule content in advance. ➔ None of the brands Share content between 1AM - 7AM. ➔ Chumbak & WYO are the only two brands that Tweet between 12AM - 1AM. ➔ Cumulatively, Tweet density is highest at 12PM.
10

Facebook: Average Engagements per Post
The following graph illustrates the number of posts shared by brands in this set head-to-head against the average engagements garnered per post. The higher the average engagements per post, the more they resonate with a brand’s target audience. ➔ WYO shared the most posts [162] & yet yielded the highest average engagements per post shared [14.4K
engagements/post]◆ Happily Unmarried shared the second largest number of posts [55] & yielded 170 engagements/post, on average.◆ Freecultr did not share any posts this reporting period and has hence been omitted from the graph below.
11

Twitter Content Dissemination
The following graphs illustrate a day wise & hour wise breakdown of the Tweet density followed by all brands in this competitive set over this reporting period. Key Insights:➔ Maximum Tweets across all brands are shared on Thursdays, followed closely by Wednesdays. ➔ BHC & Happily Unmarried lead all competitors in terms of the number of daily Tweets shared. ➔ BHC is currently capitalizing on Tweets shared on Sundays compared to the other brands in this set. ➔ Tweet density is maximum prior to 9AM for brands in this set
◆ BHC & Happily Unmarried share the most Tweets between 5AM - 6AM. ◆ The second spike in Tweet density occurs at 12 PM. ◆ None of the brands are sharing content post 9PM, likely indicating that no brand is scheduling content in advance.
12

The following graph illustrates the number of Tweets shared by brands in this set head-to-head against the average engagements garnered per post. The higher the average engagements per Tweet, the more they resonate with a brand’s target audience. ➔ BHC garnered the highest average engagement per Tweet shared [80], followed by Happily Unmarried [6].➔ Quirkbox tracked with the lowest average engagements per Tweet [0].➔ Freecultr did not share any Tweets this reporting period and has hence been omitted from the graph below.
Twitter Average Interactions per Post
13

Instagram Content Dissemination
The following graphs illustrate a day wise & hour wise breakdown of the Instagram content shared density followed by all brands in this competitive set over this reporting period. Key Insights:➔ Quirk Box shared the most posts on Instagram [105 total posts], and leads daily content dissemination on each day
except Saturdays.◆ Happily Unmarried shared the most content on Saturdays [10].◆ Kulture Shop shares no content on Sundays, likely indicating that the brand does not schedule content in
advance.➔ Quirk Box shares maximum content between 5AM - 6AM; BHC shares the most content from 2PM - 3PM.➔ No brand is sharing content post 7PM.➔ Please note, Freecultr & Voxpop did not share any posts this reporting period.
14
Instagram: Average Engagements per Post
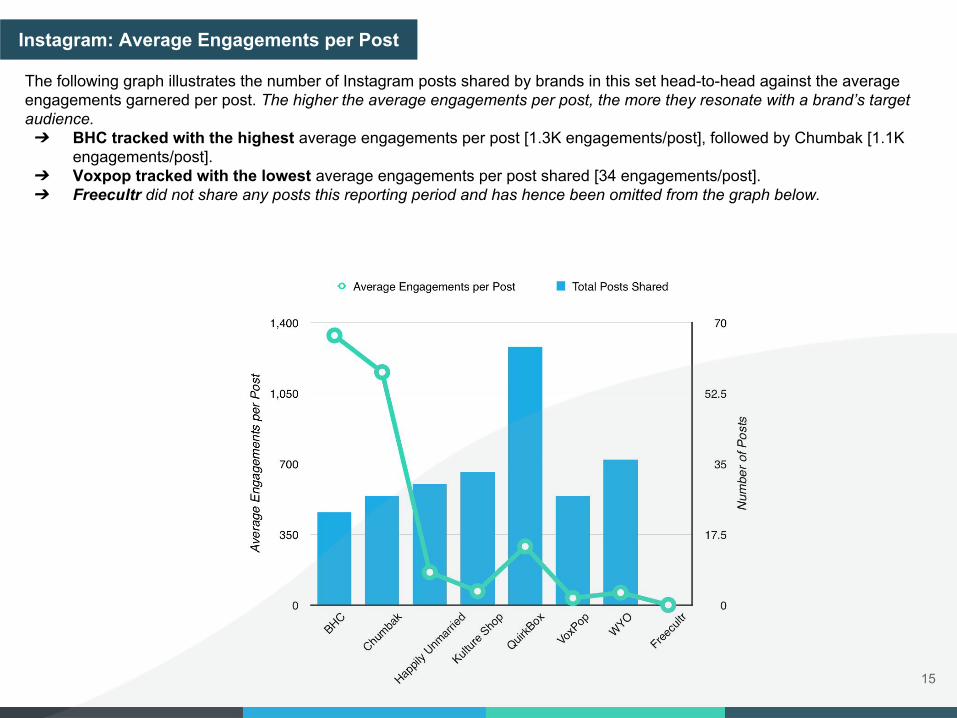
The following graph illustrates the number of Instagram posts shared by brands in this set head-to-head against the average engagements garnered per post. The higher the average engagements per post, the more they resonate with a brand’s target audience. ➔ BHC tracked with the highest average engagements per post [1.3K engagements/post], followed by Chumbak [1.1K
engagements/post].➔ Voxpop tracked with the lowest average engagements per post shared [34 engagements/post].➔ Freecultr did not share any posts this reporting period and has hence been omitted from the graph below.
15

16
➔ BHC gets most number of fan posts but they are not replying to any of their fan posts➔ Kulture Shop has best response time as well as rate within given set of competitors.➔ Chumbak has poorest response time i.e. 5 days
Response Analysis

Best Performing Content: Facebook
18/02/2016 15/02/2016 18/02/2016
The following are the most engaging posts (Top 3) shared on Facebook this reporting period. Please note, WYO shared the most engaging posts. All thumbnails are clickable to the original post.
17

Best Performing Content: Instagram
18/02/2016 19/02/2016 22/02/2016
The following are the most engaging posts (Top 3) shared on Instagram this reporting period. Please note, Chumbak shared the most engaging post, followed by Being Human. All thumbnails are clickable to the original post.
18

The following are the most engaging Tweets (Top 3) shared on Twitter this reporting period. Please note, Being Human shared the Top 3 most engaging Tweets. All thumbnails are clickable to the original post.
15/02/2016 19/02/2016 10/02/2016
Best Performing Content: Twitter
19

Promoted Post Performance (Facebook)
20
The following section predicts promoted posts shared by brands in this competitive set from 13th February - 25th February, 2016. ➔ BHC had the highest share of boosted posts [20%], followed by VoxPop [17%].➔ Despite boosting just 2 posts [17% of total], VoxPop garnered the highest Promoted engagements [68%] ➔ Kulture Shop did not boost any content in this reporting period. ➔ Quirk Box’s only Promoted post [see here] garnered 55% of their total engagements during this period indicating
that the brand is boosting posts that resonate with their audience most.

Promoted Post Performance (Facebook)
Boosting Efficiency:The number of Promoted engagements yielded per Promoted post shared. A value of:1 → implies that Promoted posts are garnering nearly the same engagement as compared to organic posts.>1 → implies that Promoted posts are better targeted and drive higher engagements than organic posts. <1 → implies that boosted posts are yielding less engagement than organic posts 21

22
Brandwise: Audience Geo Location & Best Performing Content Breakdown
- implies Promoted posts tracked using Promoted Post Detection feature on PropheSee.
*Note: All thumbnails are clickable to the original post.No posts were made from any of Freecultr’s handle during the study period. WYO did not post anything on Twitter during the study period.

23

24
India U. S. A. U.A.E. South Africa Canada Mexico United Kingdom Australia Singapore New Zealand276118 1906 1234 497 337 333 307 298 240 187

11/02/2016 10/02/2016 14/02/2016
25*Note: Promoted Post Detection feature was functional during 13th to 25th Feb, it is possible that posts made between 10th to 12th Feb were boosted yet not captured here.

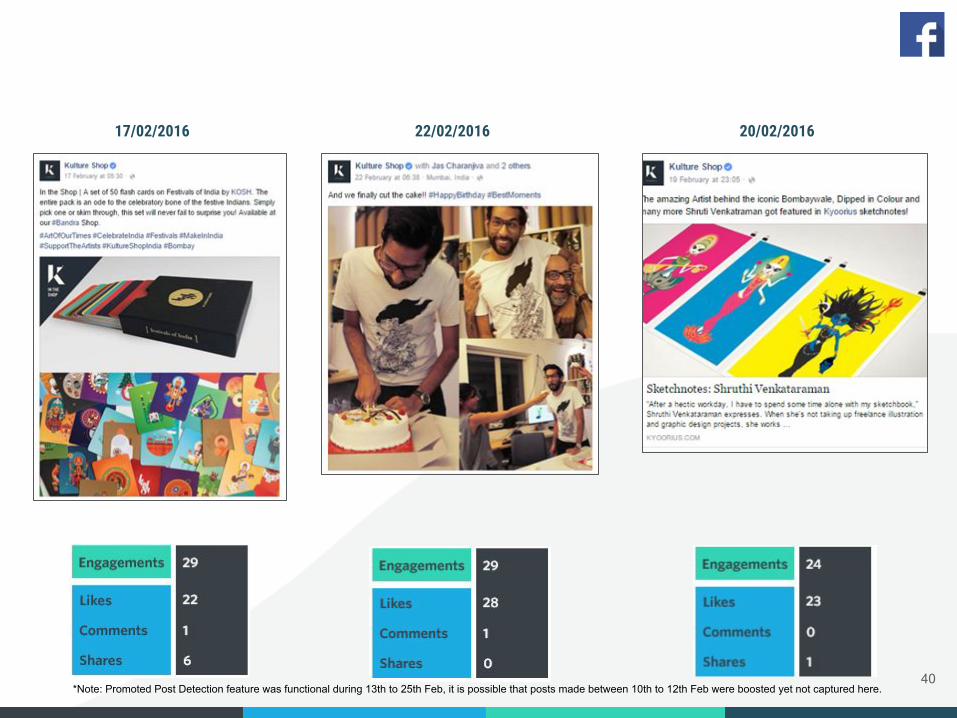
15/02/2016 22/02/2016 13/02/2016
26

13/02/2016 20/02/2016 19/02/2016
27
28

29
India U. S. A. U.A.E. Pakistan United Kingdom Canada Australia Bangladesh Egypt Singapore431285 10746 4052 3768 2201 1684 1607 1421 1273 1144

24/02/2016 18/02/2016 22/02/2016
30*Note: Promoted Post Detection feature was functional during 13th to 25th Feb, it is possible that posts made between 10th to 12th Feb were boosted yet not captured here.

10/02/2016 22/02/2016 18/02/2016
31

16/02/201618/02/2016 20/02/2016
32
33
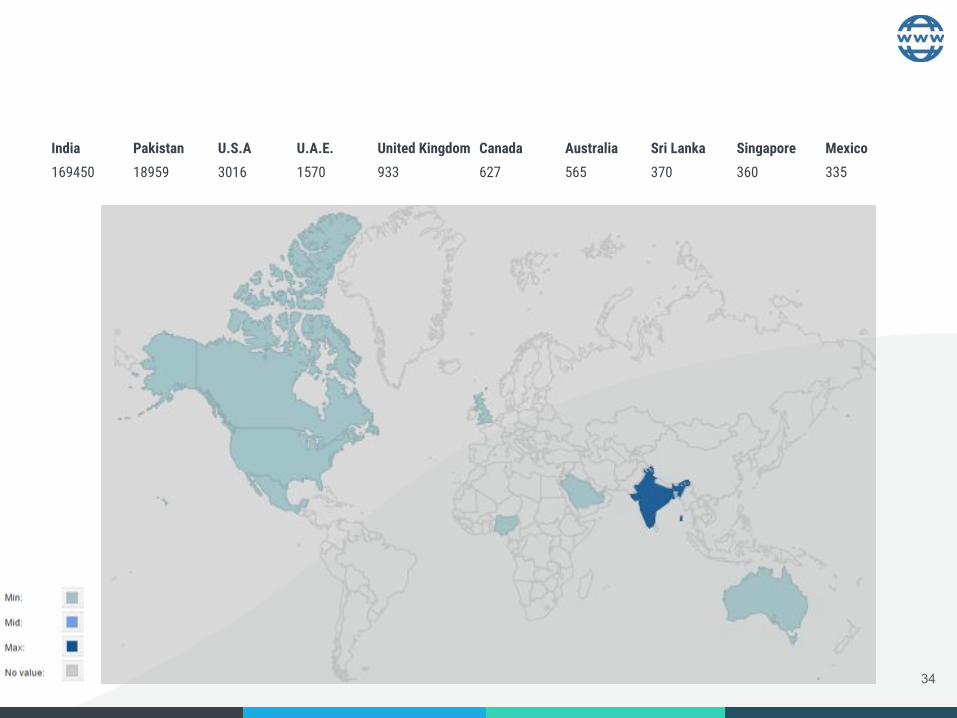
India Pakistan U.S.A U.A.E. United Kingdom Canada Australia Sri Lanka Singapore Mexico169450 18959 3016 1570 933 627 565 370 360 335
34

10/02/2016 11/02/2016 20/02/2016
35*Note: Promoted Post Detection feature was functional during 13th to 25th Feb, it is possible that posts made between 10th to 12th Feb were boosted yet not captured here.

18/02/2016 16/02/2016
36
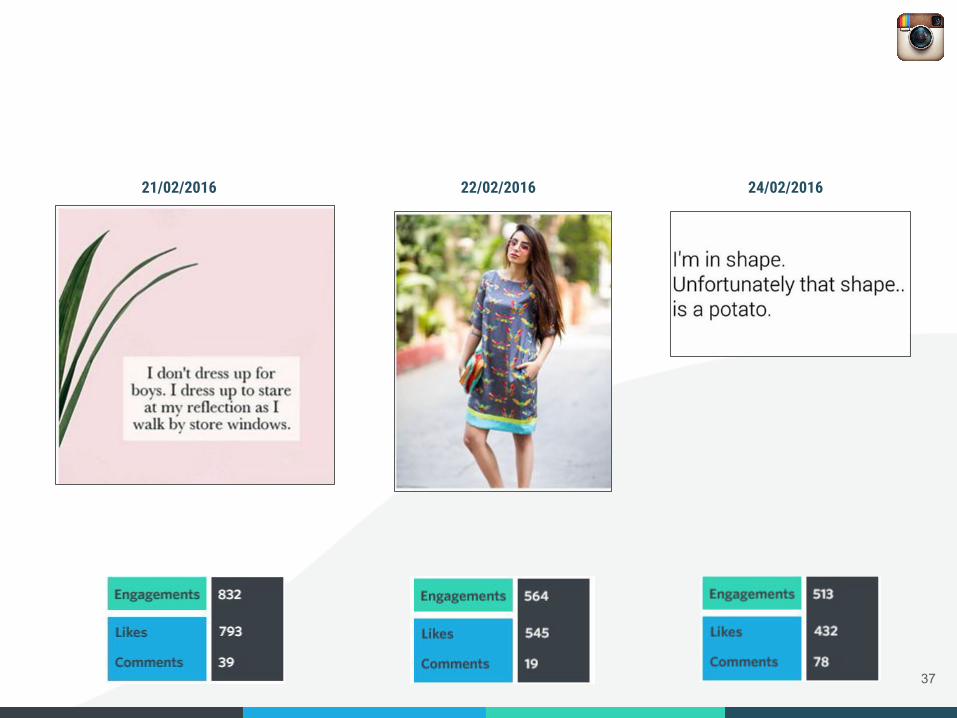
21/02/2016 22/02/2016 24/02/2016
37
38

India U. S. A. U.A.E. Sri Lanka United Kingdom Peru Canada Australia Singapore Mexico70101 957 694 493 361 272 148 139 115 98
39
17/02/2016 20/02/201622/02/2016
40*Note: Promoted Post Detection feature was functional during 13th to 25th Feb, it is possible that posts made between 10th to 12th Feb were boosted yet not captured here.
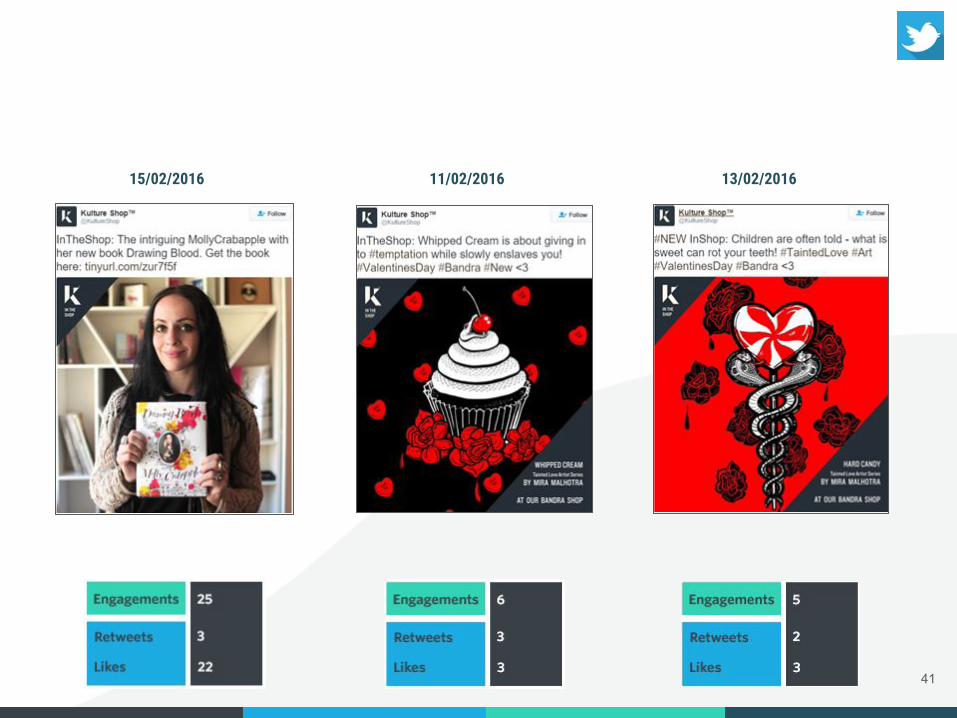
15/02/2016 11/02/2016 13/02/2016
41

22/02/2016 18/02/2016 22/02/2016
42

43
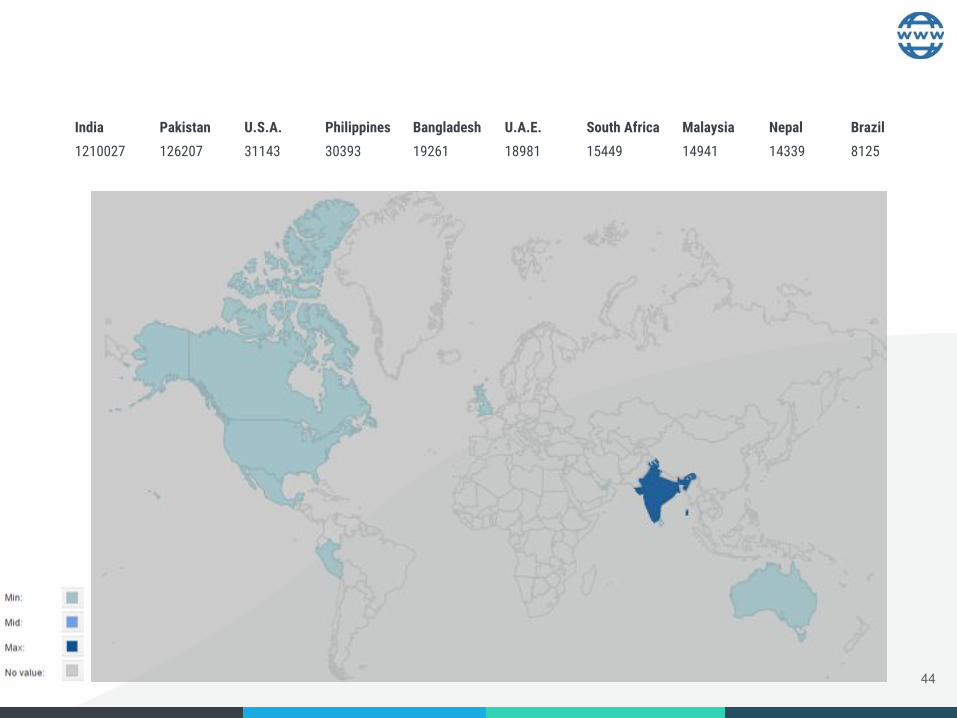
India Pakistan U.S.A. Philippines Bangladesh U.A.E. South Africa Malaysia Nepal Brazil1210027 126207 31143 30393 19261 18981 15449 14941 14339 8125
44

17/02/2016 15/02/2016 17/02/2016
45*Note: Promoted Post Detection feature was functional during 13th to 25th Feb, it is possible that posts made between 10th to 12th Feb were boosted yet not captured here.

14/02/2016 16/02/2016 20/02/2016
46

47

India Pakistan Bangladesh U.A.E. U.S.A. South Africa Nepal United Kingdom Canada Australia163780 13598 6275 2930 2271 2260 2078 1551 1007 944
48

18/02/201624/02/2016 21/02/2016
49*Note: Promoted Post Detection feature was functional during 13th to 25th Feb, it is possible that posts made between 10th to 12th Feb were boosted yet not captured here.
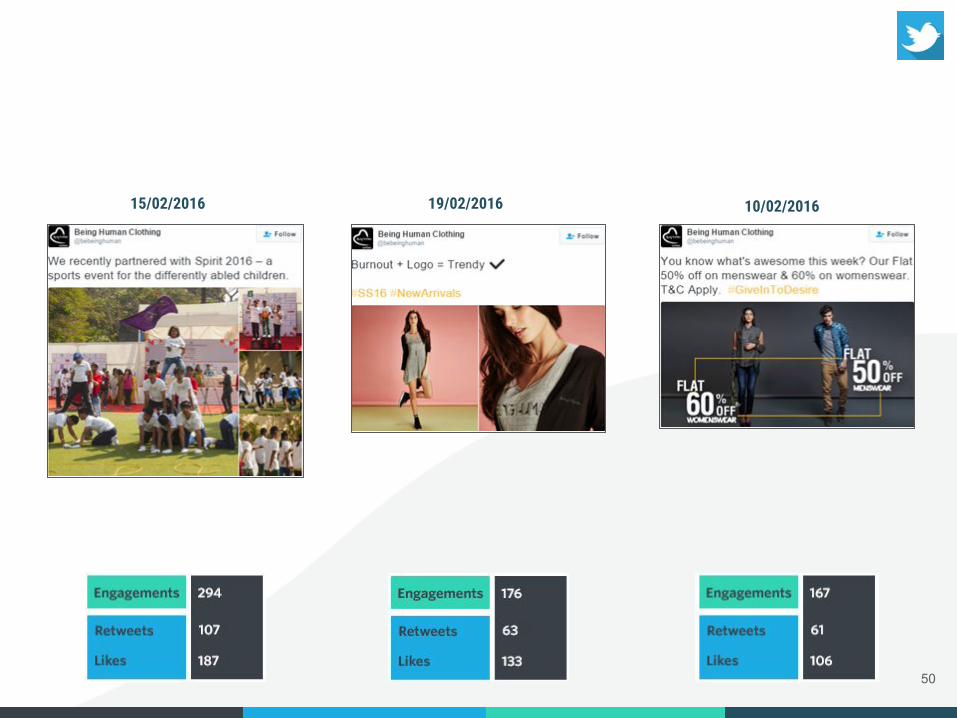
15/02/2016 19/02/2016 10/02/2016
50

19/02/2016 22/02/2016 10/02/2016
51
52

India U. S. A. U.A.E. United Kingdom Canada Australia Singapore Pakistan South Africa Germany525040 9802 5015 2356 2065 1901 999 956 922 622
53

20/02/201619/02/2016 21/02/2016
54*Note: Promoted Post Detection feature was functional during 13th to 25th Feb, it is possible that posts made between 10th to 12th Feb were boosted yet not captured here.

12/02/2016 10/02/2016 20/02/2016
55

10/02/2016 14/02/2016 14/02/2016
56

57
58
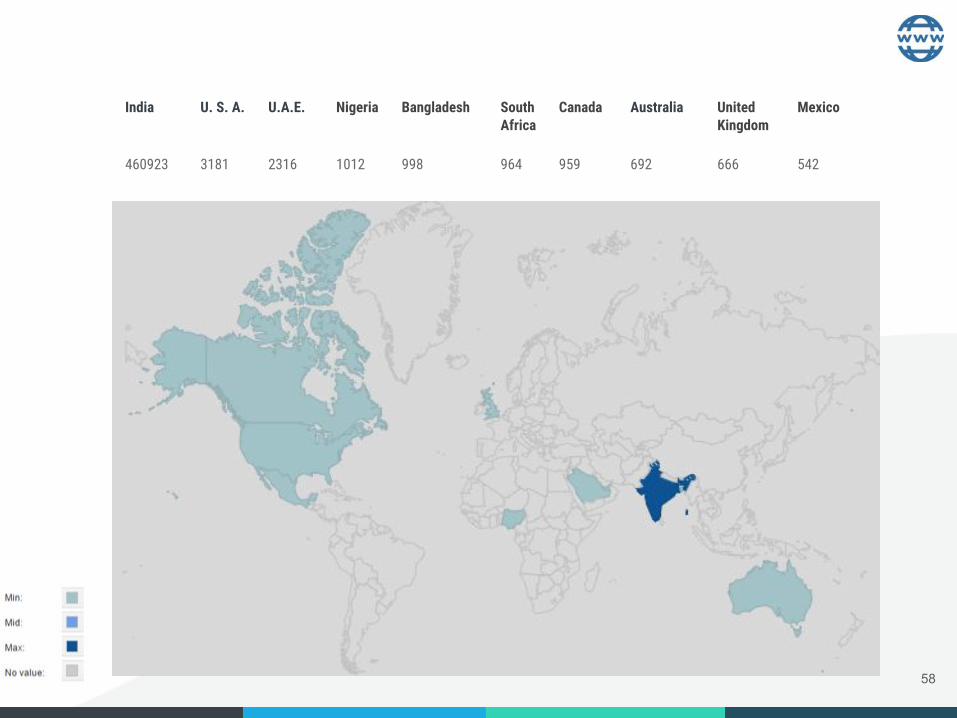
India U. S. A. U.A.E. Nigeria Bangladesh South Africa
Canada Australia United Kingdom
Mexico
460923 3181 2316 1012 998 964 959 692 666 542