report on a collaborative study for proposed 2 nd ... · haematopoietic progenitor cells into the...
TRANSCRIPT

WHO/BS/10.2133 ENGLISH ONLY
EXPERT COMMITTEE ON BIOLOGICAL STANDARDIZATION Geneva, 18 to 22 October 2010
Report on a Collaborative study for Proposed 2nd
International standard for Granulocyte colony stimulating factor (G-CSF) Meenu Wadhwa1,4, Chris Bird1, Michelle Hamill2, Alan B Heath2 & Robin Thorpe1
1 Biotherapeutics Group,
2 Biostatistics Section, NIBSC, Blanche Lane, South Mimms, Potters
Bar, Hertfordshire, EN6 3QG, UNITED KINGDOM
4Principal investigator & Corresponding author
© World Health Organization 2010
All rights reserved. Publications of the World Health Organization can be obtained from WHO Press, World Health Organization, 20 Avenue Appia, 1211 Geneva 27, Switzerland (tel.: +41 22 791 3264; fax: +41 22 791 4857; e-mail: [email protected]). Requests for permission to reproduce or translate WHO publications – whether for sale or for noncommercial distribution – should be addressed to WHO Press, at the above address (fax: +41 22 791 4806; e-mail: [email protected]).
The designations employed and the presentation of the material in this publication do not imply the expression of any opinion whatsoever on the part of the World Health Organization concerning the legal status of any country, territory, city or area or of its authorities, or concerning the delimitation of its frontiers or boundaries. Dotted lines on maps represent approximate border lines for which there may not yet be full agreement. The mention of specific companies or of certain manufacturers’ products does not imply that they are endorsed or recommended by the World Health Organization in preference to others of a similar nature that are not mentioned. Errors and omissions excepted, the names of proprietary products are distinguished by initial capital letters. All reasonable precautions have been taken by the World Health Organization to verify the information contained in this publication. However, the published material is being distributed without warranty of any kind, either expressed or implied. The responsibility for the interpretation and use of the material lies with the reader. In no event shall the World Health Organization be liable for damages arising from its use. The named authors [or editors as appropriate] alone are responsible for the views expressed in this publication.
WHO/BS/10.2133 Page 2
Summary Five candidate preparations of human sequence recombinant granulocyte-colony stimulating factor (G-CSF) were formulated and lyophilized at NIBSC prior to evaluation in a collaborative study for their suitability to serve as a replacement international standard. The preparations were tested by 13 laboratories using in vitro bioassays. The candidate preparation 09/136 was judged suitable to serve as a replacement international standard based on the data obtained for biological activity and stability (predicted % loss per year of less than 0.01% at the recommended storage temperature of -20˚C). On the basis of the results reported here, it is proposed that the preparation coded 09/136 be accepted as the WHO 2
nd IS for human G-CSF with an assigned
value for G-CSF activity of 95,000 IU/ampoule.
Responses from study participants Responses have been obtained from eight of the 13 participants of the study. Minor comments were received relating to typographical errors or omissions in the description of methodologies (Table 3) or the names of participants (Appendix 1) and these have been corrected. All responses received were in agreement with the proposal that the preparation coded 09/136 is suitable as the WHO 2nd IS for potency determination of different G-CSF therapeutic products.
Introduction
The current WHO 1st International Standard (IS) for Granulocyte-colony stimulating factor (G-CSF) (88/502) was established by the WHO Expert Committee on Biological Standardisation in 1992 with an assigned potency value of 10,000 IU (WHO Technical Report Series, 840, 1994; Mire-Sluis et al 1995). Stocks of this IS are now extremely low and a replacement will be required by 2011. The WHO IS is primarily intended for the potency estimation of G-CSF products which are used for several indications relating to neutropenia. Such uses include decreasing the incidence of infection, reducing the duration of neutropenia e.g.‚ febrile neutropenia in patients with nonmyeloid malignancies undergoing myeloablative chemotherapy followed by marrow transplantation, for reducing the time to neutrophil recovery and the duration of fever subsequent to chemotherapy in acute myeloid leukaemia patients. In addition, G-CSF is used chronically in symptomatic patients with severe neutropenia (congenital‚ cyclic‚ or idiopathic) for reducing the incidence and duration of sequelae of neutropenia eg‚ fever‚ infections‚ oropharyngeal ulcers. Increasingly, G-CSF is being used for mobilization of haematopoietic progenitor cells into the peripheral blood for collection by leukapheresis and haematopoietic stem-cell transplantation. The WHO 1st IS for G-CSF is a non glycosylated yeast derived G-CSF mutein which was evaluated in a wide range of bioassays using primary bone marrow cells or myeloid leukaemic cell-lines. Twenty-nine laboratories participated in the previous study and a mean potency value of 10,000 IU/ampoule was assigned (Mire-Sluis et al 1995). The 1st IS has proved suitable for potency evaluation of approved G-CSF products containing either E.coli expressed non-glycosylated G-CSF or CHO cell expressed glycosylated G-CSF protein. However, the more recent availability of different G-CSF products worldwide (including several biosimilars in Europe) which are produced predominantly using E.coli as the expression system has dictated the need for a better (more relevant) reference standard. In view of this situation, it was considered necessary to evaluate in a collaborative study, several G-CSF preparations derived
WHO/BS/10.2133 Page 3
using either E.coli or CHO cell expression systems for selection of a suitable replacement for the 1st IS. The objective of the current exercise, therefore, is the potency evaluation of five candidate G-CSF preparations relative to the current WHO 1st IS in a multi-centre international collaborative study. Calibration of the proposed WHO 2nd IS is primarily based on the bioassay in use in various laboratories and relies entirely on the estimates calculated relative to the WHO 1st IS for continuity of the IU.
This project was endorsed by the WHO Expert Committee on Biological Standardisation in October 2009.
Aims of the Study The purpose of the study was to characterize a candidate WHO 2nd IS for the bioassay of human G-CSF and assign a unitage for G-CSF activity. To achieve this, the study sought
1. To assess the suitability of ampouled preparations of human granulocyte-colony stimulating
factor (G-CSF) to serve as 2nd IS for the bioassay of human G-CSF by assaying their biological activity in a range of routine, 'in-house' bioassays.
2. To assess the activity of the ampouled preparations in different bioassays in current use for these materials and to calibrate the candidate IS against the 1st IS (88/502).
Materials and Methods Five preparations of recombinant human sequence G-CSF were kindly donated to WHO (see Acknowledgement). Four preparations were expressed in E coli and one was expressed using Chinese Hamster Ovary (CHO) cells. Trial fills were conducted and the biological activity of the lyophilized G-CSF preparations compared with the bulk material in a bioassay based on G-CSF induced proliferation of a murine myeloid cell-line. This bioassay is commonly used in other laboratories for evaluation of the biological activity of G-CSF. As the trial lyophilizations of G-CSF performed appropriately in the bioassay, final lyophilization of different G-CSF preparations into ampoules was carried out at NIBSC as per the procedures used for International Biological Standards (ECBS guidelines - WHO Technical Report Series 932, 2006). Buffers, final compositions as shown in Table 1, were prepared using nonpyrogenic water and
depyrogenated glassware. Buffer solutions were filtered using sterile nonpyrogenic filters (0.22µM Stericup filter system, Millipore, USA) where appropriate. For the study, the five preparations were coded as described in Table 1. The mass content of the preparations was determined by the manufacturers. As the protein content of the ampoules cannot be verified by direct measurement of absolute mass, the content is assumed to be the theoretical mass, calculated from the dilution of the bulk material of known protein mass content, and the volume of formulated solution delivered to the ampoule. This mass value is given as “predicted
µg”.
For all five preparations, the appropriate volume was added to the buffer to give 5.0 (±1%) litres
of a solution of concentration predicted as 1µg/ml G-CSF for 08/350, 09/136, 09/150, 09/158, 09/160. For these coded preparations, the G-CSF was distributed in 1.0ml aliquots, giving the

WHO/BS/10.2133 Page 4 theoretical protein content per ampoule shown in Table 1. The current standard (88/502) was
previously prepared using a 2.0 litres (±1%) solution containing 0.2µg/ml G-CSF; the solution was distributed in 0.5ml aliquots per ampoule giving a theoretical protein content of 100 ng per ampoule (Table 1). For each fill, a percentage of ampoules were weighed. The mean fill weights are shown in Table 2. Each solution was lyophilized, and the ampoules were sealed under dry nitrogen by heat fusion of the glass and stored at –20°C in the dark. Residual moisture of each preparation, measured by the coulometric Karl-Fischer method (Mitsubishi CA100), is shown in Table 2. Headspace oxygen content was determined by frequency modulated spectroscopy using the Lighthouse FMS-760 Instrument (Lighthouse Instruments, LLC). Testing for microbial contamination using Total viable count method did not show any evidence of microbial contamination.
Participants Samples were despatched in September 2009 to 15 laboratories in 10 different countries. The participants comprised 2 control laboratories, 11 manufacturers’ laboratories and 2 regulators; 13 participants submitted data and are listed in Appendix 1.
Assay Methods and Study Design Participants were asked to assay all samples including the current IS (88/502) concurrently on a minimum of three separate occasions using their own routine bioassay methods within a specified layout which allocated the samples across 5 plates and allowed testing of replicates as per the study protocol (Appendix 2). It was requested that participants perform eight dilutions of each preparation using freshly reconstituted ampoules for each assay. Where available they were asked to include their own in-house reference material. A summary of the assay methods used in the study is given in Table 3. Participating laboratories were sent five sets of six study samples coded A-F along with the current IS (88/502) and a sample of an excipient, coded N as detailed in Table 1. Samples B and F were coded duplicate samples of the same material (candidate replacement standard 09/136). Participants were requested to return their raw assay data, using spreadsheet templates provided, and also their own calculations of potency of the study samples relative to the current IS.
Statistical Analysis
The potencies of the study samples were calculated relative to the current IS (88/502) by analysis of the raw assay data at NIBSC. The assays were analysed using a weighted logistic parallel line model, using the full dose-response curve (using an in house program, WRANL (Gaines Das and Tydeman, 1982)). In some instances, the assays were analysed using a simple parallel-line model based on a linear portion of the dose response curve (Finney 1978). Potencies within laboratories were combined using geometric means, and intra-laboratory variability was expressed as geometric coefficients of variation (%GCV) (Kirkwood 1979). Overall potencies were calculated as geometric means of the individual laboratory means, and inter-laboratory variability was expressed as %GCVs between laboratory means. A Duncan’s multiple range test (Duncan 1975) was used to investigate any potential outlying laboratory

WHO/BS/10.2133 Page 5
results. Confidence intervals for the overall geometric means were calculated assuming that the log laboratory mean potency estimates followed a normal distribution. The agreement between duplicate samples was assessed by calculating the difference in log potency estimates (relative to 88/502) of samples B and F for each assay, calculating the mean of the squared difference for each laboratory, taking the square root to give a root mean square (RMS) value, and expressing this as an average percentage difference.
Stability Studies
Accelerated Degradation Studies
Samples of the candidate standard 09/136 (study samples B & F) were stored at elevated temperatures (20˚C, 37˚C and 45˚C) for 7 to 8 months and assayed at NIBSC using the GNFS-60 bioassay. Samples were tested concurrently with those stored at the recommended storage temperature of -20˚C, and baseline samples stored at -70˚C. For each material, 4 assays were performed and each assay replicated across 4 plates. The potencies of all samples were expressed relative to the appropriate -70˚C baseline samples.
Stability after Reconstitution Samples of the candidate standard 09/136 were reconstituted and left at 4˚C and 20˚C for periods of 4 hours, 24 hours, 1 week and 2 weeks. The reconstitutions were timed to allow all samples to be assayed concurrently. Three independent assays were performed (on samples that had been reconstituted from three separate ampoules), with each sample replicated across 2 plates within each assay.
Stability on Freeze-Thaw
Samples of the candidate standard 09/136 were reconstituted and subjected to a series of freeze-thaw cycles (1 up to 4). They were then assayed concurrently with a freshly reconstituted ampoule. Three independent assays were performed (on samples that had been reconstituted from three separate ampoules), with each sample replicated across 2 plates within each assay.
Results
Data Received
Results were received from 13 laboratories. Participating laboratories have been assigned code numbers allocated at random, and not necessarily representing the order of listing in Appendix 1 to retain confidentiality in the report. Laboratory 3 returned two sets of assays from two different methods, which have been analysed separately as if from different laboratories, and are referred to as laboratories 3A and 3B. Details of the assay methods used by the individual laboratories are given in Table 3. The majority of laboratories returned data from three assays as requested. Laboratory 1 returned data from five assays. Laboratories 5 and 9 returned data from four assays. For laboratory 5, one

WHO/BS/10.2133 Page 6 plate was excluded from the first assay due to an apparent problem with the responses for the current IS, indicated by the laboratory. For laboratory 7, analysis was restricted to the top three doses for all samples, as lower doses were giving responses close to the background. As a result, analysis was performed using a simple parallel-line approach on the log transformed responses. The assays from laboratory 8 only covered a narrow dilution range (approximately 2-fold in total) and for two assays (Assays 1 and 3) there was no dose-response. These two assays were excluded from subsequent analysis. The results for laboratory 8 are therefore based on a single assay. For laboratory 14 the data from the third assay appeared highly variable compared to the data from the first two assays, and the estimated potencies were more variable than in the other two assays. This assay was excluded from subsequent analysis. For the other two assays, analysis was restricted to three doses in the linear portion of the log transformed dose response curve, using a simple parallel-line approach. This reduced the variability in potency estimates between plates and assays, and matched the approach taken by laboratory 14 when calculating their own potency estimates. For all other laboratories, all assays were included. In some cases however, individual data points or dose levels were removed at the extremes of the dose-response curves, to improve the fit of the parallel line model.
Excipient sample N
In all assays for all laboratories, the excipient (sample N) did not give any dose response.
Potencies of samples A-F relative to 88/502
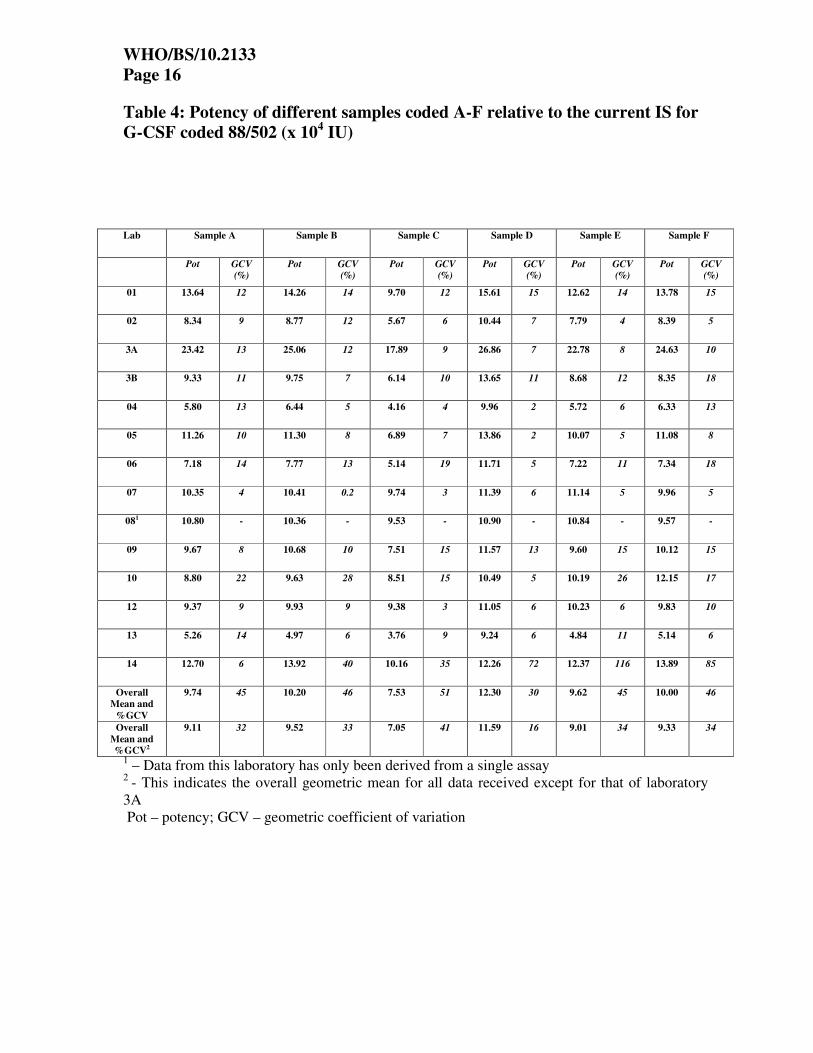
The laboratory geometric mean potencies for samples A – F relative to the current IS (88/502-assigned unitage of 104 IU/ml) are shown in Table 4, along with the intra-laboratory %GCV. The laboratory mean potency estimates are also shown in histogram form in Figures 1a – 6a. Each box represents a laboratory geometric mean estimate, and the boxes are labelled with the laboratory code.
The intra-laboratory variability, as measured by the within-laboratory %GCV differs between laboratories, ranging from below 5% to around 30%. Laboratory 14 had particularly variable results, with %GCVs ranging from 5% to 116% for different samples (based on the results of only two assays, the third having been excluded due to even higher intra-laboratory variability). From Table 4 and Figures 1a – 6a, it is clear that the potency estimates from laboratory 3A for samples A-F relative to 88/502 are substantially higher than those from other laboratories (around 2 to 2.5-fold higher than the overall mean). The results provided by laboratory 3 indicated that for the assay method 3A, 88/502 was giving low responses relative to their in-house standard, whereas for assay method 3B, the responses were comparable. The overall geometric mean potency estimates are also shown in Table 4, along with the inter-laboratory (between-laboratory) %GCVs for each sample. These are also shown excluding the results from laboratory 3A. When 3A is excluded the %GCV between laboratories is around 30% - 40%, although for sample D it is lower at 16%.

WHO/BS/10.2133 Page 7
The results from laboratory 3A were significantly higher than the other laboratories for all samples, relative to the within-laboratory variation (Duncan’s test). For sample B, the results from laboratory 13 were significantly lower than other laboratories, but sample F (a duplicate of sample B) was not significantly lower. Apart from these, no other laboratories were found to be significantly different from the rest of the laboratories. Apart from the results from laboratory 3A, there did not appear to be any significant differences between assay methods. The overall mean potencies of samples A, B, E and F relative to 88/502 were all around 9 to 9.5 x 10⁴ IU/ml. Sample D had a slightly higher potency (11.6 x 10⁴ IU/ml). Sample C had a lower overall mean potency of around 7 x 10⁴ IU/ml. The overall geometric means (excluding laboratory 3A), along with 95% confidence intervals, are shown in Table 5.
Potencies of samples A-F relative to sample B
The potencies of the study samples A, C, D, E and F were also calculated relative to sample B, using the overall geometric mean potency for B of 9.52 x 10⁴ IU/ml (Table 4, excluding 3A) as an assigned unitage. The laboratory geometric mean potencies are shown in Table 6 along with the within-laboratory %GCVs. They are also shown in histogram form in figures 1b-6b. It is clear from the table and figures that the agreement between laboratories for the majority of the study samples is greatly improved when using sample B as a candidate standard compared with 88/502. The results from laboratory 3A are now in line with those of other laboratories. The between laboratory %GCVs for samples A, E and F are below 10%. As sample F is a duplicate of sample B, the %GCV of around 9% represents the “best case” agreement that can be expected from these assay types. For the low potency sample C, the %GCV is a little higher at 17%, but this still represents an improvement compared to using the current IS 88/502. For sample D, the %GCV is 22%, slightly higher than when using 88/502, which gave a %GCV of 17%. The overall mean potencies of samples A, C, D, E and F relative to sample B were very close to those calculated relative to 88/502, as expected. The overall geometric means, along with 95% confidence intervals, are shown in Table 7. Because of the improved agreement between laboratories, the confidence intervals are narrower for all samples except D.
Agreement between duplicates
Samples B and F were coded duplicates of the same material. The overall potency estimates relative to 88/502 were in very close agreement (9.52 and 9.33 x 10⁴ IU/ml). There is also good agreement between the laboratory mean estimates of samples B and F (Table 4) for most laboratories. The agreement between the potency estimates of B and F within assays can be assessed in two ways. Firstly, the intra-laboratory %GCV for the potencies of sample F relative to sample B, shown in Table 6, represents the variability between assays of direct comparisons of F to B. They range from 1.3% (laboratory 13), representing excellent agreement between assays, to 31.8% (laboratory 14, based on two assays only), which represents a high level of variability, which has already been noted for this laboratory. All other laboratories had % GCVs less than 20%. Secondly, as described in the statistical methods section, the average differences in potency estimates of sample B and F were calculated (root mean square difference in log potency) for

WHO/BS/10.2133 Page 8 each laboratory, and these differences, expressed as a percentage, are shown in Table 8. These range from 3.4% (laboratory 3A) to 28% (laboratory 10). Where these figures are higher than the %GCVs, as for laboratory 10, this suggests a consistent bias in estimates, possibly arising from the assay layout. For laboratory 10, for example, the laboratory mean estimates for samples B and F were 9.63 and 12.15 x 10⁴ IU/ml respectively.
Stability Studies
Accelerated Degradation Studies
Geometric mean potency estimates of the samples of B (coded 09/136) stored at different temperatures (expressed as a percentage of the -70˚C sample) are shown in Table 9. There is very little observed degradation, with the mean potency of the samples stored at 45˚C being 87% relative to the -70˚C samples after more than 6 months storage. The usual Arrhenius model for accelerated degradation was applied (Kirkwood and Tydeman, 1984) to obtain a predicted % loss per year or per month at the different temperatures. For the candidate standard 09/136, the predicted % losses are shown in Table 10. The material appears very stable, with a predicted % loss per year of less than 0.01% at the recommended storage temperature of -20˚C. The predicted loss at +37˚C is 0.25% per month. These figures indicate that the material is stable for long term storage at -20˚C, and for limited excursions at higher temperature during transportation. It is sufficiently stable to serve as an International Standard.
Stability after Reconstitution The potencies of the reconstituted ampoules of Sample B (coded 09/136) are shown in Table 11 (expressed as a percentage of the freshly reconstituted ampoule), along with the %GCV between individual assay estimates. The potency of 09/136 is not diminished after 1 week at either 4˚C or 20˚C. The results after 2 weeks are a little more variable, but there is still very little loss, with an observed potency of 97% of freshly reconstituted ampoule for the candidate standard 09/136 after 2 weeks at +20˚C. This is within the limits of assay variability.
Stability on Freeze-Thaw
The potencies of the reconstituted ampoules are shown in Table 12 (expressed as a percentage of the freshly reconstituted ampoule), along with the %GCV between individual assay estimates. From the tables, it is clear that the potency of sample B (coded 09/136) does not decrease with an increasing number of freeze-thaw cycles (the observed potencies after 4 cycles are marginally higher than after 1 cycle). It is possible that there is a slight loss of potency after a single freeze-thaw, but repeated cycles do not appear to have any further impact, and the observed reduction after a single freeze-thaw is within the limits of assay variability.
Discussion
From results derived from this study, it is evident that apart from laboratory 3A which used the luciferase reporter gene assay, no significant differences were apparent between assay methods. Results from Laboratory 3A are significantly (2-2.5 fold) higher than the other laboratories for all samples relative to 88/502. In the 3A assay, 88/502 provided low responses relative to their

WHO/BS/10.2133 Page 9
in-house standard, whereas comparable responses were observed for assay method 3B. The reason for discrepancies in results from two different assays conducted in the same laboratory is not known. From Table 4 and the data illustrated in Figures 1a - 6a, the assays from a majority of laboratories (except Laboratory 3A) showed very similar results for potencies of samples A-F relative to 88/502 despite a moderate level of variability. Most laboratories performed an assay based on G-CSF-induced proliferation of the NFS-60 cell-line or its variants but employed different readouts using either a radioactive label (3H-thymidine) or colorimetric/fluorescence dye for detection. Using these assays, for samples A-F relative to 88/502, the potencies were predominantly clustered just below the expected activity of 10 (all contain 10 times more G-CSF than the 1st IS 88/502) except for sample C which was approximately 30% lower in potency. This result was, however, not unexpected as preparation C had been stored for approximately 18 months at 4oC (beyond the expected shelf-life) and had previously shown loss of biological activity. This preparation was purposely included in the study to assess if assays were robust and capable of detecting a low potency preparation. It is clear from the data that a majority of laboratories identified this sample as the lowest in activity. In general, there was good agreement between the results from most laboratories but laboratories 13 and 4 showed slightly lower potencies for all samples except for sample D. The reason for the lower potencies is not clear as these laboratories employed the same cell-line, assay readout and assay duration as that of laboratory 12 which produced comparable results to those from other laboratories (Table 3). A possible explanation for the reduced biological activity of all E.coli expressed preparations in assays from laboratories 4 and 13 is the inhibitory effect of serum on G-CSF activity. It is recognised that the biological activity of non-glycosylated G-CSF as opposed to glycosylated G-CSF is significantly compromised following exposure to serum over several hours (Carter et al 2004a, b). In these assays, foetal bovine serum is a critical reagent and care needs to be taken in the screening and selection of foetal bovine serum which is used for maintaining the cells and for the cell-based bioassay. The influence of serum on biological activity of G-CSF may also be responsible for the moderate variability in potency seen in most assays with samples A, B, C, E or F containing non-glycosylated G-CSF when compared with 88/502 (Table 4). In contrast, using sample B as a standard for comparison purposes, the variability in potency estimates of samples A, C, E and F is markedly reduced and there is significant improvement in inter-laboratory agreement with agreement also observed with data from laboratory 3A while sample D is relatively unaffected (Table 6). This reduction in variability when using B as a comparator is not unexpected as sample B has the same molecular species and structural entity as samples A, C, E and F. Data derived from coded duplicates, samples B and F were also highly consistent. The overall potency estimates relative to 88/502 were in very close agreement (9.52 and 9.33 x 10⁴ IU/ml). There is also good agreement between the laboratory mean estimates of samples B and F (Table 4) for most laboratories. Stability studies indicated that sample B (code 09/136) is stable for long term storage at -20˚C and the potency is not diminished after 1 week of storage at either 4˚C or 20˚C following reconstitution or after repeated freeze-thaw cycles.

WHO/BS/10.2133 Page 10 These results clearly indicate that sample B (code 09/136) can be used as a replacement standard for 88/502 with an assigned value for G-CSF activity of 95,000IU/ampoule; this value is in continuity with the value assigned to the 1st IS.
Conclusions and Proposal Based on the results of this study, it is clear that the G-CSF candidate (sample B, coded 09/136) is suitable to serve as the WHO 2nd IS for G-CSF for assessing potency of current G-CSF therapeutic products (including both E. coli and CHO cell expressed). There are 4,500 ampoules of this standard available from NIBSC. It is proposed that the candidate preparation 09/136 be accepted as the WHO 2nd IS for G-CSF with an assigned value for G-CSF activity of 95,000IU/ampoule.
References 1st International standard for Granulocyte colony stimulating factor (G-CSF) BS/92.1711 WHO Technical Report Series, 840, 10 Mire-Sluis AR, Das RG, Thorpe R (1995) The international standard for granulocyte colony stimulating factor (G-CSF) Evaluation in an international collaborative study. Participants of the Collaborative Study. J Immunol Methods. 179(1),117-26. Gaines Das, R.E. and Tydeman, M.S. (1982) Iterative weighted regression analysis of logit responses: A computer program for analysis of bioassays and immunoassays. Comput. Programs Biomed. 15, 13 - 22 Finney DJ (1978) Statistical methods in biological assay. 3rd edition Charles Griffin. London. Kirkwood TBL (1979) Geometric means and measures of dispersion. Biometrics 35, 908-9 Duncan DB (1975) T-tests and intervals for comparisons suggested by the data. Biometrics 31, 339-359 Kirkwood TBL & Tydeman MS (1984) Design and analysis of accelerated degradation tests for the stability of biological standards II. A flexible computer program for data analysis. J Biol Standardisation 12; 207-14. Carter CR, Whitmore KM, Thorpe R (2004a) The significance of carbohydrates on G-CSF: differential sensitivity of G-CSFs to human neutrophil elastase degradation. J Leukoc Biol. 75(3),515-22. Carter CR, Keeble JR, Thorpe R (2004b) Human serum inactivates non-glycosylated but not glycosylated granulocyte colony stimulating factor by a protease dependent mechanism: significance of carbohydrates on the glycosylated molecule. Biologicals. 32(1), 37-47.

WHO/BS/10.2133 Page 11
Acknowledgements We are very grateful to the manufacturers (Sandoz, Austria, Chugai Pharmaceutical Co. Ltd, Japan, Amgen USA, Serum Institute of India, India, Biogenerix, Germany) for the supply of candidate materials and to the participating laboratories for performing the laboratory tests. We are grateful to Paul Matejtschuk and Kiran Malik for helpful discussions and assistance with pilot fills of G-CSF preparations and staff of SPD for lyophilizing and despatching the candidate materials of the study.

WHO/BS/10.2133 Page 12
List of Appendices
Appendix 1 – List of participants Appendix 2 – Protocol for Collaborative Study for 2nd IS for human G-CSF
Appendix 3 – Draft Instructions for Use for the proposed WHO 2nd IS for G-CSF

WHO/BS/10.2133 Page 13
Table 1: Materials used in study
Ampoule Contents
Ampoule
Code
Study Code
No Of
Ampoules in Stock
G-CSF (Predicted Mass
- µµµµg)
Expression
System
Excipients*
Reconstitution
Volume
Custodian and
storage
08/350
A 4,000~ 1 E.coli
09/136
B, F 4,500~ 1 E.coli
09/150
C 4,500~ 1 E.coli
09/158
D 4,500~ 1 CHO
09/160
E 4,500~ 1 E.coli
Excipient N 100~ 0 N/A
Trehalose Tween -20 Phenylalanine Arginine Human Serum Albumin
1 ml distilled water
88/502
Current
IS
300~
0.1
Yeast
Trehalose Human Serum Albumin Saline, pH7.2
0.5 ml distilled
water
NIBSC, Potters Bar, HERTS, UK
Stored at -20oC
* Details of the concentrations of the excipients in the formulation are provided in the Draft Instructions for use (Appendix 3).

WHO/BS/10.2133 Page 14
Table 2 – Mean fill weights and residual moisture content of candidate preparations
Ampoule Code
Study Code
Mean Fill weight (g)
Coefficient of
Variation Fill weight
%
Mean Residual Moisture
%
Coefficient of
Variation Residual Moisture
%
Mean Headspace
Oxygen %
Coefficient of Variation Headspace
Oxygen %
08/350 A 1.0076 (258) 0.180 0.172 (12) 11.28 0.24 (12) 34.63
09/136 B, F 1.0077 (231) 0.168 0.205 (12) 31.48 0.17 (12) 48.64 09/150 C 1.0012 (195) 0.150 0.092 (12) 30.12 0.27 (12) 32.88
09/158 D 1.0070 (183) 0.145 0.181 (12) 34.09 0.23 (12) 53.41
09/160 E 1.0086 (196) 0.216 0.172 (12) 21.45 0.17 (12) 52.44
The numbers in parentheses indicate the number of determinations Residual moisture of each preparation was measured by the coulometric Karl-Fischer method (Mitsubishi CA100). Headspace oxygen content was determined by frequency modulated spectroscopy (Lighthouse FMS-760).

WHO/BS/10.2133 Page 15
Table 3: Individual Laboratory Codes and Assays used by Study Participants
In some labs, the NFS-60 and MNFS-60 cell-lines have been adapted to grow in cell culture medium containing G-CSF e.g., lab 1
Laboratory Code Cell Line Assay Type Assay Duration (hrs) Read-out
1 MNFS-60 Proliferation (ATP) 33 Luminescence
2 GNFS-60 Proliferation 28 Alamar Blue
3A 32DCK39 Reporter-gene (luciferase) 4.5 Luminescence
3B 32D Proliferation 66 3H Thymidine
4 NFS-60 Proliferation 53 MTT
5 NFS-60 Proliferation 48 Alamar Blue 6 MNFS-60 Proliferation 48 MTS
7 MNFS-60 Proliferation 53 MTT 8 GNFS-60 Proliferation 28 Alamar Blue
9 GNFS-60 Proliferation 48 3H Thymidine
10 NFS-60 Proliferation 24 3H Thymidine
12 NFS-60 Proliferation 52 MTT
13 NFS-60 Proliferation 54 MTT 14 NFS-60 Proliferation 50 MTS
WHO/BS/10.2133 Page 16
Table 4: Potency of different samples coded A-F relative to the current IS for G-CSF coded 88/502 (x 104 IU)
1 – Data from this laboratory has only been derived from a single assay 2 - This indicates the overall geometric mean for all data received except for that of laboratory 3A Pot – potency; GCV – geometric coefficient of variation
Lab Sample A Sample B Sample C Sample D Sample E Sample F
Pot GCV (%)
Pot GCV (%)
Pot GCV (%)
Pot GCV (%)
Pot GCV (%)
Pot GCV (%)
01 13.64 12 14.26 14 9.70 12 15.61 15 12.62 14 13.78 15
02 8.34 9 8.77 12 5.67 6 10.44 7 7.79 4 8.39 5
3A 23.42 13 25.06 12 17.89 9 26.86 7 22.78 8 24.63 10
3B 9.33 11 9.75 7 6.14 10 13.65 11 8.68 12 8.35 18
04 5.80 13 6.44 5 4.16 4 9.96 2 5.72 6 6.33 13
05 11.26 10 11.30 8 6.89 7 13.86 2 10.07 5 11.08 8
06 7.18 14 7.77 13 5.14 19 11.71 5 7.22 11 7.34 18
07 10.35 4 10.41 0.2 9.74 3 11.39 6 11.14 5 9.96 5
081 10.80 - 10.36 - 9.53 - 10.90 - 10.84 - 9.57 -
09 9.67 8 10.68 10 7.51 15 11.57 13 9.60 15 10.12 15
10 8.80 22 9.63 28 8.51 15 10.49 5 10.19 26 12.15 17
12 9.37 9 9.93 9 9.38 3 11.05 6 10.23 6 9.83 10
13 5.26 14 4.97 6 3.76 9 9.24 6 4.84 11 5.14 6
14 12.70 6 13.92 40 10.16 35 12.26 72 12.37 116 13.89 85
Overall Mean and
%GCV
9.74 45 10.20 46 7.53 51 12.30 30 9.62 45 10.00 46
Overall Mean and %GCV2
9.11 32 9.52 33 7.05 41 11.59 16 9.01 34 9.33 34

WHO/BS/10.2133 Page 17
Table 5: Geometric Means and 95% Confidence Intervals for all Samples relative to 88/502
Sample Geometric Mean*
95% Confidence Interval
A 9.11 7.69 – 10.78
B 9.52 8.00 – 11.32
C 7.05 5.74 – 8.66
D 11.59 10.61 – 12.65
E 9.01 7.56 – 10.73
F 9.33 7.83 – 11.12
Geometric Mean* - This indicates the overall geometric mean for all data received except for that of laboratory3A

WHO/BS/10.2133 Page 18
Table 6: Potency of different samples coded A-F relative to Sample B coded 09/136
Sample A Sample C Sample D Sample E Sample F Lab
Pot %GCV Pot %GCV Pot %GCV Pot %GCV Pot %GCV
01 9.10 5 6.47 11 10.42 11 8.43 9 9.20 11
02 9.05 4 6.15 9 11.33 6 8.45 8 9.11 7
3A 8.90 5 6.80 2 10.21 5 8.65 4 9.36 4
3B 9.12 5 6.00 5 13.33 4 8.48 5 8.16 11
04 8.58 16 6.15 1 14.73 8 8.46 0.2 9.36 19
05 9.48 5 5.80 6 11.68 9 8.48 6 9.33 11
06 8.79 9 6.29 11 14.34 12 8.85 3 8.99 7
07 9.46 4 8.91 4 10.42 6 10.19 5 9.11 5
08 9.93 . 8.76 . 10.02 . 9.96 . 8.80 .
09 8.61 2 6.70 10 10.31 12 8.55 11 9.02 14
10 8.70 6 8.41 13 10.37 22 10.08 2 12.01 11
12 8.98 1 8.99 6 10.59 8 9.81 5 9.42 5
13 10.07 8 7.20 13 17.70 3 9.27 5 9.85 1
14 8.69 33 6.95 4 8.39 22 8.46 54 9.50 32
Overall Mean and %GCV
9.09 5 7.03 17 11.49 22 8.98 8 9.34 9

WHO/BS/10.2133 Page 19
Table 7: Geometric Means and 95% Confidence Intervals for all samples relative to Sample B coded 09/136
Sample Mean 95% Confidence Interval
A 9.09 8.83 – 9.36
C 7.03 6.42 – 7.69
D 11.49 10.26 – 12.86
E 8.98 8.60 – 9.38
F 9.34 8.90 – 9.81

WHO/BS/10.2133 Page 20
Table 8: Averages differences between Samples B and F within each lab
Laboratory Code
Average % difference
between B and F
01 10.8
02 7.3
3A 3.4
3B 19.3
04 15.1
05 9.8
06 8.1
07 6.3
08 8.2
09 13.7
10 28.0
12 4.4
13 3.7
14 21.6

WHO/BS/10.2133 Page 21
Table 9: Geometric mean potency of Sample B (09/136) after storage for approximately 8 months
(% Relative to sample stored at -70˚C)
Temperature 09/136
-20˚C 93.7
+20˚C 97.9
+37˚C 86.5
+45˚C 87.4
Table 10: Predicted % loss per year and month at different temperatures for Sample B (09/136)
Temperature % loss per month % loss per year
-20˚C - < 0.01
+4˚C < 0.01 0.10
+20˚C 0.05 0.58
+37˚C 0.25 3.01
Table 11: Geometric mean potencies (and %GCV) of samples stored after reconstitution
(% of freshly reconstituted ampoule)
Sample Temp 4 hours 24 hours 1 week 2 weeks
Mean %GCV Mean %GCV Mean %GCV Mean %GCV
B (09/136) 4˚C 103.1 4.41 101.7 9.94 105.7 6.17 97.8 9.25
20˚C 106.0 5.20 101.9 7.75 102.9 3.97 96.7 13.55
Table 12: Geometric mean potencies (and %GCV) of samples after repeated freeze-thaw cycles
(% of freshly reconstituted ampoule)
Sample 1 x freeze/thaw 2 x freeze/thaw 3 x freeze/thaw 4 x freeze/thaw
Mean %GCV Mean %GCV Mean %GCV Mean %GCV
B (09/136) 90.7 6.11 93.3 2.60 99.2 2.14 94.8 3.28

WHO/BS/10.2133 Page 22
Figure 1a:
Potencies of Sample A v 88/502
0
1
2
3
4
5
6
7
8
9
10
Potencies of A v 88/502
0 2 4 6 8 10 12 14 16 18 20 22 24 26 28 30
04
13
02
06
10
07
08
09
12
3B
05
14
01 3A
Figure 1b:
Potencies of Sample A v Sample B
0
1
2
3
4
5
6
7
8
9
10
Potencies of Sample A v Sample B
0 2 4 6 8 10 12 14 16 18 20 22 24 26 28 30
04
06
09
10
12
14
3A
01
02
05
07
08
13
3B

WHO/BS/10.2133 Page 23
Figure 2a:
Potencies of Sample B v 88/502
0
1
2
3
4
5
6
7
8
9
10
Potencies of B v 88/502
0 2 4 6 8 10 12 14 16 18 20 22 24 26 28 30
13 04 02
06
07
08
09
10
12
3B
05 01
14
3A

WHO/BS/10.2133 Page 24
Figure 3a:
Potencies of Sample C v 88/502
0
1
2
3
4
5
6
7
8
9
10
Potencies of C v 88/502
0 2 4 6 8 10 12 14 16 18 20 22 24 26 28 30
04
13
02
05
06
3B
09
10
01
07
08
12
14
3A
Figure 3b:
Potencies of Sample C v Sample B
0
1
2
3
4
5
6
7
8
9
10
Potencies of Sample C v Sample B
0 2 4 6 8 10 12 14 16 18 20 22 24 26 28 30
01
02
04
05
06
09
14
3A
3B
07
08
10
12
13

WHO/BS/10.2133 Page 25
Figure 4a:
Potencies of Sample D v 88/502
0
1
2
3
4
5
6
7
8
9
10
Potencies of D v 88/502
0 2 4 6 8 10 12 14 16 18 20 22 24 26 28 30
02
04
08
10
13
06
07
09
12
14
05
3B
01 3A
Figure 4b:
Potencies of Sample D v Sample B
0
1
2
3
4
5
6
7
8
9
10
Potencies of Sample D v Sample B
0 2 4 6 8 10 12 14 16 18 20 22 24 26 28 30
14 01
07
08
09
10
12
3A
02
05
04
06
3B
13

WHO/BS/10.2133 Page 26
Figure 5a:
Potencies of Sample E v 88/502
0
1
2
3
4
5
6
7
8
9
10
Potencies of E v 88/502
0 2 4 6 8 10 12 14 16 18 20 22 24 26 28 30
13 04 02
06
3B
05
08
09
10
12
01
07
14
3A
Figure 5b:
Potencies of Sample E v Sample B
0
1
2
3
4
5
6
7
8
9
10
Potencies of Sample E v Sample B
0 2 4 6 8 10 12 14 16 18 20 22 24 26 28 30
01
02
04
05
06
09
14
3A
3B
07
08
10
12
13

WHO/BS/10.2133 Page 27
Figure 6a:
Potencies of Sample F v 88/502
0
1
2
3
4
5
6
7
8
9
10
Potencies of F v 88/502
0 2 4 6 8 10 12 14 16 18 20 22 24 26 28 30
04
13
02
06
3B
07
08
09
12
05
10
01
14
3A
Figure 6b:
Potencies of Sample F v Sample B
0
1
2
3
4
5
6
7
8
9
10
Potencies of Sample F v Sample B
0 2 4 6 8 10 12 14 16 18 20 22 24 26 28 30
06
08
3B
01
02
04
05
07
09
12
13
14
3A
10
WHO/BS/10.2133 Page 28
Figure Legends
Figures 1a – 6a: Potency (x 104 IU/ml) of study samples A – F relative to the International Standard 88/502. Figures 1b, 3b – 6b: Potency (x 104 IU/ml) of study samples A, C, D, E, and F relative to sample B, coded 09/136 (= 9.52 x 10⁴ IU/ml).

WHO/BS/10.2133 Page 29
Appendix 1 List of Participants The following participants contributed data to the study. In this report, each laboratory has been identified by a number from 1 to 13 that is not related to this order of listing. Nadine Frankenberg and Martin Schiestl, Novartis Pharma AG, Werk Klybeck, WKL 681.3.05, Klybeckstrasse 141, CH-4057 Basel, Switzerland Akira Kobayashi and Takeshi Kuromatsu, CMC Development Department, Chugai Pharmaceutical Co. Ltd, 5-1, Ukima 5-chome, Kita-ku, Tokyo, 115-8543 Japan Deepti Roy, Sudhir Manjul and Dixit Mallikarjun Narayan, Biocon Ltd, 20th KM, Hosur Road, Electronic City, Bangalore -560 100, India Julie Collinet and Eric Vedrine, Sanofi Winthrop Industrie, Laboratoire de biologie, 180 rue Jean Jaures, 94702 Maisons Alfort, France Chris Bird, Cytokines and Growth Factors Section, Biotherapeutics Group, NIBSC, Blanche Lane, South Mimms, Potters Bar, HERTS, EN6 3QG, UK Aaron von Kerczek and Laurie Pukac, Teva Biopharmaceuticals, USA 9410, Key West Avenue, Rockville MD 20850, USA Yanling Feng and Sharon Ra, GeneScience Pharmaceuticals Co., 72 Tianhe Street, Changchun High-Tech Dev. Zone,Changchun, Jilin, P.R. China 130012. Yang Meihua, Xiamen Amoytop Biotech Co., No.330 Wengjiao Road, Haicang, Xiamen, Fujian, P.R.China 361022 Yun Kyu Choi and Yoon Ji Kim,Biopharmaceutical Research 3, Research Center, Dong-A Pharm. Co., Ltd. 47-1, Sanggal-Dong, Kiheung-Gu, Yongin-Si, Kyunggi-Do, 446-905, Korea Wendy Laderach and Amy Ngo, Quality Control, Amgen Inc., One Amgen Center Drive, Thousand Oaks, CA 91320, USA Gao Kai, Deputy Director, Division of Biopharmaceuticals, NICPBP, NO2.Tiantan Xili, Beijing 100050, P.R.China Sonja Klingelhöfer, Richter-Helm BioLogics, Habichthorst 30, 22459 Hamburg, Germany Rustom Mody and Deepak Gupta, Intas Biopharmaceuticals Ltd, Plot no. 423/P/A GIDC, Sarkhej-Bavala Highway, Moraiya, Ta. Sanand, Ahmedabad – 382 210, India.

WHO/BS/10.2133 Page 30
Appendix 2
COLLABORATIVE STUDY FOR 2nd International Standard (IS) for HUMAN G-CSF
July 2009
Study Protocol for G-CSF Bioassay
1. AIMS OF THE STUDY
3. To assess the suitability of ampouled preparations of human granulocyte-colony stimulating
factor (G-CSF) to serve as 2nd IS for the bioassay of human G-CSF by assaying their
biological activity in a range of routine, 'in-house' bioassays.
4. To assess the activity of the ampouled preparations in different bioassays in current use for
these materials and to calibrate the candidate IS against the 1st IS (88/502).
5. To compare the ampouled preparations with characterised 'in-house' laboratory
standards where these are available. .
2. MATERIALS INCLUDED IN THE STUDY
Participants will be sent
• A set of samples coded by letter A to F (5 ampoules for each preparation) for testing in
G-CSF bioassays. Each sample contains approximately 1 µg of G-CSF.
• 5 ampoules of the current IS (88/502). The current IS contains approximately 100ng of
G-CSF.
• 2 ampoules of an excipient coded N to assess any effect of excipients on the assay.
3. RECONSTITUTION AND STORAGE OF PREPARATIONS
Prior to initiating the study, please read the Instructions for Use provided with the collaborative study. Please note the statements regarding safety and that these preparations are not for human use. Lyophilized preparations provided should be stored at -20oC or below until used.
• All preparations, A to F should be reconstituted with 1ml of sterile distilled water and used immediately.
• For the IS coded 88/502, dissolve the total contents of the ampoule in 0.5ml of sterile distilled water. Rinse the ampoule with about 0.4ml of sterile phosphate buffered saline (PBS) and make up the total volume to 1.0ml with PBS. This solution will contain G-CSF at a concentration of 10,000 International Units/ml. Use carrier protein where extensive dilution is required. Use immediately after
reconstitution.
4. ASSAY STRUCTURE 1. Participants are asked to include all samples A to F and the current IS (88/502) in each G-
CSF assay. In addition, we request that participants include their own in house standard in

WHO/BS/10.2133 Page 31
each assay, where available.
2. For this study, please use a freshly prepared ampoule of each preparation, A to F and of
the current IS (88/502) in each of the assays. An assay is considered independent if the assay is carried out on different days/occasions.
3. For each assay method used, participants are asked to perform an assay initially (a pilot assay)
to ensure that all preparations (A to F, 88/502 and in-house standard) are diluted such that the concentration range falls within the working range of the assay. Please include dilution series of all preparations (A to F, 88/502 and in-house standard) in the assay.
4. Following the pilot assay (as in step 2 above), perform at least 3 independent assays for
each of the preparations (A to F, 88/502 and in-house standard) using the most appropriate dilutions (those giving responses in the linear portion of the dose response curve) derived from the pilot assay for the different preparations tested. As only 2 ampoules of the excipient (coded N) are provided, the excipient should be included in 2 assays only. Dilute the excipient to give the same starting dilution as ampoules A to F.
5. Participants are requested to include dilution series for each preparation in each assay.
Please include eight dilutions of each preparation in duplicate and follow the recommended assay layout provided (separate excel file). Each plate must include 88/502 and the in-house standard. Samples A-F will be split across plates as shown in the recommended layout, and repeated in replicate, giving a total of 4 plates. On a fifth plate,perform eight dilutions for the excipient (coded N) in duplicate. Include blank control wells (cells with culture medium but no G-CSF) as indicated.
5. INFORMATION TO BE SUPPLIED AND PRESENTATION OF RESULTS 1. We have provided an Excel template (separate excel file) for returning the data obtained
from the 3 assays for all the samples tested in the assays.
2. Please let us know, as clearly as possible, how the assay was carried out, especially how the stock solutions were diluted and what dilutions were entered into the assay (and at what positions, if microtitre plates were used). We have provided an example for a microtitre plate format data sheet on page 6 for diagrammatically illustrating the assay format, dilutions and results.
IT IS VITAL TO INDICATE THE PREDILUTIONS (starting dilutions) OF THE ORIGINAL PREPARATION IN EACH ASSAY, along with the working dilutions on the plate.
Please PROVIDE ALL RAW DATA (microtitre plate readout CPM/OD, Response
Units etc) as direct analysis of the raw data provided by the assays permits data from all participants to be handled, as far as possible by uniform procedures .
We request participants to follow the example provided and enter data as indicated in the Excel template (that has been provided separately). Please return all data relating to the 3 assays electronically in the same format as the Excel template provided.
3. Please provide information regarding your local in-house standard on the sheet provided.
4. Please provide information regarding your assay on the sheet provided.

WHO/BS/10.2133 Page 32
PLEASE PROVIDE ALL INFORMATION REQUESTED AS THIS IS NEEDED FOR COMPILATION OF THE STUDY REPORT AND SEND TO:
6. CALCULATION OF RESULTS BY PARTICIPATING LABORATORY Although NIBSC will calculate relative potencies from the raw data provided by the
participants, participants are requested to calculate the contents of each preparation using their own in-house methods relative to the IS (88/502) and the in-house standard.
PLEASE PROVIDE INFORMATION OF ALL METHODS USED TO CALCULATE RESULTS.
7. REPORTING OF RESULTS A draft report of the results will be sent to participants so that they will have an opportunity to
comment on it. Participants in the collaborative study are asked to note that they do so with the understanding that they agree not to publish or circulate information concerning the materials sent to them without the prior consent of the organisers.

WHO/BS/10.2133 Page 33
COLLABORATIVE STUDY FOR HUMAN G-CSF Laboratory identification……
Local standard information
1. What is the nature of your local standard? Please state expression system ___________
2. How did you obtain the standard? Bought ____ Source _____________ Made in-house ____ (please give reference if available) 3. What units do you use with the standard? Mass ________ Units _________ International Units _________
4. If units or international units, please provide information on how it was derived
__________________________________________________________________
______________________________________________________

WHO/BS/10.2133 Page 34
COLLABORATIVE STUDY FOR HUMAN G-CSF
Laboratory identification……
Assay information Outline the assay methods used (provide full protocol on separate sheets if available):
WHO/BS/10.2133 Page 35
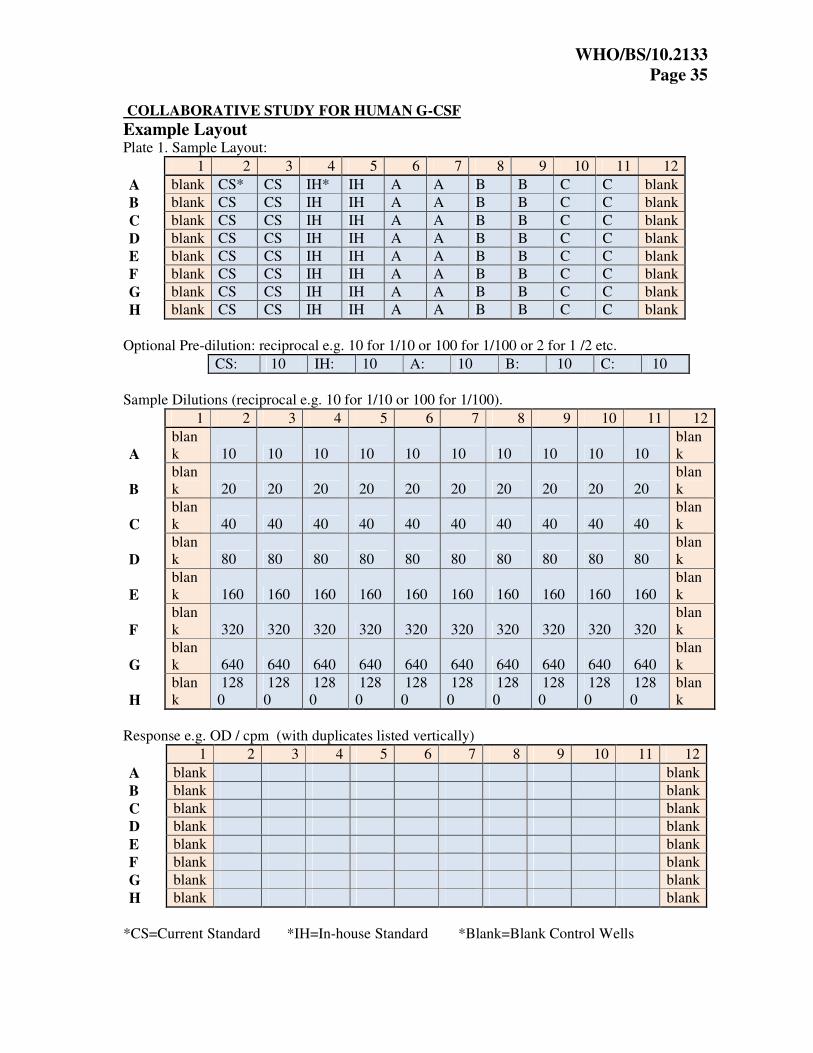
COLLABORATIVE STUDY FOR HUMAN G-CSF
Example Layout Plate 1. Sample Layout:
1 2 3 4 5 6 7 8 9 10 11 12
A blank CS* CS IH* IH A A B B C C blank
B blank CS CS IH IH A A B B C C blank
C blank CS CS IH IH A A B B C C blank
D blank CS CS IH IH A A B B C C blank
E blank CS CS IH IH A A B B C C blank
F blank CS CS IH IH A A B B C C blank
G blank CS CS IH IH A A B B C C blank
H blank CS CS IH IH A A B B C C blank
Optional Pre-dilution: reciprocal e.g. 10 for 1/10 or 100 for 1/100 or 2 for 1 /2 etc.
CS: 10 IH: 10 A: 10 B: 10 C: 10
Sample Dilutions (reciprocal e.g. 10 for 1/10 or 100 for 1/100).
1 2 3 4 5 6 7 8 9 10 11 12
A blank 10 10 10 10 10 10 10 10 10 10
blank
B blank 20 20 20 20 20 20 20 20 20 20
blank
C blank 40 40 40 40 40 40 40 40 40 40
blank
D blank 80 80 80 80 80 80 80 80 80 80
blank
E blank 160 160 160 160 160 160 160 160 160 160
blank
F blank 320 320 320 320 320 320 320 320 320 320
blank
G blank 640 640 640 640 640 640 640 640 640 640
blank
H blank
1280
1280
1280
1280
1280
1280
1280
1280
1280
1280
blank
Response e.g. OD / cpm (with duplicates listed vertically)
1 2 3 4 5 6 7 8 9 10 11 12
A blank blank
B blank blank
C blank blank
D blank blank
E blank blank
F blank blank
G blank blank
H blank blank
*CS=Current Standard *IH=In-house Standard *Blank=Blank Control Wells

WHO/BS/10.2133 Page 36
Appendix 3 Draft Instructions for Use for the proposed WHO 2nd International Standard for G-CSF (09/136)

WHO/BS/10.2133 Page 37

WHO/BS/10.2133 Page 38