report of the national marine fisheries service workshop
TRANSCRIPT

Report of theNational Marine Fisheries ServiceWorkshop on AdvancingElectronic Tag Technologies andTheir Use in Stock AssessmentsAugust 23–25, 2005
Pete Sheridan, John W. Ferguson, and Sandra L. Downing, editors
U.S. DEPARTMENT OF COMMERCENational Oceanic and Atmospheric AdministrationNational Marine Fisheries Service
NOAA Technical Memorandum NMFS-F/SPO-82


Report of theNational Marine Fisheries Service
Workshop on Advancing Electronic Tag Technology and Their Use in Stock Assessments
August 23–25, 2005
Pete Sheridan, John W. Ferguson, and Sandra L. Downing, editors
NOAA Technical Memorandum NMFS-F/SPO-82June 2007
U.S. Department of CommerceCarlos M. Gutierrez, Secretary
National Oceanic and Atmospheric AdministrationVice Admiral Conrad C. Lautenbacher, Jr., USN (Ret.)Under Secretary for Oceans and Atmosphere

ii
Suggested citation:Sheridan, P., J. W. Ferguson, and S. L. Downing (editors). 2007. Report of the National Marine Fisheries Service Workshop on Advancing Electronic Tag Technology and Their Use in Stock Assessments. U.S. Dept. Commerce, NOAA Tech. Memo. NMFS-F/SPO-82, 82 p.
A copy of this report may be obtained from:Northwest Fisheries Science Center2725 Montlake Boulevard EastSeattle, Washington 98112
Or online at:http://spo.nmfs.noaa.gov/tm/

Contents Introduction 1
Workshop Recommendations 3
Acoustic Tags
1 Using Acoustic Tags for Life History Studies of the Red King Crab 5Near Kodiak, AlaskaPeter A. Cummiskey and Eric Munk
2 Acoustic Tagging of Green Sturgeon 7Steve Lindley and Mary Moser
3 Using Acoustic Telemetry to Document English Sole Movements: 9Application to Management of Contaminated SedimentsMary Moser, Mark S. Myers, Steve L. Katz, Sandra M. O’Neill, Stephen R. Quinnell, and James E. West
4 Developing Shallow-Water Acoustic Telemetry Methods for 11Juvenile Snapper Habitat Studies in the Florida Keys National Marine SanctuarySamantha Whitcraft, Lisa Pytka, Bill Richards, John Lamkin, Trika Gerard, Tom Carlson, Geoffrey A. McMichael, Jessica Vucelick, and Greg Williams
5 Tag Effects Considerations in Electronic Tagging Studies 13R. Lynn McComas, Brad Ryan, and Geoffrey A. McMichael
6 Unmanned Underwater Vehicles for Fish and Marine Mammal 15Shadowing and Data Acquisition: A ConceptEarl F. Prentice and R. Lynn McComas
7 Movements of Yellowfin and Bigeye Tuna in a Network of Fish 17Aggregating Devices as Determined by Acoustic TelemetryKim Holland, David Itano, and Laurent Dagorn
Pop-up Tags
8 Status of the Argos Joint Tariff Agreement 18Stephen Auer
9 Acoustic, Archival, and Pop-up Satellite Tags and Large Pelagic 19Fishes: A 30-Year PerspectiveRichard Brill and Michael Musyl
10 Evaluation of Pop-up Archival Transmitters to Determine Cause 21of Failure for Satellite Transmitters Deployed on Pacific Leatherback TurtlesScott R. Benson and Peter H. Dutton
11 Pop-up Archival Transmitting Tags and Their Application to 23Loggerhead Sea Turtle Survival StudiesSheryan Epperly, Christopher Sasso, Eric Prince, Carlos Rivero, Alan Bolten, Jeanette Wyneken, Joseph Flanagan, and Craig Harms
iii

iv
12 Combined Use of PAT and SPOT Tags to Study Three-Dimensional 24Habitat Use Patterns of Shortfin Mako SharksSuzanne Kohin and David Holts
13 Shark Research in the Gulf of Alaska with Satellite, Sonic, and 26Archival TagsDean L. Courtney and Lee Hulbert
14 PSAT Performance and Metadata Analysis Project 28Michael Musyl, Geoff Arnold, Michael Domeier, Molly Lutcavage, Lianne McNaughton, Yonat Swimmer, Steve Wilson, and Richard W. Brill
Radio Tags
15 Utilizing Radiotelemetry to Investigate Passage Behavior and 29Survival of Juvenile Salmonids in the Columbia River BasinGordon A. Axel, Eric E. Hockersmith, Byron L. Iverson, Samuel L. Rambo, Darren A. Ogden, and Douglas B. Dey
16 Automated Telemetry Data Retrieval and Organization 31Brian J. Burke, Bruce F. Jonasson, Eric E. Hockersmith, Kinsey E. Frick, Gordon A. Axel, Byron L. Iverson, Samuel L. Rambo, Mark A. Kaminski, and Ron L. Helgeson
17 Failure Modes of Dorsal Fin-Mounted Small Cetacean Telemetry 33TagsAleta A. Hohn, M. Bradley Hanson, Forrest Townsend, Frank Deckert, and Tiu Similä
18 Foraging Studies of Hawaiian Monk Seals Using Satellite-Linked 35Depth RecordersCharles L. Littnan and Brent S. Stewart
19 Combination of Satellite Telemetry and Molecular Genetic Analysis 37in the Study of Beluga Whales in the Western NearcticGreg O’Corry-Crowe, Robert Suydam, Jack Orr, Lloyd Lowry, Kathy Frost, Dennis Litovka, and Rod Hobbs
Archival Tags
20 Documenting Elephant Seal Movement with a Geographic 38Location, Time-Depth Recording Archival TagRobert L. DeLong, Sharon Melin, Brent S. Stewart, and Roger D. Hill
21 Archival Tagging of Salmonids on the Central California Coast 39Sean A. Hayes, Ellen V. Freund, Chad V. Hanson, Morgan H. Bond, and R. Bruce MacFarlane
22 Archival Tagging of Atka Mackerel, Pacific Cod, and Flatfish in the 41Aleutians, Gulf of Alaska, and Eastern Bering SeaDan Nichol

v
23 Application of Electronic Data Storage Tags in Studies of Black Sea 43Bass and Yellowtail Flounder in the Northwest AtlanticJoshua Moser, Gary Shepherd, Steve Cadrin, Azure Westwood, and Stacy Kubis
Linkages between Tagging and Environmental Data
24 Hypoxia-Based Habitat Compression of Tropical Pelagic Fishes 45Eric D. Prince and C. Phillip Goodyear
25 Kuroshio Extension Current Bifurcation Region: A Pelagic Hotspot 47for Juvenile Loggerhead Sea TurtlesJeffrey J. Polovina, George Balazs, Evan Howell, Itaru Uchida, Denise Parker, and Peter H. Dutton
26 Merging Satellite Telemetry with Oceanographic and Archival Tag 49Data to Assess Foraging Ecology of Alaskan PinnipedsJeremy T. Sterling, Rolf Ream, Brian S. Fadely, and Tom Gelatt
27 Spatial Patterns of Juvenile Stellar Sea Lions at Sea with Respect to 50Corresponding Patterns of Environmental FeaturesMichelle E. Lander, Jeremy T. Sterling, and Brian S. Fadely
28 Critters in Context: A Method for Integrating Tag Data with Other 51Environmental InformationDavid G. Foley and Lynn deWitt
29 Seasonal Movements and Habitat Use of Dall’s and Harbor 53Porpoises in the Inland and Coastal Waters of Washington State as Determined by RadiotelemetryM. Bradley Hanson
30 Assessing Habitat Use and Movement Patterns of Coastal Sharks 55with an Automated Acoustic Telemetry SystemJohn K. Carlson, Michelle Heupel, and Colin Simpfendorfer
Stock Assessment and Ecosystem Applications
31 Potential Role of Electronic Tags in Stock Assessments 57Richard D. Methot
32 How Can Pinniped Telemetry Data Fit into Fisheries Management? 58Examples from Stellar Sea Lions and Northern Fur Seals in AlaskaBrian S. Fadely, Lowell Fritz, Jeremy T. Sterling, Rolf Ream, and Shane Capron
33 Using Information from Electronic Tags for Stock Assessment of 60Northeast Fishery ResourcesSteven Cadrin, Gary Shepherd, Tim Sheehan, Stacy Kubis,Joshua Moser, and Azure Westwood
34 Using Location Data from Telemetry Tagged Marine Mammals to 62Improve Stock AssessmentsM. Bradley Hanson

vi
35 Using Archival Tagging to Better Understand Stock Structure and 64to Develop Habitat-Based Models for North Pacific AlbacoreSuzanne Kohin and John Childers
36 Virtual Population Analyses of Atlantic Bluefin Tuna that Include 66Information from Electronic Pop-up TagsClay E. Porch
37 Using Electronic Tags in Marine Mammal Stock Assessment 68ReportsRobyn P. Angliss and Ray Outlaw
Breakout Session Summaries
Acoustic Tags 69Pop-up Satellite Tags 70Radio Tags 72Archival Tags 72
Recent NMFS Publications and Reports Derived from Electronic 75Tagging
Workshop Attendees 79

Introduction On 23–25 August 2005, the National Marine Fisheries Service (NMFS or NOAA Fisheries Service) Advanced Sampling Technology Working Group (ASTWG) sponsored a workshop at the Northwest Fisheries Science Center (NWFSC) in Seattle. The intent of the workshop was to advance the use of electronic tagging technologies and the scientific data gathered through these technologies, and to improve fisheries stock assessments and the implementation of ecosystem-based management strategies. The overall goal was to develop a list of recommendations for improving tagging technologies that would be submitted to the ASTWG for future funding. The specific goals were to 1) identify present and future research needed to improve electronic tagging technologies, 2) discuss specific data management requirements for each technology, and 3) develop ways to improve how tagging and environmental data are incorporated into stock assessments.
Approximately 80 scientists from the NOAA Fisheries Service attended the workshop. Vendors were specifically excluded from the workshop so that scientists could openly share their experiences using the various technologies. The workshop was organized into two days of researchers giving presentations of their experiences applying the various technologies. The presentations were grouped into the following sessions: • acoustic tags, • pop-up tags (including pop-up satellite tags), • radio tags, • archival tags, • linkages between tagging and environmental data, and • stock assessment and ecosystem applications.A third day was devoted to smaller breakout sessions that were organized by type of tagging technology (acoustic, pop-up, radio, and archival) and animals (pinnipeds, cetaceans, turtles, pelagic fish, bottom fish, and invertebrates).
Electronic tagging is a key methodology NOAA Fisheries Service scientists use to gather information on stock productivity and recruitment, fish behavior and feeding ecology, habitat selection, and individual and population-level responses to environmental and climate variability. This information is needed for accurate and responsible fisheries management. The workshop highlighted the cutting-edge nature of these technologies. In many cases, scientists are just at the beginning stages of developing electronic tagging techniques to sample animals in their habitats in real time; to address specific questions about patterns of vertical, diel, and feeding movements; and to identify intra- and interspecific behavioral differences. Obtaining more detailed information on habitat selection at smaller time scales and linking this information to concurrently measured environmental parameters will greatly enhance knowledge of what species require to maintain their viability and productivity through time and in varying environmental conditions.
The workshop produced the following recommendations for the ASTWG to consider: • improve tag power management, • decrease tag size, • increase the use of sensors on tags, • improve the accuracy of geolocation data, • enhance data transmission capabilities between tags and receivers, • reduce biofouling on tags, • establish database sharing mechanisms and protocols, • increase tag and software reliability, • reduce tag costs through bulk purchases, • cosponsor an international tagging symposium with invited vendors, • improve collaboration and communication, and • develop a budget initiative within the agency to address the workshop
recommendations.
Workshop participants expressed an overwhelming appreciation for the information and lessons learned, and supported conducting similar workshops in the future.

2
These workshops could be held every 2 or 3 years, since electronic tagging technologies are developing and changing rapidly. Future workshops could also address specific topics such as the integration of environmental data into stock assessments, and the sharing of animal location and environmental databases.

3
Workshop Each tag type presents a unique set of requirements needed to improve the utility of the data developed from the technology. However, many recommendations
Recommenda- were similar across tag types and the data that specific technology produced. We present these summary recommendations for ASTWG to consider as the next steps
tions needed to enhance the effectiveness of how data on the environmental parameters of tagged individuals are gathered, so these important environmental variables can be incorporated into NOAA Fisheries Service stock assessments and resource management decisions.
Improve Tag Power ManagementA universal theme across tag types was the need for improved power management and thus tag longevity, cost effectiveness, and data volume and quality. NOAA researchers should work with tag vendors to develop new methods of saving energy through use of active and passive energy management, using batteries developed for cold-water temperatures, developing batteries that are recharged by water flow or solar cells, and verifying tag performance prior to attachment without using battery life.
Decrease Tag SizeThe need for smaller tags is highly dependent on the application and question being asked. As researchers ask more detailed questions about the biology and ecology of all life stages, there is a need for smaller tags that are placed inside an animal and more streamlined external tags.
Increase Use of Sensors on TagsUnderstanding the environmental parameters animals select could be greatly enhanced by incorporating sensors into electronic tags and storing or transmitting the data. These data could include salinity, pressure (depth), compass/magnetic anomalies (general geolocation), light level (chlorophyll), ice thickness, and conductivity. Sensors could also be used to monitor the behavior and physiology of the tagged animal, including pitch, roll, dive, inactivity, and whether the individual has been preyed on.
Improve GeolocationA common need is for increased precision of geolocation data. Developing cost-effective, global positioning system (GPS)–based tags or acoustic listening tags and their support systems is a high priority.
Improve Data TransmissionEnhanced data transmission capabilities are needed to increase transmission rates so more data can be transmitted during brief surfacing periods or during haul outs, to allow two-way communication between tags and receivers (radio tags and arrays, pop-up tags and satellites), to limit transmissions to periods when receivers are within view or range, to develop communicating history acoustic transponding (CHAT) technology that would allow researchers to locate and track animals using transponding tags and retrieve data without recapturing the animal, and to develop enhanced wireless communication capabilities.
Reduce BiofoulingFor externally attached tags, biofouling is a considerable problem. Tags made of antibiofouling materials are needed to reduce impacts to tag life and data accuracy.
Share DatabasesShared databases could create efficiencies for research. The workshop attendees recommended establishing a common site where environmental, habitat selection, and location data could be stored for use by stock assessment analysts. Creating this database would include developing software for merging different data sets and standardizing reporting criteria so that data can be merged. They also recommended that a data manager be hired to manage the site.

4
Increase Tag and Software Reliability, and Initiate Bulk Purchases with VendorsIn general, the relationship between NMFS and its vendors needs improvement. The reliability of tags and software needs to be enhanced to reduce the probability of tag failure and ensure data are not lost. Vendors typically replace defective tags, but this is a minimal cost of the study compared to lost opportunity, ship time, and personnel costs. Vendors need to warranty their products such that true costs are covered, not just tag costs, and an increased interaction with vendors is needed for them to understand and meet specific study requirements. Bulk purchasing across NMFS centers and line offices could result in reduced tag and equipment costs. This purchasing could be coordinated through the centralized database coordinator located in headquarters or one of the centers, as discussed above.
Improve Collaboration and CommunicationElectronic tagging technology and data use changes rapidly. NMFS researchers agree that regularly scheduled internal workshops (every 2–3 years) are necessary for improved collaboration and information exchanges. An international tagging symposium that includes vendors and manufacturers is also needed, since the last such session was held in 1988 with U.S. Fish and Wildlife Service and American Fisheries Society sponsorship.
Develop a Budget InitiativeNMFS researchers recognize the value that data gathered from electronic tagging studies brings to the development of stock assessments and to agency resource management decisions. This value is reflected in the type of data collected, as well as the fact that data are collected in a cost-effective manner. Therefore, workshop participants strongly propose developing a budget initiative within the agency to address the recommendations produced from the workshop to advance and expand the effectiveness and utility of electronic tagging, and how this important sampling tool is used within NOAA Fisheries Service. To implement the initiative, it is recommended that in fiscal year 2007 the ASTWG provide funds to convene a team of scientists represented by each science center that will meet and develop the documents necessary for an electronic tagging budget initiative.

5
1Using Acoustic Tagsfor Life History Studiesof the Red King Crabnear Kodiak, Alaska
Peter A. Cummiskey and Eric MunkAlaska Fisheries Science CenterKodiak, Alaska
A database using Microsoft Access was developed to track the data generated. All tables include, and are interrelated by, tag and deployment numbers. The four main tables are 1) sonic tags, which records tag release and recovery dates, crab size, sex, and the nature of tag loss; 2) location, which records tag locations, date, time, depth, and collocation with other tags; 3) dive summary, which records crab observations, numbers, activity, associations, bottom type, and depth; and 4) measurements, which records crab size, sex, and the shell and reproductive conditions.
Since 1990 we have tagged 190 crabs from 42 to 167 mm in carapace length and tracked them for an average of 157 days (Figure 2). The epoxy attachment has been highly reliable, with only a few tags that may have detached from the crab. The Sonotronics CT-04-1 tag detection range is limited, perhaps 100 m, but its size has allowed us to successfully track crab too small for a larger tag. The CT-82-3 tag, with a battery life of 48 months, is reliable and the signal strength does not diminish over time. We have used the same Sonotronics USR 4HL for 12 years and had only a few shorts in the hydrophone wire that can be easily changed with minimal expense. The average detection range of this receiver and tag combination is about 400 m with a high degree of tag detection in often demanding conditions. We recover our lost tags
The red king crab (Paralithodes camtschaticus) has supported large commercial fisheries in North American and Asian waters. The fishery in Alaska peaked in 1980 and then declined abruptly, resulting in closures in most of the Gulf of Alaska. The sudden decline of red king crab generated considerable interest in habitat requirements and life history, particularly during the juvenile stages. After a brief larval period, crab settle to the bottom and spend the first year as individuals. In their second year crab start to aggregate, forming pods of hundreds to thousands of crab (Figure 1). Podding behavior continues throughout the juvenile stage and intermittently into adulthood.
The study area, Womens Bay, is a shallow semienclosed 18 km2 estuary near Kodiak, Alaska. Womens Bay is considered a nursery area for red king crab and has supported populations throughout this period of decreased abundance. Before 1990, biologists at the NMFS lab in Kodiak used scuba observations to document the behavior and movements of pods of smaller juveniles nearshore, before they moved into deeper water where visual location proved impractical.
In 1990, we started to use acoustic tags, which allowed us to expand dive observations throughout Womens Bay, as well as track general movements of crab pods over time. When divers located a pod, several crab were collected, tagged on the surface, and returned. Sonotronics (Tucson, Arizona) CT-04-1 tags are used for smaller crab or CT-82-3 for larger. The tags were fixed to the crab carapace using marine epoxy (Sea Goin Poxy Quick, Permalite Plastics, Costa Mesa, California). Multiple tags are deployed to minimize chances that the pod is lost due to molting or mortality.
All tagged crab are located weekly with a Sonotronics USR-4HL surface receiver and DH-2 hydrophone from a small boat. GPS locations, date, time, depth, and tag numbers are recorded. Scuba observations are made at least weekly using a Datasonics (Cataumet, Massachusetts) DPL-275-H dive receiver. Crab numbers, activity, associations, bottom type, and depth are recorded. Crab are often collected, measured on the surface, and then released, providing information on pod dynamics.
Figure 1. A pod of aggregating juvenile red king crab. Pods range in size from hundreds to thousands of crabs. Divers located this pod in Womens Bay.

o
e e
l
%
e
Figure 2. An acoustic tag glued with marine epoxy onto the back of a king crab. The crab are returned to the crab pod.
and have reused them up to six times. The tags may alsbe inexpensively fit with new batteries. We have been satisfied with both the equipment and service provided by Sonotronics.
We used our Datasonics dive receiver (Figure 3) after wlocated the tag from the surface. We have made 557 divobservations with this receiver. Tag detection range is 40 to 50 m, but as the battery ages, this range gradually diminishes. Variable conditions and other aspects of a demanding dive environment often mask this range reduction, until it fails to detect tags all together. Equipment failures have occurred at critical times, for example, during molting seasons, when we tag newly molted crabs before old tags are shed in the molt. We have found the cost and, particularly, the turnaround time involved in repairing our receiver to be detrimentato our ongoing project.
We are working on two new subprojects using acoustic-tag equipment. First, we plan to combine acoustic tags with three Lotek LTD-1100 archival tags (Lotek, Newmarket, Ontario) to test an economical way to obtain continuous depth and temperature data on individual crab. Second, we hope to use PIT (passive integrated transponder) tags in podded crab to get better growth data. Dive observations have shown 100molting of 3- and 4-year-old crab in the winter, while 20% to 30% of the same crab also molt the following summer. This makes molting intervals and growth mordifficult to assess as the crab age. We are starting live tank experiments using PIT tags on smaller crab to test mortality rates. If successful with small crab, we hope to PIT tag hundreds of podded crab and track them with acoustic tags to improve crab growth and molting information. It is not uncommon to double tag animals in order to track different kinds of information—in this case long-term data (PIT tags) and short-term data (acoustic tags).
6
Overall, although we use basic equipment, it has proven to be reliable in a demanding environment. The size and protected nature of our study area is conducive to using basic equipment and makes our project feasible. Using direct scuba observations provides important data on crab life history, for example, when crab molt or how they die. Merely using surface tracking would otherwise miss this information. We dive on crab year-round, producing 3,122 tag locations, 557 dive observations, and 245 collections since 1990. Recently, we successfully followed a pod of a several thousand crab for over 4 years; we used 33 tags, and produced 900 tag locations, 107 dives, and 66 collections. This resulted in a continuous record of growth of a single crab cohort, potentially allowing for better predictions of crab recruitment for management.
Figure 3. A diver holding a Datasonics DPL-275-H dive receiver. Scuba observations are made at least weekly to monitor crab movements.

7
2Acoustic Taggingof Green Sturgeon
Steve LindleySouthwest Fisheries Science CenterSanta Cruz, California
Mary MoserNorthwest Fisheries Science CenterSeattle, Washington
Green sturgeon (Acipenser medirostris) are of rising importance to NOAA Fisheries Service, with one distinct population segment (DPS) proposed as a threatened species under the Endangered Species Act (ESA) and the other DPS a species of concern. The lack of basic knowledge on population size, structure, and distribution severely hampers managing green sturgeon. Given their rarity, electronic tagging offers the most practical way to gain some of this information.
In 2002, we recognized that a number of studies of freshwater habitat use by green sturgeon could be leveraged to provide information on stock structure and movement among freshwater and coastal habitats. This was possible because many researchers on the west coast use Vemco (Shad Bay, Nova Scotia) acoustic tags and receivers with default frequencies and code maps. We supplied the existing projects with additional tags and receivers, initiated new tagging projects in estuarine areas where green sturgeon aggregate, and developed collaborations with people studying salmonids and rockfish from Monterey Bay to southeast Alaska (see Figure 1). Green sturgeon are an excellent subject for long-term acoustic tagging because they can carry a large tag that has extended battery life and their migrations are extensive but typically restricted to shallow depths on the shelf. With a shoestring budget and the goodwill of many people and agencies, we have been
Figure 1. Map of the west coast of North America showing Vemco receiver locations for various agencies and sites where green sturgeon were tagged.

8
Figure 2. Researchers tagging a green sturgeon with a Vemco acoustic tag.
remarkably successful in describing movement among systems, patterns of migration along the coast, and the source of mixed stocks (Figure 2).
While we have learned much about green sturgeon from our work thus far, much more could be learned using this technology as the basis for more ambitious studies. Because acoustically tagged green sturgeon are readily “resighted,” mark-recapture studies are feasible with modest tagging efforts, compared to traditional approaches that require physical recapture of the fish. For example, the Cormack-Jolly-Seber capture-recapture model could be used to estimate survival rates from the temporal pattern of tag detections. Stage-based models of the tagged animals could be developed that could estimate movement rates among habitat types as a function of animal size or spawning history. Ultimately, a nonacoustic sighting component would be added to allow estimation of the tagging rate. With this kind of information, the complete dynamics of the population could be estimated with a multistage open population model.
The basic approach of using acoustic tagging and mark-recapture designs could be expanded to other species (such as salmon, sharks, other large coastal pelagics, and the more migratory groundfish) as part of the developing Pacific Coast Ocean Observing System (PaCOOS). A major goal of PaCOOS is to provide the information required for fishery resource management. The backbone of the system would be a series of hydrophone arrays along the continental shelf, extending and embracing the Pacific Ocean Shelf Tracking (POST) Project (formerly known as the Pacific Ocean Salmon Tracking Project). Such a system, combined with appropriate tagging, could allow accurate description of the temporal and spatial dynamics of populations at a resolution not achievable with other available technologies.
In addition to substantial funding, the long-term nature of such studies will require coordination of tag codes, receiver settings, and data sharing. Ideally, this coordination would happen through a neutral party. The Pacific States Marine Fisheries Commission (PSMFC) coded-wire tag and PIT tag systems might provide a useful model for managing acoustic tagging on a coast-wide scale. Similarly, managing a coast-wide receiver array is a major endeavor for which NOAA Fisheries Service is well suited, with its long experience with numerous and widespread coastal and open-ocean data buoys.

9
3Using Acoustic Telemetry to Document English SoleMovements: Application to Management of Contaminated Sediments
Mary L. Moser, Mark S. Myers, andSteve L. KatzNorthwest Fisheries Science CenterSeattle, Washington
Sandra M. O’Neill, Stephen R. Quinnell, and James E. WestWashington Department of Fish and WildlifeOlympia, Washington
Assessments of estuarine and marine fish exposure to contaminated sites have traditionally relied on indirect evidence, such as the capture of sentinel species in these areas or the presence of high contaminant levels in various fish tissues. Along the Pacific Coast of North America, English sole (Parophrys vetulus) are used as a sentinel species because they are broadly distributed in benthic habitats where they would contact contaminated sediment. English sole are also an effective sentinel species because they seem to show high fidelity to feeding areas, migrating only in winter for spawning. Strong correlations between sediment polycyclic aromatic hydrocarbons (PAHs) and the prevalence of neoplastic and preneoplastic liver diseases in English sole collected from contaminated areas also suggest high site fidelity. However, the amount of time adult English sole spend in contaminated areas and the spatial extent of their summer feeding movements have never been assessed directly.
We tested the use of acoustic telemetry to document the time individual English sole spent in contaminated areas and whether they showed interannual fidelity to these sites. This work was conducted in Eagle Harbor, a small, PAH-contaminated embayment of Puget Sound(Figure 1). This site was selected because it has been the subject of an ongoing study of sediment contamination and its effects on fish health. In 1994, a contaminated subtidal area of Eagle Harbor was covered with a cap of clean sediment (Figure 1). Subsequent testing for toxicopathic lesions and several direct measures of PAH exposure in English sole trawled from this embayment were used to determine whether remediation was successful. Now estimates of English sole home range are needed to more precisely link the degree of contaminant exposure with fish health. Acoustic telemetry in this small study area seemed to be a logical tool for documentation of English sole movements in and around contaminated sites.
����������
��������
���������� ���������� ��������� ���������� ��������� ����������
����������������
����������
������
��������������
������������
Figure 1. Aerial view of Eagle Harbor in Puget Sound with fixed receiver locations (red), mobile listening posts (yellow), trawl lines (white), and location of the sediment cap (light blue) denoted.

10
Initial laboratory experiments in 2003 verified that acoustic transmitters could be surgically implanted into adult English sole without tag expulsion or negative effects on survival or feeding within the first month of tagging. In the summers of 2003 and 2004, we trawled adult English sole from Eagle Harbor and surgically implanted uniquely coded acoustic transmitters in 39 of the largest (>27 cm) fish. The transmitters (Vemco V8 series, Shad Bay, Nova Scotia) were 9 × 30 mm cylinders weighing 5 g. We tested both high (147 decibels, or dB) and low (139 dB) power transmitters set at a variety of pulse intervals (20–60 s, 40–120 s, and 180–360 s).
After their release near the capture site, the sole were detected during periodic scans of set listening posts with a portable receiver (Vemco VR60) or by a continuously scanning array of underwater receivers (Vemco VR2) (Figure 1). We also tested use of a three-dimensional positioning system (Vemco VRAP, Vemco’s radio acoustic position system) to document small-scale (on the order of meters) sole movements. The positioning system was deployed in Eagle Harbor near the known locations of two English sole and two stationary transmitting beacons were also deployed nearby. Position information for the four targets was taken over a 24-hour period, with the hope of observing diel patterns of fish movement.
Surgical implantation of the transmitters seemed to workwell, particularly in the second year when fish were allowed to recover from surgery in a submerged cage for several days prior to release. The fixed receiver arrays detected all but one of the English sole that exited Eagle Harbor and provided valuable information on the diel and seasonal patterns of fish movement. The low-power transmitters set at a 20–60 s pulse interval proved most useful. The low power reduced transmission collisions (which result in the inability to identify fish codes) and improved spatial resolution, while the shorter burst interval reduced the time needed to scan listening posts. In addition, these transmitters had an extended battery life, which allowed us to document the return of English sole to Eagle Harbor in the second and third summers of the project.
Our study was limited by the inability to develop accurate, high resolution (<100 m) maps of English sole home range from mobile tracking. The time-intensive process of scanning listening posts would have been easier with a receiver that automatically triangulates fish position (expensive). We needed daily or even hourly calibration of transmission range, due to the effects of passing algal blooms and ferry traffic in this acoustically
challenging study area (time consuming). An automated system to conduct and incorporate these calibrations would result in more accurate home range delineation. Tag miniaturization would also allow study of a greater size range of English sole.
Downloading receiver arrays, which in some cases required dive operations, would have been eased by the addition of wireless communication with the receivers. Cell phone links would allow downloading from the laboratory and reduce the need for expensive boat and dive operations. The usefulness of data obtained from the fixed receiver arrays was constrained by the large (over one second per day) and unpredictable amount of drift in receiver time stamps. This is a common problem among logging receivers and should be remedied.
Finally, we were disappointed with the results from the VRAP system. In addition to the high cost of this equipment and the expertise needed to set it up, we found that its application was very restricted. The system was most accurate (+1.5 m) when stationary targets were inside the relatively small envelope of system reception (a triangle of 450 m on a side). Precision of stationary target location outside of this envelope was unsatisfactory (+60 m). Thus, the system was strongly dependant on the position of the fish, which move relative to the hydrophone array. Dynamic position referencing, via onboard GPS or referencing stationary pingers perhaps, would greatly improve the performance of systems like VRAP. Although this technology shows great promise, we did not pursue itsuse further due to results of this trial.
11
g tic
sh
d
e
the and r g on gin
rns s d
ear
n
4Developing Shallow-Water Acoustic TelemetryMethods for Juvenile Snapper Habitat Studies in the Florida Keys National Marine Sanctuary
Samantha Whitcraft and Lisa PytkaSoutheast Fisheries Science CenterCooperative Institute for Marine and Atmospheric ScienceMiami, Florida
Bill Richards, John Lamkin,and Trika GerardSoutheast Fisheries Science CenterMiami, Florida
Tom CarlsonPacific Northwest National Lab/Battelle Portland, Oregon
Geoffrey A. McMichaeland Jessica VucelickPacific Northwest National Lab/Battelle Richland, Washington
Greg WilliamsPacific Northwest National Lab/Battelle Sequim, Washington
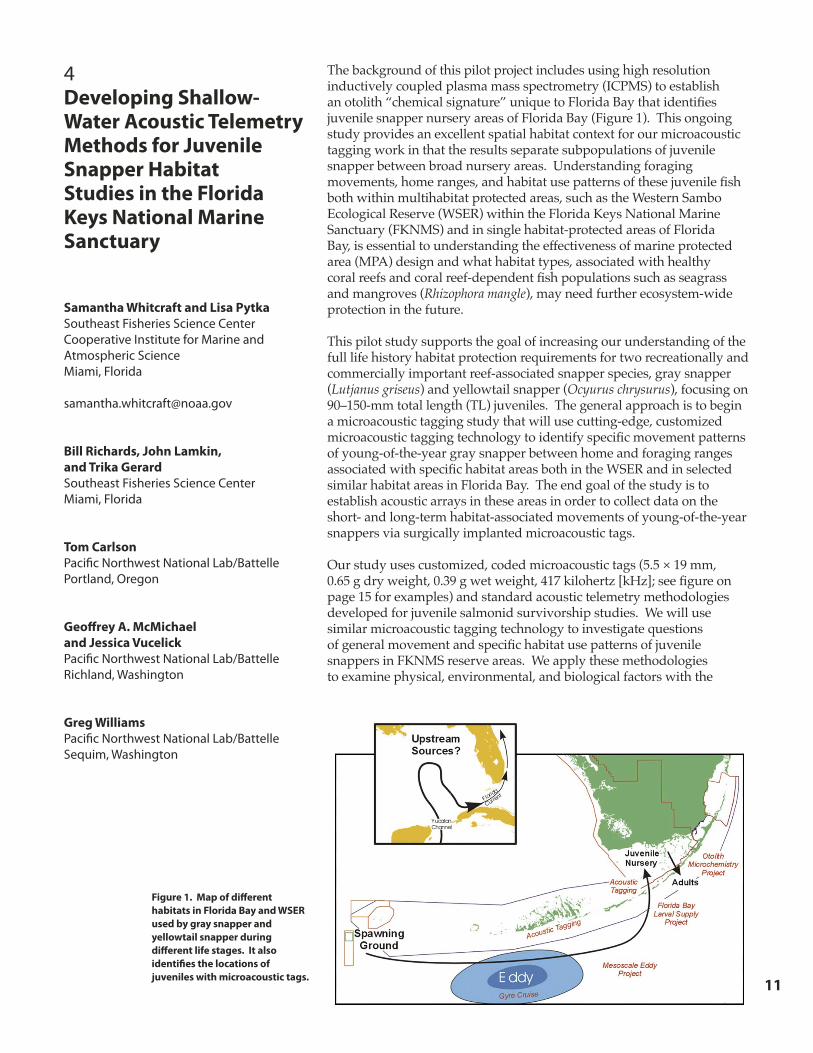
The background of this pilot project includes using high resolution inductively coupled plasma mass spectrometry (ICPMS) to establish an otolith “chemical signature” unique to Florida Bay that identifies juvenile snapper nursery areas of Florida Bay (Figure 1). This ongoinstudy provides an excellent spatial habitat context for our microacoustagging work in that the results separate subpopulations of juvenile snapper between broad nursery areas. Understanding foraging movements, home ranges, and habitat use patterns of these juvenile fiboth within multihabitat protected areas, such as the Western Sambo Ecological Reserve (WSER) within the Florida Keys National Marine Sanctuary (FKNMS) and in single habitat-protected areas of Florida Bay, is essential to understanding the effectiveness of marine protectearea (MPA) design and what habitat types, associated with healthy coral reefs and coral reef-dependent fish populations such as seagrass and mangroves (Rhizophora mangle), may need further ecosystem-widprotection in the future.
This pilot study supports the goal of increasing our understanding of full life history habitat protection requirements for two recreationally commercially important reef-associated snapper species, gray snappe(Lutjanus griseus) and yellowtail snapper (Ocyurus chrysurus), focusin90–150-mm total length (TL) juveniles. The general approach is to bea microacoustic tagging study that will use cutting-edge, customized microacoustic tagging technology to identify specific movement patteof young-of-the-year gray snapper between home and foraging rangeassociated with specific habitat areas both in the WSER and in selectesimilar habitat areas in Florida Bay. The end goal of the study is to establish acoustic arrays in these areas in order to collect data on the short- and long-term habitat-associated movements of young-of-the-ysnappers via surgically implanted microacoustic tags.
Our study uses customized, coded microacoustic tags (5.5 × 19 mm, 0.65 g dry weight, 0.39 g wet weight, 417 kilohertz [kHz]; see figure opage 15 for examples) and standard acoustic telemetry methodologiesdeveloped for juvenile salmonid survivorship studies. We will use similar microacoustic tagging technology to investigate questions of general movement and specific habitat use patterns of juvenile snappers in FKNMS reserve areas. We apply these methodologies to examine physical, environmental, and biological factors with the
Figure 1. Map of different habitats in Florida Bay and WSER used by gray snapper and yellowtail snapper during different life stages. It also identifies the locations of juveniles with microacoustic tags.

12
goal of optimizing telemetry instrumentation and field techniques for this application.
In February 2005, initial field testing of the tag and nodconfiguration in obstruction-rich shallow water was conducted on the lower Yakima River. Stationary beactags were placed along the riverbank in submerged branch litter to simulate an obstruction-rich, shallow-water mangrove environment. We tested acoustic reception (417 kHz) between the beacon tag deployed approximately 1.5-, 0.9-, and less than 0.3-m depths antwo sedentary nodes deployed at 1.8 and 2.7 m. We altested three different ranges between tags and nodes, approximately 10, 40, and 90 m. Initial results indicatethat the total number of acoustic signal “hits” from the beacon tags to the nodes decreased with increasing obstructions between the acoustic receiver and sender. However, we found that with an intermediate amount of branch litter we were able to detect and decode approximately 50 “hits” within an hour. Furthermore, the average time between receptions of the acoustic signal was circa 5 minutes given the greatest amount of obstruction and approximately 2 minutes given intermediate obstruction. Thus, given our initial field observations of movement patterns of some juvenile snapper species in mangrove and seagrass habitats, these results, if applicable to salt water, may prove adequate to detect the presence and movement of thesfish in association with specific habitat types.
In May 2005, samples of mangrove prop roots were acoustically tested with a 25-mm-wide transducer to measure attenuation levels. Attenuation was fairly significant in all cases and is most likely due to small air bubbles present on the roots, which were exposed to air and not treated with a surfactant prior to submergence for testing. In nature, roots submerged for long periods are not likely to have a coating of microbubbles. However, the lab tests showed that attenuation through dense root aggregations decreaseswith frequency. As transmit frequency decreases, sounwavelength increases and the ratio of the dimensions oroot structure to wavelength also decreases, reducing disruption of the transmitted signal. During the summof 2006 we conducted in situ testing of three different frequencies: 107, approximately 260, and 417 kHz. Results from range testing of 417 kHz microacoustic tain 2-m deep salt water (33 practical salinity units or psfound a maximum range of 142 m. Similar ranges werrecorded in obstruction-rich, nearshore habitat such as eelgrass (Zostera marina).
In order to determine optimal microacoustic tag implantation protocols for juvenile snappers and size effects with regards to survivorship, research is now in progress to conduct surgical trials of these microacoustictags in 90–150-mm TL gray snapper (Figure 2). For tagging survivorship trials, 40 fish will be treated with each of the following treatments: intraperitoneal
e
on
at d so
d
e
d f
er
gs u) e
implantation, surgery with no tag implantation, and control. Prior trials found 100% survivorship of juvenile (6–23 g) sockeye salmon (Oncorhynchus nerka) across all three treatments. Additionally, in February 2005, 40 juvenile rainbow trout (O. mykiss, 100–128-mm full length [FL]) were surgically tagged, as part of a training exercise for NOAA staff, and 100% survived in captivity for 111 days postsurgery while retaining their tags. Our initial juvenile snapper microacoustic surgical tagging and survivorship trials were completed in September 2005.
Additional tag bioeffects studies are planned as we anticipate further reduction in the size of acoustic transmitters, enabling tagging of smaller juveniles and further reduction of any impacts of tag size on juveniles within the size range currently being tested. All juvenile snappers from tagging survivorship trials will be aged via otolith ageing techniques; specifically using silver-nitrate additive for staining, extensive polishing, and microscopy or visual reading techniques to reveal daily growth rings. We anticipate ageing these fish to the number of days since birth within their first year by counting these rings.
After the workshop, we will continue this study by conducting range-testing trials in three juvenile snapper habitat types in Florida Bay and WSER. We will test multiple acoustic frequencies within each habitat type in order to minimize sound signal attenuation. We will also manipulate code length, source level, and other aspects of the transmitted signal to find a combination of frequency and coding that maximizes decode ranges while minimizing signal attenuation and multipath for the very shallow water and high vegetative density habitats of juvenile snappers.
Figure 2. Researcher surgically implanting the acoustic tag into a juvenile snapper.

13
5Tag Effects Considerationin Electronic Tagging Studies
R. Lynn McComas, Brad Ryan, and Geoffrey A. McMichaelNorthwest Fisheries Science CenterSeattle, Washington
s Advances in the development of electronic tagging technology have resulted in a proliferation of applications for providing data directed at specific fisheries management goals. The preponderance of electronic tagging techniques involves implanting or attaching a device to the subject. Both cases involve invasive procedures, and since even the use of anesthetic can alter body chemistry, use of these devices can be both behaviorally and physiologically disruptive, resulting in uncharacteristic performance of tagged individuals relative to the untagged population. Tag effects studies can be conducted to characterize the extent of divergence from a control condition. For the most part these have been laboratory studies involving immediate influence on growth and survival over the life of the electronic instrument. This abstract suggests that tag effects considerations should be revisited periodically in the laboratory and in the field.
The term “laboratory studies” is used here to describe work to appraise the effects of tagging where otherwise free-ranging animals are held captive. This process can fall into several categories, including intermediate-term studies for animals held in raceways, net pens, or tanks for extended periods, as well as retention groups held for short-term assessment. Longer-term efforts are generally designed to evaluate some aspect of physiological or behavioral response of a tagged group relative to a reference (control) group of similar animals, while retention groups are often used to make relatively shorter duration inferences about a simultaneously tagged and released cohort.
Assuming that captive animal response is similar to what the subject will experience in a natural condition, there are good reasons to implement lab or retention studies. Relative comparisons of growth, survival, pathology, anatomical effects, behavior, and predation are strengths of this approach. For example, observations of tag rejection (shedding or expulsion) and wound healing development (encapsulation, adhesion progression, altered or eroded organs, and so on) are most easily and economically accomplished using captive animals, as are initial comparisons among tag devices, coating or potting types, or form factors (Figures 1 and 2). Lab studies can also be important where a surrogate species may be used to refine a device or procedure for a protected target species.
It seems obvious that feasibility studies must be undertaken with captive animals to assess immediate effects of a new tag on the target organism before full-blown field studies are attempted. However, it is also advisable to revisit key aspects of the original evaluation during the field study using retention groups. Holding a portion of the released group in as near ambient conditions as possible can afford insight into perturbations resulting from changes in conditions over the tagging season.
There are two outstanding limitations to using the laboratory approach. The most obvious is that the captive cohort is shielded from synergistic physical and biological influences that it would normally be subjected to in a natural system. The second weakness is that prolonged captivity may be at least as traumatic as the tagging procedure, particularly in the longer term.
Both of these limitations can be at least partially overcome by developing procedures for evaluating postrelease tag effects. Given the increasing importance of electronic tagging, it would be advisable to begin to build tag effects objectives into the study design. One
Adhesion development
Device encapsulation
Wound healing
Figure 1. Tests were conducted to determine how salmonids responded to being tagged with microacoustic tags. As depicted, common salmonid responses exhibited during the tag-retention study include adhesion development, device encap-sulation, and wound healing.

14
way this can be done is to compare developmental and established tagging methods to create a tag effects index. For example, this technique has recently been applied during survival studies of acoustically tagged steelhead (Oncorhynchus mykiss) in the Columbia River. Groups of fish tagged with acoustic and passive integrated transponder (PIT) tags were released simultaneously with groups of steelhead with PIT tags only. Comparison of the percentages of PIT tag recoveries from bird droppings will be used as an index to tag effects for acoustically tagged individuals. A similar method could be designed to specifically compare tag effects among electronic tags with different characteristics (shape, size, coating type, and so on) under field conditions.
Finally, a discussion of electronic tagging effects must include an examination of ethical considerations for the tagged subject. The debate should inform deliberation relating proper tagging protocols, relevance of the research to the target species, and the long-term fate of the tagged subject. One area of this debate involves surgical procedures. Researchers are increasingly using surgical techniques to implant transmitters, in part due to evidence that adverse effects of surgical implants decrease over time. Surgical procedures require training and practice for proficiency, and surgical and handling techniques should also be reviewed periodically to include new developments. The ultimate ethical purpose of a tagging effort should be to reduce tag-related effects to the point where tagged individuals survive to reproduce at the same rate as untagged animals.
Figure 2. During the tag-retention study, some of the fish rejected the prototype tags.

15
r 6 Unmanned UnderwateVehicles for Fish and Marine Mammal Shadowing and Data Acquisition: A Concept
Earl F. Prentice and R. Lynn McComasNorthwest Fisheries Science CenterSeattle, Washington
Extensive resource monitoring and near real-time data acquisition are required to accomplish the NMFS mission. Resource monitoring and information gathering will only be achieved through the development and deployment of new technology and approaches. Customized underwater vehicles (UVs) such as semiautonomous and autonomous underwater vehicles (SAUVs and AUVs) in concert with new tags and sensors can play an important role in achieving the goals outlined. The information gleaned from use of this new technology will be required to conserve and manage our marine resources on an ecosystem level.
Monitoring and information-gathering challenges can be partially addressed using present technology by reconfiguring existing data-gathering systems and tools, and by developing new tools and products using existing technology (Figure 1). One of the new tools required is a miniature transponding pressure sensitive tag. Miniature pinger-type acoustic tags (without pressure-sensing capability) exist but miniature sub-22-mm tags having pressure sensors that can be automatically calibrated do not. This class of acoustic tag is considered essential to obtain accurate target position information.
Figure 1. Sample microacoustic tags used to tag juvenile salmonids shown to scale against a penny and a millimeter rule.
Using existing techniques and equipment, mobile tracking of aquatic targets is not reliable from an active tracking, three-dimensional positioning, or at times from a safety standpoint. For instance, using fixed interrogation points (“picket fence” target intercept approach) to track animals only provides information for one point in time. In addition, the receiver may not be in the correct location for target detection and thus no information is collected. Furthermore, limited spatial, temporal, hydrographical, or environmental data, if any, are obtained using this approach.
Causal relationships between the physical environment and animal behavior remain a mystery for many fish and marine mammal species and for various life stages of these animals. Using UVs in concert with a new class of acoustic tag would provide new and critical information needed to address many questions and concerns of fisheries managers. The proposed concept is not limited to any one area of fisheries or marine mammal and has national and international application. What is being proposed is a suite of tools and approaches that can be used to gather data on free-roaming targets of interest (e.g., fish and marine mammals) in situ (Figure 2).

16
Figure 2. In future technology, an unmanned underwater vehicle tracks an acoustically tagged fish and relays that information back to a ship. The vehicle would also collect environmental and hydrological data.
Technology objectives include 1) identifying or developing technology to shadow (track) acoustically tagged and nontagged fish and marine mammals using unmanned, underwater-type vehicles (e.g., SAUVs and AUVs), while gathering environmental and hydrological data; and 2) developing a suite of transponding acoustic tags suitable for use with juvenile and adult fish and marine mammals that are capable of being accurately and precisely tracked by AUVs and similar vehicles. An abbreviated list of technology challenges includes 1) target acquisition, tracking, and positioning; 2) UV positioning and object avoidance; 3) mission duration; 4) power for propulsion and its management for the instrument suite; 5) tag miniaturization (weight and size), read range, and duration; and 6) tag battery size, shape, and power density.
Fisheries science is experiencing rapidly expanding capabilities through developments in computational, robotic, communications, and sensor industries. This expansion is further driven by the biological sciences’ need to understand the interactive dynamics between organisms and the environments in which they live, in order to manage, restore, and maintain our natural resources. To satisfy this informational need, an extensive, remote, continual, and interactive sensor presence within particular areas of interest is required. The following concepts are presented as a means of obtaining some of the required information about the interaction between aquatic animals and their environment.
The basic concept is to shadow targets of interest (e.g., fish and marine mammals) using underwater vehicles (e.g., SAUVs and AUVs) while continuously collecting environmental, hydrographical, and other information of interest in the immediate vicinity of the tracking vehicle. Besides obtaining information on the movementof individual fish, in the future it may also be possible to passively identify stocks of fish using DNA sensors
aboard the UV. NASA scientists have developed an ultrasensitive electronic DNA detector that uses a forest of carbon nanotubes and probe DNA molecules to sense meager amounts of specific DNA. The basic detector could be used in practical land-based applications within 2 years and in the aquatic environment a short time later.
Once the above objectives are achieved, the resulting tools could be used to collect information on the seasonal movements of fish and mammals, their responses to environmental and hydrographic factors, their responses to trophic interactions (i.e., predator-prey relationships), and their responses to and use of micro- and monohabitats. In addition, the system could be used to document habitat use during various life history stages to augment existing life history information and demographics, and to help define the functional relationships governing animal spatial and temporal distribution and movement. Finally, the system could be used to collect information on fish and marine mammals so that ecosystem-based considerations can be incorporated into management decisions and to provide near real-time information on the environment they inhabit so that adaptive management strategies can be applied. In other words, in contrast to traditional Eularian sampling strategies, Lagrangian methods could be used to monitor specific species. The concepts and ideas presented do not cover all scenarios for the use of such vehicles but do provide a vision for the development of a program to address goals and needs outlined in NOAA Fisheries Strategic Plan for FY 2003–FY 2008 and Beyond (online at http://www.ppi.noaa.gov/pdfs/Strategic_Plans/2003_NOAA_Strategic_Plan.pdf) and, in part, to serve the fishery communities’ information needs on a global scale.

17
7Movements of Yellowfin and Bigeye Tuna in a Network of Fish Aggregating Devices as Determined by Acoustic Telemetry
Kim Holland, David Itano, and Laurent DagornHawaii Institute of Marine BiologyKaneohe, Hawaii
Understanding the impact of fish aggregating devices (FADs) on the behavior and distribution of tuna is important in evaluating FAD-induced changes in fishing and refining population assessments. We placed Vemco VR2 (Shad Bay, Nova Scotia) acoustic data loggers on all 13 FADs surrounding the island of Oahu, Hawaii. Yellowfin and bigeye tuna (Thunnus albacares and T. obesus) captured at the FADs were equipped with coded sonic transmitters and released. The results show that although some fish moved among several FADs, the predominant trend was for individual tuna to associate tightly with one FAD and not visit others in the network (Figure 1).
When other FADs were visited, they were the FADs closest to the FAD where the fish were released. Data were also collected on duration of residence, times of arrival and departure of fish from the FAD, and school cohesion. This latter component would be advanced by development of archiving sonic tags that could communicate among themselves and report to a FAD or be interrogated on recapture. Development of tags with longer transmission distances would also be useful in this regard. It would be useful as well if real-time FAD association data or midocean FAD or buoy data could be acquired by cell phone or satellite telemetry of the acoustic detection events; this technological improvement is currently under development and beta testing.
Figure 1. Locations of the 13 FADs surrounding the island of Oahu, Hawaii. Vemco VR2 acoustic data loggers were placed on all 13 FADs to monitor movement of tuna tagged with sonic tags. Most individuals stayed near the FAD where they were tagged and released.

18
8 Status of the Argos Joint Tariff Agreement
Stephen AuerNOAA Research, Office of Global Programs Washington, DC
The U.S. biological community’s use of the Argos Satellite Data Collection System and Joint Tariff Agreement (JTA) has exploded in recent years so that it is now the largest sector of users. The JTA has made several beneficial adjustments to the tariff structure over the previous 5 years to reduce JTA costs for biologists, and the JTA has attempted to garner more input from its biologists to better serve them, for example, regarding system requirements or tariff structure. The objective of the JTA is to provide a fair, cost-effective, and simple tariff for its users; this has achieved mixed results. The tariff has been negotiated and modified many times during its history due to changes in the Argos system, the processing service provider’s (CLS, or Collecte, Localisation, Satellites, a subsidiary of the French space agency, CNES, or Centre National d’Etudes Spatiales) operational costs, and the composition and needs of users.
In 2004 the JTA closely examined the service provider’s cost basis for the total Argos system with an aim toward achieving a cost basis that corresponds to real and required JTA services and the ability of users to cover these costs. The JTA tariff cost basis is and should remain preferential in comparison with the growing non-JTA (commercial) user community. At the 2004 JTA annual meeting, the 25 member-country Representatives of Countries (ROCs) considered a new global tariff proposed by CLS. The 25-year history of the JTA was reviewed, with emphasis on negotiation of the new tariff structure in 2005. The ROCs negotiated and approved a user cost structure that they believed was fairer for the global body of JTA users. The resultant tariff was expected to reduce the average cost for most users, and CLS promised that it would provide a “soft landing” to any users negatively impacted. A reduction in the average user cost is possible because the total Argos usership has dramatically increased in recent years. At the 2005 annual JTA meeting, the ROCs planned to review the initial year’s experience with this new tariff and to consider fine-tuning adjustments to better achieve the above aims.

19
9 Acoustic, Archival, and Pop-up Satellite Tags andLarge Pelagic Fishes: A 30-Year Perspective
Richard BrillNortheast Fisheries Science CenterVirginia Institute of Marine Science Gloucester Point, Virginia
Michael MusylPacific Islands Fisheries Science CenterJoint Institute for Marine and Atmospheric ResearchHonolulu, Hawaii
Acoustic telemetry has been used with large pelagic fishes (i.e., tuna and billfish) for over 30 years (Figure 1). The early studies revealed species-specific vertical movement patterns and widely divergent tolerances of the changes in temperature and oxygen conditions occurring with depth. For example, bigeye tuna (Thunnus obesus) show much greater vertical mobility than yellowfin tuna (T. albacares) and swordfish much greater vertical mobility than the istiophorid billfish (blue, black, and striped marlin, Makaira nigricans, M. indica, and Tetrapturus audax). Bigeye tuna and swordfish make diurnal vertical movements that mirror the movements of the organisms of the deep sound scattering layer (e.g., from the surface layer to >500 m where water temperatures may be <5°C), effectively exploiting this community as a prey resource both day and night. In contrast, the vertical movements of yellowfin tuna and marlins appear constrained to depths where water temperatures are no more than 8°C colder than surface layer temperature. Acoustic telemetry has also shown that tuna have very highly developed navigational abilities in that they can repeatedly return to the same location at the same time over several days. Subsequent acoustic telemetry projects have demonstrated the importance of specific environmental features (e.g., prey density and water clarity) to tuna horizontal movements and aggregations.
Implanted archival tags have confirmed the species-specific vertical movement patterns of tuna, and pop-up satellite archival tags (PSATs) have done the same for billfish (marlins and swordfish) (Figure 2). PSATs have also been shown to be particularly effective at assessing postrelease mortality in a variety of species ranging from sharks to billfish to sea turtles. PSATs have clear advantages in these sorts of studies in that the data returned and fail-safe mechanisms programmed into the tags allow a mortality event to be clearly differentiated from tag failure (i.e., with PSATs you can tell “dead” from “shed”). Both implanted archival tags and PSATs rely on light-based geolocations, and recently developed data analysis techniques (e.g., Kalman filter and use of sea surface temperature, or SST, data) have improved geolocation accuracy. Archival tag technology is clearly suitable for answering ocean basin-scale movement questions. However, light-based geolocation data still are not, and may never be, of sufficient precision to allow interactions of pelagic fishes with mesoscale oceanographic features to be defined. Because of generally low return rates, implanted archival tags are not usable with rare event species (e.g., swordfish, certain species of sharks, and so on) because a sufficient number of tags cannot be deployed. PSATs are preferable in this situation, but issues with long-term attachment, low reporting rates, and the high costs of deployment for the amount of data returned remain to be solved.
Because tuna and billfish are so highly mobile, robust population assessments depend on a good understanding of short- and long-term horizontal and vertical movement patterns. In other words, it is necessary to be able to differentiate changes in abundance from changes in “availability” or “gear vulnerability” due to variations in environmental conditions and fish response to them. Deterministic habitat-based standardization (HBS) models have been used to predict fish distributions, where effective effort is modeled as the joint probability of the effectiveness of the gear (e.g., depth of longline hooks) and the depth distribution of the target species. To be a significant improvement, HBS models need accurate habitat envelopes (i.e., accurate assessment of the impact of temperature and oxygen levels on depth distributions). Without these, HBS models may not offer any improvement to population assessments based on nominal
Figure 1. A yellowfin tuna tagged with a PSAT near its dorsal fin.

20
catch and effort data. Measuring and ultimately predicting the effects of oceanographic conditions on the behaviors of pelagic fishes requires the types of direct observations provided by acoustic telemetry and electronic data recording tags.
Figure 2. Diagram of the movement patterns near Hawaii of blue marlin tagged with PSATs. The black dots (end points) indicate where the PSATs were recovered. Various colored lines represent individual marlin movements.

21
10 Evaluation of Pop-up Archival Transmitters to Determine Cause of Failure for Satellite Transmitters Deployed oPacific Leatherback Turtles
Scott R. Benson and Peter H. DuttonSouthwest Fisheries Science CenterMoss Landing, California
n
Pacific leatherback turtles (Dermochelys coriacea) are in decline, and better knowledge of migration routes, stock structure, foraging habits, and renesting intervals is essential for their successful recovery. Satellite-linked transmitters (platform transmitter terminals, PTTs) have been useful tools for determination of leatherback stock identification, migratory routes, internesting behavior, habitat use, diving behavior, and locations of potential fisheries interactions.
Since 2000, 69 satellite transmitters have been deployed on leatherback turtles in California, Papua New Guinea, and Papua, Indonesia. Expected transmitter life was 18–24 months; however, only 8 transmitters (16%) had durations greater than 12 months and 16 of the 69 (23%) failed within 2 months. It is unknown whether shorter deployments represented transmitter failure, attachment failure, or turtle mortality. To determine the cause of satellite transmitter failure, we evaluated records of pop-up archival transmitting (PAT) tags deployed on leatherback turtles simultaneously with satellite transmitters. The PAT tags were programmed to release after a specified number of days or under conditions indicating a prolonged, uninterrupted time at depth, which could suggest turtle mortality.
Satellite-linked transmitters were attached to the carapace of leatherback turtles, using a harness made of polypropylene webbing and polyvinyl tubing (Figure 1), at foraging grounds off central California and at nesting beaches in New Guinea and Costa Rica. PAT tags (n = 61) were attached to the satellite tag harness or directly to the turtle by drilling a small hole through the pygal process of the carapace (Figure 2). These two techniques permitted PAT attachment that was either dependent or independent of the harness apparatus. PAT tags were programmed to release and transmit data if 1) specified deployment period was complete, or 2) depth of tag remained constant for a prolonged period (48–96 hours). Combined, these techniques allowed specific inferences about the potential fate of the satellite transmitters and turtles.
Data from PAT tags were insufficient to resolve the nature of satellite transmitter “failure events” in most cases. Twenty-nine (49%) of deployed PAT tags failed to report, 25 (41%) reported as scheduled, and seven (11%) reported early. No PAT tags deployed for greater than 6 months ever reported. Among the PAT tags that reported as programmed, one attached to the PTT harness apparatus released 75 days after the last PTT transmission, indicating PTT failure at 111 days. Among the PAT tags that reported early, five were cases of either harness or PTT failure where satellite transmitters ceased after 0–47 days and associated PAT tags, attached to the harness apparatus, reported at approximately the same time. Among the PAT tags that were attached independently of the harness apparatus (i.e., pygal attachment), two reported early suggesting mortality as the cause of the short deployment records. Although PAT tags were programmed to transmit data around the time of premature release at a higher priority, resolution was too coarse to resolve the sequence of events causing mortality.
Leatherback turtles perform migrations that span entire ocean basins, often requiring more than a year to complete. Many PAT tags failed to report after the programmed date, particularly with longer deployments (Figure 3). Causes of PAT tag failures are unknown, but could be attributable to malfunction of the tag (i.e., release failure, programming error, or transmission failure) or to external factors that
Figure 1. Satellite-linked transmitter (PTT) attached to shoulder harness of leatherback turtle in Papua New Guinea.

22
Figure 2. PAT tag attached at pygal process of leatherback turtle in Papua New Guinea.
could impact the tag (i.e., biofouling or pressure). PAT tags were originally designed for use with large fast-moving fish species (i.e., tuna); therefore, biofouling and failure due to the effects of pressure may be more likely for tags attached to relatively slow-moving and deep-diving species such as leatherback turtles.
Fishery interaction has been considered one of the primary causes of decline for the leatherback turtle, particularly in the Pacific Ocean; however, records from telemetry deployments failed to clearly demonstrate the link. Satellite transmitters have demonstrated great variability in duration of transmissions, and shorter durations could be attributable to attachment failure or transmitter malfunction in addition to mortality. PAT tags could play a significant role in resolving these multiple causes of transmitter failure if PAT tags were able to reliably provide greater detail around the time of premature release. Presently, time-at-depth data are saved as binned data to permit storage and efficient transmission of the large volume of recorded data; however, binned data do not provide the resolution necessary to determine the cause of a premature release, and dive profile data may be necessary for determining cause of premature PAT tag release.
Unless PAT tags are able to reliably report after deployments greater than 6 months, it will be difficult to resolve the causes of satellite transmitter failure. Improvements to PAT tag design that would help resolve the nature of apparent PTT failures include1) greater reliability of PAT tag reporting and 2) greater temporal resolution of binned depth data and more sophisticated algorithms identifying a turtle mortality event.
Figure 3. Performance of PAT tags attached to leatherback turtles from 2001 to 2005. Causes of PAT tag failures are unknown.

23
e
11 Pop-up Archival Transmitting Tags andTheir Application to Loggerhead Sea TurtlSurvival Studies
Sheryan Epperly, Christopher SassEric Prince, and Carlos RiveroSoutheast Fisheries Science CenterMiami, Florida
Alan BoltenUniversity of FloridaGainesville, Florida
Jeanette WynekenFlorida Atlantic UniversityBoca Raton, Florida
Joseph FlanaganHouston ZooHouston, Texas
Craig HarmsNorth Carolina State UniversityMorehead City, North Carolina
e
o,
Pop-up archival transmitting (PAT) tags are used in survival studies. They are designed to provide information on the fate of the animal—more so than conventional satellite tags. We developed a new attachment methodology for cheloniid sea turtles. In May 2003, disabled PAT tags were attached to three approximately 50-cm straight carapace length (SCL) loggerhead turtles (Caretta caretta) of the 2000 year-class held in captivity at the NOAA Fisheries Service Galveston Laboratory. The attachments were monitored daily, photographed weekly, and removed a year later. The posterior carapace of each animal was scanned radiographically using computer-assisted tomography (CT) and the radiographs were evaluated for the long-term impact of the attachment on the underlying bone. There was no evidence of significant reaction to the attachment.
We also conducted a feasibility study of using PAT tags for a full survival study of sea turtles. After deciding that the post-hooking mortality of sea turtles likely would not be expressed in a short time, we selected the Wildlife Computers (Redmond, Washington) PAT tags because of their ability to collect data every minute, summarize the data from a long period of deployment into histograms of durations defined by the user, and transmit them after pop up. We deployed 39 tags on wild loggerhead turtles in the North Atlantic. Most had interacted with the pelagic longline fishery, but some were control turtles dipnetted from the surface. We monitored the fate of these turtles for up to a year and assessed our ability to use this technology in sea turtle studies. Over 40% of the tags remained attached until the pop-up date, indicating those animals had survived. About 30% of the tags never transmitted data, and the remainder popped up prematurely. A few premature releases were categorized as mortalities, but the fate of most of the premature releases could not be determined.
Last, we combined sea turtle data with data from PAT-tagged pelagic fish and grouper and evaluated tag performance over three generations of Wildlife Computers tags. Early performance of PAT 2 tags was relatively poor. Over 30% of the tags deployed did not transmit, and a small percentage of histograms transmitted by the remaining tags were received uncorrupted. Improvement was observed with subsequent versions of the tag, with only about 15% of the PAT 4 tags not transmitting, and a greater proportion of the histograms were received uncorrupted (Figure 1).
Figure 1. Wildlife Computers PAT tag performance on pelagic fish, grouper, and sea turtles. In total, 213 tags were deployed: 96 PAT 2s, 78 PAT 3s, and 39 PAT 4s. The expected number of time-at-depth histograms for each tag is based on the numberof days at large and the number of histograms produced daily. The actual number received is expressed as a proportion of thetotal expected. Note that it is possible to receive more than oncopy of a particular histogram and, for short deployments, the actual number received may exceed the total expected.
�
���
���
���
���
���
���
���
���
���
���
��� ��� ��� ��� ����� ������������������������
�����������
������������
������������
����������������
�����������
����������������
�����������
����������������
������������������������������������������������������
���
����
����
����
����

24
12 Combined Use of PAT and SPOT Tags to Study Three-Dimensional Habitat Use Patterns of Shortfin MakoSharks
Suzanne Kohin and David HoltsSouthwest Fisheries Science CenterLa Jolla, California
We tagged shortfin mako sharks (Isurus oxyrinchus) with both pop-up archival transmitting (PAT) tags and satellite-linked transmitting tags (Smart Position or Temperature Transmitting tags, or SPOT tags, Wildlife Computers, Redmond, Washington) in order to study their horizontal and vertical movements. PAT tags transmitted depth and temperature profiles, and depth and temperature frequency histograms collected during 4-hour periods providing information on vertical habitat preferences. Without including ancillary information such as sea surface temperature (SST), geolocation estimates from PAT tags are unsatisfactory for fine-scale movement information. Therefore, SPOT tags, mounted on the first dorsal fin of the sharks, transmitted when the fin broke the surface of the water. High-quality locations (classes 1, 2, and 3) were obtained from Argos satellites for each shark nearly every day and frequently several times each day.
Figure 1 demonstrates the track of a shortfin mako shark carrying both tags for a period of 45 days. Double tagging has enabled us to obtain accurate horizontal movement information to characterize the essential habitats of these highly migratory sharks. In addition, the accurate locations obtained from the Argos-linked tags are being used to improve light-based geolocation algorithms currently in development by several research groups. The data were combined by fitting a curvilinear model to the derived locations in order to estimate each shark’s position during each 4-hour period. Tracks were plotted in three dimensions using ArcView GIS software (ESRI, Redlands, California) with maximum depths and water temperature profiles shown in the vertical dimension. When archiving data into 4-hour bins, PAT tag battery failure occurred before all binned data could be transmitted when deployments exceeded approximately a month. Hence, this technique of examining three-dimensional habitat preferences was most effective when deployments were relatively short, such that the majority of the binned water column profile data were available.
Figure 1. Movements of a shortfin mako shark double tagged with a radio-transmitting, satellite-linked position tag and a pop-up archival tag off the coast of southern California and Baja California, Mexico.

25
We have had great success using satellite-linked tags on sharks, in part due to a specially designed tagging cradle used to immobilize the sharks during tag attachment. PAT tags are anchored with nylon anchors near the base of the first dorsal fin and loosely secured with a cable tie around the stalk of the tag (see Figures 2 and 3). PAT tags attached in this manner have remained on sharks up to 9 months. SPOT tags are secured with three nylon bolts through the dorsal fin and, in most cases, have provided locations for well over a year.
Figure 2. Researchers onboard a research vessel tagging a shark with PAT and SPOT tags.
Figure 3. The anchoring hardware used to attach the PAT and SPOT tags to the sharks.

26
13Shark Research in the Gulfof Alaska with Satellite, Sonic, and Archival Tags
Dean L. CourtneyAlaska Fisheries Science CenterJuneau, Alaska
Lee HulbertAlaska Department of Fish and Game Juneau, Alaska
The Auke Bay Laboratory has used satellite, sonic, and archival electronic tags to study the ecological role and life history of the Pacific sleeper shark (Somniousus pacificus), salmon shark (Lamna ditropi), and spiny dogfish (Squalus acanthias) in Alaskan waters. Electronic tags can be programmed to continuously record temperature and depth. Satellite tags transmit to polar orbiting satellites when the tagged animal is at the surface or after the tag has detached from the animal at a preprogrammed time. Sonic tags transmit to hydrophones deployed remotely in an array or manually from a vessel that follows tagged animals. Archival tags retain data onboard and must be physically recovered to retrieve data.
Satellite tags were attached externally to the dorsal region of 36 Pacific sleeper sharks and 16 salmon sharks in the Gulf of Alaska and Prince William Sound during 2002 and 2003 (Figure 1). Movement or depth data have been recovered from 24 satellite-tagged Pacific sleeper sharks. Behavior was analyzed from depth data recorded by the tags. Systematic vertical oscillations were most common (60%), followed by diel vertical migrations (25%), and irregular vertical movements (15%). Median vertical movement from 4,781 hours of recorded data from one shark was 6 km/day. Movement data have been recovered from 13 satellite-tagged salmon sharks. Up to 121 geographic locations have been recovered from a single animal. During summer, depth distribution was bimodal, with the surface (0–2 m) and the thermocline preferred. Most female salmon sharks tagged during the study left Prince William Sound and migrated south and east as Pacific salmon spawning migrations declined in autumn.
Sonic tags were surgically implanted in the abdominal cavity of 24 Pacific sleeper sharks in Chatham Strait in 2004. Thirteen sonic-tagged Pacific sleeper sharks were acoustically relocated with hydrophones deployed from a vessel in a search area of 588 km2 within a month after release. Acoustically relocated sharks were tracked at depths greater than 500 m, made horizontal movements of 6 km/day, and made vertical migrations off the bottom. Sonic-tagged sharks were not acoustically recovered with an array of hydrophones deployed within the same region 8 months after release.
Archival tags were attached externally to the dorsal fins of 88 Pacific sleeper sharks in Chatham Strait from 2003 to 2005 and surgically implanted in the abdominal cavity of 99 spiny dogfish in Yakutat Bay from 2004 to 2005 (Figure 2). Pacific sleeper sharks and spiny dogfish are occasionally encountered as bycatch in Alaskan commercial fisheries. The Auke Bay Laboratory offers a $200 reward for the return of electronic archival tags. Reward posters have been distributed to the Alaska commercial fishing industry and to the local communities where tags were released. To date, no archival tags have been recovered.
Recovery rates for satellite tags (62%), sonic tags (54%), and archival tags (0%) have been low. Possible causes for low recovery rates include shorter than expected battery life of sonic and archival tags, failed external attachments of archival and satellite tags, premature termination of satellite data transmission, limited acoustic tracking technology for sonic tags, and low interception rates of archivally tagged sharks in Alaskan commercial fisheries (Figure 3). In spite of low recovery rates, electronic tags have proved to be a valuable tool for gathering information on the geographic distribution and vertical habitat of sharks in Alaskan waters.
Figure 1. A satellite-tagged Pacific sleeper shark being released.

27
Figure 2. An archival tag attached externally to the dorsal fin of a Pacific sleeper shark.
Figure 3. Tracking records for some of the sleeper sharks originally tagged with sonic tags in the Chatham Strait.

28
14 PSAT Performance and Metadata Analysis Project
Michael Musyl, Geoff Arnold,Michael Domeier, Molly Lutcavage, Lianne McNaughton, Yonat Swimmer,and Steve WilsonPacific Islands Fisheries Science CenterJoint Institute for Marine and Atmospheric ResearchHonolulu, Hawaii
Richard W. BrillNortheast Fisheries Science CenterVirginia Institute of Marine ScienceGloucester Point, Virginia
The purpose of this study is to explore failure (or conversely success) scenarios in pop-up satellite archival tags (PSATs) attached to pelagic fish, sharks, and turtles. As an example, of 121 PSATs attached to sharks, billfish, and tuna in Hawaii, 71 (or 60%, rounded) reported data with 40% of the tags listed as “nonreporters” (namely, nonreporting is not synonymous with mortality). Specifically, the study is designed to look for explanatory variables in the context of PSAT retention rates, percentage retrieved satellite data (i.e., depth, temperature, or geolocations), and tag failure. By examining several factors and information about PSATs attached to vastly different pelagic species, it is anticipated that certain patterns or commonalties may emerge to help improve our understanding of attachment methodologies, selection of target species, and experimental design. It is anticipated that this study will examine information from over 1,000 PSATs. Information derived from this study will allow an unprecedented and critical appraisal of the overall efficacy of the technology.

29
15 Utilizing Radiotelemetry to Investigate Passage Behavior and Survival of Juvenile Salmonids in theColumbia River Basin
Gordon A. Axel, Eric E. Hockersmith, Byron L. Iverson, Samuel L. Rambo, Darren A. Ogden, and Douglas B. DeyNorthwest Fisheries Science CenterSeattle, Washington
A primary focus of recovery efforts for depressed salmonid stocks has been assessing and improving fish passage conditions at hydroelectric projects and through their reservoirs. Since the listing of Columbia River basin salmonids under the Endangered Species Act, juvenile salmonid passage and survival studies at Lower Monumental, Ice Harbor, and McNary dams have been conducted to make informed decisions in the best interest of the stocks (Figure 1).
Figure 1. Locations of the hydroelectric facilities on the Snake and Columbia rivers.
Over the course of the last 10 years, we have improved the detection efficiency of our telemetry receivers, thanks in large part to the designs created by RF Engineering (Lynnwood, Washington). Unlike other telemetry receivers currently being used to track fish, the NMFS 30 megahertz (MHz) multichannel receiver detects amplitude modulated (AM) pulse-coded carrier frequency signals on nine channels simultaneously without using digital signal processing (DSP) technology. Each channel is optimized for wide dynamic range and high adjacent channel rejection, and provides excellent sensitivity. Once a tag is detected, the receiver decodes the signal to determine which individual tag sent the signal. The receiver then records one lineof data to a local file containing the time stamp of the detection, the channel and code that together uniquely identify the fish, and power (signal strength).
In 2003, we began to design a wireless network for data acquisition andmanagement. The original network consisted of FreeWave 900-MHz Wireless Data Transceivers (FreeWave Technologies, Boulder, Colorado)that were connected to our telemetry receivers. This configuration allowed a single person to download more than 50 telemetry sites within the constraints of an 8-hour work day (approximately 140 miles of study area). However, the 900-MHz system had limited range and did not allow for automated downloading. During 2004 and 2005 we changed to the airBridge TOTAL 2.4-GHz client (SmartBridge, San Jose,California). Powered through the use of an Ethernet cable, this unit has higher receiver sensitivity and rugged weatherproof design, and provides error-free data transfer with auto-fallback data rate for long-distance communication in noisy environments.

30
Currently, we are pursuing a smaller radio transmitter that will enable us to tag a larger portion of the total population. When we began tagging juveniles in 1997, we used a 1.8-g tag. In 2005, our tags weighed 0.9 g. Limitations on tag size include the overall output of the tag and the battery life required for such output. In order to provide complete detection of juvenile salmonids through the study area, we require a battery life of 10 days. We are examining the use of different potting substances to decrease the weight of the tag anways to decrease the length of the antenna that trails behind the animal as it swims. In addition, we are also investigating a transition from an AM transmitter to a frequency modulated (FM) transmitter. With a slight modification to our current RF receiver board, we will be able to detect and code an FM tag. This modificatiowill substantially increase the number of individual tagcodes and reduce the power consumption of our currentag, thus allowing for a smaller, more efficient juvenile RF tag. Because FM tags would require less power to produce the same output and tag life that we currently need, we would be able to use a smaller battery and reduce the tag weight by one-third.
Our electronics technicians are developing quarter-wave two and three element receiving antennas. Theseantennas will reduce antenna size by 50%, while keepithe antenna tuned to our carrier frequency of 30 MHz. This will increase antennas’ versatility and durability. For underwater applications, the electronics shop is developing a dual plane dipole antenna (Figure 2). This antenna will increase the number of detections by allowing detections in both horizontal and vertical planes.
d
n t
ng
Figure 2. Diagram of the detection field of the antenna attached to the upstream face of the dam demonstrates the difference between radiation patterns of current antennas used for radiotelemetry work with salmonids and the new dipole antenna being developed.
While modifications to our antennas and receivers will be helpful, data communications efficiency is paramount to the success of the juvenile salmonid radiotelemetry studies. The current data communication is done via RS-232 serial port. We are investigating a transition from RS-232 to Ethernet that will provide a minimum of 10 megabits per second of data transfer, thus improving network reliability and speed. This will allow us to download from receivers several times daily and receive site reports that will provide the electronics staff with the information necessary to keep the telemetry receivers running at their optimal capabilities.
With recent technological enhancements, radiotelemetry will continue to provide critical information on passage and survival for juvenile salmonids at hydroelectric dams and through their reservoirs. As we take advantage of these enhancements, we will be able to improve our assessments of the stocks and determine the best course of action to recover, conserve, and manage endangered and threatened salmonids and their habitats.

31
16 Automated Telemetry Data Retrieval and Organization
Brian J. Burke, Bruce F. Jonasson,Eric E. Hockersmith, Kinsey E. Frick, Gordon A. Axel, Byron L. Iverson, Samuel L. Rambo, Mark A. Kaminski,and Ron L. HelgesonNorthwest Fisheries Science CenterSeattle, Washington
Whether using remotely sensed tags for small-scale animal movement studies or large-scale survival and behavioral analyses, data retrieval and organization are often the most time-consuming and technically challenging aspects of a telemetry research project. Furthermore, the complexity and quantity of telemetry data can make analysis and interpretation difficult. Using a radiotelemetry study of juvenile salmonid passage and survival as an example, we describe steps one can take to automate much of this process, increasing overall project productivity as well as data accuracy and retrieval reliability.
From 2 May to 15 July 2005, we radio-tagged and released almost 15,000 juvenile salmonids in the Snake River and tracked their downstream migration through the hydropower system, generating over 4 gigabytes of raw data. Release locations ranged from the Ice Harbor Dam tailrace to the forebay of Lower Monumental Dam, a distance of about 60 km. We collected positional data using an array of 74 stationary radiotelemetry receivers distributed within a 120-km reach of the lower Snake and mid-Columbia rivers (Figure 1).
Figure 1. A typical stationary radiotelemetry site, near McNary Dam on the Columbia River. An antenna and two solar panels provide power to the radiotelemetry receiver located in the cabinet under the bottom solar panel.
We released tags on nine separate frequencies, and each of our stationary receivers was programmed to listen for all frequencies simultaneously. When a tag was detected, the receiver decoded the signal and recorded one line of data to a local file containing the time stamp of the detection, the channel and code (that together uniquely identify the fish), and power (signal strength) recorded in a hexadecimal format. This data collection sequence is common to most telemetry studies.
Receivers grouped in the same geographical area, such as a dam, were networked to a local computer using wireless Ethernet radios. The computer was connected to the Internet, allowing access to the receivers and their data from anywhere with an Internet connection (Figure 2). Files were automatically downloaded from the receivers using a program called Tracker2. This program was produced via contract by the White Salmon Group (White Salmon, Washington) to help organize the downloading and maintenance of radiotelemetry receivers. On a preset schedule, Tracker2 contacted each receiver, downloaded the current file, reset the receiver’s clock (to maintain consistency between

32
receivers), and cleared the memory of the receiver. In addition to automated downloading, we were able to contact each receiver directly using Tracker2 for diagnostics.
Each morning, we collated all the files from the previousday and sent them to a local server via file transfer protocol (FTP). To help accomplish this task, we used an FTP program, FTPShell, which allowed 1) a script to send the appropriate files (using its own native scriptinglanguage) and 2) scheduling scripts so that file transfers could be done automatically.
Once all the files for a given day were stored on our FTP server (ftp.afsc.noaa.gov), we transferred them to the Linux server that runs our Oracle database. We used a script scheduling capability in Linux to deal with the files and the data. Each file was converted from hexadecimal format to ASCII text (using a C program) and loaded into a temporary table in Oracle using sqlldr,an Oracle bulk data loading program. Filters were then applied to the data with Procedural Language/Structured Query Language (PL/SQL) code, which sorted out the potentially informational records from theobvious noise records, associated tag detections with theappropriate release record, and flagged any duplicate records. By using one piece of code stored in the database, we ensured that all data were treated equally (i.e., the exact same “rules” were applied to all data), increasing data quality. Furthermore, if we decided to change the rules, a simple alteration of the PL/SQL codeand rerunning the PL/SQL program was all that was necessary.
We then summarized the data, again using PL/SQL, and generated reports specifying the content of the files received that day. These reports were sent via e-mail to a list of recipients specific to each type of data. For example, the reports associated with tagging and release events were sent to one group of researchers while a report describing receiver diagnostics was sent to another group of researchers. These e-mail lists were maintained on the server and used a script written in Perl. All processing, receiver diagnostics, and detection summary reports were complete and e-mailed by 7 AM daily.
Occasionally difficulties arose with some of these automated tasks. Sometimes a server would be inadvertently shut down, or a script might encounter an error while running. When this occurred, we were alerted to the failure either by the contents of the reportswe received or by specific system error e-mail reports. Sometimes an error simply meant rerunning a script; other times it meant checking a list of files or a receiver in the field for troubleshooting. However, the delays caused by these events were minor compared to the amount of time necessary to run a project of this size without the use of automation.
Automation of remote data retrieval, filtering, and summarization ensured that we addressed problems with receivers, such as a loss of power, in a timely manner and that abnormal fish behavior could be recognized in season. This timely supply of information can often drive the schedule for tagging additional fish or receiver maintenance and repair, reducing the downtime of receivers, and increasing the efficiency and success of the researchers’ efforts. Moreover, any or all of these steps can be modified to fit individual research projects, regardless of scope or tagging methodology. As with most aspects of research, some foresight and initial time investment can ultimately result in large savings of time and money, as well as an increase in data quality.
Figure 2. The wireless arrangement for one receiver-antenna combination (not shown) installed on the on the deck of the McNary Dam. All of the receivers are connected to a local computer, which can be accessed through the Internet.

33
17 Failure Modes of Dorsal Fin-Mounted Small Cetacean Telemetry Tags
Aleta A. HohnSoutheast Fisheries Science CenterBeaufort, North Carolina
M. Bradley HansonNorthwest Fisheries Science CenterSeattle, Washington
Forrest Townsend and Frank DeckertTracPacFort Walton Beach, Florida
Tiu SimiläNORCA (Norwegian killer whale project)Straumsjoen, Nordland, Norway
Most deployments of dorsal fin–mounted telemetry tags have not provided location information for their entire expected service life. However, the reasons for these premature failures could not be discerned because these problems could have been due to multiple factors. As a result, efforts to correct these problems have been confounded. Although several researchers have noted or alluded to causes of telemetry system failures, none designed their studies to attempt to determine the specific causes.
We assessed the failure modes of small cetacean telemetry tags by deploying paired tags, usually an Argos platform transmitter terminal (PTT) and a very high frequency (VHF) transmitter, and obtaining periodic opportunistic and dedicated resighting efforts of these animals to the extent possible. Tags were deployed on 7 Dall’s porpoises (Phocoenoides dalli), 18 harbor porpoises (Phocoena phocoena), 28 bottlenose dolphins (Tursiops truncates), and 7 killer whales (Orcinus orca). We used results from these observations and other datato discern failure modes such that iterative modifications could be made to mitigate perceived telemetry problems to increase durations of monitoring (Figure 1). The iterative design modifications were intended to reduce tag-generated drag, reduce skin contact, increase fin cooling, and incorporate flotation material so the tag could be recovered to better assess system failures.
For 23 of 60 deployments, relocations or resightings allowed assessment of the attachment or hardware condition. Fourteen deployments could be monitored for the expected service life of at least one of the transmitters. Although many instances of attachment component failures were likely responsible for signal loss, multiple deployments had documented or diagnosed hardware component failures. Attachment component failures included breakage of the attachment pins or tag housing, and tissue breakdown resulting in pinoutmigration. Hardware problems included faulty saltwater switches,antennas grounding out on the dorsal fins, and antenna breakage. For bottlenose dolphins and harbor porpoises, the two species with the most deployments and widest variety of tag designs, only in bottlenose dolphins did the signal contact duration consistently increase with tag system modifications. However, despite design modifications (Figure 2, upper photo), tag attachments for bottlenose dolphins continued to experience pin migration (Figure 2, lower photo). Although implementation of similar system modifications were made to harbor porpoise tags, durations of signal contact continued to be variable with some relatively short durations of contact and most durations not extending 6 months. Lack of resight data hampered assessment of latter harbor porpoise tag deployments.
Early signal loss is probably associated with attachment failures most likely due to rubbing behavior or antenna grounding problems. Signal loss mid-duration in the transmitter’s expected service life, while also possibly associated with attachment failures due to rubbing behavior, could also be due to pin outmigration or saltwater switch biofouling. Attachment failure due to rubbing has been, and likely continues to be, an issue for tag deployments in some species. Therefore in order to reduce rubbing behavior, tag attachments methods should try to minimize tag sensation. The trajectory of attachment pin migration in the dorsal fin tissue continues to indicate that additional efforts are needed to understand and mitigate the role of tag shape, position, or stability to minimize impact and drag-related forces to reduce tissue breakdown. A complementary effort
Brokenpins
Figure 1. Tag attachment failure due to broken pins on a bottlenose dolphin. Photo by K. Mazzarella, Nags Head Dolphin Watch.

34
to minimizing tag-related tissue damage should be developing a single point release system to reduce tissue damage associated with unsynchronized tag release.
Reductions in transmitter size are needed to decrease drag forces, attachment “footprint,” and therefore possibly associated sensation. However, because smallertags will likely remain attached for longer durations, thissize reduction cannot be made at a cost to the service life.On the contrary, service life will need to be increased. New generations of tags often require a significant redesign of various components. However, these redesigns sometimes result in reduced reliability of the transmitter or its components. More thorough testing of transmitters is required to mitigate this problem. In order to increase long-term reliability of saltwater switches and antennas, transmitter manufacturers need to make design modifications that will mitigate biofouling and increase the robustness of the antennas relative to the forces associated with drag and rubbing behavior.
As transmitter size is reduced and attachment duration increases, smaller batteries will be required to operate for extended time periods. This situation necessitates renewed efforts and new approaches to improve management of transmitter power and of signal transmission, reception, and processing to provide the highest accuracy locations with the fewest number of transmissions.
Only through a concerted effort to mitigate previously noted failure modes will the goal of consistent telemetry tag deployments lasting a year be achieved on small cetaceans.
Figure 2. A modified tag design where it was hoped that the more streamlined design would improve attachment (upper photo), but subsequent observations revealed that the pins still migrated with this design (lower photo).

35
18 Foraging Studies of Hawaiian Monk Seals Using Satellite-Linked Depth Recorders
Charles L. LittnanPacific Islands Fisheries Science Center Honolulu, Hawaii
Brent S. StewartHubbs-SeaWorld Research InstituteSan Diego, California
Nearly all of the approximately 1,300 Hawaiian monk seals (HMSs, Monachus schauinslandi) inhabit the remote Northwestern Hawaiian Islands (NWHI) in six main subpopulations. Following substantial declines in abundance after the late 1950s, the species was listed as endangered under the Endangered Species Act in 1976. Perhaps because of the poor foraging success and subsequent poor survival of juveniles, their numbers are declining overall. A comprehensive understanding of the diet and foraging habitats and patterns has been identified as a key component for successful conservation of monk seals. Consequently, from 1996 through 2004, the movements and diving behaviors of 157 seals were documented throughout the Hawaiian Islands Archipelago (HIA) using satellite-linked depth recorders (SDRs, Wildlife Computers SDR-T16s, Redmond, Washington) attached to the dorsal pelage (Figure 1). The primary objectives of these studies were to characterize the marine and terrestrial habitat requirements of HMSs throughout their range and compare differences in foraging habitat and behavior between sex or age-classes and subpopulations to better understand how resource availability and foraging success may affect HMS demography. We summarize those data here and evaluate the null hypothesis that foraging patterns did not vary with age and sex of the seals or among colonies.
Figure 1. Hawaiian monk seals were tagged with satellite-linked depth recorders to monitor their movements and diving behaviors. This photo shows an adult male monk seal with a satellite tag attached to its dorsal pelage.
Seals in the NWHI foraged extensively within barrier reefs and on the slopes of reefs and islands at all colony sites, but their foraging habitats also ranged widely to seamounts and submerged reefs and banks along the HIA submarine ridge (Figure 2). Most dives were less than 150-m deep, though some exceeded 550 m. Foraging patterns varied substantially with age and sex of seals and among colonies. In the NWHI, foraging ranges of seals increased from the eastern colony at French Frigate Shoals to the colony at the western end of the HIA at Kure Atoll.
Seals in the Main Hawaiian Islands (MHI) foraged in shallow habitats closer to haul-out sites compared with seals in the NWHI. Most locations were within the 200-m bathymetry contour and most dives of all seals were less than 60 m, though some had deeper modes at between 80 and 160 m and two seals exceeded 200 m. Dive durations generally lasted between 6 and 10 minutes. These data suggest that there may be fundamental differences in prey abundance or community

36
Figure 2. Foraging locations of 147 monk seals from six subpopulations in the Northwestern Hawaiian Islands. Satellite tracking showed that monk seals used much of the benthic habitat, including atolls, slopes, and seamounts. Numbered areas indicate atolls, islands, or known seamounts.
dynamics among colonies but particularly between the NWHI and the MHI. These differences may be limiting population recovery of monk seals in the NWHI but are adequate to support population growth in the MHI (Figure 3).
The current SDR technology has provided valuable information on the foraging behavior of monk seals on a course scale (i.e., intra-atoll movement). However, there is a great need to develop and deploy instruments that can record foraging movements on a finer scale to better assess dive behavior, habitat use, and potential competition within and between sex and age-classes. Current technology relying on the estimation of location using the Argos satellite system is limited by the much reduced frequency of satellite passes near the equator as well as the behavior of the animals. Much of the bathymetric data being collected is at a resolution of 5-m grid spacing. To make effective use of these maps for studying monk seal habitat use, we would need a location resolution of 10- to 25-m accuracy from the seals. It is likely that new GPS technology will be the most reliable way to monitor monk seal movements in the future.
Figure 3. The calculated 95% and 50% probability distributions representing the overall habitats used by three monks seals in the MHI. The age-classes were adult (A), juvenile (J), and weaner (W), and sex categories were male (M) and female (F). Results show that monk seals forage within the 200-m bathymetry contour and tend to have relatively small ranges.

37
19 Combination of Satellite Telemetry and Molecular Genetic Analysis in the Study of Beluga Whales inthe Western Nearctic
Greg O’Corry-CroweSouthwest Fisheries Science CenterLa Jolla, California
greg.o’[email protected]
Robert SuydamNorth Slope BoroughDepartment of Wildlife ManagementBarrow, Alaska
Jack OrrDepartment of Fisheries and Oceans Canada Winnipeg, Manitoba
Lloyd Lowry and Kathy FrostUniversity of Alaska—FairbanksFairbanks, Alaska
Dennis LitovkaChukotTINROAnadyr, Chukotka, Russia
Rod HobbsAlaska Fisheries Science CenterSeattle, Washington
The application of satellite telemetry to highly inaccessible species such as arctic marine mammals has revolutionized the study of their movement patterns and foraging behavior. We report on a unique approach that combines satellite telemetry and molecular genetic analysis to describe the movements, foraging ecology, dispersal patterns, and population structure of beluga whales (Delphinapterus
leucas) in the Alaskan, Russian, and Canadian arctic. The polar environment limits tag deployment primarily to the summer months and typically curtails transmissions to much less than one year. Ice conditions also limit sampling opportunities for genetic analysis to a number of discrete coastal areas in spring and summer.
The genetic analysis of 1,200 tissue samples collected at the ice edge in spring and along the coast in summer resolved population structure and identified separate stocks of beluga whales in the western Nearctic, as well as reconstructing spring migration routes of these stocks (Figure 1). The deployment of satellite tags at a number of these same coastal sites in the summer months has added to our knowledge of movements and provided unique insights into beluga dive behavior and foraging ecology. Telemetry enabled us to reconstruct the remainder of the annual migration pathways of a number of stocks and revealed that distinct stocks often overlapped in space if not in time. The integration of the telemetry and genetic findings with traditional ecological knowledge and aerial and shore-based surveys is a powerful tool in designing effective management policies for this species.
Figure 1. To study movements and dispersal patterns of beluga whales in the Alaskan, Russian, and Canadian arctic, whales were tagged with satellite tags. The map shows the movements of the tagged whales.

38
20 Documenting Elephant Seal Movement with a Geographic Location, Time-Depth Recording Archival Tag
Robert L. DeLong and Sharon MelinAlaska Fisheries Science CenterSeattle, Washington
Brent S. StewartHubbs-SeaWorld Research InstituteSan Diego, California
Roger D. HillWildlife ComputersRedmond, Washington
In 1989 we developed and tested a microprocessor event recorder to document long-distance marine animal migrations. The recorder contained 256 K of memory, a clock, and a control circuit to operate the recorder that recorded time, sea surface temperature (SST), sea surface light intensity, and pressure. The recorder was housed in a columnar, titanium pressure housing. We deployed these dive recorders on adult male northern elephant seals (Mirounga angustirostris) at the end of the breeding season and recovered the recorders 4 months later when the animals returned to land to molt. With the recorded data, we were able to obtain a single point estimate of animal location each day and chart the migration of animals from the California Channel Islands to the Northern Gulf of Alaska and their return to the Channel Islands(Figure 1).
The derivation of animal location has been described. Essentially measurements of surface light intensity are used to construct the day length for each day the animal is at sea. From light-level measurements, estimates of civil twilight, day length, and local apparent noon are calculated; these data are used to estimate a latitude and longitude. The method does not work at high latitudes in conditions of continuous daylight or darkness. The method is also prone to errors during 15 days on either side of the vernal and autumnal equinox. During these periods we compared recorded sea surface temperatures to recorded SST summaries of blended analyses from satellite, shipboard, and buoy measurements to obtain the best estimate of animal location.
This same technology has been used to assess migration of other marine mammals and is now used on pop-up tags to track large pelagic fish.
Figure 1. To document long-distance marine animal migrations, dive recorders were deployed on adult male northern elephant seals. Using this technology, researchers were able to monitor the locations of the tagged seals and show distinct double migrations for males and females.

39
21 Archival Tagging of Salmonids on the CentralCalifornia Coast
Sean A. Hayes, Ellen V. Freund,Chad V. Hanson, Morgan H. Bond,and R. Bruce MacFarlaneSouthwest Fisheries Science CenterSanta Cruz, California
Little is known about the behavior and distribution of central California coho salmon (Oncorhynchus kisutch) and steelhead (O. mykiss) during the ocean phase of their life histories. As both species are protectedby the Endangered Species Act, there is no targeted local ocean fishery and they are rarely collected by Chinook salmon (O. tschawytscha) fishery and research surveys. While this is due in part to the greater abundance of Chinook salmon and lower probability of capturing coho salmon or steelhead, it does not answer the question of ocean habitat use by these two species.
We have recently begun an archival tagging program at Scott Creek, a small central California coastal stream approximately 100 km south of San Francisco. The first phase of the program was to tag juvenile fish just prior to ocean entry. We selected one of the smallest archival loggers available (iBKrill, 13.2 × 25.4 mm, 3.2 g, Alpha Mach Inc., Mont-St.-Hilaire, Quebec), which collected temperature data in 0.5°C resolution. The tag can be applied with internal or external attachment methods. The external method currently requires a two-point attachment. Due to concerns about fish growth and drag, the tags were surgically implanted into the body cavity of juvenile fish greater than 200-mm fork length and 100-g mass (Figure 1). While it was possible
Figure 1. Implanting iBKrill temperature logger into a 220-mm juv enile salmonid. Upper photo shows tag partially inserted; lower photo shows fish after implantation and closure with surgical staples.
Figure 2. External attachment of iBKrill tag on steelhead smolt (upper) and the larger iBCod tag on steelhead (lower).
to collect wild steelhead in this size range, juvenile coho salmon rarely exceed 140 mm prior to ocean entry. A small conservation hatchery in the watershed produces juvenile steelhead and coho salmon from wild broodstock. Here, growth rate of both species was accelerated so that hatchery fish of sufficient size were available for tagging. Approximately 150 archival temperature loggers were deployed on juvenile coho salmon and steelhead just prior to ocean entry for the purposes of studying movements (limited) and thermal preferences at sea. In addition, 35 short-term, high-resolution (1- or 5-minute data collection intervals) deployments of temperature loggers were made on steelhead smolts to study estuary usage patterns (Figure 2) during the summers of 2003 and 2004. In the spring of 2002 and 2004, we also deployed external tags (Figure 2) on adult female steelhead during their return migration to sea. To date, five short-term and four long-term

40
deployment tags have been recovered, providing clear patterns of estuary and ocean thermal environments experienced by steelhead (Figure 3).
Several aspects of the study site make it ideal for archival tagging. The hatchery provides large juvenile fish and serves as a tagging laboratory. An adult fish trap and relatively small adult populations (approximately 350 returning adults per species) increase the probability of data logger recovery and enable the collection of adult steelhead during their return migration to sea for external and internal tagging purposes.
The major challenge facing archival tagging research with salmonids relates to their typically poor survival rates between life history stages. In Scott Creek, approximately 3% of smolts entering the ocean survive to return as adults, and only 4% to 6% of adult steelhead are observed returning to spawn a second time. This translates into tag recovery probabilities of roughly 1% to 5%, accounting for potential increased mortality rates associated with tagging, and probability of not recapturing the fish in the stream even if it survives to return. This drives the need for inexpensive tags since only a small percentage will ever be recovered (iBKrill is approximately $45 per tag). In addition, tags need to be small for use on juveniles and to avoid increasing mortality rates.
Currently, the most likely methods of tracking movement appear to be geolocation and comparing sea surface temperature (SST) data to tag temperature data from times when fish were known to be near the ocean surface (if depth or pressure data are recorded). The use of archival satellite tags is not a possibility due to the limited amount of time salmonids spend at or near the surface. At this point pop-up tags are not small enough for deployment on a 4-kg adult steelhead, much less a 100-g smolt. Alternatively the use of ultrasonic tags and large arrays of acoustic monitors could provide for data collection on multiple individuals. The limitations of these systems include the high cost of the arrays and limited coverage by the listening stations. Future plans include tagging juvenile coho salmon and steelhead with internal archival tags that record a time series of temperature and depth, and tagging adult steelhead with external archival tags that record a time series of temperature, depth, and light. As we are in the early stages of the project, data analysis efforts are preliminary. Clearly, a geographic information system (GIS) of representing the data will need to be implemented, one that can overlay satellite data such as SST and data collected from ships, including temperature, conductivity, salinity, chlorophyll, or depth profiles.
��
��
��
��
��
�
��
�
�������
�����
�����
�����
������ 3/15/04 ������� ������� �������������
����� May04 ����� ����� ����� ����������
Tem
pera
ture
°CTe
mpe
ratu
re °C
Figure 3. Upper plot shows partial tag records from a juvenile and an adult steelhead in the estuary just prior to and after ocean entry in March 2004. Estuary thermal data are overlayed for comparison. Lower plot shows a full year of ocean temperature environment experienced by adult steelhead.

41
22 Archival Tagging of Atka Mackerel, Pacific Cod, and Flatfish in the Aleutians, Gulf of Alaska, and Eastern Bering Sea
Dan NicholAlaska Fisheries Science CenterSeattle, Washington
Data storage tags were deployed on Atka mackerel (Pleurogrammus monopterygius), Pacific cod (Gadus macrocephalus), and several flatfish species in the eastern Bering Sea and Gulf of Alaska between 2000 and 2005. The tags, originally manufactured by Conservation Devices (model RL-42) and currently manufactured by Lotek Wireless (model LTD-1100, Newmarket, Ontario), recorded both pressure (depth) and temperature. Tags are flat sided, measuring 8 × 16 × 27 mm and weighing approximately 4.1 g. Tags were attached externally, beneath the anterior dorsal fin, using 0.5-mm stainless steel wire (Figure 1).
A total of 1,412 tags have been deployed, including 530 on Atka mackerel, 634 on Pacific cod, and 248 on flatfish. Tagged fish were captured in commercial trawl, pot, longline, and jig fisheries. A cash reward of $200 was provided as an incentive for returning tags. Thus far, recovered tags include 24 from Atka mackerel, 285 from Pacific cod, and 2 from northern rock sole (Lepidopsetta polyxystra).
The initial impetus for deployment of data storage tags was to determine whether the vertical movements of these species influenced their availability to resource assessment surveys. NMFS Alaska bottom trawl surveys are conducted during daylight hours only. Results from the Atka mackerel tags indicate clear diurnal movements with fish remaining on the bottom during nighttime and undergoing extensive vertical migrations during daytime (Figure 2). Vertical movements of Pacific cod were much more varispend most of the time closely asdaytime and nighttime.
able, although it appears individuals sociated with the bottom during both
Figure 1. Archival tagging of Atka mackerel (left) and Pacific cod (right).
Figure 2. Diurnal vertical movement pattern of Atka mackerel for a week period.
���
����
����
��
����
��
���
���
���
���
������
�
����������������

42
More recent examination of the tag data from Pacific cod documents a recuperation period after tagging. Unlike Atka mackerel and flatfish species, Pacific cod have swim bladders that can rupture during capture. Although swim bladders can be sealed within 24 hours after capture, a recuperation process, characterized by a gradual descent back to the depth of capture, usually occurs. Gradual descents can take more than 2 weeks depending on the depth cod are returning to. These descents actually represent the neutrally buoyant descent of cod after they have lost gas from the rupture. Descents are slow because the physiological process of secretion of gas into the swim bladder is slow.

43
23 Application of Electronic Data Storage Tags in Studies of Black Sea Bass and Yellowtail Flounder in the Northwest Atlantic
Joshua Moser, Gary Shepherd,Steve Cadrin, Azure Westwood,and Stacy KubisNortheast Fisheries Science CenterWoods Hole, Massachusetts
Electronic data storage tags (Lotek 1100, Figure 1, Lotek Wireless, Newmarket, Ontario) that record temperature and pressure have provided new insight into the behavior of black sea bass (Centropristis striata) and yellowtail flounder (Limanda ferruginea). Several hundred tags have been deployed in seasonal batches at predetermined locations.
Development of an experimental design is critical for a successful program. Prior to tag deployment, quality assurance testing in a pressurized container has reduced the likelihood of tag failure(Figure 1). Recovery of archived data also depends on fishermen to recapture and report tagged fish. Consequently, reward incentives and outreach programs are a critical part of these tagging programs. We have experienced lower return rates in sea bass (3.7%) relative to internal anchor tags (14.3%), while flounder returns (8.1%) have exceeded traditional Petersen tags (5.6%). Differences in predation resulting from visibility of the tag (color, possible light flashes), tag-induced mortality, tag loss, and differences in fisheries may contribute to the variable recovery rates between species (Figure 2). Results of the experiments have identified movement corridors in yellowtail flounder related to temperature, seasonal changes in temperature and depth along migratory routes in sea bass (Figure 3), and daily behaviors related to tidal cycles for both species (Figure 4). Availability of oceanographic data corresponding to the area used by tagged fish is critical for the interpretation of archived tagging data.
Suggested improvements in tag design may involve measurements of conductivity, longer battery life, and alternative attachment designs that are less invasive.
Figure 1. Lotek 1100 data storage tag (left, shown to scale against a paper clip) and a pressure chamber used for predeployment testing (right, shown to scale against a ruler).

44
Figure 2. Areas of abrasion on black sea bass (left) and yellowtail flounder (right) resulting from tags. Time at large was 355 days for black sea bass and 723 days for yellowtail flounder. Tag-induced pathologies may lead to tag loss or mortality.
������� ������� ������� ������� ��������������������
���
����
����
����
�
�����������
���
����
�� �����
Figure 3. Time series of data storage tag (DST) readings from tagged black sea bass released November 2003 in Rhode Island and recovered February 2004 in Hudson Canyon (179 miles[288.1 km] southwest of release point). Results suggest a behavioral relationship between temperature and movement.
���
�����
�
����������
���
����
����
����
Figure 4. Depth records from an archival tag deployed on a yellowtail flounder on Georges Bank indicating time on bottom and reflecting the local tidal cycle. Distinct off-bottom movements (numbered 1–5) during late evening or early morning are also shown along with a substantial change in bottom depth associated with movement (number 3).

45
24 Hypoxia-Based Habitat Compression of Tropical Pelagic Fishes
Eric D. PrinceSoutheast Fisheries Science CenterMiami, Florida
C. Phillip GoodyearNiceville, Florida
Large areas of cold, oxygen-depleted (hypoxic) waters are permanent features of the eastern tropical Pacific and Atlantic oceans, a result of intense nutrient upwelling. Here we use electronic tags to show that these cold, hypoxic strata compress the acceptable physical habitat of marlin and sailfish into a shallow surface layer, with important ecological and fisheries consequences.
Very little data exist to characterize the habitat depths of tropical pelagic billfish and tuna, even though these features are critical for monitoring population abundance. We investigated habitat depth of marlin and sailfish using pop-up satellite archival tags (PSAT). We monitored 19 billfish for an aggregate of 801 days in western North Atlantic habitats where dissolved oxygen (DO) concentrations are not limiting, and 13 billfish for an aggregate of 429 days in the eastern tropical Pacific, where hypoxic conditions are often as shallow as 25 m (Figure 1). We stratified the amount of time spent by each fish, and its deepest dive during successive 6-hour periods, into strata of less than or equal to 50 m, greater than 50 m, greater than 100 m, and greater than 200 m. Pacific billfish remained within the shallowest strata, while Atlantic billfish were much more likely to venture deeper (Figure 2). Our analyses showed markedly different vertical habitat use (highly significant p < 0.001) in the two study areas.
Figure 1. Pacific basin (blue, A) and Atlantic basin (red, B) study areas and release sites (white stars). Areas encompass horizontal displacements where electronic tags deployed on billfish sent transmissions to the Argos satellite system.
The spatial extents of acceptable habitats for some estuarine and shallow demersal reef fishes are known to respond to variations in DO. Our findings show this phenomenon also exists at a much larger scale for pelagic fishes in the tropical oceans. In our Pacific study area, DO levels of 1.5 ml/l occur at about 75 m and this depth appears to form the lower threshold of habitat use for our Pacific billfish (Figure 3). Conversely, DO rarely declined below 3.5 ml/l and did not appear to constrain vertical habitat use of our Atlantic marlin or sailfish(Figure 3). The extremely shallow depth of acceptable habitat in the Pacific study area arising from nutrient upwelling in the region also restricts this highly productive environment to the very near surface. We feel that this habitat compression facilitates closer physical proximity of predator and prey in the same habitat, which would provide enhanced foraging opportunities that may contribute to larger average sizes of apex predators.

We have discovered strong quantitative evidence that the depth of the acceptable habitat for billfish is shallower in our eastern Pacific study area than the western North Atlantic. We contend that this difference is a consequence of the cold, hypoxic water underlying the shallow thermocline in the eastern Pacific, not present in the western North Atlantic. The same environmental features that limit acceptable habitat to a very shallow layer also make the fishes more vulnerable to exploitation, as evidenced by high catches of tropical pelagic tuna in these areas. Where the habitat is compressed into a shallow surface layer, fish are fully exposed to highly efficient surface gears such as purse seines—a combination that can threaten resource productivity and sustainability. Many of these species are already fully exploited or overfished.
�������������� �����������������
���
�����
����
����
≤��
���
���
��
���
Figure 2. Proportion of (A) time at depth and (B) proportion of records with dives to depth for four depth strata (≤50 m, >50 m, >100 m, and >200 m) in Atlantic (red) and Pacific (blue) basin study areas for sailfish (solid color) and marlins (hatched bars). Horizontal error bars for proportion of time at depth and proportion of records with dives at depth are ±1 standard error.
46
���
����
��
���
����
��
�
��
�
���������������� �������������
�������������� ������������������
Figure 3. (A) Temperature (°C), (B) dissolved oxygen (ml/l), (C) salinity (ppt), and (D) chlorophyll (μg/l), profiles derived from 1998 and 2001 World Ocean Atlas data for the Atlantic (red) and Pacific (blue) study areas. Temperature, dissolved oxygen, and salinity data are means, and horizontal error bars are ±1 standard deviation. Chlorophyll data are medians, and horizontal error bars are for the 10th and 90th percentiles of the distribution of values within included cells.

47
25 Kuroshio Extension Current Bifurcation Region: A Pelagic Hotspotfor Juvenile Loggerhead Sea Turtles
Jeffrey J. Polovina, George Balazs,and Evan HowellPacific Islands Fisheries Science CenterHonolulu, Hawaii
Itaru UchidaPort of Nagoya Public AquariumMinato-ku, Nagoya, Japan
Denise ParkerPacific Islands Fisheries Science CenterJoint Institute for Marine and Atmospheric ResearchUniversity of HawaiiHonolulu, Hawaii
Peter H. DuttonSouthwest Fisheries Science CenterLa Jolla, California
Satellite telemetry of 43 juvenile loggerhead sea turtles (Caretta caretta) in the western North Pacific together with satellite remotely sensed oceanographic data identified the Kuroshio Extension Current Bifurcation Region (KECBR) as a forage hotspot for these turtles(Figure 1). Thirty-seven of the loggerhead turtles were 1- and 2-year-olds that were hatched and reared at the Port of Nagoya Public Aquarium, while the other six were juveniles caught and released from commercial longline vessels in the central North Pacific. Argos-linked transmitters were attached to all turtles.
Figure 1. Satellite-tagged juvenile loggerhead sea turtles.
We used satellite remotely sensed sea surface height and ocean color data to examine the turtles’ ocean habitat. We tried several approaches to link oceanographic data with turtle position and movement data. To examine seasonal links, quarterly histograms of the latitude-frequency distribution of all turtles were combined with mean geostrophic velocity and surface chlorophyll as functions of latitude. To examine fine-scale use of habitat features, we used overlays of turtle tracks and satellite imagery.
The results indicated that in the KECBR juvenile loggerhead turtles resided in Kuroshio Extension Current (KEC) meanders and the associated anticyclonic (warm core) and cyclonic (cold core) eddies during the fall, winter, and spring when the KEC water contains high surface chlorophyll. Turtles often remained at a specific feature for several months. However, in the summer when the KEC waters become vertically stratified and surface chlorophyll levels were low, the turtles moved north up to 600 km from the main axis of KEC to the Transition Zone Chlorophyll Front (TZCF).
In some instances, the loggerhead sea turtles swam against geostrophic currents, and seasonally all turtles moved north and south across the strong zonal flow. Loggerhead sea turtles traveling westward in the KECBR had their directed westward movement reduced 50% by the opposing current, while those traveling eastward exhibited an increase in directed zonal movement. It appears, therefore, that these relatively weak-swimming juvenile loggerhead sea turtles are not passive drifters

48
in a major ocean current but are able to move east, west, north, and south through this very energetic and complex habitat (Figure 2).
These results indicate that oceanic regions, specifically the KECBR, represent an important juvenile forage habitat for this threatened species. Interannual and decadal changes in productivity of the KECBR may be important to the species’ population dynamics. Further, conservation efforts should focus on identifying and reducing threats to the survival of loggerhead sea turtles in the KECBR.
Figure 2. Overlays of migration records from (A) October 2003, (B) November 2003, (C) December 2003, and (D) January 2004 of satellite-tagged juvenile loggerhead sea turtles and satellite imagery show that the turtles were not drifting with the major ocean current, but actively swimming.

49
26Merging Satellite Telemetry with Oceanographic and Archival Tag Data to Assess Foraging Ecologyof Alaskan Pinnipeds
Jeremy T. Sterling, Rolf Ream,Brian S. Fadely, and Tom GelattAlaska Fisheries Science CenterSeattle, Washington
We report on the progress, advantages, and challenges of merging satellite telemetry, archival tag, and oceanographic data for ecosystem applications. Since 1990, the Alaska Ecosystems Program has used satellite transmitters or satellite dive recorders, sometimes in combination with archival tags (time-depth recorders), to record movements and diving patterns of 260 northern fur seals (Callorhinus ursinus) and 154 Steller sea lions (Eumetopias jubatus) (Figure 1).
Subsets of the movement and diving data have been merged with remotely sensed and directly observed environmental data. These efforts have advanced our understanding of the foraging ecology of these animals and have resulted in the identification of oceanographic processes that appear to influence at-sea behavior. However, locating, acquiring, formatting, processing, and merging environmental data with movement and diving data for analysis has been difficult. Some of the challenges include integration of environmental data that differs between northern fur seals and Steller sea lions, Argos location error problems when interpreting Steller sea lion movements compared to northern fur seal movements, long-term deployments (>1 year), and coordinating the efforts of multiple groups processing the same information without reinventing the wheel. Possible solutions include increased spatial and temporal overlap using autonomous underwater vehicles, drifter buoys, small-scale ship surveys, and onboard environmental sampling; evaluating both “constructive” and “destructive” Argos location filtering techniques; applying software modules for all filtering techniques; using GPS tags; experimenting with new adhesives, which may increase flexibility and durability and decrease application time; and utilizing remote-sensing or animal-tracking users group to share processed remote-sensing data.
Figure 1. Steller seal lion foraging location, surface chlorophyll a, and geostrophic vectors. Results show merged altimetry data Colorado Center for Astrodynamics Research (CCAR) ¼°–geostrophic vectors and Moderate Resolution Imaging Spectroradiometer (MODIS)4.89 km2 surface chlorophyll a.
165°W
160°W
160°W
155°W
155°W
52°N
52°N
54°N
54°N
56°N
56°N
58°N
58°N
Kodiak IslandGeostrophic vectors (cm/s)
� 0.2–2.5
� 2.6–5.0
� 5.1–7.5
� 7.6–10.0
� 10.1–12.5
� 12.6–15.0
� 15.1–17.5
� 17.6–20.0
� 20.1–22.5
� 22.6–25.0
0 100 20050 km
100 meters
Surface chlorophyll a
0–0.010 0.011–0.020
0.021–0.040
0.041–0.060
0.061–0.080
0.121–0.140
0.101–0.120
0.081–0.100
0.141–0.160
0.161–3.000

50
27 Spatial Patterns of Juvenile Steller Sea Lions at Sea with Respect to Corresponding Patterns of Environmental Features
Michelle E. Lander, Jeremy T. Sterling, and Brian S. FadelyAlaska Fisheries Science CenterSeattle, Washington
The decline of the western stock of Steller sea lions (Eumetopias jubatus) has been attributed to juvenile mortality, which may have been exacerbated by environmental perturbations that altered the distribution or abundance of food resources. It is necessary, therefore, to assess how juvenile Steller sea lions alter their foraging strategies in response to spatial and temporal changes of oceanographic processes, which ultimately affect the distribution of prey. Although data on the foraging behavior of juvenile Steller sea lions have been fairly detailed, little is known about the relationship between foraging locations and their associated physical and biological characteristics. For this study, a combination of satellite telemetry, remote-sensing techniques, and a geographic information system (GIS) was used to assess the foraging ecology and habitat use of juvenile Steller sea lions with respect to patterns of oceanic features (sea surface temperature, or SST, and chlorophyll a), which possibly serve as proxies for environmental processes or prey.
Because archival tags such as time-depth recorders are difficult to retrieve from Steller sea lions due to logistics associated with recapturing the animals, 75 satellite-depth recorders (SDRs, Wildlife Computers, Redmond, Washington) and 23 satellite relay data loggers (SRDLs, Sea Mammal Research Unit, SMRU, St. Andrews, Scotland) were deployed on juvenile Steller sea lions in the Aleutian Islands, Gulf of Alaska, and Washington from 2000 to 2004. Location data collected by SDRs were decoded using Satpak software (Wildlife Computers), whereas location data collected by SRDLs were decoded in a marine mammal behavior visualization system (MAMVIS) by the SMRU. In addition to location data (latitude, longitude), SDRs provided information over specified time periods for all dives (depth, duration, and time at depth) within user-defined histogram bins. The SRDLs provided similar data but provided attributes of behavior and the environment (i.e., temperature at depth) with the corresponding time, enabling us to interpolate behaviors to specific locations.
Level 3 standard mapped images of SST and chlorophyll a, which were collected by the Moderate Resolution Imaging Spectroradiometer (MODIS) instrument aboard the Terra and Aqua satellites (NASA’s EOS-AM and EOS-PM, Earth Observing Systems crossing the equator in the morning and evening, respectively), were obtained from the Goddard Earth Sciences Distributed Active Archive Center and the Ocean Color Discipline Processing System. These data products had a spatial resolution of 4.88 km and were converted to raster data grids using ArcGIS 9.0 (ESRI, Redlands, California). Temperature data provided by SRDLs were useful for ground truthing remotely sensed images of SST, which often were missing data as a result of cloud cover. Additionally, geostatistical techniques and other geoprocessing tools (ArcGIS) were used to interpolate or enhance chlorophyll images that were missing data. Landscape metrics of composition and configuration were quantified for all images using a spatial pattern analysis program and examined with respect to the distribution and behavior of Steller sea lions.
Despite the advantages provided by SRDLs, only subsamples of data were transmitted by the instruments due to bandwidth restrictions. The ongoing development of a remote release platform (Figure 1, Advanced Telemetry Systems, Isanti, Minnesota), which is a device configured to release attached equipment from marine mammals on a signal from a command unit, will greatly improve our ability to collect the satellite tags and therefore obtain detailed dive data for Steller sea lions.
Figure 1. A prototype remote release platform that is being developed by Advanced Telemetry Systems.

51
28 Critters in Context: A Method for Integrating Tag Data with Other Environmental Information
David G. FoleyJoint Institute for Marine and Atmospheric ResearchSouthwest Fisheries Science CenterPacific Grove, California
Lynn deWittSouthwest Fisheries Science CenterLa Jolla, California
Scientists and resource managers seeking oceanographic data are often confronted with a bewildering array of data sets and formats. Even with the high-quality satellite data now supplied by NOAA, NASA, and their international partners, integration and dissemination of these data sets requires significant technical infrastructure and expertise. We have developed a system to demonstrate a method for the effective integration of information retrieved from electronic tags deployed with independently derived environmental data. The rapidly expanding suite of quality hydrographic data measured by a variety of commercially marketed tags provides a unique capacity to identify oceanic habitat, but these records are inherently unable to describe the larger-scale processes that may bias local measurements. In order to place the in situ (“at critter”) measurements within the context of changing oceanic conditions, we use a Live Access Server to combine the data measured by the electronic tag placed on the animal with available satellite data and model output at temporal and spatial scales commensurate with those of the predominant regional ocean dynamics. Projects have been initiated with several tagging teams (e.g., Pacific Islands Fisheries Science Center and the Census of Marine Life’s Tagging of Pacific Pelagics program). Preliminary results from each project are presented and discussed. The emphasis for current and future work is placed on improving the Internet-based interface to improve direct involvement in the analyses by all levels of investigators; the feedback from those investigators is expected to drive these efforts.
A research team at the Environmental Research Division of the Southwest Fisheries Science Center has developed an index of habitat potential that is based on the observed range of temperatures used by electronically tagged Chinook salmon (Oncorhynchus tshawytscha) and the distribution of sea surface temperatures (SSTs) that match this range. SST values from satellites are used to extrapolate (Figure 1, upper maps) over the entire range, offering insight into the impact of
Figure 1. Potential habitat for Chinook salmon based on temperature preferences measured with electronic tags shows significant interannual variability between years (upper maps). The lower graphs illustrate how dive behavior of the salmon changed when preferred surface habitat was no longer available due to anomalously warm surface water.
� ���� ���� ���� ���� ����
����
���
���
���
���
�������� ���� ���� ����� �������� ��������� ����
���� ��� ������� �� � � �����
����
�����
������
�������
�������
�����
�����
�������
��������������
��������������
����������
����������
����������
� ���� ���� ���� ���� � ���� ���� ���� ���� � ���� ���� ���� ����
� � � � � � � � � � �
���� ��������

52
ocean environmental parameters while also providing a useful diagnostic tool for examining behavior of the animals (Figure 1, lower graphs). In this case satellite ocean-color data were used also to examine the role of surface productivity in determining the seasonal patterns of vertical movement by Chinook salmon. This work lays the foundation for describing habitat on the basis of temperature and suggests a need to incorporate other variables in the analysis. Because the tags used included no mechanism for deriving geographic position, there was no way to compare the satellite measurements with those recorded on the tags.
The availability of geographic position fundamentally changes the approach one uses to analyze the data. In addition to displaying simple overlays of tracks on SST, bathymetry, sea surface height, surface chlorophyll concentration, surface currents, and surface winds, one can also view movies and actually extract various digital data along the track of the animal for each time period available. This technique is analogous to the “drill down” capability of many geographic informationsystems (GISs), but is more appropriate to the dynamic ocean environment as it allows the animal to essentially swim through the data as they did in the actual ocean.
������������������������������������
���������������������������������
������������������������������������
������������������������������
��������
��������������
�����
����
���
�
���������������������������
� �
� �
As part of a NMFS-led effort to understand and eventually mitigate the take of olive ridley turtles (Lepidochelys olivacea) in mahi mahi (Coryphaena hippurus) longline fisheries near Costa Rica, a number of turtles were equipped with pop-up satellite archival tags (PSATs), which maintain a rough record of position based on measured light level and a fair amount of filtering and comparison with independently measured environmental parameters. These data were integrated with satellite data using the Pacific Fisheries Environmental Laboratory Live Access Server to determine what, if any, preferences could be found with respect to environmental conditions (Figure 2). A very strong preference for low chlorophyll water was discovered. The resulting probability distribution function can now be used to generate maps of likely turtle locations using satellite-based ocean-color measurements with possible application toward the mitigation of adverse interactions with the fisheries. The probability distribution function would entail a simple quantification of the relationships established inFigure 2 (e.g., by regression) and then plugging in the values to the satellite data fields for use in fisheries management models.
Figure 2. Sample output from data extractions performed for a specific leatherback turtle (Dermochelys coriacea). Environmental values of (A) chlorophyll, (B) water depth, and (C) SST are shown in red for the track of the animal, with the background “available” values shown in green. (D) Bathymetry and track are shown. Clearly the turtle demonstrates a preference for low-chlorophyll, high-visibility waters, while showing no distinct preference for SST or water depth. This result is similar to the preferences of loggerhead sea turtles (Caretta caretta) in the subtropical convergence zone as observed elsewhere. Note: This was preliminary data, which differed significantly from the final analysis.

29 Seasonal Movements and Habitat Use of Dall’s and Harbor Porpoises in the Inland and Coastal Waters of Washington State as Determined by Radiotelemetry
M. Bradley HansonNorthwest Fisheries Science CenterSeattle, Washington
Monitoring the long-term movements of small cetaceans with radiotelemetry has the potential to identify important seasonal habitat use patterns. This type of information is critical for improving stock assessments. Understanding the interactions between species and their environment is the cornerstone for assessing population viability. Determining the degree to which inherent environmental variability affects the distribution and abundance of populations compared to direct or indirect anthropogenic impacts is key to informed conservation actions.
Marine mammals, for at least some part if not all of the year, focus on foraging. In many cases their prey are highly mobile, as they respond to patchy productivity in the ocean environment. This productivity is in turn driven by complex interactions of bathymetric and hydrographic features that can cause marine habitats to vary dramatically on sometimes relatively short temporal and spatial scales.
In northern Washington and southern British Columbia, the primary static bathymetric features include five basins: 1) outer coast, 2) Strait of Juan de Fuca, 3) Haro Strait, 4) Georgia Strait, and 5) Puget Sound. Only the first four are relevant to this study on porpoise movements. Several prominent features of the 60-km wide outer coast shelf area adjacent to the entrance to the Strait of Juan de Fuca include the Juan de Fuca Canyon and La Perouse and Swiftsure banks. The Strait of Juan de Fuca, bounded by Vancouver Island and the Olympic Peninsula, links the ocean with the Georgia Strait basin (via Haro Strait) and Puget Sound. This strait gradually shallows from west to east with its most prominent feature being the north-south Victoria sill. Haro Strait/Boundary Pass is the largest channel connecting the Strait of Juan de Fuca with the Georgia Strait, running north-northeast through the San Juan Islands to the east and Vancouver and Gulf Islands to the west. This channel is deep along the eastern shore shallowing to the west in Haro Strait, and the reverse bathymetry pattern exists in Boundary Pass. The bathymetric junction between Boundary Pass and Georgia Strait is the Boundary Pass sill. Georgia Strait runs northwest from the northern San Juan Islands and is bounded by the Gulf Islands and Washington State in the southern portion and Vancouver Island and the mainland in the northern portion. The southern portion is the widest region with a deep central basin that narrows to the west of the mouth of the Fraser River. This region has two major persistent features: the California Current on the outer coast and the Fraser River plume in Georgia Strait. Several prominent ephemeral features of the system include 1) prevailing southwest winter winds and northwest summer winds, 2) outer coast spring upwelling, 3) the Juan de Fuca eddy, 4) Fraser River freshet, and 5) spring or neap tides.
In the early spring, a dramatic shift occurs in prevailing wind patterns from the winter southwesterly winds to the summer northwesterly winds. This results in coastal upwelling with cold, nutrient-rich water moving up the continental slope, including the Juan de Fuca Canyon. Some of this water mass rotates counterclockwise, creating the Juan de Fuca eddy, and some of this water mass continues moving up the Strait of Juan de Fuca until it reaches the Victoria sill. A combination of the spring freshet from the Fraser River and the spring and neap tides acts to pump this deep layer over the Victoria sill, up Haro Strait, and eventually over the Boundary Pass sill into the Strait of Georgia.
Seasonal movements of Dall’s and harbor porpoises (Phocoenoides dalli 53and Phocoena phocoena) were determined from locations of individuals

54
tagged with satellite-linked or very high frequency (VHF) transmitters for 6–19 months from 1998 to 2005. Dall’s porpoises were tagged in Haro Strait, and harbor porpoises in both western Strait of Juan de Fuca and northern San Juan Islands. In most cases locations were obtained weekly. Satellite imagery for sea surface temperature (SST) and chlorophyll a were acquired froNOAA and NASA for the periods these animals were tracked.
For both species, multiseason residency was generally observed in Haro, Juan de Fuca, and southern Georgia straits, with only seasonal use of La Perouse and Swiftsure banks. For the harbor porpoise tagged in northern San Juan Islands, during the first 3 weeks aftertagging, it moved between Presidents Channel and the deep basin in southern Georgia Strait. After mid-July itwas only relocated in the area of this deep basin, until the last location in January when it was again relocated in northern Presidents Channel. No associations were readily apparent with large-scale features detectable from remote sensing, but occurrences adjacent with tidafronts were commonly observed during tracking. For the three harbor porpoises tagged in the western and central Strait of Juan de Fuca, two moved to theLa Perouse and Swiftsure bank areas shortly after tagging, potentially associating with remnants of the Juan de Fuca eddy. Subsequently, all porpoises were located in the central Strait of Juan de Fuca, generally west of the Victoria sill, an area where a substantial cold-water feature develops in the fall (Figure 1). One
m
l
of the Dall’s porpoises displayed the largest-scale shift between regions of any of the porpoises. The timing of these movements appeared to be in association with the development of the Juan de Fuca eddy in the spring of both 1999 and 2000. In October she was relocated in the central Strait of Juan de Fuca, in the same general area where the tagged harbor porpoises were located, but in early January she returned to Haro Strait.
Bathymetric and land features of this region, in combination with oceanographic features, likely serve to provide a consistently high state of productivity, supporting both species as year-round residents. In addition, these features and conditions also likely concentrate this productivity in many of these areas resulting in high site fidelity. Of particular note was the significant movement of a tagged Dall’s porpoise to the outer coast coincident with the timing of development of the Juan de Fuca eddy in two consecutive years. Its departure is consistent with the breakdown of this feature. The Juan de Fuca eddy is likely important to other marine mammal species, such as humpback whales (Megaptera novaeangliae), which are found there in large numbers only during the summer. Although some of the tagged harbor porpoises appear to associate with the Juan de Fuca eddy, their focus in the central Strait of Juan de Fuca (as was the fall seasonal use by the Dall’s porpoise) with the substantial and relatively persistent, but yet to be described, cold-water feature, deserves further investigation.
Figure 1. Fall locations in central Strait of Juan de Fuca (left) coincided with breakdown of Juan de Fuca eddy and Strait of Juan de Fuca cold-water features (right).

55
30 Assessing Habitat Use and Movements Patternsof Coastal Sharks with an Automated Acoustic Telemetry System
John K. CarlsonSoutheast Fisheries Science CenterPanama City, Florida
Michelle Heupel and Colin SimpfendorferMote Marine LaboratorySarasota, Florida
Traditionally, tracking the movements of aquatic organisms has been accomplished by active tracking in which an individual is fitted with an acoustic transmitter, followed, and position estimated (Figure 1). This method is costly and labor intensive because active manual tracking requires relocating or tracking the tagged animal continuously for long periods. Recent advances in acoustic technology using stationary omnidirectional hydrophone arrays have allowed the collection of long-term location data without the bias and costs of potentially “chasing” animals within the study site.
Figure 1. An Atlantic sharpnose shark tagged with an ultrasonic transmitter.
Because previously active tracking of sharks has resulted in few or no relocations, an array system was employed in a study on Atlantic sharpnose (Rhizopriondon terraenovae) and blacktip (Carcharhinus limbatus) sharks to gain better data on shark associations with environmental parameters and habitat use. In 2004, 12 hydrophones (Vemco VR1, Shad Bay, Nova Scotia) were deployed in a semienclosed bay (approximately 2 × 15 km, Figure 2) in northwest Florida, and 14 sharks were tagged with ultrasonic transmitters (69.0 kilohertz) and monitored for 5 months (1 May to 30 September). Of the 153 days the array was present in the bay, Atlantic sharpnose (n = 9) and blacktip (n = 5) sharks were monitored for an average of 10.2 and 26.6 days, respectively.
Preliminary analysis using an algorithm for taking presence-absence data and converting them to averaged positions demonstrated that sharks do not respond to environmental factors (i.e., tidal or lunar phase, temperature, salinity, and dissolved oxygen) but appear to exit and enter the study site randomly. When sharks were present in the bay, spatial use varied by species. Atlantic sharpnose sharks occupied the center of the bay, adjacent to the opening, 53.3% of the time, while spending 24.8% and 21.9% at the shallower extremes, respectively. Conversely, blacktip sharks occupied the center of the bay 33.1% of the time, and the western and eastern extremes 46.1% and 20.8% of thetime, respectively. These results differ from those previously obtained for blacktip sharks for a similarly sized bay where sharks spent over 100 days in residence, and they contradict commonly held theory that sharks remain in distinct coastal areas throughout summer months. Future work will employ the use of continuous environmental data loggers that will allow for the better coupling of abiotic data and

56
movement patterns. This platform will provide a window into shark ecosystem community dynamics not previously available.
������� ������������������������
�������
������
������
������
������
����������������
��
��
Figure 2. Location of study site in Florida and VR1 stations within the bay system.

57
31 Potential Role of Electronic Tags in Stock Assessments
Richard D. MethotNorthwest Fisheries Science CenterSeattle, Washington
One of the reasons for holding this workshop is to address ways of improving stock assessments. I reviewed the definition of a stock assessment, the components of stock assessment models such as natural mortality and annual recruitment rates, and the role of electronic tag data in improving those components (see Tables 1, 2, and 3).
Catch and electronic tagsElement Data need
Discard Percent survival
Location Location of fishing effort and catch
Observer sampling Pr (find needle efficiency in haystack)
Electronic tags?
Yes
VMS
Yes
Table 1. Catch and electronic tags.
Surveys and electronic tagsElement Data need
Direct abundance Statistically designed estimate tag-recapture program
Catchability Response to sampling gear
Diel vertical migration
Response to environment (thermocline depth)
Habitat usage
Electronic tags?
Yes, but mostly withlarge N dumb tags
Yes
Yes
Yes
Yes
Table 2. Surveys and electronic tags.
Biology and electronic tagsElement Data needed
Movement Stock boundaries
Movement Diffusivity
Growth & maturation
Natural mortality Predator-prey encounters
Electronic tags?
Yes
Yes
Biochemical sensor?
Maybe?
Table 3. Biology and electronic tags.
I concluded that there is a significant, immediate opportunity to use tags to understand the effect of fish behavior on survey catchability. As well, information on scales of spatial mixing will be important as we move further into spatially explicit models. However, technology must be cheaper and more robust before statistically valid population-level studies can be designed.

58
32 How Can Pinniped Telemetry Data Fit into Fisheries Management? Examples from Steller SeaLions and Northern Fur Seals in Alaska
Brian S. Fadely, Lowell Fritz, Jeremy T. Sterling, and Rolf ReamAlaska Fisheries Science CenterSeattle, Washington
Shane CapronAlaska Regional OfficeJuneau, Alaska
A mission of NOAA Fisheries Service is to manage ocean resources use through ecosystem-based management. In addition, the Marine Mammal Protection Act and the Endangered Species Act (ESA) require conservation of marine mammals. Satellite telemetry data have provided inferences of northern fur seal (Callorhinus ursinus) (Figure 1) and endangered Steller sea lion (Eumetopias jubatus) foraging behavior
to evaluate potentially adverse competitive overlap with fisheries.
Sea lions and fur seals are sympatric over large portions of their Alaskan ranges and have declined substantially during the past 30 years. Lactating fur seals segregate in Bering Sea foraging areas in summer, and both sexes undertake winter migrations into pelagic and coastal waters of the North Pacific Ocean. In contrast Steller sea lions tend to remain largely within continental shelf areas. Both species consume pollock (Theragra chalcogramma) of sizes important to commercial fisheries. Causes of recent fur seal declines are unknown, but may be among causes hypothesized for sea lion declines. Numerous consultations under ESA of federal fishery actions off Alaska have extensively used telemetry data to infer Steller sea lion foraging needs. Fishery actions and ESA-directed conservation measures are also subject to review for environmental and social concerns under the National Environmental Policy Act (NEPA).
Figure 1. A northern fur seal with satellite tracking and dive recording instrument packages attached.
Designation of sea lion critical habitat was based in part on telemetry deployments made prior to 1993. Analyses suggesting that decreased juvenile survivorship was a proximate cause of the decline directed recent research toward investigating juvenile foraging ecology. These data were combined with information on fisheries and fish stocks to implement conservation measures aimed at halting the decline of Steller sea lions (Figure 2). Analyses progressed from examining general location and diving data summaries to analysis of distance-stratified frequencies of diving locations. Because data-logging instruments are difficult to retrieve, diving behavior was characterized using satellite-linked recorders that binned dives into 6-hour periods. The periods limited the spatial resolution to which foraging behavior could be inferred. And because recent telemetry studies addressed

59
questions about juveniles, less than ideal age and geographic coverage was available during conservation measure development. Ultimately insufficient data exist to directly link behavior with foraging success, survival, or reproductive success.
Analyses of pollock catch and biomass distributions within each foraging area from 1982 to 2002 suggest that harvest rates within areas used by lactating fur seals from St. George Island averaged four times greater than in areas used by St. Paul Island seals. During this period, seal populations on St. George declined more rapidly than those on St. Paul, but it is unknown whether this decline was related to spatial differences in fishing intensity. However, analyses conducted under NEPA found that as sea lion protection measures were implemented to reduce fish removals from critical habitat, pollock trawl fishing effort expanded northward from the Eastern Aleutian Islands into the Bering Sea and may have shifted to fur seal foraging areas. The extent of overlap may also have been affected by pollock responses to interannual oceanographic variability in bottom temperature on the eastern Bering Sea shelf.
Continuing advancements in technology and analytical methodology will improve our ability to utilize telemetry-derived pinniped data in fisheries management. Among these advancements are any combinations of technologies that provide more accurate and precise location fixes and that can deliver detailed dive profile data so as to better identify foraging trips and dive patterns, improved capture methods to deploy instruments on larger animals, and development of statistically appropriate models to evaluate foraging behavior on a population basis and to include varied data types and multiple species. Also needed are continuing discussions about how best to incorporate such models when designing or evaluating fisheries management actions. Current management structures require analyses under multiple legal processes to fully evaluate potential impacts of fisheries on marine mammal populations.
Figure 2. An adult female and yearling Steller sea lions.

60
33 Using Information from Electronic Tags for Stock Assessment of Northeast Fishery Resources
Steven Cadrin, Gary Shepherd, Tim Sheehan, Stacy Kubis, Joshua Moser, and Azure WestwoodNortheast Fisheries Science CenterWoods Hole, Massachusetts
Several research projects in the northeast United States use various types of electronic tags to study fish behavior, and results from these research efforts contribute to fishery stock assessments. The primary use of electronic tags has been to track movements of individual animals, leading to inferences of stock structure, supporting the estimation of mixing rates between adjacent stocks, and potentially contributing to estimates of stock size. The application of electronic tagging for fisheries science has traditionally been to illustrate basic aspects of life history, such as juvenile and adult habitat, vertical and horizontal movements, and home range. Such descriptive information can be used to determine appropriate structure of population dynamics models and associated sampling designs.
Information from electronic tags can also be used more directly for stock assessment and fishery management. For example, in “round-trip” movements across management boundaries (Figure 1), electronic tags have been used to evaluate mortality rates (Figure 2), effectiveness of marine protected areas, and the effect of environmental variables on seasonal movements.
One of the challenges of using electronic tags for stock assessment is the prohibitive cost of deploying tags on a representative sample of fish populations (Figure 3). As the technology advances and becomes more cost effective, we expect the role of electronic tagging in stock assessment to expand.
Figure 1. Inferred trajectory of a yellowtail flounder (Limanda ferruginea) based on depth, tidal amplitude and time of high tide derived from archival tag data, local predictions from a tidal model, and a search algorithm with distance constraints. Release and recapture positions are indicated by green and red circles, respectively. Stock area boundaries are indicated in red, and fishing closure areas are indicated in pink.
From Gröger, J. P., R. Rountree, S. X. Cadrin, A. Westwood, and S. Kubis. In press. The use of digital storage tags and tidal information to study migration patterns of yellowtail flounder [Limanda ferruginea] off New England. Can. J. Fish Aquat. Sci.

61
Figure 2. Estimates of Atlantic salmon (Salmo salar) smolt survival derived from ultrasonic telemetry receiver arrays (Vemco VR2 units, Shad Bay, Nova Scotia) that monitored migration through the Dennys River (Maine) into the Bay of Fundy and Gulf of Maine. Hatchery-reared smolts with surgically inserted ultrasonic pingers were released into the Dennys River (open-filled circle) during 2001 (n = 70), 2002 (n = 150), and 2003 (n = 150). VR2s units (solid circles) were placed throughout the system to monitor migratory dynamics and estimate migration success. Telemetry array sharing with a Canadian Department of Fisheries and Oceans telemetry study (Gilles LaCroix, St. Andrews, Canada) allowed for array coverage into the Bay of Fundy (solid lines, 2001–2002). Lower boxes represent numbers and percentages of smolts assumed dead within each zone.
Figure 3. A comparison of recaptures of many traditional tags and several archival tags related to the population distribution. Density of black sea bass (Centropristis striata) was derived from catch data reported on vessel trip reports (2002–2004). Internal anchor tag and electronic data storage tag recapture locations are shown with three red lines connecting release and recapture locations of electronic tags.

62
Based on location data from a tagged harbor porpoise (9802) and other porpoise observations in the northern San Juan Islands, boat-based line transect surveys were conducted in 1999 and 2002 in the San Juan Island section of the inland waters to improve on aerial survey estimates. Effort was increased (approximately 1,150 km) over the previous aerial line transect surveys (574 and 846 km). More important, effort was stratified to increase effort in the southern Strait of Georgia in the area the tagged animal had been tracked.
The harbor porpoise tagged in the northern San Juan Islands (9802) was relocated over a 215-day period. During this period, the porpoise’s movements were confined to a relatively small area that included only the northern San Juan Islands and the U.S. waters of the southern Strait of Georgia (Figure 1). Two harbor porpoises tagged the western Strait of Juan de Fuca were tracked for 6 months and one for 19 months. Although two of these porpoises (0103 and 0204) made initial movements to the west and northwest, by early winter all were residing in the central Strait of Juan de Fuca. The animal that was tracked for 19 months (0308) remained in the central strait region the entire time (Figure 1).
Two Dall’s porpoises tagged in Haro Strait were tracked for 180 and 378 days, respectively. The subadult male porpoise that was tracked for 180 days remained in the Haro Strait/Swanson Channel for almost the entire
34 Marine mammal stock assessments are a core mission for NMFS under the Marine Mammal Protection Act. Adequate stock assessments require
Using Location Data from accurate delineations of stock structure boundaries as well as robust Telemetry Tagged Marine estimates of population size and trends. It has been noted that many
types of data can provide information on stock structure, including Mammals to Improve distribution, population response, morphology, genetics, life history, and Stock Assessments contaminants, but each has inherent limitations. In some cases genetic data
can provide information on where delineations in population structure occur, although in others it can only indicate that additional structure exists within the population. On the West Coast of the United States, several
M. Bradley Hanson stocks of harbor porpoises (Phocoena phocoena) and one stock of Dall’s Northwest Fisheries Science Center porpoise (Phocoenoides dalli) have been delineated from genetics data. In Seattle, Washington Washington State, two stocks of harbor porpoises are currently recognized:
the Oregon/Washington coastal stock and the inland Washington stock, [email protected] with the boundary arbitrarily set between Cape Flattery and Bonilla Point,
Vancouver Island. However, recent genetic analyses suggest additional structure within the inland water stock exists but the boundaries cannot be delineated. This study used seasonal movements of individual porpoises tagged with telemetry devices to assess current boundaries and identify other potential stock boundaries. In addition, the movement of these tagged animals identified regions of higher densities where survey effort could be focused to improve stock estimates.
A combination of satellite-linked transmitter location data (latitude, longitude) and triangulations of very high frequency (VHF) transmitter signals allowed locations to be determined approximately weekly. Seventeen harbor porpoises were captured and tagged between 1998 and 2003, one from the northern San Juan Islands, and 16 in the western Strait of Juan de Fuca. The porpoise tagged in the northern San Juan Islands was tagged in June and the western Strait of Juan de Fuca animals were all tagged in early fall. Monitoring durations that exceeded 6 months were available for the one porpoise from the northern San Juan Islands and three of the porpoises in the Strait of Juan de Fuca. Eight Dall’s porpoises were tagged between 1997 and 1999, all in Haro Strait in May. Two of the porpoises had monitoring durations that exceeded 6 months.

63
.
e
���������������������
��������������
Figure 1. Locations of tagged harbor porpoises.
period. The other porpoise, an adult female, only remainedin the Haro Strait region for about a week before making an abrupt move to the outer coast off the entrance to the Strait of Juan de Fuca. She remained there until at least mid-August and by early October she was relocated in the central Strait of Juan de Fuca. In early January the animal shifted back to Haro Strait with occasional forays into the southern Strait of Georgia. The porpoise was last located offthe entrance to the Strait of Juan de Fuca in mid-May 2000, within 2 weeks of the time it had moved there the year before
Boat-based line transect surveys found large numbers of harbor porpoises concentrated in the southern Strait of Georgia, in the same general region as the locations of the tagged porpoise 9802 (Figure 2). The preliminary population estimates from the boat survey were greater than the estimate derived from aerial data, and the preliminary coefficient of variation (CV) estimates showed some reduction compared to the aerial surveys.
The small-scale movements of harbor porpoise 9802 and thconsistent observation of other porpoises in the northern
San Juan area during this period suggest limited seasonal movements for at least some porpoises in this region. In addition, the small-boat surveys confirmed the presence of a high density of porpoises in the southern Strait of Georgia.
Limited seasonal movements of the tagged harbor porpoises to the outer coast suggests that the current boundary for the inland waters and coastal stocks is accurate, but the lack of interchange between porpoises tagged in the Strait of Juan de Fuca and Strait of Georgia suggests there are potentially at least two stocks within inland waters. Although sample size is small, the locations of tagged Dall’s porpoises were consistent with the current stock definitions while their limited movements suggest additional structure.
Although sample size is limited, the movements of Dall’s porpoises are restricted to the boundaries of the stocks as defined by genetic studies. The seasonal movement of one Dall’s porpoise to coastal waters may explain why population estimates for inland waters varied widely between two consecutive surveys. In 1991 the population of Dall’s porpoises was estimated to be 3,745 (CV of 44.2%), whereas in 1996 the population estimate had decreased by over 50% to 1,545 (CV of 43.1%). While the large CVs likely account for some of the variation, some may be explained by a net movement of porpoises outside the survey area during the season these surveys are typically conducted (August). Consequently, future surveys that include some portion of the outer coast may provide more representative estimates for this species.
Data from tagged small cetaceans can assist with improving stock delineation by identifying boundaries from movements and by providing information to improve survey design data.
to yield more accurate abundance and trend
��������������������
�������������������������������������������������
��������������������������
�������
������
������
������
�������� ������� ������� ������� ������� �������
Figure 2. Weekly locations of tagged porpoises in 1999.

64
35 In the last decade, efforts have been made to incorporate information on animal movements and habitat use patterns into fish stock
Using Archival Tagging to assessment models. These efforts are accomplished in numerous Better Understand Stock ways. First, hypotheses concerning stock structure are being tested
using electronic tags. Based on electronic tag data, it is now believed Structure and to Develop that bluefin tuna (Thunnus thynnus) feeding in the Georges Bank area Habitat-Based Models for of the North Atlantic are from two separate stocks, each with different
breeding grounds. Thus, stock assessments of Atlantic bluefin tuna North Pacific Albacore are being developed to examine the North Atlantic population as two
stocks. Second, catch-per-unit effort (CPUE) indices are standardized based on habitat models developed from information on the animals’ behaviors. For example, for a longline fishery, if details of effort are
Suzanne Kohin and John Childers well documented and information is known about the preferences of Southwest Fisheries Science Center the targeted animals, it is possible to distinguish between periods when La Jolla, California fishing may be more effective depending on the time of day, the depth
of the hooks, temperature of the water column, or a number of other [email protected] environmental indices.
Behavior of pelagic fishes is difficult to observe; however, electronic tagging studies are increasingly providing information on thermal, depth, and geographic preferences of many pelagic species. Since 2001, we have been deploying implantable archival tags in juvenile north Pacific albacore tuna (Thunnus alalunga) off the west coast of the United States and northern Baja California, Mexico. The tags record water temperature, depth, light, and peritoneal temperature every minute while the fish is at liberty. Data recovered from 16 tags by the end of 2005 demonstrated that North Pacific albacore tuna inhabit waters from the surface down to a depth of 250 m during the day, but remain almost exclusively in the top 50 m at night (Figure 1). In contrast, most of the hooks of a longline fishery operating southeast of Japan fish at depths between 50 and 300 m (Figure 2). These data will be used to standardize CPUE indices of abundance from the Hawaii-based longline fishery that overlaps with the areas used by these fish.
Effective fishing effort for a given time and area will be calculated as the product of the proportion of time albacore tuna spend at a particular depth stratum and the number of hooks fishing at that depth stratum summed over all depth strata. The proportion of time spent at any given depth stratum may be calculated as a function of the absolute water temperature at depth, mixed layer temperature and depth, sea surface to ambient water temperature differential, or dissolved oxygen. At this time, we do not yet have enough electronic data to determine which factors will be the most influential in the habitat model.
A number of things should be considered when designing an electronic tagging study for habitat-based models of highly migratory fish. It is important that fishery statistics of catch and effort be collected in sufficient detail to be able to describe the effective effort. For example, for a longline fishery it may be important to know at what depth the hooks are fishing because it may be a factor of the number of hooks between floats as well as the prevailing weather and oceanographic conditions. Tagging efforts should be focused on those individuals (i.e., size or age-classes) that are selected in the fishery for which a standardized index is being developed. Tagging efforts should also be spread out to cover the entire area over which the fishery operates. And finally, as tag technology improves and a larger suite of miniaturized sensors become available, it will be important to select the appropriate sensors based on the habitat preference assumptions for the animal being studied.

65
�
����
����
����
����
����
�����
����
����
����
����
�
��� �� �� ��� ��� ����� ��� ������������
��� �����
Figure 1. Albacore tuna time-at-depth histograms, n = 2,072 days.
�
����
����
����
����
����
����
��� ��� ��� ��� ����� ������������
���������������������������������
���
����
����
����
���
Figure 2. Albacore tuna combined depth distribution of numbers 1, 3, and 7 longline hooks.
From Yano, K., H. Yamada, and T. Kosuge. 2004. Preliminary results of relationship between setting depth of tuna longline and swimming depth of Pacific bluefin tuna at the spawning grounds. Working document of the 3rd Pacific Bluefin Tuna Working Group meeting of the Interim Scientific Committee for Tuna and Tuna-like Species in the North Pacific, ISC/04/PBF-WG/06.

66
36 Atlantic bluefin tuna (Thunnus thynnus) are managed through the International Commission for the Conservation of Atlantic Tuna
Virtual Population (ICCAT). The populations in the eastern and western Atlantic have Analyses of Atlantic been managed separately since 1981. However, in 1993 ICCAT
scientists developed a two-area virtual population analysis (VPA) Bluefin Tuna that Include that suggested small interchanges between the two populations could Information from have important implications. The original two-area VPA assumed fish
movement is diffusive, that is, fish moving across the ocean “forget” Electronic Pop-up Tags where they came from. An alternative is to assume the two populations
overlap and that sojourning fish return home. Research published in 2001 fitted the “diffusion” and “overlap” VPAs to conventional tagging data and estimated interchange rates on the order of a few percent.
Clay E. Porch Recently, the results from several pop-up tagging experiments seem Southeast Fisheries Science Center to suggest that up to 40% of western bluefin tuna move into eastern Miami, Florida waters. This preliminary study explores this contention by fitting the
VPA to published data from two such [email protected]
The catch data, abundance indices, and VPA procedures employed are described in ICCAT’s Report of 2002 Atlantic Bluefin Tuna Stock Assessment Session. Release and recovery data for 22 platform transmitter terminal (PTT) and 19 pop-up archival transmitting (PAT) tags placed on bluefin tuna caught off New England appeared in two other studies. Tag recoveries were assumed to be multinomial distributed with negative loglikelihood:
��� �
������
������������� �
���� �
�������� ����
where R is the number of bluefin tuna that were tagged, cky is the number of tagged bluefin tuna that were recaptured during year y in area k, and rk is the number of tagged bluefin tuna that survived to the end of the experiment and were located in area k at the time the tags reported to the satellite. The tag attrition model used to compute r and c is described in a previously published article.
The addition of the pop-up tags had little impact on the VPA in the absence of interchange (unsurprising considering there were only 41 tags, most of which detached after a few months). The fit to the tagging data was significantly better when the interchange rates were estimated; Akaike’s Information Criterion corrected (AICc) values for the overlap, and diffusion models were 1,379 and 1,383, respectively (compared to 2,811 without interchange). The diffusion model estimated 12% of western bluefin tuna move east, whereas the overlap model estimated 2% of eastern bluefin tuna move west (i.e., the eastward moving tags had been placed on eastern bluefin tuna sojourning in the west). The overlap model provided a better fit than the diffusion model, but the difference in AICc values was not statistically compelling.
The appraisal for western bluefin tuna was less optimistic when interchange rates were estimated (Figure 1, East). The abundance of spawners (age 8 and older) in 2000 relative to the 1970 level was estimated to be 7% with the overlap model and 9% with the diffusion model (as compared to 12% with no interchange). The appraisal for eastern bluefin tuna was almost unchanged with the overlap model, but more optimistic with the diffusion model; the estimated abundance of age 8 and older group was higher for 2000 than for 1970 (Figure 1, West).
� ����
�
�����
���� � �
��������� ��
� ����� � � ���� �
� � �

There are several potential pitfalls in this analysis. One study found that tags that stayed attached to the fish remained in the west, whereas tags that detached prematurely often drifted east. Most of the tags used in the VPA that reported from the east were PTT tags, which have no means of detecting premature detachments, so it is unclear whether the tags were still attached when they reported. When the VPAs were rerun without the PTT tags the estimated interchange was much lower (about 3% eastward) and the abundance trends were similar to the case without interchange (Figure 2).
The limited coverage of the tagging data was problematic. Only adult bluefin tuna off New England were tagged. Longer deployments and extended geographic coverage would aid in identifying the most appropriate model (overlap, diffusion, or otherwise) andestimating the interchange rates. Another challenge is to reconcile the fine-scale spatiotemporal information available from the tags with the course spatiotemporal grid (two area, annual) used by the VPA. For example, should a tag that barely crosses into the east and avoids the main eastern fisheries be counted as having moved east?
In summary, the present study illustrates that even relatively few pop-up tags can provide statistically significant information on interchange rates, if not mortality. Inasmuch as the reporting rates with electronic tags tend to be high and to some extent fisheryindependent, interchange estimates are apt to be less biased than when obtained from conventional tag-recapture data. Wide geographic and temporal coverageis important when the data are used in assessment models. It would be useful to extend the VPA to use information from archival tags on the time spent in each management area.
����
����
���
�����
����
���
�����
����
Figure 1. Trends in abundance of spawning-age fish (age 8 and older) estimated by the overlap (red triangles), diffusion (blue squares), and no-interchange (black line) VPAs using the pop-up tag data.
67
���
�����
����
���
�����
����
����
����
Figure 2. Trends in abundance of spawning-age fish (age 8 and older) estimated by the diffusion VPAs with all tags (blue squares) and without the PTT tags (green circles). The black line refers to the no-interchange model.

68
37 Using Electronic Tags in Marine Mammal Stock Assessment Reports
Robyn P. Angliss and Ray OutlawAlaska Fisheries Science CenterSeattle, Washington
Section 117 of the Marine Mammal Protection Act requires that NMFS develop stock assessment reports for all marine mammals present in U.S. waters. Since marine mammal stock assessment reports were first developed in 1995, the use of electronic tagging information in the stock assessment reports has increased. Data collected from a variety of electronic tag types, including radio and satellite, are now a critical component of many stock assessment reports. Electronic tagging data are most frequently used for correcting abundance estimates for animals not observed during surveys and are used to improve our understanding of animal distribution, to aid in stock identification, and for a variety of other reasons (Figure 1). Assessments updated most recently have included new information collected from satellite tags. In order to develop the next generation of stock assessments, it will be necessary to obtain additional information from electronic tags and further develop tag technology to allow the collection of different types of information.
Figure 1. Examples of electronic tag technologies that have been used to collect data for various components used to make stock assessments.
����������������
����������
���������������
��������������������
�������
�����������������
����������������
������������
���������������������������
�
�
�
�
�
�
�
�
� � � � � � � � �
���
����
����
����
�

69
Breakout Background
Session Acoustic tags transmit their acoustic signal after receiving an interrogation pulse from a sonar source or are set to transmit their signals at a selected pulse rate. For most
Summaries studies, acoustic tags are surgically inserted into the fish. Tag size depends on the size
of the transducer, whose diameter is inversely proportional to frequency. Detection range is also inversely proportional to frequency; larger, low-frequency tags (e.g., 30
kilohertz [kHz]) may have a detection range of around 1 km while smaller higher-
Acoustic Tags frequency tags (e.g., 300 kHz) may have a detection range of less than 400 m.
Typically, the low-frequency tags are used to track larger pelagic fish and the higher-frequency tags are used in studies that require smaller tags. Acoustic tags are used in saltwater environments because sound transmits well through salt water compared to radio waves that quickly attenuate. Both portable and fixed hydrophones are used to receive the transmitted pulse signals to help determine the location of the tagged individuals. Besides location, data can be transmitted from internal sensors that record physiological parameters, depth, and swimming direction or speed.
Workgroup discussion
The first topic covered during the discussion was the type of problems that occurred with currently available acoustic-tag technologies. Researchers brought up that receiving systems are unable to decode tags from all of the different manufacturers, interference among tags was common when tracking fish in small or confined geographic areas, activation of the smaller tags was time consuming, and some tags failed to activate.
Because tags are expensive to purchase, attendees discussed having NOAA negotiate a bulk purchase price by combining the purchases for separate projects. They also raised the point that NOAA should hire an independent firm to test the tags and receivers and then write a document comparing the telemetry equipment. By combining forces, attendees hoped that they would have more power in getting the equipment manufacturers to develop features that worked better for fisheries research. These features would include a lower failure rate, specifically to reduce the number of tags that fail to activate or stop functioning shortly after activation.
In addition to discussing the pros and cons of different tag and receiving equipment, attendees discussed the importance of sharing information on attachment techniques. Attendees pointed out that it was as valuable to document what did not work as what did work for individual species. After sharing some of their experiences, attendees suggested a NOAA-sponsored Web site might be a good place for sharing tag-attachment information.
Attendees talked about needing smaller or longer-lasting tags for their research. Suggested ways of achieving these improvements were miniaturization of the different types of sensors (e.g., inactivity, temperature, or electromyogram transmitters calibrated against swim speed), and development of new battery technologies. As with all of the other tags, researchers wanted smaller and longer lasting batteries. They also suggested that being able to remotely turn the tags on and off or change pulse rates would improve power management. In addition, they discussed the need for more streamlined batteries because often the shape of available batteries produces a tag shape that does not work well with all host species.
Attendees also considered how to improve tracking results. They wanted methods that would reduce interference when tracking tagged fish in confined geographic areas. They wanted more accurate approaches for recording the three-dimensional positions of all sizes of fish and suggested adding GPS and exploring fixed beacons for

70
triangulation. Some mentioned the need for improved time synchronization among receiving systems.
Finally, attendees discussed both data acquisition and database management. They wanted to be able to communicate remotely with receivers either through wireless or cell connections to download data. They also discussed developing standardized protocols for data processing so that databases for independent studies contained similar information (e.g., receiver locations, tag code format, user information, integration of sensor and environmental data, or protocols for data processing). One person suggested that maybe this database could be included within an already existing regional database system such as Pacific Coast Ocean Observing Systems (PaCOOS).
New features researchers would like to see with acoustic tag technology included an “I have been eaten” sensor, compass and magnetic georeferencing, and ways to activate the tags based on where a tag is or a specific time or set of times. In order to increase the number of species that could be monitored with miniature acoustic tags in different habitats, another feature needed was a broader range of acoustic frequencies.
Pop-up Satellite Background
Tags The development of the Argos Data Collection System, a joint venture between France and the United States, provides complete world coverage with receivers installed onboard NOAA satellites orbiting the Earth. With this system an electronic tag could transmit stored data to this satellite system without recovering the tag. Furthermore, location of the tag would be known whenever data were transmitted.
The initial sizes of satellite tags were large and therefore could only be used with large species. Furthermore, for tags to be effective, the species need to be on the surface long enough to be detected by a passing satellite and have time to transmit the stored data. Accuracy of determining the tag’s location improves with the number of successful “uplinks” during each satellite overpass and Service Argos classifies the quality of location (class 1, 2, or 3) achieved with each fix.
To expand the number of species that could be tagged and to enable tags to be at the surface long enough to be effective, tag manufacturers designed mechanisms for releasing the tags from the animals. These pop-up tags detach from the animal at a predetermined time and float to the surface, where they then transmit the stored data to the Argos satellite system. Many variants are currently available as tag manufacturers attempt to satisfy research needs.
Workgroup discussion
The first topic covered was the type of problems that occurred with the currently available satellite and pop-up tag technologies. Attendees noted that few tags report after 6 months, long-term tag attachment is an issue, biofouling causes problems with the saltwater switch, there is a need for a wider range of sensors, and tags release prematurely yet researchers are unable to identify why.
Because tags are expensive, attendees discussed having NOAA negotiate a bulk purchase price by combining the purchases for the separate projects. Because longevity is an issue, they advocated running a group of tags through extreme temperature and pressure cycles for 1–6 months to try to determine the cause of failure. If the vendors are unwilling to do these tests, then NOAA should conduct the necessary tests or issue a contract for the work. If the failures are due to batteries, the

71
group recommended that vendors investigate alternative batteries or develop methods for recharging the batteries (e.g., using solar or current methods).
Attendees discussed, at length, premature release of tags. They suggested that in order to determine the cause of the premature releases, it would be useful to receive a detailed set of data (using a finer time scale than what is permanently stored) from the last few days before release instead of sending the initial set of stored data. They emphasized that this is important because often data are not completely uploaded by these prematurely released tags and consequently, these final critical data points are never received (or the data points are on a time scale too gross for determining what might have happened to cause the tag to release). The attendees also noted that prematurely released tags in northern latitudes keep transmitting the same data since there is only so much time for transmission. It would be useful if transmission did not always begin at the same point in the stored data.
The premature-release topic led naturally into a discussion of tag-attachment issues. The general consensus was that movement of the anchors was probably causing most of the tag losses. They commented that often an animal’s tissue was damaged by the moving anchor. Researchers then conveyed their different approaches for attaching tags (e.g., swivels or shock absorbers on the tethers). They concluded that it would be helpful if the tags were shaped more hydrodynamically and if researchers designed experiments to test attachment methods. Along these lines, they mentioned that alternatively shaped (e.g., more streamlined) batteries might make it possible to design more hydrodynamically shaped tags. Attendees also noted that smaller tags would offer more flexibility in tag-attachment techniques.
Attendees conveyed that biofouling is a problem with these long-acting tags. Biofouling interferes with tag attachment and causes problems by weighing down the pop-up tags. It also causes some tag failure as it affects the saltwater switch on some of the pop-up tags.
The group talked about alternatives for determining geolocation. The group proposed that the vendors investigate using magnetic anomalies, tidal flux, temperature at a set depth (e.g., 50 m), sea surface temperatures (SSTs), and GPS.
Software, the Argos Data Collection System, and data management were the last set of topics covered. The tag users recommended that the tag manufacturers maintain the format of outputted data spreadsheets because changes require alterations to data management tools that have already been developed. They recommended that any new information be added at the end of the data stream. They said they would like more data from Argos; one person related that often more location data were contained in the DI (or DIAG) messages than in the DS (or Dispose) messages. They wondered if more satellites would help produce more data. Finally, they conveyed the different data management tools that were available and discussed the strengths and weaknesses of applying different filters and algorithms. To avoid duplication of effort, they recommended getting NOAA support for granting permission so all of the satellite and pop-up tag researchers could use tools that are already available to some of the users.
The group also discussed new features they would like to see made available. These included a wider range of sensors. They listed recording salinity (as a measure of density), dissolved oxygen, and velocity. They also suggested for coastal species it would be useful to have a smaller tag that just transmitted its location, so it could be recovered easier. Attendees also wondered whether it was possible for the tags to only transmit when satellites were in view, which would conserve battery life.

7
Radio Tags Background
Radio tags transmit a simple pulsed signal at a selected pulse rate. Radio tags are ineffective in marine environments where the signal quickly attenuates, but they are an effective research tool in freshwater because physical obstacles, turbidity, turbulence, and thermal stratification do not affect radio waves. Furthermore, radio signals radiate through the water surface and can be detected at great distances because there is little loss of signal strength in air. Receivers can be fitted into listening stations on land, boats, or aircraft. Radio tags operate at high frequencies (20–250 megahertz [MHz]) and thus, there is little signal drift.
Theoretically, large numbers of fish can be monitored simultaneously using multiple frequencies or pulse rates. In practice, however, it is very difficult to distinguish more than four or five pulse rates on an individual frequency. Radio tags are short-term tags with their longevity depending on size of battery and pulse rate.
NOAA researchers use radio tags to investigate the life history stages of anadromous species that occur in freshwater habitats. For example, salmonids are tagged with radio tags to learn how habitat modifications have affected different populations. Small radio tags used to monitor juvenile salmonids typically operate for 1–4 weeks while larger tags used to monitor adult salmonids can continue operating up to 12 months. For salmonid research, radio tags are inserted surgically into the juveniles and inserted into the stomach of the adults. In both cases, antennas hang outside of the body.
Workgroup discussion
This workgroup included researchers working with satellite or platform transmitter terminal (PTT) tags that use radio signals to transmit their data as well as those working with traditional pulse radio tags. The first topic covered during the discussion was the type of problems encountered with the currently available tag technologies. Attendees noted that even the smallest tags are still too large for some research projects, two-way communication between the PTTs and satellites is needed, the cost of using Argos is too high, attachment of PTTs is an issue, and a standardized receiver system is needed.
Both the PTT and pulse radio tag users want tags that are smaller and last longer. They would like PTTs that are attached externally to be more hydrodynamically designed.
To improve data collection with the PTTs, the attendees discussed having the ability to remotely interrogate the tags both above water and underwater. Furthermore, they discussed the advantages of having tags with the ability for two-way communication between the PTTs and satellites, and how their research would benefit from higher resolution in position fixes. Not only would they like to see a reduction in the cost of using Argos, but they would also like access to the raw data since the data transmission is often prematurely terminated.
Archival Tags Background
Simple archival tags are data loggers that record depth, temperature, pressure, light, chemical, or physiological indicators at set intervals for months or years. More sophisticated archival tags are programmable and are capable of providing a direct estimate of geographical position for each individual fish at regular intervals over
2 months or years. Theoretically, some of these tags could record data for up to 5 years and store this information for up to 20 years.

73
Archival tags have been produced in many shapes and are either inserted surgically or attached externally to species of interest. Because these are long-term tags, a large amount of data can potentially be generated from individual tags and therefore only small numbers of animals are usually tagged. However, the longer a tag is deployed, the more likely it is to become detached, so researchers often include experiments to monitor attachment success into their studies.
In order to retrieve the information, archival tags must be recovered from the individual. Recapture operations frequently rely on commercial or recreational fishermen and often use incentives (e.g., money or prizes) to improve the chances of recovering the tags. To facilitate identification of individuals carrying tags internally, an external mark or tag is commonly applied to the test animal.
Workgroup discussion
The first topic covered during the discussion was the types of problems that occurred with the currently available archival-tag technologies. Researchers relayed that tag life is frequently significantly less than what the manufacturers advertise (which makes it difficult to answer certain research questions), there is often a large difference in recovery among tagged species (sometimes it is impossible to determine why this is true), and the software for collecting and retrieving the data is inadequate.Because archival tags are expensive, attendees discussed having NOAA negotiate a bulk purchase price by combining the purchases for the separate projects. They also raised the point that NOAA or some independent firm should test the tags for reliability and performance. Many researchers test each tag before it is deployed and they have seen failure rates as high as 50%; these rates do not include tags that fail after deployment. NOAA should use its collective power as a large user of these tags to work with the vendors to improve tag reliability by performing quality control testing before the tags are shipped to users; furthermore, vendors should replace tags that fail before deployment. NOAA should also use its collective power to negotiate with vendors to make certain that the software is updated before hardware updates are released and that any changes are documented.
Attendees also noted that NOAA researchers have been successful at communicating to the vendors the new features they want added to archival tags, but have not been successful at communicating the need for an inexpensive stable tag. Many types of research could be accomplished with a reliable archival tag.
Another point the attendees emphasized was the need for an honest appraisal of how these tags perform under realistic environmental conditions. In other words, vendors need to provide realistic estimates of tag life when the tag and its battery are frequently exposed to fluctuating or extreme pressures and temperatures. Furthermore, vendors need to provide the information on how the researchers should set up the tags in order to prolong battery life (e.g., give instructions on how to set up duty cycle settings to yield a longer tag life).
The attendees also identified a significant need for finding ways to extend battery life for archival tags because it is their longevity that makes them such a useful research tool. Researchers suggested making the batteries rechargeable, finding ways to use either water flow or the sun to recharge the batteries, and investigating whether there are batteries that would function better under cold-water conditions. If the vendors are unwilling to investigate this battery issue on their own, NOAA should offer to share the costs of this work. After all, the data being collected are greatly expanding our knowledge of populations and areas of high productivity, which contributes directly to NOAA’s ability to manage resources. Furthermore, in situations where good geolocation data can be obtained using electronic tags, they can be a cost-effective way to get environmental samples compared to oceanographic sampling platforms.

74
The attendees also discussed the fact that some new sensors with archival tags have the potential to aid in providing other important information for NOAA. For example, light-level sensors could help measure chlorophyll and water flow sensors might help measure current velocity.
Because the software for collecting and retrieving the data is inadequate, attendees learned during this workshop that each group of NOAA researchers has been developing its own software. Consequently, researchers recommended that NOAA should eliminate this redundant effort and instead create a common database platform, which would include the ability to analyze the different data sets with various filters and models. Furthermore, this concentration of data would assist with the broader effort to integrate the electronic tag data with environmental and stock assessment data. Another software issue raised was a time stamp problem that needs to be resolved.
Along the lines of sharing a database, attendees discussed creating a Web-based working group where members could share information such as a vendor list, methods used, tag attachment protocols, tag-related requests for proposals, and tag testing results.

75
n
Recent NMFS Baird, R. W., J. F. Borsani, M. B. Hanson, and P. L. Tyack. 2002. Diving and night-time behavior of long-finned pilot whales in the Ligurian Sea. Mar. Ecol. Prog. Ser.
Publications and 237:301–305.Reports Derived
Baird, R. W., M. B. Hanson, and L. M. Dill. 2005. Factors influencing the diving from Electronic behaviour of fish-eating killer whales: Sex differences and diel and interannual Tagging variation in diving rates. Can. J. Zool. 83:257–267.
Benson, S. R., P. H. Dutton, C. Hitipeuw, Y. Thebu, Y. Bakarbessy, C. Sorondanya, N. Tangkepayung, and D. Parker. In press. Post-nesting movements of leatherbacks from Jamursba Medi, Papua, Indonesia: Linking local conservation with international threats. Proceedings of the 24th Annual Symposium on Sea Turtle Biology and Conservation, San Jose, Costa Rica 2004. NOAA Tech. Memo. NMFS-SWFSC.
Benson, S. R., K. M. Kisokau, L. Ambio, V. Rei, P. H. Dutton, and D. Parker. In press. Beach use, inter-nesting movement, and migration of leatherback turtles, Dermochelys coriacea, nesting on the north coast of Papua New Guinea. Chelon. Conserv. Biol.
Brill, R. W., G. H. Balazs, K. N. Holland, R. K. C. Chang, S. Sullivan, and J. C. George. 1995. Daily movements, habitat use, and submergence intervals of normal and tumor-afflicted juvenile green turtles (Chelonia mydas L.) within a foraging area in the Hawaiian Islands. J. Exp. Mar. Biol. Ecol. 185:203–218.
Brill, R. W., K. A. Bigelow, M. K. Musyl, K. A. Fritsches, and E. J. Warrant. 2005. Bigeye tuna behavior and physiology—their relevance to stock assessments and fishery biology. Col. Vol. Sci. Pap. ICCAT 57(2):142–161.
Brill, R., B. Block, C. Boggs, K. Bigelow, E. Freund, and D. Marcinek. 1999. Horizontal movements and depth distribution of large, adult yellowfin tuna (Thunnus albacares) near the Hawaiian Islands, recorded using ultrasonic telemetry: Implications for the physiological ecology of pelagic fishes. Mar. Biol. 133:395–408.
Brill, R. W., D. B. Holts, R. K. C. Chang, S. Sullivan, H. Dewar, and F. G. Carey. 1993. Vertical and horizontal movements of striped marlin (Tetrapturus audax) near the main Hawaiian Islands, determined by ultrasonic telemetry, with simultaneous measurements of oceanic currents. Mar. Biol. 117:567–574.
Brill, R., and M. Lutcavage. 2001. Understanding environmental influences on movements and depth distribution of tunas and billfish can significantly improve stock assessments. Amer. Fish. Soc. Symp. 25:179–198.
Brill, R., M. Lutcavage, G. Metzger, P. Bushnell, M. Arndt, J. Lucy, and C. Watson. 2002. Horizontal and vertical movements of juvenile bluefin tuna (Thunnus thynnus) ithe western north Atlantic determined using ultrasonic telemetry. Fish. Bull.100:155–167.
Burke, B. J., T. J. Bohn, S. L. Downing, M. A. Jepson, and C. A. Peery. 2004. Dam passage and fallback by Chinook salmon and steelhead as determined by passive integrated transponder tags and radio tags. Report to the U.S. Army Corps of Engineers, Portland and Walla Walla Districts. National Marine Fisheries Service, Northwest Fisheries Science Center, Seattle.
Burke, B. J., K. E. Frick, M. L. Moser, T. J. Bohn, and T. C. Bjornn. 2005. Adult fall Chinook passage through fishways at lower Columbia River dams in 1998, 2000, and 2001. Report to the U.S. Army Corps of Engineers, Portland and Walla Walla Districts.National Marine Fisheries Service, Northwest Fisheries Science Center, Seattle.

76
Cadrin, S. X., and A. D. Westwood. 2004. The use of electronic tags to study fish movement: A case study with yellowtail flounder off New England. ICES CM2004/K:81.
Dutton, P. H., S. R. Benson, and S. A. Eckert. 2006. Identifying origins of leatherback turtles from Pacific foraging grounds off central California, USA. In N. J. Pilcher (compiler), Proceedings of the 23rd Annual Symposium on Sea Turtle Biology and Conservation, Kuala Lumpur, Malaysia 2003. NOAA Tech. Memo. NMFS-SEFSC-536.
Fadely, B. S., B. W. Robson, J. T. Sterling, A. Greig, and K. A. Call. 2005. Immature Steller sea lion (Eumetopias jubatus) dive activity in relation to habitat features of the eastern Aleutian Islands. Fish. Oceanogr. 14 (Suppl. 1):243–258.
Graves, J. P., B. E. Luckhurst, and E. D. Prince. 2002. An evaluation of pop-up satellite tags to estimate post-release survival of blue marlin (Makaira nigricans). Fish. Bull. 100:134–142.
Gröger, J. P., R. Rountree, S. X. Cadrin, A. Westwood, and S. Kubis. In press. The use of digital storage tags and tidal information to study migration patterns of yellowtail flounder (Limanda ferruginea) off New England. Can. J. Fish Aquat. Sci.
Hanson, M. B. 2001. An evaluation of the relationship between small cetacean tag design and attachment durations: A bioengineering approach. Ph.D. dissertation, Univ. Washington, Seattle.
Hinke, J. T., D. G. Foley, C. Wilson, and G. M. Watters. 2005. Persistent habitat use by Chinook salmon (Oncorhynchus tshawytscha) in the coastal ocean. Mar. Ecol. Prog. Ser. 304:207–220.
Keefer, M. L., C. A. Peery, W. R. Daigle, M. A. Jepson, S. R. Lee, C. T. Boggs, K. R. Tolotti, and B. J. Burke. 2005. Escapement, harvest, and unknown loss of radio-tagged adult salmonids in the Columbia-Snake River hydrosystem. Can. J. Fish. Aquat. Sci. 62:930–949.
Kerstetter, D. W., B. E. Luckhurst, E. D. Prince, and J. E. Graves. 2003. Use of pop-up satellite archival tags to demonstrate survival of blue marlin (Makaira nigricans) released from pelagic longline gear. Fish. Bull. 101:939–948.
Loughlin, T. R., J. T. Sterling, R. L. Merrick, J. L. Sease, and A. E. York. 2003. Immature Steller sea lion diving behavior. Fish. Bull. 101:566–582.
Luo, J., E. D. Prince, C. P. Goodyear, B. E. Luckhurst, and J. E. Serafy. 2006. Vertical habitat utilization by large pelagic animals: A quantitative framework and numerical method for use with pop-up satellite tag data. Fish. Oceanogr. 15:208–229.
Moser, J., and G. Shepherd. 2004. Seasonal movement of black sea bass. National Marine Fisheries Service, Northeast Fisheries Science Center Ref. Doc. 04-01:54.Moser, M. L., and D. A. Close. 2003. Assessing Pacific lamprey status in the Columbia River Basin. Northwest Sci. 77:116–125.
Moser, M. L., A. L. Matter, L. C. Stuehrenberg, and T. C. Bjornn. 2002. Use of an extensive radio receiver network to document Pacific lamprey (Lampetra tridentata) entrance efficiency at fishways on the lower Columbia River, USA. Hydrobiologia 483:45–53.

Moser, M. L., M. S. Myers, B. J. Burke, and S. M. O’Neill. 2005. Effects of surgically implanted transmitters on survival and feeding behavior of adult English sole. In M. T. Spedicato, G. Lembo, G. Marmulla (eds.), Aquatic telemetry: Advances and applications. Proceedings of the Fifth Conference on Fish Telemetry held in Europe,p. 1–7. Ustica, Italy, 9–13 June 2003. FAO/COISPA, Rome.
Moser, M. L., P. A. Ocker, L. C. Stuehrenberg, and T. C. Bjornn. 2002. Passage efficiency of adult Pacific lampreys at hydropower dams on the lower Columbia River, USA. Trans. Amer. Fish. Soc. 131:956–965.
Moser, M. L., R. W. Zabel, B. J. Burke, L. C. Stuehrenberg, and T. C. Bjornn. 2005. Factors affecting adult Pacific lamprey passage rates at hydropower dams: Using time to event analysis of radiotelemetry data. In M. T. Spedicato, G. Lembo, G. Marmulla (eds.), Aquatic telemetry: Advances and applications. Proceedings of the Fifth Conference on Fish Telemetry held in Europe. Ustica, Italy, 9–13 June 2003.FAO/COISPA, Rome.
Nichol, D. G., and E. A. Chilton. 2006. Recuperation and behavior of Pacific cod after barotrauma. ICES J. Mar. Sci. 63:83–94.
Nichol, D. G., and D. A. Somerton. 2002. Diurnal vertical migration of Atka mackerel (Pleurogrammus monopterygius) as shown by archival tags. Mar. Ecol. Prog. Ser. 239:193–207.
Polovina, J. J., G. H. Balazs, E. A. Howell, D. M. Parker, M. P. Seki, and P. H. Dutton. 2004. Forage and migration habitat of loggerhead (Caretta caretta) and olive ridley (Lepidochelys olivacea) sea turtles in the central North Pacific Ocean. Fish. Oceanogr. 13:36–51.
Polovina, J. J., E. Howell, D. R. Kobayashi, and M. P. Seki. 2001. The transition zone chlorophyll front, a dynamic global feature defining migration and forage habitat for marine resources. Prog. Oceanogr. 49:469–483.
Polovina, J. J., I. Uchida, G. Balazs, E. Howell, D. Parker, and P. Dutton. 2006. The Kuroshio Extension Current Bifurcation Region: A pelagic hotspot for juvenile loggerhead sea turtles. Deep-Sea Res. II 53(3–4):326–339.
Prince, E. D., R. K. Cowen, E. S. Orbesen, S. A. Luthy, J. K. Llopiz, D. E. Richardson, and J. E. Serafy. 2005. Movements and spawning of white marlin (Tetrapturus albidusand blue marlin (Makaira nigricans) off Punta Cana, Dominican Republic. Fish. Bull. 103:659–669.
Prince, E. D., and C. P. Goodyear. 2006. Hypoxia-based habitat compression of tropical pelagic fishes. Fish. Oceanogr. 15(6):451–464.
Ream, R. R., J. T. Sterling, and T. R. Loughlin. 2005. Oceanographic features related to northern fur seal migratory movements. Deep-Sea Res. II 52:823–843.
Robson, B. W., M. E. Goebel, J. D. Baker, R. R. Ream, T. R. Loughlin, R. C. Francis, G. A. Antonelis, and D. P. Costa. 2004. Separation of foraging habitat among breeding sites of a colonial marine predator, the northern fur seal (Callorhinus ursinus). Can. J. Zool. 82:20–29.
Sheehan, T. F., G. Lacroix, and J. F. Kocik. 2004. Atlantic salmon hatchery smolt emigration dynamics determined through ultrasonic telemetry: Dennys River Maine, USA. U.S. Atlantic Salmon Assessment Committee Annual Report 2004/16:66–67.
Sterling, J. T., and R. R. Ream. 2004. At-sea behavior of juvenile male northern fur 77seals (Callorhinus ursinus). Can. J. Zool. 82:1621–1637.
)

78
Stewart, B. S. 2004. Foraging ecology of Hawaiian monk seals (Monachus schauinslandi) at Pearl and Hermes Reef, Northwestern Hawaiian Islands: 1997–1998. National Marine Fisheries Service, Pacific Islands Fisheries Science Center Admin. Rep. H-04-03C.
Stewart, B. S. 2004. Geographic patterns of foraging dispersion of Hawaiian monk seals (Monachus schauinslandi) at the Northwestern Hawaiian Islands. National Marine Fisheries Service, Pacific Islands Fisheries Science Center Admin. Rep. H-04-05C.
Stewart, B. S., and P. K. Yochem. 2004. Dispersion and foraging of Hawaiian monk seals (Monachus schauinslandi) near Lisianski and Midway Islands: 2000–2001. National Marine Fisheries Service, Pacific Islands Fisheries Science Center Admin. Rep. H-04-04C.
Stewart, B. S., and P. K. Yochem. 2004. Use of marine habitats by Hawaiian monk seals (Monachus schauinslandi) from Kure Atoll: Satellite-linked monitoring in 2001–2002. National Marine Fisheries Service, Pacific Islands Fisheries Science Center Admin. Rep. H-04-01C.
Stewart, B. S., and P. K. Yochem. 2004. Use of marine habitats by Hawaiian monk seals (Monachus schauinslandi) from Laysan Island: Satellite-linked monitoring in 2001–2002. National Marine Fisheries Service, Pacific Islands Fisheries Science Center Admin. Rep. H-04-02C.
Tallack, S., P. Rago, T. Brawn, S. Cadrin, J. Hoey, and L. T. Singer. 2005. Proceedings of a workshop to review and evaluate the design and utility of fish mark-recapture projects in the northeastern United States. National Marine Fisheries Service, Northeast Fisheries Science Center Ref. Doc. 05-02.

79
Workshop Kelly Andrews Dan CooperNorthwest Fisheries Science Center Alaska Fisheries Science Center
Attendees Seattle, Washington Seattle, [email protected] [email protected]
Robyn P. Angliss Dean L. CourtneyAlaska Fisheries Science Center Alaska Fisheries Science CenterSeattle, Washington Seattle, [email protected] [email protected]
Stephen J. Auer Peter A. CummiskeyNOAA Office of Global Programs Alaska Fisheries Science CenterWashington, DC Seattle, [email protected] [email protected]
Gordon A. Axel Nancy D. DavisNorthwest Fisheries Science Center University of WashingtonPasco, Washington High Seas Salmon Research [email protected] Seattle, Washington
[email protected] R. BensonSouthwest Fisheries Science Center Andrew DittmanMoss Landing, California Northwest Fisheries Science [email protected] Seattle, Washington
[email protected] BogradSouthwest Fisheries Science Center Sandra L. DowningLa Jolla, California Northwest Fisheries Science [email protected] Seattle, Washington
[email protected] W. BrillNortheast Fisheries Science Center John W. DurbanVirginia Institute of Marine Science Alaska Fisheries Science CenterGloucester Point, Virginia Seattle, [email protected] [email protected]
Brian J. Burke Peter H. DuttonNorthwest Fisheries Science Center Southwest Fisheries Science CenterSeattle, Washington La Jolla, [email protected] [email protected]
Steven Cadrin John EilerNortheast Fisheries Science Center Alaska Fisheries Science CenterWoods Hole, Massachusetts Seattle, [email protected] [email protected]
John K. Carlson Sheryan EpperlySoutheast Fisheries Science Center Southeast Fisheries Science CenterPanama City, Florida Miami, [email protected] [email protected]
John Childers Brian S. FadelySouthwest Fisheries Science Center Alaska Fisheries Science CenterLa Jolla, California Seattle, [email protected] [email protected]

80
John W. Ferguson Bob IwamotoNorthwest Fisheries Science Center Northwest Fisheries Science CenterSeattle, Washington Seattle, [email protected] [email protected]
David G. Foley Bruce F. JonassonSouthwest Fisheries Science Center Northwest Fisheries Science CenterJoint Institute for Marine and Seattle, WashingtonAtmospheric Research [email protected] Grove, [email protected] Véronique Koch
Southeast Fisheries Science Center, Kinsey E. Frick Miami, FloridaNorthwest Fisheries Science Center [email protected], [email protected] Suzanne Kohin
Southwest Fisheries Science CenterMichael Goebel La Jolla, CaliforniaSouthwest Fisheries Science Center [email protected] Jolla, [email protected] Stacy Kubis
Northeast Fisheries Science CenterM. Bradley Hanson Woods Hole, MassachusettsNorthwest Fisheries Science Center [email protected], [email protected] John Lamkin
Southeast Fisheries Science CenterDonald Hawn Miami, FloridaPacific Islands Fisheries Science Center [email protected], [email protected] Michelle E. Lander
Alaska Fisheries Science CenterSean A. Hayes Seattle, WashingtonSouthwest Fisheries Science Center [email protected] Cruz, [email protected] Mike Laurs
Southwest Fisheries Science CenterGina K. Himes Boor La Jolla, CaliforniaMontana State University [email protected], [email protected] Steven T. Lindley
Southwest Fisheries Science CenterEric E. Hockersmith La Jolla, CaliforniaNorthwest Fisheries Science Center [email protected], Washington [email protected] Charles L. Littnan
Pacific Islands Fisheries Science CenterAleta A. Hohn Honolulu, HawaiiSoutheast Fisheries Science Center [email protected], North [email protected] Elizabeth A. Logerwell
Alaska Fisheries Science CenterKim Holland Seattle, WashingtonUniversity of Hawaii [email protected] Institute of Marine BiologyKaneohe, Hawaii R. Bruce [email protected] Southwest Fisheries Science Center
La Jolla, [email protected]

81
Douglas M. Marsh Layla Osman GallegosNorthwest Fisheries Science Center Southwest Fisheries Science CenterSeattle, Washington La Jolla, [email protected] [email protected]
Gene M. Matthews Daniel PalaciosNorthwest Fisheries Science Center Southwest Fisheries Science CenterSeattle, Washington Pacific Grove, [email protected] [email protected]
R. Lynn McComas John PayneNorthwest Fisheries Science Center Northwest Fisheries Science CenterPasco, Washington Seattle, [email protected] [email protected]
Susanne F. McDermott Jeffrey J. PolovinaAlaska Fisheries Science Center Pacific Islands Fisheries Science CenterSeattle, Washington Honolulu, [email protected] [email protected]
Richard D. Methot Clay E. PorchNorthwest Fisheries Science Center Southeast Fisheries Science CenterSeattle, Washington Miami, [email protected] [email protected]
Joshua Moser Earl F. PrenticeNortheast Fisheries Science Center Northwest Fisheries Science CenterWoods Hole, Massachusetts Seattle, [email protected] [email protected]
Mary L. Moser Eric D. PrinceNorthwest Fisheries Science Center Southeast Fisheries Science CenterSeattle, Washington Miami, [email protected] [email protected]
Peter Munro Samuel L. RamboAlaska Fisheries Science Center Northwest Fisheries Science CenterSeattle, Washington Pasco, Washington [email protected] [email protected]
Michael Musyl Anne RichardsPacific Islands Fisheries Science Center Northeast Fisheries Science CenterJoint Institute for Marine and Woods Hole, MassachusettsAtmospheric Research [email protected], [email protected] Cheryl Ryder
Alaska Fisheries Science CenterDan Nichol Seattle, WashingtonAlaska Fisheries Science Center [email protected], [email protected] Benjamin Sandford
Northwest Fisheries Science CenterGreg O’Corry-Crowe Seattle, WashingtonSouthwest Fisheries Science Center [email protected] Jolla, Californiagreg.o’[email protected] Christopher R. Sasso
Southeast Fisheries Science CenterMiami, [email protected]

82
Peter F. SheridanSoutheast Fisheries Science CenterPanama City Beach, [email protected]
Yunbing ShiAlaska Fisheries Science CenterSeattle, [email protected]
David SomertonAlaska Fisheries Science CenterSeattle, [email protected]
Jim StarkAlaska Fisheries Science CenterSeattle, [email protected]
Jeremy T. SterlingAlaska Fisheries Science CenterSeattle, [email protected]
Skip TezakNorthwest Fisheries Science CenterSeattle, [email protected]
Robert V. WalkerUniversity of WashingtonHigh Seas Salmon Research ProgramSeattle, [email protected]
Samantha WhitcraftSoutheast Fisheries Science CenterCooperative Institute for Marine and Atmospheric ScienceMiami, [email protected]
John G. WilliamsNorthwest Fisheries Science CenterSeattle, [email protected]
Lisa WooninckSouthwest Fisheries Science CenterPacific Grove, [email protected]
Cynthia YeungAlaska Fisheries Science CenterSeattle, [email protected]
