report of the fao/cecaf working group on the … · travail est d’améliorer la gestion des...
TRANSCRIPT

CECAF/ECAF SERIES 12/74COPACE/PACE SÉRIES 12/74
Rapport du Groupe de travail FAO/COPACE sur l'évaluation des petits poissons pélagiques –Sous-groupe SudAccra, Ghana, 19-28 octobre 2009
Report of the FA
O/C
EC
AF W
orking Group on the A
ssessment of S
mall P
elagic Fish – Subgroup S
outh – Accra, G
hana, 19–28 October 2009
Rapport du G
roupe de travail FAO
/CO
PAC
E sur l'évaluation des petits poissons pélagiques – S
ous-groupe Sud – A
ccra, Ghana, 19-28 octobre 2009
FAO
Report of the FAO/CECAF Working Group on the Assessment of Small Pelagic Fish – Subgroup SouthAccra, Ghana, 19–28 October 2009
The second meeting of the FAO/CECAF Working Group on the Assessment of Small Pelagic Fish – Subgroup South met in Accra, Ghana, from 19 to 28 October 2009. The overall objective of the Working Group is to contribute to the improved management of small pelagic resources in West Africa through the assessment of the state of the stocks and fisheries to ensure sustainable use of these resources for the benefit of coastal countries. The Working Group focused on addressing data quality issues and the analysis of trends in the available data sets. Total catch of small pelagic fish for the period 1990 to 2007 fluctuated with an average of around 494 000 tonnes. Although important
changes were observed in the abundance and exploitation level for some of the stocks, the overall general situation with respect to the state of the different stocks was found to be similar to that of 2005. Round sardinella (western
stock) was found to be overexploited. It was recommended not to increase catches until further analysis with more complete data on the stocks is available. Five stocks were found to be fully exploited: flat sardinella (western stock) and Sardinella spp. (northern stock), bonga (northern stock and southern stock), and anchovy (western stock). For these stocks it was recommended, as a precautionary measure, that catch level should not exceed the catch of the last year or the average catch of the last four years. For the Cunene horse mackerel (southern stock) no conclusive
results were obtained with the models, but other independent information indicate that the stock is not in a good condition. For this stock it was recommended that targeted effort on this species should be reduced. For four of the stocks analysed the data did not provide reliable results and for three stocks the data available were not sufficient to
apply an assessment model. As a precautionary measure, catch level recommendations were nevertheless also made for these stocks.
La deuxième réunion du Groupe de travail FAO/COPACE sur l’évaluation des petits poissons pélagiques – Sous-groupe Sud (WGASP-S) a eu lieu à Accra, Ghana, du 19 au 28 octobre 2009. L’objectif général du Groupe de
travail est d’améliorer la gestion des ressources de petits pélagiques en Afrique de l’ouest grâce à l’évaluation de l’état des stocks et des pêcheries de façon à assurer une utilisation durable de ces ressources au bénéfice des pays
côtiers. Le Groupe de travail s'est concentré sur les aspects liés à la qualité des données et sur l'analyse des tendances dans les données. La capture totale de petits poissons pélagiques pour la période 1990 à 2007 a fluctué avec une moyenne d’environ 494 000 tonnes. Bien que des changements importants aient été observés dans les
niveaux d’abondance et d’exploitation de certains stocks, la situation générale par rapport à l’état des différents stocks est apparue globalement semblable à celle de l’année 2005. La sardinelle ronde stock ouest a été classifiée comme surexploitée. Il a été recommandé de ne pas augmenter les captures jusqu’à ce qu’une analyse plus approfondie et des données plus complètes sur le stock soient disponibles. Cinq stocks étaient pleinement exploités -sardinella plate stock ouest et Sardinella spp. stock nord, ethmalose (stock nord et stock sud), et anchois (stock ouest). Pour
ces stocks il a été recommandé, par mesure de précaution, que le niveau de capture ne dépasse pas la capture de la dernière année ou la moyenne des quatre dernières années. Pour le stock sud du chinchard du Cunène, des
résultants concluants ne peuvent pas être tirés des modèles, mais d’autres sources d’information indiquent que ce stock n’est pas dans un bonne état. L´effort exercé sur ce stock doit être réduit. Pour quatre des stocks analysés les
données n’ont pas fourni de résultats fiables et pour trois des stocks les données disponibles n’étaient pas suffisantes pour l’application d’un modèle d’évaluation. Par mesure de précaution, le Groupe de travail a néanmoins fait des
recommandations sur le niveau des captures à respecter.
i2909b/1/01.13


PROGRAMME FOR THE DEVELOPMENT OF FISHERIES IN THE EASTERN CENTRAL ATLANTIC FISHERY COMMITTEE FOR THE EASTERN CENTRAL ATLANTIC
CECAF/ECAF SERIES 12/74 COPACE/PACE SÉRIES 12/74
PROGRAMME POUR LE DÉVELOPPEMENT DES PÊCHES DANS L’ATLANTIQUE CENTRE-EST COMITÉ DES PÊCHES POUR L’ATLANTIQUE CENTRE-EST
Report of the FAO/CECAF Working Group on the Assessment of Small Pelagic Fish – Subgroup South
Accra, Ghana, 19–28 October 2009
Rapport du Groupe de travail FAO/COPACE sur l’évaluation des petits poissons pélagiques – Sous-groupe Sud
Accra, Ghana, 19-28 octobre 2009
FOOD AND AGRICULTURE ORGANIZATION OF THE UNITED NATIONS
ORGANISATION DES NATIONS UNIES POUR L’ALIMENTATION ET L’AGRICULTURE Rome, 2013

The designations employed and the presentation of material in this information product do not imply the expression of any opinion whatsoever on the part of the Food and Agriculture Organization of the United Nations (FAO) concerning the legal or development status of any country, territory, city or area or of its authorities, or concerning the delimitation of its frontiers or boundaries. The mention of specific companies or products of manufacturers, whether or not these have been patented, does not imply that these have been endorsed or recommended by FAO in preference to others of a similar nature that are not mentioned. The views expressed in this information product are those of the author(s) and do not necessarily reflect the views of FAO. Les appellations employées dans ce produit d’information et la présentation des données qui y figurent n’impliquent de la part de l’Organisation des Nations Unies pour l’alimentation et l’agriculture (FAO) aucune prise de position quant au statut juridique ou au stade de développement des pays, territoires, villes ou zones ou de leurs autorités, ni quant au tracé de leurs frontières ou limites. La mention de sociétés déterminées ou de produits de fabricants, qu'ils soient ou non brevetés, n'entraîne, de la part de la FAO, aucune approbation ou recommandation desdits produits de préférence à d'autres de nature analogue qui ne sont pas cités. Les opinions exprimées dans ce produit d’information sont celles du/des auteur(s) et ne reflètent pas nécessairement celles de la FAO. All rights reserved. FAO encourages the reproduction and dissemination of material in this information product. Non-commercial uses will be authorized free of charge, upon request. Reproduction for resale or other commercial purposes, including educational purposes, may incur fees. Applications for permission to reproduce or disseminate FAO copyright materials, and all queries concerning rights and licences, should be addressed by e-mail to [email protected] or to the Chief, Publishing Policy and Support Branch, Office of Knowledge Exchange, Research and Extension, FAO, Viale delle Terme di Caracalla, 00153 Rome, Italy. Tous droits réservés. La FAO encourage la reproduction et la diffusion des informations figurant dans ce produit d’information. Les utilisations à des fins non commerciales seront autorisées à titre gracieux sur demande. La reproduction pour la revente ou d’autres fins commerciales, y compris pour fins didactiques, pourrait engendrer des frais. Les demandes d’autorisation de reproduction ou de diffusion de matériel dont les droits d’auteur sont détenus par la FAO et toute autre requête concernant les droits et les licences sont à adresser par courriel à l’adresse [email protected] ou au Chef de la Sous-Division des politiques et de l’appui en matière de publications, Bureau de l’échange des connaissances, de la recherche et de la vulgarisation, FAO, Viale delle Terme di Caracalla, 00153 Rome (Italie). © FAO 2013

iii
PREPARATION OF THIS DOCUMENT
The FAO/CECAF Working Group on pelagic resources was created during the fifteenth session of the
Fishery Committee for the Eastern Central Atlantic (CECAF) which was held in Abuja, Nigeria, from
1 to 3 November 2000 (FAO, 2001). Subsequently, a permanent FAO/CECAF Working Group was
created, composed of scientists from the coastal countries and from those countries or organizations
playing an active role in small pelagic fisheries.
The second meeting of the FAO/CECAF Working Group on the Assessment of Small Pelagic Fish –
Subgroup South (WGASP-S) met in Accra, Ghana, from 19 to 28 October 2009. The overall objective
of WGASPS is to contribute to the improved management of small pelagic resources in West Africa
through the assessment of the state of the stocks and fisheries to ensure sustainable use of these
resources for the benefit of coastal countries.
The meeting was funded by Project GCP/INT/003/NOR – Strengthening the knowledge base for and
implementing an ecosystem approach to marine fisheries in developing countries, “EAF-Nansen” and
organized by the FAO in collaboration with the Marine Fisheries Research Division of Ghana.
Altogether 14 researchers from 12 different countries and FAO took part in the meeting.
A first editing of this report was made by all participants of the Working Group. Final technical
editing was done by Ana Maria Caramelo, Merete Tandstad and Tarub Bahri. We are grateful to
Marie-Thérèse Magnan for her assistance in the final editing of this document.
PRÉPARATION DE CE DOCUMENT
Le Groupe de travail FAO/COPACE sur les ressources pélagiques a été créé au cours de la quinzième
session du Comité des pêches pour l’Atlantique Centre-Est (COPACE) qui s’est tenue à Abuja
(Nigéria) du 1er
au 3 novembre 2000 (FAO, 2001). Par la suite, un Groupe de travail permanent
FAO/COPACE a été créé, composé de scientifiques des pays côtiers et de ces pays ou organisations
jouant un rôle actif dans les pêcheries de petits pélagiques.
La deuxième réunion du Groupe de travail FAO/COPACE sur l’évaluation des petits poissons
pélagiques – Sous-groupe Sud (WGASP-S) a eu lieu à Accra (Ghana) du 19 au 28 octobre 2009.
L’objectif général du Groupe est de contribuer à l’amélioration de l’aménagement des ressources de
petits pélagiques en Afrique de l’ouest par l’évaluation de l’état des stocks et des pêcheries afin
d’assurer l’utilisation durable de ces ressources pour le bénéfice des pays côtiers.
La réunion a été financée par le projet GCP/INT/003/NOR – Renforcement de la base des
connaissances pour la mise en œuvre d’une approche écosystémique des pêches maritimes dans les
pays en développement, «EAF-Nansen» et organisée par la FAO en collaboration avec la Division de
la recherche sur les pêcheries marines du Ghana.
Au total, 14 chercheurs de 12 pays différents et de la FAO ont participé à la réunion.
Une première édition de ce rapport a été faite par tous les participants du Groupe de travail. Une
édition technique finale a été faite par Ana Maria Caramelo, Merete Tandstad et Tarub Bahri. Nos vifs
remerciements vont à Marie-Thérèse Magnan pour l'assistance apportée à l'édition finale de ce
document.

iv
FAO Fishery Committee for the Eastern Central Atlantic/Comité des pêches pour l’Atlantique
Centre-Est. 2013.
Report of the FAO/CECAF Working Group on the Assessment of Small Pelagic Fish – Subgroup
South. Accra, Ghana, 19–28 October 2009.
Rapport du Groupe de travail FAO/COPACE sur l’évaluation des petits poissons pélagiques – Sous-
groupe Sud. Accra, Ghana, 19-28 octobre 2009.
CECAF/ECAF Series/COPACE/PACE Séries. No. 12/74 Rome, FAO. 172 pp.
ABSTRACT
The second meeting of the FAO/CECAF Working Group on the Assessment of Small Pelagic Fish –
Subgroup South met in Accra, Ghana, from 19 to 28 October 2009. The overall objective of the
Working Group is to contribute to the improved management of small pelagic resources in West
Africa through the assessment of the state of the stocks and fisheries to ensure sustainable use of
these resources for the benefit of coastal countries. The Working Group focused on data quality and
on the analysis of trends in the basic data (catch, effort, abundance indices and length distribution)
and trends in the fishery independent survey data. The species assessed by the Working Group were:
sardinella (Sardinella aurita and Sardinella maderensis), bonga (Ethmalosa fimbriata), anchovy
(Engraulis encrasicolus) and horse mackerel (Trachurus trecae and Decapterus rhonchus) and other
Carangidae, in the region between the northern border of Guinea-Bissau and the southern border of
Angola.
For each of these species, standardized information is given on stock identity, fisheries, abundance
indices, sampling, biological data, assessment, management recommendations and future research.
Of the 17 stocks analysed one is found to be overexploited, round sardinella (S. aurita) western
stock. For this stock it was recommended not to increase catches until further analysis with more
complete data on the stocks is available. Five stocks were found to be fully exploited: flat sardinella
(S. maderensis) western stock and Sardinella spp. Northern stock, bonga (E. fimbriata) northern
stock and southern stock, and anchovy (E. encrasicolus) western stock. For these stocks it was
recommended, as a precautionary measure, that catch level should not exceed the catch of the last
year or the average catch of the last four years. The Cunene horse mackerel southern stock was
found to be overexploited but the models did not fit well the data presented to the Working Group,
but other independent information point out the bad conditions of the stock, for this stock it was
recommended that targeted effort on this species should be reduced. For four of the stocks analysed
the data did not provide reliable results and for three stocks the data available were not sufficient to
apply an assessment model. For these stocks, as a precautionary measure, the Working Group
recommended that catch level should not exceed the average of the last five or three years or in
some cases last year’s (2008) catch.
Because of the emphasis on database improvement, less time was available for assessment. Further
it should be noted that the results of the model depend strongly on the quality of the data that the
Working Group have at its disposal and the main limitation to the assessments is non availability of
data for some countries in the region. For some of the species/stocks the model did not produce
reliable results due to insufficient and inconsistent input data. Given the above, it is recommended
that the results of the assessments should be interpreted as preliminary and that further analysis of
the basic data should be undertaken before the next meeting of the Working Group.

v
RÉSUMÉ
La deuxième réunion du Groupe de travail FAO/COPACE sur l’évaluation des petits poissons
pélagiques – Sous-groupe Sud (WGASP-S) a eu lieu à Accra, Ghana, du 19 au 28 octobre 2009.
L’objectif général du Groupe de travail est d’améliorer la gestion des ressources de petits pélagiques
en Afrique de l’ouest grâce à l’évaluation de l’état des stocks et des pêcheries de façon à assurer une
utilisation durable de ces ressources au bénéfice des pays côtiers. Le Groupe de travail s'est
concentré sur la qualité des données et sur l'analyse des tendances dans les données de base
(captures, effort, index d'abondance et distribution des tailles) et des tendances dans les données
indépendantes des campagnes de pêche. Les espèces évaluées par le Groupe de travail étaient les
sardinelles (Sardinella aurita et Sardinella maderensis), l’ethmalose (Ethmalosa fimbriata),
l’anchois (Engraulis encrasicolus) et les chinchards (Trachurus trecae et Decapterus rhonchus)
ainsi que d’autres carangidés dans la zone située entre la frontière nord de la Guinée-Bissau et la
frontière sud de l’Angola.
Une information standardisée est fournie au sujet de l’identité du stock, des pêcheries, des indices
d’abondance, de l’échantillonnage, des données biologiques, de l’évaluation, des recommandations
de gestion et des recherches futures pour chaque espèce.
Sur les 17 stocks analysés, un est surexploité, la sardinelle ronde (S. aurita) stock ouest. Pour ce
stock il a été recommandé de ne pas augmenter les captures jusqu’à ce qu’une analyse plus
approfondie et des données plus complètes sur le stock soient disponibles. Cinq stocks étaient
pleinement exploités: sardinella plate (S. maderensis) stock ouest et Sardinella spp. stock nord,
ethmalose (E. fimbriata) stock nord et stock sud, et anchois (E. encrasicolus) stock ouest. Pour ces
stocks il a été recommandé, en tant que mesure de précaution, que le niveau de capture ne dépasse
pas la capture de la dernière année ou la capture moyenne des quatre dernières années. Le stock sud
du chinchard du Cunène est aussi surexploité mais le modèle ne s´ajuste pas aux données et l´effort
exercé sur ce stock doit être réduit. Pour quatre des stocks analysés les données n’ont pas fourni de
résultats fiables et pour trois des stocks les données disponibles n’étaient pas suffisantes pour
l’application d’un modèle d’évaluation. Pour ces stocks, comme mesure de précaution, le Groupe de
travail a recommandé que le niveau des captures ne devrait pas dépasser la moyenne des cinq ou
trois dernières années ou, dans certains cas, la capture de l’année précédente (2008).
En raison de l’accent mis sur l’amélioration des bases de données, moins de temps a pu être
consacré à l’évaluation. De plus, on doit remarquer que les résultats du modèle dépendent fortement
de la qualité des données que le Groupe de travail a à sa disposition et la principale limite à
l’évaluation est que les données relatives à certains pays de la région ne sont pas disponibles. Pour
certaines espèces et certains stocks, le modèle n’a pas produit de résultats fiables en raison de
données de base insuffisantes et contradictoires. Il est donc recommandé que les résultats des
évaluations soient interprétés comme préliminaires et que l'analyse approfondie des données de base
soit faite avant la prochaine réunion du Groupe de travail.

vii
CONTENTS
1. INTRODUCTION ....................................................................................................................... 1
1.1 Terms of reference ................................................................................................................ 1
1.2 Participants ........................................................................................................................... 1
1.3 Definition of the working area .............................................................................................. 2
1.4 Structure of the report ........................................................................................................... 2
1.5 Overview of fisheries and landings ....................................................................................... 2
1.6 Overview of survey results by R/V DR. FRIDTJOF NANSEN ......................................... 11
1.7 Sampling and data quality ................................................................................................... 12
1.8 Methodology and software ................................................................................................. 17
2. SARDINELLA ........................................................................................................................... 17
2.1 Stock identity ....................................................................................................................... 17
2.2 Fisheries ............................................................................................................................... 18
2.3 Abundance indices ............................................................................................................... 19
2.3.1 Catch per unit of effort ............................................................................................... 19
2.3.2 Acoustic surveys ......................................................................................................... 21
2.4 Sampling of commercial fisheries ...................................................................................... 21
2.5 Biological data .................................................................................................................... 21
2.6 Assessment ........................................................................................................................... 22
2.7 Management recommendations ........................................................................................... 24
2.8 Future research ..................................................................................................................... 24
3. BONGA ...................................................................................................................................... 24
3.1 Stock identity ....................................................................................................................... 24
3.2 Fisheries ............................................................................................................................... 25
3.3 Abundance indices ............................................................................................................... 26
3.3.1 Catch per unit of effort ................................................................................................ 26
3.3.2 Acoustic surveys ......................................................................................................... 26
3.4 Sampling of commercial fisheries ....................................................................................... 26
3.5 Biological data ..................................................................................................................... 26
3.6 Assessment ........................................................................................................................... 27
3.7 Management recommendations ........................................................................................... 28
3.8 Future research ..................................................................................................................... 28
4. ANCHOVY ................................................................................................................................ 28
4.1 Stock identity ....................................................................................................................... 28
4.2 Fisheries ............................................................................................................................... 28
4.3 Abundance indices ............................................................................................................... 29
4.3.1 Catch per unit of effort ................................................................................................ 29
4.3.2 Acoustic surveys ......................................................................................................... 29
4.4 Sampling of commercial fisheries ....................................................................................... 30
4.5 Biological data ..................................................................................................................... 30
4.6 Assessment ........................................................................................................................... 30
4.7 Management recommendations ........................................................................................... 31
4.8 Future research ..................................................................................................................... 31
5. HORSE MACKEREL AND OTHER CARANGIDS ............................................................ 31
5.1 Stock identity ....................................................................................................................... 31
5.2 Fisheries ............................................................................................................................... 31
5.3 Abundance indices ............................................................................................................... 32
5.3.1 Catch per unit of effort ................................................................................................ 32
5.3.2 Acoustic surveys ......................................................................................................... 32
5.4 Sampling of commercial fisheries ....................................................................................... 32

viii
5.5 Biological data ..................................................................................................................... 33
5.6 Assessment ........................................................................................................................... 33
5.7 Management recommendations ........................................................................................... 34
5.8 Future research ..................................................................................................................... 34
6. GENERAL CONCLUSIONS ................................................................................................... 35
TABLE DES MATIÈRES
1. INTRODUCTION ..................................................................................................................... 39 1.1 Termes de référence ............................................................................................................. 39
1.2 Participants .......................................................................................................................... 39
1.3 Définition de la zone de travail ............................................................................................ 40
1.4 Structure du rapport ............................................................................................................ 40
1.5 Vue d’ensemble des pêcheries et des débarquements .......................................................... 40
1.6 Vue d’ensemble des résultats des campagnes du N/R DR. FRIDTJOF NANSEN ............. 50
1.7 Échantillonnage et qualité des données ............................................................................... 52
1.8 Méthodologie et logiciel ...................................................................................................... 57
2. SARDINELLES ......................................................................................................................... 58
2.1 Identité du stock ................................................................................................................... 58
2.2 Les pêcheries ........................................................................................................................ 58
2.3 Indices d’abondance............................................................................................................. 60
2.3.1 Capture par unité d’effort ............................................................................................ 60
2.3.2 Campagnes acoustiques .............................................................................................. 62
2.4 Échantillonnage des pêcheries commerciales ...................................................................... 62
2.5 Données biologiques ............................................................................................................ 63
2.6 Évaluation ............................................................................................................................ 63
2.7 Recommandations d’aménagement ..................................................................................... 65
2.8 Recherche future .................................................................................................................. 66
3. ETHMALOSE ........................................................................................................................... 66
3.1 Identité du stock ................................................................................................................... 66
3.2 Les pêcheries ........................................................................................................................ 66
3.3 Indices d’abondance............................................................................................................. 68
3.3.1 Capture par unité d’effort ............................................................................................ 68
3.3.2 Campagnes acoustiques .............................................................................................. 68
3.4 Échantillonnage des pêcheries commerciales ...................................................................... 68
3.5 Données biologiques ............................................................................................................ 69
3.6 Évaluation ............................................................................................................................ 69
3.7 Recommandations d’aménagement ..................................................................................... 70
3.8 Recherche future .................................................................................................................. 70
4. ANCHOIS .................................................................................................................................. 71
4.1 Identité du stock ................................................................................................................... 71
4.2 Les pêcheries ........................................................................................................................ 71
4.3 Indices d’abondance............................................................................................................. 72
4.3.1 Capture par unité d’effort ............................................................................................ 72
4.3.2 Campagnes acoustiques .............................................................................................. 72
4.4 Échantillonnage des pêcheries commerciales ...................................................................... 72
4.5 Données biologiques ............................................................................................................ 72
4.6 Évaluation ............................................................................................................................ 72
4.7 Recommandations d’aménagement ..................................................................................... 73
4.8 Recherche future .................................................................................................................. 73
ix
5. CHINCHARD ET AUTRES CARANGIDÉS ......................................................................... 74
5.1 Identité du stock ................................................................................................................... 74
5.2 Les pêcheries ........................................................................................................................ 74
5.3 Indices d’abondance............................................................................................................. 75
5.3.1 Capture par unité d’effort ............................................................................................ 75
5.3.2 Campagnes acoustiques .............................................................................................. 75
5.4 Échantillonnage des pêcheries commerciales ...................................................................... 75
5.5 Données biologiques ............................................................................................................ 76
5.6 Évaluation ............................................................................................................................ 76
5.7 Recommandations d’aménagement ..................................................................................... 77
5.8 Recherche future .................................................................................................................. 77
6. CONCLUSIONS GÉNÉRALES .............................................................................................. 77
REFERENCES/RÉFÉRENCES ...................................................................................................... 82
TABLES/TABLEAUX
(83–112)
FIGURES/FIGURES
(113–144)
APPENDIXES/ANNEXES
I List of participants/Liste des participants ............................................................................... 145
II Biomass dynamic model with environmental effects – User instructions .............................. 147
(in English only/en anglais seulement)

1
1. INTRODUCTION
The second meeting of the FAO/CECAF Working Group on the Assessment of Small Pelagic Fish –
Subgroup South met in Accra, Ghana, from 19 to 28 October 2009.
The Working Group on Pelagic Resources was created during the fifteenth session of the Fisheries
Committee for the Eastern Central Atlantic (CECAF) which was held in Abuja, Nigeria from 1 to
3 November 2000 (FAO, 2001). The first meeting of the Working Group was held in Limbé,
Cameroon, from 25 September to 1 October 2006.
The overall objective of the Working Group is to contribute to the improved management of small
pelagic resources in West Africa through the assessment of the state of the stocks and fisheries to
ensure sustainable use of these resources for the benefit of coastal countries.
The species assessed by the Group were: sardinella (Sardinella aurita, Sardinella maderensis and
Sardinella spp.), bonga (Ethmalosa fimbriata), anchovy (Engraulis encrasicolus) and horse mackerel
(Trachurus trecae) and Decapterus spp., in the region between the northern border of Guinea-Bissau
and the southern border of Angola.
The meeting was funded by Project GCP/INT/003/NOR – Strengthening the Knowledge Base for and
Implementing an Ecosystem Approach to Marine Fisheries in Developing Countries, “EAF-Nansen”
and organized by the FAO in collaboration with the Marine Fisheries Research Division of Ghana.
Altogether 16 researchers from 14 different countries and FAO took part in the meeting.
1.1 Terms of reference
The terms of reference of the Working Group which were adopted by the CECAF Sub-Committee
(FAO, 2001) were:
1. To update (to 2008) the catch and effort statistics by country and by species.
2. To consolidate and update biological information on catches, in particular length and age, if
available. To proceed with a review of the trends and quality of the available data.
3. To select the most reliable data sources and assessment methods.
4. To assess the current state of the different stocks in the subregion using the available catch and
effort information, the biological data and the data from the research surveys.
5. To present the different stock management options for the various stocks, pointing out the
long and short-term effects.
6. To identify gaps in the data which need to be remedied during future Working Group
meetings.
1.2 Participants
Williams Akambi Bamikole Nigeria
Tarub Bahri FAO/Rome
Paul Bannerman Ghana
Antònio Barrados Angola
Iça Barri Guinea-Bissau
Ana Maria Caramelo FAO/Rome
José Dias de Sousa Lopes Sao Tome and Principe
Alvin S. Jueseah Liberia
Kossi Maxoè Sedzro Togo
Samuel Quaatey Ghana
2
Micheline Schummer Gabon
Sheku Sei Sierra Leone
Zacharie Sohou Benin
Merete Tandstad FAO/Rome
Joanny Tapé Côte d’Ivoire
Sory Traoré Guinea
Jean Tsomba Dihonga DR Congo
Samatha Vida Osei Ghana
George Yongbi Cameroon
Names and full addresses of all participants are given in Appendix I.
1.3 Definition of the working area
The assessment area of the Working Group is the southern part of the Central-Eastern Atlantic
(CECAF area), from the Northern border of Guinea-Bissau to the South of Angola.
1.4 Structure of the report
A separate section is devoted to each of the main groups of species (sardinella, bonga, anchovy, horse
mackerel and other carangids). For each of these, standardized information is given on stock identity,
the fisheries, abundance indices, sampling, biological data, assessment, management recommendations
and future research.
1.5 Overview of fisheries and landings
There was a decrease of 18 percent in total landings of the main small pelagic fish landed in the region
from 413 000 tonnes in 2005 to 342 000 tonnes in 2007. However, the trend observed since 1999 is
rather stable, with few years showing catches either higher (1996 and 2003) or lower than the average
(Figure 1.5.1a). Total landings of small pelagic fish for the period 1990–2007 have been fluctuating
around 494 000 tonnes.
The round sardinella (S. aurita) constituted nearly 23 percent of total landings of small pelagic fish,
thus ranking the most important small pelagic fish in the region. Total landings of round sardinella
have been fluctuating between 54 000 and 237 000 tonnes over the period 1990–2007 with an average
of about 113 000 tonnes. The overall trend is a relatively steady decrease (with fluctuations) in
landings for this species since 1999, with a total landing of about 65 000 tonnes in 2007
(Figure 1.5.1a).
The landings of flat sardinella (S. maderensis) in 2007 were 56 000 tonnes with a contribution to the
total landings of the main small pelagic fish in the region of about 10 percent. Compared with the total
landings of the round sardinella in 2007, flat sardinella is just over 15 percent lower. The average for
the period 1990–2007 for this species is 48 000 tonnes. Some countries report catches for
Sardinella spp. as a whole, without separating the species. This could be misleading when comparing
the catches of S. aurita and S. maderensis. However, for those countries that provide figures by
species, Sardinella aurita remains the most important one.
Anchovy (Engraulis encrasicolus) and bonga (Ethmalosa fimbriata) are very important species in the
southern region of CECAF. The total landings of anchovy in 2007 were around 13 000 tonnes,
declining by about 70 percent compared to 2005 (Figure 1.5.1a). This decrease may be related to the
fluctuations characterizing anchovy stocks, as 2008 indicates an increase of the catches
(48 000 tonnes) and yet 2008 statistics are still incomplete as some countries still need to report their
catches. An average of 70 000 tonnes of anchovy were recorded for the period analysed. Landings of
bonga in 2007 constitute about 20 percent of total landings of small pelagic fish in the subregion.
Bonga, an estuarine species is mainly targeted by artisanal fishers operating in all the subregion. Total
3
landings of bonga in the subregion were 151 000 tonnes in 2007, which constitutes an increase of
about 13 percent compared to the 2005 landings (133 000 tonnes).
The horse mackerel (Trachurus trecae) is an important species, constituting about 9 percent
(approximately 27 000 tonnes) of the total landings of the main small pelagic fish in 2007. The trend
of the catches fluctuates over the period 1990–2007 and shows a general decrease. Total landings of
horse mackerel in the subregion were 27 000 tonnes in 2007, which constitutes a decrease of about
31 percent compared to the 2005 landings (39 000 tonnes).
Trachurus sp. constitutes about eight percent (15 000 tonnes) of the total landings of the main small
pelagic fish in 2007. The trend shows an overall decrease over the period 1990–2007, but with an
increase during the last three years (2005, 2006 and 2007). Total landings of Trachurus sp. in the
subregion were 15 000 tonnes in 2007. They increased of about 130 percent compared to the 2005
landings (6 500 tonnes).
Guinea-Bissau
Fisheries
Studies carried out on artisanal fishery provide an estimate of 5 000 to 10 000 fishermen, 650 to
2 500 pirogues and catches of 30 000 to 52 000 tonnes per year (PASP, 2007). The types of pirogues
used are the following: bote, monoxile pirogue, improved monoxyile, nhominca and salam type, with
length varying between 1 and 20 metres.
The small pelagic industrial fishery was run by Russian vessels between 1990 and 1993. After this
period, the number of Russian vessels declined, as they were replaced by vessels from Panama and
Belize. During the period 1990 to 1997 and 2000 to 2007, more than 30 countries fished in Guinea-
Bissau. Three countries were responsible for the most significant catches of small pelagic fish in
Guinea-Bissau: Russian Federation 43 percent, Panama 33 percent, and Belize 11 percent. This
represented more than 85 percent of the catches.
Landings
The most important small pelagic species caught are Ethmalosa fimbriata and Mugil spp., Ethmalosa
is the most important. This species is processed and smoked for consumption in the country and for
the exportation to the subregional market.
The industrial catch is dominated by horse mackerel (Trachurus trecae, 52 percent), sardinella
(Sardinella spp. 35 percent), mackerel (Scomber japonicus, 5 percent), Senegal jack (Caranx
senegallus, 4 percent). These species represented 86 percent of the catches in the periods 1990–1997
and 2000–2007. The remaining 14 percent include species such as Pomatomus saltatrix, Rachycentron
canadum, Scomberomorus tritor, Lichia amia, Orcynopsis unicolor, Eucinostomus melanopterus,
Trachinoptus spp. Elops lacerta, and Mugil spp. with catches around 338 000 tonnes (Figure 1.5.1b).
Guinea
Fisheries
The artisanal fleet targeting small pelagic fish is composed of vessels of the littoral fleet (operating in
estuaries and in areas where the bottom does not exceed 10 m depth) and the coastal fleet (operating in
areas where the bottom can reach 20 m depth). The vessels of the littoral fleet are the kourous, the
gbankenyi, the small salan with sails. These vessels rarely have an engine. The vessels of the coastal
fleet are the flimbote and the large salan. They all have an engine of 25 hp or more. Five main types of
gear are used nowadays by the Guinean artisanal fishery: bonga drifting gillnet, encircling bonga
gillnet, encircling mullet gillnet, encircling bobo croacker gillnet, and surrounding net. Of these
pelagic gears the bonga drifting gillnet and the encircling bonga gillnet are the most important in terms
of coastal, small pelagic catch in Guinea. The number of artisanal fishing vessels exploiting coastal,
small pelagic species in Guinea has increased from 1 275 in 1995 to more than 1 900 canoes in 2004.

4
The industrial pelagic fleet is composed of trawlers of which the length varies between 65 and
88 metres with a GRT of between 1 600 and 2 300. These pelagic trawlers are large industrial vessels
whose engine power often exceeds 2 000 hp. The number of pelagic vessels operating in Guinea since
1995 varies between two and six vessels each year. It should be noted that the pelagic vessels come
from the ex-USSR (above all Ukraine and the Russian Federation) and are chartered by
Guinean shipowners.
Landings
The bonga (Ethmalose fimbriata) is the main small pelagic fish species, exclusively targeted by
artisanal fishery and constituting about 69 percent of the total landings of small pelagic fish in 2007.
The landings1 of bonga decreased from 53 000 tonnes in 2003 to 11 300 tonnes in 2005 before
increasing again progressively until 28 000 tonnes in 2007 (Figure 1.5.1b). The average landings of
bonga for the last five years (2003–2007) were about 30 000 tonnes and the trend of the landings is
decreasing, even though the general trend of bonga catches increases over the period 1995–2007.
The round sardinella (Sardinella aurita) was the second most important species landed in 2007, with a
total of 3 500 tonnes, constituting about eight percent of the total landed in Guinea. The round
sardinella landings increased from 4 000 to 7 600 tonnes between 2003 and 2004, but then decreased
annually starting in 2004 to reach 3 100 tonnes in 2007. The average catch is 4 800 tonnes over the
last five years and the overall trend decreases during this period. The general trend of the round
sardinella landings increases over the period 1995–2007.
The flat sardinella (Sardinella maderensis) represented seven percent of the total small pelagic
catches, which corresponds to 2 500 tonnes. The catches decreased progressively from 3 700 tonnes in
2003 to about 700 tonnes in 2005 (55 percent respect to 2004) and then increased up to 2 500 tonnes in
2007. The average catch over the last five years is 2 000, with an overall decrease of the trend during
this period. The general trend of flat sardinella catches decreases over the period 1995–2007.
The total landings of the horse mackerels (Decapterus spp. and Trachurus spp.) constituted
respectively five and one percent of the small pelagic fish landed in Guinea with an average over the
last five years of about 2 900 and 900 tonnes respectively. The trend of the landings for horse
mackerel decreases over the last five years and over the whole period 1995–2007 (Figure 1.5.1c).
Sierra Leone
Fisheries
The artisanal fishery operates in estuaries, bays and inshore waters, and the fishing activities are
largely concentrated in a stock of 15–45 km from the coast and a depth of less than 50 metres. This
fishery comprises a variety of dugout and planked canoes and a recent frame survey showed that there
are about 8 000 fishing crafts of different sizes of which about 10 percent of these crafts are
motorized. These fishing crafts employ diverse ranges of fishing gears, which include castnets, ring
nets, driftnets, setnets, beach seines and hooks. This fishery contributes significantly to the total
national fish production and about 70 percent of the catch is composed of Ethmalosa fimbriata and
Sardinella spp.; Illisha africana also occurs in large quantities. These species are mainly caught by
ring nets, beach seines and surface driftnets.
The industrial fishery sector, which is foreign-dominated, is characterized by a multinational fishing
fleet with gross tonnage ranging from 75 to over 800 GRT. Over the last 20 years the industrial fishing
fleet has consisted mainly of shrimpers, fish trawlers, canoe support vessels (mother vessels) and
carriers. These fleets operate in the open deep waters, although the shrimpers mostly operate in
inshore waters where their target species are concentrated. The bulk of the industrial fishing fleet are
shrimp trawlers, hence the landings of finfish are largely a bycatch of inshore demersal species; some
1 Landings data of bonga for the period 1995–2004 were revised and corrected.
5
pelagic species such as Decapterus spp., scomberids, Chloroscombrus chrysurus and other carangids
also occur as bycatch.
The number of licensed vessels reached a total of about 180 in 1987, of which a good number were
pelagic purse seiners from the ex-USSR. However, this number gradually decreased in the early
1990s, primarily due to the withdrawal of the former Soviet vessels, and lately due to the effect of the
civil war. This situation drastically reduced the landings of the Trachurus spp. (pollock),
Sardinella spp. (herring) and the mackerels (Scomber japonicus and Scomberomorus tritor).
Landings
In the past, the bulk of the pelagic landings came from the industrial fishery sector (Soviet fleet)
whose fishing operations were concentrated in the northern part of the shelf, but since the abrogation
of the fishing agreement with the ex-USSR, the artisanal fishery has been the dominant force. This is
due to the fact that shrimpers largely dominate the current fleet composition in the industrial fishery,
and thus the landings are dominated by inshore demersal species. In recent time, the bulk of the small
pelagics landings come from the artisanal sector.
The artisanal catch production from 1994 to 2002 is mainly based on extrapolation, as the number of
boats and effort was not available for proper statistics. This situation was due to the inability to
conduct proper frame survey during the ten-year civil unrest. However, with the establishment of the
ARTFISH2 program in 2003, the Statistics Unit of the Ministry of Fisheries and Marine Resources has
been able to actualize systematic data collection and reliable statistics in the artisanal fisheries sector.
According to the catch statistics, the artisanal catch data tripled that of the industrial catch for these
years. It is worth noting that over 70 percent of the total artisanal production constitutes
Ethmalosa fimbriata and Sardinella spp. The landed Sardinella spp. largely comprises of Sardinella
maderensis, which is concentrated in coastal waters. Sardinella aurita tend to occur in upwelling areas
in offshore waters.
Landings of all the main small pelagic fish in Sierra Leone have shown important interannual
fluctuations during the period from 2002 to 2008 with an overall increasing trend (Figure 1.5.1c). The
bonga (E. fimbriata) and sardinellas (Sardinella spp.) dominated landings of the main small pelagic
fish in Sierra Leone in 2005. The total landings of these species were around 53 000 (about
68 percent) and 22 000 (about 29 percent tonnes) respectively (Figure 1.5.1d).
Liberia
Fisheries
Liberia has a coastline, of about 579 kilometres stretching from Grand Cape Mount County, Liberia
and Sierra Leone border to Maryland County, Liberia and Côte d’Ivoire border. The continental shelf
has an irregular shape (narrow at some points and wider at another). The fisheries of Liberia are
divided into industrial and artisanal fisheries. The industrial fleets are comprised of mainly double rig
shrimp trawlers targeting shrimp and demersal species such as sole, grunts, snappers. The fleets have
varied in size and gross tonnage ranging from 90 to 300 tonnes over the years. Total fleet (artisanal
and industrial) recorded in 2008 is 39 vessels. The artisanal fishers mainly target the pelagic fish
resources and they operate within the 6 nautical miles (inshore zone) fraction of the EEZ that was set
aside for artisanal fishers activities.
The fisheries resources include pelagic species such as Sardinella spp., Trachurus trecae,
Scomber japonicus, Sphyraena spp., Salene dorsalis, Ethmalosa fimbriata, Decapterus spp., etc. The
artisanal fisheries use mainly small 7-metre dugout canoes manned by 1–3 fishermen and propelled by
paddles or by small outboard engines. The main gears used by this fleet segment are hand lines and
gillnets. Larger canoes of about 12 metres and propelled by 25 or 40 hp outboard engines target the
2 Artisanal fisheries stock assessment programme.

6
small pelagic fishes using ring nets and surround nets. This fishery is practiced mainly by Fanti fishers
from Ghana and their catches account for about 40 percent of the total artisanal landings in weight.
Between 1999 and 2004, the overall average catch for marine fisheries was 7 757 tonnes per annum,
with the highest production in this period being 11 472 tonnes in 1999. The most important species
caught in terms of quantities were those belonging to the sardine and herring family, which accounted
for about 23 percent of the total marine catches.
Landings
The overall landings of the main pelagic fishes in Liberia have shown fluctuations from 1999 to 2007.
An overall increase in total catch was observed over the period 1997–2004, from 648 tonnes in 1997
to 2 523 tonnes in 2004. Then the catches fluctuate after 2004. Average total landing of small pelagic
species from 2005 to 2008 is 1 835 tonnes. The highest catch of small pelagics was observed in 2007
from 1 136 tonnes in 2006 to 3 109 tonnes in 2007 representing a 21 percent increase in 2007
(Figure 1.5.1e).
Côte d’Ivoire
Fisheries
Despite the existence of an artisanal fishery, no data are available because of a poor monitoring,
especially in the last years. The industrial fleet is composed of around 20 vessels more than 40 years
old the majority of which are national. These vessels use surface trawls and recently encircling surface
gillnet and operate along the entire coast at more than 4 NM from the coast.
Landings
The industrial fleet lands its catches at Abidjan harbour early in the morning and until 9 am. The
industrial production is largely dominated by round sardinella (Sardinella aurita) which constitutes
over 60 percent of the catches. The landings for this species decreased from 9 000 to 4 600 tonnes
during the period 2003–2007 (Figure 1.5.1f).
Ghana
Fisheries
The artisanal purse seine gears and beach seines are the main exploiters of the pelagic resources. There
are two types of artisanal purse seine gears and the difference is in the mesh size. The purse seine with
the 25 mm mesh size is locally called “watsa” while the one with 10 mm mesh size is called “poli”.
The beach seine has a mesh size of 10 mm and operates from the beach, mainly along estuaries. The
artisanal gears are operated from dugout canoes and there are 2 500 artisanal purse seine canoes and
903 beach seine canoes operating along the entire coast of Ghana. The canoes vary between 12 and
18 m in length and are powered by outboard motors of 40 hp.
The inshore fleets are locally built wooden vessels fitted with inboard engines of up to 400 hp and
have lengths ranging between 8 and 37 metres. These vessels are multipurpose and are used for both
purse seining and bottom trawling. They operate as purse seiners during the upwelling periods and
switch to bottom trawling for the rest of the year. The purse seiners target the sardinellas, chub
mackerel and other Carangidae species. They fish in the same coastal waters as the artisanal fleet
during the upwelling seasons. There are about 230 inshore vessels operating from seven landing
centres (these are sites with a port or semi-harbour facility).
Landings
Overall landings of the main small pelagic fish in Ghana showed fluctuations from 1990 to 2008. A
small increase in total landings was observed in 2003 from around 140 000 tonnes in 2002 to about
170 000 tonnes in 2003, followed by a decrease in 2004 of about 9 percent. Since 2005, catches of the
small pelagics have fluctuated falling to a low of approximately 137 000 tonnes in 2007 then rising to
182 000 in 2008. The total landings of the main small pelagic fish in Ghana in 2008 were dominated
by the two sardinella species constituting about 65–70 percent of the total. Landings of these species
7
increased from around 94 000 tonnes in 2003 to around 109 000 tonnes in 2004, representing a
16 percent increase in landings of the two sardinella species (Figure 1.5.1d). Landings of bonga
(E. fimbriata) consisted of about 19 percent of total landings of small pelagic fish in 2004, increasing
by 37 percent as compared to 2003. Among the total sardinellas, S. aurita accounted for 61.2 percent
of the resource. Currently landings of the sardinellas, anchovy and bonga shad in 2008 are 40 676,
40 612 and 1 805 tonnes respectively (Figure 1.5.1g).
Togo
Fisheries
There are seven types of fishing gear used by the artisanal fishery. These are ring purse seine, beach
seine, surface gillnet, bottom set gillnet, floating gillnet, shark gillnet and line. The different gears are
used all year round but particularly intensely between July and October. The purse seine is used to
catch all small pelagics. The Caranx crysos, Caranx hippos spp., Trachurus spp., Sardinella aurita,
Sardinella maderensis and Engraulis encrasicolus species are the most fished. The period of greatest
abundance in the Togolese fisheries of these species is from July to October each year which
corresponds to the high season. The Engraulis encrasicolus species is the most abundant in the purse
seine catches (around 50 percent). Like the purse seine the beach seine is used for catching small
pelagics. The surface gillnet is used above all for Sardinella aurita and Sardinella maderensis. The
bottom set gillnet is used to catch bottom species, in particular the Pseudotolithus spp., the
Pagellus spp. and the Galeoides decadactylus. The floating gillnet catches Exocoetus volitans,
Hemiramphus brasilensis, Strongylura senegalensis, etc. The industrial fishery is not very developed.
Since 1999 it has been almost inexistent. The fleet is generally made up of small trawlers.
Landings
Anchovy (E. encrasicolus) is the main target species and dominated landings of the main small pelagic
fish in Togo. Anchovy landings constituted about 42 percent of total landings of all the main small
pelagic fish in 2004. An average of about 8 000 tonnes of anchovy was landed over the last five years
(Figure 1.5.1e). Landings of S. aurita consisted of about 28 percent of total landings of small pelagic
fish in 2004, increasing by 17 percent as compared to 2003 (Figure 1.5.1h).
Benin
Fisheries
The small pelagic fishery mainly concerns the artisanal maritime fleet. In Benin, there is no industrial
fleet as such in the pelagic fishery. Nevertheless, some trawlers do land around 10 tonnes of small
pelagic species per year. The artisanal fleet is composed of more than 600 canoes mainly fishing with
purse seines, sovi bottom set gillnets, sardinella gillnets, dagbadja gillnets, beach seine and ali-watcha
gillnets.
Landings
Sardinella3 is the main target species and dominated landings of the main small pelagic fish in Benin,
constituting about 35 percent of total landings of this group of species over the last five years (2004–
2008). The average landings of artisanal fishery for horse mackerel are 116 tonnes and show an
increase over the last three years. As for the industrial fishery, the landings for this species are in
average 2 tonnes for the last three years. The Carangidae are divided in three groups: Caranx spp.,
Trachurus trecae and other species of Carangidae. This last group includes Chloroscombrus
chrysurus, Alectis alexandrinus and Selene dorsalis, species for which data are available. An average
of about 1 415 tonnes of Sardinella maderensis and 606 tonnes of Sardinella aurita were landed over
the last five years (Figure 1.5.1i). Given the conditions of work in the field, it is not easy for the
inspectors to identify and separate the species. The other carangidae and Ilisha africana are important
3 The two sardinella species are not always split in the landings, but field observations indicate that this group is mainly
composed of the flat sardinella (S. maderensis) (Gbgaudi, pers. comm., 2009).

8
species in Benin and represented respectively about 17 and 15 percent of the landings over the last five
years. Data for industrial fishery are available from 2006 onwards.
Nigeria
Fisheries
The artisanal crafts used for the exploitation of the pelagic fishery range between 5.8 length overall
(LOA), width of 1.26 m and depth of 0.56 m and 7.9 m LOA, width 1.55 m and depth 0.75 m. The
Ghanaian dugout canoe’s LOA ranges between 12 and 18 metres and 1.3 to 1.8 m width. The mesh
sizes used for artisanal fisheries range between 45 and 50 mm for adult Sardinella spp. The Ethmalosa
fimbriata is fished by various gears depending on the stage being targeted. For adult bonga the mesh
size is 76 mm, pre-adult the mesh size is 42 mm and the fry is 12 mm in the creeks. Two types of
purse seine gears are used and the difference is in the mesh size. The purse seine with the 25 mm mesh
size is for adult sardinella, bonga, Caranx spp. and scombrids, while the 10 mm mesh size purse seine
targets juveniles of sardinella, bonga and anchovy. Both gears are used in coastal waters. The beach
seines with mesh size of 10 mm operate from the beach, mainly in lagoons and estuaries, and exploit
adult sardinellas and anchovies and juvenile Sardinella spp., Ilisha africana, Caranx spp. and
Ethmalosa fimbriata. When the target species move further out to sea outboard engines are used. The
canoes use outboard engines of 25 and 40 hp. The 40 hp engines are used by canoes with 12–18 m
length overall.
Landings
Overall landings of the main small pelagic fish in Nigeria showed fluctuations from 1990 to 2007. An
increase in total landings was observed from around 135 000 tonnes in 1995 to about 168 000 tonnes
in 1999, followed by a decrease in the following years. This was due to the increase of landings of the
round sardinella (S. aurita) during this period. The total landings of the main small pelagic fish in
Nigeria were dominated by bonga and sardinellas, together constituting about 60 percent of the total
(Figure 1.5.1j).
Cameroon
Fisheries
Over 6 500 canoes of different types (monoxyles and plank) are used in this fishery. These canoes are
either driven by the wind, paddles or outboard engines (percentage motorization of about 28 percent).
There are also many types of fishing gears: hooks and line, underwater guns, gillnets and diverse seine
nets. The purse seine net is utilized in very large canoes (15–20 m), generally powered by 40 hp
engines. This gear, known as Awasha (Ghanian appellation: Watsa in West Africa), requires a team of
20–30 fishermen for it to be manipulated easily. There are a total of about 100 canoes carrying out this
activity. The encircling gillnet operates in shallow areas. The canoes utilized here are generally of an
average size of 8–13 m and powered by 8 hp engines and with an average of 2–3 fishermen. There are
a total of about 890 canoes carrying out this activity. The surface gillnet is used by two types of units:
motorized units with average size canoes powered by 8 hp engines and operated by two to three
persons, and non-motorized hand-paddled small size paddle canoes with one to two people.
Landings
Data points are available from 1990–2008 for Ethmalosa fimbriata and from 1994–1996 and 2002–
2008 for Sardinella maderensis with artisanal fisheries. In addition there are data from 2002–2005 for
Caranx spp. and Illisha africana.
Industrial catch data is given for Sardinella spp., Caranx spp. and S. japonicus. Cameroon just carried
out a frame survey and is still awaiting analysis of the data. There is intention to embark on a new data
collection scheme and the trends will be described in the next working group (Figure 1.5.1k).

9
Sao Tome and Principe
Fisheries
Artisanal fishery is an important source of employment and livelihood for numerous families along the
coast. Artisanal fishery employs directly over 5 000 persons (fishermen and women selling fish).
Around 25 000 persons make their living out of fishing activities. Fishery products are generally sold
fresh, salted and smoked on the markets.
Artisanal fishing is carried out with 3 to 6-metre monoxyle pirogues (wind or paddle driven), with or
without engine and with one to two fishermen on board. The gears most commonly used are the
surface and the drifting gillnets, circling or bottom nets, hand lines and bottom lines.
Landings
In Sao Tome and Principe, the artisanal fishing is carried out by a small fleet using flew gears;
therefore catches of small pelagic fish are low, with 785 tonnes in 2007. The species most represented
in the catches of Sao Tome and Principe are not in the CECAF list. The most common species are
Sardinella spp., Caranx spp., C. rhonchus, as well as Hemiramphidae and Exocoetidae. The most
fished species is Caranx spp. (200 tonnes in 2007), representing nearly a quarter of the catches,
followed by Cypselurus minos and Hemiramphus brasiliensis (Figure 1.5.1l).
The catches are landed on the two islands. Few boats are dedicated exclusively to small pelagic
fishing. The reported catches show a stable trend between 2000 and 2008 for all species.
Gabon
Fisheries
Small pelagic fish is targeted mainly by artisanal fishery; however, some bycatch of small pelagic fish
is landed by the industrial fleet.
The marine artisanal fishery takes place in the coastal area within 3 NM from the coast. It is operated
mainly by foreign fishermen (Nigerians, Beninese, Ghanaians, Togolese, Sao-Tomeans, Senegalese,
Equato-Guineans) and some local fishermen (20 percent).
The small pelagic fish species landed are mainly Clupeidae (Ethmalosa fimbriata), Carangidae
(Caranx hippos, etc.), Mugilidae (Mugil cephalus, etc.) and Scombridae (Scomber japonicus, etc.).
The vessels of the artisanal fleet are fiberglass pirogues manufactured industrially in Gabon and with
characteristics that vary according to the fishing area, gears used and storage mode of the fish on
board. Fishermen also use monoxyle pirogues with a flat bottom.
The pirogues are 6 to 13 metres length and 80 percent are driven by 8 to 40 hp engines. In 2008,
1 772 fishermen using pirogues operated in the national waters.
There are several fishing techniques using different types of gears: the encircling seine and encircling
gillnet used to catch bonga (Ethmalosa fimbriata) (fished from December to March and from June to
August), the surface drifting gillnet, the beach seine and the lines.
Landings
Overall landings of the main small pelagic fish in Gabon showed fluctuations from 1995 to 2008.
E. fimbriata landings constituted about 78 percent of total landings of all the main small pelagic fish in
2008. There is a decrease in the trend of the catches, from 19 000 tonnes in 1998 to 8 300 tonnes in
2008. The second more important species in the landings is the round sardinella, with catches showing
important fluctuations. The catches of mullet (Mugil cephalus) are rather stable. The average total
landings of small pelagics in the last five years is about 12 200 tonnes (Figure 1.5.1m).
10
For management and protection purposes, a closed fishing season was established for the bonga
(Ethmalosa fimbriata) in 2003, from 1 September to 31 October each year. A fishing area was also
established for Donguila at the Komo estuary.
Moreover, a decree establishing a biological rest from 1 January to 31 April of each year was signed in
2007. The geographic delimitation of the relevant areas for biological goes from the Rio Muni Estuary
to Cap Lopez, within 12 NM.
Democratic Republic of Congo
Fisheries
Small pelagic fish is exclusively exploited by the artisanal fleet in the Democratic Republic of Congo.
This fishery is based in Moanda in the Province of Bas-Congo and it is carried out with 7 to 16-metre
monoxyle pirogues 75 percent of which are non motorized hand-paddled and 25 percent powered by
outboard engines. The main gear used are small mesh surface gillnets targeting round sardinella
(Sardinella aurita) and flat sardine (Sardinella maderensis) and large mesh surface gillnets targeting
bonga (Ethmalosa fimbriata) and horse mackerel (Trachurus trecae).
Landings
Landings of small pelagic fish increased substantially over the last 3 years (2006–2008), from
97 tonnes in 2006 to 326 tonnes in 2007 and 933 tonnes in 2008. Sardinella maderensis and
Sardinella aurita constitute 75 percent of the catches (Figure 1.5.1o).
Angola
Fisheries
Commercial fishing for small pelagics started in the 1950s with the objective of contributing to the
development of the fish meal industry. Until 1975, fishing was done by small boats of 40–50 tonnes,
operating mainly in the area from Benguela to Namíbe. During this period the catches of horse
mackerel and sardines were about 500 000 tonnes.
Since the Independence in 1975, the catch declared for the horse mackerel decreased significantly. In
1976, the catch of the national fleet was below 76 000 tonnes. In 1980 the catches were about
100 000 tonnes for horse mackerel and 297 000 for sardinellas, due to the activity of the foreign purse
seiners that started fishing in the country with the support of fish processing factories.
In 1990, the foreign fleet which represented the highest fishing effort stopped fishing and the catches
decreased to 48 000 tonnes for horse mackerel and 87 000 for sardinellas. The sardinella landings
increased again until 1995 and reached 119 000 tonnes, before decreasing drastically over the last
period. Horse mackerel catches fluctuate over the period 1990–2003 but with a general decrease.
However, the reporting system of the catches is not reliable for the period 1999–2007 and therefore
these data should be considered with caution. In 2008, the data collection system was improved and
the catches reported are 44 000 tonnes of horse mackerel and 70 000 tonnes for sardinellas.
The industrial fishery is mostly operated by 70 purse seiners for horse mackerel, sardinellas and other
carangids. There are 34 demersal trawlers that catch some pelagic fish (horse mackerel and other
carangids) as bycatch.
Landings
With respect to Angola it should be noted that different data sources provide very different estimates.
The data should therefore be treated with caution and the discrepancies should be looked into and
clarified before the next meeting. Sardinella spp. and horse mackerels contribute with about
76 percent of the total landing in 2008 (Figure 1.5.1o).

11
1.6 Overview of survey results by R/V DR. FRIDTJOF NANSEN
Several pelagic surveys have been carried out in the region since the 1980s, all of them by the
Norwegian R/V DR. FRIDTJOF NANSEN. The Senegalese R/V ITAF DEME has also carried out
pelagic surveys in Sierra Leone in 2008 and 2009. A list of surveys carried out since 1999 is provided
in Table 1.6.1.
The longest survey series is that of Angola, where R/V DR. FRIDTJOF NANSEN has carried out
acoustic surveys since 1985. From 19954 to 2007, a series of annual acoustic surveys have been
carried out in the same season (August–September). In 2008 and 2009 the survey was carried in May-
July. The surveys aimed to map the distribution and estimate the abundance of the main small pelagic
fish species, sardinella (Sardinella aurita and S. maderensis), horse mackerel (Trachurus trecae and
T. capensis) and mackerel (Scomber japonicus). The distribution of other pelagic resources was also
mapped and their abundance was estimated. The abundance estimates from the surveys are presented
as numbers and biomass per length-group.
For some of the years (1985, 1989, 1994, 1995 and 1996), the surveys were extended to Gabon and
Congo to make sure that the horse mackerel and sardinella stocks shared by Angola, Congo and
Gabon were fully covered. Three surveys have also been carried out in recent years in Congo and
Gabon (2004–2008) (Figure 1.6.1d), just prior to the Angola survey. The first of these was a survey to
study sardinella recruitment, whereas the two latter (2005 and 2006) were combined acoustic and
demersal surveys carried out in conjunction with the surveys in the Central Gulf of Guinea (Nigeria,
Cameroon, Sao Tome and Principe) (Figure 1.6.1c). A combined acoustic and demersal survey was
also carried out in the Central Gulf of Guinea in 2004. Amongst other things, these surveys aimed to
map the distribution and estimate the acoustic abundance of the main small pelagic species/groups in
the region; to describe the distribution, composition and estimate the abundance of the main demersal
species on the shelf by a swept-area trawl programme; to collect zooplankton samples for distribution
and species identification, to map the general hydrographic regime (temperature, salinity and oxygen).
Several surveys have been carried out in the Western Gulf of Guinea (Figure 1.6.1b).
Figure 1.6.1e shows the abundance estimates of the main target species in Angola from 1995 to 2006.
The overall biomass of the main target species has shown fluctuations over the period. Since 2002,
with the exception of 2005, the overall biomass has shown an increasing trend. The biomass of
Sardinella spp. has shown a fluctuating trend. The lowest biomass in the series was recorded in 2005,
followed by a record high biomass of around 600 000 tonnes in 2006. Of the two horse mackerel
species, Trachurus trecae is the dominant. Biomass of this species has also been fluctuating, with the
highest Abundance Indices s registered in the early part of the series. From 2000 to 2001 there was a
sharp drop in biomass of this species, with a biomass of less than 100 000 tonnes in 2001. From 2001
to 2004, the biomass increased, before decreasing again in 2005 and 2006. The biomass registered in
2006 was around 150 000 tonnes. Trachurus capensis has been monitored since 2001. The highest
biomass of this species was registered in 2005 with a biomass of more than 200 000 tonnes.
Figure 1.6.1c shows the biomass estimates of the main pelagic groups from the acoustic estimates in
Nigeria and Cameroon. The main species group in this area was the Pelagic II Group. This group
shows a decreasing trend over the three years, decreasing from more than 200 000 tonnes in 2004 to
around 60 000 tonnes in 2006. Biomass of sardinella was around 10 000 tonnes in 2004 and 2006. The
2006 estimate for this species has not yet been finalized. Other clupeids than sardinella are also
important in this stock and constituted a biomass of around 16 000 tonnes in 2006.
In the Western Gulf of Guinea (Côte d’Ivoire, Ghana, Togo and Benin), seven surveys have been
carried out since 1999 (Figure 1.6.1b). Five of the surveys were carried out during the period April–
June in 1999, 2004, 2005 and 2006, and two of them were carried out during the upwelling season,
4 In 1995 and 1996, two acoustic surveys were carried out, one in February–March and one in July–August.

12
one in July–August 2002 and one in September 2000. All of these surveys were combined acoustic
and demersal surveys. As for the surveys in the Central Gulf of Guinea these surveys aimed to map the
distribution and estimate the acoustic abundance of the main small pelagic species/groups in the
region; to describe the distribution, composition and estimate the abundance of the main demersal
species on the shelf by a swept-area trawl programme; to collect phyto- and zooplankton samples for
distribution and species identification, to map the general hydrographic regime (temperature, salinity
and oxygen).
Figure 1.6.1d shows the estimated abundance for all the target species/species groups in Ghana, Togo
and Benin5 for the above mentioned surveys. In general the highest abundance of small pelagics was
detected in 2002, 2004 and 2006. With values of around 130 000 tonnes, Sardinella spp. is the main
species. This species has shown some fluctuations over the period, decreasing from 45 000 tonnes in
1999 to around 37 000 tonnes in 20006. The highest biomass of this species group was found in 2002,
with around 67 000 tonnes. In 2004 and 2005, the biomass decreased somewhat before increasing to
around 58 000 tonnes in 2006. The Pelagic II Group (composed of carangids, scombrids, barracudas
and hairtail) has fluctuated around 50 000 tonnes over the period, the lowest estimate was recorded in
2004 (39 000 tonnes) and the highest in 2000 (65 000 tonnes). The 2006 estimate for this group was
42 000 tonnes). Biomass estimates of anchovy (E. encrasicolus) in Ghana, Togo and Benin have also
fluctuated over the period. The highest estimate of this species was made in 2004 (33 000 tonnes). The
2006 estimate was 1 800 tonnes, one of the lowest of the series.
Detailed estimates for the different species by stocks are given in the respective sections.
1.7 Sampling and data quality
During this meeting of the Small Pelagic South Working Group emphasis was put on constructing and
improving the data base and on developing working procedures within the Group. The Group
compiled data series on catch, effort and biological data for the main species caught in the area. The
section below provides an overview of how the relevant fisheries data are collected in the
different countries.
Guinea
Artisanal fisheries
Data are collected in two ways. The first takes place once a year and involves a complete census of
active vessels over the whole of the Guinean coast. This allows the actual number of the vessels and
fishing gears used in each port to be known. The second involves following a stratified sampling plan
to continuously collect data on activity (number and duration of trips) and landings by region and by
gear for all commercial categories or species. This operation is carried out on a sample of 21 ports
which are judged to be representative of all Guinean artisanal fishing ports.
Total landings are extrapolated from data on activity and observed landings in the 21 sample ports to
the whole of the coast based on the annual census. However, it should be noted that potential biases
may arise in the statistical extrapolation due to the eventual fluctuation in the number of active vessels
over the course of the year and to an “imperfect” distribution of fishing gears in the sample ports.
Industrial fisheries
The total number and the technical characteristics of the fishing vessels active each year in the
Guinean EEZ are collected on the basis of the fishing licences issued by the administration. Continual
follow-up of activities at sea is carried out by onboard observers who collect data on effort (fishing
days) and catch (kept and discarded). For reliability of the estimates, only the data collected by a
5 Côte d’Ivoire is also covered in these surveys, but biomass estimates are not shown given that Côte d’Ivoire
was not present at the meeting. 6 It should be noted that the overall sardinella biomass did not decrease as it was also abundant in Côte d’Ivoire.
13
group of observers carefully chosen by the Centre national des sciences halieutiques de Boussoura
(CNSHB) and embarked quarterly on the fishing vessels, following a stratified sampling plan, are
used. These data are verified and corrected and then extrapolated to all the industrial vessels active in
the Guinean EEZ over the year under consideration. Finally an exhaustive follow-up of industrial
landings is carried out at the autonomous port of Conakry by CNSHB samplers.
Sierra Leone
Industrial fisheries
Fisheries observers are placed on board all industrial vessels throughout the year. They collect and
record catch data on log books; in addition they send daily catch and effort data to the Statistics Unit
through the radio officer in the Ministry of Fisheries. The data are then input into a database
programme (IFDAS). There are also dock observers at major landing sites that collect catch landings
for the Statistics Unit.
Sampling for statistical data is continuous throughout the license period of every fishing vessel. With
regards to biological sampling, fisheries observers have been currently trained to collect quality data
onboard fishing vessels, particularly to collect catch data on species basis and biological data such as
length frequencies and length and weight data. Length frequency and length weight data exist from
current survey. An EU-funded institutional support project for fisheries management is currently
funding fisheries surveys and catch data collection in the industrial fisheries sector..
Artisanal fisheries
A sample-based method is used in this fishery wherein 25 landing sites are randomly selected out of
the 503 landing sites identified, for collecting catch and effort data. The monthly catch and effort data
are computed using the ARTFISH software.
Sampling is done twice a week in all landing sites and the sampling days are randomly selected at the
start of each week.
Liberia
Artisanal fisheries
A routine data collection is carried out in the artisanal sector of the Liberian fisheries. These data are
collected by fisheries inspectors/observers assigned at various fish landing sites along the coast of
Liberia. A weekly catch and effort data of all small-scale fishing activities is collected by fisheries
inspectors assigned in the field. Sampling scheme for the artisanal fisheries catch and effort data is yet
to be established. Plans and negotiations are on the way to develop a sampling scheme and use a
software (ARTFISH) to compute the catch and effort data of the fisheries.
Industrial fisheries
Fisheries inspectors or observers are deployed aboard industrial fishing vesssels to monitor and collect
catch and effort statistics of fishing activities of these industrial fleets. These data are reported to the
the research and statistics division of the Bureau of National Fisheries and input into the fisheries
database. VHF radio communication system is soon to be established at the Bureau of National
Fisheries for daily reporting of catch and effort data of industrial fisheries.
Ghana
Artisanal fishery
Catch statistics in the artisanal fishery are collected following a sampling scheme with designated
sampling sites (25 percent of the total landing sites) where daily records are taken except on Tuesday,
which is a traditional fishing holiday. Monthly estimates of catch by species and gear as well as
monthly effort estimates are made using the ARTFISH software.
14
Inshore fishery
A total coverage of all the inshore (semi-industrial vessels) landing sites is made on a daily basis and
records are taken and processed in the same way as for the artisanal fishery.
Industrial fishery
A total coverage of all vessels is conducted for each trip and data computed to obtain monthly
estimates of catch.
A few biological sampling was done in 2007 mainly in Tema where samples were purchased from
the fleets.
Togo
Data on catch, effort and active days are collected all year round at eight fishing sites (over a total of
20) grouped into stocks. The ARTFISH software has been used in the Togolese maritime artisanal
fishery since 1999.
Benin
Catch and effort data
The coast has been divided into four stocks. In each stock sites have been identified where sampling of
catch by gear and species is carried out. At each identified site the number of trips per day and the type
of fishing gear are recorded.
Extrapolation of the data is carried out on the basis of the survey data.
Biological data
Due to a lack of financial means, it is difficult to collect biological data. When the occasion arises,
length frequency is recorded on around 100 individuals by fishing gear.
Nigeria
The national fisheries data (catch and effort) are collected by field enumerators at both state and at the
federal level. These data are collated and analysed by the Federal Department of Fisheries and are
published as annual fisheries data.
Biological and other useful fisheries data sets are collected during survey trips to fishing villages or
landing sites by Nigeria Institute for Oceanography and Marine Research. At the sampling site, the
number of craft and gear are enumerated. The number of trips/days are recorded and the catch weight
and samples of total length and weight taken. When such trips are not possible, samples are bought
from fishermen and taken to the laboratory for further analysis.
During survey trips, samples are taken on a daily basis. When survey trips are not possible samples are
bought at a varying frequency, depending on the survey.
Cameroon
Artisanal fishery
Data on the fishing of target pelagic species was obtained through frame surveys, monthly censuses or
follow-up of canoe landing sites, surveys of activities of the fishing units (fishing days, catches, etc.),
and collection of biological data by the Ministry of Livestock, Fisheries and Animal Husbandry
(MINEPIA), the Southwest Development Agency (SOWEDA) and by research staff from the Institute
of Agricultural Research for Development (IRAD).

15
These activities were carried out in all fishing sites from Ndian division at the frontier with Nigeria to
the Ocean division close to to the border with Equatorial Guinea. The surveys were carried out
following a stratified sampling plan: landing centre by type of fishing by month as recommended
by ARTFISH.
In addition estimates were made for some missing trends of Ethmalosa fimbriata (artisanal) between
1990–1993 then 1997–2001 based on data on quantities of smoked fish shipped out of the
fishing camps.
For biological data, field staff at selected sampling sites collected length frequency data on a weekly
basis. Every month a sample of over 30 species of fish are analysed in the laboratory for gonad
maturation and stomach contents.
The sampling is done by MINEPIA field staff but the data are not analysed yearly. The only data
accessible are those collected for research purposes. There is no chronological series. The existing data
are sporadic. In 2002, a data collection system intended for continuous assessment was set up within
the framework of the SOWEDA project.
Industrial fishery
There are observers on board all industrial vessels throughout the year. Data on catches are declared
from log books by vessels to MINEPIA dock authorities. The data are then compiled and published in
annual activity reports by the responsible province.
With regards to biological sampling, there are no data so far. The Ministry is trying to put a system in
place for biological sample collection with assistance from the FAO tropical shrimp project.
Sao Tome and Principe
Artisanal fisheries
Information on artisanal fishery is collected in 10 landing sites in the north, centre and south of the
two islands. In each landing site, one field staff collects effort and catch data at random, 20 days per
month.
Catch and effort data of the semi-industrial fleet are collected at the harbour by one field staff for
each boat.
Data on industrial fishing are difficult to collect as the fishery is operated by foreign fleets in the EEZ
and observers are not allowed on board. Moreover, as there are no deep enough harbours, the
industrial boats cannot dock and therefore do not land any catch in the country. There are no reliable
data on the catches.
Gabon
Artisanal fisheries
The collection of data on the small pelagic fishery started in the mid-eighties. In 1994, statistical tools
were put in place by the General Directorate of Fisheries and Aquaculture (DGPA) for the structuring
of the data collection, storing and processing.
The stratification of the sampling design for artisanal fishery should be based on the results of an
annual frame survey. Yet, because of budget constraints, the last frame survey covering all strata was
carried out in 1998. However, on the occasion of the update of the ARTFISH software by the Statistics
Unit, a frame survey was carried out in the estuary province in 2003.
Effort data are recorded on a daily basis with information on the number of trips per day and type gear
used. Data on the catches (weight, number of fishes per catch and price) are collected in the landing

16
sites. The biological sampling is usually carried out three times per week, but the frequency may vary
according to the intensity of the fishing activity.
All the data collected are sent to the Statistics Unit of the DGPA where they are input and processed
using the ARTFISH software developed by FAO.
The main difficulty hindering the improvement of the data collection system is the absence of vehicles
to go in the field for the control of the information sent by the inspectors.
Democratic Republic of Congo
Artisanal fisheries
Statistical data are collected twice per month in the Democratic Republic of Congo (on day 15 and 30
of each month). The catches are separated by species and length and weight data are collected.
Inspectors send the data to the Territorial Inspection of Agriculture for processing. The data are then
sent to the district and the province administrations before being input in the national database.
Angola
Artisanal fisheries
Since May 1996, the Artisanal Fisheries Institute, in cooperation with FAO and the French Ministry
for Cooperation, has been implementing a control programme for the catch/effort along the coast in
which it is estimated that the production from the artisanal fisheries in 2008 was about 5 000 tonnes
for pelagic fish (2 000 tonnes for horse mackerel, 2 500 tonnes for sardinellas, 346 tonnes for
Scomber japonicus, 113 tonnes for Solene dorsalis and 245 tonnes for Caranx spp.
Industrial fisheries
Information on catch and effort is provided through log books obtained from the fishing companies.
These provide information on catch and effort on a daily basis.
The biological sampling is obtained from the semi-industrial and industrial fleets in the fishing
harbours and landing sites. Biological analysis of the measured fish is then made at the Institute for
length, weight, sex, and stomach content. The gonads are observed to see stage of maturity, and
weight. Otoliths are also extracted. Afterwards all the information is entered into the database to be
analysed.
Data quality
Despite the effort made by the countries in the region in collecting fishery data as described in the
sections above, many countries did not have reliable catch and in particular effort series for some of
the species and stocks. It was also noted that different sources of data gave different numbers for some
countries and species. Attention should be given to bring only one reliable series of catch and effort
data for stock assessments.
An important input for stock assessment is a series of abundance indices. One type of abundance index
is catches per unit of effort. For some countries some series of CPUE data exist per gear, but for some
of the stocks it is difficult to identify an appropriate CPUE series. For many stocks no reliable effort
data is available.
It is necessary, also, to have fishery independent series of stock abundance. Since the 1980s, acoustic
and demersal surveys by Norwegian research vessels have provided an important contribution in this
respect. Although the length of the time series in all stocks are not yet sufficiently long to be used as
the main abundance index in the model, they provide important information on stock distribution,
stock identity, species composition, hydrography, etc.
17
1.8 Methodology and software
A total of seven species/species groups and 14 stocks were analysed by the Group (Table 1.8.1).
After reviewing the available data, the Working Group concluded that the only class of methods that
could be applied to all stock units were Production Models (Annex II). Keeping consistency with the
methods used in 2004 for the last few years, the dynamic version of the Schaefer (1954) model was
used. To assess the current state of the stocks and estimate the model parameters, an Excel spreadsheet
implementation of the dynamic version of this model, with an observation error estimator (Haddon,
2001), was used. The model was fitted to the data using the non-linear optimizer built into the
Excel solver.
Reference points for management advice
To ensure consistency in the management advice, the 2009 Working Group decided to use the same
Biological Reference Points (BRPs) as those adopted by the FAO Working Group on the Assessment
of Small Pelagic Fish off Northwest Africa. Hence the indices B/BMSY and F/FMSY were used as Limit
Reference Points, while the indices B/B0.1 and F/F0.1 were chosen for Target Reference Points. A more
detailed explanation of these reference points and of their use in fisheries management is given in the
2006 Report of the FAO Working Group on the assessment of small pelagic fish off Northwest Africa
(FAO, 2006).
Length structured methods
For some of the stocks, like the Sardinella spp. and horse mackerel in southern stock some data on
NANSEN surveys length distributions were available. This data were transformed in catch length
composition supposing that the length distribution of the surveys were the same as the length
distribution of catches in Gabon, Congo and Angola. The growth parameters for that species were then
estimated by FiSAT II (Gayanilo, Sparre and Pauly, 2005). Therefore, a length cohort analysis (Jones,
1984) was applied to these stocks, in order to estimate the overall F-level on the fishery, and the
relative exploitation pattern in the last few years. For more information on these methods readers are
referred to Sparre and Venema (1996).
2. SARDINELLA
These stocks are influenced by a tropical hydroclimate characterized by three current systems (the
Guinea current, the Canary current and the Equatorial counter current) which affects the
oceanographic conditions and the pelagic fisheries. The dominant current system is the Guinea current
and the offshoot of the Canary current (blowing from February to April) which flows eastward along
the coast to join the westward flowing South Equatorial current (May–July) off the coast of Liberia.
The influence of the Canary current is characterized by the north-south migration of the
25 oC isotherm (Coutin and Payne, 1988). This cold Canary current, flows towards the Equator with
greater effect during February to April flowing southwards to bring cold, nutrient-rich water from the
upwelling areas, with a well-defined thermocline occurring at ‘mid-shelf’ (10 m inshore and 20 m
offshore) supporting a large quantity of commercially important small pelagic fish stocks including
sardinella.
2.1 Stock identity
Sardinellas caught in the southern CECAF area from Guinea to Angola are composed of two species,
the round sardinella (Sardinella aurita) and the flat sardinella (Sardinella maderensis). The surveys
carried out in the CECAF area show that the two species are found in a vast area stretching from the
southern Moroccan zone to south of Angola. The FAO/CECAF Working Group for the moment has
agreed on the existence of four stocks for these two species in the Southern CECAF Area. These are
northern (Guinea-Bissau, Guinea, Liberia and Sierra Leone), western (Benin, Côte d’Ivoire, Ghana,
and Togo), central (Cameroon and Nigeria) and southern (Angola, Congo, DR Congo and Gabon)
(Figure 2.1.1).
18
2.2 Fisheries
Northern stock (Guinea-Bissau, Guinea, Liberia and Sierra Leone)
The Sardinella aurita occur offshore and are exploited by the industrial pelagic trawlers of Guinea and
shrimp trawlers and purse seiners of Sierra Leone. S. aurita is the second most abundant fish after
Decapterus spp. in their catches. The shrimp trawlers and the finfish trawlers of Sierra Leone, and
Liberia fish the S. aurita and S. maderensis as bycatches. The S. maderensis occur in coastal waters
and are exploited by the artisanal canoes of Guinea, Guinea Bissau, Sierra Leone and Liberia. In these
countries, the artisanal canoes use ring gillnets, set gillnets, drift gillnets and beach seines to catch
these species. Most of the ring gillnet crafts are powered with outboard motors of 15–40 hp.
Western stock (Benin, Côte d’Ivoire, Ghana and Togo)
The catches are dominated by S. aurita off Ghana and Togo while S. maderensis is the dominant
species off Benin. The two sardinellas are exploited mainly by the artisanal fleets in Ghana, Togo and
Benin and to a lesser extent by the semi-industrial (inshore) fleet and the industrial fish trawlers in
Ghana and Côte d’Ivoire. In the three countries, the artisanal fleet uses either artisanal purse seine gear
(locally called Poli/Watsa) or beach seine to exploit the two species.
Central stock (Cameroon and Nigeria)
The sardinellas are exploited by the artisanal fleets of Nigeria and Cameroon. S. aurita is the dominant
species in the catches. Off Cameroon, the artisanal fleet uses surface gillnets. In Nigeria the adult fish
are caught in coastal waters with drift gillnets, beach seine and artisanal purse seine gears. The
juvenile fish are caught in the creeks using cast nets and scoop nets. The gears are operated in plank
and dugout canoes.
Southern stock (Angola, Congo, DR Congo and Gabon)
Since no participants were present from Congo, the data from this country are not included in the
analysis. Artisanal fleets form the main fishing fleet for the sardinellas in this region. Surface gillnets
operated from canoes are employed in the artisanal fishery while the industrial fleet uses pelagic trawl.
The dominant species off DR Congo is S. maderensis. While this species occurs all year round,
S. aurita is most abundant between May and September. Off DR Congo, the species are exploited by
both artisanal and industrial fleets. Surface gillnets operated from canoes are employed in the artisanal
fishery while the industrial fleet use pelagic trawl.
In Angola the two species were proportional, S. maderensis occurs inshore and S. aurita occurs
offshore. The abundance of sardinellas is linked to the upwelling periods. They are exploited by both
the artisanal and semi-industrial fleets. The industrial pelagic trawling was closed in 2004. The purse
seiners and artisanal gears mainly exploit the sardinellas. Sardinella maderensis is also the dominant
of the two species off Angola and occurs in coastal waters, whereas S. aurita occurs offshore. The
abundance of sardinellas is linked to the upwelling periods.
Catch and effort
The catches of sardinella are shown in Tables 2.2.1a,b,c. Effort is shown in Table 2.2.2 and
Figures 2.2.2a,b.
Northern stock
The two species of sardinella are caught all year round with peak periods in January–May and
September–December. The peak catches coincide with the upwelling periods in the area. Fishing
effort on sardinella is from the artisanal and industrial sectors. The artisanal effort for Guinea is the
largest in the region and is presented in Table 2.2.2 and Figures 2.2.2a,b from 1995 to 2007. There is a
decreasing trend since 2005.
19
Western stock
Peak catches of the two species occur in June–September which coincides with the major upwelling
period in the area. Fishing effort on sardinella in this region is mainly from the artisanal sector. Ghana
has the largest series of effort for sardinella in the region, from 1990 to 2008 for inshore fishery. The
catch appears to be stable between 1992 and 2000 followed by fluctuations around 80 000 tonnes. In
general, catches of the western stock for Sardinella aurita has shown a declining state since 2004.
Central stock
The dorminant catch in the region is Sardinella maderensis. Although the catch of Sardinella
maderensis in Cameroon is relatively high, there is high inconsistency in effort. Continuous time
series data of catch is only available from 2002 to 2008. There was no data collection system in place
during 1990–1993 and 1997–2001. Nigeria accounts for the bulk of the catch but there are no effort
data for this region. The catch and effort data in this region are noisy, with inconsistencies.
Southern stock
The catch data series from DR Congo are very low compared to the entire region to explain clear
variations. However, S. aurita dominates the catch in this country.
The dominant catch in this region is Sardinella aurita which is mainly caught by Angola. The catches
and effort of Sardinella aurita and Sardinella maderensis of DR Congo are very low. The main
fishery for sardinella in the south is the artisanal fishery.
2.3 Abundance indices
2.3.1 Catch per unit of effort
The catch per unit of effort for the artisanal and industrial fisheries was calculated separately for the
two Sardinella species (S. aurita and S. maderensis) and stocks, including the combined species
reported in the region. Due to data collection bottlenecks, sardinella species is not reported separately
for the Northern stock in Guinea-Bissau, Sierra Leone and Liberia, they are reported as Sardinella spp.
These species were also combined to harmonize assessment for the south and central stocks
(Figures 2.3.1a,b,c).
Sardinella aurita
Northern stock
Catch data are not reported separately for this species by the countries in the region except Guinea.
The CPUE (Figure 2.3.1a, Table 2.3.1a) from the industrial fleet of Guinea indicated an increasing
trend annually from 1995 to 2002. The trend has started decreasing since then, possibly due to high
fishing pressure. It is important to note that the trend did not show the annual fluctuation in CPUE
normally associated with the small pelagics.
Western stock
All the countries with the exception of Côte d’Ivoire presented data on the artisanal fleet and CPUE
(Figure 2.3.1b) indicated fluctuating trends annually for Ghana and Togo which is typical of small
pelagics. The CPUE of Ghana’s industrial fleet indicated a general decreasing trend from the early
1990s to 1998, followed by some increase in 2003. From 2004 to 2008, there is a general decline in
CPUEs in the region. Maximum peaks in the CPUE appear in 1992 and 2003.
Central stock
No CPUE was calculated because there was no effort data from Nigeria and no data from Cameroon.
Southern stock
CPUE for the artisanal fleets of Angola is the highest in the region with a peak in 1990, but no data
were available for 1998 to 2008.
20
Perhaps the absence of long time series of data is making it difficult to follow the trend. The CPUE
from the industrial fleet for both countries indicated annual fluctuations. It appears that the current
abundance is lower than in the early 1990s, possibly due to high fishing pressure.
Sardinella maderensis
Northern stock
This species is exploited by both the artisanal and industrial fleet. The CPUE trend for S. maderensis
in Guinea artisanal fishery fluctuates throughout the years (Figure 2.3.1d).
Central stock
No CPUE was calculated for S. maderensis for Nigeria and Cameroon because no catch data were
available for this species.
Western stock
In general, the CPUE for S. maderensis in the region is very low and shows fluctuating trends. CPUE
in Côte d’Ivoire industrial fisheries is low and shows fluctuating trend with peak in 2005. The CPUE
trend for Ghana artisanal fisheries is stable from 1990 to 2003 followed by fluctuating trends with a
drop in 2007. The CPUE trend for Togo artisanal fisheries shows fluctuating trend and a decrease in
2007. The CPUE trend for Benin artisanal fisheries fluctuated and reached a high plateau starting in
2004 (Figure 2.3.1d and Table 2.3.1b).
Southern stock
The CPUE for DR Congo artisanal fisheries fluctuates with decreasing trend from 2003 to 2007 with a
peak in 2007. Angola industrial fisheries show the highest CPUE in the region with the highest peak in
1991 followed by a declining trend from 1991 to 1996 with increase in 1997. There was no catch data
in the earlier years of the series and no effort data for 1998 to 2008.
Sardinella spp.
Northern stock
Guinea-Bissau displays the highest CPUE in the region with a declining trend from 1990 to 1994
followed by an increase in 1995. This is followed by an increasing trend from 1997 to 2003 with very
high and unrealistic CPUE in 2003 due to very low effort and very high catch declared. The CPUE for
Sardinella spp. in Guinea industrial fisheries displays fluctuating trends with a peak in 1995. Guinea
artisanal fisheries show low and stable CPUE. The CPUE trend for Sierra Leone artisanal fisheries is
also low and displays an increasing trend from 2006 to 2008. The CPUE for Liberia artisanal and
industrial fisheries shows a fluctuating trend with a peak in 1995 (Figures 3.2.1e,f).
Western stock
Data on the western stock for the sardinellas were differentiated. They were not reported as
Sardinella spp.
Central stock
Data on the western stock for the sardinellas were differentiated. They were not reported as
Sardinella spp.
Southern stock
The CPUE for Sardinella spp. in Gabon artisanal fisheries is very low and shows fluctuating trends,
with the highest peak in 2002 and 2004.

21
2.3.2 Acoustic surveys
Sardinella spp.
Northern stock
There are no long time series data for the northern stock. The survey data available are from the
R/V DR. FRITDJOF NANSEN, 2006 and 2007, although Sierra Leone has survey data for 2008–
2009, not presented to the Working Group (Figure 2.3.2a).
Western stock
Biomass estimates from R/V DR. FRITDJOF NANSEN surveys since 1999 are presented in
Figure 2.3.2b. The figure indicates increasing trend in biomass of the species annually since 2000
except in 2005. This is in contrast with the CPUE for the stock. It is important to note that there are no
survey data for 2001 and 2003.
Central stock
Figure 2.3.2c indicates the biomass estimates from R/V DR. FRITDJOF NANSEN surveys in 2004,
2005 and 2007 showing that the biomass is decreasing during these years.
Southern stock
There are long-time series of data for Angola from R/V DR. FRITDJOF NANSEN for 2000–2006 and
they are presented in Figure 2.3.2d.
Figure 2.3.2e shows a variation in biomass along the period with a peak in 2007. For the three
countries together, Angola, Congo and Gabon, the biomass estimates by the R/V DR. FRITDJOF
NANSEN are declining from 2006 to 2007.
2.4 Sampling of commercial fisheries
Northern stock
In Sierra Leone and Guinea, there is 5 and 20 percent sampling of the artisanal fishery. While Sierra
Leone uses ARTFISH to process data, Guinea uses PECHART to process data. Both programmes give
monthly estimates of catch by gear. In both countries, there is total coverage of all industrial vessels.
Observers are put on each vessel for a fishing trip to collect catch and effort data. IFDAS and
PECHART software are respectively used by Sierra Leone and Guinea to process industrial data.
Monthly estimates of catch by gears are produced.
Western stock
In Ghana, Togo and Benin, a sampling scheme is used to sample the artisanal fleet with 25, 10 and
5 percent coverage respectively. All the countries use ARTFISH to process data to estimate monthly
catch by gear. There is total coverage of all the semi-industrial fleet in Ghana and ARTFISH is used to
process data to estimate monthly catch by gear.
Central stock
There is sampling of the artisanal fleet and ARTFISH is used to estimate monthly catch for Cameroon
and by extrapolation for Nigeria.
Southern stock
In both Congo and Angola, there is sampling of the artisanal fleet (four days a week) and ARTFISH is
used to process data for monthly estimate of catch by gear. There is total coverage of the industrial
fleet and data is processed using a spreadsheet.
2.5 Biological data
No new biological data were presented to the Working Group.
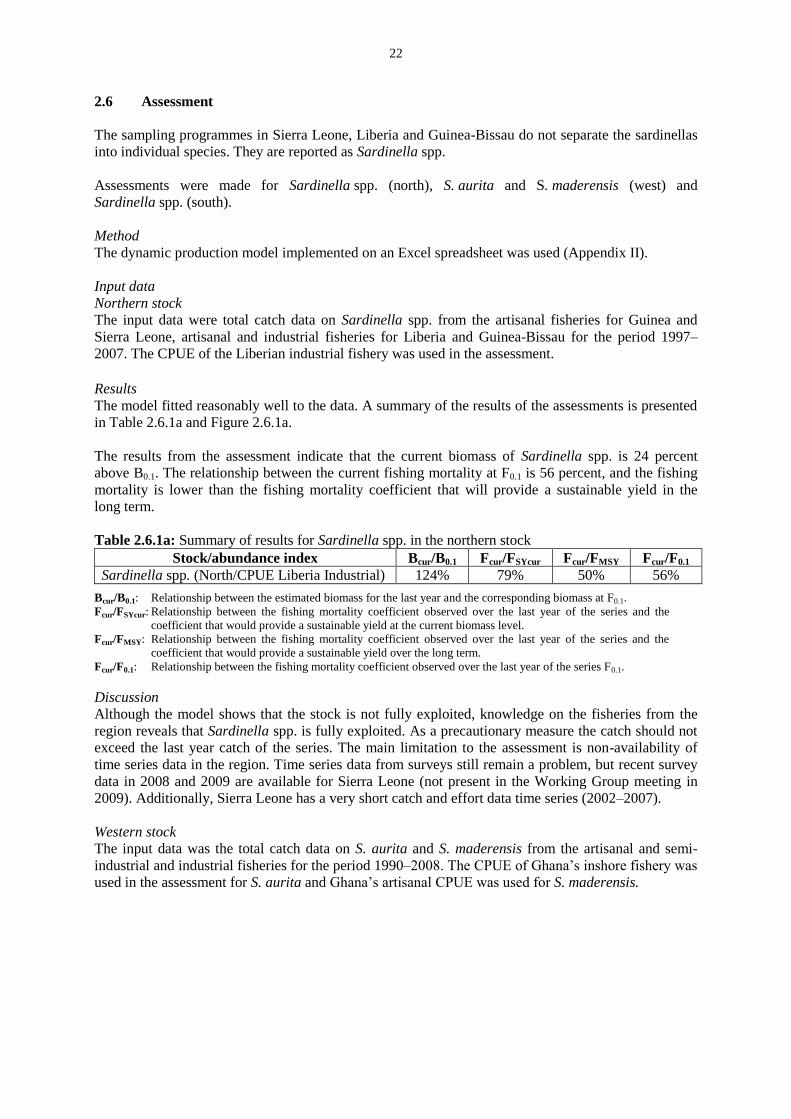
22
2.6 Assessment
The sampling programmes in Sierra Leone, Liberia and Guinea-Bissau do not separate the sardinellas
into individual species. They are reported as Sardinella spp.
Assessments were made for Sardinella spp. (north), S. aurita and S. maderensis (west) and
Sardinella spp. (south).
Method
The dynamic production model implemented on an Excel spreadsheet was used (Appendix II).
Input data
Northern stock
The input data were total catch data on Sardinella spp. from the artisanal fisheries for Guinea and
Sierra Leone, artisanal and industrial fisheries for Liberia and Guinea-Bissau for the period 1997–
2007. The CPUE of the Liberian industrial fishery was used in the assessment.
Results
The model fitted reasonably well to the data. A summary of the results of the assessments is presented
in Table 2.6.1a and Figure 2.6.1a.
The results from the assessment indicate that the current biomass of Sardinella spp. is 24 percent
above B0.1. The relationship between the current fishing mortality at F0.1 is 56 percent, and the fishing
mortality is lower than the fishing mortality coefficient that will provide a sustainable yield in the
long term.
Table 2.6.1a: Summary of results for Sardinella spp. in the northern stock
Stock/abundance index Bcur/B0.1 Fcur/FSYcur Fcur/FMSY Fcur/F0.1
Sardinella spp. (North/CPUE Liberia Industrial) 124% 79% 50% 56%
Bcur/B0.1: Relationship between the estimated biomass for the last year and the corresponding biomass at F0.1.
Fcur/FSYcur: Relationship between the fishing mortality coefficient observed over the last year of the series and the
coefficient that would provide a sustainable yield at the current biomass level.
Fcur/FMSY: Relationship between the fishing mortality coefficient observed over the last year of the series and the
coefficient that would provide a sustainable yield over the long term.
Fcur/F0.1: Relationship between the fishing mortality coefficient observed over the last year of the series F0.1.
Discussion
Although the model shows that the stock is not fully exploited, knowledge on the fisheries from the
region reveals that Sardinella spp. is fully exploited. As a precautionary measure the catch should not
exceed the last year catch of the series. The main limitation to the assessment is non-availability of
time series data in the region. Time series data from surveys still remain a problem, but recent survey
data in 2008 and 2009 are available for Sierra Leone (not present in the Working Group meeting in
2009). Additionally, Sierra Leone has a very short catch and effort data time series (2002–2007).
Western stock
The input data was the total catch data on S. aurita and S. maderensis from the artisanal and semi-
industrial and industrial fisheries for the period 1990–2008. The CPUE of Ghana’s inshore fishery was
used in the assessment for S. aurita and Ghana’s artisanal CPUE was used for S. maderensis.

23
Results
The model fitted reasonably well for all the above stocks selected (Figures 2.6.2a,b). A summary of
the results of the assessments is presented in Table 2.6.2. For Sardinella aurita the current biomass
level Bcur of the stock is less than the biomass at B0.1, although the current fishing mortality for the
S. aurita is less than FMSY (Fcur/FMSY = 58%) that will bring the stock to sustainable levels. The model
fits reasonable well the data for S. maderensis from Table 2.6.3, for the current biomass is 10 percent
less than B0.1 and the current fishing mortality is 10 percent higher than the fishing mortality that will
bring the stock to a sustainable level.
Table 2.6.2: Summary of results for the Sardinella aurita and S. maderensis in the western stock
Stock/abundance index Bcur/B0.1 Fcur/FSYcur Fcur/FMSY Fcur/F0.1 S. aurita (West/CPUE Ghana inshore) 58% 43% 58% 65% S. maderensis (West/CPUE Ghana artisanal) 90% 110% 112% 124%
Bcur/B0.1: Relationship between the estimated biomass for the last year and the corresponding biomass at F0.1.
Fcur/FSYcur: Relationship between the fishing mortality coefficient observed over the last year of the series and the
coefficient that would provide a sustainable yield at the current biomass level.
Fcur/FMSY: Relationship between the fishing mortality coefficient observed over the last year of the series and the
coefficient that would provide a sustainable yield over the long term.
Fcur/F0.1: Relationship between the fishing mortality coefficient observed over the last year of the series F0.1.
Central stock
No assessment was done for the central stock as no CPUE series were available. Catches show
increasing trends.
Southern stock
Input data
The input data were the total catch data for Sardinella spp. from the artisanal and industrial fisheries
for Congo, the artisanal fisheries for DR Congo and semi-industrial and industrial fisheries for Angola
fisheries and industrial fisheries for Gabon for the period 1990–2008. The CPUE of the R/V DR.
FRIDTJOF NANSEN (1990–2008) from Angola was used in the assessment. LCA was applied to the
length frequencies from the region as an exploratory assessment.
Results
A summary of the results of the assessments is presented in Table 2.6.3. The results of the assessment
show that the current biomass is 49 percent above B0.1 showing that the stock is moderately exploited.
The current fishing mortality is below F0.1 and below the fishing mortality that will provide sustainable
yield in the long term.
Table 2.6.3: Summary of results for Sardinella spp. southern stock (Angola, Congo, DR Congo
and Gabon)
Stock/abundance index Bcur/B0.1 Fcur/FSYcur Fcur/FMSY Fcur/F0.1 Sardinella spp. (South/CPUE Angola Nansen) 149% 149% 55% 61%
Bcur/B0.1: Relationship between the estimated biomass for the last year and the corresponding biomass at F0.1.
Fcur/FSYcur: Relationship between the fishing mortality coefficient observed over the last year of the series and the
coefficient that would provide a sustainable yield at the current biomass level.
Fcur/FMSY: Relationship between the fishing mortality coefficient observed over the last year of the series and the
coefficient that would provide a sustainable yield over the long term.
Fcur/F0.1: Relationship between the fishing mortality coefficient observed over the last year of the series F0.1.
Discussion
The model shows that Sardinella spp. in the south is moderately exploited. This result was confirmed
by LCA analysis. However the result should be interpreted with caution because of uncertainties in the
data due to data declaration bottlenecks. No data were available for Congo for the last three years
series. The same catch data in 2005 were used for the series of 2006 to 2008. This is a major limitation
of the assessment.

24
2.7 Management recommendations
Northern stock
It is recommended to maintain the catch of the last years (about 20 000 tonnes) and to regulate the
fishing effort especially in the inshore coastal waters where the juveniles are targeted by artisanal
fishers. The canoe fleet numbers should be controlled.
Western stock
The stock of S. aurita is overexploited in biomass, hence, as a precautionary measure, catches should
not exceed 40 000 tonnes annually. The stock of S. maderensis is fully exploited. Any further increase
in effort in the fishery could lead to higher fishing mortality thus reducing the biomass. Though
S. maderensis is fully exploited, catches should not exceed the average of the last five years
(20 000 tonnes).
Central stock
As a precautionary measure, catches should not exceed the average of the last five years
(30 000 tonnes).
Southern stock
No catch value limit is recommended for this stock. However, data collection and declaration
consistencies are recommended. As a precautionary measure, it is suggested not to increase catches of
these species.
2.8 Future research
Fisheries research should be emphasized for all the regions. Data collection schemes should be
improved and effort should be made to collect data on species basis in the artisanal and
industrial fisheries.
Intensify biological sampling for better estimates of growth, mortality and abundance indices.
Identification of species especially the Carangidae and Sardinella.
Continue with Nansen surveys to obtain fisheries independent data.
To obtain better abundance indices of the sardinellas below the 30 metres depth contour.
To better understand interactions between the resource and the environment.
Adoption of a systematic sampling programme for the collection of catch and effort data for
all fleet.
3. BONGA
3.1 Stock identity
Bonga (Ethmalosa fimbriata), otherwise called shad is found along the West African coast and it is an
important species as it is mainly found in coastal waters (15–45 m depth), estuaries and sometimes in
rivers. It is largely targeted by the artisanal fisheries sector but some catches are recorded in the
industrial sector. Bonga in the southern region was grouped into four stocks (northern, western, central
and southern). Since there was no study on molecular biology of this stock, the stocks were mainly
based on the catch and effort trend of the fisheries. The stocks were grouped into the northern stock
(Guinea Guinea-Bissau, Liberia and Sierra Leone), the western stock (Benin, Côte d’Ivoire, Ghana
and Togo), the central stock (Cameroon, Nigeria) and the southern stock (Angola, Congo, DR Congo
and Gabon).
25
3.2 Fisheries
Bonga has been intensively exploited for a long time in the subregion. As a coastal and estuarine
species, bonga is mainly exploited by the artisanal fisheries and is a very important species in
Cameroon, Gabon, Guinea, Nigeria and Sierra Leone. Although the stock is exploited by other
countries (Benin, Congo, Côte d’Ivoire, DR Congo, Guinea-Bissau and Liberia), very little catch and
effort data were reported. No data were reported by Angola, Sao Tome and Principe and Togo.
Northern stock
A range of fishing gears such as ring gillnets, purse seines, beach seines and bottom driftnets are
utilized. The canoes used vary from 6 to18 m and means of propulsion vary from sails, paddle and
15–40 hp outboard motors. Over 70 percent of the total artisanal landing in Guinea and Sierra Leone
is bonga.
Western stock
Fishing gears such as ring gillnets, purse seines, beach seines and surface driftnets are used. The
canoes used vary from 12–18 m with 25–40 hp outboard motors as a means of propulsion. Bonga
constitutes a low percentage in the total artisanal landings for Ghana and Benin.
Central stock
The gears used include purse seines, surface drift gillnets, encircling nets and beach seines. The canoes
used vary from 5–9 m and 12–20 m. The means of propulsion range from sails, paddles and 8–40 hp
outboard motors. Bonga constitutes about 15–20 percent of the total artisanal landings in Nigeria and
Cameroon.
Southern stock
This species is largely caught in Lobito, Angola and is targeted by the artisanal fisheries exclusively
employing surface drift gillnets. The canoes are 6–7 metres in length and driven by paddles and
15–25 hp outboard motors. No data on catches were provided by Angola. Bonga constitutes about
6–10 percent of the total artisanal landings for Congo.
Catch
Total annual catch of bonga by countries, fleet and stocks are presented in Table 3.2.1. No catch data
were provided by Sao Tome and Principe, Angola and Togo, which was due to the insignificant
quantity landed or not reported as the case in Angola where the catches are discarded at sea.
Figure 3.2.1 shows the total catch of bonga per stock (north, central, west and south). For the northern
stock, the catches for years 1990 to 1994 were so low as a result of no contribution in catch data from
all the countries in this zone except Guinea-Bissau. From then on, there has been an increasing trend
in catches of bonga with interannual fluctuations reaching a total of 86 004 tonnes in 2006. The total
catch of the western stock fluctuates from year to year but the highest value was recorded in 1992. It
shows a steady decrease in values from 1998 with a little fluctuation in 2000 and 2006. The total catch
in the central stock has an increasing trend with some fluctuations from 1990 to 1995. There was
decreasing trend till 2002 and an increase from 2003 to 2007. This probably was due to increased
catches for Cameroon as result of the Bakassi conflict during which many fishers crossed over and the
installation of a good data collection system through the SOWEDA project. The total catch in the
other stocks (southern) have been maintained at slightly constant production level with very
little fluctuation.
Effort
Effort data for bonga are presented in Table 3.2.2 and Figure 3.2.2 as well as the number of trips, of
fishing days or of days at sea. It should be noted that the effort presented here was for the total
artisanal fisheries from respective countries and the effort from industrial fisheries from Liberia, Sierra
Leone and Ghana (inshore). The effort from Guinea-Bissau was the efforts recorded from foreign
fleets from the Russian Federation and Germany.
26
The effort data for the artisanal fishery in Sierra Leone and Ghana were measured as number of
fishing trips, the rest of the countries provided effort data in number of fishing days for all fleets. No
effort data were provided by Togo, Nigeria, Sao Tome and Principe, and Angola. Various trends could
be observed from the efforts recorded by countries with the trends starting from the years that data
were available. The overall trend for all countries was fairly stable from 1995 to 2007, except for
Cameroon and Sierra Loene which have increased efforts reported. The changes in the Cameroon
series could be attributed to the same reasons as mentioned in the catch trends.
3.3 Abundance indices
3.3.1 Catch per unit of effort
The CPUEs (in kg/fishing trips) for artisanal fisheries were calculated from the catch and effort data
provided by Congo, Guinea and Ghana. CPUEs for artisanal fisheries (kg/trips) provided by Sierra
Leone and Ghana were also calculated. The overall CPUEs trend for all countries has been stable at
very low levels from 1990 to 2007 (Figure 3.3.1). For CPUEs computed in kg/trips, a stable low trend
was observed for Ghana from 1990–2004, whereas for Congo, the limited time series of data for the
artisanal fleet show an increasing trend (Figure 3.3.1).
3.3.2 Acoustic surveys
Surveys of small pelagic fish in West Africa conducted under the Nansen Programme and subregional
research vessels do not estimate the abundance of bonga as they are found inshore and in estuaries.
Therefore fisheries independent data were not available to the Working Group.
3.4 Sampling of commercial fisheries
Northern stock
In the industrial fishery, fisheries observers are placed onboard each licensed fishing vessels, whose
responsibility is to record catch and effort data in log books for analysis. Hence, sampling for
statistical data goes on throughout the year. In the artisanal fishery, sampling is done by sample-based
methods, where catch and effort are recorded at selected landing sites. This information is used in
ARTFISH software for analysis.
Western stock
In the artisanal fishery, sampling is done by sample-based methods, where catch and effort are
recorded at selected landing sites. This information is used in ARTFISH software for analysis.
Central stock
In the artisanal fishery in Cameroon, sampling is done by sample-based methods, where catch and
effort are recorded at selected landing sites. This information is used in ARTFISH software for
analysis. In Nigeria, samples of catch and effort data are collected from the major landing sites at both
state and federal levels and are then collated and analysed as national fisheries data
Southern stock
In the artisanal fishery, sampling is done by sample-based methods, where catch and effort are
recorded at selected landing sites. This information is used in ARTFISH software for analysis.
3.5 Biological data
No new biological data were available from the different countries.

27
3.6 Assessment
Quality of data
In order to test the quality of the data available for the assessment, the Subgroup carried out an
exploratory analysis of the catch and effort data. At a stock level for west and central, limited effort
data series were available hence no CPUE) was calculated. For the northern and southern stocks the
CPUE calculated from the catch and effort data of Guinea and Gabon artisanal fleets respectively
targeting bonga were used separately for the assessment.
Methods
The dynamic production model, implemented on an Excel spreadsheet was used. This model is further
described in Appendix II.
Input data
The model requires complete time series of data in total catch as well as an index of stock abundance.
The estimates of total catch were obtained by adding the catch estimates of all the fleets in each
country and were used as total catch series. For an abundance index, one time series was used. The
CPUE from Guinea (1997–2007) and Gabon (1995–2008) artisanal fisheries were chosen. For bonga,
the artisanal CPUE was considered more appropriate than the industrial series
To estimate the total catch for the time series of the northern stocks, FAO catch statistics for 1997 to
2001 for Sierra Leone (artisanal) were added to the series. For the southern stock, the catch for the last
three years (2006–2008) were not available for Congo. The catch for this country for the period 2006–
2008 was assumed to be the same as that recorded in 2005.
Result
The results obtained from northern and southern stocks were satisfactory. However, the data from
western stock gave poor fit to the model.
The fitted model using the artisanal CPUE from Guinea and the total catch from the northern stock
was considered satisfactory. It manages to follow the main trends in abundance indices, reacting to the
variation in catches (Figure 3.6.1).
The fitted model for the southern stock (using Gabon artisanal CPUE) also provided an acceptable
adjustment to the data (Figure 3.6.2).
The model results indicate that the current biomass for northern stock is close to the biomass at B0.1,
and that the current fishing mortality is below that at F0.1. This stock is considered fully exploited
(Table 3.6.1). The model for the southern stock shows similar results to that of the northern stock.
Table 3.6.1: Summary of the current status of the stock and the fishery for bonga Ethmalosa fimbriata
Stock/abundance indices Bcur/B0.1 Fcur/FSYcur Fcur/F0.1 Fcur/FMSY
Ethmalosa fimbriata (North/CPUE Guinea artisanal) 107 % 106 % 96 % 87 %
Ethmalosa fimbriata (South/CPUE Gabon artisanal) 104 % 75 % 71 % 64 %
Bcur/B0.1: Relationship between the estimated biomass for the last year and the corresponding biomass at F0.1.
Fcur/FSYcur: Relationship between the fishing mortality coefficient observed over the last year of the series and the
coefficient that would provide a sustainable yield at the current biomass level.
Fcur/FMSY: Relationship between the fishing mortality coefficient observed over the last year of the series and the
coefficient that would provide a sustainable yield over the long term.
Fcur/F0.1: Relationship between the fishing mortality coefficient observed over the last year of the series F0.1.
Discussion
The lack of contrast in the catch time series and abundance indices decreases appreciably the
reliability of the result obtained in the modelling. The reliability was also affected by lack of complete
data from the different countries. Therefore, care must be taken when interpreting these results.
However, the modelling results indicate that the northern and southern stocks are fully exploited.
28
The data available did not fit the model for the western stock. In this zone, bonga is the secondary
target species sardinella is most preferred.
3.7 Management recommendations
As a precautionary measure, catch level should not be increased for the northern stock and not exceed
the average of the last five years (79 000 tonnes). For the southern stock as a precautionary measure
catch level should not exceed the total average year’s catch (11 000 tonnes).
This Working Group could not produce results on the assessment of the central stock as a result of
lack of discontinuous effort data from Cameroon and no effort data from Nigeria. It was therefore
recommended that efforts should not increase over the average of the last five years (58 000 tonnes).
For the western stock, there is no recommendation due to insufficient data from countries within
this zone.
3.8 Future research
To collect and improve data collection (catch and effort) for E. fimbriata in Benin, Cameroon,
Côte D’Ivoire, DR Congo, Gabon, Guinea, Guinea-Bissau and Nigeria.
Given the absence of biological sampling for bonga in the subregion, countries are urged to
collect biological data on E. fimbriata to enable better analysis of the status of the stock and
the effect of the fishery on the stock.
It is proposed that countries targeting bonga should carry out research for data/information on
the bonga fishery.
4. ANCHOVY
4.1 Stock identity
Engraulis encrasicolus, commonly called anchovy, is present in the southern CECAF region, between
Guinea and Angola. A pelagic species often found in large shoals, Engraulis encrasicolus lives in
shallow waters and sometimes in depths of up to 400 m.
Anchovy represents one of the characteristic species of the upwelling. The juveniles are found in the
coastal fringe, and represent the dominant pelagic species in catches. Anchovy is also found
in estuaries.
4.2 Fisheries
In the region, anchovy is mostly exploited by beach seines and purse seines which are non
selective gears.
Anchovy is found in waters with strong upwelling, which explains the availability of this species in
different territorial waters of the countries in the region during the upwelling season. In certain
countries, anchovy consumption is part of the eating habits of the population. This is the case in
Ghana, Togo, Benin and Congo where large quantities are landed by beach seine and purse seine. In
other countries, anchovies are mixed with other small species in landings. Identification is therefore
very difficult. This is the case in Nigeria and Cameroon where the species is present, but no data are
available. In Guinea, anchovy is considered a non valuable bycatch and is consequently discarded.

29
Catch
Six countries in the region have catch data for this species. These are Sierra Leone, Ghana, Togo,
Benin, Angola and Congo. The data from 2006 to 2008 for Congo have not been provided because the
scientist from Congo was absent. These catch data, divided by zone, are given in Table 4.2.1 and
Figure 4.2.1. These stocks are the northern stock (Guinea and Sierra Leone), the western stock (Ghana,
Togo and Benin) and the southern stock (Congo and Angola).
The northern stock is only represented by Sierra Leone. The catch data varied widely between 2002
and 2008. However, they peaked in 2006 with 151 tonnes.
For the western stock, the total catch of Engraulis encrasicolus varied from 82 220 tonnes and
48 415 tonnes from 1990 to 2008 with peaks in 1996, 2000 and 2003. Generally there is a decreasing
trend in the western stock and the graph that shows this trend is identical to that of the anchovy catch
in Ghana, the biggest fishery.
The southern stock comprises the catch from Congo and Angola. Averaging around 499 tonnes yearly
this catch has not undergone any major fluctuation.
The catch from Angola fell from three tonnes in 1998 to one tonne in 2003. This species does not
seem to be a target species for the semi-industrial and industrial fisheries of Angola. They constitute
bycatches. In 2002, the increase in catch observed in Congo is probably due to the increase in beach
seine units.
Effort
Effort over the whole region is expressed in fishing days as shown in Table 4.2.2 and Figure 4.2.2.
Most of this effort came from the purse seine and the beach seine, the latter being used in the nursery
area. A beach seine can be used up to twice a day. When a beach seine makes good catches, this
encourages others to go out as well.
The vessels used in this fishery are generally monoxylous Ghanaian canoes of between 14 and
18 metres in length in the western stock and 6 to 18 metres in the northern and southern stocks. Most
are powered by 10 or 25 hp engines. In some countries, some of the beach seines are not motorized.
4.3 Abundance indices
4.3.1 Catch per unit of effort
CPUE for Sierra Leone is only for the period 2002–2007.
In Ghana, Togo and Benin, the stock shows the same characteristics. It is fished in these countries by
the beach seine and the purse seine. The Ghanaian fishery reflects that of the whole western stock
(Ghana, Togo and Benin) and the CPUE considered (those of Ghana) show a fluctuating trend, with
three peaks observed in 1996, 2000 and 2003 (Figure 4.3.1).
4.3.2 Acoustic surveys
R/V DR. FRIDTJOF NANSEN
Anchovy biomass was estimated for the western stock (Ghana, Togo and Benin) during acoustic
surveys carried out by R/V DR. FRIDTJOF NANSEN between 1999 and 2006 (Figure 4.3.2). The
highest estimates were obtained in 2000 and 2004. In 2000, the survey took place in September during
the upwelling and this large biomass estimate can be explained by the fact that anchovy is a species
that is typical of upwelling waters. In 2004, the survey took place in May–June. The highest
concentration of anchovy was found at Cape Three Points in Ghana where the temperature was 25 °C.
The increase in biomass in 2004 could be explained by this low temperature.
National surveys
No national pelagic survey has been carried out in the southern CECAF region.
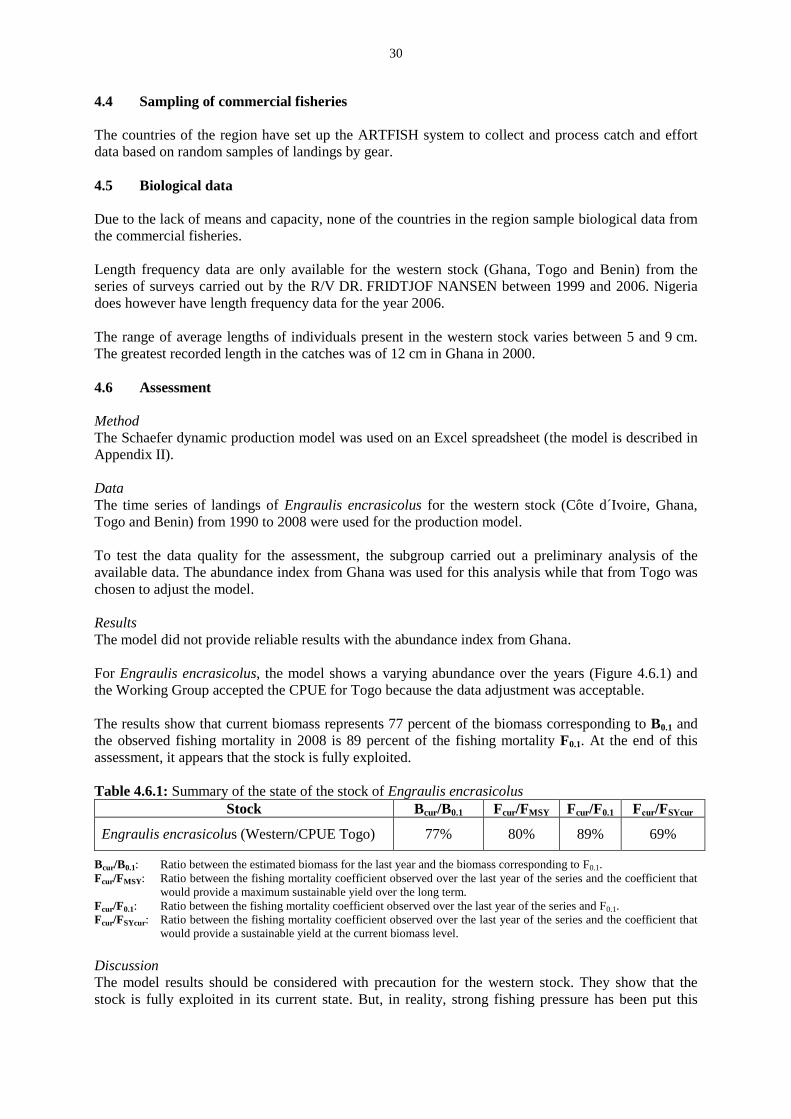
30
4.4 Sampling of commercial fisheries
The countries of the region have set up the ARTFISH system to collect and process catch and effort
data based on random samples of landings by gear.
4.5 Biological data
Due to the lack of means and capacity, none of the countries in the region sample biological data from
the commercial fisheries.
Length frequency data are only available for the western stock (Ghana, Togo and Benin) from the
series of surveys carried out by the R/V DR. FRIDTJOF NANSEN between 1999 and 2006. Nigeria
does however have length frequency data for the year 2006.
The range of average lengths of individuals present in the western stock varies between 5 and 9 cm.
The greatest recorded length in the catches was of 12 cm in Ghana in 2000.
4.6 Assessment
Method
The Schaefer dynamic production model was used on an Excel spreadsheet (the model is described in
Appendix II).
Data
The time series of landings of Engraulis encrasicolus for the western stock (Côte d´Ivoire, Ghana,
Togo and Benin) from 1990 to 2008 were used for the production model.
To test the data quality for the assessment, the subgroup carried out a preliminary analysis of the
available data. The abundance index from Ghana was used for this analysis while that from Togo was
chosen to adjust the model.
Results
The model did not provide reliable results with the abundance index from Ghana.
For Engraulis encrasicolus, the model shows a varying abundance over the years (Figure 4.6.1) and
the Working Group accepted the CPUE for Togo because the data adjustment was acceptable.
The results show that current biomass represents 77 percent of the biomass corresponding to B0.1 and
the observed fishing mortality in 2008 is 89 percent of the fishing mortality F0.1. At the end of this
assessment, it appears that the stock is fully exploited.
Table 4.6.1: Summary of the state of the stock of Engraulis encrasicolus
Stock Bcur/B0.1 Fcur/FMSY Fcur/F0.1 Fcur/FSYcur
Engraulis encrasicolus (Western/CPUE Togo) 77% 80% 89% 69%
Bcur/B0.1: Ratio between the estimated biomass for the last year and the biomass corresponding to F0.1.
Fcur/FMSY: Ratio between the fishing mortality coefficient observed over the last year of the series and the coefficient that
would provide a maximum sustainable yield over the long term.
Fcur/F0.1: Ratio between the fishing mortality coefficient observed over the last year of the series and F0.1.
Fcur/FSYcur: Ratio between the fishing mortality coefficient observed over the last year of the series and the coefficient that
would provide a sustainable yield at the current biomass level.
Discussion
The model results should be considered with precaution for the western stock. They show that the
stock is fully exploited in its current state. But, in reality, strong fishing pressure has been put this
31
resource. There are also fluctuations in the western stock probably due to environmental factors. This
species, as previously discussed, is essentially caught by beach seines and purse seines whose fishing
effort increases continuously. Furthermore, these fishing gears are not selective.
It is worth noting that the surveys carried out by the R/V DR. FRIDTJOF NANSEN show a decline in
the biomass of the western stock after 2004.
The artisanal catches from Côte d’Ivoire are not available. Consequently, the absence of this data
could influence the results of the assessment.
4.7 Management recommendations
As a precautionary measure for the western stock (Ghana, Togo and Benin), catches should not exceed
the average recorded over the last three years (40 000 tonnes).
4.8 Future research
Ensure the collection of catch and effort data relating to gears that exploit anchovy to make a
better stock assessment.
Côte d’Ivoire should provide the relevant data.
Continue acoustic surveys by the R/V DR. FRIDTJOF NANSEN and make biomass estimates
for anchovy.
Carry out national surveys and take into account depths below 15 m using appropriate
methods.
5. HORSE MACKEREL AND OTHER CARANGIDS
The main species under consideration for the stock assessment of carangids are the Caranx spp.,
Decapterus spp. and Trachurus trecae. For the other carangid species or groups of species, only data
on catch and effort will be presented.
5.1 Stock identity
Whilst waiting for more detailed information on stock identity of the carangid species in the southern
CECAF region, the Working Group decided to consider five stocks: the northern stock (Guinea-
Bissau, Guinea, Liberia and Sierra Leone), the western stock (Beni,n Côte d’Ivoire, Ghana and Togo),
the central stock (Cameroon and Nigeria), the Sao Tome stock and the southern stock (Angola, Congo,
DR Congo and Gabon).
5.2 Fisheries
Catch and effort data for the five stocks with total observed catches between 1990 and 2008 are shown
in Tables 5.2.1a,b and c and Figures 5.2.1.a,b,c.
Total catch
It can be seen that, for Decapterus spp., the catches are basically all from the industrial fishery in the
northern stock (Guinea and Sierra Leone) with an annual average of about 4 000 tonnes. The majority
of catches in the southern CECAF region (mainly Decapterus rhonchus) are taken in Guinea. A large
decrease can be seen in all catches from around 5 700 tonnes in 1996 to around 2 000 tonnes in 2004
followed by a recovery in 2005 and 2006.
For the group of Trachurus spp. species, most of the Trachurus trecae are caught in the stocks of the
northern, western and central regions and the Trachurus spp. are caught in the southern stock (notably
32
in the Angolan zone). A worrying decrease can be seen over the whole southern CECAF region, going
from over 65 000 tonnes in 1990 to less than 7 000 tonnes in 2004. It should however be noted that an
increasing trend in catches can be seen from 2003 in the western stock.
The other carangid species that are generally exploited in the region are Selene dorsalis,
Chloroscombrus chrysurus and the Caranx spp. species. Total catches of these species have seen an
increasing trend, rising from 1 300 tonnes in 1993 to 15 000 tonnes in 2008.
Effort
In Guinea and Sierra Leone these species are mainly fished by encircling gillnets and driftnets in the
artisanal fishery. In Ghana, Togo, Benin, Nigeria and Cameroon, small carangids are mainly exploited
by the beach seine and the purse seine.
Most of the industrial fleets’ effort is concentrated in the Guinean EEZ. The large pelagic trawlers that
target horse mackerel come from eastern European countries (Russian Federation and Ukraine). The
nominal effort of this fleet (fishing days) decreased overall from over 600 fishing days in 1996 to
around 400 days in 2004, then recovered increasing to 900 days in 2005 before falling again to
600 days in 2007 (Table 5.2.2).
5.3 Abundance indices
5.3.1 Catch per unit of effort
The CPUE, in tonnes per fishing day or positive trip, are calculated for each species or group of
species in each stock where data are available. For the Decapterus rhonchus and Trachurus trecae
species, the CPUE series is based on the nominal effort of the industrial pelagic fleet in Guinea
(northern stock) and that of Liberia in the artisanal fishery.
In Angola, the two species (Trachurus trecae and T. capensis) can be found; thus in processing the
data for Angola together with the other countries, the Trachurus spp. species was used instead of
T. trecae.
5.3.2 Acoustic surveys
R/V DR. FRIDTJOF NANSEN
The R/V DR. FRIDTJOF NANSEN acoustic surveys provide abundance estimates for horse mackerel
in the southern stock (Figure 5.3.2). The series of surveys of the Trachurus capensis species is very
short so the results cannot be used to study long term trends. The Working Group therefore decided to
consider only Trachurus trecae in this stock.
The acoustic abundance index of Trachurus trecae showed an overall decreasing trend between 1996
and 2006 with very low levels in 2001 when the lowest value over the whole period was recorded.
5.4 Sampling of commercial fisheries
In the southern CECAF region, sampling of landings is carried out in all five stocks as all the countries
are involved in this fishery.
Guinea-Bissau, Guinea and Sierra Leone
The industrial pelagic fleet exploiting horse mackerel samples commercial catches all year round. The
total number of technical characteristics of active vessels in the Guinean and Sierra Leonean EEZs are
collected each year on the basis of fishing licences granted by the administration. A continual follow
up of activities is carried out by onboard observers who collect data on effort (fishing days) and catch
(kept and discards).
33
Côte d’Ivoire
Data on the artisanal fishery have not been collected in recent years. The industrial fishery is
monitored at the Abidjan fishing port, every day. The entry and exit data of vessels and fish sales slips
are collected every two weeks by the research team from the Oceanological Research Centre to
estimate the effort and catch per species.
Ghana, Togo, Benin, Nigeria, Cameroon and Congo
Sampling for catch and effort data collection is carried out all year round using the ARTFISH
programme for all small pelagics, including horse mackerel and other carangids. Certain countries
have had computing problems with ARTFISH and so use Excel to process their data.
Angola
Commercial catches of pelagic species are collected throughout the year by the industrial fleet based
on log books.
5.5 Biological data
The length frequencies from 2004 are not available to this Working Group.
5.6 Assessment
Method
The Schaefer dynamic production model was used on an Excel spreadsheet (model described in
Appendix II).
Data
The model requires a time series of total catch and abundance indices of the stock.
The estimates of total catch obtained by summing catches from different fleets from countries were
used.
The global model was applied to the Decapterus spp. data from the northern stock (Guinea-Bissau,
Guinea, Sierra Leone and Liberia) using the CPUEs of the industrial pelagic trawlers of Guinea
(period 1995 stock 2007).
For Trachurus trecae, the northern stock (Guinea-Bissau and Liberia) and the southern stock (Congo,
Gabon and Angola) were considered. In the northern region, the model was applied to the CPUE of
the industrial trawlers of Guinea (period 1995 stock 2007) and to the CPUE of the artisanal fishery of
Liberia (1997 stock 2008). In the southern region, the model was applied to the stock data using the
biomass indexes of acoustic surveys of the R/V DR. FRIDTJOF NANSEN as the abundance index.
For Caranx spp., the model was applied to the Sao Tome stock using the CPUE of the
artisanal fishery.
Results
The global models applied to the data for the Decapterus spp. species in the northern stock, T. trecae
species in the northern and southern zone were not considered because the indices used are not
representative of the change in biomass of these different zones. No diagnosis can thus be established
on the basis of these models.
34
Discussion
Based on these models it was not possible to draw conclusions on the state of the stocks of the
different species studied. In the case of the northern stocks, the species are the most exploited by
Guinea-Bissau and Guinea. In Guinea-Bissau, the data collection is irregular while in Guinea, an
estimated proportionality coefficient based on the data for one survey was applied to the landings
with a view to estimating the catches of each of the species. Additional surveys are therefore
necessary. Moreover, the sharp declining trends in the catches of the two species (Decapterus spp.
and Trachurus trecae) at least over the last three years suggest a precautionary approach in the
exploitation of the stocks.
As concerns the southern stocks, the most exploited Carangid species is T. trecae in Angola. However
the landings of this species are not fully recorded. Nevertheless, the biomass and average length
series in Angola which began in 1985 show a decline. The estimated MSY using the Cadima formula
is lower than the catch of the last year and furthermore, 90 percent of the biomass recorded in 2009 is
made up of undersized individuals (length < 21 cm pers. comm. 2009). All these observations also
indicate the adoption of a precautionary approach.
5.7 Management recommendations
Due to limitations in the models obtained and uncertainties surrounding the data, whilst waiting for
more investigations on the fisheries and survey data, the Working Group suggests that the following
precautionary measures be adopted:
The catch of the Decapterus spp. species group in the northern countries should not exceed the
3 000 tonnes level (last year’s value).
The catch of the T. trecae species should not exceed the level of 10 000 tonnes (last year’s value) in
the northern countries and in the southern countries the effort targetting this species should be reduced.
5.8 Future research
In order to reduce uncertainties surrounding the assessment, the Working Group recommends carrying
out the following research:
Support sampling programmes in order that they cover total catch of all the main carangid
species, including horse mackerel, for all fleets in all countries of the southern CECAF region.
Continue biological data collection for biological studies (growth, reproduction, feeding) on
the main carangid species and make these data available to the Working Group by the next
meeting.
Begin sampling catches and discards onboard all vessels fishing horse mackerel due to
problems arising from under-declaration of catch, especially of juveniles.
35
6. GENERAL CONCLUSIONS
Similarly to the previous Working Group, emphasis was put on database improvement and thus less
time was available for assessment. Nevertheless, a number of assessments were made for some of the
main species and stocks using a dynamic production model. For one stock, a trial assessment using a
length based method was also applied. For some of the species/stocks the model did not produce
reliable results due to insufficient and inconsistent input data. The results of the dynamic production
model depend strongly on the quality of the data (fisheries dependent and independent) that the
Working Group has at its disposal. These data limitations must be kept in mind when interpreting the
results of the assessments.
Fishery dependent information is based on catch statistics, effort data, and the biological samples that
are taken in the various fisheries, such as length measurements, etc. From these data it is possible to
obtain information relevant for fish stock assessments such as total catch, length groups harvested (and
quantity thereof), catch per unit of effort, etc. The Working Group appreciates the effort made to
obtain all these data, which are of the utmost importance for fish stock assessment and management,
however some deficiencies were noted. These deficiencies relate to, amongst others, incomplete
(e.g. due to incomplete sampling or under-reporting) or, in the case of some countries, lack of catch
and effort data for some species/stocks of importance to the region. Inconsistencies between different
data sets were still observed and low sampling intensity and coverage was reported for several
countries, especially in artisanal fisheries. Attention should be given to the aforementioned issues
before the next meeting and, in particular, efforts should be made to verify and update existing catch
and effort series, and to bring one reliable series of total catch and effort data for stock assessments to
the next meeting. An effort should also be made to ensure that catch and effort data are reported from
all fleet segments. A more in-depth analysis of the CPUE series is also encouraged to facilitate the
application of the model.
In general, biological sampling of landings from the region is almost non existent. For some species
and stocks length information from catches exists, but in general only for one or a limited number of
years. Length data and other biological data are available from research surveys. These data were used
to assess the state of Sardinella spp., making the assumption that the length frequency data from
surveys has the same structure as the length frequencies of the catches of the fishing countries Gabon,
DR Congo and Angola. Before future meetings all length data should be analysed in more detail to
see if it would be possible to apply length based models for those stocks.
In addition to the fisheries dependent information, the Working Group also has access to fishery
independent data, through the various abundance estimates made during surveys with the
R/V DR. FRIDTJOF NANSEN. The Senegalese R/V ITAF DEME has also carried out acoustic
surveys in Sierra Leone for the last two years, and the reports from these surveys were also made
available to the Working Group. Survey information is very valuable and in many cases represents the
most important information on the status and development of the pelagic fish stocks.
The advice for the stocks is given in relation to reference points. For the sake of comparability and
consistency, the reference points chosen were the same as those used in the FAO Working Group for
the Assessment of Small Pelagic Fish off Northwest Africa. The advice for each stock gives guidelines
for managers in the management of the pelagic stocks in a way to make them develop in a direction
where each stock is exploited at an optimum level. The advice for each stock is given in terms of
catch levels. It was noted that for shared stocks, such as many of the pelagic stocks, formal agreements
on sharing arrangements would have to be made and management put into place.
Finally, the Working Group noted that for some species/stocks in the southern CECAF region,
observed data deficiencies in catch and effort data for some countries was related to the relative less
importance of these species to the countries concerned. The Working Group should therefore carefully
review the species/stocks adopted at the first meeting in 2006 (FAO, 2009) to better focus future
assessments. A summary of the assessments and management recommendations by the Working
Group is presented in Table 6.1.
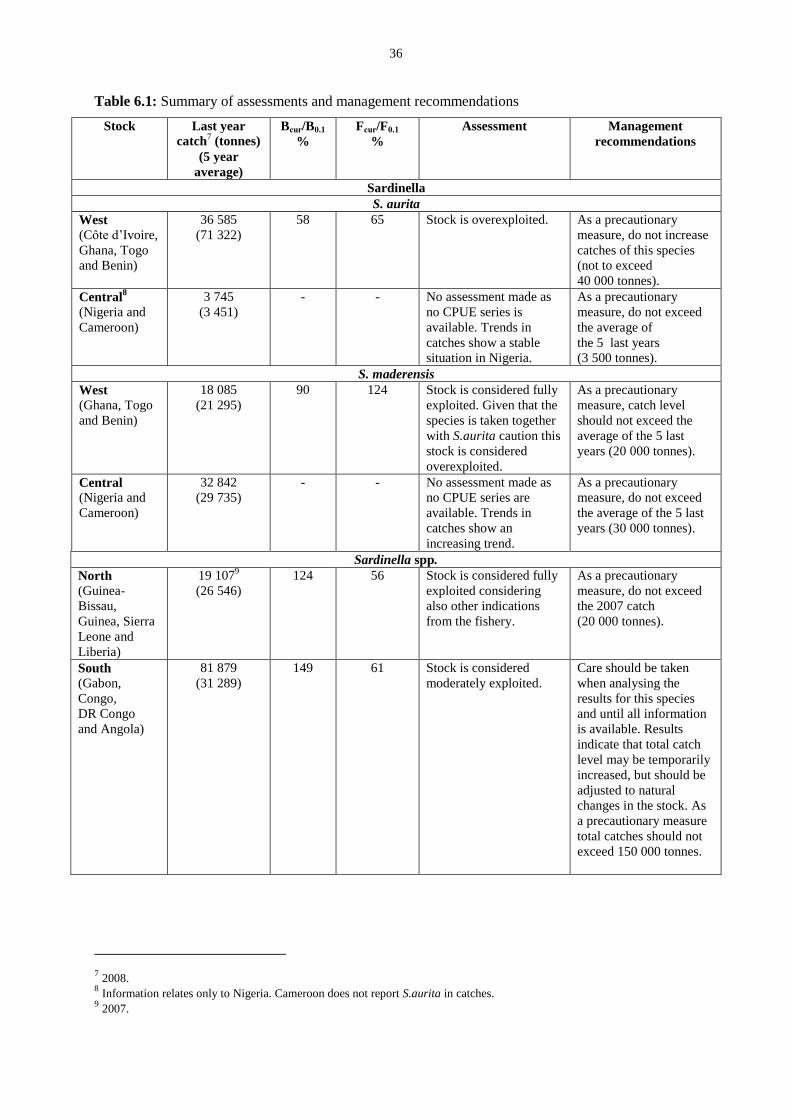
36
Table 6.1: Summary of assessments and management recommendations
Stock Last year
catch7 (tonnes)
(5 year
average)
Bcur/B0.1
%
Fcur/F0.1
%
Assessment Management
recommendations
Sardinella
S. aurita
West
(Côte d’Ivoire,
Ghana, Togo
and Benin)
36 585
(71 322)
58
65
Stock is overexploited. As a precautionary
measure, do not increase
catches of this species
(not to exceed
40 000 tonnes).
Central8
(Nigeria and
Cameroon)
3 745
(3 451)
- - No assessment made as
no CPUE series is
available. Trends in
catches show a stable
situation in Nigeria.
As a precautionary
measure, do not exceed
the average of
the 5 last years
(3 500 tonnes).
S. maderensis
West
(Ghana, Togo
and Benin)
18 085
(21 295)
90 124
Stock is considered fully
exploited. Given that the
species is taken together
with S.aurita caution this
stock is considered
overexploited.
As a precautionary
measure, catch level
should not exceed the
average of the 5 last
years (20 000 tonnes).
Central
(Nigeria and
Cameroon)
32 842
(29 735)
- - No assessment made as
no CPUE series are
available. Trends in
catches show an
increasing trend.
As a precautionary
measure, do not exceed
the average of the 5 last
years (30 000 tonnes).
Sardinella spp.
North
(Guinea-
Bissau,
Guinea, Sierra
Leone and
Liberia)
19 1079
(26 546)
124 56 Stock is considered fully
exploited considering
also other indications
from the fishery.
As a precautionary
measure, do not exceed
the 2007 catch
(20 000 tonnes).
South
(Gabon,
Congo,
DR Congo
and Angola)
81 879
(31 289)
149 61 Stock is considered
moderately exploited.
Care should be taken
when analysing the
results for this species
and until all information
is available. Results
indicate that total catch
level may be temporarily
increased, but should be
adjusted to natural
changes in the stock. As
a precautionary measure
total catches should not
exceed 150 000 tonnes.
7 2008.
8 Information relates only to Nigeria. Cameroon does not report S.aurita in catches.
9 2007.
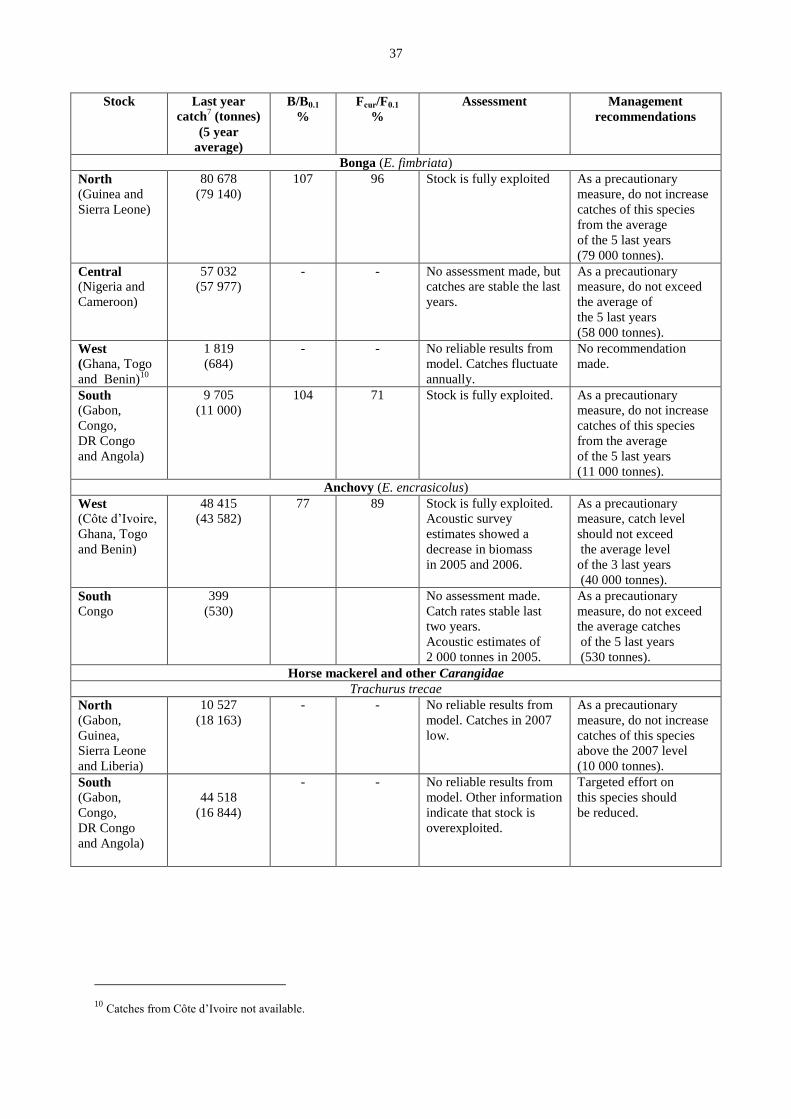
37
Stock Last year
catch7 (tonnes)
(5 year
average)
B/B0.1
%
Fcur/F0.1
%
Assessment Management
recommendations
Bonga (E. fimbriata)
North
(Guinea and
Sierra Leone)
80 678
(79 140)
107 96 Stock is fully exploited As a precautionary
measure, do not increase
catches of this species
from the average
of the 5 last years
(79 000 tonnes).
Central
(Nigeria and
Cameroon)
57 032
(57 977)
- - No assessment made, but
catches are stable the last
years.
As a precautionary
measure, do not exceed
the average of
the 5 last years
(58 000 tonnes).
West
(Ghana, Togo
and Benin)10
1 819
(684)
- - No reliable results from
model. Catches fluctuate
annually.
No recommendation
made.
South
(Gabon,
Congo,
DR Congo
and Angola)
9 705
(11 000)
104 71 Stock is fully exploited. As a precautionary
measure, do not increase
catches of this species
from the average
of the 5 last years
(11 000 tonnes).
Anchovy (E. encrasicolus)
West
(Côte d’Ivoire,
Ghana, Togo
and Benin)
48 415
(43 582)
77
89
Stock is fully exploited.
Acoustic survey
estimates showed a
decrease in biomass
in 2005 and 2006.
As a precautionary
measure, catch level
should not exceed
the average level
of the 3 last years
(40 000 tonnes).
South Congo
399
(530)
No assessment made.
Catch rates stable last
two years.
Acoustic estimates of
2 000 tonnes in 2005.
As a precautionary
measure, do not exceed
the average catches
of the 5 last years
(530 tonnes).
Horse mackerel and other Carangidae
Trachurus trecae
North
(Gabon,
Guinea,
Sierra Leone
and Liberia)
10 527
(18 163)
- - No reliable results from
model. Catches in 2007
low.
As a precautionary
measure, do not increase
catches of this species
above the 2007 level
(10 000 tonnes).
South
(Gabon,
Congo,
DR Congo
and Angola)
44 518
(16 844)
- - No reliable results from
model. Other information
indicate that stock is
overexploited.
Targeted effort on
this species should
be reduced.
10
Catches from Côte d’Ivoire not available.

38
Stock Last year
catch7 (tonnes)
(5 year
average)
B/B0.1
%
Fcur/F0.1
%
Assessment Management
recommendations
Decapterus spp.
North
(Guinea-
Bissau,
Guinea,
Sierra Leone
and Liberia)
3 120
(3 767)
- - No reliable results from
model.
As a precautionary
measure, do not increase
catches of this species
above the 2007 level
(3 000 tonnes).
Caranx spp.
Sao Tome 186
(193)
- - Catches of this species
stable over the last years.
No recommendation was
made with respect to
catch levels.
39
1. INTRODUCTION
La deuxième réunion du Groupe de travail FAO/COPACE sur l’évaluation des petits pélagiques –
Sous-groupe Sud – a eu lieu au Ghana, du 19 au 28 octobre 2009.
Le Groupe de travail sur les ressources pélagiques a été créé au cours de la 15ème
session du Comité
des pêches pour la Région de l’Atlantique Centre-Est (COPACE) qui s’est déroulée à Abuja, au
Nigéria du 1er au 3 novembre 2000 (FAO, 2001). La première session du Groupe de travail s’est tenue
à Limbé, Cameroun, du 25 septembre au 1er octobre 2006.
L’objectif global du Groupe de travail est de contribuer à l’amélioration de la gestion des petits
pélagiques de l’Afrique nord-occidentale par le biais de l’évaluation de l’état des stocks et des
pêcheries afin d’assurer une utilisation durable de ces ressources pour le plus grand bénéfice des pays
côtiers.
Les espèces évaluées par le Groupe comprennent les sardinelles (Sardinella aurita, Sardinella
maderensis et Sardinella spp.), l’ethmalose d’Afrique (Ethmalosa fimbriata), l’anchois (Engraulis
encrasicolus) le chinchard du Cunène (Trachurus trecae) et Decapterus spp., dans la zone délimitée
par la frontière nord de la Guinée-Bissau et la frontière sud de l’Angola.
La réunion a été financée par le projet EAF-Nansen GCP/INT/003/NOR: Renforcement de la base des
connaissances pour la mise en oeuvre d’une approche écosystémique des pêches maritimes dans les
pays en développement, et a été organisée par la FAO avec la collaboration de la Division de la
recherche sur les pêches maritimes du Ghana.
En tout, 16 scientifiques provenant de 14 pays différents et de la FAO ont participé à la réunion.
1.1 Termes de référence
Les termes de référence du Groupe de travail, qui ont été adoptés par le Sous-Comité du COPACE
(FAO, 2001), sont les suivants:
1. Actualiser (jusqu’à l’année 2008) les statistiques par pays et par espèce relatives aux captures
et à l’effort de pêche.
2. Compiler et mettre à jour les données biologiques sur les captures, notamment celles relatives
à la taille et à l’âge, si elles sont disponibles. Procéder à un examen des tendances observées
et de la qualité des données disponibles.
3. Sélectionner les sources d’informations et les méthodes d’évaluation les plus fiables.
4. Estimer l’état courant des différents stocks de la sous-région en utilisant les informations
disponibles concernant les captures et l’effort de pêche, les données biologiques et les
renseignements issus des campagnes de recherche.
5. Présenter les différentes options de gestion des différents stocks étudiés, en mettant en
évidence les effets qui en découlent à court et à long termes.
6. Identifier les divergences dans les données qui devront être clarifiées au cours des prochaines
réunions du Groupe de travail.
1.2 Participants
Williams Akambi Bamikole Nigéria
Tarub Bahri FAO/Rome
Paul Bannerman Ghana
Antònio Barrados Angola
Iça Barri Guinée-Bissau
40
Ana Maria Caramelo FAO/Rome
José Dias de Sousa Lopes Sao Tomé-et-Principe
Alvin S. Jueseah Libéria
Kossi Maxoè Sedzro Togo
Samuel Quaatey Ghana
Micheline Schummer Gabon
Sheku Sei Sierra Leone
Zacharie Sohou Bénin
Merete Tandstad FAO/Rome
Joanny Tapé Côte d’Ivoire
Sory Traoré Guinée
Jean Tsomba Dihonga République démocratique du Congo
Samatha Vida Osei Ghana
George Yongbi Cameroun
Les noms et les adresses complètes de tous les participants sont donnés à l’Annexe I.
1.3 Définition de la zone de travail
La zone de travail du Groupe est la partie sud de la Région de l’Atlantique Centre-Est (région du
COPACE), délimitée par la frontière nord de la Guinée-Bissau et le sud de l’Angola.
1.4 Structure du rapport
Un chapitre particulier est consacré à chacune des principales espèces (sardinelle, ethmalose, anchois,
chinchard et autres carangidés). Des informations sont fournies sur l’identité du stock, les pêcheries,
les indices d’abondance, l’échantillonnage, les données biologiques, les évaluations, les
recommandations en terme de gestion et la recherche future.
1.5 Vue d’ensemble des pêcheries et des débarquements
Les débarquements totaux des principaux pélagiques de petite taille de la région sud du COPACE ont
subi une baisse de 18 pour cent, passant de 413 000 tonnes en 2005 à 342 000 tonnes en 2007.
Toutefois, la tendance caractérisant ces activités est restée plutôt stable depuis 1999, malgré des taux
de captures plus élevés ou plus bas que la moyenne selon les années comme c’est le cas pour 1996 et
2003. (Figure 1.5.1a). Les débarquements totaux de petits pélagiques pour la période de 1990 à 2007
ont fluctué autour de 494 000 tonnes.
La sardinelle ronde (S. aurita) représente près de 23 pour cent de l’ensemble de petits pélagiques
débarqués de la région et constitue de ce fait la ressource pélagique la plus importante de la zone
d’étude. Les débarquements totaux de sardinelles rondes ont fluctué entre 54 000 et 237 000 tonnes de
1990 à 2007 avec une moyenne de l’ordre de 113 000 tonnes. Les débarquements de sardinelles
rondes ont affiché une diminution progressive depuis 1999, malgré quelques fluctuations, et ont été
estimés à 65 000 tonnes en 2007 (Figure 1.5.1a).
Les captures de sardinelles plates (S. maderensis) étaient de 56 000 tonnes en 2007, représentant ainsi
10 pour cent des débarquements totaux de petits pélagiques de la région. Les débarquements de
sardinelles plates étaient donc de 15 pour cent inférieurs à ceux de la sardinelle ronde pour l’année
2007. La moyenne enregistrée de 1990 à 2007 pour (S. maderensis) était de 48 000 tonnes. Certains
pays enregistrent l’ensemble des captures de Sardinella spp. sans faire de distinction entre les espèces.
Ceci peut prêter à confusion lorsqu’il s’agit de comparer les prises de S. aurita et de S. maderensis.
Néanmoins, pour les pays qui fournissent des données ventilées par espèce, la Sardinella aurita reste
la ressource la plus importante.
41
L’anchois (Engraulis encrasicolus) et l’ethmalose (Ethmalosa fimbriata) sont deux ressources
particulièrement importantes de la région sud du COPACE. Les débarquements totaux d’anchois
étaient de l’ordre de 13 000 tonnes en 2007 et ont connu une baisse d’environ 70 pour cent par rapport
à 2005 (Figure 1.5.1a). Cette diminution peut être liée aux fluctuations qui caractérisent l’état des
stocks d’anchois; en effet, l’année 2008 a enregistré une augmentation des captures qui se sont
élevées à 48 000 tonnes même si les statistiques sont incomplètes étant donné que certains pays
doivent encore communiquer les taux de captures de leurs pêcheries. Une moyenne de 70 000 tonnes
d’anchois a été enregistrée pour la période analysée. Les débarquements d’ethmalose constituent
environ 20 pour cent de l’ensemble des ressources pélagiques débarquées de la sous-région.
L’ethmalose, qui est une espèce estuarienne, est ciblée principalement par les pêcheurs du secteur
artisanal de la sous-région. Les débarquements totaux d’ethmalose de la zone étudiée étaient estimés à
151 000 tonnes en 2007, ce qui constitue une hausse de 13 pour cent par rapport aux 133 000 tonnes
enregistrées en 2005.
Le chinchard du Cunène (Trachurus trecae) est une espèce considérée comme importante et il
représentait, en 2007, environ neuf pour cent, soit approximativement 27 000 tonnes, des
débarquements totaux des principales ressources de petits pélagiques. Les taux de captures ont
présenté des fluctuations durant la période 1990-2007 et affiché une baisse générale. L’ensemble des
chinchards débarqués dans la sous-région était estimé à 27 000 tonnes, ce qui constitue une baisse
d’environ 31 pour cent par rapport aux débarquements de 2005, estimés à 39 000 tonnes.
En 2007, la capture de Trachurus spp. représentait environ huit pour cent (soit 15 000 tonnes) des
débarquements totaux des principales espèces de petits pélagiques. Une tendance à la baisse a été
observée de 1990-2007, suivie d’une hausse au cours des trois dernières années (2005, 2006 et 2007).
Quinze mille tonnes de Trachurus spp. ont été débarquées dans la sous-région en 2007, ce qui
constitue une hausse d’environ 130 pour cent par rapport aux débarquements de 2005 qui étaient de
6 500 tonnes.
Guinée-Bissau
Pêcheries
Les études sur les pêcheries artisanales ont recensé de 5 000 à 10 000 pêcheurs et de 650 à
2 500 pirogues et ont indiqué que les taux de captures variaient de 30 000 à 52 000 tonnes par an
(PASP, 2007). Les types de pirogues identifiées sont les botes, les pirogues monoxyles, les pirogues
monoxyles améliorées, les embarcations de type nhominca et salam, et font entre 1 et 20 mètres
de long.
De 1990 à 1993, les pêcheries industrielles de petits pélagiques étaient aux mains d’opérateurs russes.
Par la suite, le nombre de navires russes a diminué du fait qu’ils ont été remplacés par des vaisseaux
battant pavillon du Panama et du Belize. Durant les périodes de 1990 à 1997 et de 2000 à 2007, plus
de 30 pays sont venus pêcher dans les eaux de la Guinée-Bissau. Les captures les plus élevées de
petits pélagiques en Guinée-Bissau ont été réalisées par trois pays à savoir: la Russie qui enregistre
43 pour cent des captures totales, le Panama, 33 pour cent et le Belize 11 pour cent. Les activités de
ces flottilles représentent plus de 85 pour cent de l’ensemble des captures.
Débarquements
Parmi les deux espèces les plus exploitées de petits pélagiques, Ethmalosa fimbriata et Mugil spp.,
l’ethmalose est la plus importante. Elle est transformée en produits fumés et commercialisée dans le
pays et la sous-région.
Les captures de la pêche industrielle sont dominées par le chinchard du Cunène (Trachurus trecae,
52 pour cent), les sardinelles (Sardinella spp. 35 pour cent), le maquereau (Scomber japonicus, 5 pour
cent), les carangues du Sénégal (Caranx senegallus 4 pour cent ). Ces espèces représentent 86 pour
cent des captures pour les périodes de 1990 à 1997 et de 2000 à 2007. Les 14 pour cent restantes
comprennent des espèces telles que Pomatomus saltatrix, Rachycentron canadum, Somberomorus
42
tritor, Lichia amia, Orcynopsis unicolor, Eucinostomus melanopterus, Trachinoptus spp. Elops
lacerta et Mugil spp., dont les captures sont estimées à environ 338 000 tonnes. (Figure 1.5.1b).
Guinée
Pêcheries
Les pêcheries artisanales ciblant les petits pélagiques disposent d’une flottille littorale (opérant dans
les estuaires et les zones d’une profondeur de 10 mètres maximum) et d’une flottille côtière (opérant
dans les eaux d’une vingtaine de mètres de profondeur). Les bateaux utilisés sur le littoral sont les
kourous, les gbankenyi, les petits salan à voile. Ces embarcations sont rarement munies de moteurs.
Les bateaux de la flottille côtière sont les flimbote et le grand salan. Ils sont tous équipés de moteurs
de 25 CV ou plus. De nos jours, la pêche artisanale en Guinée se pratique principalement à l’aide des
cinq types d’équipement suivants: le filet maillant dérivant pour l’ethmalose, le filet maillant
encerclant pour l’ethmalose, le filet maillant encerclant pour le mulet, le filet maillant encerclant pour
l’otolithe bobo et le filet tournant. Les filets maillants dérivants et les filets maillants encerclants pour
l’ethmalose font partie des équipements les plus utilisés pour la pêche côtière des petits pélagiques de
la Guinée. Le nombre de bateaux du secteur artisanal exploitant les espèces côtières de petits
pélagiques de la Guinée a augmenté et est passé de 1 275 à plus de 1 900 embarcations de 1995
à 2004.
La flottille industrielle se compose de chalutiers pélagiques faisant entre 65 et 88 mètres de long et
d’une capacité de 1 600 à 2 300 TJB. Ces chalutiers sont de gros navires industriels équipés de
moteurs d’une puissance qui dépasse souvent les 2 000 CV. On compte, chaque année, de deux à six
chalutiers pélagiques opérant dans les eaux guinéennes depuis 1995. Il convient de noter que les
chalutiers proviennent de l’ex-URSS (en particulier de l’Ukraine et de la Fédération de Russie) et
qu’ils sont affrétés par des opérateurs guinéens.
Débarquements
L’ethmalose (Ethmalose fimbriata) constitue la plus grande partie des débarquements de petits
pélagiques. Elle est ciblée exclusivement par les pêcheries artisanales et représentait, en 2007, environ
69 pour cent des débarquements totaux de petits pélagiques. Les débarquements1 d’ethmalose ont subi
une baisse et sont passés de 53 000 tonnes en 2003 à 11 300 tonnes en 2005 avant de connaître une
reprise progressive pour atteindre une valeur de 28 000 tonnes en 2007 (Figure 1.5.1b). La moyenne
des débarquements d’ethmalose des cinq dernières années (2003-2007) se situe autour de
30 000 tonnes et une baisse a été observée, bien que la tendance globale des captures se caractérise
par une augmentation pour la période 1995-2007.
En 2007, la sardinelle ronde (Sardinella aurita) était la deuxième espèce la plus pêchée, avec un total
de 3 500 tonnes, représentant de ce fait environ huit pour cent des débarquements totaux de la Guinée.
Les débarquements de sardinelles ont augmenté et sont passés de 4 000 à 7 600 tonnes entre 2003 et
2004, mais ils ont baissé d’une année à l’autre à partir de 2004 et ont été estimés à 3 100 tonnes en
2007. La moyenne des captures au cours des cinq dernières années est de 4 800 tonnes et la tendance
globale pour la période 1995-2007 se caractérise par une augmentation des débarquements de
sardinelles rondes.
La sardinelle plate (Sardinella maderensis) représente sept pour cent de l’ensemble des captures de
petits pélagiques, ce qui correspond à une valeur de 2 500 tonnes. Les captures ont affiché une baisse
progressive et sont passées de 3 700 tonnes en 2003 à environ 700 tonnes en 2005 (55 pour cent de
moins par rapport à 2004), puis elles ont connu une reprise et ont atteint les 2 500 tonnes en 2007.
La moyenne des captures au cours des cinq dernières années était de 2 000 tonnes, avec une
diminution progressive pour cette période. La tendance générale pour les captures de sardinelles
plates se caractérise par une baisse pour la période 1995-2007.
1 Les données relatives aux débarquements d’ethmalose pour la période 1995-2004 ont été revues et corrigées.
43
Les débarquements totaux de chinchards (Decapterus spp. et Trachurus spp.) représentent
respectivement cinq et un pour cent des petits pélagiques débarqués en Guinée et affichent
respectivement une moyenne de l’ordre de 2 900 et de 900 tonnes. Les captures de chinchards ont
connu une tendance à la baisse au cours des cinq dernières années et sur toute la période 1995-2007
(Figure 1.5.1c).
Sierra Leone
Pêcheries
Les pêcheries artisanales opèrent dans les estuaires, les baies et les eaux côtières et l’activité de pêche
se concentre en grande partie sur un stock situé à 15-45 km de la côte et à moins de 50 mètres de
profondeur. Ces pêcheries disposent de différents types de pirogues et de barques en planches; un
sondage récent indique qu’il existe environ 8 000 embarcations de différentes tailles dont dix pour
cent sont motorisées. La pêche à bord de ces appareils est pratiquée au moyen de divers équipements
à savoir des filets à lancer, les filets à anneaux, les filets dérivants, les filets fixes, les sennes de plage
et les hameçons. L’activité de ces pêcheries contribue de façon significative à la production nationale
de poissons et environ 70 pour cent des captures se composent d’ethmaloses (Ethmalosa fimbriata) et
de sardinelles (Sardinella spp); l’espèce Illisha africana est capturée également en grande quantité.
Ces espèces sont pêchées principalement par des filets à anneaux, des sennes de plage et des filets
dérivants de surface.
Le secteur de la pêche industrielle, dominé par des intérêts étrangers, se caractérise par une flottille
multinationale d’une capacité de 75 à plus de 800 TJB. Au cours des 20 dernières années, la flottille
industrielle était composée principalement de crevettiers, de chalutiers à poisson, de pirogues de
soutien (bateaux-mères) et de navires de transport. Ces appareils opèrent en haute mer, bien que les
crevettiers manoeuvrent en grande partie dans les eaux côtières ou sont concentrées les espèces qu’ils
ciblent. L’essentiel de la flottille de la pêche industrielle sont des crevettiers, de ce fait les
débarquements de poissons sont en grande partie constitués de prises accessoires d’espèces
démersales côtières; certaines espèces pélagiques telles que Decapterus spp., les scombridés,
Chloroscombrus chrysurus et autres carangidés sont également pêchées comme prises accessoires.
En 1987, on comptait environ 180 vaisseaux détenteurs de permis, dont une grande partie étaient des
senneurs pélagiques à senne coulissante provenant de l’ex-URSS. Toutefois, ce chiffre a
progressivement diminué à partir des années 1990, en raison principalement du retrait des vaisseaux
soviétiques et par la suite des conséquences de la guerre civile. Cette situation a entraîné une
réduction significative des débarquements de Trachurus spp. (chinchards), de Sardinella spp.
(harengs) et de maquereaux (Scomber japonicus et Scomberomorus tritor).
Débarquements
Dans le passé, l’essentiel des débarquements de petits pélagiques provenait de la pêche industrielle
(flottilles soviétiques) dont les opérations se concentraient dans la partie nord du plateau mais depuis
l’abrogation de l’accord de pêche avec l’ex-URSS, les pêcheries artisanales sont la force dominante
de ce secteur. Ceci est dû au fait que la flottille industrielle actuelle, composée en grande partie de
crevettiers, capture principalement des espèces démersales côtières. L’essentiel des débarquements de
petits pélagiques provient, depuis quelque temps, du secteur artisanal.
Les taux des captures de 1994 à 2002, provenant de la pêche artisanale, ont été établis par
extrapolation puisque les données sur le nombre d’embarcations et l’effort de pêche n’étaient pas
disponibles pour obtenir des statistiques fiables. Cette situation résulte de l’impossibilité de mener des
enquêtes sur les types d’appareils de pêche durant les troubles de la guerre civile qu’a connus le pays
pendant dix ans. Cependant, avec l’établissement du programme ARTFISH2 en 2003, la Division des
statistiques du Ministère des pêches et des ressources maritimes a été en mesure d’effectuer une
2 Programme d’évaluation des stocks des pêcheries artisanales.

44
collecte systématique des données et d’obtenir des statistiques fiables. D’après les données sur les
captures, les prises provenant du secteur artisanal ont triplé par rapport à celles du secteur industriel
pour les années en question. Il convient de noter que les espèces Ethmalosa fimbriata et Sardinella
spp. constituent plus de 70 pour cent de la production totale de la pêche artisanale. Les sardinelles
(Sardinella spp.) débarquées se composent en grande partie de Sardinella maderensis, qui se
concentrent dans les eaux côtières. L’espèce Sardinella aurita se trouve plutôt au large dans les zones
de remontée des eaux.
En Sierra Leone, les débarquements des principales espèces de petits pélagiques ont présenté des
fluctuations importantes d’une année sur l’autre durant la période qui s’étend de 2002 à 2008 et ont
affiché une tendance globale à la hausse (Figure 1.5.1c). En 2005, l’ethmalose (E. fimbriata) et les
sardinelles (Sardinella spp.) ont dominé les prises des principales espèces de petits pélagiques du
pays. Les débarquements totaux de ces espèces étaient respectivement de l’ordre de 53 000 tonnes
(environ 68 pour cent) et de 22 000 tonnes (environ 29 pour cent) (Figure 1.5.1d).
Libéria
Pêcheries
Le Libéria est doté d’un littoral d’environ 579 km qui s’étend du Comté de Grand Cape à la frontière
du Libéria, et de la Sierra Leone au Comté du Maryland, dans le sud, aux confins avec la Côte
d’Ivoire. Le plateau continental se caractérise par une forme irrégulière, variant en largeur d’un point
à l’autre. Les pêcheries libériennes sont constituées des pêcheries artisanales et industrielles. La
flottille industrielle comprend en grande partie des crevettiers à gréement double ciblant les crevettes
et les espèces démersales telles que les soles, les grondeurs et les vivaneaux. La taille des vaisseaux
varie et la capacité est passée, au cours des années, de 90 à 300 tonnes. En 2008, la flottille totale
(artisanale et industrielle) comptait 39 navires. Les pêcheurs du secteur artisanal ciblent
essentiellement les poissons pélagiques et opèrent à l’intérieur d’un espace de six milles marins de la
Zone économique exclusive (ZEE) le long du littoral, qui a été réservé aux activités de la
pêche artisanale.
Les ressources halieutiques se composent d’espèces pélagiques telles que Sardinella spp., Trachurus
trecae, Scomber japonicus, Sphyraena spp., Salene dorsalis, Ethmalosa fimbriata, Decapterus spp.
etc. Les pêcheries artisanales disposent de petites pirogues de sept mètres, manœuvrées par un à trois
pêcheurs et propulsées par des pagaies ou de petits moteurs hors-bord. Les principaux équipements
intervenant dans ce segment de la flottille sont les lignes de pêche à main et les filets maillants. Des
pirogues plus longues d’une douzaine de mètres et dotées de moteurs hors-bord de 15 à 40 CV ciblent
les petits poissons pélagiques au moyen de filets à anneaux et de filets encerclants. Ce type d’activité
est pratiqué principalement par les pêcheurs Fantis du Ghana dont les captures représentent environ
40 pour cent en poids des débarquements totaux du secteur artisanal. Entre 1999 et 2004, la moyenne
annuelle des captures des pêcheries était de 7 757 tonnes, avec une production maximale pour cette
période de 11 472 tonnes, enregistrée en 1999. Les espèces les plus importantes en termes de quantité
étaient celles appartenant à la famille des sardines et des harengs et représentaient environ 23 pour
cent des prises totales.
Débarquements
De 1999 à 2007, les débarquements totaux des principales espèces pélagiques de la partie libérienne
ont présenté des fluctuations. Les captures totales de la période 1997-2004 ont enregistré une hausse,
passant de 648 tonnes en 1997 à 2 523 tonnes en 2004 et ont fluctué après 2004. La moyenne de
l’ensemble des captures de petits pélagiques de 2005 à 2008 était de 1 835 tonnes. L’année 2007 a
enregistré la valeur maximale en termes de captures de petits pélagiques, avec un taux qui est passé de
1 136 tonnes en 2006 à 3 109 tonnes en 2007, soit une augmentation de 21 pour cent pour cette année
(Figure 1.5.1e).

45
Côte d’Ivoire
Pêcheries
Bien que la Côte d’Ivoire soit dotée de pêcheries artisanales, elle n’a communiqué aucune donnée en
raison d’un suivi insuffisant, notamment dans les dernières années. La flottille industrielle se compose
d’une vingtaine de navires de plus de 40 ans dont la majorité font partie du parc national. Ces
appareils utilisent des chaluts de surface et plus récemment des filets maillants de surface encerclants
et opèrent sur tout le littoral à plus de quatre mille marins de la côte.
Débarquements
La flottille industrielle débarque ses captures au port d’Abidjan tôt le matin, et ce jusqu’à 9 heures. La
production industrielle est largement dominée par les sardinelles rondes (Sardinella aurita) qui
constituent plus de 60 pour cent des captures. Les débarquements de cette espèce ont diminué et sont
passés de 9 000 à 4 600 tonnes durant la période 2003-2007 (Figure 1.5.1f).
Ghana
Pêcheries
Les ressources pélagiques sont exploitées principalement au moyen de sennes coulissantes et de
sennes de plage artisanales. Il existe deux types de sennes coulissantes dont la différence réside dans
la taille des mailles. La senne coulissante d’un maillage de 25 mm est appelée localement Watsa
tandis que celle dotée de mailles de 10 mm est connue sous le nom de Poli. La senne de plage se
caractérise par un maillage de 10 mm et est utilisée sur les plages se situant le long d’estuaires. Ces
engins sont maniés sur des pirogues. Il a été recensé 2 500 pirogues manoeuvrant la senne coulissante
artisanale et 903 embarcations munies de sennes de plage opérant sur l’ensemble de la côte
ghanéenne. Les pirogues font de 12 à 18 mètres de longueur et sont équipées de moteur hors-bord de
40 CV.
Les flottilles côtières se composent de bateaux en bois construits localement et équipés de moteurs
intérieurs pouvant faire jusqu’à 400 CV de puissance; ils font entre 8 et 37 mètres de longueur. Ces
embarcations polyvalentes sont utilisées à la fois pour la pêche à la senne coulissante et le chalutage
de fond. Elles fonctionnent comme senneurs durant les périodes de remontée des eaux et pratiquent le
chalutage de fond pour le restant de l’année. Les senneurs ciblent la sardinelle, le maquereau
espagnol, et autres espèces de carangidés. Ils pêchent dans les mêmes eaux côtières que les
embarcations artisanales durant les saisons de remontée des eaux. Deux cent trente navires côtiers
opérant à partir de sept sites de débarquements (sites abritant un port ou une structure portuaire) ont
été recensés.
Débarquements
Pour le Ghana, les valeurs des débarquements totaux des principales espèces pélagiques ont fluctué de
1990 to 2008. L’année 2003 a affiché une légère augmentation de l’ensemble des prises qui est passé
de 140 000 tonnes en 2002 à 170 000 tonnes en 2003, suivie par un fléchissement d’environ 9 pour
cent en 2004. Depuis 2005, les captures de petits pélagiques ont fluctué pour baisser aux environs de
137 000 tonnes en 2007 et remonter à 182 000 tonnes en 2008. Les débarquements totaux des
principaux poissons pélagiques étaient dominés en 2008 par les deux espèces de sardinelles qui
représentaient environ 65-70 pour cent de la production totale. Les débarquements de ces espèces ont
augmenté et sont passés de 94 000 tonnes en 2003 aux environs de 109 000 tonnes en 2004, ce qui
constitue une augmentation de 16 pour cent ces débarquements. (Figure 1.5.1d). Les débarquements
d’ethmalose (E. fimbriata) représentaient environ 19 pour cent des captures totales de petits
pélagiques en 2004, augmentant de 37 pour cent par rapport à 2003. La sardinelle ronde (S. aurita)
représentait 61,2 pour cent des captures de sardinelles. En 2008, les débarquements de sardinelles,
d’anchois et d’ethmaloses aloses étaient respectivement de 40 676, 40 612 et 1 805 tonnes
(Figure 1.5.1g).
46
Togo
Pêcheries
La pêche artisanale se pratique au moyen de sept types d’équipements; il s’agit de la senne coulissante
à anneaux, de la senne de plage, des filets maillants de surface et de fond, du filet maillant flottant, du
filet pour requins et des lignes. Ces engins de pêche interviennent tout au long de l’année et de façon
plus intensive de juillet àt octobre. La senne coulissante est utilisée pour la capture de tous les petits
pélagiques. Les espèces suivantes Caranx crysos, Caranx hippos spp., Trachurus spp., Sardinella
aurita, Sardinella maderensis et Engraulis encrasicolus sont parmi celles qui sont le plus pêchées. La
période enregistrant le taux d’abondance le plus élevé en ce qu concerne les espèces ciblées par les
pêcheries togolaises se situe de juillet à octobre, ce qui correspond à la haute saison. Engraulis
encrasicolus domine les prises réalisées à l’aide de sennes coulissantes (environ 50 pour cent). La
senne de plage, tout comme la senne coulissante, est utilisée pour prendre les petits pélagiques. Les
espèces Sardinella aurita et Sardinella maderensis sont surtout pêchées au moyen de filets maillants
de surface. Le filet maillant de fond est utilisé pour capturer des espèces de fond notamment
Pseudotolithus spp., Pagellus spp. et Galeoides decadactylus. Les filets maillants flottants servent à
prendre des espèces telles que Exocoetus volitans, Hemiramphus brasilensis, Strongylura
senegalensis, etc. La pêche industrielle n’est pas très développée et sa production est, depuis 1999,
négligeable. Les quelques flottilles identifiées se composent de petits chalutiers.
Débarquements
L’anchois (E. encrasicolus) constitue la première espèce-cible et domine les débarquements des
principales espèces de petits pélagiques du Togo. En 2004, les captures d’anchois représentaient
environ 42 pour cent des débarquements totaux de principaux poissons pélagiques de petite taille. Une
moyenne annuelle de l’ordre de 8 000 tonnes d’anchois a été débarquée au cours des cinq dernières
années. (Figure 1.5.1e). Les prises de S. aurita représentaient environ 28 pour cent des débarquements
de poissons pélagiques de petite taille en 2004, augmentant de 17 pour cent par rapport à 2003
(Figure 1.5.1h).
Bénin
Pêcheries
La pêche de petits pélagiques est principalement le fait d’une flottille maritime artisanale. Le Bénin ne
dispose pas d’une flottille industrielle en tant que telle se consacrant à l’exploitation des ressources
pélagiques. Toutefois, une dizaine de tonnes de petits pélagiques sont débarquées chaque année par
quelques chalutiers. La flottille artisanale se compose de plus de 100 pirogues pêchant essentiellement
au moyen de sennes coulissantes, de filets maillants de fond pour le sovi, de filets maillants pour la
sardinelle, le dagbadja, de sennes de plage et de filets maillants pour l’ali-watcha
Débarquements La sardinelle
3 est la principale espèce-cible et domine les débarquements des principaux poissons de
petite taille de la partie béninoise, représentant environ 35 pour cent des captures totales de ce groupe
d’espèces au cours des cinq dernières années (2004-2008). La moyenne des débarquements de
chinchards des pêcheries artisanales est de 116 tonnes et a affiché une hausse au cours des trois
dernières années. Pour ce qui est de la pêche industrielle, les débarquements de cette espèce sont en
moyenne de deux tonnes pour les trois dernières années. Les carangidés sont divisés en trois groupes:
Caranx spp, Trachurus trecae et autres espèces. Le dernier groupe comprend Chloroscombrus
chrysurus, Alectis alexandrinus et Selene dorsalis, espèces pour lesquelles des données sont
disponibles. Environ 1 415 tonnes de Sardinella maderensis et 606 tonnes de Sardinella aurita ont été
débarquées en moyenne au cours des cinq dernières années (Figure 1.5.1i). Étant donné les conditions
de travail sur le terrain, il n’est pas toujours facile pour les inspecteurs d’identifier et de séparer les
3 Les deux espèces de sardinelles ne sont pas toujours séparées dans les débarquements mais les observations sur le terrain
indiquent que ce groupe est composé principalement de sardinelles plates (S. maderensis) (Gbgaudi, comm. pers., 2009).
47
deux espèces. Les autres carangidés et Ilisha africana constituent des ressources importantes pour le
Bénin et représentaient respectivement environ 17 et 15 pour cent des débarquements des cinq
dernières années. Des données relatives aux activités de la pêche industrielle sont disponibles à partir
de 2006.
Nigéria
Pêcheries
Les embarcations artisanales servant à l’exploitation des ressources pélagiques varient entre
5,8 mètres de longueur hors tout, 1,26 mètre de largeur et 0,56 mètre de profondeur et 7,9 mètres de
longueur hors tout, 1,55 mètre de largeur et 0,75 mètre de profondeur. Les pirogues ghanéennes font
de 12 à 18 mètres de LHT et de 1,3 à 1,8 mètre de large. Le maillage des filets utilisés pour la pêche
artisanale des individus adultes de Sardinella spp varie de 45 à 50 mm. L’ethmalose (Ethmalosa
fimbriata) est pêchée au moyen de divers types d’équipements en fonction de l’âge à laquelle elle est
ciblée. Le maillage est de 76 mm pour les individus adultes, de 42 mm pour les pré-adultes et de
12 mm pour le fretin se trouvant dans les criques. Deux types de sennes coulissantes dont la
différence réside dans le type de maillage sont maniés. La senne coulissante d’un maillage de 25 mm
sert à prendre la sardinelle, l’ethmalose, l’espèce Caranx spp. et les scombridés adultes tandis que la
senne d’un maillage de 10 mm cible les individus juvéniles de sardinelles, d’ethmaloses et d’anchois.
Ces deux types d’engins de pêche sont maniés dans les eaux côtières. Les sennes de plage d’un
maillage de 10 mm sont utilisées à partir des plages, essentiellement dans les lagons et les estuaires
pour capturer les sardinelles et anchois adultes et les individus juvéniles de Sardinella spp., Ilisha
africana, Caranx spp. et Ethmalosa fimbriata. Lorsque les espèces cibles migrent vers le large, les
embarcations s’équipent de moteurs hors-bord de 25 à 40 CV. Les moteurs de 40 CV sont posés sur
des pirogues de 12 à 18 mètres de longueur hors tout.
Débarquements
Pour le Nigéria, les valeurs des débarquements totaux des principales espèces de petits pélagiques ont
fluctué de 1990 à 2007. Une hausse a été enregistrée avec des chiffres qui sont passés d’environ
135 000 tonnes en 1995 à environ 168 000 tonnes en 1999, suivie par un fléchissement au cours des
années suivantes. Ceci était dû à une augmentation des débarquements de sardinelles rondes (S.
aurita) au cours de ladite période. Les débarquements totaux des principaux pélagiques de petite taille
du Nigéria étaient dominés par l’ethmalose et la sardinelle, qui constituaient 60 pour cent de la
production totale (Figure 1.5.1j).
Cameroun
Pêcheries
Ces pêcheries comptent plus de 6 500 pirogues de différents types (monoxyles et en planches). Ces
embarcations sont propulsées soit par le vent, soit par des pagaies ou encore des moteurs hors-bord (le
pourcentage de motorisation étant d’environ 28 pour cent). Il existe également différents types
d’engins de pêche tels que les hameçons et les lignes, les fusils sous-marins, les filets maillants et
diverses catégories de sennes de plage. Les sennes coulissantes sont manoeuvrées sur de très grandes
pirogues de 15 à 20 mètres, généralement équipées de moteurs de 40 CV. Pour être manœuvrés avec
plus de facilité, ces appareils, appelés localement Awasha (l’appellation ghanéenne étant Watsa), ont
besoin d’une équipe de 20 à 30 pêcheurs. Environ une centaine de pirogues de ce type ont été
recensées. Les filets encerclants interviennent dans les eaux peu profondes. Les pirogues utilisées à
cet effet sont généralement d’une longueur de 8 à 13 mètres et sont équipées de moteurs de 8 CV;
elles sont manoeuvrées par deux à trois pêcheurs. Il existe environ 890 pirogues de ce type. Les filets
maillants de surface sont utilisés sur deux catégories d’embarcations: des unités motorisées de taille
moyenne, équipées de moteurs 8 CV et manœuvrées par deux à trois personnes et des petites pirogues
non motorisées propulsées par des pagaies maniées par une ou deux personnes.

48
Débarquements
Des données de 1990 à 2008 et de 1994 à 1996 puis de 2002 à 2008 sont disponibles pour Ethmalosa
fimbriata et Sardinella maderensis auprès des pêcheries artisanales. En outre, des informations ont été
recueillies de 2002 à 2005 pour les espèces Caranx spp. et Illisha africana.
Les données relatives à la capture industrielle de Sardinella spp., Caranx spp. et S. japonicus ont été
transmises. Le Cameroun vient juste de mener un sondage et attend le résultat des analyses de ces
informations. Un nouveau programme de collecte de données est sur le point d’être lancé et les
tendances observées seront décrites lors de la prochaine réunion du Groupe de travail (Figure 1.5.1k).
Sao Tomé-et-Principe
Pêcheries
La pêche artisanale constitue une importante source d’emplois et un moyen de subsistance majeur
pour les nombreuses familles vivant le long des côtes. Elle emploie directement plus de
5 000 personnes (pêcheurs et femmes vendant le poisson). Environ 25 000 personnes vivent des
activités maritimes. En général, les produits de la pêche sont vendus sur les marchés comme produits
frais, salés ou fumés.
La pêche artisanale est pratiquée au moyen de pirogues monoxyles de 3 à 6 mètres (propulsées par le
vent ou des pagaies), avec ou sans moteur et maniées par un ou deux pêcheurs. Les filets maillants de
surface et dérivants, les filets encerclants et de fond, les lignes à main et de fond sont les équipements
les plus courants.
Débarquements
À Sao Tomé-et-Principe, la pêche artisanale est le fait d’une flottille utilisant quelques engins de
pêche et, en conséquence, les captures de petits pélagiques sont faibles; elles s’élevaient, en 2007, à
785 tonnes. Les espèces dominantes des captures effectuées à Sao Tomé-et-Principe ne figurent pas
sur la liste des espèces visées par le COPACE. Les espèces les plus communes sont Sardinella spp.,
Caranx spp., C. rhonchus, ainsi que Hemiramphidae et Exocoetidae. L’espèce la plus pêchée est
Caranx spp. (200 tonnes en 2007), représentant presque un quart des captures, suivie par Cypselurus
minos et Hemiramphus brasiliensis (Figure 1.5.1l).
Les prises sont débarquées sur les deux îles. Seulement quelques bateaux se consacrent exclusivement
à la pêche de petits pélagiques. Entre 2000 et 2008, les valeurs des captures enregistrées pour toutes
les espèces ciblées, sont restées stables.
Gabon
Pêcheries
Les petits pélagiques sont ciblés principalement par les pêcheries artisanales; cependant ils sont aussi
capturés par les navires de la flottille industrielle comme prises accessoires.
La pêche artisanale s’effectue sur le littoral à l’intérieur d’un espace de trois milles marins de la côte.
Elle est surtout le fait de pêcheurs étrangers provenant du Nigéria, Bénin, Ghana, Togo, de Sao Tomé-
et-Principe, du Sénégal et de la Guinée équatoriale et de quelques pêcheurs locaux (20 pour cent).
Les petits pélagiques débarqués sont constitués en majorité d’espèces de clupéidés (Ethmalosa
fimbriata), de carangidés (Caranx hippos, etc.) de mugilidés (Mugil cephalus, etc.) et de scombridés
(Scomber japonicus, etc.).
La flottille artisanale se compose de pirogues en fibre de verre fabriquées industriellement au Gabon et
dont les caractéristiques varient selon les zones de pêche, les équipements utilisés et le mode de
stockage du poisson à bord. Les pêcheurs se servent également de pirogues monoxyles à fond plat.
49
Les pirogues font de 6 à 13 mètres de long et 80 pour cent d’entre elles sont équipées de moteur de 8 à
40 CV. En 2008, 1 772 pêcheurs embarqués sur des pirogues opéraient dans les eaux nationales.
Il existe plusieurs techniques de pêche utilisant chacune différents types d’équipement tels que la
senne et le filet maillant encerclants, pour la pêche à l’ethmalose (Ethmalosa fimbriata) (exploitée de
décembre à mars et de juin à août), le filet maillant dérivant de surface, la senne de plage et les lignes.
Débarquements
Les débarquements totaux des principaux petits pélagiques de la partie gabonaise ont présenté des
fluctuations de 1995 à 2008. Les débarquements de E. fimbriata ont constitué 78 pour cent des
débarquements totaux des petits pélagiques pour l’année 2008. Le taux de capture a baissé, passant de
19 000 tonnes en 1998 à 8 300 tonnes en 2008. La deuxième espèce la plus importante en termes de
production est la sardinelle ronde dont les captures affichent de nettes fluctuations. Les prises de
mulets (Mugil cephalus) restent stables. La moyenne des débarquements totaux des petits pélagiques
des cinq dernières années est d’environ 12 200 tonnes (Figure 1.5.1m).
À des fins de gestion et de protection, une saison de fermeture de la pêche à l’ethmalose (Ethmalosa
fimbriata) qui s’étend du 1er septembre au 31 octobre de chaque année a été instaurée en 2003. Une
zone de pêche a également été établie pour la ville de Donguila sur l’estuaire du fleuve Komo.
En outre, un décret prévoyant un repos biologique du 1er janvier au 31 avril de chaque année a été
signé en 2007. Les zones consacrées au repos biologique ont été délimitées et vont de l’estuaire du
Rio Muni au Cap Lopez, dans une zone comprise à l’intérieur des 12 milles marins de la côte.
République démocratique du Congo
Pêcheries
Les petits pélagiques sont exclusivement exploités par la flottille artisanale de la République
démocratique du Congo. Cette pêcherie est basée à Moanda dans la Province du Bas-Congo et dispose
de pirogues monoxyles de 7 à 16 mètres de long; 75 pour cent de ces embarcations sont manoeuvrées
par des pagaies et les 25 pour cent restantes sont équipées de moteurs hors-bord. Les principaux
équipements utilisés sont les filets de surface de petit maillage ciblant la sardinelle ronde (Sardinella
aurita) et la sardinelle plate (Sardinella maderensis) et les filets de surface à grande maille pour
l’ethmalose (Ethmalosa fimbriata) et le chinchard du Cunène (Trachurus trecae).
Débarquements
Les débarquements de petits pélagiques ont connu une augmentation significative au cours des trois
dernières années (de 2006 à 2008), et sont passés de 97 tonnes en 2006 à 326 tonnes en 2007 puis à
933 tonnes en 2008. Les espèces Sardinella maderensis et Sardinella aurita constituent 75 pour cent
des captures. (Figure 1.5.1o).
Angola
Pêcheries
L’exploitation commerciale de petits pélagiques a débuté dans les années 1950 dans le but de
contribuer au développement de l’industrie de la farine de poisson. Jusqu’en 1975, la pêche était
pratiquée à bord de petits bateaux de 40 à 50 tonnes, opérant en majorité dans la zone allant de
Benguela à Namíbe. Durant cette période, les prises de chinchards et de sardinelles s’élevaient à
500 000 tonnes.
50
À partir de l’Indépendance en 1975, les déclarations des débarquements de chinchards ont baissé de
façon significative. En 1976, les captures relevant de la flottille nationale étaient inférieures à
76 000 tonnes. En 1980, elles étaient de l’ordre de 100 000 tonnes pour le chinchard et de
297 000 tonnes pour la sardinelle, et ce en raison des activités des senneurs étrangers qui ont, avec le
soutien des usines de transformation du poisson, commencé à pêcher dans le pays.
En 1990, la flottille étrangère, qui avait déployé l’effort de pêche le plus élevé, cessa d’opérer et les
captures ont chuté jusqu’à 48 000 tonnes pour le chinchard et 87 000 tonnes pour la sardinelle. Les
débarquements de sardinelles ont enregistré une nouvelle hausse jusqu’en 1995 pour atteindre les
119 000 tonnes, avant de chuter fortement dans la dernière période. Les captures de chinchards ont
fluctué au cours de la période 1990-2003 mais ont connu une tendance générale à la baisse. Toutefois,
le système d’enregistrement des données n’était pas fiable pour la période 1999-2007 et, de ce fait, il
convient de les interpréter avec la plus grande prudence. Le système de collecte de données a été
amélioré en 2008 et les captures enregistrées étaient de 44 000 tonnes pour le chinchard et de
70 000 tonnes pour la sardinelle.
La pêche industrielle est pratiquée principalement par 70 senneurs pour le chinchard, la sardinelle et
autres carangidés. Trente-quatre chalutiers exploitant les espèces démersales pêchent les petits
pélagiques (chinchards et autres carangidés) comme prises accessoires.
Débarquements
Il est à noter, en ce qui concerne l’Angola, que les différentes sources d’informations procurent des
estimations très différentes. Il conviendra donc de traiter ces informations avec la plus grande
prudence et les divergences qui ont été notées devront être examinées et clarifiées avant la tenue de la
prochaine réunion. Sardinella spp. et les chinchards représentaient environ 76 pour cent des
débarquements totaux en 2008 (Figure 1.5.1o).
1.6 Vue d’ensemble des résultats des campagnes du N/R DR. FRIDTJOF NANSEN
De nombreuses campagnes de recherche scientifique sur les pélagiques ont été réalisées dans la région
depuis les années 1980 par le norvégien N/R DR. FRIDTJOF NANSEN. Le sénégalais N/R ITAF
DEME a également effectué des enquêtes sur les pélagiques en Sierra Leone durant les années 2008 et
2009. Une liste des études réalisées depuis 1999 est fournie au Tableau 1.6.1.
La série d’études la plus longue est celle de l’Angola, où le N/R DR. FRIDTJOF NANSEN effectue
des campagnes de prospection depuis 1985. De 19954 à 2007, une série de campagnes acoustiques a
été réalisée chaque année à la même saison (d’août à septembre). En 2008 et 2009, l’enquête a été
effectuée des mois de mai à juillet. Ces campagnes de prospection avaient pour objectif de
cartographier la répartition et d’estimer l’abondance des principales espèces de petits pélagiques, à
savoir la sardinelle ronde et plate (Sardinella aurita et S. maderensis), le chinchard (Trachurus trecae
et T. capensis) et le maquereau (Scomber japonicus). La répartition d’autres pélagiques a également
été cartographiée et leur abondance a été estimée. Les estimations d’abondance issues des campagnes
de prospection sont présentées en nombres d’individus et en biomasse par classe de taille.
Pour les années 1985, 1989, 1994, 1995 et 1996, les campagnes de prospection ont été étendues au
Gabon et au Congo afin de s’assurer que les stocks de chinchards et de sardinelles partagés par
l’Angola, le Congo et le Gabon soient complètement couverts. Trois campagnes ont été également
réalisées récemment au Congo et au Gabon (2004-2008) (Figure 1.6.1d), juste avant celle de
l’Angola. La première de ces études avait pour but d’étudier le recrutement des sardinelles, tandis que
les deux dernières (2005 et 2006) consistaient en des campagnes acoustiques combinées à des
programmes de recherche sur les espèces démersales, conduites conjointement aux enquêtes menées
dans la partie centrale du golfe de Guinée (Nigéria, Cameroun, Sao Tomé-et-Principe) (Figure 1.6.1c).
4 En 1995 et 1996, deux campagnes acoustiques ont été conduites, dont une de février à mars et l’autre de juillet à août.
51
Une campagne acoustique combinée à une étude sur les espèces démersales avait déjà été réalisée
dans la partie centrale du golfe de Guinée en 2004. Ces campagnes, avaient pour objectif, entre autres,
de cartographier la répartition et d’estimer l’abondance des principales espèces/principaux groupes de
petits pélagiques, dans la région, de décrire la répartition, la composition et d’estimer l’abondance des
principales espèces démersales du plateau continental par le biais des campagnes de chalutage, de
recueillir des échantillons de zooplancton pour procéder à l’identification et à la répartition des
espèces et de cartographier le régime hydrographique global (température, salinité et oxygène).
Plusieurs études ont été menées dans la partie occidentale du golfe de Guinée (Figure 1.6.1b).
La Figure 1.6.1e présente les estimations d’abondance des principales espèces-cibles en Angola de
1995 à 2006. La biomasse des principales espèces-cibles relatives à cette période a connu des
variations. Depuis 2002, l’ensemble de la biomasse s’est caractérisé par une tendance à la hausse
excepté pour 2005. Les estimations de biomasse de Sardinella spp. ont montré des variations. La
valeur minimale de la série pour cette espèce a été enregistrée en 2005, suivie par un pic d’environ
600 000 tonnes en 2006. Des deux espèces de chinchards, Trachurus trecae est la plus importante. La
biomasse de cette espèce a aussi connu des fluctuations, avec un sommet enregistré dans les premières
années de la série. Une chute a été observée de l’année 2000 à 2001 avec une valeur inférieure à
100 000 tonnes en 2001. De 2001 à 2004, la biomasse a augmenté avant de décroître à nouveau en
2005 et 2006. La valeur enregistrée en 2006 était de l’ordre de 150 000 tonnes. Trachurus capensis est
suivi depuis 2001 et l’année 2005 a connu le chiffre le plus élevé en termes de biomasse pour cette
espèce dont la valeur a atteint les 200 000 tonnes.
La Figure 1.6.1c présente les estimations de biomasse des principaux groupes de pélagiques issues des
campagnes acoustiques menées au Nigéria et au Cameroun. Le groupe le plus important de pélagiques
de cette zone est le Groupe II. On a constaté une baisse de la biomasse au cours des trois dernières
années, avec des valeurs qui sont passées de 200 000 tonnes en 2004 à environ 60 000 tonnes en 2006.
La biomasse de la sardinelle était estimée à environ 10 000 tonnes en 2004 et 2006. Les estimations
pour l’année 2006 n’ont pas encore été finalisées. Des espèces de clupéidés autres que la sardinelle
sont également importantes pour ce stock; leur biomasse était d’environ 16 000 tonnes en 2006.
Sept campagnes de prospection ont été conduites dans la partie occidentale du golfe de Guinée (Côte
d’Ivoire, Ghana, Togo et Bénin) depuis 1999 (Figure 1.6.1b). Cinq de ces études ont été réalisées
durant les mois d’avril à juin des années 1999, 2004, 2005 et 2006 et deux d’entre elles ont été
menées durant la période de remontée des eaux, dont une en juillet-août 2002 et l’autre en septembre
2000. Toutes ces recherches consistaient en des campagnes acoustiques combinées à des études sur
les espèces démersales. Les études menées dans la partie centrale du golfe de Guinée avait pour
mission de cartographier la répartition et d’estimer l’abondance acoustique des principales
espèces/principaux groupes de petits pélagiques de la région, de décrire la répartition, la composition
et d’estimer les indices d’abondance des principales espèces démersales du plateau continental par le
biais de campagnes de chalutage, de recueillir des échantillons de phytoplancton et de zooplancton
pour étudier la répartition des espèces et procéder à leur identification et de cartographier le régime
hydrographique global (température, salinité et oxygène).
La Figure 1.6.1d présente les estimations d’abondance de toutes les espèces/tous les groupes
d’espèces-cibles pour le Ghana, le Togo et le Bénin5 issues des prospections susmentionnées. Les taux
d’abondance les plus élevés relatifs aux petits pélagiques ont été relevés en 2002, 2004 et 2006. Avec
une valeur de l’ordre de 130 000 tonnes, Sardinella spp. constituait l’espèce principale. La biomasse
de cette espèce a connu des variations au cours de la période en question, et a chuté de 45 000 tonnes
en 1999 à environ 37 000 tonnes en 20006. Le niveau de biomasse le plus élevé pour ce groupe
d’espèces a été enregistré en 2002, avec un chiffre de 67 000 tonnes. Il a légèrement diminué en 2004
5 La Côte d’Ivoire est aussi couverte par ces campagnes de prospection mais les estimations de biomasse n’ont pas été
présentées étant donné que ses représentants n’ont pas participé à la réunion. 6 Il convient de noter que la biomasse de sardinelles, dont la valeur est importante pour la Côte d’Ivoire, n’a pas enregistré
de baisse.
52
et 2005 avant d’atteindre les 58 000 tonnes en 2006. Le Groupe II de pélagiques (qui se compose de
carangidés, de scombridés, de barracudas et de poissons-sabres) a fluctué autour de 50 000 tonnes au
cours de la période en question, avec une valeur minimale de 39 000 tonnes enregistrée en 2004 et une
valeur maximale de 65 000 tonnes en 2000. L’estimation de 2006 pour ce groupe était de
42 000 tonnes. Le niveau de biomasse estimée relatif à l’anchois (E. encrasicolus) dans les parties
ghanéennes, togolaises et béninoises a également fluctué au cours de cette période. L’estimation la
plus élevée pour cette espèce a été relevée en 2004 avec un chiffre de 33 000 tonnes. La valeur
enregistrée en 2006 était de 1 800 tonnes, soit une des plus basses des la série.
Des estimations détaillées sur les différentes espèces en fonction des stocks sont données dans leurs
sections respectives.
1.7 Échantillonnage et qualité des données
Durant la réunion du Groupe de travail sur les petits pélagiques de la région Sud, l’accent a été mis
sur le développement d’une base de données et sa mise à jour ainsi que l’établissement de procédures
de travail au sein du groupe. Le Groupe a compilé des séries de données sur les captures, l’effort de
pêche et les informations biologiques pour les principales espèces exploitées de la zone d’étude. La
section suivante donne une vue d’ensemble sur les processus de collecte des informations relatives
aux pêcheries des différents pays.
Guinée
Pêcheries artisanales
Les données sont collectées selon deux procédures différentes. La première, qui a lieu une fois par an,
consiste en un recensement complet des bateaux opérant sur toute la côte de Guinée. Ceci permet
d’établir le nombre effectif de vaisseaux et d’engins de pêche utilisés dans chaque port. La seconde
méthode consiste à suivre un programme d’échantillonnage stratifié pour collecter de façon continue
des données sur l’activité de pêche (nombres de sorties et durée) et les débarquements par région et
par engin pour toutes les catégories commerciales ou espèces. Cette opération est conduite sur un
échantillon de 21 ports qui sont jugés être représentatifs de tous les ports de pêche traditionnels de la
Guinée.
Les débarquements totaux sont calculés par extrapolation des données sur l’activité de pêche et des
observations relatives aux débarquements des 21 ports sélectionnés à l’ensemble de la côte sur la base
du recensement annuel. Toutefois, il convient de prendre en compte le fait que cette extrapolation
statistique puisse être biaisée en raison de la variation du nombre de vaisseaux opérant durant le cours
de l’année et d’une répartition «imparfaite» des engins de pêche dans les ports sélectionnés.
Pêcheries industrielles
Les informations sur le nombre total de vaisseaux de pêche opérant dans la zone économique
exclusive guinéenne ainsi que les caractéristiques techniques afférentes sont recueillies à partir des
permis délivrés par l’administration. Un suivi régulier des activités en mer est effectué par des
observateurs à bord des vaisseaux qui rassemblent les données sur l’effort de pêche (jours de pêche) et
les captures (prises et rejets). Pour s’assurer de la fiabilité de ces estimations, seules les données
recueillies par un groupe d’observateurs soigneusement sélectionnés par le Centre national des
sciences halieutiques de Boussoura (CNSHB) s’embarquant tous les trois mois sur les vaisseaux de
pêche, et qui sont issues d’un programme d’échantillonnage stratifié, sont utilisées. Ces informations
sont vérifiées puis corrigées et extrapolées à tous les vaisseaux industriels opérant dans la zone
économique exclusive de la Guinée pour l’année prise en compte. En dernier lieu, un suivi exhaustif
de tous les débarquements des navires industriels est effectué au port autonome de Conakry par les
échantillonneurs du CNSHB.

53
Sierra Leone
Pêcheries industrielles
Des observateurs sont placés à bord de chaque navire industriel et ce, tout au long de l’année. Ces
derniers sont chargés de recueillir des informations, de les enregistrer sur un journal de bord. Ils
envoient chaque jour les données relatives aux captures et à l’effort de pêche à l’Unité des statistiques
par le biais de l’officier de radio du Ministère des pêches. Les renseignements sont par la suite saisis
dans la base de données (IFDAS). Des observateurs placés sur les quais des principaux sites de
débarquement collectent également les données relatives aux captures qu’ils transmettent à l’Unité
de statistiques.
L’échantillonnage pour l’obtention d’informations statistiques s’effectue de façon continue sur tous
les navires durant la période d’autorisation de l’activité de pêche. Pour ce qui est de l’échantillonnage
biologique, les observateurs du Service des pêches ont été formés aux activités de collecte de données
de qualité à bord des navires de pêche notamment la collecte de renseignements sur les captures des
espèces et les renseignements biologiques tels que la fréquence de taille et les informations relatives à
la taille et au poids. Les informations sur la fréquence de taille et les données relatives à la taille et au
poids ont été fournies par les enquêtes effectuées. Un projet de l’Union européenne de soutien
institutionnel à la gestion des pêches finance actuellement les enquêtes menées sur les pêcheries et la
collecte de données sur les captures dans le secteur industriel.
Pêcheries artisanales
Une méthode de dénombrement est utilisée pour cette pêcherie par le biais de laquelle 25 sites de
débarquements sont sélectionnés parmi les 503 sites répertoriés pour la collecte de données relatives
aux captures et à l’effort de pêche. Les rapports mensuels des captures et de l’effort de pêche sont
calculés à l’aide du logiciel ARTFISH.
Les activités d’échantillonnage ont lieu deux fois par semaine dans tous les sites de débarquement et
les jours sont choisis de façon aléatoire au début de chaque semaine.
Libéria
Pêcheries artisanales
Le secteur artisanal des pêcheries du Libéria fait l’objet de collectes de données de routine. Ces
renseignements sont recueillis par les inspecteurs/observateurs des pêcheries assignés à divers sites de
débarquement tout au long de la côte libérienne. Un relevé hebdomadaire des données de captures et
de l’effort de pêche de toutes les activités à petite échelle est effectué par les inspecteurs nommés sur
le terrain. Un programme d’échantillonnage pour les pêcheries artisanales doit encore être mis en
place. Des plans et des négociations sont en cours pour développer ce programme d’échantillonnage
et permettre l’utilisation d’un logiciel (ARTFISH) afin de calculer les données de captures et sur
l’effort de pêche.
Pêcheries industrielles
Des inspecteurs et des observateurs sont déployés sur les vaisseaux de pêche industriels avec pour
mission d’effectuer le suivi des activités et de collecter les statistiques sur les captures et l’effort de
pêche des navires industriels. Les renseignements obtenus sont transmis à la Division de la recherche
et des statistiques du Bureau national des pêches et saisis dans la base de données appropriée. Un
système de communication par radio VHF est sur le point d’être mis en place par le Bureau national
des pêches pour permettre de communiquer chaque jour les données sur les captures et l’effort des
pêcheries industrielles.

54
Ghana
Pêcheries artisanales
Les statistiques sur les captures relatives aux pêcheries artisanales sont obtenues à partir d’un
programme d’échantillonnage ciblant des sites de débarquements sélectionnés (à savoir 25 pour cent
du nombre total des sites de débarquement) dans lesquels des relevés quotidiens sont effectués sauf le
mardi qui est un jour de pause traditionnel pour la pêche. Des estimations mensuelles des captures par
espèce et par engin ainsi que des estimations mensuelles de l’effort de pêche sont calculées à l’aide du
logiciel ARTFISH.
Pêcheries côtières
Une couverture totale de tous les sites de débarquement des pêcheries côtières (vaisseaux semi-
industriels) est effectuée sur une base journalière et des relevés sont obtenus et traités selon les mêmes
procédures que celles mises en place pour les pêcheries artisanales.
Pêcheries industrielles
Une couverture de tous les navires et de toutes les sorties est effectuée et les données sont saisies afin
d’obtenir les estimations mensuelles des captures.
Des activités d’échantillonnage biologique ont été conduites en 2007, principalement à Téma où le
poisson faisant l’objet de recherche a été acheté aux navires de pêche.
Togo
Les informations relatives aux captures, à l’effort de pêche et aux jours d’activité sont récoltées en
fonction des stocks et ce, tout au long de l’année sur 8 des 20 sites de pêche existants. Le logiciel
ARTFISH est utilisé depuis 1999 par les pêcheries togolaises.
Bénin
Données sur les captures et l’effort de pêche
La zone côtière a été divisée en quatre stocks. Des sites pour la conduite des activités
d’échantillonnage des captures par engin et espèce ont été identifiés dans chacun de ces stocks. Le
nombre de sorties par jour et le type d’engin de pêche employé sont enregistrés dans tous les sites
identifiés.
L’extrapolation des données s’effectue sur la base des informations issues des enquêtes.
Données biologiques
Il demeure difficile de procéder à la collecte de données biologiques en raison du manque de moyens
financiers. En revanche, lorsque cela est possible, l’enregistrement de la fréquence par taille sur une
centaine d’individus par engin de pêche est effectué.
Nigéria
Les données relatives aux pêcheries du pays (captures et effort de pêche) sont récoltées par des
recenseurs opérant sur le terrain aux niveaux national et fédéral. Ces données sont compilées et
analysées par le Département fédéral des pêches et publiées en tant que données halieutiques
annuelles.
Les informations biologiques et autres séries de données utiles sur la pêche sont recueillies durant les
enquêtes de terrain effectuées par l’Institut nigérian de recherches océanographiques et halieutiques
auprès des villages de pêcheurs ou des sites de débarquement. Les appareils et les engins de pêche
sont répertoriés. Le nombre de sorties/jours d’activité sont enregistrés; le poids des captures est
effectué et des échantillonnages pour l’estimation de la taille et du poids sont réalisés. Lorsque ces
55
déplacements ne sont pas possibles, des échantillons de poissons sont achetés aux pêcheurs et envoyés
au laboratoire où ils sont analysés.
Durant les enquêtes sur le terrain, les échantillonnages sont effectués sur une base journalière.
Lorsque ces déplacements ne sont pas possibles, le poisson est acheté à une fréquence variable en
fonction du type d’enquête.
Cameroun
Pêcheries artisanales
Les données sur la pêche des espèces pélagiques cibles ont été obtenues par le biais d’activités telles
que les bases de sondage, les recensements mensuels ou le suivi des sites de débarquement des
pirogues, l’étude des activités des unités de pêche (jours de pêches, captures, etc.) et la collecte de
données biologiques, soutenues par le Ministère de l’élevage, des pêches et des industries animales
(MINEPIA), l’Agence de développement pour le Sud-Ouest (SOWEDA) et des chercheurs de
l’Institut de la recherche agricole pour le développement (IRAD).
Ces activités concernent tous les sites de pêche situés entre le département de Ndian à la frontière
avec le Nigéria et le département de l’Océan aux confins avec la Guinée équatoriale. Ces enquêtes se
basent sur un programme d’échantillonnage stratifié: sites de débarquements par type de pêche par
mois comme recommandé par le logiciel ARTFISH.
En outre, les estimations des captures artisanales d’Ethmalosa fimbriata de 1990 à 1993 puis de 1997
à 2001 ont été calculées sur la base des quantités de poissons fumés transportés des camps de pêche.
En ce qui concerne les données biologiques, une personne sur le terrain assignée à des sites
d’échantillonnage sélectionnés est chargée de recueillir les données sur la fréquence de taille sur une
base hebdomadaire. Chaque mois, un échantillon de plus de 30 espèces de poissons est analysé dans
un laboratoire pour obtenir des informations sur la maturité des gonades et le contenu stomacal
des individus.
L’échantillonnage est effectué par le personnel de MINEPIA mais les données ne sont pas analysées
annuellement. Les seules données accessibles sont celles collectées aux fins de la recherche. Il
n’existe pas de séries chronologiques. Les informations disponibles sont limitées. En 2002, un
système de collecte de données visant à fournir une évaluation continue a été mis en place dans le
cadre du projet SOWEDA.
Pêcheries industrielles
Tout au long de l’année, des observateurs sont embarqués à bord des vaisseaux industriels. Les
données relatives aux captures sont communiquées par les vaisseaux aux autorités portuaires de
MINEPIA à partir des informations issues des journaux de bord. Les renseignements sont ensuite
compilés et publiés dans les rapports annuels d’activité de la province concernée.
Pour ce qui est de l’échantillonnage biologique, aucune donnée n’a été fournie jusqu'à présent. Le
Ministère s’efforce de mettre en place un système de collecte de données biologiques avec
l’assistance du projet de la FAO sur les crevettes tropicales.
Sao Tomé-et-Principe
Pêcheries artisanales
Les informations sur la pêche artisanale sont recueillies sur 10 sites de débarquement répartis dans le
nord, le centre et le sud des deux îles. Une personne sur le terrain est chargée de collecter, 20 jours par
mois, et de façon aléatoire, les données sur l’effort de pêche et les captures sur chacun de ces sites.
56
Les données relatives aux captures et à l’effort de pêche de la flottille semi-industrielle sont collectées
au port à raison d’une personne par bateau.
Il n’est pas aisé de collecter les données portant sur la pêche industrielle car le secteur est dominé par
les flottilles étrangères opérant dans la zone économique exclusive et les observateurs ne sont pas
autorisés à bord de ces navires. De plus, les structures portuaires n’ont pas suffisamment de
profondeur pour permettre aux vaisseaux industriels de se mettre à quai et de procéder aux
débarquements des captures sur l’île. De ce fait, il n’existe pas de données fiables sur les captures.
Gabon
Pêcheries artisanales
La collecte de données sur les pêcheries de petits pélagiques a débuté au milieu des années 1980. En
1994, des outils statistiques ont été mis en place par la Direction générale des pêches et de
l’aquaculture (DGPA) pour le développement de la collecte, du stockage et du traitement des données.
La stratification du plan d’échantillonnage destiné aux pêcheries artisanales devrait être basée sur les
résultats d’un sondage annuel. Mais, en raison de contraintes budgétaires, le dernier sondage couvrant
toutes les strates date de 1998. Toufefois, avec la mise à jour du logiciel ARTFISH par l’Unité des
statistiques, une enquête a été réalisée dans la province de l’estuaire en 2003.
Les informations relatives à l’effort de pêche sont enregistrées sur une base journalière et
comprennent des renseignements sur le nombre de sorties par jour et le type d’engin employé. Les
données sur les captures (poids, nombre de poissons par prise et prix) sont collectées sur les sites de
débarquement. L’échantillonnage biologique est conduit trois fois par semaine mais la fréquence peut
varier en fonction de l’intensité de l’activité de pêche.
Toutes les données rassemblées sont transmises à l’Unité des statistiques de la DGPA où elles sont
saisies dans le logiciel ARTFISH développé par la FAO puis traitées.
Le principal obstacle à l’amélioration du système de collecte de données est lié au fait qu’il n’y a pas
de véhicules permettant de se rendre sur le terrain pour contrôler l’information transmise par les
inspecteurs.
République démocratique du Congo
Pêcheries artisanales
Les données statistiques sont récoltées deux fois par mois (les 15 et 30 de chaque mois). Les captures
sont divisées par espèce et les données relatives à la taille et au poids sont recueillies. Les
observateurs transmettent les informations à l’Inspection territoriale de l’agriculture qui procédera à
leur traitement. Ensuite ces informations seront envoyées aux administrations des districts et des
provinces avant d’être saisies dans la base de données nationale.
Angola
Pêcheries artisanales
Depuis mai 1996, l’Institut des pêches artisanales a, en collaboration avec la FAO et le Ministère
français de la coopération, mis en place un programme de contrôle sur les captures/l’effort de pêche,
tout au long de la côte, grâce auquel il a été estimé que la production des pêcheries artisanales pour
l’année 2008 s’élevait à environ 5 000 tonnes de poissons pélagiques (dont 2 000 tonnes pour le
chinchard, 2 500 tonnes pour les sardinelles, 346 tonnes pour Scomber japonicus, 113 tonnes pour
Solene dorsalis et 245 tonnes pour l’espèce Caranx spp.
57
Pêcheries industrielles
Les données relatives aux captures et à l’effort de pêche sont notées sur les journaux de bord des
compagnies de pêche. Ces informations sont communiquées sur une base journalière.
Le poisson destiné à l’échantillonnage biologique provient des vaisseaux industriels et semi-
industriels des ports de pêche et des sites de débarquements. L’analyse biologique est ensuite
effectuée dans l’institut approprié afin de déterminer la taille, le poids, le sexe et le contenu stomacal.
Les gonades sont observées pour déterminer le stade de maturité sexuelle et le poids. Les otolithes
sont extraits. Par la suite, toutes ces informations sont saisies dans une base de données et analysées.
Qualité des données
Malgré les efforts déployés par les pays de la région pour collecter des informations sur les pêcheries,
comme nous l’avons vu dans les sections précédentes, un grand nombre d’entre eux ne disposent pas
de données fiables notamment en ce qui concerne l’effort de pêche portant sur certains stocks et
espèces. Il a également été noté que les valeurs obtenues concernant les pays et les espèces pouvaient
différer en fonction des sources dont elles proviennent. Il convient de porter une attention particulière
à la nécessité d’obtenir des séries de données fiables sur les captures et l’effort de pêche pour pouvoir
procéder à l’évaluation des stocks.
Les séries d’indices d’abondance sont des données d’entrée importantes pour l’évaluation des stocks.
Les captures par unité d’effort de pêche constituent un type d’indice d’abondance. Certains pays
disposent de CPUE calculées par engin de pêche mais, pour certains stocks, il est encore difficile
d’identifier une série appropriée de CPUE. Pour de nombreuses populations, il n’existe pas encore de
données fiables sur l’effort de pêche.
Il est également nécessaire de disposer de séries d’indices d’abondance des stocks qui soient
indépendantes des pêcheries. Depuis les années 1980, les campagnes acoustiques et les études sur les
espèces démersales menées par les vaisseaux de recherche norvégiens ont contribué de façon
significative à améliorer les connaissances dans ce domaine. Bien que la durée des séries
chronologiques de l’ensemble des stocks ne soit pas suffisamment longue pour qu’elles soient
utilisées comme principal indice d’abondance dans le modèle, elles fournissent d’importants
renseignements sur la répartition des stocks, leur identité, la composition des espèces, les aspects
hydrographiques, etc.
1.8 Méthodologie et logiciel
Un total de 7 espèces/groupes d’espèces et de 14 stocks ont été analysés par le Groupe
(Tableau 1.8.1).
Après révision des données disponibles, le Groupe de travail a conclu que les seules méthodes
applicables à tous les groupes de stocks étaient les Modèles de production (Annexe II). Permettant de
rester cohérent avec la méthode utilisée en 2004 et au cours des dernières années, la version
dynamique du modèle de Schaefer (1954) a été utilisée. Pour évaluer l’état actuel des stocks et estimer
les paramètres du modèle, une feuille de calcul Excel de la version dynamique de ce modèle, avec un
estimateur d’erreur d’observation (Haddon, 2001), a été utilisée. Le modèle a été adapté aux données
en utilisant la fonction d’optimisation non linéaire, l’outil Solveur, incorporée dans Excel.
Points de référence pour les conseils de gestion
Afin de rester cohérent en termes de conseil de gestion, le Groupe de travail de 2009 a décidé de
continuer à utiliser les Points de référence biologiques adoptés par le Groupe lors de l’évaluation des
petits pélagiques pour l’Afrique nord-occidentale. Les indices B/BMSY et F/FMSY ont donc été utilisés
comme Points de référence limites, tandis que les indices B/B0.1 et F/F0.1 ont été choisis pour les
Points de référence cibles. Une explication plus détaillée de ces points de référence et de leur usage
58
dans la gestion des pêcheries est fournie dans le Rapport du Groupe de travail de la FAO de 2006 sur
l’évaluation des petits pélagiques pour l’Afrique nord-occidentale (FAO, 2006).
Méthodes basées sur la taille
Pour certains des stocks comme ceux de Sardinella spp. et des populations méridionales de
chinchards, des données relatives à la répartition par taille issues des campagnes du vaisseau de
recherche NANSEN étaient disponibles. Ces données ont servi à déterminer la fréquence de taille des
captures en supposant que la répartition par taille des enquêtes soit similaire à celle des captures du
Gabon, du Congo et de l’Angola. Les paramètres de croissance ont été estimés en utilisant l’outil
FiSAT II (Gayanilo, Sparre et Pauly, 2005). L’analyse de cohortes basée sur la fréquence de taille
(Jones, 1984) a été appliquée à ces stocks pour estimer la mortalité par pêche F et le schéma
d’exploitation correspond pour ces dernières années. Pour de plus amples informations sur ces
méthodes, les lecteurs peuvent se reporter aux travaux de Sparre et Venema (1996).
2. SARDINELLES
Les stocks de sardinelles subissent l’influence d’un hydroclimat tropical caractérisé par la présence de
trois systèmes de courant (le Courant de Guinée, le Courant des Canaries et le Contre-courant
équatorial) qui affectent les conditions océanographiques et ont un impact significatif sur
l’exploitation des ressources pélagiques. Le système de courant dominant est constitué du Courant de
Guinée et d’une branche du Courant des Canaries qui, poussés par les vents de février à avril, se
dirigent vers l’est le long de la côte pour rejoindre le Courant Sud-équatorial se déplaçant vers l’ouest
de mai à juillet au large de la côte du Libéria. L’influence du Courant des Canaries se traduit par le
déplacement du nord vers le sud de l’isotherme 25 oC (Coutin et Payne, 1988). Le Courant froid des
Canaries progressant vers l’Équateur est fortement ressenti de février à avril véhiculant des eaux plus
froides, des nutriments provenant de la remontée des eaux ainsi qu’une thermocline bien définie
survenant en milieu de plateau (10 mètres sur les côtes et 20 mètres au large) et qui fait vivre un grand
nombre de stocks de poissons pélagiques, d’une importance capitale pour le commerce, y compris les
sardinelles.
2.1 Identité du stock
Les sardinelles capturées dans la région sud du COPACE, de la Guinée à l’Angola, se composent en
l’occurrence de deux espèces, la sardinelle ronde (Sardinella aurita) et la sardinelle plate (Sardinella
maderensis). Les campagnes effectuées dans la région de l’étude montrent que ces deux espèces sont
présentes sur une vaste zone allant de la partie sud marocaine au sud de l’Angola. Pour le moment, le
groupe de travail FAO/COPACE s’accorde sur l’existence de quatre stocks pour ces deux espèces
dans la région sud. Il s’agit des stocks nord (Guinée-Bissau, Guinée, Sierra Leone et Libéria), ouest
(Côte d’Ivoire, Togo, Ghana, Togo et Bénin), central (Nigéria et Cameroun) et sud (Gabon, RD
Congo et Angola) (Figure 2.1.1).
2.2 Les pêcheries
Stock nord (Guinée-Bissau, Guinée, Libéria et Sierra Leone)
L’espèce Sardinella aurita se concentre dans les zones du large et est exploitée par les chalutiers
pélagiques industriels de la Guinée, les crevettiers et les senneurs à senne coulissante de la Sierra
Leone. Elle constitue la deuxième espèce la plus abondante après Decapterus spp. S. aurita et
S. maderensis sont pêchées comme prises accessoires par les crevettiers et chalutiers à poisson de la
Sierra Leone et du Libéria. L’espèce S. maderensis vit dans les eaux côtières et est exploitée par les
pêcheries artisanales de la Guinée, Guinée-Bissau, Sierra Leone et du Libéria au moyen de pirogues.
Les embarcations locales sont munies de filets maillants à anneaux, de filets maillants de fond, de
filets maillants dérivants et de sennes de plage. La plupart des filets à anneaux sont maniés grâce à des
moteurs hors-bord de 15 à 20 CV.
59
Stock ouest (Côte d’Ivoire, Togo, Ghana et Bénin)
Au large du Ghana et du Togo, les captures sont dominées par l’espèce S. aurita tandis que
S. maderensis est l’espèce pêchée en majorité dans les eaux du Bénin. Les deux types de sardinelles
sont exploités principalement par les flottilles artisanales du Ghana, du Togo et du Bénin et, dans une
moindre mesure, par les flottilles semi-industrielles (côtières) et les chalutiers industriels à poisson du
Ghana et de la Côte d’Ivoire. Dans ces pays, les flottilles artisanales ont recours soit à des sennes
coulissantes artisanales, appelées localement Poli/Watsa, soit à des sennes de plages pour
l’exploitation des deux espèces.
Stock central (Nigéria et Cameroun)
Les sardinelles sont exploitées par les flottilles artisanales du Nigéria et du Cameroun. S. aurita est
l’espèce prédominante dans les captures. Au large du Cameroun, les flottilles artisanales utilisent des
filets maillants de surface. Dans les eaux côtières du Nigéria, les poissons adultes sont capturés à
l’aide de filets maillants dérivants, de sennes de plage et de sennes coulissantes artisanales. Les
juvéniles sont pêchés dans les criques avec des filets à lancer et des filets-écopes. Ces équipements
sont maniés sur des pirogues en planches ou taillées dans le bois.
Stock sud (RD Congo, Gabon, Congo et Angola)
Étant donné qu’aucun participant du Congo n’était présent, les données pour ce pays ne sont pas
incluses dans l’analyse. Dans cette région, les sardinelles sont pêchées principalement par les flottilles
artisanales. Dans les pêcheries artisanales, les pirogues sont munies de filets maillants de surface
tandis que les flottilles industrielles utilisent des chaluts pélagiques. La sardinelle plate, S. maderensis,
est l’espèce prédominante au large de la République démocratique du Congo et même si on la trouve
tout au long de l’année, l’espèce S. aurita est plus abondante durant la période qui s’étend de mai à
septembre. Au large de la République démocratique du Congo, ces deux types de ressources sont
exploités tant par les flottilles artisanales qu’industrielles. Dans les pêcheries artisanales, des filets
maillants de surface sont maniés à partir de pirogues tandis que les flottilles industrielles utilisent des
chaluts pélagiques.
En Angola, les deux espèces sont proportionnellement réparties. S. maderensis se trouve dans les
zones côtières et S. aurita se concentre dans les eaux du large. L’abondance de sardinelles est liée aux
périodes de remontée des eaux. Elles sont exploitées tant par les flottilles artisanales que semi-
industrielles. Le chalutage pélagique industriel a cessé en 2004. La sardinelle est principalement
exploitée par les senneurs à senne coulissante et les engins de pêche artisanaux. Sardinella maderensis
est également l’espèce prédominante pour l’Angola et se concentre dans les eaux côtières, tandis que
S. aurita se trouve au large. L’abondance de sardinelles est liée aux périodes de remontée des eaux.
Captures et effort de pêche
Les captures relatives aux sardinelles sont présentées aux Tableaux 2.2.1,a,b,c. L’effort de pêche est
donné au Tableau 2.2.2 et dans les Figures 2.2.2 a,b.
Stock nord
Les deux espèces de sardinelles sont pêchées tout au long de l’année et les périodes de plus grande
activité vont de janvier à mai et de septembre à décembre. Les taux de captures les plus élevés
coïncident avec les périodes de remontée des eaux. L’effort de pêche relatif à la sardinelle provient
des secteurs artisanal et industriel. L’effort de pêche de 1995 à 2007 lié à l’exploitation artisanale est
le plus important de la région et est présenté au Tableau 2.2.2 et dans les Figures 2.2.2a,b. On observe
une tendance à la baisse depuis 2005.
Stock ouest
La période de plus grande activité pour les captures de ces deux espèces s’étend de juin à septembre et
coïncide avec le moment de la plus importante remontée des eaux dans cette zone. L’effort de pêche
relatif à la sardinelle de la région provient essentiellement du secteur artisanal. En termes de pêche
côtière, le Ghana a enregistré, de 1990 à 2008, l’effort le plus important de la région pour la
60
sardinelle. Le taux de captures apparaît stable entre 1992 et 2000 et fluctue par la suite autour de
80 000 tonnes. En général, on note une tendance à la baisse des captures de Sardinella aurita depuis
2004 pour le stock ouest.
Stock central
L’espèce la plus exploitée dans la région est la Sardinella maderensis. Même si les prises sont
relativement élevées au Cameroun, l’enregistrement de l’effort de pêche n’est pas effectué sur une
base régulière. Seule la série chronologique de données de la période 2002 à 2008 est disponible.
Aucun système de collecte n’a été mis en place de 1990 à 1993 ni de 1997 à 2001. L’essentiel des
captures est effectué au Nigéria mais il n’existe pas d’informations sur l’effort de pêche pour cette
zone. Les données relatives aux captures et à l’effort de pêche de cette région présentent de sérieuses
lacunes.
Stock sud
La série de données relatives aux captures de la République démocratique du Congo affiche des
valeurs particulièrement basses en comparaison avec le reste de la région. Toutefois, Sardinella.
aurita est prédominante dans les captures du pays.
L’espèce, qui est exploitée principalement par l’Angola, constitue la ressource la plus pêchée dans la
région. En République démocratique du Congo, les captures et l’effort de pêche relatifs à Sardinella
aurita et à Sardinella maderensis affichent des valeurs particulièrement basses. Les sardinelles sont
principalement exploitées par les pêcheries artisanales du sud.
2.3 Indices d’abondance
2.3.1 Captures par unité d’effort
Les captures par unité d’effort des pêcheries artisanales et industrielles ont été calculées séparément
pour les deux espèces de sardinelles (S. aurita et S. maderensis) et les stocks, mais des valeurs des
prises combinées concernant la région ont été également enregistrées. En raison des goulets
d’étranglements relatifs à la collecte de données, il n’a pas été fait de distinction entre les deux
espèces pour le stock nord couvrant la Guinée, la Guinée-Bissau, la Sierra Leone et le Libéria, et les
données font référence à l’espèce Sardinella spp dans son ensemble. Eu égard aux stocks sud et
central, les deux espèces ont également été regroupées, dans le but d’harmoniser les évaluations
(Figures 2.3.1a,b,c).
Sardinella aurita
Stock nord
Les données relatives aux captures de cette espèce ne sont pas communiquées séparément par les pays
de cette zone excepté pour la Guinée. Les CPUE (Figure 2.3.1a, Tableau 2.3.1a) provenant des
flottilles industrielles de la Guinée montrent une tendance à la hausse pour la période 1995-2002. On
observe, à partir de ce moment-là, un fléchissement des valeurs, lié probablement aux pressions
exercées par la pêche. Il est important de noter que les CPUE ne présentent pas les fluctuations
annuelles qui sont habituellement associées aux petits pélagiques.
Stock ouest
Tous les pays à l’exception de la Côte d’Ivoire ont communiqué des données sur les flottilles
artisanales et les CPUE (Figure 2.3.1b); celles-ci montrent des fluctuations d’une année sur l’autre
pour le Ghana et le Togo, ce qui est typique des petits pélagiques. Les CPUE provenant de la pêche
industrielle du Ghana affichent une tendance générale à la baisse du début des années 1990 à 1998,
suivie par une certaine reprise en 2003. On observe une diminution générale des CPUE dans la région
de 2004 à 2008. Les valeurs les plus élevées pour les CPUE apparaissent en 1992 et en 2003.
61
Stock central
Les CPUE n’ont pas pu être calculées en raison du fait que le Nigéria ne disposait pas de données sur
l’effort de pêche et que le Cameroun n’a pas fourni de renseignements.
Stock sud
Les CPUE de la flottille artisanale de l’Angola affichent les valeurs les plus élevées de la zone avec
un pic en 1990, mais aucune donnée n’a été communiquée pour la période allant de 1998 à 2008. Il se
peut qu’il soit difficile de suivre les tendances en raison de l’absence d’une longue série
chronologique de données. Les valeurs des CPUE des flottilles industrielles des deux pays fluctuent
d’une année à l’autre. Il apparaît que l’indice d’abondance actuel est plus bas que celui relevé au
début des années 1990, et cela probablement en raison des fortes pressions exercées par la pêche.
Sardinella maderensis
Stock nord
L’espèce est exploitée tant par les flottilles artisanale qu’industrielle. Les valeurs des CPUE des
pêcheries artisanales de Guinée portant sur S. maderensis tendent à fluctuer tout au long des années.
(Figure 2.3.1d).
Stock central
En ce qui concerne le Nigéria et le Cameroun, les CPUE relatives à S. maderensis n’ont pu être
calculées du fait que les deux pays ne disposent pas de données sur les captures pour cette espèce.
Stock ouest
En général, le taux de CPUE pour S. maderensis dans cette zone est particulièrement bas et tend à
fluctuer. Les CPUE des pêcheries industrielles de la Côte d’Ivoire sont faibles et présentent des
fluctuations; elles ont atteint un niveau maximal en 2005. Les CPUE pour le Ghana sont restées
stables de 1990 à 2003 puis ont présenté des fluctuations et ont subi une chute en 2007. Les CPUE des
pêcheries artisanales du Togo ont eu tendance à fluctuer et ont enregistré une baisse en 2007. Les
CPUE relatives à la pêcherie artisanale du Bénin ont fluctué puis ont atteint un plateau élevé à partir
de 2004 (Figure 2.3.1d, Tableau 2.3.1b).
Stock sud
Les CPUE relevées pour les pêcheries artisanales de la République démocratique du Congo fluctuent
et affichent une tendance à la baisse de 2003 à 2007 avec une reprise en 2007. Les pêcheries
industrielles de l’Angola connaissent le taux le plus élevé de CPUE de la région et ont enregistré un
pic en 1991, suivi par une tendance à la baisse de 1991 à 1996 et d’une reprise en 1997. Il n’existe pas
de données sur les captures pour les premières années de la série, ni de données sur l’effort de pêche
pour la période allant de 1998 à 2008.
Sardinella spp.
Stock nord
La Guinée-Bissau affiche le taux le plus élevé de CPUE de la région et les valeurs indiquent une
tendance à la baisse de 1990 à 1994 suivie par une augmentation en 1995. Par la suite, on a observé
une tendance à la hausse des rendements pour la période qui s’étend de 1997 à 2003 avec un taux de
CPUE particulièrement élevé et improbable pour 2003 vu l’effort de pêche minimal et le taux élevé de
captures déclarées. Les CPUE de Sardinella spp. des pêcheries industrielles de la Guinée tendent à
fluctuer et ont atteint un niveau particulièrement élevé en 1995. Les pêcheries artisanales de la Guinée
ont fait état de CPUE qui sont basses et stables. Les CPUE des flottilles artisanales de la Sierra Leone
sont également basses et indiquent une tendance à la hausse de 2006 à 2008. Eu égard aux pêcheries
artisanales et industrielles du Libéria, les valeurs des CPUE tendent à fluctuer et un pic a été
enregistré en 1995 (Figures 3.2.1e,f).
62
Stock ouest
Les données communiquées pour le stock ouest ne pas font pas référence à Sardinella spp dans son
ensemble mais une distinction a été établie entre les deux espèces.
Stock central
Les données communiquées pour le stock ouest ne pas font pas référence à Sardinella spp. dans son
ensemble mais une distinction a été établie entre les deux espèces.
Stock sud
Les CPUE des pêcheries artisanales du Gabon portant sur Sardinella spp. sont particulièrement basses
et présentent des fluctuations, avec un niveau maximal enregistré en 2002 et en 2004.
2.3.2 Campagnes acoustiques
Sardinella spp.
Stock nord
Il n’existe pas de données chronologiques sur de longues périodes pour le stock nord. Les données
d’enquête disponibles sont celles issues des campagnes du N/R DR. FRITDJOF NANSEN en 2006 et
2007, bien que la Sierra Leone dispose de données d’enquête issues des prospections conduites de
2008 à 2009 mais celles-ci n’ont pas été communiquées au Groupe de travail (Figure 2.3.2a).
Stock ouest
Les estimations de biomasse provenant des campagnes réalisées à bord du N/R DR. FRITDJOF
NANSEN depuis 1999 sont présentées dans la Figure 2.3.2b. Les informations révèlent une tendance
à la hausse d’une année sur l’autre pour la biomasse de l’espèce depuis l’an 2000 excepté pour l’année
2005. Ceci contraste avec les valeurs des CPUE concernant le stock. Il importe de signaler qu’il
n’existe pas de données provenant d’enquête pour 2001 et 2003.
Stock central
La Figure 2.3.2c présente les estimations de biomasse issues des campagnes de prospection du
N/R DR. FRITDJOF NANSEN réalisées en 2004, 2005 et 2007 dont les valeurs affichent une
tendance à la baisse pour les années en question.
Stock sud
Concernant l’Angola, une longue série chronologique de données pour la période 2000-2006, issue
des campagnes de prospection du N/R DR. FRITDJOF NANSEN, est disponible et présentée à la
Figure 2.3.2d.
Les chiffres mettent en évidence des variations de la biomasse tout au long de la période avec un pic
en 2007. On constate, pour les trois pays regroupés, Angola, Congo et Gabon, que les estimations de
biomasse effectuées à bord du N/R DR. FRITDJOF NANSEN donnent des valeurs en diminution
pour la période de 2006 à 2007 (Figure 2.3.2e).
2.4 Échantillonnage des pêcheries commerciales
Stock nord
Le taux d’échantillonnage sur les pêcheries artisanales est de 5 et de 20 pour cent respectivement pour
la Sierra Leone et la Guinée. Alors que la Sierra Leone utilise ARTFISH pour le traitement des
données, la Guinée a recours au logiciel PECHART. Les deux programmes donnent des estimations
mensuelles de captures par engin. Dans les deux pays, l’échantillonnage couvre la totalité de la
flottille industrielle. Des observateurs sont placés à bord de chaque vaisseau sortant pour la pêche afin
de recueillir les données portant sur les captures et l’effort de pêche. Les logiciels IFDAS et
PECHART sont respectivement utilisés par la Sierra Leone et la Guinée pour le traitement des

63
données relatives à l’exploitation industrielle. Des estimations mensuelles des captures par engin en
sont tirées.
Stock ouest
Au Ghana, Togo et Bénin, un programme d’échantillonnage couvrant respectivement 25, 10 et 5 pour
cent de la flottille artisanale, est en place. Ces trois pays ont recours au logiciel ARTFISH pour le
traitement des données et l’estimation des captures mensuelles par engin. Au Ghana,
l’échantillonnage couvre l’ensemble de la flottille semi-industrielle et les données sont saisies dans le
logiciel ARTFISH afin d’estimer les captures mensuelles par engin de pêche.
Stock central
Des activités d’échantillonnage sont en place et couvrent la flottille artisanale; le logiciel ARTFISH
est utilisé pour estimer les captures mensuelles concernant le Cameroun et, par extrapolation,
le Nigéria.
Stock sud
Au Congo comme en Angola, des activités d’échantillonnage ont lieu à raison de quatre jours par
semaine; le logiciel ARTFISH est utilisé pour traiter les données et estimer les captures mensuelles
par engin de pêche. La flottille industrielle est couverte dans son intégralité. Les données sont traitées
sur une feuille de calcul.
2.5 Données biologiques
Aucune nouvelle donnée biologique n’a été soumise au Groupe de travail.
2.6 Évaluation
Les programmes d’échantillonnage de la Sierra Leone, du Libéria et de la Guinée-Bissau ne font pas
de distinction entre les deux espèces de sardinelles. Les données font donc référence à Sardinella spp.
dans son ensemble.
Des évaluations ont été réalisées pour Sardinella spp. (stock nord), S. aurita et S. maderensis (stock
ouest) et Sardinella spp. (stock sud).
Méthodes
Le modèle dynamique de production adapté à une feuille de calcul Excel a été utilisé. (Annexe II).
Données d’entrée
Stock nord Les données d’entrée comprenaient les captures totales relatives à Sardinella spp. provenant des
pêcheries artisanales de la Guinée et de la Sierra Leone, des pêcheries artisanales et industrielles du
Libéria et de la Guinée-Bissau pour la période 1997-2007. Les CPUE des flottilles industrielles du
Libéria ont été utilisées pour l’évaluation.
Résultats
L’ajustement du modèle aux données a été jugé satisfaisant. Un résumé des résultats des évaluations
est présenté au Tableau 2.6.1a et à la Figure2.6.1a.
Ces résultats indiquent que la biomasse actuelle de Sardinella spp. est de 24 pour cent supérieure au
niveau de B0.1. Le rapport entre la mortalité par pêche observé et F0.1 est de 56 pour cent, et la
mortalité par pêche est inférieure à celle du coefficient qui donnerait un rendement durable dans le
long terme.
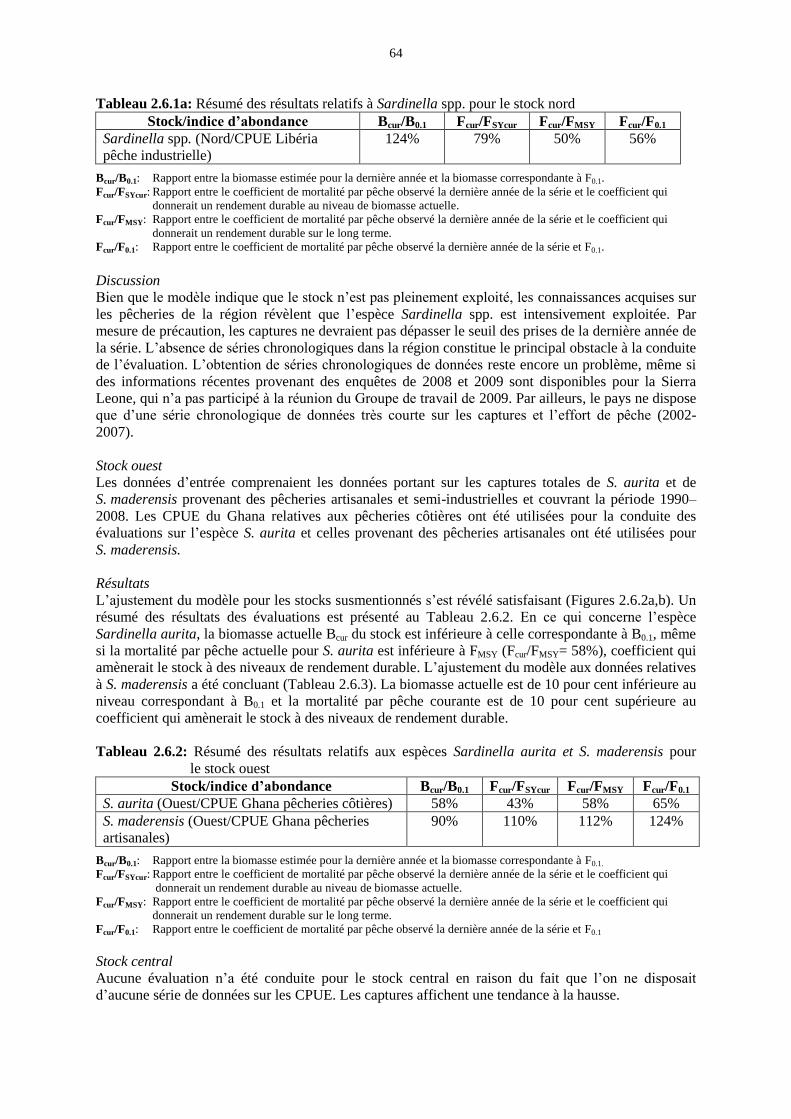
64
Tableau 2.6.1a: Résumé des résultats relatifs à Sardinella spp. pour le stock nord
Stock/indice d’abondance Bcur/B0.1 Fcur/FSYcur Fcur/FMSY Fcur/F0.1
Sardinella spp. (Nord/CPUE Libéria
pêche industrielle)
124% 79% 50% 56%
Bcur/B0.1: Rapport entre la biomasse estimée pour la dernière année et la biomasse correspondante à F0.1.
Fcur/FSYcur: Rapport entre le coefficient de mortalité par pêche observé la dernière année de la série et le coefficient qui
donnerait un rendement durable au niveau de biomasse actuelle.
Fcur/FMSY: Rapport entre le coefficient de mortalité par pêche observé la dernière année de la série et le coefficient qui
donnerait un rendement durable sur le long terme.
Fcur/F0.1: Rapport entre le coefficient de mortalité par pêche observé la dernière année de la série et F0.1.
Discussion
Bien que le modèle indique que le stock n’est pas pleinement exploité, les connaissances acquises sur
les pêcheries de la région révèlent que l’espèce Sardinella spp. est intensivement exploitée. Par
mesure de précaution, les captures ne devraient pas dépasser le seuil des prises de la dernière année de
la série. L’absence de séries chronologiques dans la région constitue le principal obstacle à la conduite
de l’évaluation. L’obtention de séries chronologiques de données reste encore un problème, même si
des informations récentes provenant des enquêtes de 2008 et 2009 sont disponibles pour la Sierra
Leone, qui n’a pas participé à la réunion du Groupe de travail de 2009. Par ailleurs, le pays ne dispose
que d’une série chronologique de données très courte sur les captures et l’effort de pêche (2002-
2007).
Stock ouest
Les données d’entrée comprenaient les données portant sur les captures totales de S. aurita et de
S. maderensis provenant des pêcheries artisanales et semi-industrielles et couvrant la période 1990–
2008. Les CPUE du Ghana relatives aux pêcheries côtières ont été utilisées pour la conduite des
évaluations sur l’espèce S. aurita et celles provenant des pêcheries artisanales ont été utilisées pour
S. maderensis.
Résultats
L’ajustement du modèle pour les stocks susmentionnés s’est révélé satisfaisant (Figures 2.6.2a,b). Un
résumé des résultats des évaluations est présenté au Tableau 2.6.2. En ce qui concerne l’espèce
Sardinella aurita, la biomasse actuelle Bcur du stock est inférieure à celle correspondante à B0.1, même
si la mortalité par pêche actuelle pour S. aurita est inférieure à FMSY (Fcur/FMSY= 58%), coefficient qui
amènerait le stock à des niveaux de rendement durable. L’ajustement du modèle aux données relatives
à S. maderensis a été concluant (Tableau 2.6.3). La biomasse actuelle est de 10 pour cent inférieure au
niveau correspondant à B0.1 et la mortalité par pêche courante est de 10 pour cent supérieure au
coefficient qui amènerait le stock à des niveaux de rendement durable.
Tableau 2.6.2: Résumé des résultats relatifs aux espèces Sardinella aurita et S. maderensis pour
le stock ouest Stock/indice d’abondance Bcur/B0.1 Fcur/FSYcur Fcur/FMSY Fcur/F0.1
S. aurita (Ouest/CPUE Ghana pêcheries côtières) 58% 43% 58% 65% S. maderensis (Ouest/CPUE Ghana pêcheries
artisanales) 90% 110% 112% 124%
Bcur/B0.1: Rapport entre la biomasse estimée pour la dernière année et la biomasse correspondante à F0.1.
Fcur/FSYcur: Rapport entre le coefficient de mortalité par pêche observé la dernière année de la série et le coefficient qui
donnerait un rendement durable au niveau de biomasse actuelle.
Fcur/FMSY: Rapport entre le coefficient de mortalité par pêche observé la dernière année de la série et le coefficient qui
donnerait un rendement durable sur le long terme.
Fcur/F0.1: Rapport entre le coefficient de mortalité par pêche observé la dernière année de la série et F0.1
Stock central
Aucune évaluation n’a été conduite pour le stock central en raison du fait que l’on ne disposait
d’aucune série de données sur les CPUE. Les captures affichent une tendance à la hausse.

65
Stock sud
Données d’entrée
Les données d’entrée comprenaient les données portant sur les captures totales de Sardinella spp. des
pêcheries artisanale et industrielle du Congo, des pêcheries artisanales de la République démocratique
du Congo et des pêcheries semi-industrielles et industrielles de l’Angola, ainsi que de l’exploitation
industrielle du Gabon pour la période 1990-2008. Les CPUE obtenues par N/R DR. FRIDTJOF
NANSEN (1990-2008) pour l’Angola ont été utilisées pour la conduite de l’évaluation. L’analyse de
cohortes basée sur la fréquence de taille a été effectuée comme évaluation exploratoire pour
cette région.
Résultats
Un résumé des évaluations est présenté au Tableau 2.6.3. Le résultat de l’évaluation révèle que la
biomasse actuelle est de 49 pour cent supérieure à celle du niveau B0.1 et indique que le stock est
modérément exploité. La mortalité par pêche observée est au-dessous du niveau F 0.1 et au-dessous du
niveau du coefficient qui donnerait des rendements durables dans le long terme.
Tableau 2.6.3: Résumé des résultats relatifs à Sardinella spp. pour le stock sud (Angola, Gabon,
Congo, RDC et Congo)
Stock/indice d’abondance Bcur/B0.1 Fcur/FSYcur Fcur/FMSY Fcur/F0.1 Sardinella spp. (Sud/CPUE Angola Nansen) 149% 149% 55% 61%
Bcur/B0.1: Rapport entre la biomasse estimée pour la dernière année et la biomasse correspondante à F0.1.
Fcur/FSYcur: Rapport entre le coefficient de mortalité par pêche observé la dernière année de la série et le coefficient qui
donnerait un rendement durable au niveau de biomasse actuelle.
Fcur/FMSY: Rapport entre le coefficient de mortalité par pêche observé la dernière année de la série et le coefficient qui
donnerait un rendement durable sur le long terme.
Fcur/F0.1: Rapport entre le coefficient de mortalité par pêche observé la dernière année de la série et F0.1.
Discussion
Le modèle indique que Sardinella spp. est modérément exploitée dans le stock sud. Ce résultat a été
confirmé par l’analyse de cohortes basée sur la fréquence de taille. Toutefois il convient d’interpréter
cette conclusion avec prudence en raison d’incertitudes au niveau des informations qui résultent des
goulets d’étranglement dans la déclaration de données. Le Congo ne disposait pas de données pour la
série des trois dernières années. Les données sur les captures de l’année 2005 ont été utilisées pour la
série de 2006 à 2008. Ceci constitue un obstacle majeur à la conduite de l’évaluation.
2.7 Recommandations d’aménagement
Stock nord
Il est recommandé de maintenir le niveau de captures des dernières années qui est de l’ordre de
20 000 tonnes et de réglementer l’effort de pêche en particulier dans les eaux côtières où les juvéniles
sont ciblés par les pêcheurs du secteur artisanal. Le nombre de pirogues des flottilles devrait
être contrôlé.
Stock ouest
La biomasse du stock de S. aurita est surexploitée et, par mesure de précaution, les captures ne
devraient pas dépasser les 40 000 tonnes par an. Le stock de S. maderensis est pleinement exploité.
Tout effort de pêche additionnel pourrait entraîner une plus grande mortalité par pêche et engendrer
de ce fait une diminution de la biomasse. L’espèce S. maderensis est pleinement exploitée et les
captures ne devraient pas dépasser la moyenne des cinq dernières années (20 000 tonnes).
Stock central
Par mesure de précaution, les captures ne devraient pas dépasser la moyenne des cinq dernières
années (30 000 tonnes).
66
Stock sud
Il n’a pas été établi de valeur limite pour ce stock. Toutefois, il est recommandé de poursuivre la
collecte de données et de veiller à ce que les déclarations soient effectuées de manière continue. Par
mesure de précaution, il est suggéré de ne pas augmenter la capture de ces espèces.
2.8 Recherche future
Les recherches sur les pêcheries devraient être intensifiées dans toutes les régions. Il
conviendrait d’améliorer les programmes de collecte de données et de déployer des efforts
pour recueillir des données sur les espèces dans les pêcheries artisanale et industrielle.
Intensifier l’échantillonnage biologique afin d’obtenir des estimations plus fiables des indices
de croissance et de mortalité des espèces et des indices d’abondance.
Procéder à l’identification des espèces, notamment pour Carangidae et Sardinella.
Poursuivre les campagnes de prospection dans le cadre du Programme NANSEN afin
d’obtenir des informations indépendantes des pêcheries.
Obtenir des indices d’abondance plus fiables pour les sardinelles au-dessous de l’isobathe de
30 mètres.
Améliorer la compréhension des interactions entre les ressources et l’environnement.
Adopter un programme d’échantillonnage systématique pour la collection de données
relatives aux captures et à l’effort de pêche pour toutes les flottilles.
3. ETHMALOSE
3.1 Identité du stock
L’ethmalose d’Afrique (Ethmalosa fimbriata), que l’on appelle aussi l’alose, se concentre tout au long
de la côte ouest-africaine et constitue une espèce importante pour la région; on la trouve
principalement dans les eaux côtières (à 15-45 mètres de profondeur), les estuaires et parfois dans les
fleuves. Elle est ciblée en grande partie par les pêcheries artisanales mais des prises sont également
signalées par le secteur industriel. L’ethmalose d’Afrique de la région sud, il a été décidé de
considérer quatre stocks, à savoir les stocks nord, ouest, central et sud. Étant donné qu’aucune
recherche biologique n’a été menée sur cette population, l’étude de l’état des stocks repose
principalement sur les tendances des captures et de l’effort de pêche des flottilles. Les populations ont
été regroupées dans le stock nord (Guinée, Guinée-Bissau, Libéria, Sierra Leone), le stock ouest (Côte
d’Ivoire, Ghana, Togo et Bénin), le stock central (Nigéria, Cameroun) et le stock sud (Gabon,
République démocratique du Congo, Congo et Angola).
3.2 Les pêcheries
L’ethmalose d’Afrique est exploitée depuis longtemps et de façon intensive dans la sous-région. En
tant qu’espèce côtière et estuarienne, elle est ciblée principalement par les pêcheries artisanales et
constitue une ressource importante pour la Guinée, la Sierra Leone, le Nigéria, le Cameroun et le
Gabon. Même si le stock est exploité par d’autres pays (Guinée-Bissau, Libéria, Côte d’Ivoire, Bénin,
Congo et République démocratique du Congo), ceux-ci n’ont communiqué qu’un nombre limité de
données sur les captures et l’effort de pêche. Le Togo, Sao Tomé-et-Principe et l’Angola n’ont fourni
aucun renseignement sur le sujet.
Stock nord
Un éventail d’engins de pêche tels que les filets maillants à anneaux, les sennes coulissantes, les
sennes de plage et les filets maillants de fonds est utilisé. Les pirogues de pêche peuvent faire de 6 à
18 mètres de long et sont propulsées par des voiles, des pagaies ou encore de moteurs hors-bord de 15
67
à 40 CV. En Guinée et Sierra Leone, l’ethmalose représente plus de 70 pour cent des débarquements
totaux de la pêche artisanale.
Stock ouest
Sont utilisés des engins de pêche tels que les filets maillants à anneaux, les sennes coulissantes, les
sennes de plage et les filets maillants de surface. Les pirogues maniées peuvent faire de 12 à
18 mètres de longueur et sont propulsées par des moteurs hors-bord de 25 à 40 CV. Les captures
d’ethmalose représentent un faible pourcentage de l’ensemble des débarquements de la pêche
artisanale du Ghana et du Bénin.
Stock central
Les engins de pêche utilisés comprennent des sennes coulissantes, des filets maillants dérivants de
surface, des filets tournants, des sennes de plage. Les pirogues peuvent faire de 5 à 9 mètres ou de
12 à 20 mètres de long et sont maniées à l’aide de voiles, de pagaies et de moteurs hors-bord de 8 à
40 CV. L’ethmalose représente environ 15 à 20 pour cent des débarquements totaux des pêcheries
artisanales du Nigéria et du Cameroun.
Stock sud
L’espèce est pêchée, en grande partie, dans la zone de Lobito, Angola et est capturée exclusivement
par les pêcheries artisanales au moyen de filets maillants dérivants de surface. Les pirogues de 6 à
7 mètres de long sont propulsées par des pagaies et des moteurs hors-bord de 15 à 25 CV. L’Angola
n’a fourni aucune donnée sur les captures. L’ethmalose représente environ 6 à 10 pour cent des
débarquements totaux des pêcheries artisanales du Congo.
Captures
Les captures annuelles totales d’ethmaloses par pays, flottilles et stocks sont présentées au
Tableau 3.2.1. Aucune donnée n’a été fournie par Sao Tomé-et-Principe, l’Angola et le Togo, en
raison des quantités insignifiantes d’ethmaloses débarquées ou du fait que les prises sont rejetées en
mer pour l’Angola. La Figure 3.2.1 donne les captures totales d’ethmalose par stock (nord, central,
ouest, sud). Pour le stock nord, les captures des années 1990 à 1994 ont été extrêmement basses étant
donné qu’aucun des pays n’a fourni de données, excepté la Guinée-Bissau. À partir de 1994, on a pu
constater une tendance à la hausse des captures d’ethmalose, avec des fluctuations en fonction des
années et un chiffre qui a atteint les 86 004 tonnes en 2006. La valeur des captures totales
d’ethmaloses fluctue d’une année sur l’autre pour le stock central mais le chiffre le plus élevé a été
enregistré en 1992. On a observé une diminution progressive à partir de 1998 avec une légère
fluctuation en 2000 et 2006. Les captures totales pour le stock central affiche une tendance à la hausse
et présentent quelques fluctuations entre 1990 et 1995. Les valeurs ont fléchi jusqu’en 2002 et une
reprise a été constatée de 2003 à 2007. Ceci est probablement dû à une augmentation des captures au
Cameroun, en raison du conflit de Bakassi durant lequel de nombreux pêcheurs ont franchi la
frontière, et à la mise en place d’un système de collecte de données efficace dans le cadre du projet
SOWEDA. Les captures totales relatives aux stocks sud et ouest se sont maintenues à un niveau de
production plutôt constant avec très peu de fluctuations.
Effort de pêche
Les données relatives à l’effort de pêche pour l’ethmalose sont présentées au Tableau 3.2.2 et dans la
Figure 3.2.2 et sont exprimées en nombre de sorties, nombre de jours de pêche ou nombre de jours en
mer. Il convient de noter que l’effort de pêche présenté ici est celui de l’ensemble des pêcheries
artisanales de chaque pays et des pêcheries industrielles du Libéria, de la Sierra Leone et du Ghana
(pêches côtières). L’effort de pêche pour la Guinée-Bissau est celui enregistré par les flottilles
étrangères russes et allemandes.
Les données relatives à l’effort de pêche des flottilles artisanales de la Sierra Leone et du Ghana ont
été calculées en fonction du nombre de sorties de pêche tandis que les autres pays ont fourni les
données relatives à l’effort de pêche en nombre de jours de pêche pour toutes les flottilles. Le Togo, le
Nigéria, Sao Tomé-et-Principe et l’Angola n’ont pas communiqué de renseignements à ce propos. Les

68
données sur l’effort de pêche enregistrées par les pays ont permis de mettre en évidence les diverses
tendances existantes à partir des années où des informations ont été mises à disposition. La situation
globale pour tous les pays de 1995 à 2007 a été relativement stable, excepté pour le Cameroun et la
Sierra Leone qui ont signalé une augmentation de l’effort de pêche. Les changements observés sur les
séries de données du Cameroun pourraient être attribués aux mêmes causes que celles qui ont affecté
les tendances des captures.
3.3 Indices d’abondance
3.3.1 Capture par unité d’effort
Les CPUE (en kg par sorties de pêche) pour les exploitations artisanales ont été calculées sur la base
des données relatives aux captures et à l’effort de pêche communiquées par le Congo, la Guinée et le
Ghana. Les CPUE pour les pêcheries artisanales, exprimées en kg par sorties de pêche, ont également
été estimées pour la Sierra Leone et le Ghana. La tendance globale des captures par unité de pêche
s’est révélée stable pour tous les pays avec des taux particulièrement bas de 1990 à 2007
(Figure 3.3.1). Pour les captures par unité d’effort estimées en kg par sorties, des taux bas et stables
ont été enregistrés pour le Ghana de 1990 à 2004 tandis que, pour le Congo, les séries chronologiques
limitées de données pour les flottilles artisanales ont signalé une tendance à la hausse (Figure 3.3.1).
3.3.2 Campagnes acoustiques
Les enquêtes sur les petits pélagiques de la région de l’Afrique de l’ouest menées dans le cadre du
Programme Nansen et par les vaisseaux de recherche au niveau sous-régional ne fournissent pas
d’estimations sur l’abondance de l’ethmalose étant donné que l’espèce se concentre dans les zones
côtières et estuariennes. De ce fait, des données indépendantes des pêcheries n’ont pas été
communiquées au Groupe de travail.
3.4 Échantillonnage des pêcheries commerciales
Stock nord
Dans le secteur des pêcheries industrielles, des observateurs sont embarqués à bord de chaque navire
titulaire d’un permis et ont pour tâche d’enregistrer les données relatives aux captures et à l’effort de
pêche sur les journaux de bord et celles-ci sont par la suite saisies et analysées. En conséquence,
l’échantillonnage pour l’obtention de données statistiques est effectué tout au long de l’année. Pour
les flottilles artisanales, l’échantillonnage s’effectue selon des méthodes de dénombrement par le biais
desquelles les données sur les captures et l’effort de pêche sont enregistrées dans des sites de
débarquements sélectionnés. Les informations obtenues sont par la suite traitées et analysées par le
logiciel ARTFISH.
Stock ouest
Dans les pêcheries artisanales, l’échantillonnage est réalisé grâce à des méthodes de dénombrement
par le biais desquelles les données sur captures et l’effort de pêche sont enregistrées dans des sites de
débarquements sélectionnés. Les informations obtenues sont par la suite traitées et analysées par le
logiciel ARTFISH.
Stock central
Dans les flottilles de pêche artisanale du Cameroun, l’échantillonnage est réalisé grâce à des méthodes
de dénombrement par le biais desquelles les données sur les captures et l’effort de pêche sont
enregistrées dans des sites de débarquements sélectionnés Les informations recueillies sont traitées et
analysées par le logiciel ARTFISH. Au Nigéria, les résultats des échantillonnages des captures et les
données relatives à l’effort de pêche sont recueillis sur les principaux sites de débarquements tant à
l’échelle nationale que fédérale et, en tant que données halieutiques nationales, elles sont compilées et
analysées.
69
Stock sud
Dans les pêcheries artisanales, l’échantillonnage est réalisé grâce à des méthodes de dénombrement
par le biais desquelles les données sur les captures et l’effort de pêche sont enregistrées dans des sites
de débarquements sélectionnés. Les informations obtenues sont par la suite traitées et analysées par le
logiciel ARTFISH.
3.5 Données biologiques
Les pays concernés n’ont pas fourni d’ultérieures données biologiques.
3.6 Évaluation
Qualité des données
Afin de tester la qualité des données disponibles pour l’évaluation, le Sous-Groupe a procédé à une
analyse exploratoire des données de capture et d’effort de pêche. En raison de séries de données
limitées sur l’effort de pêche concernant les stocks ouest et central, les CPUE n’ont pu être calculées.
Pour ce qui est des stocks nord et sud, les captures par unité d’effort, calculées respectivement sur la
base des données relatives aux captures et à l’effort de pêche des flottilles artisanales de la Guinée et
du Gabon, et ciblant l’ethmalose, ont été utilisées séparément pour l’évaluation.
Méthodes
Le modèle dynamique de production, adapté à une feuille de calcul Excel, a été utilisé. Ce modèle est
décrit plus en détail à l’Annexe II.
Données d’entrée
Le modèle requiert des séries chronologiques complètes de données sur les captures totales ainsi
qu’un indice d’abondance des stocks. L’estimation des captures totales a été obtenue en additionnant
les estimations des captures de toutes les flottilles pour chaque pays et ont été utilisées comme séries
de captures globales. Pour l’indice d’abondance, une série chronologique unique a été utilisée. Les
données sur les captures par unité d’effort du secteur artisanal de la Guinée (1997-2007) et du Gabon
(1995-2008) ont été sélectionnées. Pour l’ethmalose d’Afrique, les CPUE provenant des pêcheries
artisanales ont été jugées plus appropriées que celles du secteur industriel.
Afin d’estimer les captures totales pour la série chronologique du stock nord, les statistiques de la
FAO sur les captures relatives à la pêche artisanale de la Sierra Leone pour la période 1997 à 2001 ont
été ajoutées à la série. Pour le stock sud, le Congo n’a pas fourni de renseignements sur les captures
des trois dernières années (2006-2008). Il a été supposé que le taux de captures concernant la période
2006-2008 pour ledit pays était similaire à celui enregistré en 2005.
Résultats
Les résultats obtenus concernant les stocks nord et sud ont été jugés satisfaisants. Toutefois,
l’ajustement du modèle aux données concernant le stock ouest n’a pas été concluant.
L’ajustement du modèle sur les données de CPUE de la Guinée et sur les captures totales du stock
nord s’est avéré satisfaisant. Le modèle a pu suivre les principales tendances des indices d’abondance
en réagissant aux variations des captures (Figure 3.6.1).
Pour le stock sud, l’ajustement du modèle, en utilisant les données de captures par unité d’effort du
secteur artisanal du Gabon, s’est avéré acceptable. (Figure 3.6.2).
Les résultats du modèle indiquent que le niveau de la biomasse actuelle pour le stock nord est proche
de celui de la biomasse correspondent au point B0.1 et que la mortalité par pêche actuelle se situe en
dessous de celle du point F0.1. Ce stock est considéré comme pleinement exploité (Tableau 3.6.1). Le
modèle adapté aux données du stock sud donne des résultats similaires à ceux obtenus dans le cas du
stock nord.

70
Tableau 3.6.1: Résumé de l’état actuel du stock et de la pêche de l’ethmalose d’Afrique
(Ethmalosa fimbriata)
Stock/indices d’abondance Bcur/B0.1 Fcur/FSYcur Fcur/F0.1 Fcur/FMSY
Ethmalosa fimbriata (Nord/CPUE Guinée
pêche artisanale)
107% 106% 96% 87%
Ethmalosa fimbriata (Sud/CPUE Gabon
pêche artisanale)
104% 75% 71% 64%
Bcur/B0.1: Rapport entre la biomasse estimée pour la dernière année et la biomasse correspondante au point F0.1.
Fcur/FSYcur: Rapport entre le coefficient de mortalité par pêche observé durant la dernière année de la série et le
coefficient qui permettrait un rendement durable au niveau de biomasse actuel.
Fcur/FMSY: Rapport entre le coefficient de mortalité par pêche observé durant la dernière année de la série et le
coefficient qui permettrait un rendement durable dans le long terme.
Fcur/F0.1: Rapport entre le coefficient de mortalité par pêche observé durant la dernière année de la série et F0.1.
Discussions
L’absence de contraste entre les séries chronologiques de captures et les indices d’abondance
compromet fortement la fiabilité des résultats obtenus par la modélisation. La qualité des résultats a
également été affectée par le fait que les différents pays concernés n’ont pas transmis de données
complètes. En conséquence, il convient d’interpréter ces informations avec la plus grande attention.
Toutefois, les résultats de la modélisation indiquent que les stocks nord et sud sont pleinement
exploités.
Pour ce qui est du stock ouest, les données disponibles n’ont pu être adaptées au modèle. L’ethmalose
n’est, dans cette zone, que la deuxième espèce ciblée après la sardinelle qui est le poisson le
plus recherché.
3.7 Recommandations d’aménagement
Par mesure de précaution, le niveau des captures pour le stock nord ne devrait pas être augmenté et
dépasser la moyenne des cinq dernières années (79 000 tonnes). Pour ce qui est du stock sud, le
niveau des captures ne devrait excéder, comme approche de précaution, la moyenne annuelle des
captures totales (11 000 tonnes).
Le Groupe de travail n’a pas été en mesure de présenter les résultats de l’évaluation du stock central
faute de données chronologiques sur l’effort de pêche pour le Cameroun et du fait que le Nigéria n’a
fourni aucune information à ce sujet. Il a donc été recommandé que l’effort de pêche ne dépasse pas la
moyenne des cinq dernières années (58 000 tonnes).
En ce qui concerne le stock ouest, aucune recommandation n’a pu être émise en raison de
l’insuffisance des données des pays de cette zone.
3.8 Recherche future
Le Nigéria, le Cameroun, la Côte d’Ivoire, la Guinée-Bissau, la Guinée, le Gabon, la
République démocratique du Congo et le Bénin sont invités à recueillir des informations et à
améliorer le processus de collecte de données (captures et effort de pêche) concernant
l’espèce E. fimbriata.
En raison de l’absence d’échantillonnages biologiques pour l’ethmalose d’Afrique dans la
sous-région, il est instamment demandé au pays de rassembler des données biologiques sur
E. fimbriata pour procéder à des analyses plus fiables de l’état des stocks et des effets de la
pêche sur cette population.
Il est suggéré que les pays qui ciblent l’ethmalose d’Afrique entreprennent des recherches
pour obtenir des données/informations sur la pêche de cette espèce.
71
4. ANCHOIS
4.1 Identité du stock
Engraulis encrasicolus, communément appelé anchois, est présent dans la région sud du COPACE,
comprise entre la Guinée et l’Angola. Espèce pélagique formant souvent de grands bancs,
Engraulis encrasicolus vit dans des eaux peu profondes et parfois jusqu’à 400 m de profondeur.
L’anchois représente l’une des espèces caractéristiques de l’upwelling. Les juvéniles se reposent dans
la frange côtière où, capturés, ils constituent l’espèce pélagique dominante. Par ailleurs, l’anchois
fréquente aussi les estuaires.
4.2 Les pêcheries
Dans la région, l’anchois est principalement exploité à la senne de plage et à la senne tournante qui
sont des engins non sélectifs.
L’anchois est présent dans les eaux de fort upwelling, ce qui explique la disponibilité de cette espèce
dans les différentes eaux territoriales des pays de la région en fonction de la saison d’upwelling. Dans
certains pays, la consommation d’anchois entre dans les habitudes alimentaires des populations. C’est
le cas au Ghana, au Togo, au Bénin et au Congo où des quantités importantes sont débarquées par la
senne de plage et la senne tournante. Dans d’autres pays, les anchois sont mélangés avec d’autres
petites espèces dans les débarquements. L’identification est alors très difficile. C’est le cas au Nigéria
et au Cameroun où l’espèce est présente, mais où aucune donnée n’est disponible. En Guinée,
l’anchois est considéré comme une espèce accessoire, non prisée et par conséquent rejetée.
Captures
Six pays de la région disposent de données de capture sur cette espèce. Il s’agit de la Sierra Leone, du
Ghana, du Togo, du Bénin, de l’Angola et du Congo. Les données de 2006 à 2008 du Congo n’ont pas
été fournies parce que le scientifique du Congo était absent. Ces données de capture, réparties par
zone, sont présentées dans le Tableau 4.2.1et la Figure 4.2.1. Il s’agit du stock nord (Guinée et Sierra
Leone), le stock ouest (Ghana, Togo et Bénin) et le stock sud (Congo et Angola).
Le stock nord n’est représenté que par la Sierra Leone. Les données des captures vont de 2002 à 2008.
elles ont beaucoup varié durant ces années. Néanmoins, on note un pic en 2006 avec 151 tonnes.
Pour le stock ouest, la capture totale a varié de 82 220 tonnes à 48 415 tonnes d’Engraulis
encrasicolus de 1990 à 2008 avec des pics en 1996, 2000 et 2003. D’une manière générale, on assiste
à une tendance à la baisse dans le stock ouest et le graphique qui traduit cette tendance est identique à
celui des captures d’anchois au Ghana qui est la pêcherie la plus importante.
Le stock sud prend en compte les captures du Congo et de l’Angola. D’une manière générale, ces
captures n’ont pas subi de grandes fluctuations. La moyenne est de 499 tonnes environ par an.
Les captures de l’Angola sont passées de trois tonnes en 1998 à une tonne en 2003. Cette espèce ne
semble pas être une espèce-cible pour les pêcheries semi-industrielle et industrielle d´Angola. Elle
constitue des prises accessoires. En 2002, l’augmentation de la prise observée au Congo serait due à
l’augmentation des unités de senne de plage.
Effort de pêche
L’effort de pêche dans toute la région est exprimé en jours de pêche comme le montrent le
Tableau 4.2.2 et la Figure 4.2.2. L’essentiel de cet effort a été exercé par la senne tournante et la senne
de plage. Cette dernière est utilisée dans la zone des nurseries. Une senne de plage peut être utilisée
jusqu’à deux fois par jour. Quand une senne de plage sort et fait de bonnes prises, elle incite les
autres à sortir à leur tour.
72
Les embarcations intervenant dans cette pêcherie sont le plus souvent des pirogues monoxyles
ghanéennes de 14 à 18 mètres de long dans le stock ouest et de 6 à 18 m dans les stocks nord et sud.
La plupart sont propulsées à l’aide de moteurs de 10 ou de 25 cv. Dans certains pays, certaines unités
de la senne de plage ne sont pas motorisées.
4.3 Indices d’abondance
4.3.1 Capture par unité d’effort
La CPUE pour la Sierra Leone couvre seulement la période 2002-2007.
Au Ghana, au Togo et au Bénin, le stock présente les mêmes caractéristiques. Il est pêché dans ces
pays par la senne de plage et la senne tournante. La pêcherie du Ghana reflète celle de tout le stock
ouest (Ghana, Togo et Bénin) et les CPUE considérées (celles du Ghana) ont une tendance générale
fluctuante, avec trois pics observés en 1996, 2000 et 2003 (Figure 4.3.1).
4.3.2 Campagnes acoustiques
N/R DR. FRIDTJOF NANSEN
La biomasse de l’anchois a été estimée pour le stock ouest (Ghana, Togo et Bénin) lors des
campagnes acoustiques du N/R DR. FRIDTJOF NANSEN de 1999 à 2006 (Figure 4.3.2). Les plus
fortes estimations ont été obtenues en 2000 et 2004. En 2000, la campagne s’était déroulée en
septembre pendant l’upwelling et cette forte estimation de biomasse s’explique par le fait que
l’anchois est une espèce typique des eaux d’upwelling. En 2004, la campagne avait lieu en mai-juin.
La concentration la plus dense d’anchois a été relevée à Cap Three Points au Ghana où la température
était de 25 °C. L’augmentation de la biomasse en 2004 pourrait être attribuée à cette
basse température.
Campagnes nationales
Aucune campagne pélagique nationale n’a été réalisée dans la région sud du COPACE.
4.4 Échantillonnage des pêcheries commerciales
Dans la région, les pays ont mis en place le système ARTFISH de collecte et de traitement de données
de capture et d’effort basé sur un échantillonnage aléatoire des débarquements par engin.
4.5 Données biologiques
Faute de moyens et de capacité, aucun pays de la région ne fait d’échantillonnage des données
biologiques au niveau des pêcheries commerciales.
Les fréquences de taille ne sont disponibles que pour le stock ouest (Ghana, Togo et Bénin) pour la
série des campagnes du N/R DR. FRIDTJOF NANSEN de 1999 à 2006. Le Nigéria dispose
cependant de données sur la fréquence de taille pour l’année 2006.
La gamme des tailles moyennes des individus présents dans le stock ouest varie entre 5 et 9 cm. La
longueur maximale obtenue dans les prises a été de 12 cm au Ghana en 2000.
4.6 Évaluation
Méthode
Le modèle de production dynamique de Schaefer a été utilisé sur une feuille de calcul Excel (modèle
décrit à l’Annexe II).

73
Données
Les séries chronologiques de débarquement d’Engraulis encrasicolus pour le stock ouest
(Côte d´Ivoire, Ghana, Togo et Bénin) de 1990 à 2008 ont été utilisées pour le modèle de production.
Pour tester la qualité des données en vue de l’évaluation, le Sous-Groupe a procédé à une analyse
préliminaire des données disponible. L’indice d’abondance du Ghana a été utilisé d’une part et celui
du Togo a été choisi pour ajuster le modèle.
Résultats
Le modèle n’a pas donné des résultats fiable avec l’indice d’abondance du Ghana.
Pour Engraulis encrasicolus, le modèle présente une variabilité de l’abondance durant ces années
(Figure 4.6.1) et le Groupe de travaille a accepté les CPUE du Togo parce que l´ajustement des
données était acceptable.
Les résultats du modèle montrent que la biomasse courante représente 77 pour cent de la biomasse
correspondante à B0.1 et la mortalité par pêche observée en 2008 est 89 pour cent de la mortalité par
pêche F0.1. À l’issue de cette évaluation, il apparaît que le stock est pleinement exploité.
Tableau 4.6.1: Résumé de l’état du stock d’Engraulis encrasicolus
Stock Bcur/B0.1 Fcur/FMSY Fcur/F0.1 Fcur/FSYcur
Engraulis encrasicolus (Ouest/CPUE Togo) 77% 80% 89% 69%
Bcur/B0.1: Rapport entre la biomasse estimée pour la dernière année et la biomasse correspondante à F0.1.
Fcur/FMSY: Rapport entre le coefficient de mortalité par pêche effectivement observé la dernière année de la série et le
coefficient qui donnerait une capture durable maximale à long terme.
Fcur/F0.1: Rapport entre le coefficient de mortalité par pêche effectivement observé la dernière année de la série et F0.1.
Fcur/FSYcur: Rapport entre le coefficient de mortalité par pêche effectivement observé la dernière année de la série et le
coefficient qui donnerait une capture durable au niveau de biomasse actuelle.
Discussion
Les résultats du modèle doivent être lus avec précaution pour le stock ouest. Ils montrent que le stock
est pleinement exploité à l’état actuel. Mais, dans la réalité, une forte pression de pêche est exercée
sur cette ressource. Aussi, on note des fluctuations du stock ouest dues probablement aux facteurs
environnementaux. Cette espèce, comme cela a été signalé précédemment, est essentiellement pêchée
à la senne de plage et à la senne tournante dont l’effort de pêche augmente sans cesse. Par ailleurs, ces
engins ne sont pas sélectifs.
Il faut noter que les campagnes du N/R DR. FRIDTJOF NANSEN présentent une diminution de la
biomasse du stock ouest après 2004.
Les captures de la pêche artisanale de Côte d’Ivoire ne sont pas disponibles. Par conséquent, cette
absence de données pourrait influencer les résultats de l’évaluation.
4.7 Recommandations d’aménagement
Comme mesure de précaution pour le stock ouest (Ghana, Togo et Bénin), les captures ne devraient
pas dépasser la moyenne des trois dernières années (40 000 tonnes).
4.8 Recherche future
Assurer la collecte des données des captures et de l’effort de pêche des engins qui
interviennent dans la pêche aux anchois pour faire une meilleure évaluation du stock.
La Côte d’Ivoire devra fournir des données.

74
Poursuivre les campagnes acoustiques du N/R DR. FRIDTJOF NANSEN et faire des
estimations de biomasse de l’anchois.
Réaliser des campagnes nationales et prendre en compte les fonds inférieurs à 15 m avec des
méthodes appropriées.
5. CHINCHARD ET AUTRES CARANGIDÉS
Les principales espèces considérées pour l’évaluation des stocks des carangidae sont les Caranx spp.,
les Decapterus spp. et les Trachurus trecae. Pour les autres espèces ou groupes d’espèces de
carangidés, on se limitera à présenter les données de capture et d’effort de pêche.
5.1 Identité du stock
Dans l’attente d’informations plus précises pour l’identification des stocks des espèces de carangidés
dans la région sud du COPACE, le Groupe de travail a décidé de considérer cinq stocks: stock nord
(Guinée-Bissau, Guinée, Sierra Leone et Liberia), stock ouest (Côte d’Ivoire, Ghana, Togo et Bénin),
stock centre (Nigéria, Cameroun,), le stock de Sao Tomé et stock sud (Gabon, RD Congo, Congo
et Angola).
5.2 Les pêcheries
Les données de capture et d’effort de pêche ont été présentées pour les cinq stocks avec les captures
totales observées entre 1990 et 2008 (Tableaux 5.2.1a,b,c et Figures 5.2.1.a,b,c).
Captures totales
On constate que, pour Decapterus spp., les captures sont essentiellement réalisées par la pêcherie
industrielle dans le stock nord (Guinée et Sierra Leone) avec une moyenne annuelle d’environ
4 000 tonnes. La majorité des prises dans la région sud du COPACE (principalement Decapterus
rhonchus) sont effectuées en Guinée. On note globalement une baisse importante des captures de
5 700 tonnes environ en 1996 à 2 000 tonnes environ en 2004 puis une reprise en 2005 et 2006.
Pour le groupe d’espèces Trachurus spp., les Trachurus trecae sont pêchées en majorité dans les
stocks des régions nord, ouest et centrale et les Trachurus spp. sont prises dans le stock sud
(notamment la zone angolaise) et on observe globalement une diminution préoccupante des captures
au niveau de l’ensemble de la région sud du COPACE. On est passé de plus 65 000 tonnes en 1990 à
moins de 7 000 tonnes en 2004. Il faut cependant signaler qu’une tendance à la hausse des captures
est observée depuis 2003 dans le stock ouest.
Les autres espèces de carangidés généralement exploitées dans la région sont Selene dorsalis,
Chloroscombrus chrysurus et les espèces de Caranx spp. Les captures totales de ces espèces
connaissent une tendance à la hausse. On est passé de 1 300 tonnes en 1993 à 15 000 tonnes en 2008.
Effort de pêche
En Guinée et en Sierra Leone, ces espèces sont surtout pêchées par les filets maillants encerclant et
dérivants de la pêche artisanale. Au Ghana, au Togo, au Bénin, au Nigéria et au Cameroun, les petits
carangidés sont principalement exploités par la senne de plage et la senne tournante.
L’essentiel de l’effort de pêche des flottilles industrielles a été exercé dans la ZEE guinéenne. Les
gros chalutiers pélagiques qui ciblent les chinchards viennent des pays de l’Est (Fédération de Russie
et Ukraine). L’effort de pêche nominal (nombre de jours de pêche) de cette flottille a globalement
diminué pour passer de plus de 600 jours de pêche en 1996 à environ 400 jours en 2004 puis a repris
en passant à 900 jours en 2005 avant de redescendre à 600 jours en 2007 (Tableau 5.2.2).
75
5.3 Indices d’abondance
5.3.1 Capture par unité d’effort
Les CPUE, en tonnes par jour de pêche ou par sortie positive, ont été calculées pour les espèces ou
groupes d’espèces dans chaque stock où les données sont disponibles. Pour les espèces Decapterus
rhonchus et Trachurus trecae, la série des CPUE est basée sur l’effort nominal de la flottille
industrielle pélagique en Guinée (stock nord) et celui du Libéria en pêche artisanale.
En Angola, on retrouve les deux espèces (Trachurus trecae et T. capensis); ainsi dans le traitement,
pour l’Angola on a pris avec les autres pays Trachurus spp. à la place de T. trecae.
5.3.2 Campagnes acoustiques
N/R DR. FRIDTJOF NANSEN
Les campagnes acoustiques du N/R DR. FRIDTJOF NANSEN fournissent des estimations
d’abondance pour les chinchards dans le stock sud (figure 5.3.2). La série des campagnes sur l’espèce
Trachurus capensis est très courte et les résultats ne peuvent pas être utilisés pour l’étude des
tendances à long terme. Par conséquent, le Groupe de travail a décidé de travailler seulement sur
l’espèce Trachurus trecae dans ce stock.
L’indice d’abondance acoustique de Trachurus trecae a globalement baissé entre 1996 et 2006 avec
des niveaux très faibles en 2001, année où l’on a observé la valeur la plus basse sur toute la période.
5.4 Échantillonnage des pêcheries commerciales
Dans la région sud du COPACE, l’échantillonnage des débarquements se fait au niveau des cinq
stocks car tous les pays sont concernés par cette pêcherie.
Guinée-Bissau, Guinée et Sierra Leone
Pour la flottille de la pêche industrielle pélagique qui exploite les chinchards, l’échantillonnage des
captures commerciales est réalisé toute l’année. Le nombre total et les caractéristiques techniques des
navires actifs par année dans la ZEE guinéenne et sierra léonaise sont collectés sur la base des
licences de pêche délivrées par l’administration. Un suivi continu des activités en mer est réalisé par
des observateurs embarqués qui collectent les données sur l’effort (jours de pêche) et sur les captures
(conservées et rejets).
Côte d’Ivoire
Les données de la pêcherie artisanale n’ont pas été collectées ces dernières années. La pêcherie
industrielle est suivie au port de pêche d’Abidjan, tous les jours. Les données d’entrée et sortie des
navires et les bordereaux de vente des poissons sont récupérés toutes les deux semaines par l’équipe
de recherche du Centre de recherche océanologiques pour l’estimation de l’effort et la capture
par espèce.
Ghana, Togo, Bénin, Nigéria, Cameroun et Congo
L’échantillonnage pour la collecte des données de capture et d’effort est effectué toute l’année avec le
programme ARTFISH pour tous les petits pélagiques, y compris les chinchards et les autres
carangidés. Certains pays ont eu des problèmes informatiques avec ARTFISH et ils utilisent Excel
pour le traitement de leurs données.
Angola
76
Les captures commerciales des espèces pélagiques sont collectées tout au long de l’année auprès de la
flottille industrielle à partir des livres de bord.
5.5 Données biologiques
Les fréquences de taille à partir de 2004 ne sont pas disponibles au Groupe de travail.
5.6 Évaluation
Méthode
Le modèle de production dynamique de Schaefer a été utilisé sur une feuille de calcul Excel (modèle
décrit à l’Annexe II).
Données
Le modèle a besoin d´ une série chronologique des captures totales ainsi que des indices d’abondance
du stock.
Les estimations des captures totales obtenues en additionnant les prises des différentes flottilles des
pays ont été utilisées.
Le modèle global a été appliqué sur les données de Decapterus spp. du stock nord (Guinée-Bissau,
Guinée, Sierra Leone et Libéria) en utilisant les CPUE des chalutiers industriels pélagiques de Guinée
(période 1995-2007).
Dans le cas de Trachurus trecae, le stock nord (Guinée-Bissau et Libéria) et le stock sud (Congo,
Gabon et Angola) ont été considérés. Au nord, le modèle a été appliqué à la CPUE des chalutiers
industriels de la Guinée (période 1995-2007) et à la CPUE de la pêcherie artisanale du Libéria
(période 1997-2008). Au sud, le modèle a été appliqué aux données du stock en utilisant les indices
de biomasse des campagnes acoustiques du N/R DR. FRIDTJOF NANSEN comme indice
d’abondance.
Pour Caranx spp. le modèle a été appliqué au stock de Sao Tomé en utilisant la CPUE de la pêche
artisanale.
Résultats
Les modèles globaux appliqués aux données sur les espèces Decapterus spp. du stock nord, T. trecae
dans les zones nord et sud ont été refusés parce que les indices utilisés ne sont pas représentatifs du
changement de la biomasse de ces différentes zones. Aucun diagnostic ne peut donc être établit sur la
base de ces modèles.
Discussion
Il n’a pas été possible, sur la base des modèles, de tirer des conclusions sur l’état des stocks des
différentes espèces étudiées. Dans le cas des stocks du nord, les espèces sont le plus exploitées par la
Guinée-Bissau et la Guinée. En Guinée-Bissau, la collecte des données est irrégulière alors qu’en
Guinée un coefficient de proportionnalité estimé sur les données d’une campagne a été appliqué aux
débarquements en vue de l’estimation des captures de chacune des espèces. Des investigations
supplémentaires s’avèrent par conséquent indispensables. Par ailleurs, la forte baisse des tendances
des captures des deux espèces (Decapterus spp. et Trachurus trecae), au moins au cours des trois
dernières années, suggèrent une approche de précaution dans l’exploitation des stocks.
Dans le cas des stocks du sud, l’espèce des carangidés la plus capturée est T. trecae en Angola
cependant, les débarquements de cette espèce ne sont pas complètement enregistrés. Toutefois, la
série de biomasse et de taille moyenne de l’Angola qui débutent en 1985 montrent une baisse. La
MSY estimée avec la formule de Cadima est inférieure à la capture de la dernière année et, en plus,
77
90 pour cent de la biomasse de 2009 est constituée d’individus immatures (taille < 21 cm, pers.
comm. 2009). Toutes ces observations indiquent ici aussi une approche de précaution.
5.7 Recommandations d’aménagement
À cause des limites des modèles obtenus et des incertitudes dans les données, en attendant plus
d’investigations sur les données de pêche et de campagne, le Groupe de travail préconise d’adopter les
mesures de précaution suivantes:
La capture du groupe d’espèces Decapterus spp. dans les pays du nord ne doit pas dépasser le niveau
de 3 000 tonnes (valeur dernière année).
La capture de l’espèce T. trecae ne doit pas dépasser le niveau de 10 000 tonnes (valeur dernière
année) dans les pays du nord et dans les pays du sud réduire l’effort ciblant cette espèce.
5.8 Recherche future
Afin de réduire les incertitudes sur l’évaluation, le Groupe de travail recommande de mener les
recherches suivantes:
Soutenir les programmes d’échantillonnage afin qu’ils couvrent les captures totales de toutes
les principales espèces de carangidés, y compris les espèces de chinchards, au niveau de
toutes les flottilles dans tous les pays de la région sud du COPACE.
Continuer la collecte des données biologiques pour les études biologiques (croissance,
reproduction, alimentation) sur les principales espèces de carangidés et mettre celles-ci à la
disposition du Groupe de travail pour la prochaine réunion.
Commencer un échantillonnage des captures et des rejets à bord de tous les bateaux qui
pêchent les chinchards en raison des problèmes posés par l’éventuelle sous-déclaration des
captures, notamment des juvéniles.
6. CONCLUSIONS GÉNÉRALES
Comme lors du Groupe de travail précédent, l’accent a été mis sur l’amélioration des bases de
données et, par conséquent, moins de temps a pu être consacré à l’évaluation. Néanmoins, un certain
nombre d’évaluations ont été réalisées pour certaines des principales espèces de petits pélagiques et
certains stocks en utilisant un modèle dynamique de production. Pour un stock, un essai a été réalisé
avec une méthode basée sur la longueur. Pour certaines espèces et certains stocks, le modèle n’a pas
produit de résultats fiables en raison de données de base insuffisantes et contradictoires. Les résultats
du modèle dynamique de production dépendent fortement de la qualité des données (qui dépendent ou
non des pêcheries) à disposition du Groupe de travail. L’interprétation des résultats des évaluations
devrait tenir compte des limitations liées aux données.
L’information qui dépend des pêcheries est basée sur les statistiques de capture, les données d’effort
et l’échantillonnage biologique réalisés dans les différentes pêcheries comme les mesures de
longueur, etc. À partir de ces données, il est possible d’obtenir une information pertinente pour
l’évaluation des stocks de poissons quant à la capture totale, aux groupes de taille et aux quantités de
ces derniers, à la capture par unité d’effort, etc. Même si quelques carences ont été relevées, le Groupe
de travail apprécie l’effort fourni pour obtenir toutes ces données de première importance pour
l’évaluation et l’aménagement des stocks de poissons. Les principaux manques sont liés, entre autres,
aux données incomplètes (e.g. en raison d’échantillonnage incomplet ou de discontinuités dans
l’archivage des données) ou, dans le cas de certains pays, d’absence de données de capture et d’effort
pour certaines espèces et certains stocks importants de la région. Des incohérences entre différentes
séries de données ont été relevées et on note la faible intensité et la mauvaise couverture géographique
de l’échantillonnage des débarquements pour de nombreux pays, en particulier lorsqu’il s’agit de la

78
pêche artisanale. Une attention particulière doit être désormais accordée aux questions mentionnées
ci-dessus avant la prochaine réunion et des efforts particuliers devront être réalisés pour vérifier et
mettre à jour les séries de capture et d’effort existantes de façon à fournir des données fiables de
captures totales et d’effort pour l’évaluation du stock lors de la prochaine réunion. Un effort devrait
également être fait pour assurer que les données de capture et d’effort soient relevées pour tous les
segments de flottille. Une analyse plus approfondie des séries de CPUE est également encouragée afin
de faciliter l’application du modèle.
D’une manière générale, l’échantillonnage biologique des captures est quasiment inexistant. Pour
certaines espèces et certains stocks, il existe des informations sur la longueur des captures, mais pour
un nombre d’années limité. Des données de longueur, ainsi que d’autres données biologiques ont pu
être obtenues lors des campagnes de recherche. Ces données ont été utilisées pour évaluer l’état du
stock de Sardinella spp., sous l’hypothèse que les fréquences de longueur obtenues lors des
campagnes de recherche sont similaires à celles des captures de la pêche pour le Gabon, la RD Congo
et l’Angola. Avant les prochaines réunions, toutes les données de longueur devraient être analysées
plus en détail, afin de voir s’il serait possible d’appliquer des modèles basés sur la longueur à
ces stocks.
En plus des données qui proviennent des pêcheries, le Groupe de travail a accès aux données qui ne
dépendent pas de celles-ci. Elles proviennent notamment de différentes estimations d’abondance
réalisées au cours des campagnes avec le N/R DR. FRIDTJOF NANSEN. Le navire de recherche
sénégalais N/R ITAF DEME a également mené des campagnes acoustiques au Sierra Leone durant
les deux dernières années. Les rapports de ces campagnes ont été fournis au Groupe de travail. Les
informations fournies par les campagnes sont d’une grande valeur et, dans de nombreux cas, il s’agit
de l’information la plus importante sur le statut et le développement des stocks de poissons
pélagiques.
Les recommandations relatives aux stocks sont formulées à partir des points de référence. Dans un
souci de comparaison et de cohérence, les points de référence choisis étaient les mêmes que ceux
utilisés par le Groupe de travail de la FAO sur l’évaluation des petits pélagiques au large de l’Afrique
nord-occidentale. Les recommandations fournissent des indications à suivre pour gérer les différents
stocks d’espèces pélagiques et développer ces derniers de façon à les exploiter au mieux. Ces
recommandations sont fournies en termes de niveaux de capture. Il a été noté que, pour les stocks
partagés, tels que le sont de nombreux stocks pélagiques, il est nécessaire de mettre en place des
accords formels sur le partage et sur la gestion.
Enfin, le Groupe de Travail a noté que pour quelques espèces/stocks de la Région COPACE Sud, les
lacunes observées dans les données de capture et effort de certains pays sont liées au fait que ces
espèces sont peu importantes pour les pays en question. Par conséquent, le Groupe de Travail devrait
reconsidérer attentivement les espèces/stocks adoptés lors de la première réunion en 2006 (FAO,
2009) afin d’affiner les évaluations qui seront faites dans le futur. Un résumé des évaluations et des
recommandations d’aménagement par le Groupe de travail est présenté dans le Tableau 6.1.

79
Tableau 6.1: Résumé des évaluations et recommandations d’aménagement
Stock
Prises7 de la
dernière
année
(tonnes)
(moyenne
sur 5 ans)
Bcur/B0.1
(%)
Fcur/F0.1
(%)
Évaluation
Recommandations
d’aménagement
Sardinelles
S. aurita
Ouest
(Côte d’Ivoire,
Ghana, Togo
et Bénin)
36 585
(71 322)
58
65
Le stock est surexploité.
À titre de précaution,
il ne faut pas augmenter les
captures de cette espèce (ne
pas dépasser 40 000 tonnes).
Centre8
(Nigéria et
Cameroun)
3 745
(3 451)
-
-
Pas d’évaluation par
manque de séries de
CPUE. La tendance
dans les captures montre
une situation stable
au Nigéria.
À titre de précaution
il ne faut pas dépasser
la moyenne des productions
des 5 dernières années
(3 500 tonnes).
S. maderensis
Ouest
(Ghana, Togo
et Bénin)
18 085
(21 295)
90
124
Le stock est considéré
pleinement exploité.
Il faut remarquer que
l’espèce est capturée
avec S. aurita qui est
surexploitée.
À titre de précaution,
le niveau des captures
ne doit pas dépasser la
moyenne des 5 dernières
années (20 000 tonnes).
Centre
(Nigéria et
Cameroun)
32 842
(29 735)
-
-
Pas d’évaluation par
manque de séries de
CPUE. La tendance dans
les captures montre une
augmentation.
À titre de précaution,
le niveau de capture ne
devrait pas dépasser la
moyenne des 5 dernières
années (30 000 tonnes).
Sardinella spp.
Nord
(Guinée-
Bissau,
Guinée, Sierra
Leone et
Libéria)
191079
(26546)
124
56
Les stocks sont
considérés pleinement
exploités en tenant
compte d’autres
indications de
la pêcherie.
À titre de précaution, le
niveau de capture ne devrait
pas dépasser la capture de
2007 (20 000 tonnes).
Sud (Gabon,
Congo, Congo
DR et Angola)
81879
(31289)
149
61
Le stock est considéré
modérément exploité.
Les résultats pour cette
espèce devraient être
analysés avec précaution
tant que toute l’information
ne sera pas disponible. Les
résultats indiquent que le
niveau des captures totales
pourrait être temporairement
augmenté, mais qu’il devrait
être ajusté aux variations
naturelles du stock. A titre
de précaution, les captures
ne devraient pas excéder
150 000 tonnes.
7 2008.
8 Information relative au Nigéria. Le Cameroun n’a pas produit de données de capture.
9 2007.

80
Stock
Prises7 de la
dernière
année
(tonnes)
(moyenne
sur 5 ans)
Bcur/B0.1
(%)
Fcur/F0.1
(%)
Évaluation
Recommandations
d’aménagement
Ethmalose (E. fimbriata)
Nord
(Guinée et
Sierra Leone)
80 678
(79 140)
107
96
Le stock est surexploité.
À titre de précaution, il ne
faut pas augmenter les
captures de cette espèce au-
delà de la moyenne des
5 dernières années (79 000).
Centre
(Nigéria et
Cameroun)
57 032
(57 977)
- -
Pas d’évaluation mais les
captures sont stables les
dernières années.
À titre de précaution il ne
faut pas dépasser la
moyenne des productions
des 5 dernières années
(58 000 tonnes).
Ouest
(Ghana, Togo
et Bénin)10
1 819
(684)
-
-
Pas de résultats de
modèle. Les captures
fluctuent annuellement.
Pas de recommandations.
Sud
(Gabon,
Congo, Congo
DR et Angola)
9 705
(11 000)
104
71
Le stock est pleinement
exploité.
À titre de précaution, le
niveau de capture ne devrait
pas dépasser la moyenne des
cinq dernières années
(11 000 tonnes).
Anchois (E. encrasicolus)
Ouest
(Côte d’Ivoire,
Ghana, Togo
et Bénin)
48 415
(43 582)
77
89
Le stock est pleinement
exploité. L’estimation de
la biomasse à partir de la
campagne acoustique
montre une diminution
en 2005 et 2006.
À titre de précaution, le
niveau de capture ne devrait
pas dépasser le niveau de la
moyenne des 3 dernières
années (40 000 tonnes).
Sud (Congo)
399
(530)
Pas d’évaluation. La
capture reste stable
les 2 dernières années.
L’estimation acoustique
est de 2 000 tonnes en
2005.
À titre de précaution il ne
faut pas excéder
la moyenne des captures
des 5 dernières années
(530 tonnes).
Chinchard et autres carangidés
Trachurus trecae
Nord (Gabon,
Guinée, Sierra
Leone et
Libéria
10 527
(18 163)
-
-
Pas de résultat réaliste à
partir du modèle. Les
captures de 2007 sont
faibles.
À titre de précaution il ne
faut pas excéder la valeur de
la capture de 2007
(10 000 tonnes).
Sud
(Gabon,
Congo, Congo
DR et Angola)
44 518
(16 844)
-
-
Pas de résultat réaliste à
partir du modèle.
Les efforts sur cette espèce
doivent être réduites.
10
Les données de la Côte d’Ivoire ne sont pas disponibles.
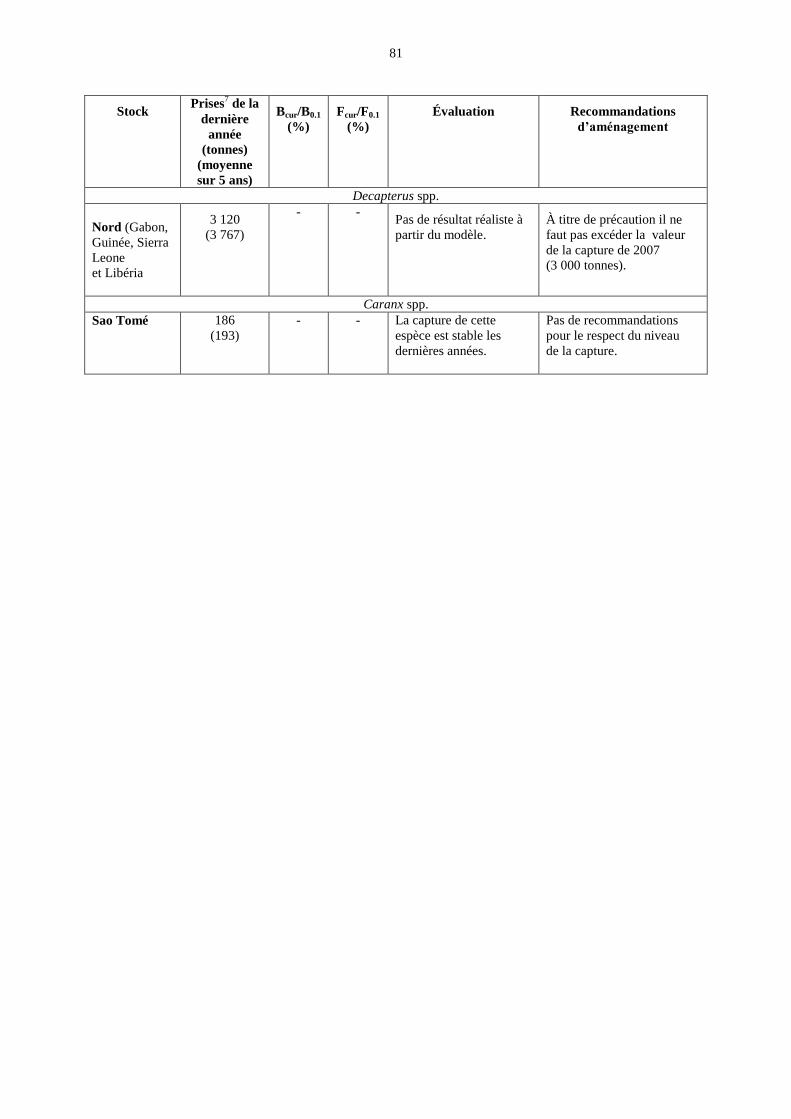
81
Stock
Prises7 de la
dernière
année
(tonnes)
(moyenne
sur 5 ans)
Bcur/B0.1
(%)
Fcur/F0.1
(%)
Évaluation
Recommandations
d’aménagement
Decapterus spp.
Nord (Gabon,
Guinée, Sierra
Leone
et Libéria
3 120
(3 767)
-
-
Pas de résultat réaliste à
partir du modèle.
À titre de précaution il ne
faut pas excéder la valeur
de la capture de 2007
(3 000 tonnes).
Caranx spp.
Sao Tomé
186
(193)
-
-
La capture de cette
espèce est stable les
dernières années.
Pas de recommandations
pour le respect du niveau
de la capture.
82
REFERENCES/RÉFÉRENCES
Coutin, P.C. & A.I. Paine 1988. The effects of long-term exploitation on West African demersal
fish stocks. A third Interim Report.
FAO. 2001 Report of the fifteenth session of the Fishery Committee for the Eastern Central Atlantic.
Abuja, Nigeria, 1-3 November 2000/Rapport de la quinzième session du Comité des pêches
pour l’Atlantique Centre-Est. Abuja, Nigéria, 1-3 novembre 2000. FAO Fisheries Report /FAO
Rapport sur les pêches. No. 642. Accra, 36p.
FAO. 2006. Report of the FAO Working Group on the assessment of small pelagic fish off northwest
Africa. Nouadhibou, Mauritania, 26 April–5 May 2005. Rapport du Groupe de travail de la FAO
sur l’évaluation des petits pélagiques au large de l’Afrique nord-occidentale. Nouadhibou,
Mauritanie, 25 avril–5 mai 2005. FAO Fisheries Report/FAO Rapport sur les pêches. No. 762.
180p.
FAO. 2009. Report of the FAO Working Group on the Assessment of Small Pelagic Fish off
Northwest Africa. Nouakchott, Mauritania, 21–31 April 2009. Rapport du Groupe de travail de
la FAO sur l’évaluation des petits pélagiques au large de l’Afrique nord-occidentale. Agadir,
Maroc, 21–31 avril 2009. FAO Fisheries Report/FAO Rapport sur les pêches. No. 849. Rome,
FAO. 238p.
Gayanilo, F.C. Jr, Sparre, P. & Pauly, D. 2005. FAO-ICLARM Stock Assessment Tools II (FiSAT II).
Revised version. User's guide. FAO Computerized Information Series (Fisheries). No. 8, Revised
version. Rome, FAO 168 p. (Includes a CD-ROM with the software.)
Haddon, M. 2001. Modelling and quantitative methods in fisheries. Chapman & Hall/CRC Press,
London/Boca Raton, 406 pp.
Jones, R. 1984. Assessing the effect of changes in exploitation patterns using length composition data
(with notes on VPA and cohort analysis). FAO Fish.Tech.Pap., (256):118 p.
Schaefer, M. 1954. Some aspects of the dynamics of populations important to the management of the
commercial marine fisheries. Bull. Inter. Am. Trop. Tuna Comm., 1 (2): 27–56.
Shepherd, J.G. 1999. Extended survivors analysis: An improved method for the analysis of catch-at-
age data. ICES Journal of Marine Science 56, 584–591.
Sparre, P. & Venema, S.C., 1996. Introduction à l'évaluation des stocks de poissons tropicaux. FAO
document technique sur les pêcheries, Première partie manuel N°306/1, FAO, Rome: 400p.

TABLES/TABLEAUX

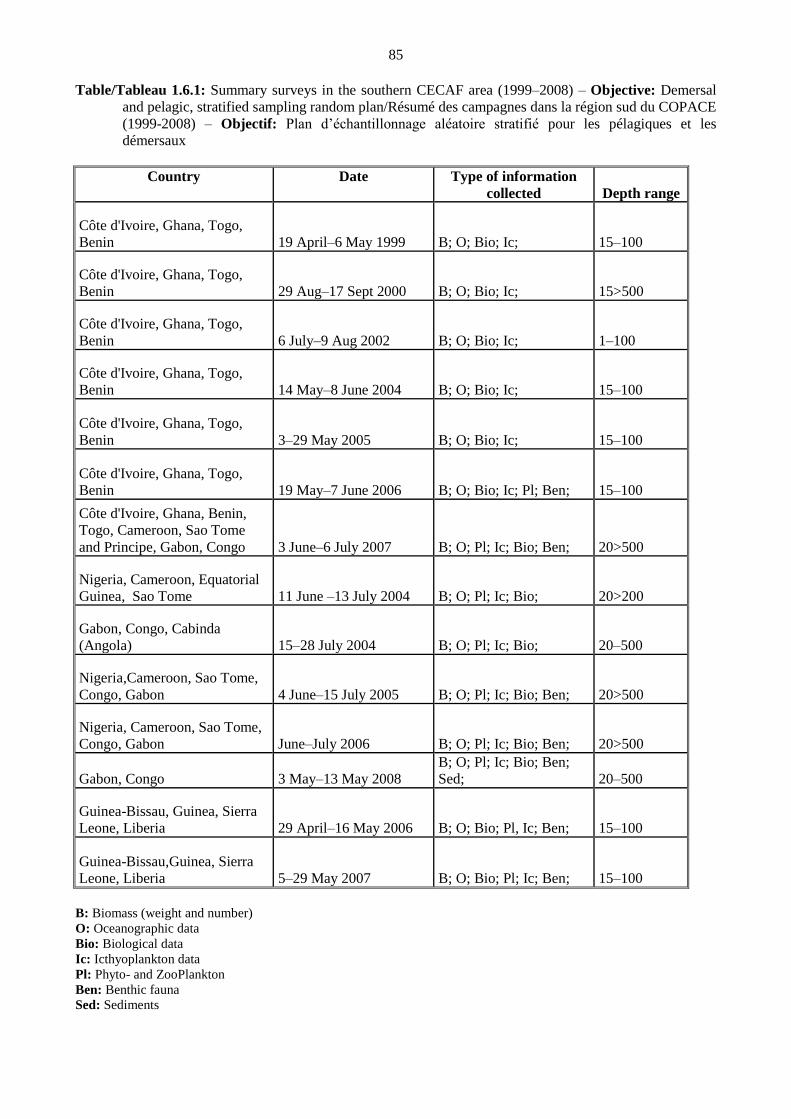
85 Table/Tableau 1.6.1: Summary surveys in the southern CECAF area (1999–2008) – Objective: Demersal
and pelagic, stratified sampling random plan/Résumé des campagnes dans la région sud du COPACE
(1999-2008) – Objectif: Plan d’échantillonnage aléatoire stratifié pour les pélagiques et les
démersaux
Country
Date
Type of information
collected Depth range
Côte d'Ivoire, Ghana, Togo,
Benin 19 April–6 May 1999 B; O; Bio; Ic; 15–100
Côte d'Ivoire, Ghana, Togo,
Benin 29 Aug–17 Sept 2000 B; O; Bio; Ic; 15>500
Côte d'Ivoire, Ghana, Togo,
Benin 6 July–9 Aug 2002 B; O; Bio; Ic; 1–100
Côte d'Ivoire, Ghana, Togo,
Benin 14 May–8 June 2004 B; O; Bio; Ic; 15–100
Côte d'Ivoire, Ghana, Togo,
Benin 3–29 May 2005 B; O; Bio; Ic; 15–100
Côte d'Ivoire, Ghana, Togo,
Benin 19 May–7 June 2006 B; O; Bio; Ic; Pl; Ben; 15–100
Côte d'Ivoire, Ghana, Benin,
Togo, Cameroon, Sao Tome
and Principe, Gabon, Congo 3 June–6 July 2007 B; O; Pl; Ic; Bio; Ben; 20>500
Nigeria, Cameroon, Equatorial
Guinea, Sao Tome 11 June –13 July 2004 B; O; Pl; Ic; Bio; 20>200
Gabon, Congo, Cabinda
(Angola) 15–28 July 2004 B; O; Pl; Ic; Bio; 20–500
Nigeria,Cameroon, Sao Tome,
Congo, Gabon 4 June–15 July 2005 B; O; Pl; Ic; Bio; Ben; 20>500
Nigeria, Cameroon, Sao Tome,
Congo, Gabon June–July 2006 B; O; Pl; Ic; Bio; Ben; 20>500
Gabon, Congo 3 May–13 May 2008
B; O; Pl; Ic; Bio; Ben;
Sed; 20–500
Guinea-Bissau, Guinea, Sierra
Leone, Liberia 29 April–16 May 2006 B; O; Bio; Pl, Ic; Ben; 15–100
Guinea-Bissau,Guinea, Sierra
Leone, Liberia 5–29 May 2007 B; O; Bio; Pl; Ic; Ben; 15–100
B: Biomass (weight and number)
O: Oceanographic data
Bio: Biological data
Ic: Icthyoplankton data
Pl: Phyto- and ZooPlankton
Ben: Benthic fauna
Sed: Sediments

86
Table/Tableau 1.8.1 Subgroups, species, groups of species, stocks and zones analysed by the Working
Group/Sous-groupes, espèces, groupes d’espèces, stocks et zones analysés par le Groupe de travail
Subgroups/species/groups
of species/stocks
Zones1
S. maderensis and S. aurita
Stock North Guinea-Bissau, Guinea , Sierra Leone and Liberia
Stock West Côte d'Ivoire, Ghana, Togo and Benin
Stock Central Nigeria and Cameroon
Stock South Gabon, Congo, Congo DR and Angola
Ethmalosa fimbriata
Stock North Guinea-Bissau, Guinea, Sierra Leone and Liberia
Stock West Côte d d'Ivoire, Ghana, Togo and Benin
Stock Central Nigeria and Cameroon
Stock South Gabon, Congo, Congo DR and Angola
Engraulis encrasicolus
Stock West Côte d'Ivoire, Ghana, Togo and Benin
Stock South Congo (2006)
Carangidae
Trachurus trecae
Stock North Guinea-Bissau, Guinea, Sierra Leone and Liberia
Stock South Gabon, Congo, Congo DR and Angola
Decapterus spp.
Stock North Guinea-Bissau, Guinea, Sierra Leone and Liberia
Caranx spp.
Sao Tome and Principe Sao Tome and Principe
1
Congo scientist was not present in this meeting.

87
Table/Tableau 2.2.1a: Catches (tonnes) of Sardinella aurita by country, fleet and year (1990–2008)/
Captures (tonnes) de Sardinella aurita par pays, flottille et année (1990-2008)
Country Fleet 1990 1991 1992 1993 1994 1995 1996 1997 1998 1999 2000
Guinea Industrial 186 1380 1524 1380 1521 2284
Sierra Leone
Artisanal
Industrial
Côte d'Ivoire Industrial 13640 25041
Northern Stock 186 1380 1524 1380 15161 27324
Ghana
Artisanal 43167 50447 119515 90600 67566 65598 115070 46387 54596 39124 98865
Inshore 2396 2265 6268 2134 2327 2143 3331 3010 1369 1256 3178
Industrial 2377 993 581 613 3386 1750 3067 1998 541 800 2479
Togo Artisanal 561 365 734 342 360 331 739 1300 1045 1986 1912
Benin Artisanal 731 297 644 494
Western Stock 48500 54070 127097 93689 73639 69822 122206 53426 57848 43809 106928
Nigeria Artisanal 76241 97145 97286 95495 2509 2978
Cameroon Artisanal
Central Stock 76241 97145 97286 95495 2509 2978
DR Congo Artisanal 7 7
Congo* Industrial 4054 2432 2908 3242 2035 482 876 196 1215 1730 954
Artisanal 1609 2850 2823 2743 4077 980 1364 1277 3068 2651 804
Angola All fleets 20784 14217 0 1207 0 3433
Southern Stock 5663 5282 5731 5985 6112 22246 16458 1473 5490 4389 5199
Total 54163 59352 132828 99674 79751 168495 237188 153709 160213 65867 142429
* Congo scientist was not present.
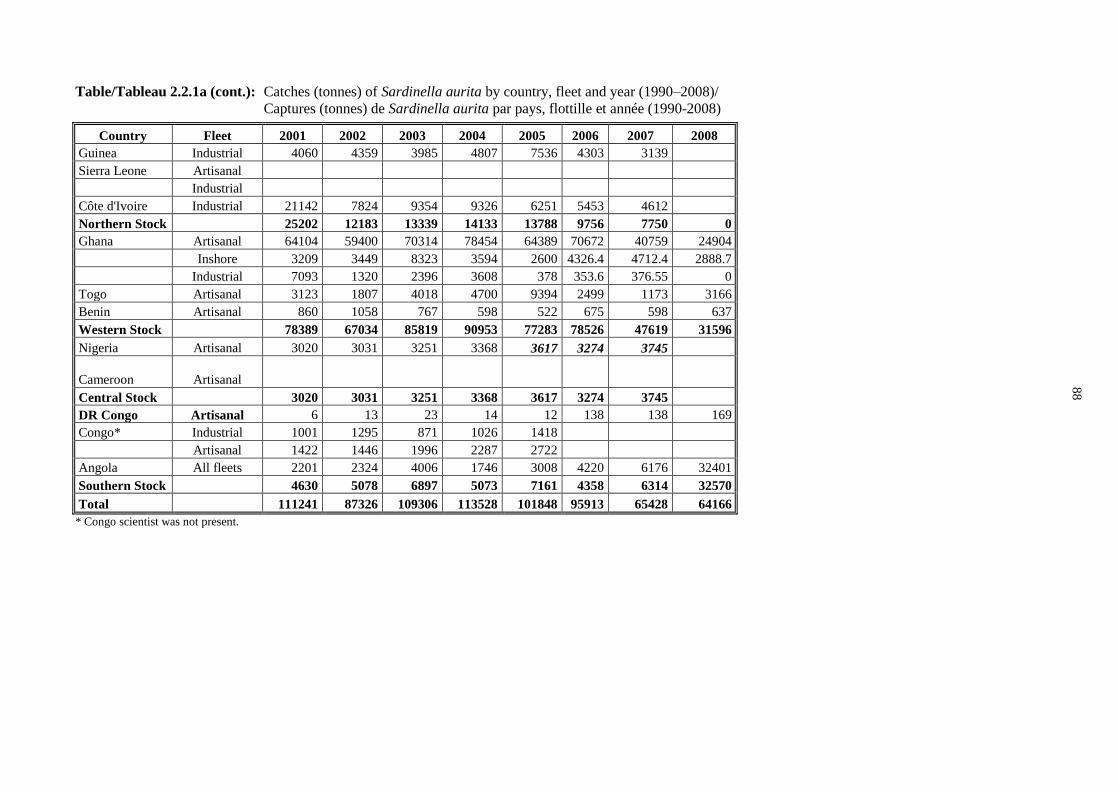
88
Table/Tableau 2.2.1a (cont.): Catches (tonnes) of Sardinella aurita by country, fleet and year (1990–2008)/
Captures (tonnes) de Sardinella aurita par pays, flottille et année (1990-2008)
Country Fleet 2001 2002 2003 2004 2005 2006 2007 2008
Guinea Industrial 4060 4359 3985 4807 7536 4303 3139
Sierra Leone Artisanal
Industrial
Côte d'Ivoire Industrial 21142 7824 9354 9326 6251 5453 4612
Northern Stock 25202 12183 13339 14133 13788 9756 7750 0
Ghana Artisanal 64104 59400 70314 78454 64389 70672 40759 24904
Inshore 3209 3449 8323 3594 2600 4326.4 4712.4 2888.7
Industrial 7093 1320 2396 3608 378 353.6 376.55 0
Togo Artisanal 3123 1807 4018 4700 9394 2499 1173 3166
Benin Artisanal 860 1058 767 598 522 675 598 637
Western Stock 78389 67034 85819 90953 77283 78526 47619 31596
Nigeria Artisanal 3020 3031 3251 3368 3617 3274 3745
Cameroon Artisanal
Central Stock 3020 3031 3251 3368 3617 3274 3745
DR Congo Artisanal 6 13 23 14 12 138 138 169
Congo* Industrial 1001 1295 871 1026 1418
Artisanal 1422 1446 1996 2287 2722
Angola All fleets 2201 2324 4006 1746 3008 4220 6176 32401
Southern Stock 4630 5078 6897 5073 7161 4358 6314 32570
Total 111241 87326 109306 113528 101848 95913 65428 64166
* Congo scientist was not present.

89
Table/Tableau 2.2.1b: Catches (tonnes) of Sardinella maderensis by country, fleet and year (1990–2008)/
Captures (tonnes) de Sardinella maderensis par pays, flottille et année (1990-2008)
Country Fleet 1990 1991 1992 1993 1994 1995 1996 1997 1998 1999 2000
Guinea Artisanal 4274 3893 3154 2790 2967 7228
Sierra Leone
Côte d'Ivoire Industrial 154 658
Northern Stock 4274 3893 3154 2790 3121 7885
Ghana
Artisanal 14549 8207 14240 16797 12310 13092 13501 14070 14770 12056 14935
Inshore 940 242 165 185 156 119 118 113 698 49 35
Industrial 419 175 102 108 597 309 541 353 95 141 438
Togo Artisanal 258 327 160 150 162 86 166 432 408 1622 638
Benin Artisanal 1218 1495 1073 824
Western Stock 16166 8951 14667 17241 13225 17880 18219 19340 20257 18216 25412
Nigeria Artisanal 10256 10840 8095 4481 6365 344 7558 9387 12226 11042 10158
Cameroon Artisanal 6171 7306 7298
Central Stock 10256 10840 8095 4481 12536 7650 14856 9387 12226 11042 10158
Sao Tome Artisanal 10
DR Congo Artisanal 5 10
Congo Industrial 4759 3359 3702 3512 3779 896 1012 289 1421 2389 255
Artisanal 1953 2982 1864 2344 1875 1299 1539 2256 2190 1384 2627
Angola All fleets 38599 42650 0 10861 18347 5150
Southern Stock 6712 6341 5566 5856 5654 40793 45201 2545 14471 22125 8041
Total 33134 26132 28328 27578 31415 70597 82170 34426 49745 54505 51507
Angola is total for pelagic trawlers, demersal trawlers and purse seiners.
Benin has total Sardinella and separated into S. aurita and S. maderensis using the ratio 60:40 (from survey ratio).
Sierra Leone Sardinella aurita in offshore and therefore not accessible to artisanal fleet. No data on industrial fleet
Gabon only Sardinella spp.
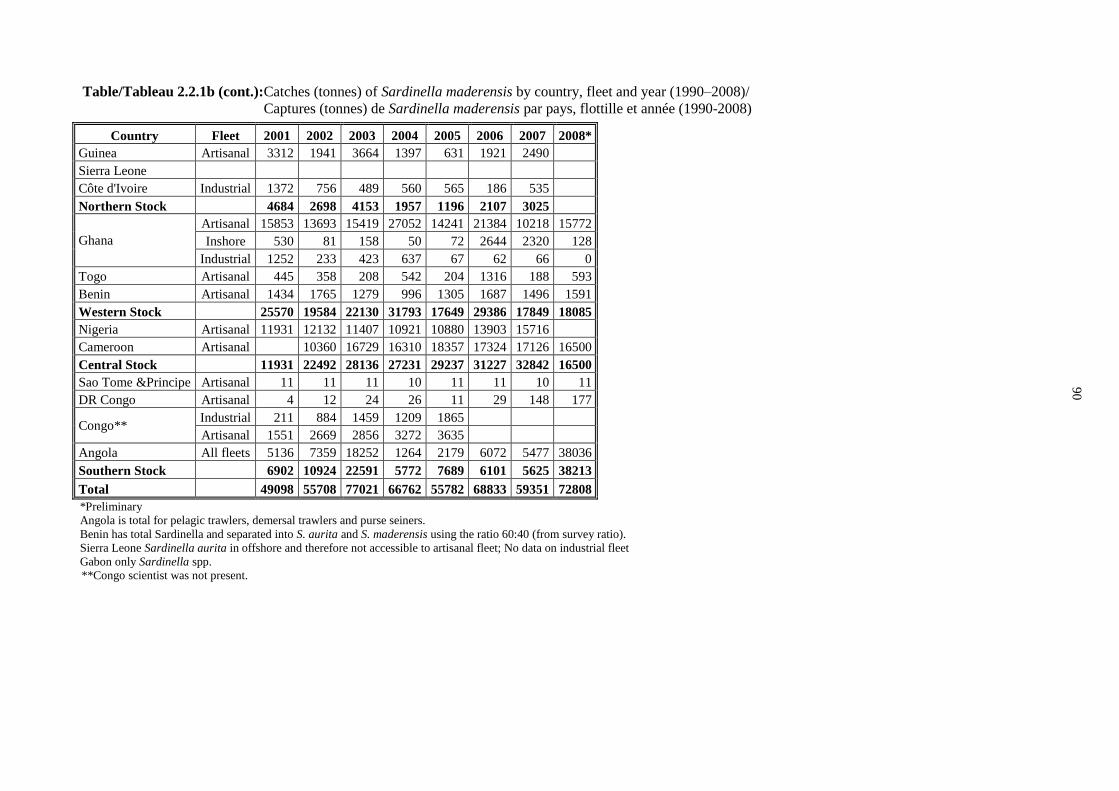
90
Table/Tableau 2.2.1b (cont.): Catches (tonnes) of Sardinella maderensis by country, fleet and year (1990–2008)/
Captures (tonnes) de Sardinella maderensis par pays, flottille et année (1990-2008)
Country Fleet 2001 2002 2003 2004 2005 2006 2007 2008*
Guinea Artisanal 3312 1941 3664 1397 631 1921 2490
Sierra Leone
Côte d'Ivoire Industrial 1372 756 489 560 565 186 535
Northern Stock 4684 2698 4153 1957 1196 2107 3025
Ghana
Artisanal 15853 13693 15419 27052 14241 21384 10218 15772
Inshore 530 81 158 50 72 2644 2320 128
Industrial 1252 233 423 637 67 62 66 0
Togo Artisanal 445 358 208 542 204 1316 188 593
Benin Artisanal 1434 1765 1279 996 1305 1687 1496 1591
Western Stock 25570 19584 22130 31793 17649 29386 17849 18085
Nigeria Artisanal 11931 12132 11407 10921 10880 13903 15716
Cameroon Artisanal 10360 16729 16310 18357 17324 17126 16500
Central Stock 11931 22492 28136 27231 29237 31227 32842 16500
Sao Tome &Principe Artisanal 11 11 11 10 11 11 10 11
DR Congo Artisanal 4 12 24 26 11 29 148 177
Congo** Industrial 211 884 1459 1209 1865
Artisanal 1551 2669 2856 3272 3635
Angola All fleets 5136 7359 18252 1264 2179 6072 5477 38036
Southern Stock 6902 10924 22591 5772 7689 6101 5625 38213
Total 49098 55708 77021 66762 55782 68833 59351 72808
*Preliminary
Angola is total for pelagic trawlers, demersal trawlers and purse seiners.
Benin has total Sardinella and separated into S. aurita and S. maderensis using the ratio 60:40 (from survey ratio).
Sierra Leone Sardinella aurita in offshore and therefore not accessible to artisanal fleet; No data on industrial fleet
Gabon only Sardinella spp.
**Congo scientist was not present.
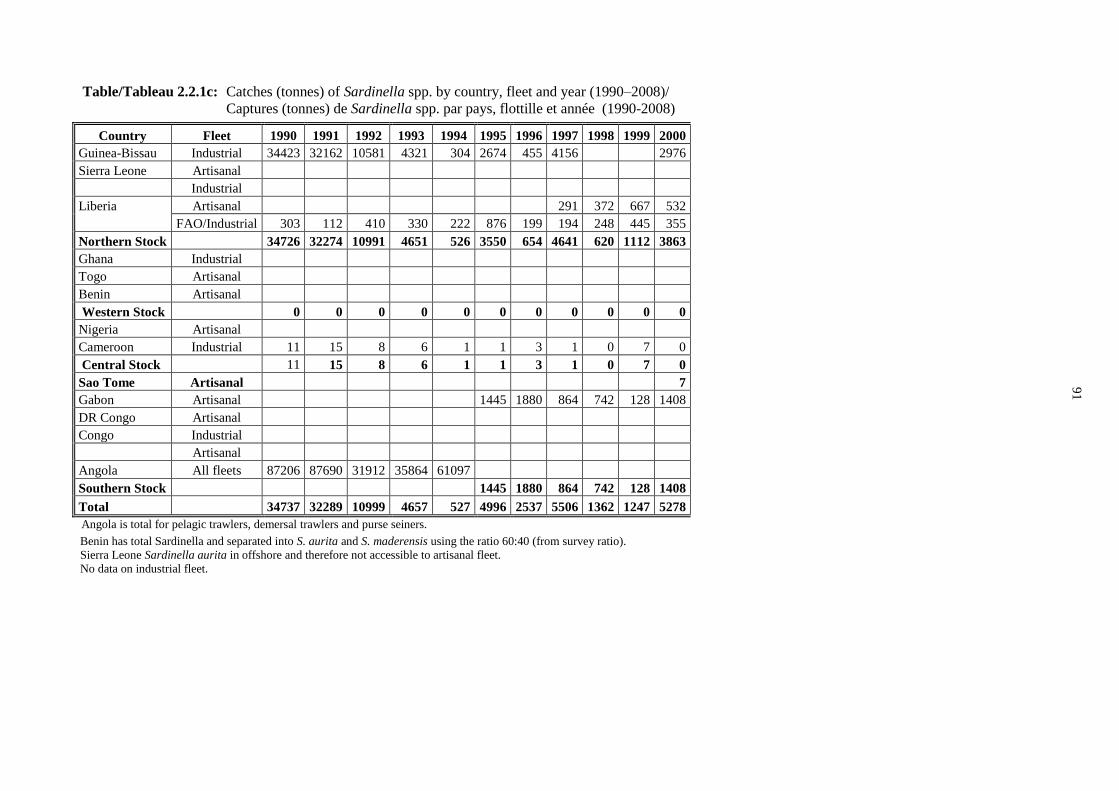
91
Table/Tableau 2.2.1c: Catches (tonnes) of Sardinella spp. by country, fleet and year (1990–2008)/
Captures (tonnes) de Sardinella spp. par pays, flottille et année (1990-2008)
Country Fleet 1990 1991 1992 1993 1994 1995 1996 1997 1998 1999 2000
Guinea-Bissau Industrial 34423 32162 10581 4321 304 2674 455 4156 2976
Sierra Leone Artisanal
Industrial
Liberia Artisanal 291 372 667 532
FAO/Industrial 303 112 410 330 222 876 199 194 248 445 355
Northern Stock 34726 32274 10991 4651 526 3550 654 4641 620 1112 3863
Ghana Industrial
Togo Artisanal
Benin Artisanal
Western Stock 0 0 0 0 0 0 0 0 0 0 0
Nigeria Artisanal
Cameroon Industrial 11 15 8 6 1 1 3 1 0 7 0
Central Stock 11 15 8 6 1 1 3 1 0 7 0
Sao Tome Artisanal 7
Gabon Artisanal 1445 1880 864 742 128 1408
DR Congo Artisanal
Congo Industrial
Artisanal
Angola All fleets 87206 87690 31912 35864 61097
Southern Stock 1445 1880 864 742 128 1408
Total 34737 32289 10999 4657 527 4996 2537 5506 1362 1247 5278
Angola is total for pelagic trawlers, demersal trawlers and purse seiners.
Benin has total Sardinella and separated into S. aurita and S. maderensis using the ratio 60:40 (from survey ratio).
Sierra Leone Sardinella aurita in offshore and therefore not accessible to artisanal fleet.
No data on industrial fleet.
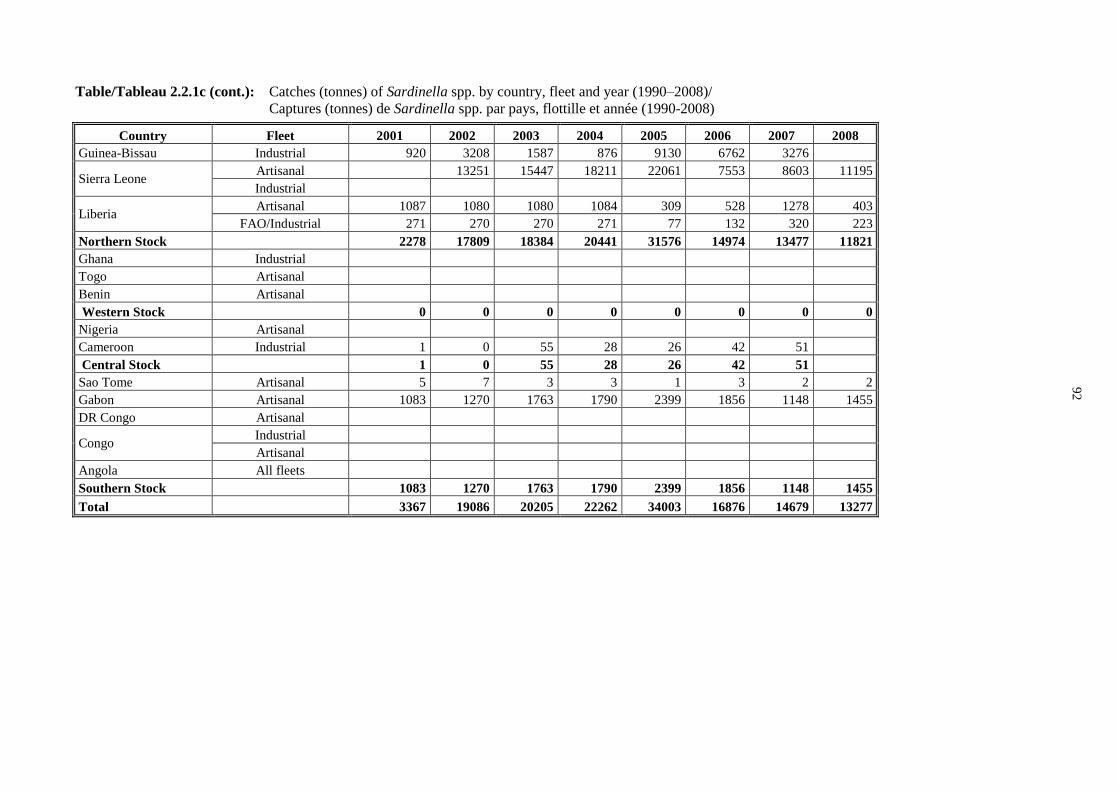
92
Table/Tableau 2.2.1c (cont.): Catches (tonnes) of Sardinella spp. by country, fleet and year (1990–2008)/
Captures (tonnes) de Sardinella spp. par pays, flottille et année (1990-2008)
Country Fleet 2001 2002 2003 2004 2005 2006 2007 2008
Guinea-Bissau Industrial 920 3208 1587 876 9130 6762 3276
Sierra Leone Artisanal 13251 15447 18211 22061 7553 8603 11195
Industrial
Liberia Artisanal 1087 1080 1080 1084 309 528 1278 403
FAO/Industrial 271 270 270 271 77 132 320 223
Northern Stock 2278 17809 18384 20441 31576 14974 13477 11821
Ghana Industrial
Togo Artisanal
Benin Artisanal
Western Stock 0 0 0 0 0 0 0 0
Nigeria Artisanal
Cameroon Industrial 1 0 55 28 26 42 51
Central Stock 1 0 55 28 26 42 51
Sao Tome Artisanal 5 7 3 3 1 3 2 2
Gabon Artisanal 1083 1270 1763 1790 2399 1856 1148 1455
DR Congo Artisanal
Congo Industrial
Artisanal
Angola All fleets
Southern Stock 1083 1270 1763 1790 2399 1856 1148 1455
Total 3367 19086 20205 22262 34003 16876 14679 13277
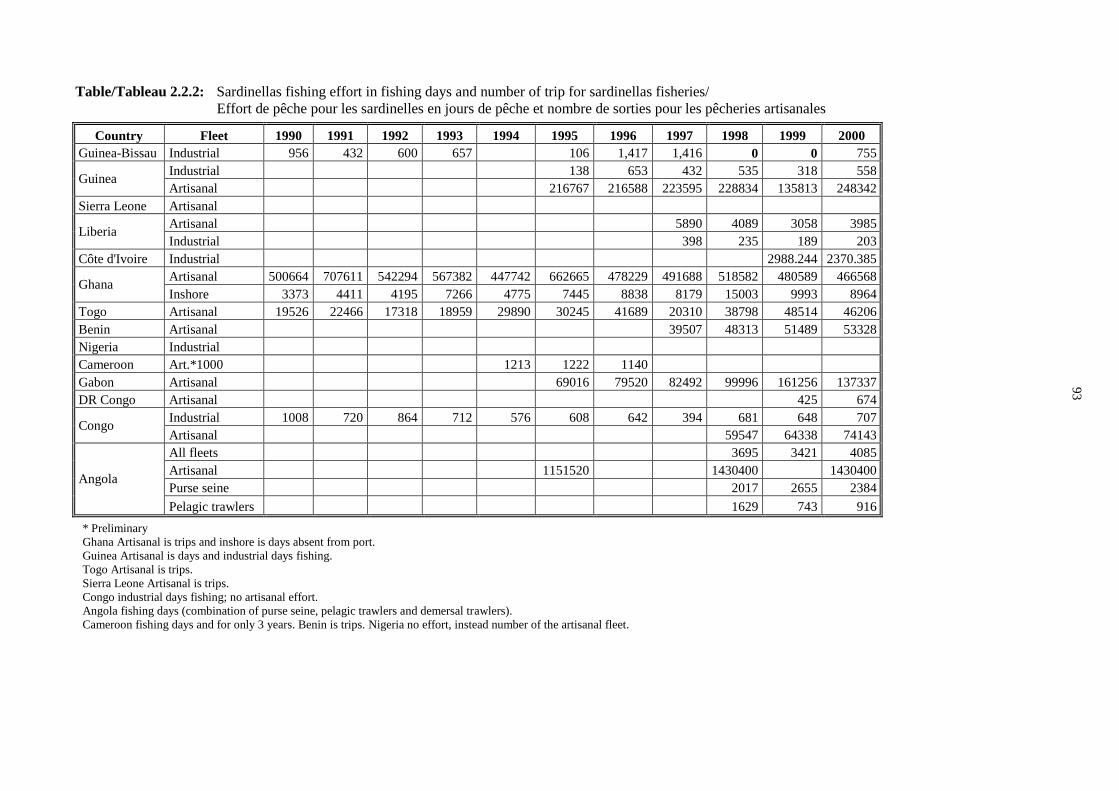
93
Table/Tableau 2.2.2: Sardinellas fishing effort in fishing days and number of trip for sardinellas fisheries/
Effort de pêche pour les sardinelles en jours de pêche et nombre de sorties pour les pêcheries artisanales
Country Fleet 1990 1991 1992 1993 1994 1995 1996 1997 1998 1999 2000
Guinea-Bissau Industrial 956 432 600 657 106 1,417 1,416 0 0 755
Guinea Industrial 138 653 432 535 318 558
Artisanal 216767 216588 223595 228834 135813 248342
Sierra Leone Artisanal
Liberia Artisanal 5890 4089 3058 3985
Industrial 398 235 189 203
Côte d'Ivoire Industrial 2988.244 2370.385
Ghana Artisanal 500664 707611 542294 567382 447742 662665 478229 491688 518582 480589 466568
Inshore 3373 4411 4195 7266 4775 7445 8838 8179 15003 9993 8964
Togo Artisanal 19526 22466 17318 18959 29890 30245 41689 20310 38798 48514 46206
Benin Artisanal 39507 48313 51489 53328
Nigeria Industrial
Cameroon Art.*1000 1213 1222 1140
Gabon Artisanal 69016 79520 82492 99996 161256 137337
DR Congo Artisanal 425 674
Congo Industrial 1008 720 864 712 576 608 642 394 681 648 707
Artisanal 59547 64338 74143
Angola
All fleets 3695 3421 4085
Artisanal 1151520 1430400 1430400
Purse seine 2017 2655 2384
Pelagic trawlers 1629 743 916
* Preliminary
Ghana Artisanal is trips and inshore is days absent from port.
Guinea Artisanal is days and industrial days fishing.
Togo Artisanal is trips.
Sierra Leone Artisanal is trips.
Congo industrial days fishing; no artisanal effort.
Angola fishing days (combination of purse seine, pelagic trawlers and demersal trawlers).
Cameroon fishing days and for only 3 years. Benin is trips. Nigeria no effort, instead number of the artisanal fleet.
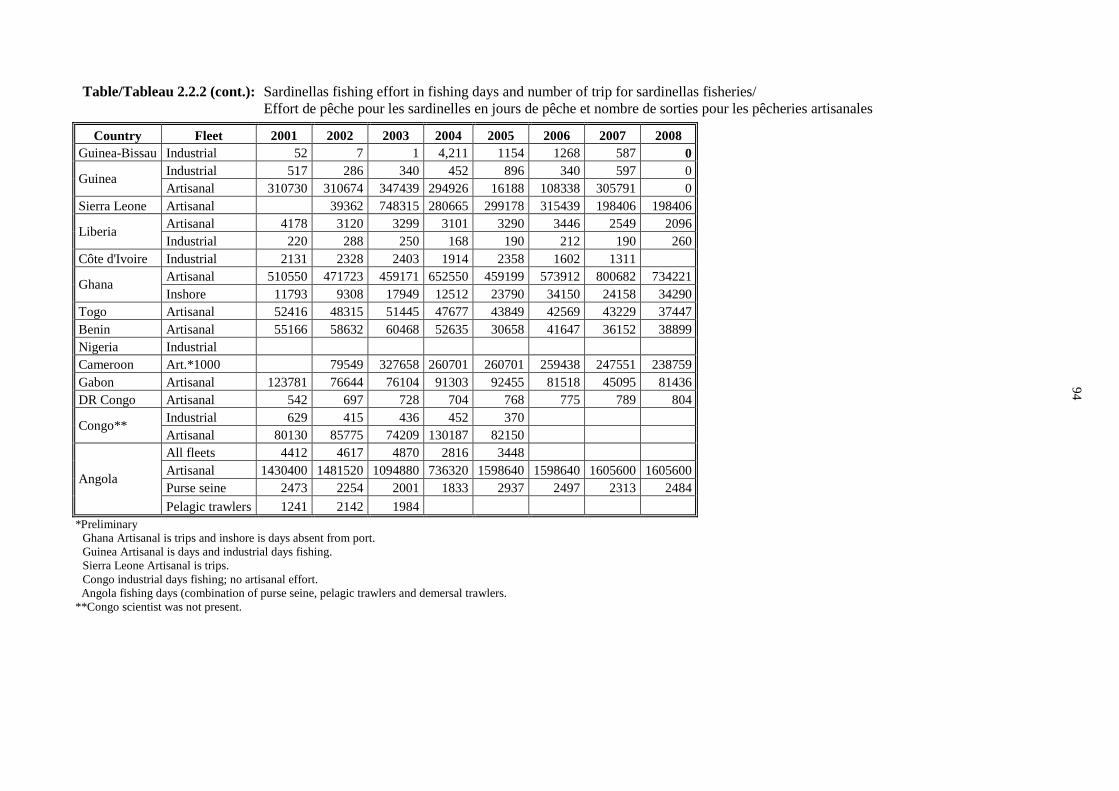
94
Table/Tableau 2.2.2 (cont.): Sardinellas fishing effort in fishing days and number of trip for sardinellas fisheries/
Effort de pêche pour les sardinelles en jours de pêche et nombre de sorties pour les pêcheries artisanales
Country Fleet 2001 2002 2003 2004 2005 2006 2007 2008
Guinea-Bissau Industrial 52 7 1 4,211 1154 1268 587 0
Guinea Industrial 517 286 340 452 896 340 597 0
Artisanal 310730 310674 347439 294926 16188 108338 305791 0
Sierra Leone Artisanal 39362 748315 280665 299178 315439 198406 198406
Liberia Artisanal 4178 3120 3299 3101 3290 3446 2549 2096
Industrial 220 288 250 168 190 212 190 260
Côte d'Ivoire Industrial 2131 2328 2403 1914 2358 1602 1311
Ghana Artisanal 510550 471723 459171 652550 459199 573912 800682 734221
Inshore 11793 9308 17949 12512 23790 34150 24158 34290
Togo Artisanal 52416 48315 51445 47677 43849 42569 43229 37447
Benin Artisanal 55166 58632 60468 52635 30658 41647 36152 38899
Nigeria Industrial
Cameroon Art.*1000 79549 327658 260701 260701 259438 247551 238759
Gabon Artisanal 123781 76644 76104 91303 92455 81518 45095 81436
DR Congo Artisanal 542 697 728 704 768 775 789 804
Congo** Industrial 629 415 436 452 370
Artisanal 80130 85775 74209 130187 82150
Angola
All fleets 4412 4617 4870 2816 3448
Artisanal 1430400 1481520 1094880 736320 1598640 1598640 1605600 1605600
Purse seine 2473 2254 2001 1833 2937 2497 2313 2484
Pelagic trawlers 1241 2142 1984
*Preliminary
Ghana Artisanal is trips and inshore is days absent from port.
Guinea Artisanal is days and industrial days fishing.
Sierra Leone Artisanal is trips.
Congo industrial days fishing; no artisanal effort.
Angola fishing days (combination of purse seine, pelagic trawlers and demersal trawlers.
**Congo scientist was not present.

95
Table/Tableau 2.3.1a: CPUE of Sardinella aurita by country, fleet and year (1990–2008)/
CPUE de Sardinella aurita par pays, flottille et année (1990-2008)
1990 1991 1992 1993 1994 1995 1996 1997 1998 1999 2000 2001 2002 2003 2004 2005 2006 2007 2008
Guinea Industrial 1.3 2.1 3.5 2.6 4.8 4.1 7.9 15.2 11.7 10.6 8.4 12.7 5.3
Artisanal
Sierra Leone Artisanal
Industrial
Liberia
Côte d'Ivoire 4.6 10.6 9.9 3.4 3.9 4.9 2.7 3.4 3.5
Ghana
Artisanal 0.1 0.1 0.2 0.2 0.2 0.1 0.2 0.1 0.1 0.1 0.2 0.1 0.1 0.2 0.1 0.1 0.1 0.1 0.0
Inshore 0.7 0.5 1.5 0.3 0.5 0.3 0.4 0.4 0.1 0.1 0.4 0.3 0.4 0.5 0.3 0.1 0.1 0.2 0.1
Industrial 10.1 5.8 5.0 4.7 25.6 11.4 19.5 9.6 3.1 4.5 22.3 65.1 14.8 30.3 20.3 3.4 2.9
Togo Artisanal 0.0 0.0 0.0 0.0 0.0 0.0 0.0 0.1 0.0 0.0 0.0 0.1 0.0 0.1 0.1 0.2 0.1 0.0
Benin Artisanal 0.0 0.0 0.0 0.0 0.0 0.0 0.0 0.0 0.0 0.0 0.0 0.0
Nigeria Artisanal
Cameroon Artisanal
DR Congo Artisanal 0.0 0.0 0.0 0.0 0.0 0.0 0.0 0.2 0.2 0.2
Congo Industrial 4.0 3.4 3.4 4.6 3.5 0.8 1.4 0.5 1.8 2.7 1.3 1.6 3.1 2.0 2.3 3.8
Congo Artisanal 0.1 0.0 0.0 0.0 0.0 0.0 0.0 0.0
Angola All fleets 0.3 0.0 0.8 0.5 0.5 0.8 0.6 0.9
Ghana Artisanal is trips and inshore is days absent from port.
Guinea Artisanal is days and industrial days fishing.
Togo Artisanal is trips.
Sierra Leone Artisanal is trips.
Congo industrial days fishing; no artisanal effort.
Angola fishing days (combination of purse seine, pelagic trawlers and demersal trawlers.
Cameroon fishing days and for only 3 years.
Benin is trips.
Nigeria no effort, instead number of the artisanal fleet.

96
Table/Tableau 2.3.1b: CPUE of Sardinella maderensis by country, fleet and year (1990–2005)/
CPUE de Sardinella maderensis par pays, flottille et année (1990-2005)
1990 1991 1992 1993 1994 1995 1996 1997 1998 1999 2000 2001 2002 2003 2004 2005 2006 2007 2008
Guinea Industrial
Guinea Artisanal 0.02 0.02 0.01 0.01 0.02 0.03 0.01 0.01 0.01 0.00 0.04 0.02 0.01
Sierra Leone Artisanal
Côte d'Ivoire Industrial 0.05 0.28 0.64 0.32 0.20 0.29 0.24 0.12 0.41
Ghana Artisanal 0.03 0.01 0.03 0.03 0.03 0.02 0.03 0.03 0.03 0.03 0.03 0.03 0.03 0.03 0.04 0.03 0.04 0.01 0.02
Ghana Inshore 0.28 0.05 0.04 0.03 0.03 0.02 0.01 0.01 0.05 0.00 0.00 0.04 0.01 0.01 0.00 0.00 0.08 0.10 0.00
Ghana Industrial 1.78 1.02 0.89 0.83 4.53 2.02 3.45 1.69 0.55 0.80 3.94 11.48 2.62 5.35 3.58 0.60 0.52
Togo Artisanal 0.01 0.01 0.01 0.01 0.01 0.00 0.00 0.02 0.01 0.03 0.01 0.01 0.01 0.00 0.01 0.00 0.03 0.00
Benin Artisanal 0.03 0.03 0.02 0.02 0.03 0.03 0.02 0.02 0.04 0.04 0.04 0.04
Nigeria Artisanal
Cameroon Artisanal 0.01 0.01 0.01
Sao Tome Artisanal
DR Congo 0.01 0.01 0.01 0.02 0.03 0.04 0.01 0.04 0.19 0.22
Congo Industrial 4.02 3.38 3.37 4.55 3.53 0.79 1.37 0.50 1.78 2.67 1.35 1.59 3.12 2.00 2.27 3.83
Congo Artisanal 0.04 0.02 0.04 0.02 0.03 0.04 0.03 0.04
Angola Industrial 2.94 5.36 1.26 1.16 1.59 3.75 0.45 0.63
Ghana Artisanal is trips and inshore is days absent from port.
Guinea Artisanal is days and industrial days fishing.
Togo Artisanal is trips.
Sierra Leone Artisanal is trips.
Congo industrial days fishing; no artisanal effort.
Angola fishing days (combination of purse seine, pelagic trawlers and demersal trawlers.
Cameroon fishing days and for only 3 years.
Benin is trips.
Nigeria no effort, instead number of the artisanal fleet.

97
Table/Tableau 2.3.1c: CPUE of Sardinella spp. by country, fleet and year (1990–2005)/
CPUE de Sardinella spp.par pays, flottille et année (1990-2005)
1990 1991 1992 1993 1994 1995 1996 1997 1998 1999 2000 2001 2002 2003 2004 2005 2006 2007 2008
Guinea-Bissau Industrial 36.01 74.45 17.63 6.58 25.23 0.32 2.93 3.94 17.69 458.29 1586.94 0.21 7.91 5.33 5.58
Sierra Leone Artisanal 0.03 0.02 0.02 0.03 1.17 1.35 1.73
Liberia Industrial 0.49 1.06 2.35 1.75 1.23 0.94 1.08 1.61 0.41 0.62 1.68 0.86
Liberia Artisanal 0.05 0.09 0.22 0.13 0.26 0.35 0.33 0.35 0.09 0.15 0.50 0.19
Ghana Industrial
Nigeria Artisanal
Cameroon Artisanal
Sao Tome Artisanal
Congo Industrial
Congo Artisanal
Angola All fleets 0 0 0 0 0 0 0 0
Ghana Artisanal is trips and inshore is days absent from port.
Guinea Artisanal is days and industrial days fishing.
Togo Artisanal is trips.
Sierra Leone Artisanal is trips.
Congo industrial days fishing; no artisanal effort.
Angola fishing days (combination of purse seine, pelagic trawlers and demersal trawlers.
Cameroon fishing days and for only 3 years.
Benin is trips.
Nigeria no effort, instead number of the artisanal fleet.
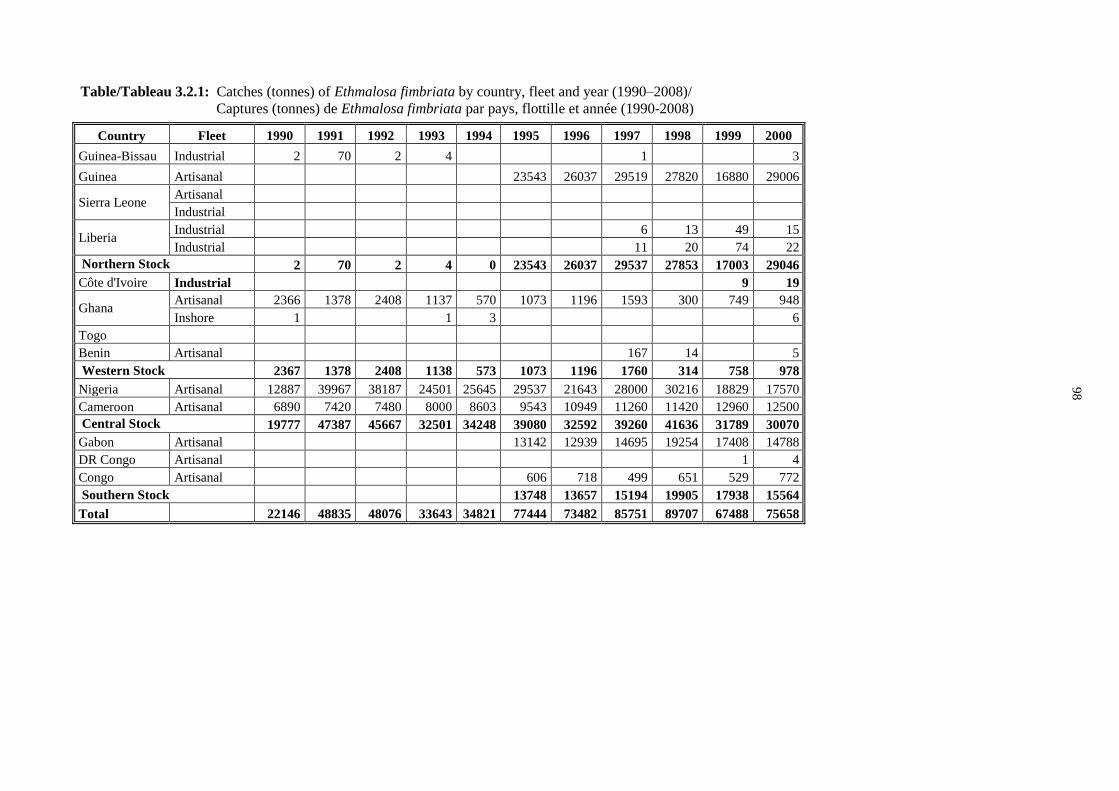
98
Table/Tableau 3.2.1: Catches (tonnes) of Ethmalosa fimbriata by country, fleet and year (1990–2008)/
Captures (tonnes) de Ethmalosa fimbriata par pays, flottille et année (1990-2008)
Country Fleet 1990 1991 1992 1993 1994 1995 1996 1997 1998 1999 2000
Guinea-Bissau Industrial 2 70 2 4 1 3
Guinea Artisanal 23543 26037 29519 27820 16880 29006
Sierra Leone Artisanal
Industrial
Liberia Industrial 6 13 49 15
Industrial 11 20 74 22
Northern Stock 2 70 2 4 0 23543 26037 29537 27853 17003 29046
Côte d'Ivoire Industrial 9 19
Ghana Artisanal 2366 1378 2408 1137 570 1073 1196 1593 300 749 948
Inshore 1 1 3 6
Togo
Benin Artisanal 167 14 5
Western Stock 2367 1378 2408 1138 573 1073 1196 1760 314 758 978
Nigeria Artisanal 12887 39967 38187 24501 25645 29537 21643 28000 30216 18829 17570
Cameroon Artisanal 6890 7420 7480 8000 8603 9543 10949 11260 11420 12960 12500
Central Stock 19777 47387 45667 32501 34248 39080 32592 39260 41636 31789 30070
Gabon Artisanal 13142 12939 14695 19254 17408 14788
DR Congo Artisanal 1 4
Congo Artisanal 606 718 499 651 529 772
Southern Stock 13748 13657 15194 19905 17938 15564
Total 22146 48835 48076 33643 34821 77444 73482 85751 89707 67488 75658
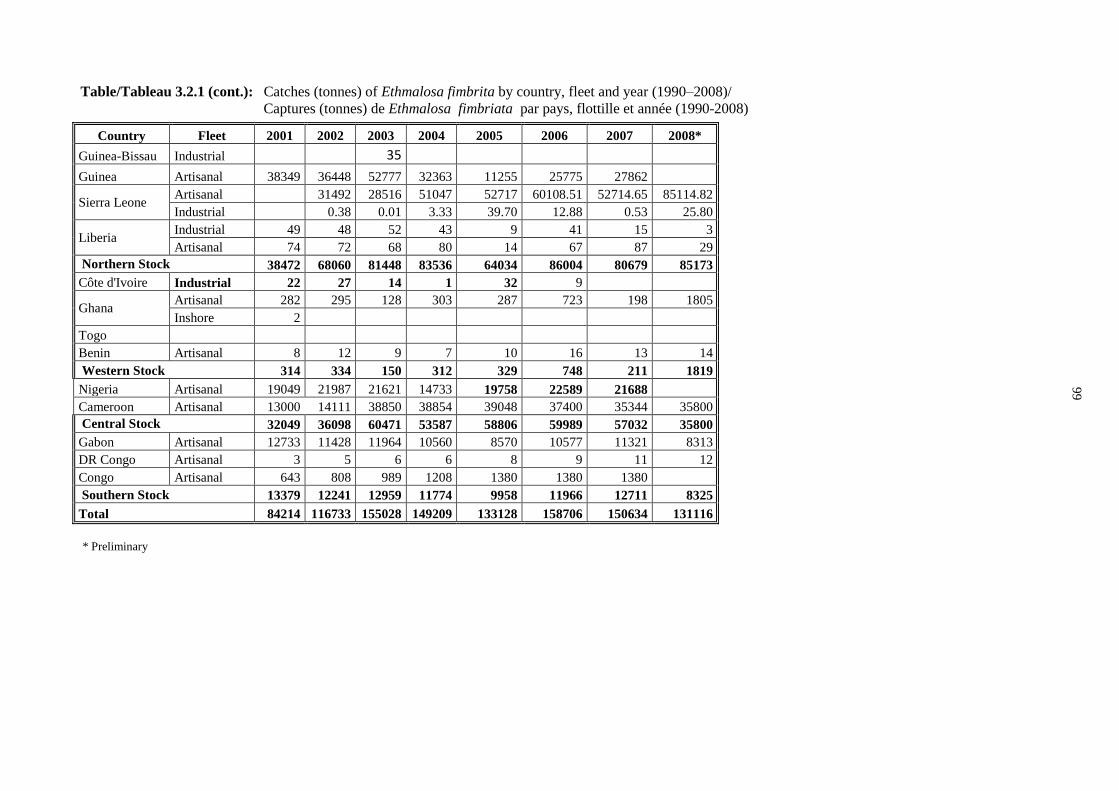
99
Table/Tableau 3.2.1 (cont.): Catches (tonnes) of Ethmalosa fimbrita by country, fleet and year (1990–2008)/
Captures (tonnes) de Ethmalosa fimbriata par pays, flottille et année (1990-2008)
Country Fleet 2001 2002 2003 2004 2005 2006 2007 2008*
Guinea-Bissau Industrial 35
Guinea Artisanal 38349 36448 52777 32363 11255 25775 27862
Sierra Leone Artisanal 31492 28516 51047 52717 60108.51 52714.65 85114.82
Industrial 0.38 0.01 3.33 39.70 12.88 0.53 25.80
Liberia Industrial 49 48 52 43 9 41 15 3
Artisanal 74 72 68 80 14 67 87 29
Northern Stock 38472 68060 81448 83536 64034 86004 80679 85173
Côte d'Ivoire Industrial 22 27 14 1 32 9
Ghana Artisanal 282 295 128 303 287 723 198 1805
Inshore 2
Togo
Benin Artisanal 8 12 9 7 10 16 13 14
Western Stock 314 334 150 312 329 748 211 1819
Nigeria Artisanal 19049 21987 21621 14733 19758 22589 21688
Cameroon Artisanal 13000 14111 38850 38854 39048 37400 35344 35800
Central Stock 32049 36098 60471 53587 58806 59989 57032 35800
Gabon Artisanal 12733 11428 11964 10560 8570 10577 11321 8313
DR Congo Artisanal 3 5 6 6 8 9 11 12
Congo Artisanal 643 808 989 1208 1380 1380 1380
Southern Stock 13379 12241 12959 11774 9958 11966 12711 8325
Total 84214 116733 155028 149209 133128 158706 150634 131116
* Preliminary
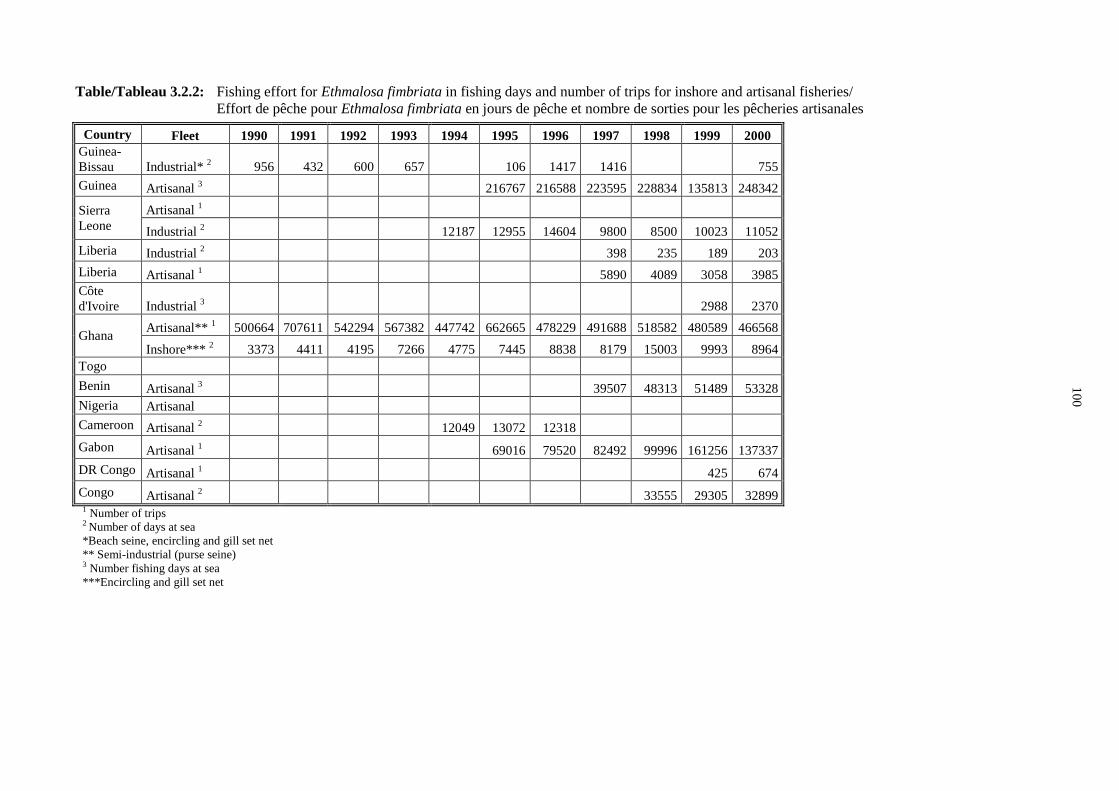
10
0
Table/Tableau 3.2.2: Fishing effort for Ethmalosa fimbriata in fishing days and number of trips for inshore and artisanal fisheries/
Effort de pêche pour Ethmalosa fimbriata en jours de pêche et nombre de sorties pour les pêcheries artisanales
Country Fleet 1990 1991 1992 1993 1994 1995 1996 1997 1998 1999 2000
Guinea-
Bissau Industrial* 2 956 432 600 657 106 1417 1416 755
Guinea Artisanal 3 216767 216588 223595 228834 135813 248342
Sierra
Leone
Artisanal 1
Industrial 2 12187 12955 14604 9800 8500 10023 11052
Liberia Industrial 2 398 235 189 203
Liberia Artisanal 1 5890 4089 3058 3985
Côte
d'Ivoire Industrial 3 2988 2370
Ghana Artisanal**
1 500664 707611 542294 567382 447742 662665 478229 491688 518582 480589 466568
Inshore*** 2 3373 4411 4195 7266 4775 7445 8838 8179 15003 9993 8964
Togo
Benin Artisanal 3 39507 48313 51489 53328
Nigeria Artisanal
Cameroon Artisanal 2 12049 13072 12318
Gabon Artisanal 1 69016 79520 82492 99996 161256 137337
DR Congo Artisanal 1 425 674
Congo Artisanal 2 33555 29305 32899
1 Number of trips 2 Number of days at sea
*Beach seine, encircling and gill set net
** Semi-industrial (purse seine) 3 Number fishing days at sea
***Encircling and gill set net
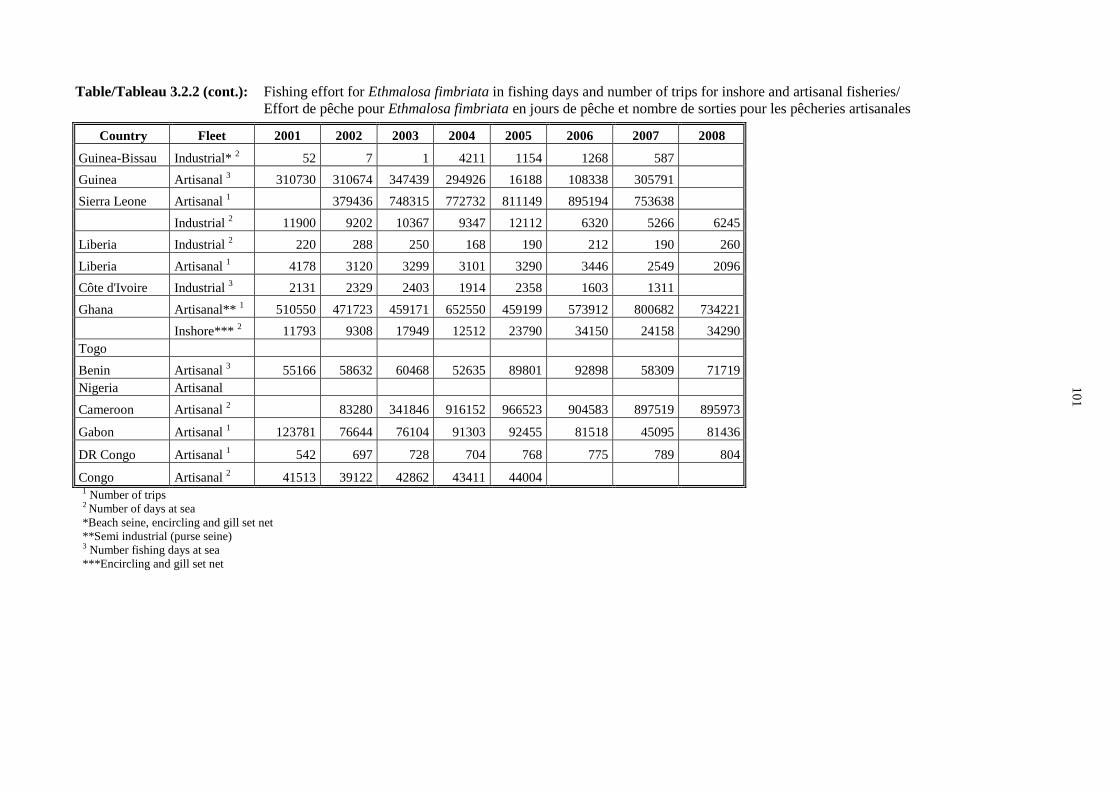
10
1
Table/Tableau 3.2.2 (cont.): Fishing effort for Ethmalosa fimbriata in fishing days and number of trips for inshore and artisanal fisheries/
Effort de pêche pour Ethmalosa fimbriata en jours de pêche et nombre de sorties pour les pêcheries artisanales
Country Fleet 2001 2002 2003 2004 2005 2006 2007 2008
Guinea-Bissau Industrial* 2 52 7 1 4211 1154 1268 587
Guinea Artisanal 3 310730 310674 347439 294926 16188 108338 305791
Sierra Leone Artisanal 1 379436 748315 772732 811149 895194 753638
Industrial 2 11900 9202 10367 9347 12112 6320 5266 6245
Liberia Industrial 2 220 288 250 168 190 212 190 260
Liberia Artisanal 1 4178 3120 3299 3101 3290 3446 2549 2096
Côte d'Ivoire Industrial 3 2131 2329 2403 1914 2358 1603 1311
Ghana Artisanal** 1 510550 471723 459171 652550 459199 573912 800682 734221
Inshore*** 2 11793 9308 17949 12512 23790 34150 24158 34290
Togo
Benin Artisanal 3 55166 58632 60468 52635 89801 92898 58309 71719
Nigeria Artisanal
Cameroon Artisanal 2 83280 341846 916152 966523 904583 897519 895973
Gabon Artisanal 1 123781 76644 76104 91303 92455 81518 45095 81436
DR Congo Artisanal 1 542 697 728 704 768 775 789 804
Congo Artisanal 2 41513 39122 42862 43411 44004
1 Number of trips 2 Number of days at sea
*Beach seine, encircling and gill set net
**Semi industrial (purse seine) 3 Number fishing days at sea
***Encircling and gill set net
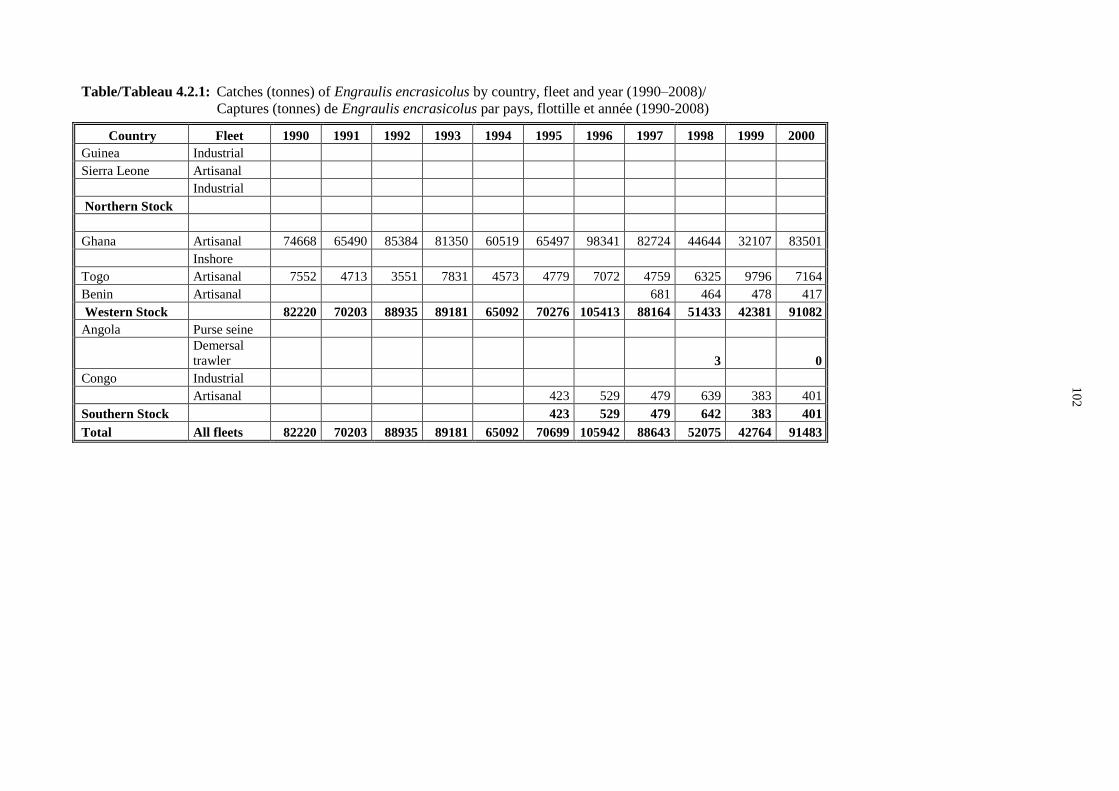
10
2
Table/Tableau 4.2.1: Catches (tonnes) of Engraulis encrasicolus by country, fleet and year (1990–2008)/
Captures (tonnes) de Engraulis encrasicolus par pays, flottille et année (1990-2008)
Country Fleet 1990 1991 1992 1993 1994 1995 1996 1997 1998 1999 2000
Guinea Industrial
Sierra Leone Artisanal
Industrial
Northern Stock
Ghana Artisanal 74668 65490 85384 81350 60519 65497 98341 82724 44644 32107 83501
Inshore
Togo Artisanal 7552 4713 3551 7831 4573 4779 7072 4759 6325 9796 7164
Benin Artisanal 681 464 478 417
Western Stock 82220 70203 88935 89181 65092 70276 105413 88164 51433 42381 91082
Angola Purse seine
Demersal
trawler 3 0
Congo Industrial
Artisanal 423 529 479 639 383 401
Southern Stock 423 529 479 642 383 401
Total All fleets 82220 70203 88935 89181 65092 70699 105942 88643 52075 42764 91483
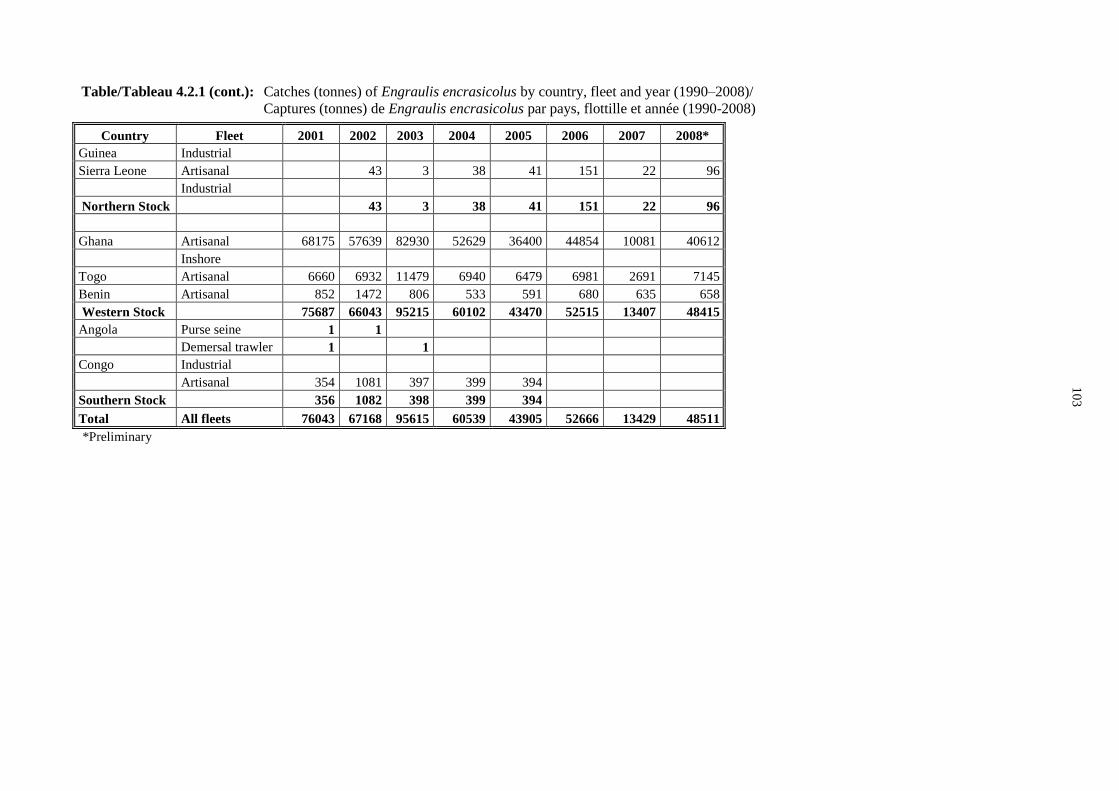
10
3
Table/Tableau 4.2.1 (cont.): Catches (tonnes) of Engraulis encrasicolus by country, fleet and year (1990–2008)/
Captures (tonnes) de Engraulis encrasicolus par pays, flottille et année (1990-2008)
Country Fleet 2001 2002 2003 2004 2005 2006 2007 2008*
Guinea Industrial
Sierra Leone Artisanal 43 3 38 41 151 22 96
Industrial
Northern Stock 43 3 38 41 151 22 96
Ghana Artisanal 68175 57639 82930 52629 36400 44854 10081 40612
Inshore
Togo Artisanal 6660 6932 11479 6940 6479 6981 2691 7145
Benin Artisanal 852 1472 806 533 591 680 635 658
Western Stock 75687 66043 95215 60102 43470 52515 13407 48415
Angola Purse seine 1 1
Demersal trawler 1 1
Congo Industrial
Artisanal 354 1081 397 399 394
Southern Stock 356 1082 398 399 394
Total All fleets 76043 67168 95615 60539 43905 52666 13429 48511
*Preliminary
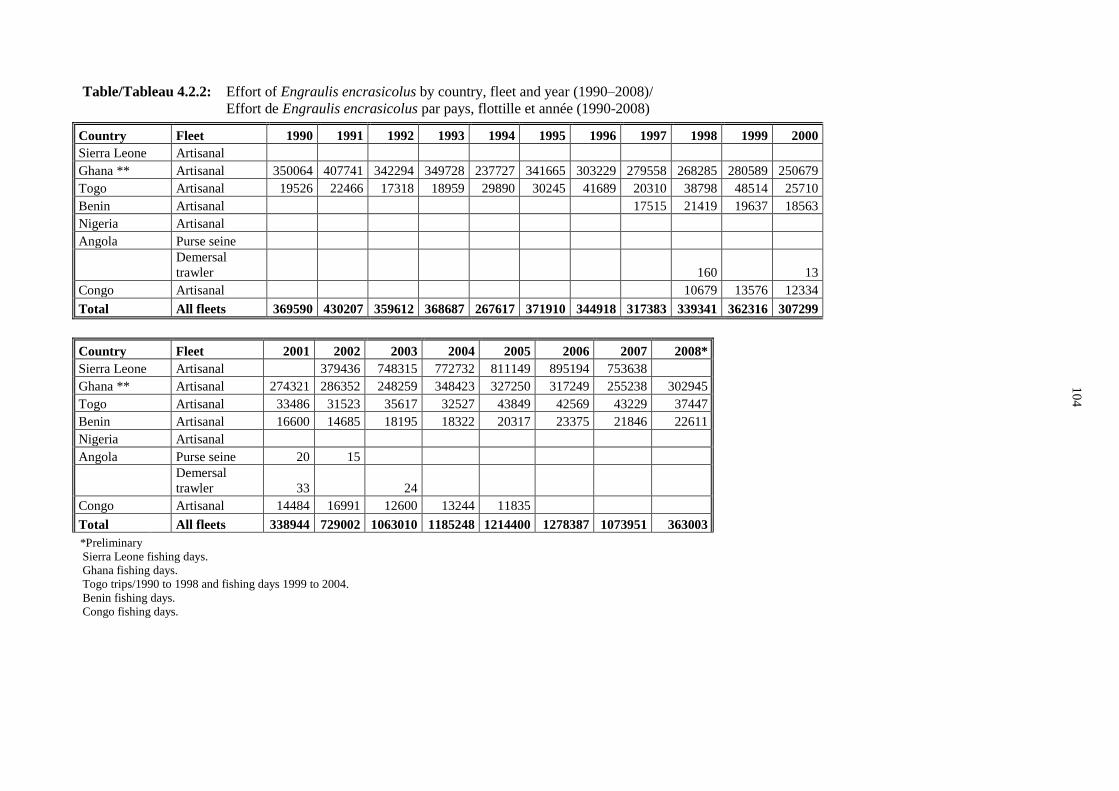
10
4
Table/Tableau 4.2.2: Effort of Engraulis encrasicolus by country, fleet and year (1990–2008)/
Effort de Engraulis encrasicolus par pays, flottille et année (1990-2008)
Country Fleet 1990 1991 1992 1993 1994 1995 1996 1997 1998 1999 2000
Sierra Leone Artisanal
Ghana ** Artisanal 350064 407741 342294 349728 237727 341665 303229 279558 268285 280589 250679
Togo Artisanal 19526 22466 17318 18959 29890 30245 41689 20310 38798 48514 25710
Benin Artisanal 17515 21419 19637 18563
Nigeria Artisanal
Angola Purse seine
Demersal
trawler 160 13
Congo Artisanal 10679 13576 12334
Total All fleets 369590 430207 359612 368687 267617 371910 344918 317383 339341 362316 307299
Country Fleet 2001 2002 2003 2004 2005 2006 2007 2008*
Sierra Leone Artisanal 379436 748315 772732 811149 895194 753638
Ghana ** Artisanal 274321 286352 248259 348423 327250 317249 255238 302945
Togo Artisanal 33486 31523 35617 32527 43849 42569 43229 37447
Benin Artisanal 16600 14685 18195 18322 20317 23375 21846 22611
Nigeria Artisanal
Angola Purse seine 20 15
Demersal
trawler 33 24
Congo Artisanal 14484 16991 12600 13244 11835
Total All fleets 338944 729002 1063010 1185248 1214400 1278387 1073951 363003
*Preliminary
Sierra Leone fishing days.
Ghana fishing days.
Togo trips/1990 to 1998 and fishing days 1999 to 2004.
Benin fishing days.
Congo fishing days.
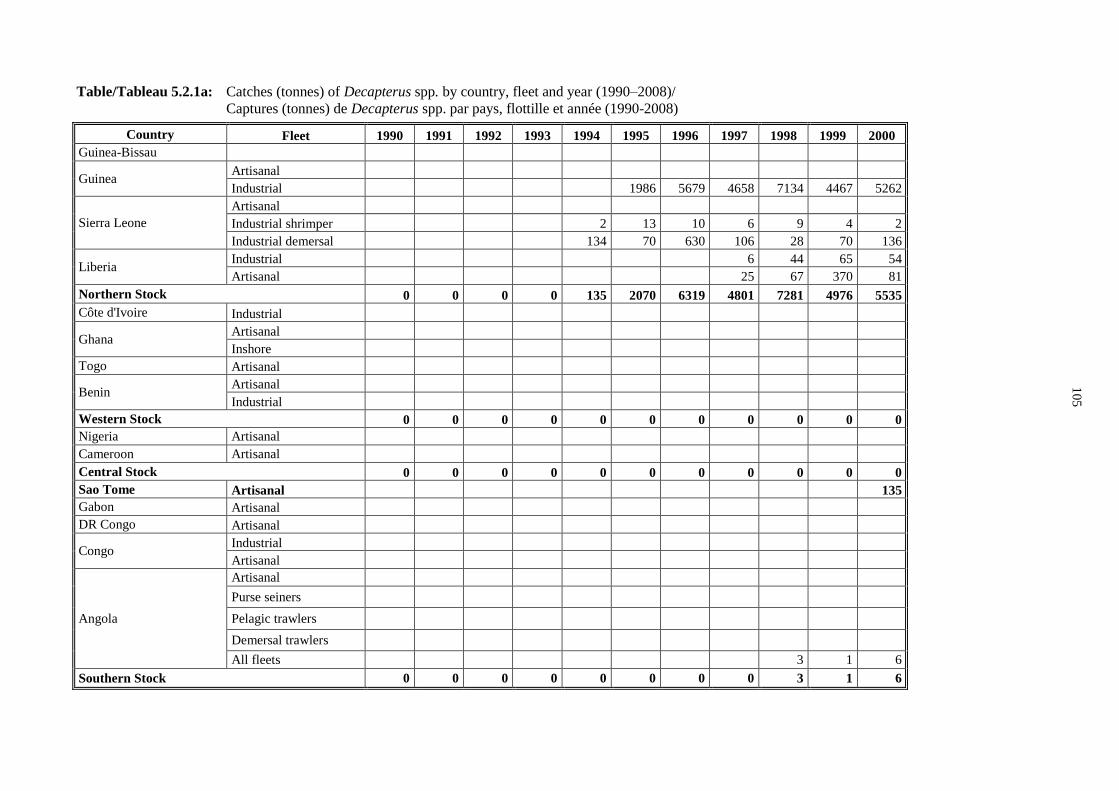
10
5
Table/Tableau 5.2.1a: Catches (tonnes) of Decapterus spp. by country, fleet and year (1990–2008)/
Captures (tonnes) de Decapterus spp. par pays, flottille et année (1990-2008)
Country Fleet 1990 1991 1992 1993 1994 1995 1996 1997 1998 1999 2000
Guinea-Bissau
Guinea Artisanal
Industrial 1986 5679 4658 7134 4467 5262
Sierra Leone
Artisanal
Industrial shrimper 2 13 10 6 9 4 2
Industrial demersal 134 70 630 106 28 70 136
Liberia Industrial 6 44 65 54
Artisanal 25 67 370 81
Northern Stock 0 0 0 0 135 2070 6319 4801 7281 4976 5535
Côte d'Ivoire Industrial
Ghana Artisanal
Inshore
Togo Artisanal
Benin Artisanal
Industrial
Western Stock 0 0 0 0 0 0 0 0 0 0 0
Nigeria Artisanal
Cameroon Artisanal
Central Stock 0 0 0 0 0 0 0 0 0 0 0
Sao Tome Artisanal 135
Gabon Artisanal
DR Congo Artisanal
Congo Industrial
Artisanal
Angola
Artisanal
Purse seiners
Pelagic trawlers
Demersal trawlers
All fleets 3 1 6
Southern Stock 0 0 0 0 0 0 0 0 3 1 6
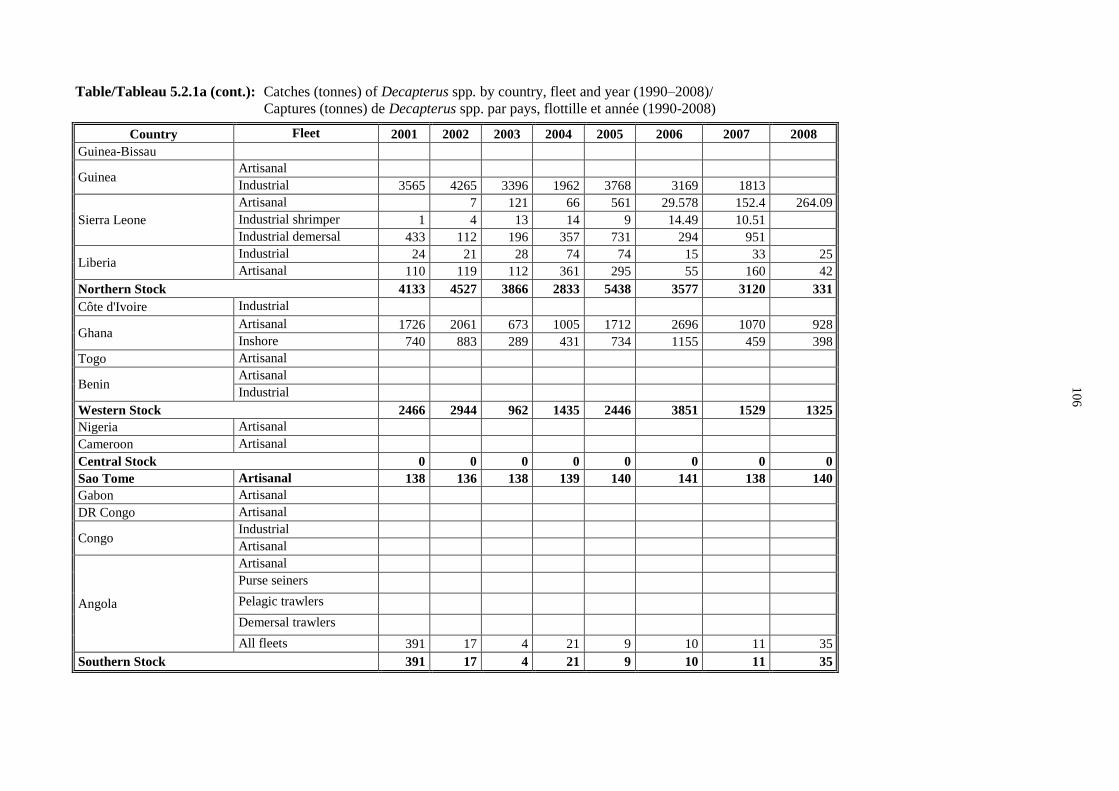
10
6
Table/Tableau 5.2.1a (cont.): Catches (tonnes) of Decapterus spp. by country, fleet and year (1990–2008)/
Captures (tonnes) de Decapterus spp. par pays, flottille et année (1990-2008)
Country Fleet 2001 2002 2003 2004 2005 2006 2007 2008
Guinea-Bissau
Guinea Artisanal
Industrial 3565 4265 3396 1962 3768 3169 1813
Sierra Leone
Artisanal 7 121 66 561 29.578 152.4 264.09
Industrial shrimper 1 4 13 14 9 14.49 10.51
Industrial demersal 433 112 196 357 731 294 951
Liberia Industrial 24 21 28 74 74 15 33 25
Artisanal 110 119 112 361 295 55 160 42
Northern Stock 4133 4527 3866 2833 5438 3577 3120 331
Côte d'Ivoire Industrial
Ghana Artisanal 1726 2061 673 1005 1712 2696 1070 928
Inshore 740 883 289 431 734 1155 459 398
Togo Artisanal
Benin Artisanal
Industrial
Western Stock 2466 2944 962 1435 2446 3851 1529 1325
Nigeria Artisanal
Cameroon Artisanal
Central Stock 0 0 0 0 0 0 0 0
Sao Tome Artisanal 138 136 138 139 140 141 138 140
Gabon Artisanal
DR Congo Artisanal
Congo Industrial
Artisanal
Angola
Artisanal
Purse seiners
Pelagic trawlers
Demersal trawlers
All fleets 391 17 4 21 9 10 11 35
Southern Stock 391 17 4 21 9 10 11 35

10
7
Table/Tableau 5.2.1b: Catches (tonnes) of Trachurus spp. by country, fleet and year (1990–2005)/
Captures (tonnes) de Trachurus spp. (1990–2005) par pays, flottille et année (1990-2008)
Country Fleet 1990 1991 1992 1993 1994 1995 1996 1997 1998 1999 2000
Guinea-Bissau Industrial 21669 17748 524 5840 5627 6913 1751 10868 8097
Guinea Artisanal
Industrial 604 1728 1418 2171 1360 1601
Sierra Leone Artisanal
1
Industrial shrimper
Industrial demersal
Liberia Industrial 12 20 22 18
Artisanal 48 78 87 71
Northern Stock 21669 17748 524 5840 5627 7518 3479 12346 2269 1468 9787
Côte d'Ivoire Industrial 1134 458
Ghana Artisanal 76 33 364 482 357 1777 31
Inshore 403 90 67 116 62 6 12 24 71 360 30
Togo Artisanal 148 135 92 107 224 149 163 107 72 1207 449
Benin Artisanal 4 2 7 28
Industrial
Western Stock 627 225 192 587 286 155 657 135 502 4485 996
Nigeria Artisanal 34 3102 2050 3290 2414
Cameroon Artisanal
Central Stock Total stock 34 3102 2050 3290 2414
Gabon Artisanal
DR Congo Artisanal 4 7
Congo Industrial
Artisanal 42 28 20 23 25 32
Angola1
Artisanal 68 492 349 484
Purse seiners 64928 34573 31475 43970 29459 21797 48014 54048 6998 5196 9184
Pelagic trawlers 27302 12727 22732
Demersal trawlers 8665 7983 7806
Southern Stock 64928 34573 31475 43970 29459 21839 48042 54135 43480 26284 40246 1 only T. trecae
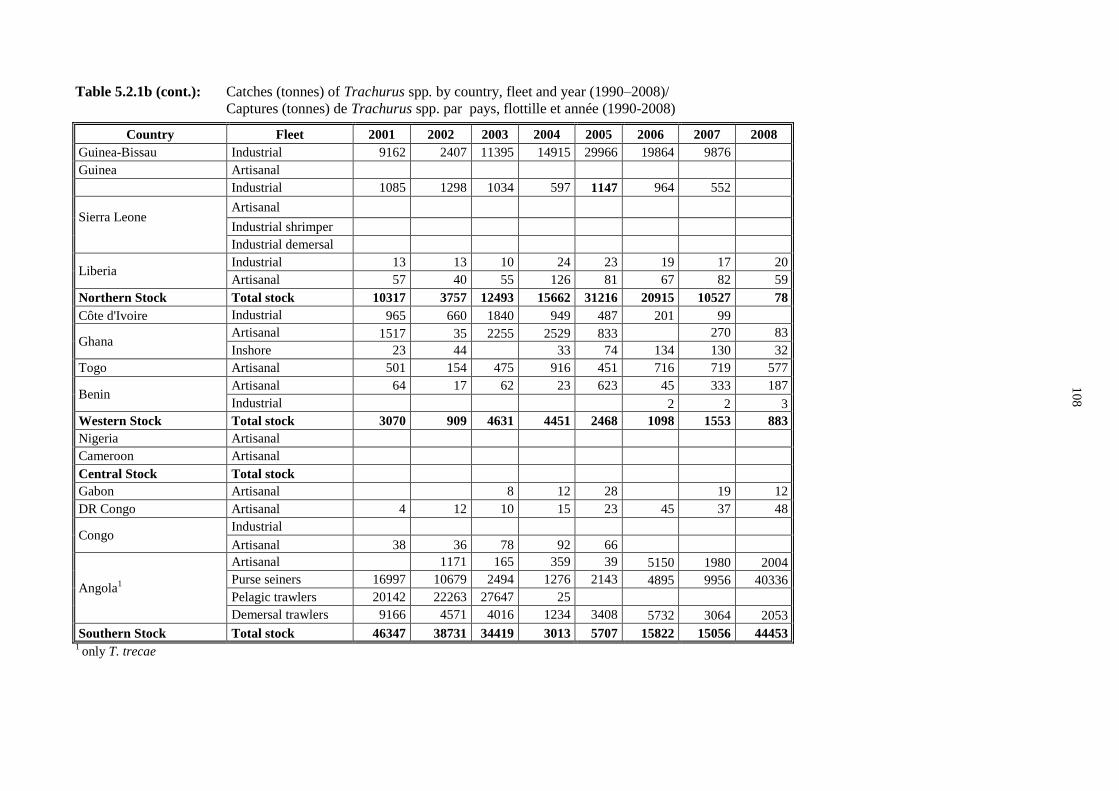
10
8
Table 5.2.1b (cont.): Catches (tonnes) of Trachurus spp. by country, fleet and year (1990–2008)/
Captures (tonnes) de Trachurus spp. par pays, flottille et année (1990-2008)
Country Fleet 2001 2002 2003 2004 2005 2006 2007 2008
Guinea-Bissau Industrial 9162 2407 11395 14915 29966 19864 9876
Guinea Artisanal
Industrial 1085 1298 1034 597 1147 964 552
Sierra Leone
Artisanal
Industrial shrimper
Industrial demersal
Liberia Industrial 13 13 10 24 23 19 17 20
Artisanal 57 40 55 126 81 67 82 59
Northern Stock Total stock 10317 3757 12493 15662 31216 20915 10527 78
Côte d'Ivoire Industrial 965 660 1840 949 487 201 99
Ghana Artisanal 1517 35 2255 2529 833 270 83
Inshore 23 44 33 74 134 130 32
Togo Artisanal 501 154 475 916 451 716 719 577
Benin Artisanal 64 17 62 23 623 45 333 187
Industrial 2 2 3
Western Stock Total stock 3070 909 4631 4451 2468 1098 1553 883
Nigeria Artisanal
Cameroon Artisanal
Central Stock Total stock
Gabon Artisanal 8 12 28 19 12
DR Congo Artisanal 4 12 10 15 23 45 37 48
Congo Industrial
Artisanal 38 36 78 92 66
Angola1
Artisanal 1171 165 359 39 5150 1980 2004
Purse seiners 16997 10679 2494 1276 2143 4895 9956 40336
Pelagic trawlers 20142 22263 27647 25
Demersal trawlers 9166 4571 4016 1234 3408 5732 3064 2053
Southern Stock Total stock 46347 38731 34419 3013 5707 15822 15056 44453 1 only T. trecae
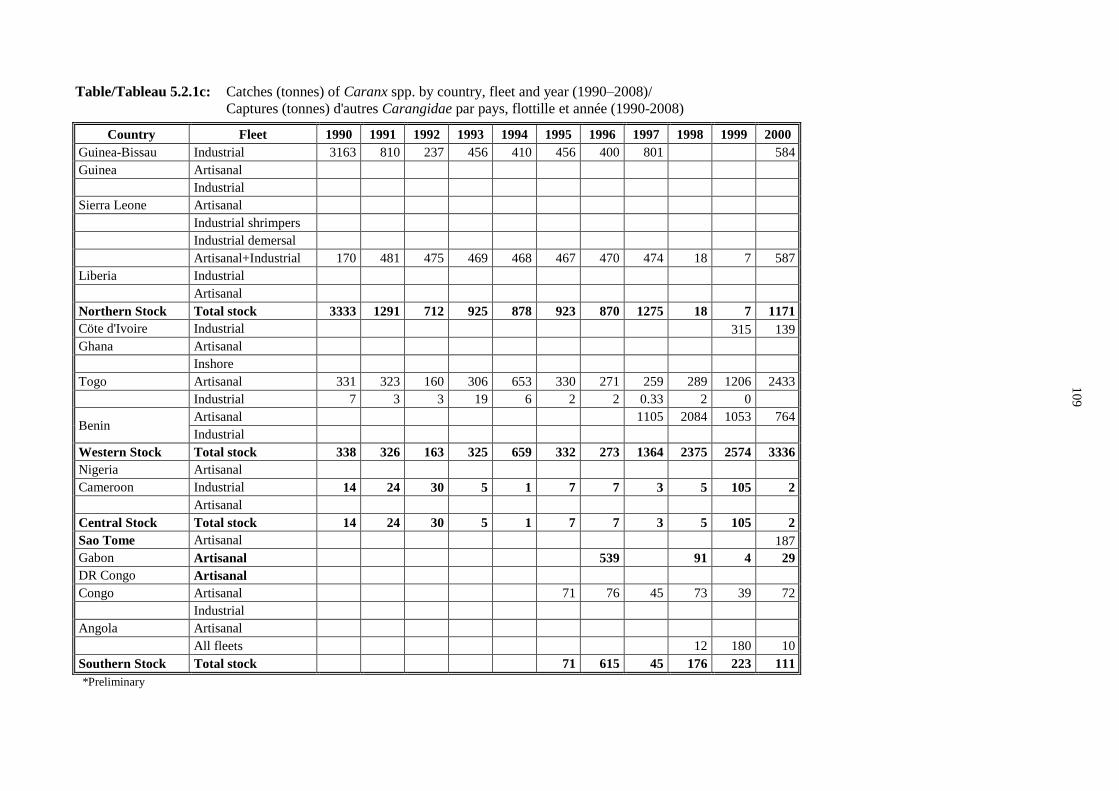
10
9
Table/Tableau 5.2.1c: Catches (tonnes) of Caranx spp. by country, fleet and year (1990–2008)/
Captures (tonnes) d'autres Carangidae par pays, flottille et année (1990-2008)
Country Fleet 1990 1991 1992 1993 1994 1995 1996 1997 1998 1999 2000
Guinea-Bissau Industrial 3163 810 237 456 410 456 400 801 584
Guinea Artisanal
Industrial
Sierra Leone Artisanal
Industrial shrimpers
Industrial demersal
Artisanal+Industrial 170 481 475 469 468 467 470 474 18 7 587
Liberia Industrial
Artisanal
Northern Stock Total stock 3333 1291 712 925 878 923 870 1275 18 7 1171
Cöte d'Ivoire Industrial 315 139
Ghana Artisanal
Inshore
Togo Artisanal 331 323 160 306 653 330 271 259 289 1206 2433
Industrial 7 3 3 19 6 2 2 0.33 2 0
Benin Artisanal 1105 2084 1053 764
Industrial
Western Stock Total stock 338 326 163 325 659 332 273 1364 2375 2574 3336
Nigeria Artisanal
Cameroon Industrial 14 24 30 5 1 7 7 3 5 105 2
Artisanal
Central Stock Total stock 14 24 30 5 1 7 7 3 5 105 2
Sao Tome Artisanal 187
Gabon Artisanal 539 91 4 29
DR Congo Artisanal
Congo Artisanal 71 76 45 73 39 72
Industrial
Angola Artisanal
All fleets 12 180 10
Southern Stock Total stock 71 615 45 176 223 111
*Preliminary
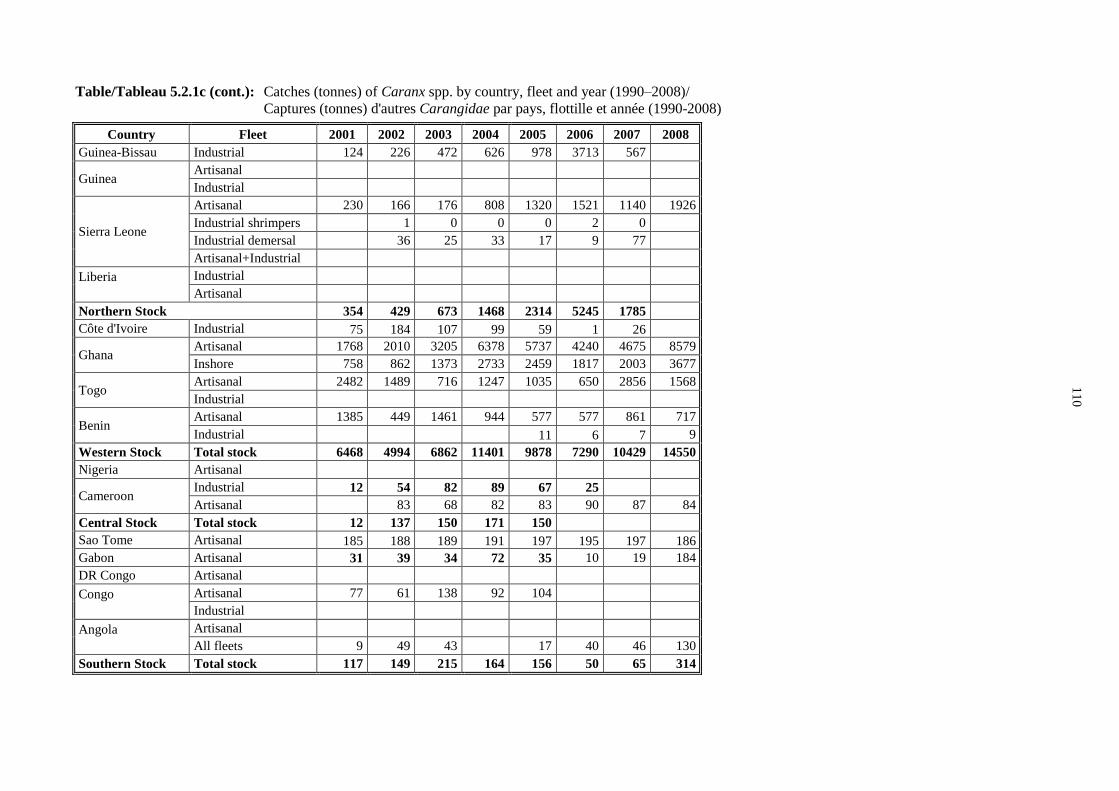
11
0
Table/Tableau 5.2.1c (cont.): Catches (tonnes) of Caranx spp. by country, fleet and year (1990–2008)/
Captures (tonnes) d'autres Carangidae par pays, flottille et année (1990-2008)
Country Fleet 2001 2002 2003 2004 2005 2006 2007 2008
Guinea-Bissau Industrial 124 226 472 626 978 3713 567
Guinea Artisanal
Industrial
Sierra Leone
Artisanal 230 166 176 808 1320 1521 1140 1926
Industrial shrimpers 1 0 0 0 2 0
Industrial demersal 36 25 33 17 9 77
Artisanal+Industrial
Liberia
Industrial
Artisanal
Northern Stock 354 429 673 1468 2314 5245 1785
Côte d'Ivoire Industrial 75 184 107 99 59 1 26
Ghana Artisanal 1768 2010 3205 6378 5737 4240 4675 8579
Inshore 758 862 1373 2733 2459 1817 2003 3677
Togo Artisanal 2482 1489 716 1247 1035 650 2856 1568
Industrial
Benin Artisanal 1385 449 1461 944 577 577 861 717
Industrial 11 6 7 9
Western Stock Total stock 6468 4994 6862 11401 9878 7290 10429 14550
Nigeria Artisanal
Cameroon Industrial 12 54 82 89 67 25
Artisanal 83 68 82 83 90 87 84
Central Stock Total stock 12 137 150 171 150
Sao Tome Artisanal 185 188 189 191 197 195 197 186
Gabon Artisanal 31 39 34 72 35 10 19 184
DR Congo Artisanal
Congo
Artisanal 77 61 138 92 104
Industrial
Angola
Artisanal
All fleets 9 49 43 17 40 46 130
Southern Stock Total stock 117 149 215 164 156 50 65 314
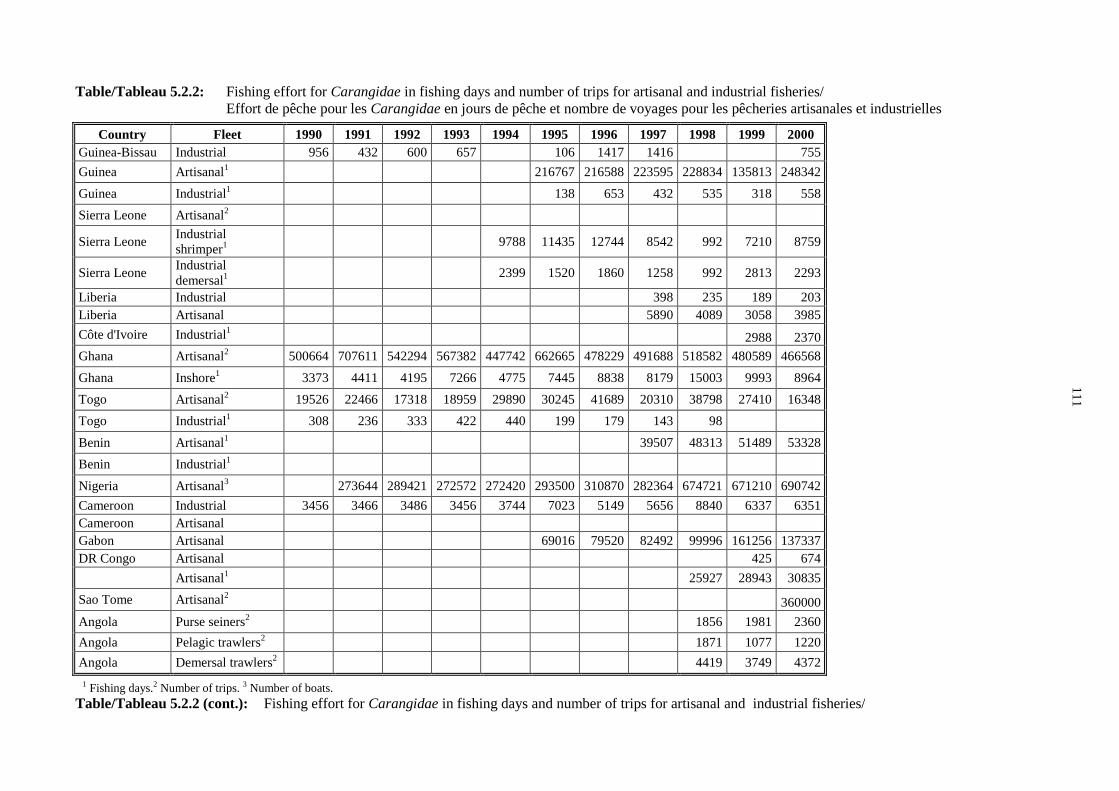
11
1
Table/Tableau 5.2.2: Fishing effort for Carangidae in fishing days and number of trips for artisanal and industrial fisheries/
Effort de pêche pour les Carangidae en jours de pêche et nombre de voyages pour les pêcheries artisanales et industrielles
Country Fleet 1990 1991 1992 1993 1994 1995 1996 1997 1998 1999 2000
Guinea-Bissau Industrial 956 432 600 657 106 1417 1416 755
Guinea Artisanal1 216767 216588 223595 228834 135813 248342
Guinea Industrial1 138 653 432 535 318 558
Sierra Leone Artisanal2
Sierra Leone Industrial
shrimper1
9788 11435 12744 8542 992 7210 8759
Sierra Leone Industrial
demersal1
2399 1520 1860 1258 992 2813 2293
Liberia Industrial 398 235 189 203
Liberia Artisanal 5890 4089 3058 3985
Côte d'Ivoire Industrial1 2988 2370
Ghana Artisanal2 500664 707611 542294 567382 447742 662665 478229 491688 518582 480589 466568
Ghana Inshore1 3373 4411 4195 7266 4775 7445 8838 8179 15003 9993 8964
Togo Artisanal2 19526 22466 17318 18959 29890 30245 41689 20310 38798 27410 16348
Togo Industrial1 308 236 333 422 440 199 179 143 98
Benin Artisanal1 39507 48313 51489 53328
Benin Industrial1
Nigeria Artisanal3 273644 289421 272572 272420 293500 310870 282364 674721 671210 690742
Cameroon Industrial 3456 3466 3486 3456 3744 7023 5149 5656 8840 6337 6351
Cameroon Artisanal
Gabon Artisanal 69016 79520 82492 99996 161256 137337
DR Congo Artisanal 425 674
Artisanal1 25927 28943 30835
Sao Tome Artisanal2 360000
Angola Purse seiners2 1856 1981 2360
Angola Pelagic trawlers2 1871 1077 1220
Angola Demersal trawlers2 4419 3749 4372
1 Fishing days.2 Number of trips. 3 Number of boats.
Table/Tableau 5.2.2 (cont.): Fishing effort for Carangidae in fishing days and number of trips for artisanal and industrial fisheries/
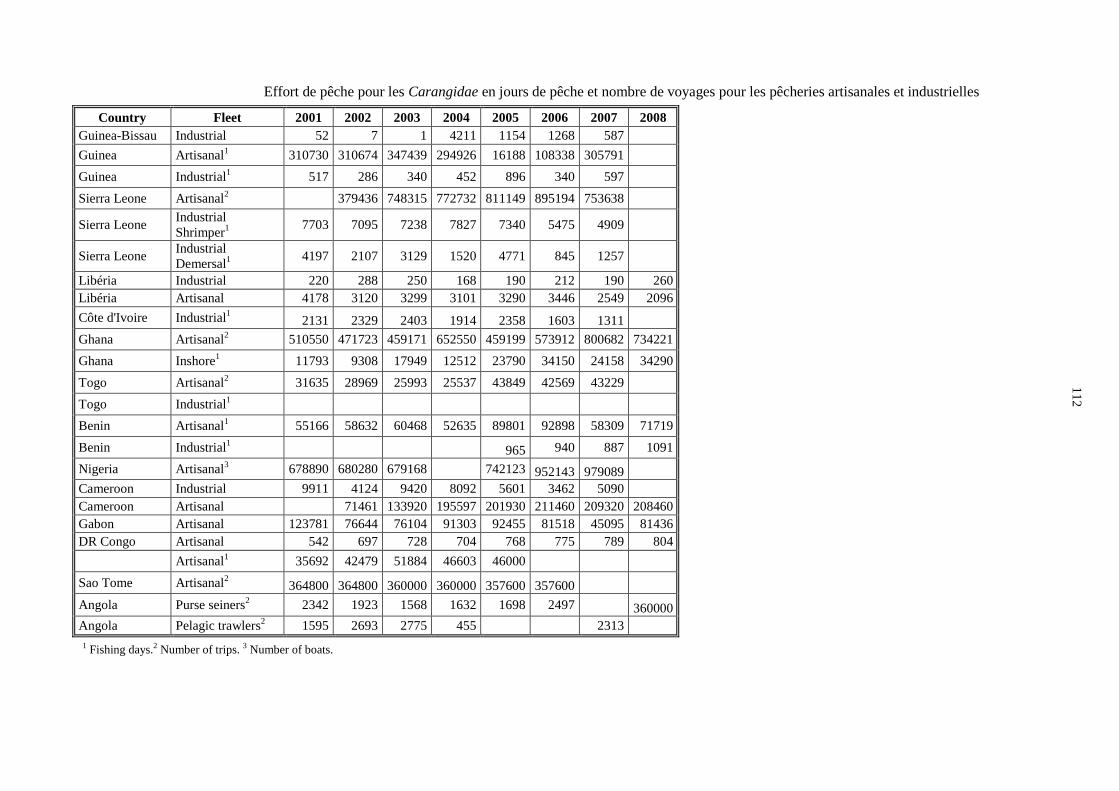
11
2
Effort de pêche pour les Carangidae en jours de pêche et nombre de voyages pour les pêcheries artisanales et industrielles
Country Fleet 2001 2002 2003 2004 2005 2006 2007 2008
Guinea-Bissau Industrial 52 7 1 4211 1154 1268 587
Guinea Artisanal1 310730 310674 347439 294926 16188 108338 305791
Guinea Industrial1 517 286 340 452 896 340 597
Sierra Leone Artisanal2 379436 748315 772732 811149 895194 753638
Sierra Leone Industrial
Shrimper1
7703 7095 7238 7827 7340 5475 4909
Sierra Leone Industrial
Demersal1
4197 2107 3129 1520 4771 845 1257
Libéria Industrial 220 288 250 168 190 212 190 260
Libéria Artisanal 4178 3120 3299 3101 3290 3446 2549 2096
Côte d'Ivoire Industrial1 2131 2329 2403 1914 2358 1603 1311
Ghana Artisanal2 510550 471723 459171 652550 459199 573912 800682 734221
Ghana Inshore1 11793 9308 17949 12512 23790 34150 24158 34290
Togo Artisanal2 31635 28969 25993 25537 43849 42569 43229
Togo Industrial1
Benin Artisanal1 55166 58632 60468 52635 89801 92898 58309 71719
Benin Industrial1 965 940 887 1091
Nigeria Artisanal3 678890 680280 679168 742123 952143 979089
Cameroon Industrial 9911 4124 9420 8092 5601 3462 5090
Cameroon Artisanal 71461 133920 195597 201930 211460 209320 208460
Gabon Artisanal 123781 76644 76104 91303 92455 81518 45095 81436
DR Congo Artisanal 542 697 728 704 768 775 789 804
Artisanal1 35692 42479 51884 46603 46000
Sao Tome Artisanal2 364800 364800 360000 360000 357600 357600
Angola Purse seiners2 2342 1923 1568 1632 1698 2497 360000
Angola Pelagic trawlers2 1595 2693 2775 455 2313
1 Fishing days.2 Number of trips. 3 Number of boats.

FIGURES

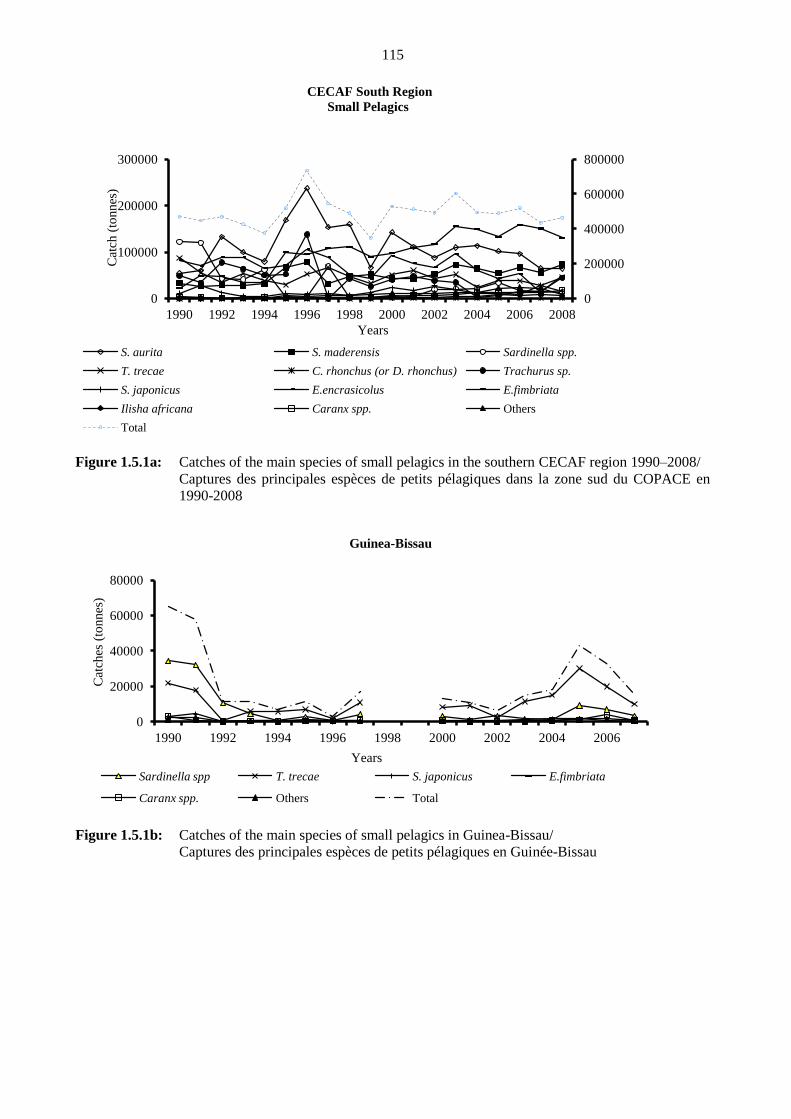
115
Figure 1.5.1a: Catches of the main species of small pelagics in the southern CECAF region 1990–2008/
Captures des principales espèces de petits pélagiques dans la zone sud du COPACE en
1990-2008
Figure 1.5.1b: Catches of the main species of small pelagics in Guinea-Bissau/
Captures des principales espèces de petits pélagiques en Guinée-Bissau
0
200000
400000
600000
800000
0
100000
200000
300000
1990 1992 1994 1996 1998 2000 2002 2004 2006 2008
Cat
ch (
tonnes
)
Years
CECAF South Region
Small Pelagics
S. aurita S. maderensis Sardinella spp.
T. trecae C. rhonchus (or D. rhonchus) Trachurus sp.
S. japonicus E.encrasicolus E.fimbriata
Ilisha africana Caranx spp. Others
Total
0
20000
40000
60000
80000
1990 1992 1994 1996 1998 2000 2002 2004 2006
Cat
ches
(to
nnes
)
Years
Guinea-Bissau
Sardinella spp T. trecae S. japonicus E.fimbriata
Caranx spp. Others Total
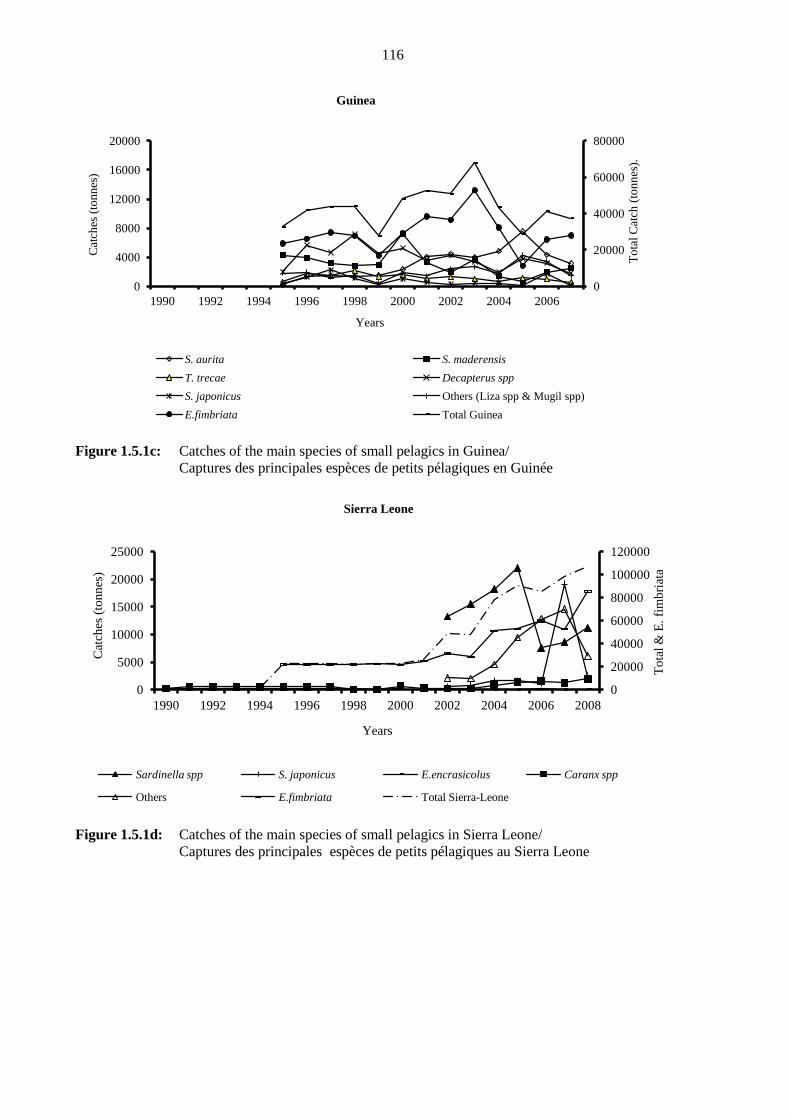
116
Figure 1.5.1c: Catches of the main species of small pelagics in Guinea/
Captures des principales espèces de petits pélagiques en Guinée
Figure 1.5.1d: Catches of the main species of small pelagics in Sierra Leone/
Captures des principales espèces de petits pélagiques au Sierra Leone
0
20000
40000
60000
80000
0
4000
8000
12000
16000
20000
1990 1992 1994 1996 1998 2000 2002 2004 2006
To
tal
Cat
ch (
ton
nes
).
Cat
ches
(to
nn
es)
Years
Guinea
S. aurita S. maderensis
T. trecae Decapterus spp
S. japonicus Others (Liza spp & Mugil spp)
E.fimbriata Total Guinea
0
20000
40000
60000
80000
100000
120000
0
5000
10000
15000
20000
25000
1990 1992 1994 1996 1998 2000 2002 2004 2006 2008
To
tal
& E
. fi
mb
riat
a
Cat
ches
(to
nn
es)
Years
Sierra Leone
Sardinella spp S. japonicus E.encrasicolus Caranx spp
Others E.fimbriata Total Sierra-Leone

117
Figure 1.5.1e: Catches of the main species of small pelagics in Liberia/
Captures des principales espèces de petits pélagiques au Libéria
Figure 1.5.1f: Catches of the main species of small pelagics in Côte d´Ivoire /
Captures des principales espèces de petits pélagiques en Côte d´Ivoire
0
500
1000
1500
2000
2500
3000
3500
0
500
1000
1500
1990 1992 1994 1996 1998 2000 2002 2004 2006 2008
To
tal &
Sa
rdin
ella
sp
p (
tonnes
)
Cat
ches
(to
nnes
)
Years
Liberia
T. trecae Decapterus spp S. japonicus
Ilisha africana Sardinella spp Total Liberia
0
10000
20000
30000
40000
0
1000
2000
3000
4000
5000
1990 1992 1994 1996 1998 2000 2002 2004 2006
To
tal &
S. au
rita
(to
nnes
)
Cat
ches
(to
nnes
)
Years
Cote d'Ivoire
S. maderensis T. trecae S. japonicus
E.fimbriata Ilisha africana Caranx spp
Other Carangidae Others S. aurita
Total

118
Figure 1.5.1g: Catches of the main species of small pelagics in Ghana/
Captures des principales espèces de petits pélagiques au Ghana
Figure 1.5.1h: Catches of the main species of small pelagics in Togo/
Captures des principales espèces de petits pélagiques au Togo
0
50000
100000
150000
200000
250000
0
20000
40000
60000
80000
100000
1990 1992 1994 1996 1998 2000 2002 2004 2006 2008
To
tal a
nd
S. a
uri
ta (
tonnes
)
Cat
ches
(to
nnes
)
Years
Ghana
S. maderensis T. trecae C. rhonchus (or D. rhoncus)
S. japonicus E.encrasicolus E.fimbriata
Ilisha africana Caranx spp. S. aurita
Total
0
5000
10000
15000
20000
0
2500
5000
7500
10000
1990 1992 1994 1996 1998 2000 2002 2004 2006 2008
To
tal
& E
.en
cra
sico
lus
(to
nnes
)
Cat
ches
(to
nnes
)
Years
Togo
S. aurita S. maderensis T. trecae S. japonicus
Ilisha africana Caranx spp E.encrasicolus Total

119
Figure 1.5.1i: Catches of the main species of small pelagics in Benin/
Captures des principales espèces de petits pélagiques au Bénin
Figure 1.5.1j: Catches of the main species of small pelagics in Nigeria/
Captures des principales espèces de petits pélagiques au Nigéria
0
2000
4000
6000
8000
0
500
1000
1500
2000
2500
1990 1992 1994 1996 1998 2000 2002 2004 2006 2008
To
tal
(to
nnes
)
Cat
ches
(to
nnes
)
Years
Benin
S. aurita S. maderensis T. trecae E.encrasicolus
E.fimbriata Ilisha africana Caranx spp Total
0
30000
60000
90000
120000
150000
0
8000
16000
24000
32000
40000
1990 1992 1994 1996 1998 2000 2002 2004 2006
To
tal
and
S. m
ad
eren
sis
(to
nn
es)
Cat
ches
(to
nn
es)
Years
Nigeria
S. maderensis T. trecae
E.fimbriata Ilisha africana
Other Carangidae Others (Tuna-like and Mackerel-like)
S. aurita Total
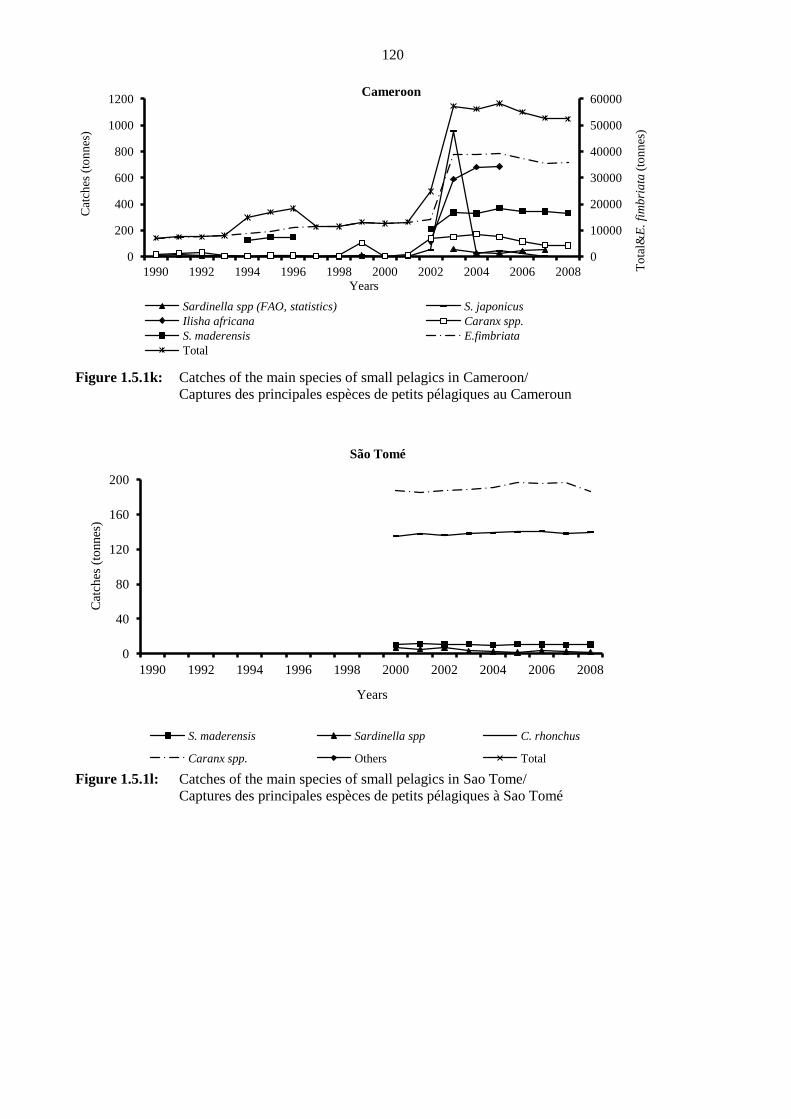
120
Figure 1.5.1k: Catches of the main species of small pelagics in Cameroon/
Captures des principales espèces de petits pélagiques au Cameroun
Figure 1.5.1l: Catches of the main species of small pelagics in Sao Tome/
Captures des principales espèces de petits pélagiques à Sao Tomé
0
10000
20000
30000
40000
50000
60000
0
200
400
600
800
1000
1200
1990 1992 1994 1996 1998 2000 2002 2004 2006 2008 To
tal&
E.
fim
bri
ata
(to
nn
es)
Cat
ches
(to
nn
es)
Years
Cameroon
Sardinella spp (FAO, statistics) S. japonicus
Ilisha africana Caranx spp.
S. maderensis E.fimbriata
Total
0
40
80
120
160
200
1990 1992 1994 1996 1998 2000 2002 2004 2006 2008
Cat
ches
(to
nnes
)
Years
São Tomé
S. maderensis Sardinella spp C. rhonchus
Caranx spp. Others Total

121
Figure 1.5.1m: Catches of the main species of small pelagics in Gabon/
Captures des principales espèces de petits pélagiques au Gabon
Figure 1.5.1n: Catches of the main species of small pelagics in Congo/
Captures des principales espèces de petits pélagiques au Congo
0
100
200
300
400
500
600
0
5000
10000
15000
20000
25000
1990 1992 1994 1996 1998 2000 2002 2004 2006 2008
Cat
ches
(to
nn
es)
Years
Gabon
Sardinella spp* E.fimbriata Others
Total T. trecae Scomber japonicus
Caranx spp.
0
4000
8000
12000
16000
1990 1992 1994 1996 1998 2000 2002 2004
Cat
ches
(to
nnes
)
Years
Congo
S. aurita S. maderensis T. trecae
S. japonicus E.encrasicolus E.fimbriata
Other Carangidae Others Total Congo
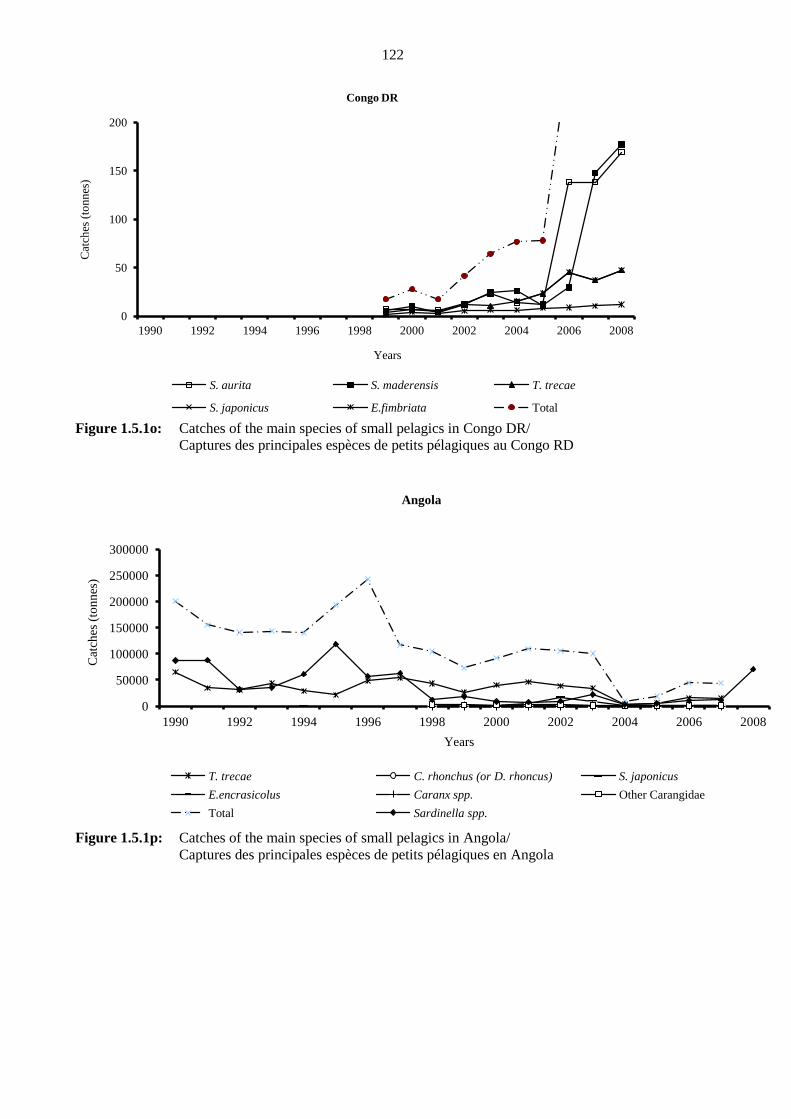
122
Figure 1.5.1o: Catches of the main species of small pelagics in Congo DR/
Captures des principales espèces de petits pélagiques au Congo RD
Figure 1.5.1p: Catches of the main species of small pelagics in Angola/
Captures des principales espèces de petits pélagiques en Angola
0
50
100
150
200
1990 1992 1994 1996 1998 2000 2002 2004 2006 2008
Cat
ches
(to
nn
es)
Years
Congo DR
S. aurita S. maderensis T. trecae
S. japonicus E.fimbriata Total
0
50000
100000
150000
200000
250000
300000
1990 1992 1994 1996 1998 2000 2002 2004 2006 2008
Cat
ches
(to
nn
es)
Years
Angola
T. trecae C. rhonchus (or D. rhoncus) S. japonicus
E.encrasicolus Caranx spp. Other Carangidae
Total Sardinella spp.

123
Figure 1.6.1a: Evolution of biomass (in tonnes) of main pelagic groups estimated by
R/V DR. FRIDTJOF NANSEN during the period 2006–2007. Western Gulf of Guinea
(Guinea-Bissau, Guinea, Sierra-Leone and Liberia)/Évolution de la biomasse (en tonnes)
des principaux groupes pélagiques estimée par le N/R DR. FRIDTJOF NANSEN pendant
la période 2006-2007. Golfe de Guinée Ouest (Guinée-Bissau, Guinée, Sierra-Leone et
Libéria)
Figure 1.6.1b: Evolution of biomass (in tonnes) of main pelagic groups estimated by
R/V DR. FRIDTJOF NANSEN during the period 1999–2006 (Western Gulf of Guinea:
Côte d'Ivoire, Ghana, Togo and Benin)/Évolution de la biomasse (en tonnes) des
principaux groupes pélagiques estimée par le N/R DR. FRIDTJOF NANSEN pendant la
période 1999-2006 (Golfe de Guinée Ouest: Côte d'Ivoire, Ghana, Togo et Bénin)
0
500000
1000000
1500000
2000000
2500000
3000000
2006/4-5 2007/5
Bio
mas
s (t
on
nes
) Acoustic Surveys R/V DR. FRIDTJOF NANSEN
Guinea-Bissau, Guinea, Sierra Leone and Liberia
Sardinella spp
Engraulis encrasicolis
Pel II (carangids, scombrids, barracudas and hairtail)
0
50000
100000
150000
200000
250000
300000
1999*/4-5 2000/9 2001 2002/7-8 2003 2004/5-6 2005/5 2006/5-6 2007/6
Bio
mas
s (t
on
nes
)
Acoustic Surveys R/V DR. FRIDTJOF NANSEN
Côte d'Ivoire, Ghana, Togo and Benin
Sardinella spp Engraulis encrasicolis Pel II

124
Figure 1.6.1.c: Evolution of biomass (in tonnes) of main pelagic groups estimated by
R/V DR. FRIDTJOF NANSEN during the period 2004–2006 (Central Gulf of Guinea:
Cameroon and Nigeria)/Évolution de la biomasse (en tonnes) des principaux groupes
pélagiques estimée par le N/R DR. FRIDTJOF NANSEN pendant la période 2004-2006
(Golfe de Guinée Centre: Cameroun et Nigéria)
Figure 1.6.1.d: Evolution of biomass (in thousand tonnes) of main pelagic groups estimated by R/V DR.
FRIDTJOF NANSEN during the period 2004–2008 (Congo and Gabon)/Évolution de la
biomasse (en milliers de tonnes) des principaux groupes pélagiques estimée par le
N/R DR. FRIDTJOF NANSEN pendant la période 2004-2008 (Congo et Gabon)
0
50000
100000
150000
200000
250000
2004/6-7 2005/6 2006/6 2007/6
Bio
mas
s (t
on
nes
) Acoustic Surveys R/V DR. FRIDTJOF NANSEN
Nigeria and Cameroon
Sardinella spp
Pel I (mainly clupeids)
Pel II(carangids, scombrids, barracudas and hairtail)
0
100000
200000
300000
400000
500000
2004/6-7 2005/6 2006/6 2007/6 2008/5
Bio
mas
s (t
ho
usa
nd
to
nn
es)
Acoustic Surveys R/V DR. FRIDTJOF NANSEN
Congo and Gabon
Sardinella spp
Trachurus trecae
Pel II(carangids, scombrids, barracudas and hairtail)
Pel I (Other clupeide)
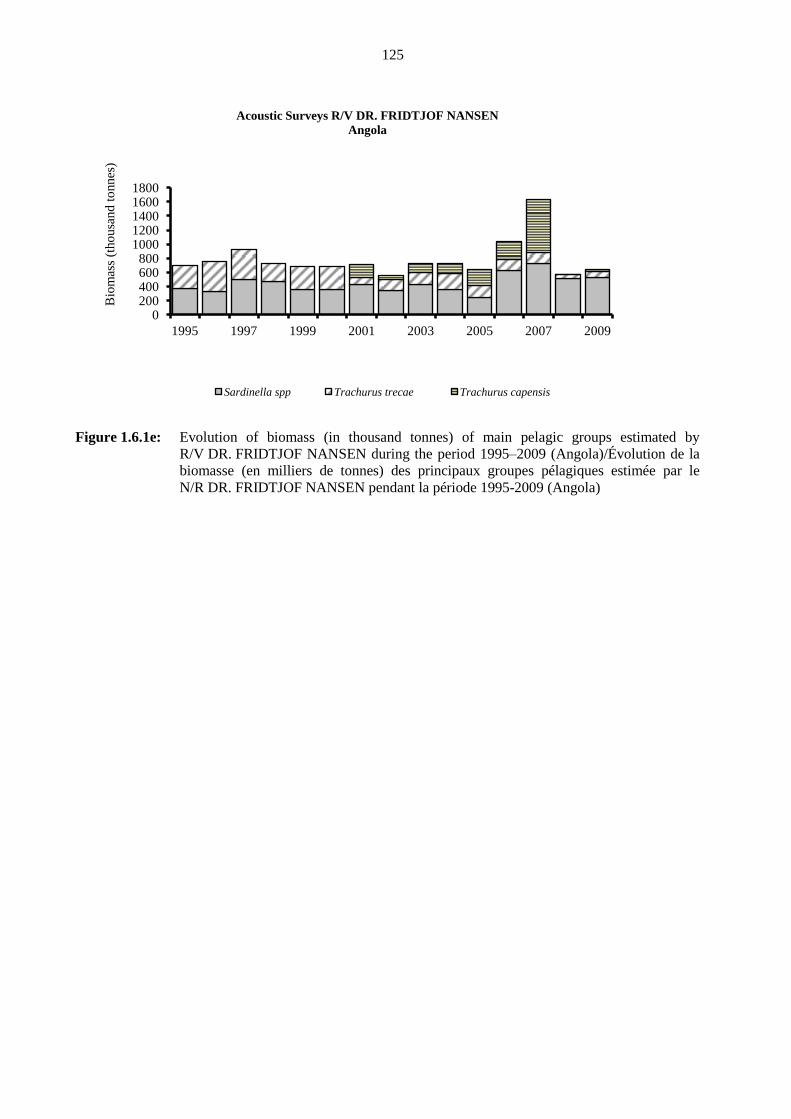
125
Figure 1.6.1e: Evolution of biomass (in thousand tonnes) of main pelagic groups estimated by
R/V DR. FRIDTJOF NANSEN during the period 1995–2009 (Angola)/Évolution de la
biomasse (en milliers de tonnes) des principaux groupes pélagiques estimée par le
N/R DR. FRIDTJOF NANSEN pendant la période 1995-2009 (Angola)
0 200 400 600 800
1000 1200 1400 1600 1800
1995 1997 1999 2001 2003 2005 2007 2009
Bio
mas
s (t
ho
usa
nd
to
nnes
) Acoustic Surveys R/V DR. FRIDTJOF NANSEN
Angola
Sardinella spp Trachurus trecae Trachurus capensis
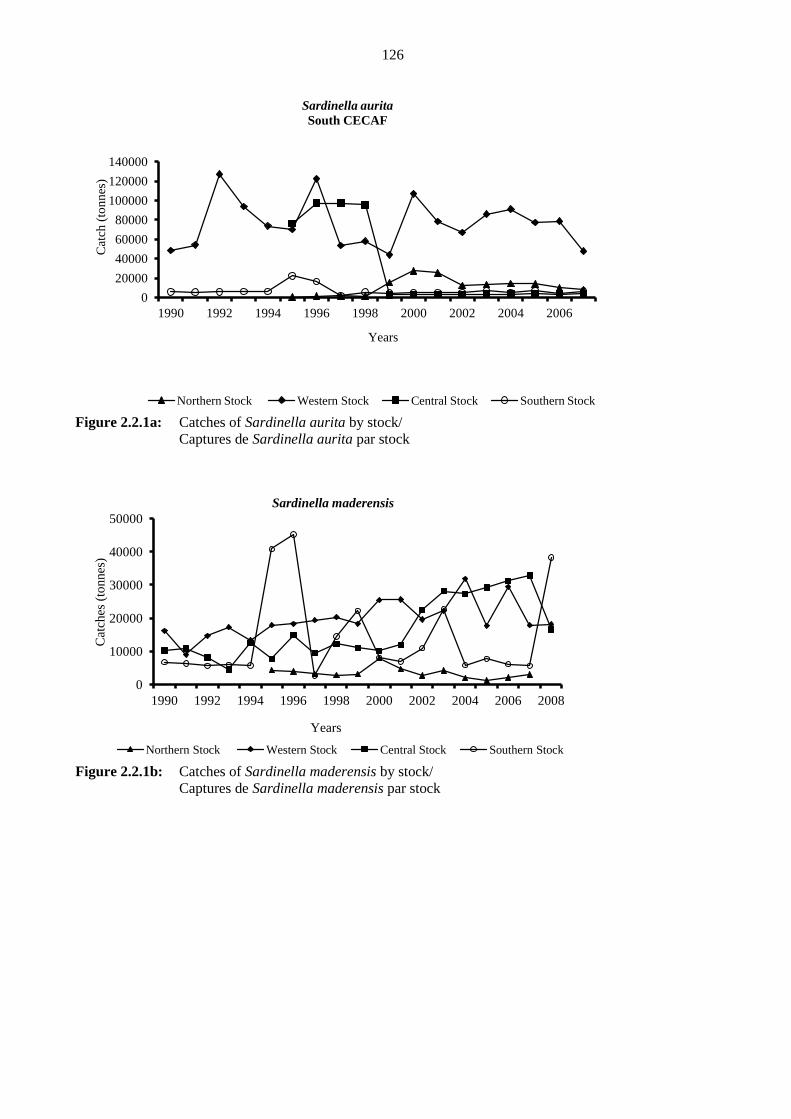
126
Figure 2.2.1a: Catches of Sardinella aurita by stock/
Captures de Sardinella aurita par stock
Figure 2.2.1b: Catches of Sardinella maderensis by stock/
Captures de Sardinella maderensis par stock
0
20000
40000
60000
80000
100000
120000
140000
1990 1992 1994 1996 1998 2000 2002 2004 2006
Cat
ch (
ton
nes
)
Years
Sardinella aurita
South CECAF
Northern Stock Western Stock Central Stock Southern Stock
0
10000
20000
30000
40000
50000
1990 1992 1994 1996 1998 2000 2002 2004 2006 2008
Cat
ches
(to
nnes
)
Years
Sardinella maderensis
Northern Stock Western Stock Central Stock Southern Stock
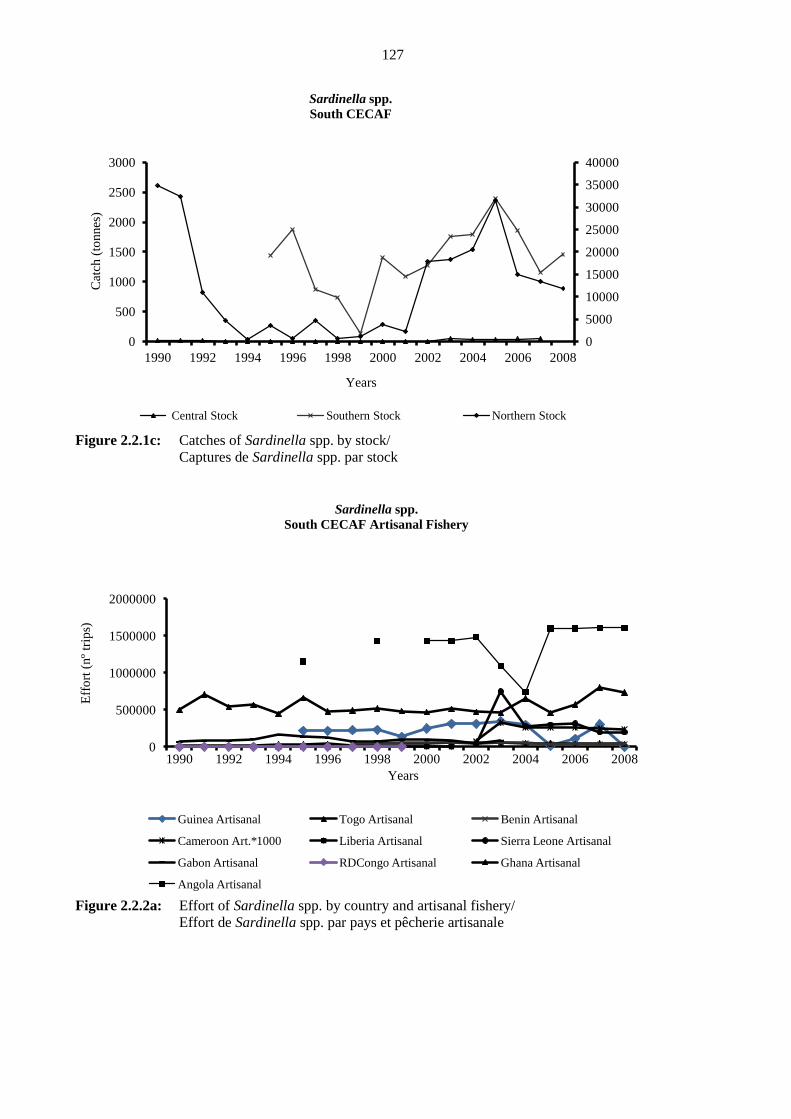
127
Figure 2.2.1c: Catches of Sardinella spp. by stock/
Captures de Sardinella spp. par stock
Figure 2.2.2a: Effort of Sardinella spp. by country and artisanal fishery/
Effort de Sardinella spp. par pays et pêcherie artisanale
0
5000
10000
15000
20000
25000
30000
35000
40000
0
500
1000
1500
2000
2500
3000
1990 1992 1994 1996 1998 2000 2002 2004 2006 2008
Cat
ch (
tonnes
)
Years
Sardinella spp.
South CECAF
Central Stock Southern Stock Northern Stock
0
500000
1000000
1500000
2000000
1990 1992 1994 1996 1998 2000 2002 2004 2006 2008
Eff
ort
(nº
trip
s)
Years
Sardinella spp.
South CECAF Artisanal Fishery
Guinea Artisanal Togo Artisanal Benin Artisanal
Cameroon Art.*1000 Liberia Artisanal Sierra Leone Artisanal
Gabon Artisanal RDCongo Artisanal Ghana Artisanal
Angola Artisanal
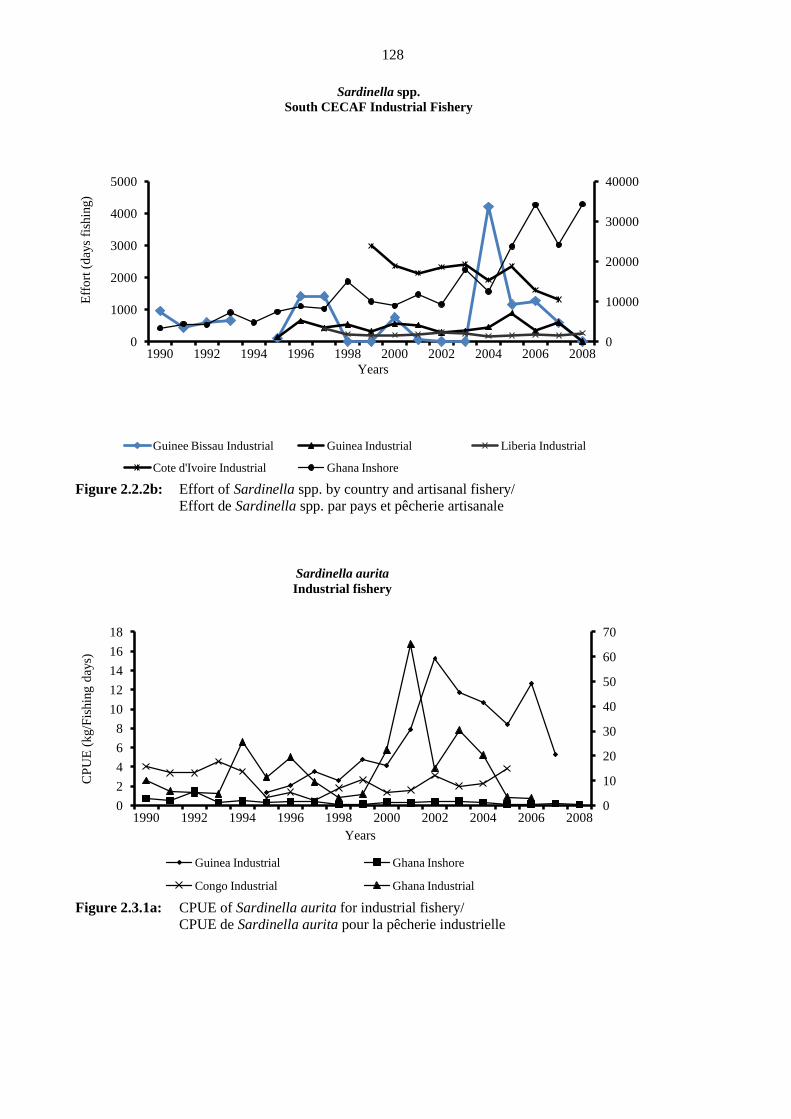
128
Figure 2.2.2b: Effort of Sardinella spp. by country and artisanal fishery/
Effort de Sardinella spp. par pays et pêcherie artisanale
Figure 2.3.1a: CPUE of Sardinella aurita for industrial fishery/
CPUE de Sardinella aurita pour la pêcherie industrielle
0
10000
20000
30000
40000
0
1000
2000
3000
4000
5000
1990 1992 1994 1996 1998 2000 2002 2004 2006 2008
Eff
ort
(d
ays
fish
ing)
Years
Sardinella spp.
South CECAF Industrial Fishery
Guinee Bissau Industrial Guinea Industrial Liberia Industrial
Cote d'Ivoire Industrial Ghana Inshore
0
10
20
30
40
50
60
70
0
2
4
6
8
10
12
14
16
18
1990 1992 1994 1996 1998 2000 2002 2004 2006 2008
CP
UE
(kg/F
ishin
g d
ays)
Years
Sardinella aurita
Industrial fishery
Guinea Industrial Ghana Inshore
Congo Industrial Ghana Industrial

129
Figure 2.3.1b: CPUE of Sardinella aurita for artisanal fishery/
CPUE de Sardinella aurita pour la pêcherie artisanale
Figure 2.3.1c: CPUE of Sardinella maderensis for industrial fishery/
CPUE de Sardinella maderensis pour la pêcherie industrielle
0.00
0.05
0.10
0.15
0.20
0.25
0.00
0.05
0.10
0.15
0.20
0.25
0.30
1990 1992 1994 1996 1998 2000 2002 2004 2006 2008
CP
UE
(kg/t
rip
)
Years
Sardinella aurita
Artisanal fishery
Ghana Artisanal Togo Artisanal Congo Artisanal
Congo DR Artisanal Benin Artisanal
0
2
4
6
8
10
12
14
0
1
2
3
4
5
6
1990 1992 1994 1996 1998 2000 2002 2004 2006 2008
CP
UE
(kg/F
ishin
g d
ays)
Years
Sardinella maderensis
Industrial fishery
Cote d'Ivoire Industrial Ghana Inshore Angola Industrial Ghana Industrial

130
Figure 2.3.1d: CPUE of Sardinella maderensis for artisanal fishery/
CPUE de Sardinella maderensis pour la pêcherie artisanale
Figure 2.3.1e: CPUE of Sardinella spp. for industrial fishery/
CPUE de Sardinella spp. pour la pêcherie industrielle
0.00
0.01
0.01
0.02
0.02
0.03
0.03
0.04
0.04
0.05
1990 1992 1994 1996 1998 2000 2002 2004 2006 2008
CP
UE
(kg/t
rip
)
Years
Sardinella maderensis
Artisanal fishery
Guinea Artisanal Ghana Artisanal Benin Artisanal Togo Artisanal
0.00
0.50
1.00
1.50
2.00
2.50
0
200
400
600
800
1000
1200
1400
1600
1800
1990 1992 1994 1996 1998 2000 2002 2004 2006 2008
CP
UE
(kg/F
ishin
g d
ays)
Years
Sardinella spp.
Industrial fishery
Guinee Bissau Industrial Ghana Inshore

131
Figure 2.3.1f: CPUE of Sardinella spp. for artisanal fishery/
CPUE de Sardinella spp. pour la pêcherie artisanale
0.00
0.10
0.20
0.30
0.40
0.50
0.60
0.00
0.20
0.40
0.60
0.80
1.00
1.20
1.40
1.60
1.80
2.00
1990 1992 1994 1996 1998 2000 2002 2004 2006 2008
CP
UE
(kg/F
ishin
g d
ays)
Years
Sardinella spp.
Artisanal fishery
Serra Leone Artisanal Liberia Artisanal

132
Figure 2.3.2a: Biomass estimates of Sardinella spp. for Northern stock (Guinea-Bissau, Guinea, Sierra
Leone and Liberia) for R/V DR. F. NANSEN and for R/V ITAF DEME (Sierra Leone
only)/Estimations de la biomasse de Sardinella spp. pour le stock nord (Guinée-Bissau,
Guinée, Sierra Leone et Libéria) pour le N/R DR. F. NANSEN et pour le N/R ITAF
DEME (Sierra Leone seulement)
0
400
800
1200
1600
1995 1997 1999 2001 2003 2005 2007/5
Bio
mas
s (t
ho
usa
nd
to
nn
es)
Acoustic Surveys R/V DR. FRIDTJOF NANSEN
Sardinella spp.
Guinea-Bissau, Guinea, Sierra Leone, Liberia
0
50
100
150
200
250
300
2008/5 2009/5
Bio
mas
s (t
ho
usa
nd
to
nn
es)
Acoustic Surveys R/V ITAF DEME
Sierra Leone
S. aurita
S.maderensis
Pel II (mainly Chloroscombrus chrysurus)
Horsemackerel (Trachurus trecae and Decapterus rhonchus)

133
Figure 2.3.2b: Biomass estimates of Sardinella spp. (Western stock: Côte d'Ivoire, Ghana, Togo and
Benin) for R/V DR. F. NANSEN/Estimations de la biomasse de Sardinella spp. (Stock
ouest: Côte d'Ivoire, Ghana, Togo et Bénin) pour le N/R DR. F. NANSEN
Figure 2.3.2c: Biomass estimates of Sardinella spp. (Central stock: Nigeria and Cameroon) for
R/V DR. F. NANSEN/Estimations de la biomasse de Sardinella spp. (Stock central:
Nigéria et Cameroun) pour le N/R DR. F. NANSEN
0
40
80
120
160
1995 1997 1999/4-5 2001 2003 2005/5 2007 2009
Bio
mas
s (t
ho
usa
nd
to
nn
es)
Acoustic Surveys R/V DR. FRIDTJOF NANSEN
Sardinella spp.
Stock West- Côte d'Ivoire, Ghana, Togo and Benin
0
4
8
12
1995 1997 1999 2001 2003 2005/6 2007/7 2009
Bio
mas
s (t
ho
usa
nd
to
nn
es)
Acoustic Surveys R/V DR. FRIDTJOF NANSEN
Sardinella spp.
Central Stock-Nigeria and Cameroon

134
Figure 2.3.2d: Biomass estimates of Sardinella spp. (Southern stock: Angola, Congo and Gabon) for
R/V DR. F. NANSEN/Estimations de la biomasse de Sardinella spp. (Stock sud:
Angola, Congo et Gabon) pour le N/R DR. F. NANSEN
Figure 2.3.2e: Biomass estimates of Sardinella spp. (Southern stock: Angola, Congo and Gabon) for
R/V DR. F. NANSEN/Estimations de la biomasse de Sardinella spp. (Stock sud: Angola,
Congo et Gabon) pour le N/R DR. F. NANSEN
0
200
400
600
800
1995 1997 1999 2001 2003 2005 2007 2009
Bio
mas
s (t
ho
usa
nd
to
nn
es)
Acoustic Surveys R/V DR. FRIDTJOF NANSEN
Sardinella spp. Angola, Congo, Gabon
Sardinella spp (A) Sardinella spp (C+G )
0
400
800
1200
2004 2005 2006 2007 2008 2009
Bio
mas
s (t
ho
usa
nd
to
nnes
)
Acoustic Surveys R/V DR. FRIDTJOF NANSEN
Stock south-Sardinella spp. Angola, Congo, Gabon
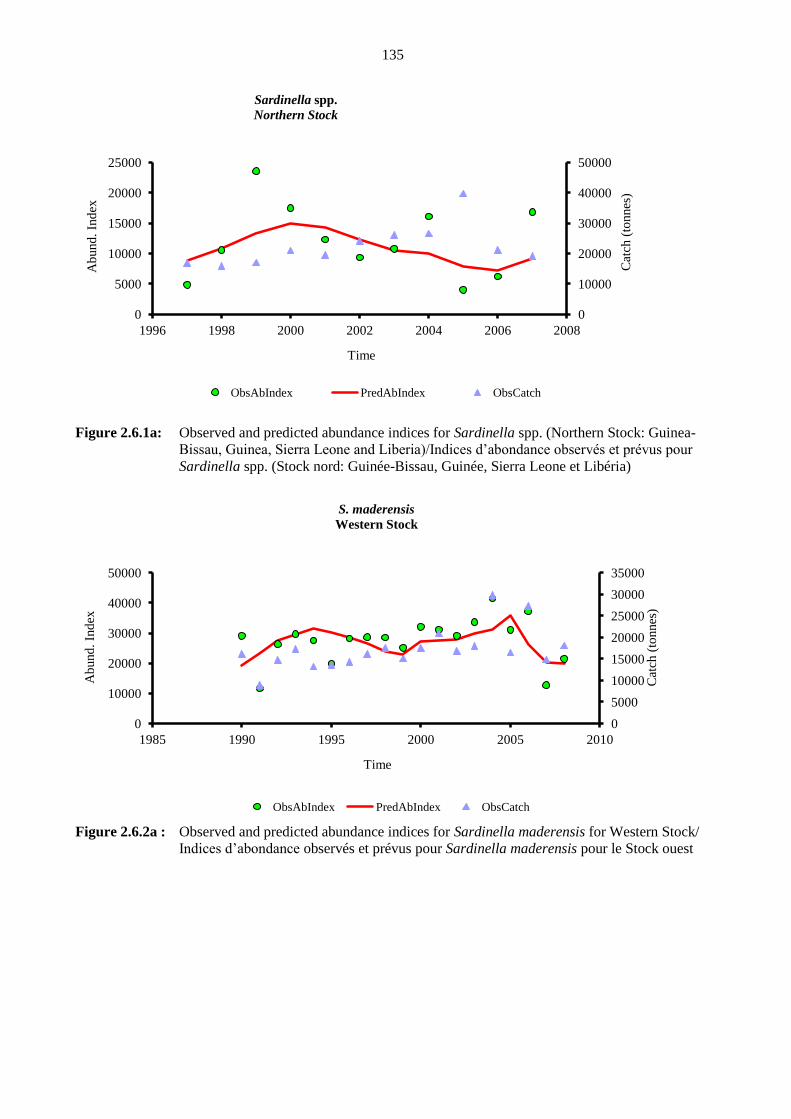
135
Figure 2.6.1a: Observed and predicted abundance indices for Sardinella spp. (Northern Stock: Guinea-
Bissau, Guinea, Sierra Leone and Liberia)/Indices d’abondance observés et prévus pour
Sardinella spp. (Stock nord: Guinée-Bissau, Guinée, Sierra Leone et Libéria)
Figure 2.6.2a : Observed and predicted abundance indices for Sardinella maderensis for Western Stock/
Indices d’abondance observés et prévus pour Sardinella maderensis pour le Stock ouest
0
10000
20000
30000
40000
50000
0
5000
10000
15000
20000
25000
1996 1998 2000 2002 2004 2006 2008
Cat
ch (
tonnes
)
Ab
und
. In
dex
Time
Sardinella spp.
Northern Stock
ObsAbIndex PredAbIndex ObsCatch
0
5000
10000
15000
20000
25000
30000
35000
0
10000
20000
30000
40000
50000
1985 1990 1995 2000 2005 2010
Cat
ch (
tonnes
)
Ab
und
. In
dex
Time
S. maderensis
Western Stock
ObsAbIndex PredAbIndex ObsCatch
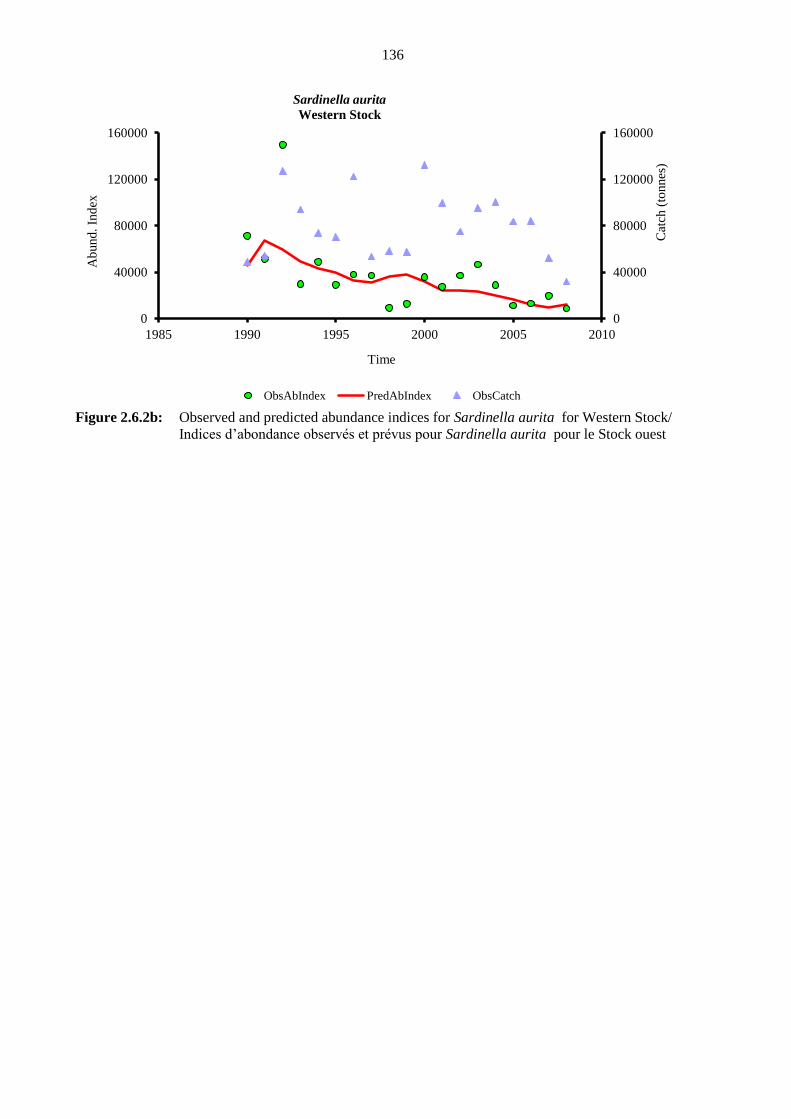
136
Figure 2.6.2b: Observed and predicted abundance indices for Sardinella aurita for Western Stock/
Indices d’abondance observés et prévus pour Sardinella aurita pour le Stock ouest
0
40000
80000
120000
160000
0
40000
80000
120000
160000
1985 1990 1995 2000 2005 2010
Cat
ch (
tonnes
)
Ab
und
. In
dex
Time
Sardinella aurita
Western Stock
ObsAbIndex PredAbIndex ObsCatch

137
Figure 3.2.1: Regional catches of E. fimbriata in the north (Guinea and Sierra Leone), west (Ghana and
Benin), central (Nigeria and Cameroun) and south (Congo)/Captures régionales de
E. fimbriata au nord (Guinée et Sierra Leone), à l’ouest (Ghana et Bénin), au centre
(Nigéria et Cameroun) et au sud (Congo)
Figure 3.2.2: Fishing effort for E. fimbriata in number of fishing days for Guinea, Sierra Leone, Ghana,
Benin, Cameroun and Congo, in number of fishing trips for Sierra Leone and Ghana
artisanal/Effort de pêche pour E. fimbriata en nombre de jours de pêche pour la Guinée, le
Sierra Leone, le Ghana, le Bénin, le Cameroun et le Congo, et en nombre de sorties de
pêche pour le Sierra Leone et le Ghana artisanal
0
20000
40000
60000
80000
100000
1990 1992 1994 1996 1998 2000 2002 2004 2006 2008
Cat
ches
(to
nnes
) Ethmalosa fimbriata
CECAF Total subregion
Northern Stock Central Stock Western Stock Southern Stock
0
200000
400000
600000
800000
1000000
1200000
1990 1992 1994 1996 1998 2000 2002 2004 2006 2008
Eff
ort
Years
Ethmalosa fimbriata
CECAF Total subregion
Guinea_Art Sierra Leone_Ind Ghana_Art Benin_Art Cameroun_Art Congo_Art Sierra Leone_Art. Liberia_Ind Liberia_Art Gabon RDCongo Guiné-Bissau
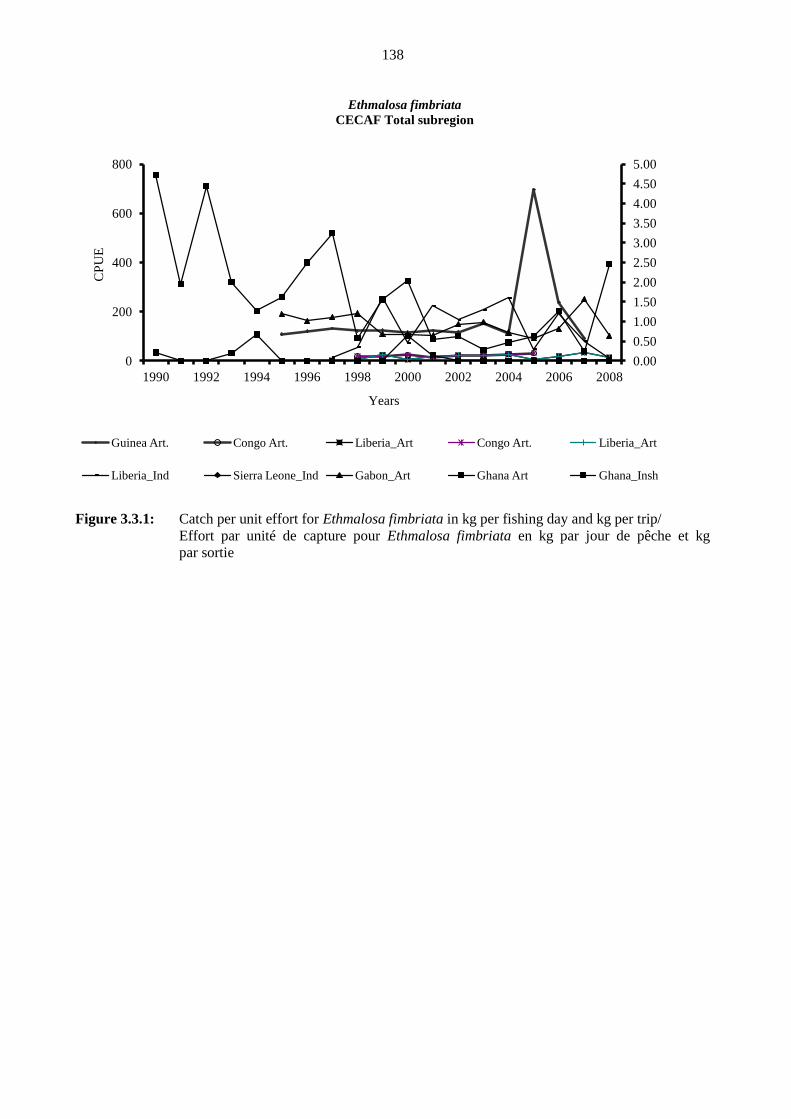
138
Figure 3.3.1: Catch per unit effort for Ethmalosa fimbriata in kg per fishing day and kg per trip/
Effort par unité de capture pour Ethmalosa fimbriata en kg par jour de pêche et kg
par sortie
0.00
0.50
1.00
1.50
2.00
2.50
3.00
3.50
4.00
4.50
5.00
0
200
400
600
800
1990 1992 1994 1996 1998 2000 2002 2004 2006 2008
CP
UE
Years
Ethmalosa fimbriata
CECAF Total subregion
Guinea Art. Congo Art. Liberia_Art Congo Art. Liberia_Art
Liberia_Ind Sierra Leone_Ind Gabon_Art Ghana Art Ghana_Insh
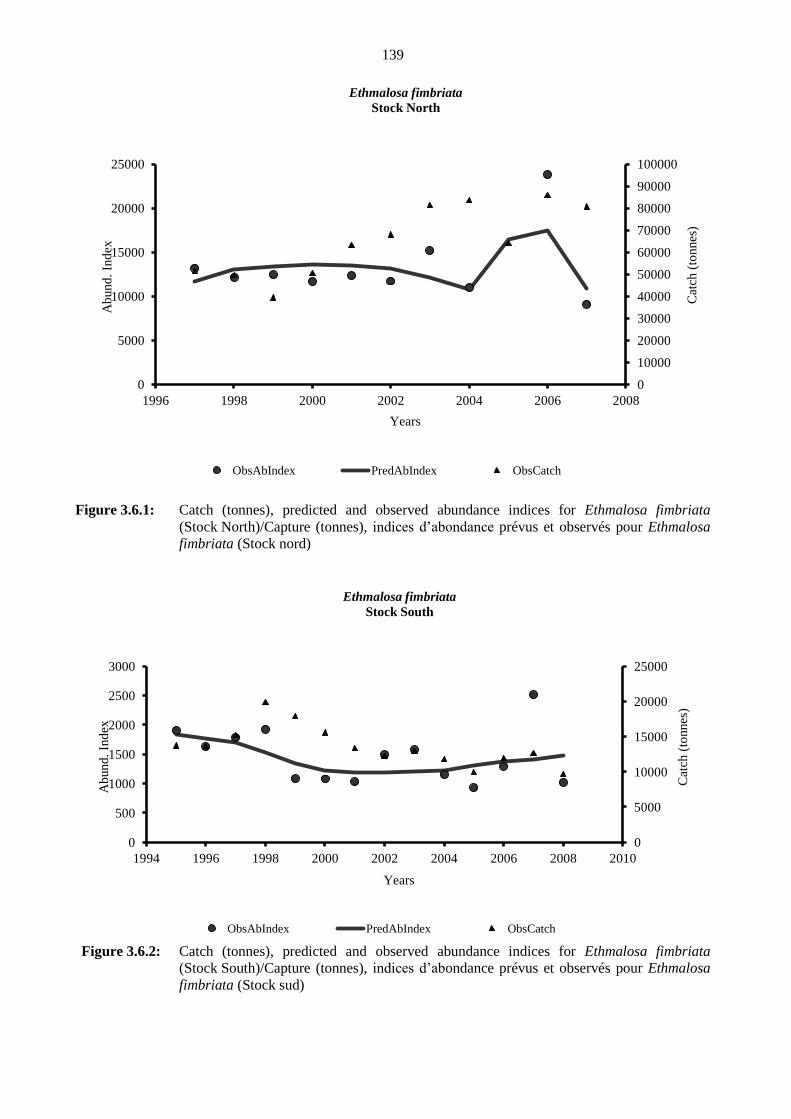
139
Figure 3.6.1: Catch (tonnes), predicted and observed abundance indices for Ethmalosa fimbriata
(Stock North)/Capture (tonnes), indices d’abondance prévus et observés pour Ethmalosa
fimbriata (Stock nord)
Figure 3.6.2: Catch (tonnes), predicted and observed abundance indices for Ethmalosa fimbriata
(Stock South)/Capture (tonnes), indices d’abondance prévus et observés pour Ethmalosa
fimbriata (Stock sud)
0
10000
20000
30000
40000
50000
60000
70000
80000
90000
100000
0
5000
10000
15000
20000
25000
1996 1998 2000 2002 2004 2006 2008
Cat
ch (
tonnes
)
Ab
und
. In
dex
Years
Ethmalosa fimbriata
Stock North
ObsAbIndex PredAbIndex ObsCatch
0
5000
10000
15000
20000
25000
0
500
1000
1500
2000
2500
3000
1994 1996 1998 2000 2002 2004 2006 2008 2010
Cat
ch (
tonnes
)
Ab
und
. In
dex
Years
Ethmalosa fimbriata
Stock South
ObsAbIndex PredAbIndex ObsCatch
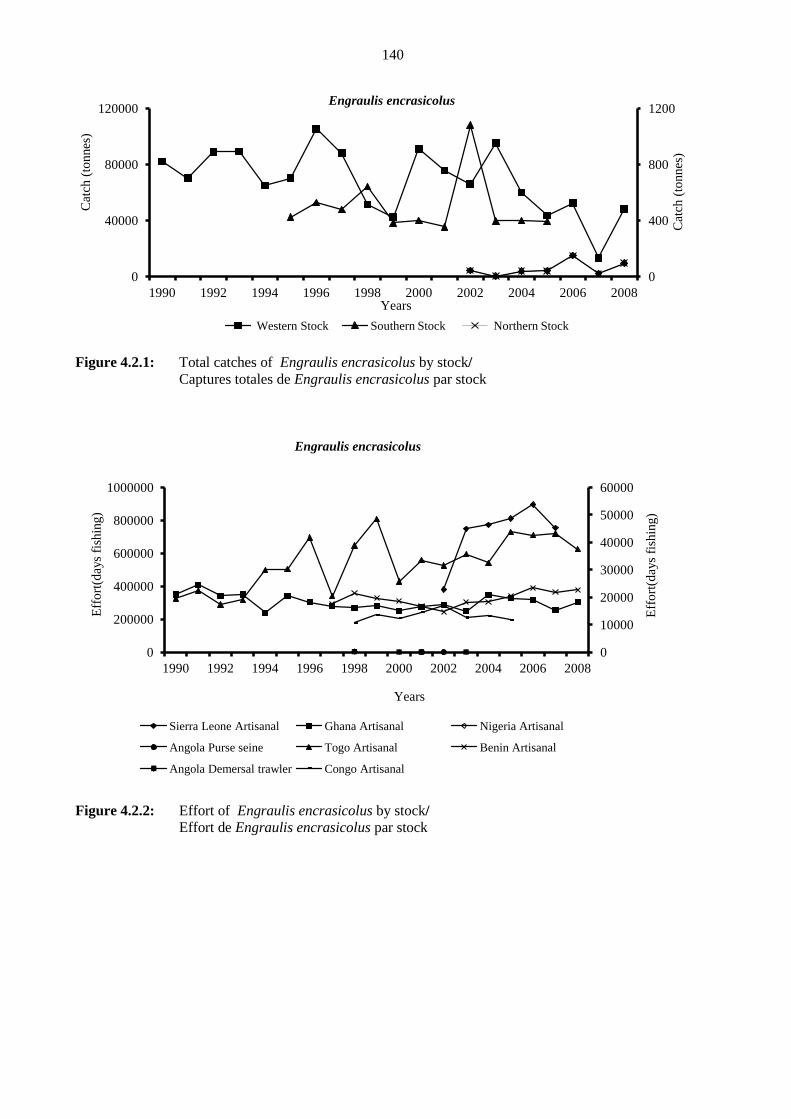
140
Figure 4.2.1: Total catches of Engraulis encrasicolus by stock/
Captures totales de Engraulis encrasicolus par stock
Figure 4.2.2: Effort of Engraulis encrasicolus by stock/
Effort de Engraulis encrasicolus par stock
0
400
800
1200
0
40000
80000
120000
1990 1992 1994 1996 1998 2000 2002 2004 2006 2008
Cat
ch (
tonnes
)
Cat
ch (
tonnes
)
Years
Engraulis encrasicolus
Western Stock Southern Stock Northern Stock
0
10000
20000
30000
40000
50000
60000
0
200000
400000
600000
800000
1000000
1990 1992 1994 1996 1998 2000 2002 2004 2006 2008
Eff
ort
(day
s fi
shin
g)
Eff
ort
(day
s fi
shin
g)
Years
Engraulis encrasicolus
Sierra Leone Artisanal Ghana Artisanal Nigeria Artisanal
Angola Purse seine Togo Artisanal Benin Artisanal
Angola Demersal trawler Congo Artisanal
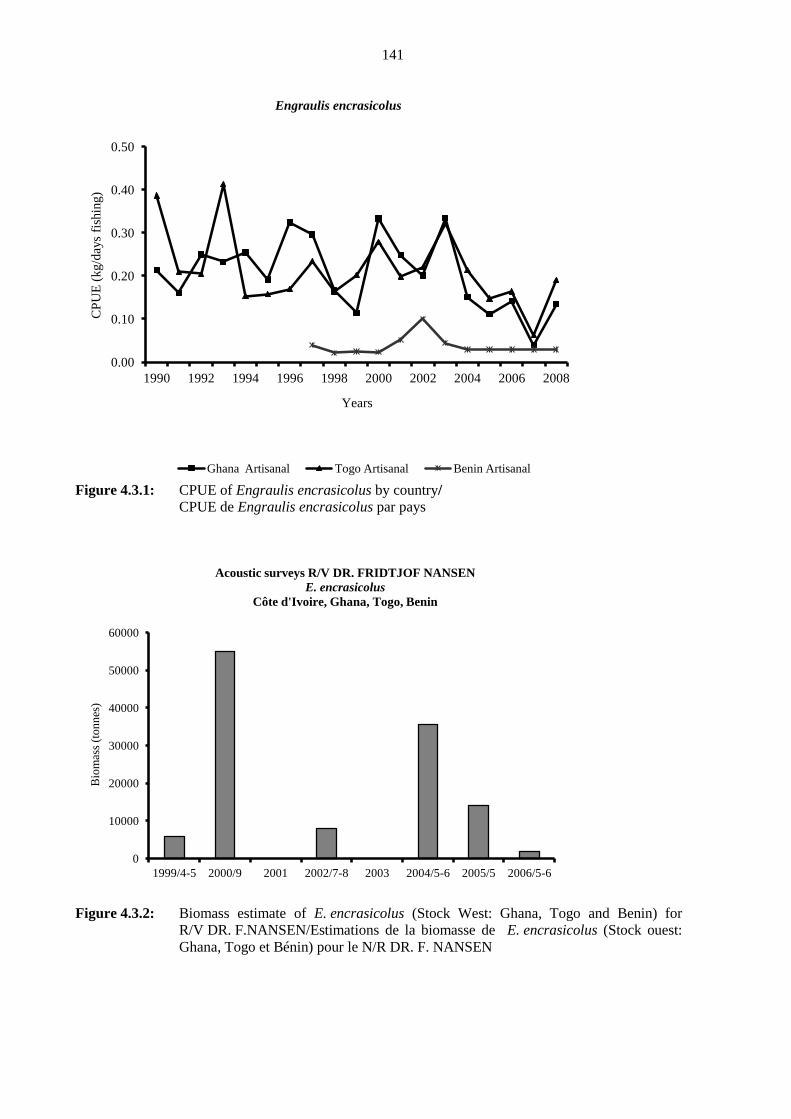
141
Figure 4.3.1: CPUE of Engraulis encrasicolus by country/
CPUE de Engraulis encrasicolus par pays
Figure 4.3.2: Biomass estimate of E. encrasicolus (Stock West: Ghana, Togo and Benin) for
R/V DR. F.NANSEN/Estimations de la biomasse de E. encrasicolus (Stock ouest:
Ghana, Togo et Bénin) pour le N/R DR. F. NANSEN
0.00
0.10
0.20
0.30
0.40
0.50
1990 1992 1994 1996 1998 2000 2002 2004 2006 2008
CP
UE
(kg/d
ays
fish
ing)
Years
Engraulis encrasicolus
Ghana Artisanal Togo Artisanal Benin Artisanal
0
10000
20000
30000
40000
50000
60000
1999/4-5 2000/9 2001 2002/7-8 2003 2004/5-6 2005/5 2006/5-6
Bio
mas
s (t
on
nes
)
Acoustic surveys R/V DR. FRIDTJOF NANSEN
E. encrasicolus
Côte d'Ivoire, Ghana, Togo, Benin
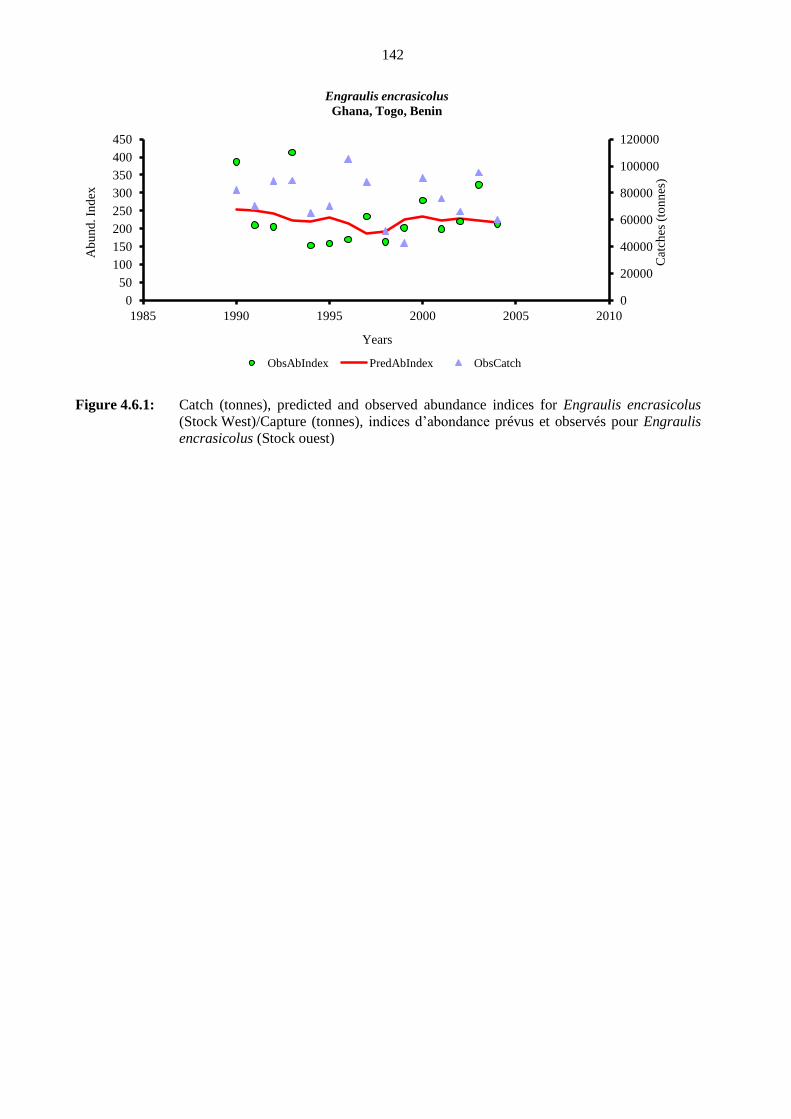
142
Figure 4.6.1: Catch (tonnes), predicted and observed abundance indices for Engraulis encrasicolus
(Stock West)/Capture (tonnes), indices d’abondance prévus et observés pour Engraulis
encrasicolus (Stock ouest)
0
20000
40000
60000
80000
100000
120000
0
50
100
150
200
250
300
350
400
450
1985 1990 1995 2000 2005 2010
Cat
ches
(to
nn
es)
Ab
un
d. In
dex
Years
Engraulis encrasicolus
Ghana, Togo, Benin
ObsAbIndex PredAbIndex ObsCatch
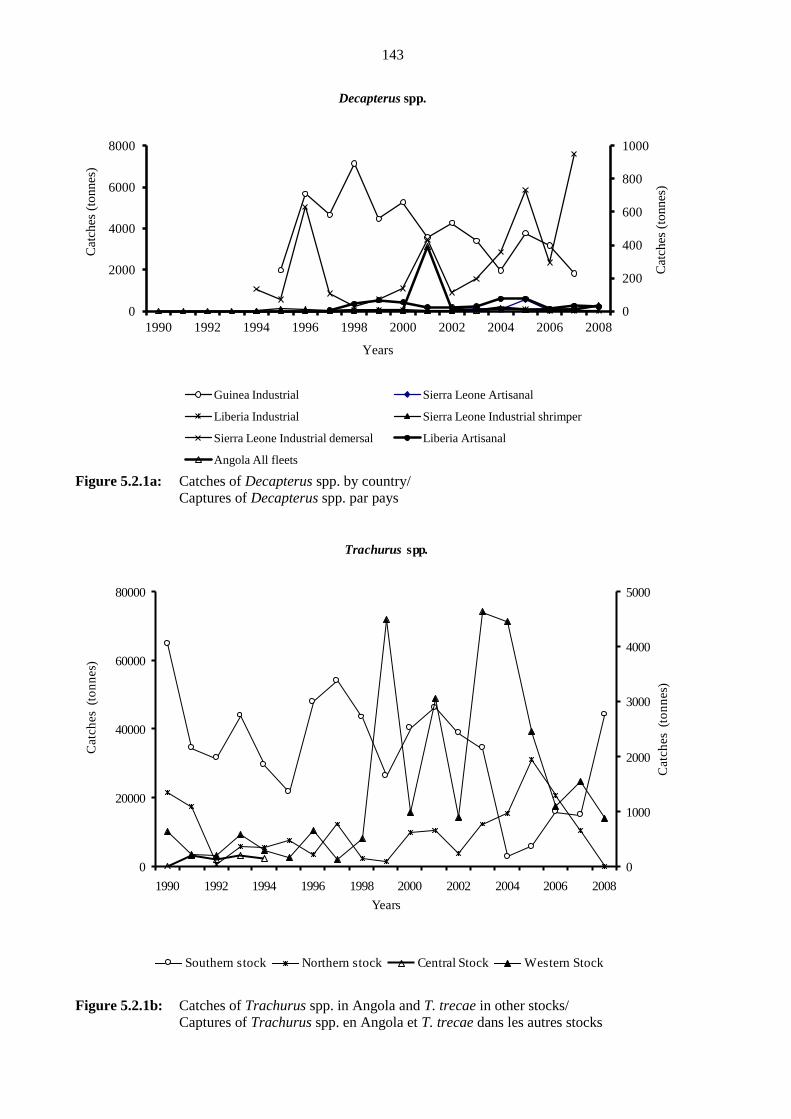
143
Figure 5.2.1a: Catches of Decapterus spp. by country/
Captures of Decapterus spp. par pays
Figure 5.2.1b: Catches of Trachurus spp. in Angola and T. trecae in other stocks/
Captures of Trachurus spp. en Angola et T. trecae dans les autres stocks
0
200
400
600
800
1000
0
2000
4000
6000
8000
1990 1992 1994 1996 1998 2000 2002 2004 2006 2008
Cat
ches
(to
nnes
)
Cat
ches
(to
nnes
)
Years
Decapterus spp.
Guinea Industrial Sierra Leone Artisanal
Liberia Industrial Sierra Leone Industrial shrimper
Sierra Leone Industrial demersal Liberia Artisanal
Angola All fleets
Trachurus spp.
0
20000
40000
60000
80000
1990 1992 1994 1996 1998 2000 2002 2004 2006 2008
Years
Catc
hes
(to
nn
es)
0
1000
2000
3000
4000
5000
Catc
hes
(to
nn
es)
Southern stock Northern stock Central Stock Western Stock

144
Figure 5.2.1c: Catches of other Carangidae by stocks /
Captures d’autres Carangidae par stocks
0
2000
4000
6000
8000
10000
12000
14000
1990 1992 1994 1996 1998 2000 2002 2004 2006 2008
Cat
ches
(to
nnes
)
Years
Other Carangidae
Central stock Southern stock Total stocks Northern stock Western stock

145
APPENDIX/ANNEXE I
LIST OF PARTICIPANTS/LISTE DES PARTICIPANTS
Country/Pays Small Pelagic Working Group members/
Membres du Groupe de travail des petits pélagiques
1 Guinea-Bissau Iça Barri
Biologiste marin, Chercheur du CIPA
Av. Amilcar Cabral, C.P. 102, Bissau
Tel.: +2455989426
E-mail: [email protected]
2 Guinea Sory Traoré
Centre National des sciences halieutiques de Boussoura (CNSHB)
BP 3738, Conakry
Tel.: +224 60 34 21 33
E-mail : [email protected]
3 Sierra Leone Sheku Sei
Fisheries Officer
Ministry of Fisheries and Marine Resources
Freetown
Tel.: +232 33899454
Fax: +232 22240828 / 242165
E-mail: [email protected]
4 Liberia Alvin S. Jueseah
Fisheries Statistician
Bureau of National Fisheries
Ministry of Agriculture
PO Box 9010, Monrovia
Tel.: +231 5824491
E-mail:[email protected]
5 Côte d’Ivoire Joanny Tapé Centre de recherches océanologiques
BP V 18, Abidjan
Tél.: +225 21 355880/21356315
E-mail: [email protected]
6 Ghana Samuel Quaatey
Acting Director of Fisheries
Fisheries Directorate
PO Box 630, Accra
Tel.: +233 22208163412
E-mail: [email protected]
7 Paul Bannerman
Assistant Director of Fisheries
Marine Fisheries Research Division
PO Box BT 62, Tema
Tel.: +233 2220848 / Mob.: +0244 794859
Fax: +233 22206627
E-mail: [email protected]
8 Samantha Vida Osei
Assistant Fisheries Officer
Marine Fisheries Research Division
PO Box BT62, Tema
Tel.: +233 2222346 / Mob.: 0243568244
E-mail: [email protected]
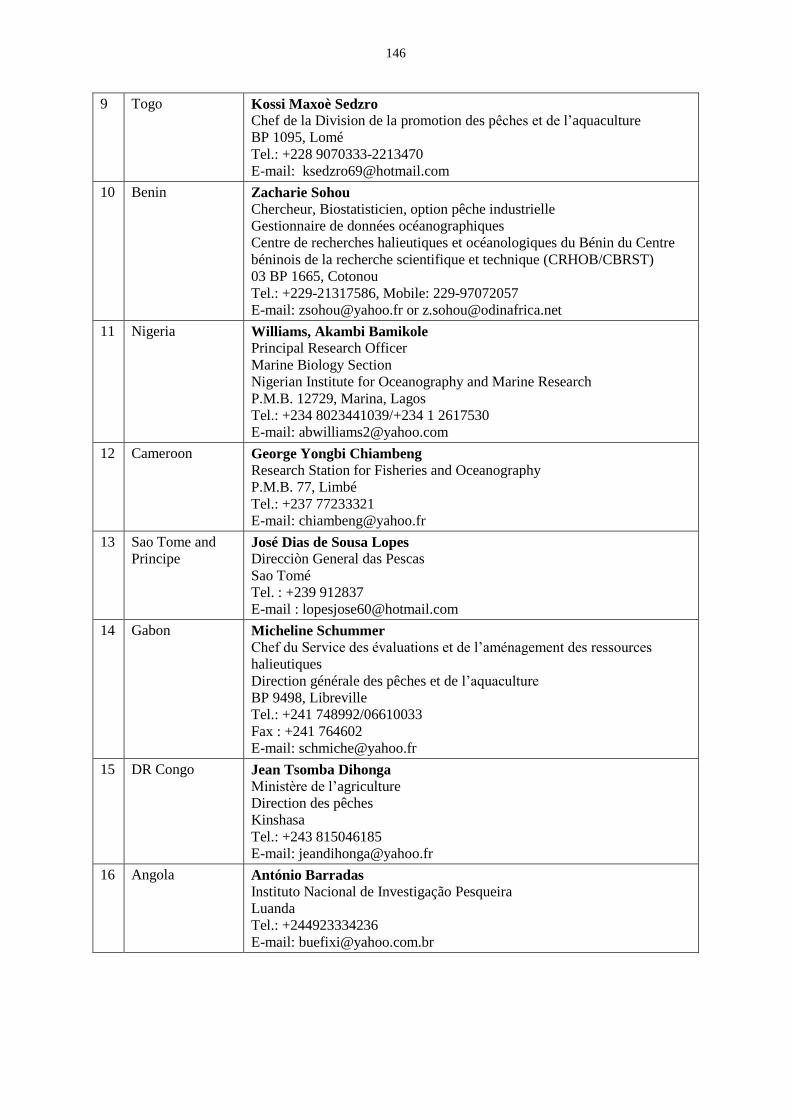
146
9 Togo Kossi Maxoè Sedzro
Chef de la Division de la promotion des pêches et de l’aquaculture
BP 1095, Lomé
Tel.: +228 9070333-2213470
E-mail: [email protected]
10 Benin Zacharie Sohou
Chercheur, Biostatisticien, option pêche industrielle
Gestionnaire de données océanographiques
Centre de recherches halieutiques et océanologiques du Bénin du Centre
béninois de la recherche scientifique et technique (CRHOB/CBRST)
03 BP 1665, Cotonou
Tel.: +229-21317586, Mobile: 229-97072057
E-mail: [email protected] or [email protected]
11 Nigeria Williams, Akambi Bamikole
Principal Research Officer
Marine Biology Section
Nigerian Institute for Oceanography and Marine Research
P.M.B. 12729, Marina, Lagos
Tel.: +234 8023441039/+234 1 2617530
E-mail: [email protected]
12 Cameroon George Yongbi Chiambeng
Research Station for Fisheries and Oceanography
P.M.B. 77, Limbé
Tel.: +237 77233321
E-mail: [email protected]
13 Sao Tome and
Principe José Dias de Sousa Lopes
Direcciòn General das Pescas
Sao Tomé
Tel. : +239 912837
E-mail : [email protected]
14 Gabon Micheline Schummer
Chef du Service des évaluations et de l’aménagement des ressources
halieutiques
Direction générale des pêches et de l’aquaculture
BP 9498, Libreville
Tel.: +241 748992/06610033
Fax : +241 764602
E-mail: [email protected]
15 DR Congo Jean Tsomba Dihonga
Ministère de l’agriculture
Direction des pêches
Kinshasa
Tel.: +243 815046185
E-mail: [email protected]
16 Angola António Barradas
Instituto Nacional de Investigação Pesqueira
Luanda
Tel.: +244923334236
E-mail: [email protected]
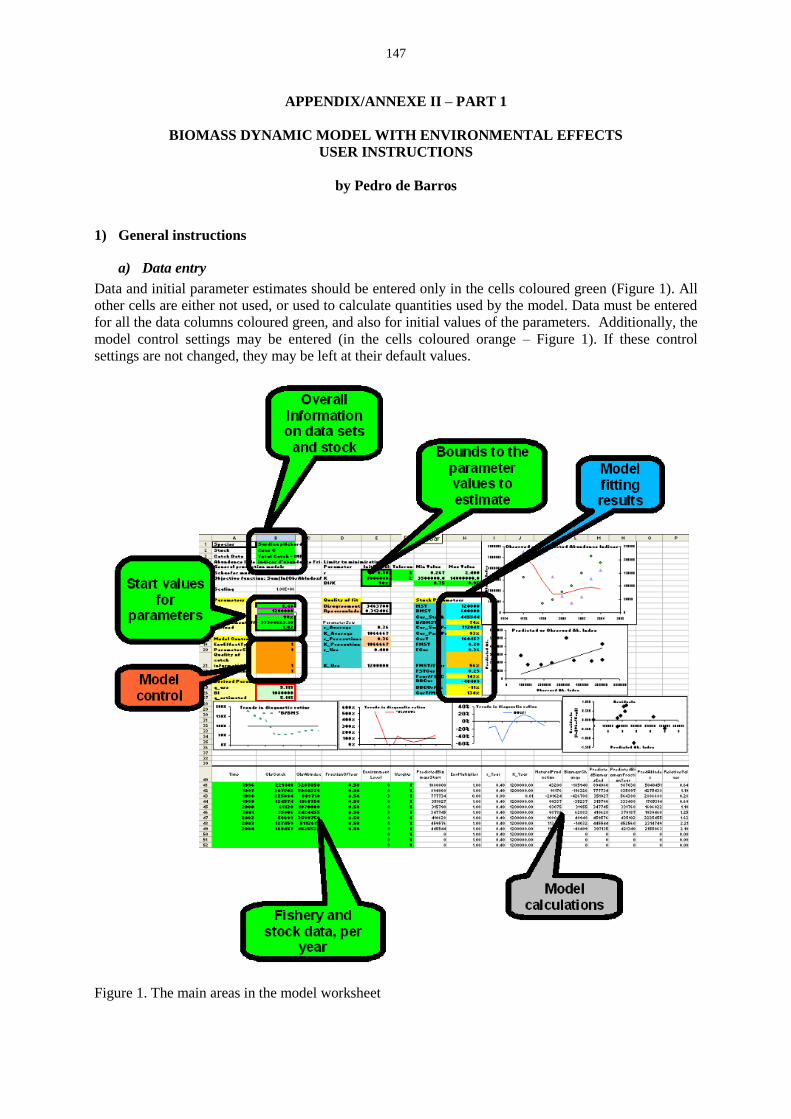
147
APPENDIX/ANNEXE II – PART 1
BIOMASS DYNAMIC MODEL WITH ENVIRONMENTAL EFFECTS
USER INSTRUCTIONS
by Pedro de Barros
1) General instructions
a) Data entry
Data and initial parameter estimates should be entered only in the cells coloured green (Figure 1). All
other cells are either not used, or used to calculate quantities used by the model. Data must be entered
for all the data columns coloured green, and also for initial values of the parameters. Additionally, the
model control settings may be entered (in the cells coloured orange – Figure 1). If these control
settings are not changed, they may be left at their default values.
Figure 1. The main areas in the model worksheet
148
b) Defining the parameters to be estimated non-linearly (using Solver)
The non-linear estimation procedures suffer from a number of limitations, of which the most important
is probably that the estimates obtained will depend on the start values defined. Therefore, one should
try to keep the number of parameters to be estimated non-linearly to the minimum possible values.
As a minimum, one must estimate r and K by fitting the model to the data using the solver algorithm.
When defining the parameters to estimate, one should as much as possible set constraints (maximum
and minimum values) so that the algorithm is limited to reasonable values, defined by the researchers.
Use the spreadsheet area of Minimum and Maximum values to define these.
2) Detailed instructions
Entering data
The following data MUST be entered in the appropriate cells of the worksheet (Figure 2):
i) Years of the data (Year)
All years from the first to the last in the data set should be entered, consecutively. The first year should
be entered in the cell immediately below the header “Year” and run consecutively until the last one.
No empty cells should exist between the data, only after the last year.
ii) Total catch per year (ObsCatch)
Total catch is REQUIRED for ALL years in the data series. The model will fail if catch data is missing
for any of the years (the reason is that catch is essential to calculating stock abundance the following
year). This column should be filled like the one for year.
iii) Abundance index (ObsAbIndex)
This column should be filled like the previous ones. However, if there is no abundance index for a
given year, this can be left blank. The model will still run correctly without a few years of data of
Abundance indices (if there are many, however, the reliability of results will be doubtful).
iv) Timing of the abundance index (FractionOfYear)
When the abundance index corresponds to e.g. a scientific survey, or to a fishery concentrated in a
short season, it will not represent the average abundance of the stock during the year, but rather this
same abundance at the time of the survey or fishery. The values in this column represent the timing of
the abundance index as a fraction of year (0.5 = July 1st). It should be set to a value corresponding
roughly to the mid-point of the survey or of the fishing season. If the abundance index corresponds to
a CPUE from a year-long fishery, this value should be set to 0.5 (mid-year).
v) Environment level
This column will include any index that can be considered to represent a deviation of the average
growth conditions of the stock in each year. If a series of environmental indices exist (e.g. a series of
upwelling indices) these can be used as the environmental level. If not, and there is external scientific
evidence that there were particular years with exceptional conditions, then an arbitrary positive (for
good growth) or negative (for poor growth) environmental level can be set for that year. If there is no
information on environmental elements affecting the carrying capacity and/or the intrinsic growth rate
of the stock, or it is considered that these parameters do not vary significantly, then the values in this
column can be left at their default values of 0.
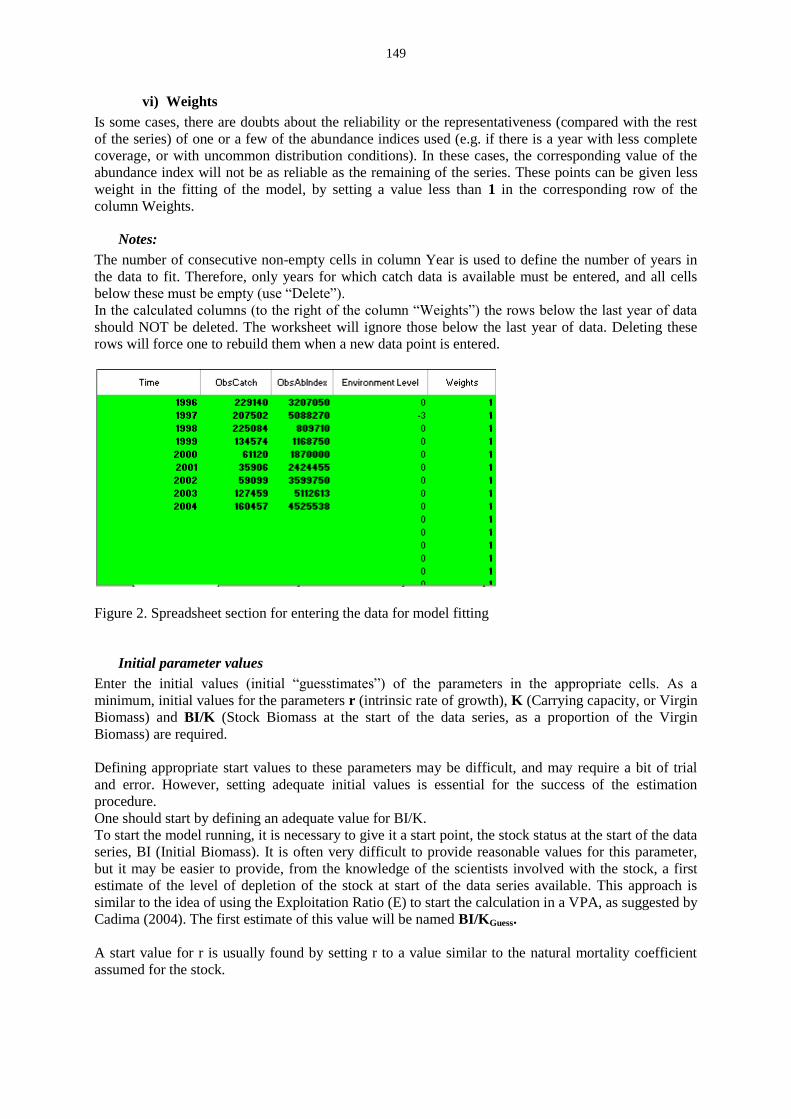
149
vi) Weights
Is some cases, there are doubts about the reliability or the representativeness (compared with the rest
of the series) of one or a few of the abundance indices used (e.g. if there is a year with less complete
coverage, or with uncommon distribution conditions). In these cases, the corresponding value of the
abundance index will not be as reliable as the remaining of the series. These points can be given less
weight in the fitting of the model, by setting a value less than 1 in the corresponding row of the
column Weights.
Notes:
The number of consecutive non-empty cells in column Year is used to define the number of years in
the data to fit. Therefore, only years for which catch data is available must be entered, and all cells
below these must be empty (use “Delete”).
In the calculated columns (to the right of the column “Weights”) the rows below the last year of data
should NOT be deleted. The worksheet will ignore those below the last year of data. Deleting these
rows will force one to rebuild them when a new data point is entered.
Figure 2. Spreadsheet section for entering the data for model fitting
Initial parameter values
Enter the initial values (initial “guesstimates”) of the parameters in the appropriate cells. As a
minimum, initial values for the parameters r (intrinsic rate of growth), K (Carrying capacity, or Virgin
Biomass) and BI/K (Stock Biomass at the start of the data series, as a proportion of the Virgin
Biomass) are required.
Defining appropriate start values to these parameters may be difficult, and may require a bit of trial
and error. However, setting adequate initial values is essential for the success of the estimation
procedure.
One should start by defining an adequate value for BI/K.
To start the model running, it is necessary to give it a start point, the stock status at the start of the data
series, BI (Initial Biomass). It is often very difficult to provide reasonable values for this parameter,
but it may be easier to provide, from the knowledge of the scientists involved with the stock, a first
estimate of the level of depletion of the stock at start of the data series available. This approach is
similar to the idea of using the Exploitation Ratio (E) to start the calculation in a VPA, as suggested by
Cadima (2004). The first estimate of this value will be named BI/KGuess.
A start value for r is usually found by setting r to a value similar to the natural mortality coefficient
assumed for the stock.

150
A start value for K is usually more difficult, but a value consistent with the remaining parameters can
also be found using a simple reasoning, as follows;
1- "Guess" the value of average stock Biomass during the period included in the assessment,
(BGuess);
2- Calculate the average value of the Abundance Index used in the same period, (AIAverage). Make
sure to include only real values of the abundance index, and to ignore any missing values;
3- Calculate a first estimate for the catchability coefficient q, as qGuess= AIAverage/ BGuess;
4- Calculate a first estimate of the stock Biomass at the start of the series, (BStart), using the value
of the abundance Index at the start of the series, (AIStart), and the first estimate of the
catchability coefficient q, qGuess, as BStart = AIStart/qGuess;
5- The first estimate of K (KGuess) is then given by KGuess=BStart/(BI/KGuess)
This procedure is implemented in the worksheet "InitialValues", within the workbook supplied
(Figure 3).
Figure 3. Estimation of the initial value for K implemented in the worksheet "InitialValues"
b) Setting limits to the estimation
When using non-linear estimation, it is advisable to set limits to the values the parameters may take.
To do this, enter the appropriate values in the “tolerance” column for the estimation of r and K. If
BI/K is to be estimated by the model, the upper and lower limits should be entered directly. Whenever
the initial values for the parameters are modified, the values in cells InitialValues should be set to the
same values entered in the cells used for the model parameters (Figure 4)
Figure 4. Process of defining the limits to the estimation in the model worksheet
c) Model control
In its current version, the model implementation allows the user to choose 3 main aspects of the
calculation, (1) the type of environmental effect (simple multiplicative or exponential), (2) to estimate
or not the catchability coefficient (q) and (3) the set of parameters to use for calculating the reference
points and the current status of the stock relative to these reference points.

151
Figure 5. Cells of the spreadsheet used to control the options in the calculations of the model
i) Choice of environmental effect type:
The model includes two different formulations for the effect of the environment level on the r and
K parameters of each year.
To select the type of environmental effect, set the value in cell EnvEffectType (Figure 5) to one of the
following values:
0 – No effect
1 – Additive formulation: EM=1+(EE*|EL|^SIGN(EL))
2 - Exponential formulation: EM=e(EE*EL)
EM: Environmental multiplier
EE: Environmental effect: Measures the overall intensity of the environmental effect. Usually
estimated by Solver as a part of the fitting routines;
EL: Environmental level: Indicator of level of environment, for each year (normally, will be deviations
from the average).
ii) Use of q
The user may choose to estimate the catchability coefficient q, or set it as fixed.
To select whether to estimate or to use the fixed value, set the value in cell q_Estimation (Figure 5) to
one of the following values:
0 – Use the fixed value set for the start
1 – Estimate the catchability coefficient
The user should never include q as one more parameter to be estimated by Solver. If it is meant to be
estimated, it should be estimated using the linear approximation given in the worksheet (just set
q_estimation to 1).
iii) Estimation of current (in the last year of data) Biomass
Even if the absolute Biomass values are not used directly (and they may be misleading, given the
degree of uncertainty involved in their estimation), they are necessary to estimate the F-values, since
these are calculated as F=B/Y.
The stock Biomass in the last year of data, that is used as a main element in calculating the current
status of the stock or the fishery, may be calculated in one of two ways: Either taken directly from the
model, as the Biomass value predicted by the model, or using the observed abundance index for that
year, and the estimated q, to calculate B=U/q.
The choice of the best option is not straightforward. However, if the quality of the total catch data in
the last few years is low, this will affect strongly the reliability of the Biomass estimates from the
model. In this case, it is better to calculate the Biomass using the Abundance Index for last year and
the overall q. To achieve this, set Quality of catch information for last few years (Figure 5) to 0
(bad quality). Otherwise, set it to 1, to use the Biomass estimates from the model.
Notes: The quality referred to here is not of the LAST catch data point (it has no effect) but rather the
few years before the last.
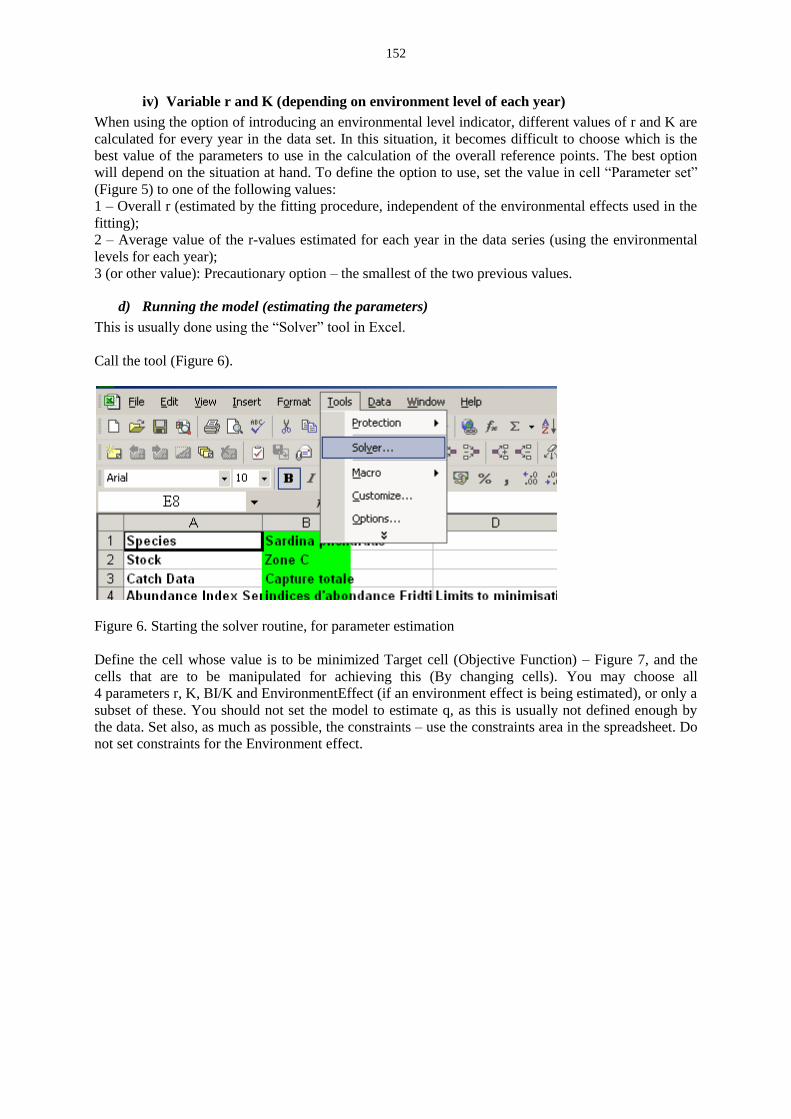
152
iv) Variable r and K (depending on environment level of each year)
When using the option of introducing an environmental level indicator, different values of r and K are
calculated for every year in the data set. In this situation, it becomes difficult to choose which is the
best value of the parameters to use in the calculation of the overall reference points. The best option
will depend on the situation at hand. To define the option to use, set the value in cell “Parameter set”
(Figure 5) to one of the following values:
1 – Overall r (estimated by the fitting procedure, independent of the environmental effects used in the
fitting);
2 – Average value of the r-values estimated for each year in the data series (using the environmental
levels for each year);
3 (or other value): Precautionary option – the smallest of the two previous values.
d) Running the model (estimating the parameters)
This is usually done using the “Solver” tool in Excel.
Call the tool (Figure 6).
Figure 6. Starting the solver routine, for parameter estimation
Define the cell whose value is to be minimized Target cell (Objective Function) – Figure 7, and the
cells that are to be manipulated for achieving this (By changing cells). You may choose all
4 parameters r, K, BI/K and EnvironmentEffect (if an environment effect is being estimated), or only a
subset of these. You should not set the model to estimate q, as this is usually not defined enough by
the data. Set also, as much as possible, the constraints – use the constraints area in the spreadsheet. Do
not set constraints for the Environment effect.

153
Figure 7. Setting the parameters for the solver routine.
After pressing “Solve”, the following dialog should be seen.
Figure 8. Dialog indicating the successful completion of the model fitting procedure
After pressing the OK button, the diagnostics can be assessed.
3) Diagnostics of fit
Like any model fitted to data, it is essential to assess the quality of the fit of the model to the particular
data set used in each run. The model will almost always produce an estimate, but the reliability of the
model fitting that produced these estimates should always be checked before accepting the results.
There may be several reasons why a production model may not fit well a particular data set. Some of
the most common ones are;
Lack of contrast in the data
“One-Way trip”
Abundance index does not represent the whole stock
Catch data are not representative of all catches, but come from only a part of the fleet, or are
fixed estimates
To help assess the quality of this fit, a few indicators are provided.

154
a) Objective function
The actual value of the objective function (Figure 9) is the first measurement of the goodness-of-fit of
the model. High values indicate a better fit. However, it is difficult to evaluate exactly what is “high”,
and this is thus not usual as a diagnostics statistic.
Figure 9. Cells holding the values of the objective function of the model fit, and of the Pearson linear
correlation coefficient r.
b) Pearson linear regression coefficient between the predicted and observed abundance indices
This coefficient (Figure 9) will not detect a non-linear relation but will measure how closely the
predicted abundance indices follow the observed ones. High values should be aimed for.
c) Plot of Predicted vs Observed Abundance Indices
Figure 10. Plot of the relation between the predicted and the observed abundance indices. This plot can
be used to detect severe deviations from the linear relationship between the observed abundance
indices and those predicted by the model
This plot presents, in a graphical way, the relation between the Abundance Index observed (or given to
the model) and the Abundance index estimated by the model, on the basis of the estimated biomass.
The desirable characteristics for this plot is a linear relation between the predicted and observed
indices, with slope 1.
Undesirable characteristics include:
a) a flat plot (no relation between predicted and observed);
b) A non-linear relation (cyclic, asymptotic or curved relation)
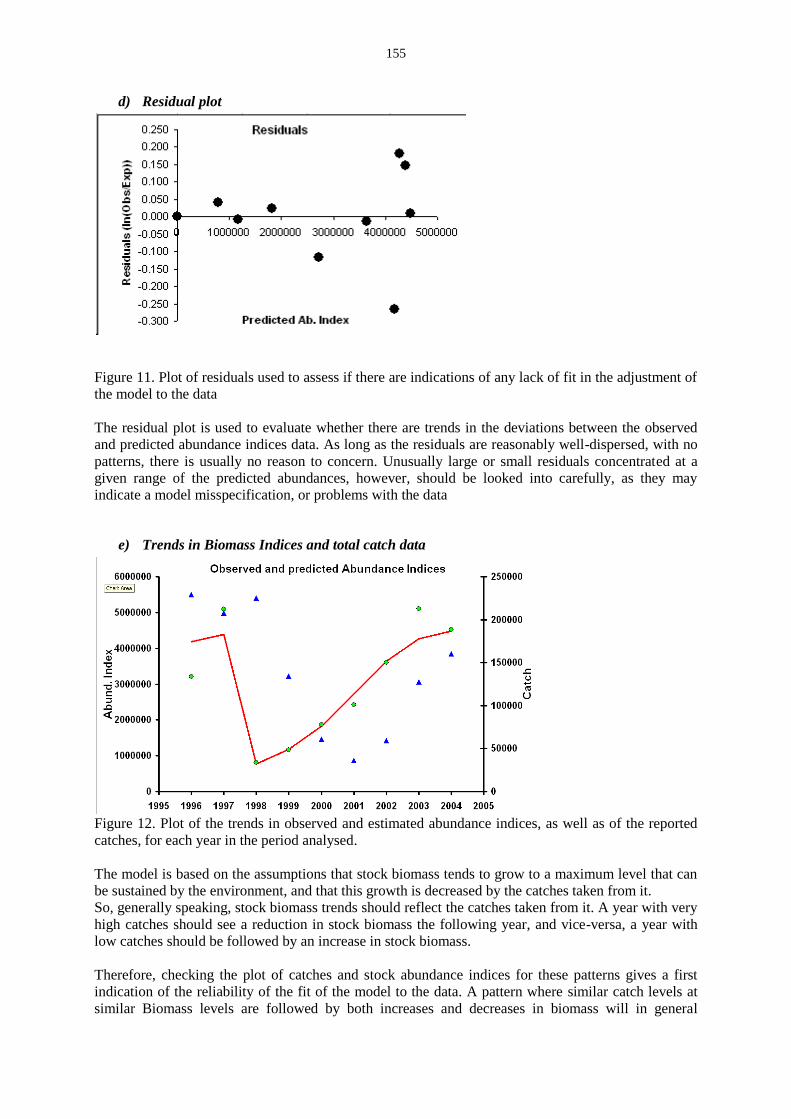
155
d) Residual plot
Figure 11. Plot of residuals used to assess if there are indications of any lack of fit in the adjustment of
the model to the data
The residual plot is used to evaluate whether there are trends in the deviations between the observed
and predicted abundance indices data. As long as the residuals are reasonably well-dispersed, with no
patterns, there is usually no reason to concern. Unusually large or small residuals concentrated at a
given range of the predicted abundances, however, should be looked into carefully, as they may
indicate a model misspecification, or problems with the data
e) Trends in Biomass Indices and total catch data
Figure 12. Plot of the trends in observed and estimated abundance indices, as well as of the reported
catches, for each year in the period analysed.
The model is based on the assumptions that stock biomass tends to grow to a maximum level that can
be sustained by the environment, and that this growth is decreased by the catches taken from it.
So, generally speaking, stock biomass trends should reflect the catches taken from it. A year with very
high catches should see a reduction in stock biomass the following year, and vice-versa, a year with
low catches should be followed by an increase in stock biomass.
Therefore, checking the plot of catches and stock abundance indices for these patterns gives a first
indication of the reliability of the fit of the model to the data. A pattern where similar catch levels at
similar Biomass levels are followed by both increases and decreases in biomass will in general
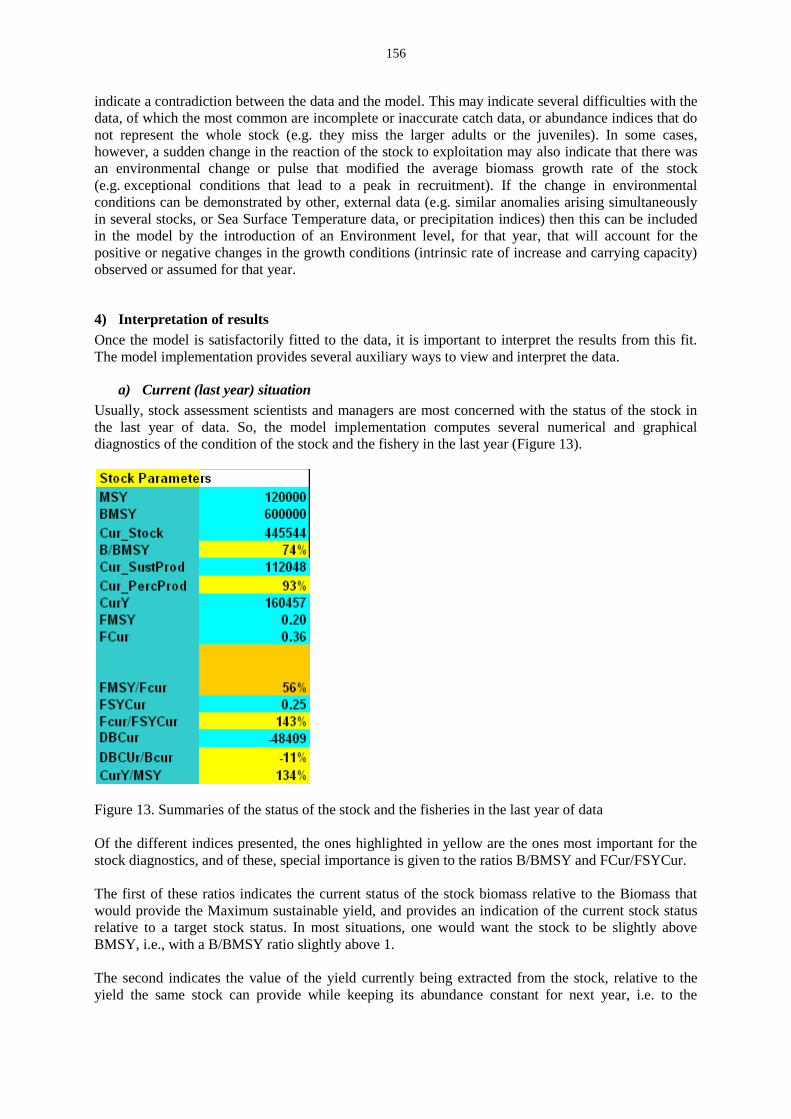
156
indicate a contradiction between the data and the model. This may indicate several difficulties with the
data, of which the most common are incomplete or inaccurate catch data, or abundance indices that do
not represent the whole stock (e.g. they miss the larger adults or the juveniles). In some cases,
however, a sudden change in the reaction of the stock to exploitation may also indicate that there was
an environmental change or pulse that modified the average biomass growth rate of the stock
(e.g. exceptional conditions that lead to a peak in recruitment). If the change in environmental
conditions can be demonstrated by other, external data (e.g. similar anomalies arising simultaneously
in several stocks, or Sea Surface Temperature data, or precipitation indices) then this can be included
in the model by the introduction of an Environment level, for that year, that will account for the
positive or negative changes in the growth conditions (intrinsic rate of increase and carrying capacity)
observed or assumed for that year.
4) Interpretation of results
Once the model is satisfactorily fitted to the data, it is important to interpret the results from this fit.
The model implementation provides several auxiliary ways to view and interpret the data.
a) Current (last year) situation
Usually, stock assessment scientists and managers are most concerned with the status of the stock in
the last year of data. So, the model implementation computes several numerical and graphical
diagnostics of the condition of the stock and the fishery in the last year (Figure 13).
Figure 13. Summaries of the status of the stock and the fisheries in the last year of data
Of the different indices presented, the ones highlighted in yellow are the ones most important for the
stock diagnostics, and of these, special importance is given to the ratios B/BMSY and FCur/FSYCur.
The first of these ratios indicates the current status of the stock biomass relative to the Biomass that
would provide the Maximum sustainable yield, and provides an indication of the current stock status
relative to a target stock status. In most situations, one would want the stock to be slightly above
BMSY, i.e., with a B/BMSY ratio slightly above 1.
The second indicates the value of the yield currently being extracted from the stock, relative to the
yield the same stock can provide while keeping its abundance constant for next year, i.e. to the
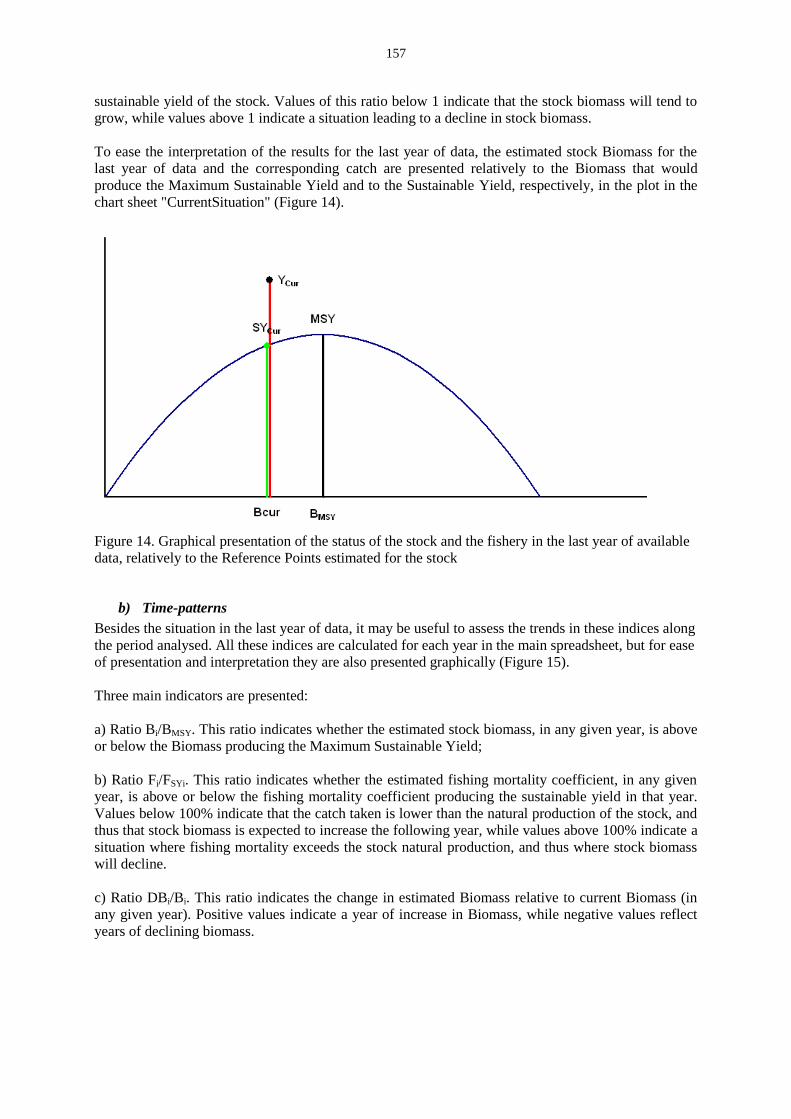
157
sustainable yield of the stock. Values of this ratio below 1 indicate that the stock biomass will tend to
grow, while values above 1 indicate a situation leading to a decline in stock biomass.
To ease the interpretation of the results for the last year of data, the estimated stock Biomass for the
last year of data and the corresponding catch are presented relatively to the Biomass that would
produce the Maximum Sustainable Yield and to the Sustainable Yield, respectively, in the plot in the
chart sheet "CurrentSituation" (Figure 14).
Figure 14. Graphical presentation of the status of the stock and the fishery in the last year of available
data, relatively to the Reference Points estimated for the stock
b) Time-patterns
Besides the situation in the last year of data, it may be useful to assess the trends in these indices along
the period analysed. All these indices are calculated for each year in the main spreadsheet, but for ease
of presentation and interpretation they are also presented graphically (Figure 15).
Three main indicators are presented:
a) Ratio Bi/BMSY. This ratio indicates whether the estimated stock biomass, in any given year, is above
or below the Biomass producing the Maximum Sustainable Yield;
b) Ratio Fi/FSYi. This ratio indicates whether the estimated fishing mortality coefficient, in any given
year, is above or below the fishing mortality coefficient producing the sustainable yield in that year.
Values below 100% indicate that the catch taken is lower than the natural production of the stock, and
thus that stock biomass is expected to increase the following year, while values above 100% indicate a
situation where fishing mortality exceeds the stock natural production, and thus where stock biomass
will decline.
c) Ratio DBi/Bi. This ratio indicates the change in estimated Biomass relative to current Biomass (in
any given year). Positive values indicate a year of increase in Biomass, while negative values reflect
years of declining biomass.
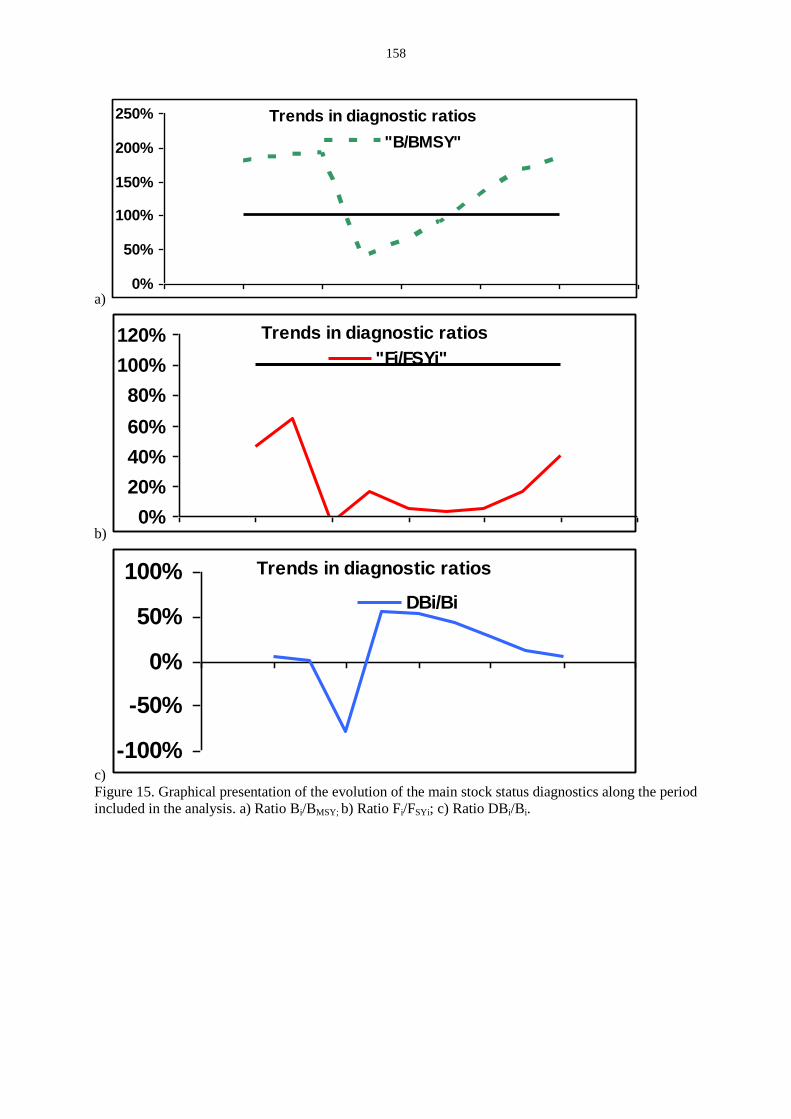
158
a)
b)
c)
Figure 15. Graphical presentation of the evolution of the main stock status diagnostics along the period
included in the analysis. a) Ratio Bi/BMSY; b) Ratio Fi/FSYi; c) Ratio DBi/Bi.
Trends in diagnostic ratios
0%
50%
100%
150%
200%
250%
"B/BMSY"
Trends in diagnostic ratios
0%
20%
40%
60%
80%
100%
120%"Fi/FSYi"
Trends in diagnostic ratios
-100%
-50%
0%
50%
100%
DBi/Bi

159
APPENDIX/ANNEX II – PART 2
Projections of future yields and stock abundance using dynamic surplus production
models - General concepts and implementation as excel spreadsheets
by Pedro de Barros
1. INTRODUCTION
a) Management measures available to fisheries managers
Fisheries managers have at their disposal a wide array of management measures that are usually
classified into three groups, (a) input control measures; (b) output control measures and (c) technical
measures. Input and output control measures aim to control the overall fishing level, i.e., the total
mortality applied to the stock, while technical measures intend to control the way how this total
mortality is distributed by the different size- or age-groups of the stock.
Input control measures include all the management measures that limit the fishing effort applied to the
fishery, and include limitations of fishing licences, of total number of fishing days, or any other
similar measures.
Output control measures are those measures that limit the total catch removed from the stock, usually
as total biomass removed, but sometimes also as numbers of individuals. Limitations of Total
Allowable Catch (TAC) are the most common form of these measures.
Finally, technical measures include those measures like mesh size limitations, minimum landing sizes,
or closed areas and seasons.
The advantages and disadvantages of different management measures are discussed by several
reference books, like e.g. Hilborn and Walters (1992) or Hogarth et al. (2006).
b) Projections in the fish stock assessment process
The fish stock assessment process includes in general at least four main steps, besides the data
collection steps:
1. Deciding the best model to represent the dynamics of the stock and the fisheries, based on (i)
the characteristics of the stock and the fishery, (ii) the management measures considered, and
(iii) the data available on the fishery and the catches;
2. Estimating the parameters of the model (fitting the model to the data available) and
calculating, where possible, the Biological Reference Points (BRP’s);
3. Assessing the current status and the historical trends of the stock and the fishery (in Biomass,
Fishing Mortality, Average Size or any other indicator of stock status) relative to the BRP’s
chosen to manage the stock;
4. Evaluating the likely consequences, for the stock and the fishery, of alternative management
options. This most often involves projecting the development of the stock and of the catches,
as well as of other statistics of the stock and the fishery, under different options for
management or future scenarios.

160
The projection of stock and fishery status under different assumptions regarding the dynamics of the
stock and the management measures applied is an essential step in the provision of management
advice, as it allows managers to evaluate the likely consequences, for the stock and the fishery, of the
different management options at their disposal.
Projections can be done for the long-term, medium-term or short-term. Each of these has different
purposes and properties that must be considered carefully when deciding which ones to carry out.
Long-term projections, also called equilibrium projections, are used to assess the average long-term
relation between the main indicators of stock and fishery status on one hand and fishing level, or other
quantities defining a fishery, on the other. They require the assumption that all conditions are kept
constant for a time-period at least as long as the life-span of the target species, and do not depend on
the current state of the stocks, which is not taken into account. Also, they do not include time as a
variable. As such, they can not be used to assess management measures that vary with time (e.g. a
policy of decreasing TAC progressively), nor do they allow one to predict the status of stocks or
fisheries at any defined point in time. These projections are mostly used to estimate the values of
Biological Reference Points, estimate desirable states of the fisheries and compare the long-term
merits of alternative management measures.
Short-term projections, on the other hand, are usually made for a period of 1-2 years after the current
year/period. They depend strongly on the current state of the stock and the fishery, and assess their
evolution at different times after the current moment/time. Because they consider time explicitly, they
can be used to assess the effects of management measures varying with time, and to predict the status
of the stocks and fisheries at different points in time within the time-frame they consider.
Finally, mid-term projections are usually made for a period of 3-10 years from current time. They use
the same equations as short-term projections, prolonging them for a longer period. They can thus be
used for the same purposes as short-term projections. As they extend farther from the current year,
however, they become more and more dependent on the assumptions of the model, and less on the
estimates of current stock and fishery status. As such, particular care must be exercized when
interpreting the results of such projections. This effect is more marked the shorter the life-span of the
stocks being analysed, since with long-lived species the individuals currently present in the stock will
influence its total abundance for a longer number of years.
Both long-term and short-term projections can be carried out based on production or structural models.
However, only projections based on structural (age-, length- or stage-structured models) can be used to
assess the effect of technical measures.
When the data available for a fishery are only total catch and effort, or catch and abundance indices,
only production models can be used, and thus the only management measures that can be assessed are
those based on input or output control.
When using and fitting Production Models, like the Schaefer logistic model, the estimation of the
parameters leads in almost all cases to carrying out a long-term projection, since the average long-term
response of the stock and the fishery to changes in fishing level are direct functions of the stock
parameters.
Carrying out short-term and medium-term projections, however, requires carrying forward the
dynamic version of the models, under different assumptions for the catches taken from the stock, as a
consequence of different input or output control management measures. Even though the equations
used for this forward projection of the stock and the fishery are the same as used for the population
model of the fitting version, it is usual to separate the task of fitting the model to data (i.e. estimating
its parameters) from the task of using the estimated parameters to analyse the consequences of
different management measures. This is mostly because the calculations used to fit the models using
161
the dynamic version of these models require intensive computations, and it is thus usually desired to
keep the corresponding programmes as simple and light as possible.
It should be noted that projections, either long-term or short-term, should not be taken for predictions
of actual stock abundance or catch values. As such, they should not be used to actually predict stock
abundance or catch at any period. Rather, they should be used to assess the relative merits of
alternative competing management options, and as such inform better the process of deciding which
management measures are more likely to drive the stock and the fishery in the direction desired by
managers.
2. WORKBOOKS FOR PROJECTIONS USING THE PRODUCTION MODELS
The spreadsheets used for fitting the dynamic version of the Schaefer logistic model are not meant for
doing projections. In fact, the need of running numerical optimization routines for the estimation of
the parameters implies that one should avoid very complicated sheets.
Accordingly, a new workbook was prepared, to run projections based on the data available and the
parameters estimated for the stock and the fishery. It should be noted that this sheet should not be used
for estimating parameters, but rather to analyse the likely consequences of different management
options (set as changes in effort or total catch relative to current levels) on the future trends in catches
and stock abundance.
This workbook is meant for doing deterministic projections, i.e., projections where the results are
always the same for a given set of (a) initial conditions (stock size at the start of the projection period)
(b) stock dynamics parameters and (c) stock exploitation strategy (TAC or Fishing Effort control).
3. POSSIBLE ANALYSES
The model implementation in the workbook can run projections with the following main
characteristics:
a) Dynamic projections based on the Schaefer model;
b) Deterministic projections. Running a simulation with the same data and parameters will
always produce the same results. Accordingly, this workbook will not produce stochastic
simulations, and thus cannot be used for running e.g. risk analysis;
c) The stock dynamics are based on the Schaefer model parameters provided to the model;
d) The start point of the simulations is the stock status estimated by the model for the last year of
available data;
It should be noted that because the simulation is based on a surplus production model, the
workbook can not be used to simulate management strategies based on technical measures.
162
a) Management strategies simulated
The implementation of the model can currently simulate the following management strategies:
i) Constant exploitation strategies
In this kind of projection, it is assumed that the exploitation strategy (either total catch or total fishing
mortality) is constant for all years being projected. The management measures under this type of can
be defined as (1) TAC fixed at the same constant level for all years in the projection or (2) fishing
mortality fixed at the same constant level for all years in the projection.
(1) Constant TAC
In this type of projection/simulation, total catch is fixed at the TAC level established by management
from the first to the last year of the projection. It is assumed that there are no enforcement/declaration
problems, so that the catch actually taken corresponds exactly to the TAC specified. For
simplification, the TAC is given as a percentage of the average catch in the reference period (a period
of the last 1 to 5 years of available data).
(2) Constant fixed total fishing mortality
This projection mode corresponds to a management option of fixing total effort, in the assumption that
there is no change in catchability, and therefore that fishing mortality is effectively proportional to
fishing effort. The actual management measures that will achieve this control of total fishing mortality
are not specified, but the simulation assumes that fishing mortality is effectively controlled. For
simplification, the fishing mortality for the projection is given as a percentage of the fishing mortality
estimated for the last year of data available.
ii) Variable exploitation strategies
In this set of strategies, managers can allow for varying TAC or fishing mortality at each year in the
projection time. This requires specifying the TAC or the fishing mortality (both as values relative to
the average values in the reference period) for each time-period covered by the projection. Otherwise,
the projection proceeds as for the case of the constant TAC or fishing mortality strategies.
An important issue to remember when defining the management strategy to simulate is how catch is
related to stock abundance. When using TAC management control, the total catch taken each year is
fixed externally. This catch does not depend on stock abundance or other aspects of stock status. When
an effort control strategy is chosen, however, the total fishing effort exerted on the stock each year is
fixed. In this system, total catch is determined by the effort applied to the average stock abundance
during the year, and thus depends on stock abundance.
4. ORGANIZATION/STRUCTURE OF THE WORKBOOK
The workbook is divided into several sheets that correspond to different parts of the operation of the
simulation:
a) Data Input and projection control
The input of the stock and fisheries data, as well as the definition of the conditions for the projection,
is separate from the calculations or the presentation of output. This way, it is possible to allow the
users to specify the input data and parameters, as well as the conditions for the simulation, in a simpler
setup than if this input was joined with the calculations. All input and control parameters are entered
into the same sheet, sheet “Input”.
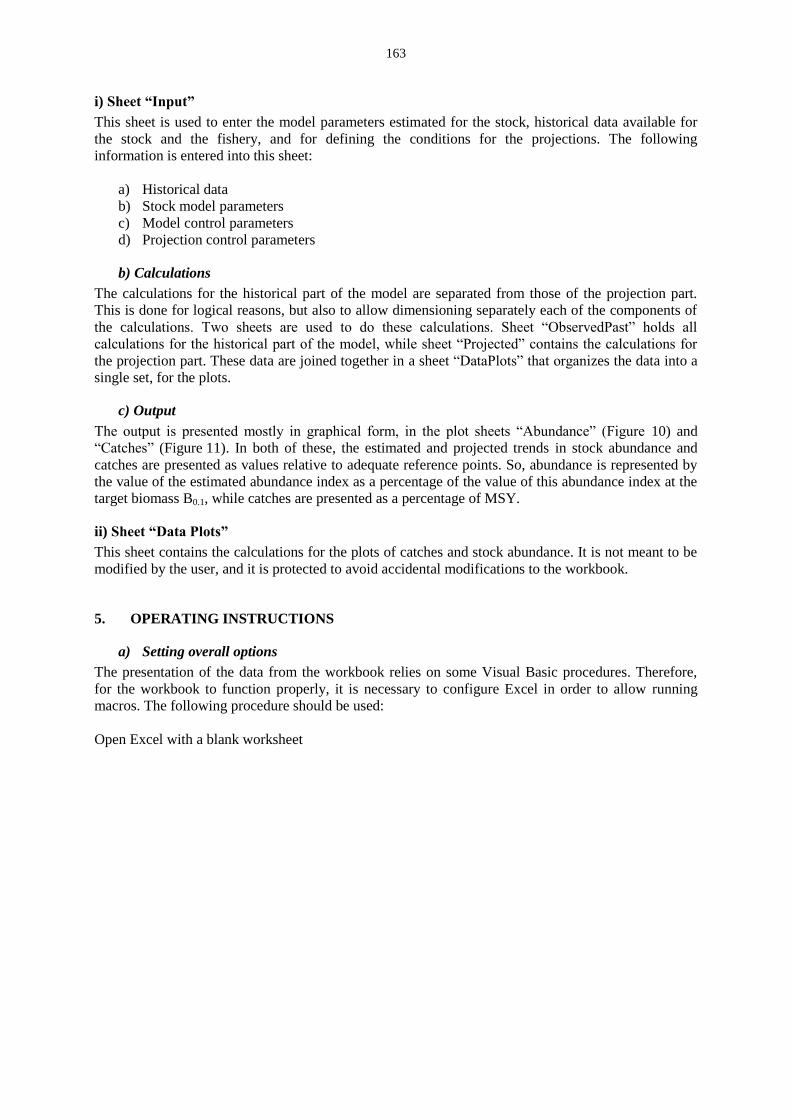
163
i) Sheet “Input”
This sheet is used to enter the model parameters estimated for the stock, historical data available for
the stock and the fishery, and for defining the conditions for the projections. The following
information is entered into this sheet:
a) Historical data
b) Stock model parameters
c) Model control parameters
d) Projection control parameters
b) Calculations
The calculations for the historical part of the model are separated from those of the projection part.
This is done for logical reasons, but also to allow dimensioning separately each of the components of
the calculations. Two sheets are used to do these calculations. Sheet “ObservedPast” holds all
calculations for the historical part of the model, while sheet “Projected” contains the calculations for
the projection part. These data are joined together in a sheet “DataPlots” that organizes the data into a
single set, for the plots.
c) Output
The output is presented mostly in graphical form, in the plot sheets “Abundance” (Figure 10) and
“Catches” (Figure 11). In both of these, the estimated and projected trends in stock abundance and
catches are presented as values relative to adequate reference points. So, abundance is represented by
the value of the estimated abundance index as a percentage of the value of this abundance index at the
target biomass B0.1, while catches are presented as a percentage of MSY.
ii) Sheet “Data Plots”
This sheet contains the calculations for the plots of catches and stock abundance. It is not meant to be
modified by the user, and it is protected to avoid accidental modifications to the workbook.
5. OPERATING INSTRUCTIONS
a) Setting overall options
The presentation of the data from the workbook relies on some Visual Basic procedures. Therefore,
for the workbook to function properly, it is necessary to configure Excel in order to allow running
macros. The following procedure should be used:
Open Excel with a blank worksheet
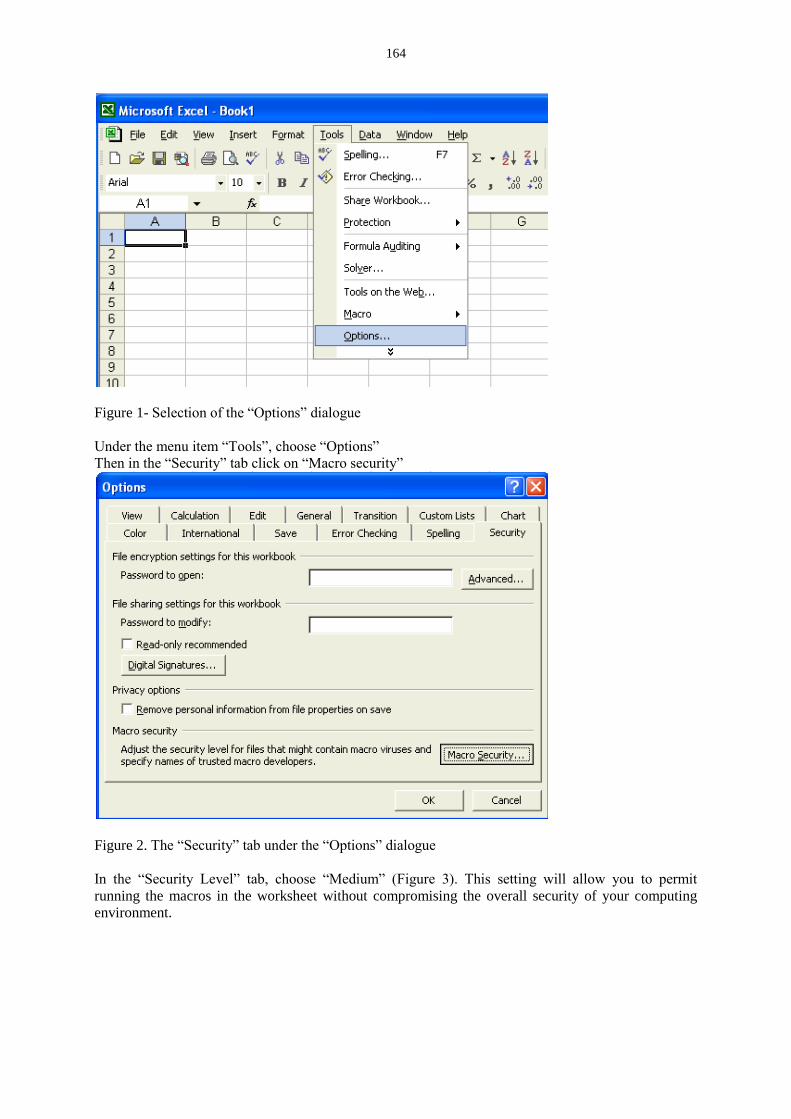
164
Figure 1- Selection of the “Options” dialogue
Under the menu item “Tools”, choose “Options”
Then in the “Security” tab click on “Macro security”
Figure 2. The “Security” tab under the “Options” dialogue
In the “Security Level” tab, choose “Medium” (Figure 3). This setting will allow you to permit
running the macros in the worksheet without compromising the overall security of your computing
environment.
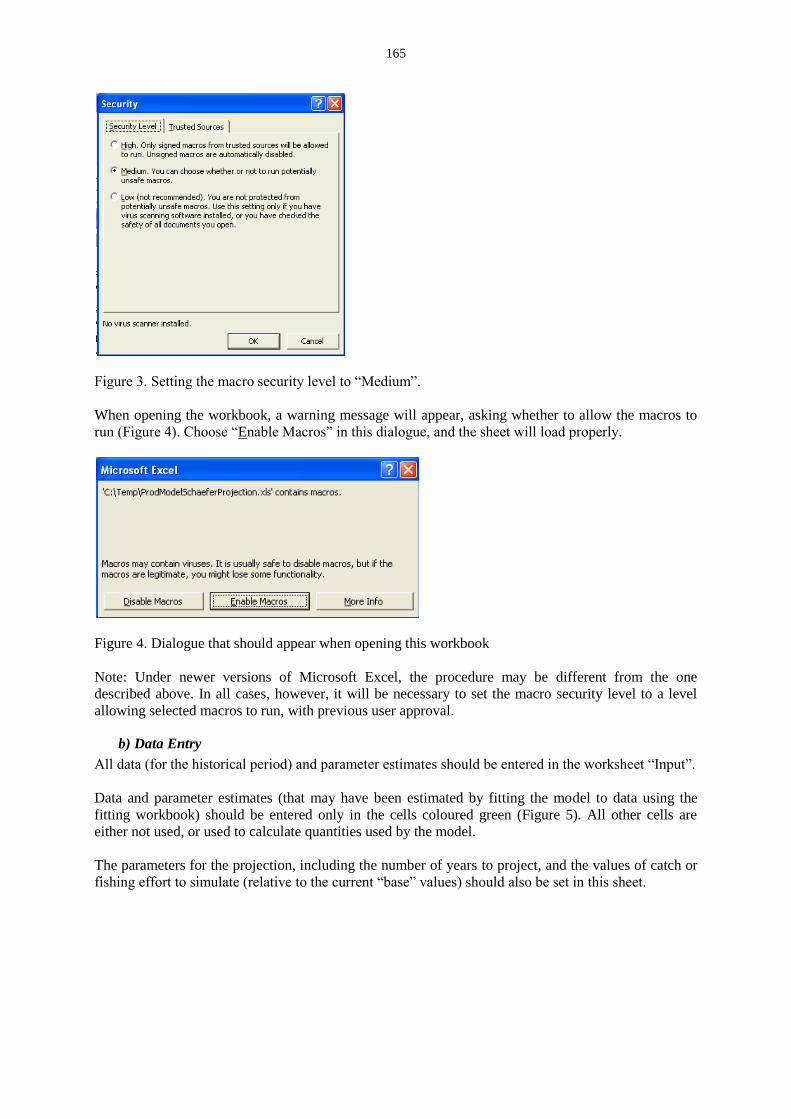
165
Figure 3. Setting the macro security level to “Medium”.
When opening the workbook, a warning message will appear, asking whether to allow the macros to
run (Figure 4). Choose “Enable Macros” in this dialogue, and the sheet will load properly.
Figure 4. Dialogue that should appear when opening this workbook
Note: Under newer versions of Microsoft Excel, the procedure may be different from the one
described above. In all cases, however, it will be necessary to set the macro security level to a level
allowing selected macros to run, with previous user approval.
b) Data Entry
All data (for the historical period) and parameter estimates should be entered in the worksheet “Input”.
Data and parameter estimates (that may have been estimated by fitting the model to data using the
fitting workbook) should be entered only in the cells coloured green (Figure 5). All other cells are
either not used, or used to calculate quantities used by the model.
The parameters for the projection, including the number of years to project, and the values of catch or
fishing effort to simulate (relative to the current “base” values) should also be set in this sheet.
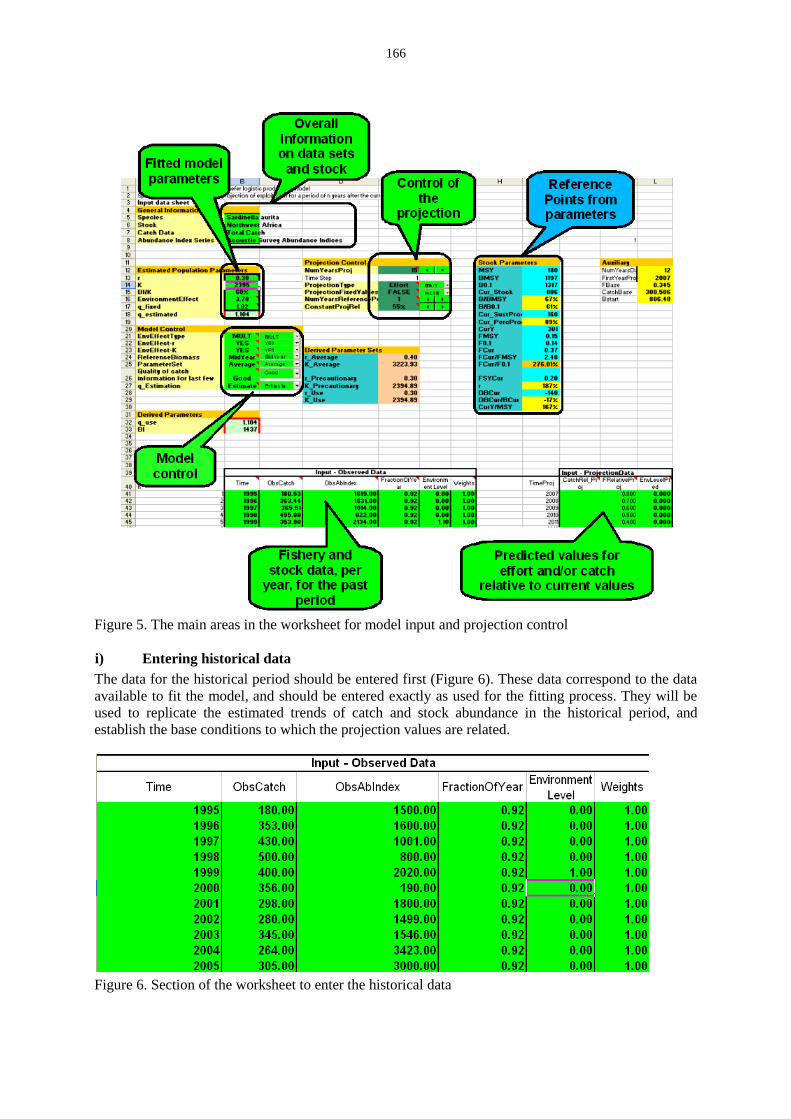
166
Figure 5. The main areas in the worksheet for model input and projection control
i) Entering historical data
The data for the historical period should be entered first (Figure 6). These data correspond to the data
available to fit the model, and should be entered exactly as used for the fitting process. They will be
used to replicate the estimated trends of catch and stock abundance in the historical period, and
establish the base conditions to which the projection values are related.
Figure 6. Section of the worksheet to enter the historical data

167
The settings in this section should be set exactly to the same values entered when fitting the model
(estimating the parameters).
(1) Years of data (Time)
All years from the first to the last in the historical data set should be entered, consecutively. The first
year should be entered in the cell immediately below the header “Year” and run consecutively until the
last one. No empty cells should exist between the data, only after the last year. Note that the worksheet
uses the number of consecutive non-empty cells in this column to define the time interval of the
historical part of the modelling, and failing to fill this properly will result in inadequate calculations.
(2) Total Catch per year (ObsCatch)
Total catch is REQUIRED for ALL years in the historical data series. The model will fail if catch data
is missing for any of these years (the reason is that catch is essential to calculating stock abundance the
following year). This column should be filled like the one for year;
(3) Abundance Index (ObsAbIndex)
This column should be filled like the previous ones. It will contain an Index of stock abundance for as
many years as possible, of the series of years considered. Only one index series can be entered,
because it is considered impossible, or at least unreliable, to combine adequately several index series
without detailed information on each of them. If it is desired to include information on more than one
abundance index, these should be combined in a separate analysis that should take into account the
relative reliability of each of the indices.
(4) Timing of the abundance index (FractionOfYear)
When the abundance index corresponds to e.g. a scientific survey, or to a fishery concentrated in a
short season, it will not represent the average abundance of the stock during the year, but rather this
same abundance at the time of the survey or fishery. The values in this column represent the timing of
the abundance index as a fraction of year (0.5 = July 1st). It should be set to a value corresponding
roughly to the mid-point of the survey or of the fishing season. If the abundance index corresponds to
a CPUE from a year-long fishery, this value should be set to 0.5 (mid-year).
(5) Environment Level
This column contains an index of “relative environmental quality” for each year in the data series.
This index should reflect, as much as possible, the overall quality of the environment for stock growth
relative to the “average” years. Years considered as “average” should have the value “0” for this
index, while years more favourable than the average will have a positive value, and years less
favourable will have negative values. This column will include any index that can be considered to
represent a deviation of the average growth conditions of the stock in each year. If a series of
environmental indices exist (e.g. a series of upwelling indices) these can be used as the environmental
level. If not, and there is external scientific evidence that there were particular years with exceptional
conditions, then an arbitrary positive (for good growth) or negative (for poor growth) environmental
level can be set for that year. If there is no information on environmental elements affecting the
carrying capacity and/or the intrinsic growth rate of the stock, or it is considered that these parameters
do not vary significantly, then the values in this column should be left at their default value of 0.
(6) Weights
This column will include the weights given to each estimate of the abundance index in the fitting
procedure. These weights should be proportional to the reliability of the different estimates. This may
mean that they should be proportional to the variance of the estimates, if this is available, but they may
be used simply to downweigh some particularly troublesome or doubtful points. In some cases, there
are doubts about the reliability or the representativeness (compared with the rest of the series) of one
or a few of the abundance indices used (e.g. if there is a year with less complete coverage, or with
uncommon distribution conditions). In these cases, the corresponding value of the abundance index
will not be as reliable as the remaining of the series. These points can be given less weight in the
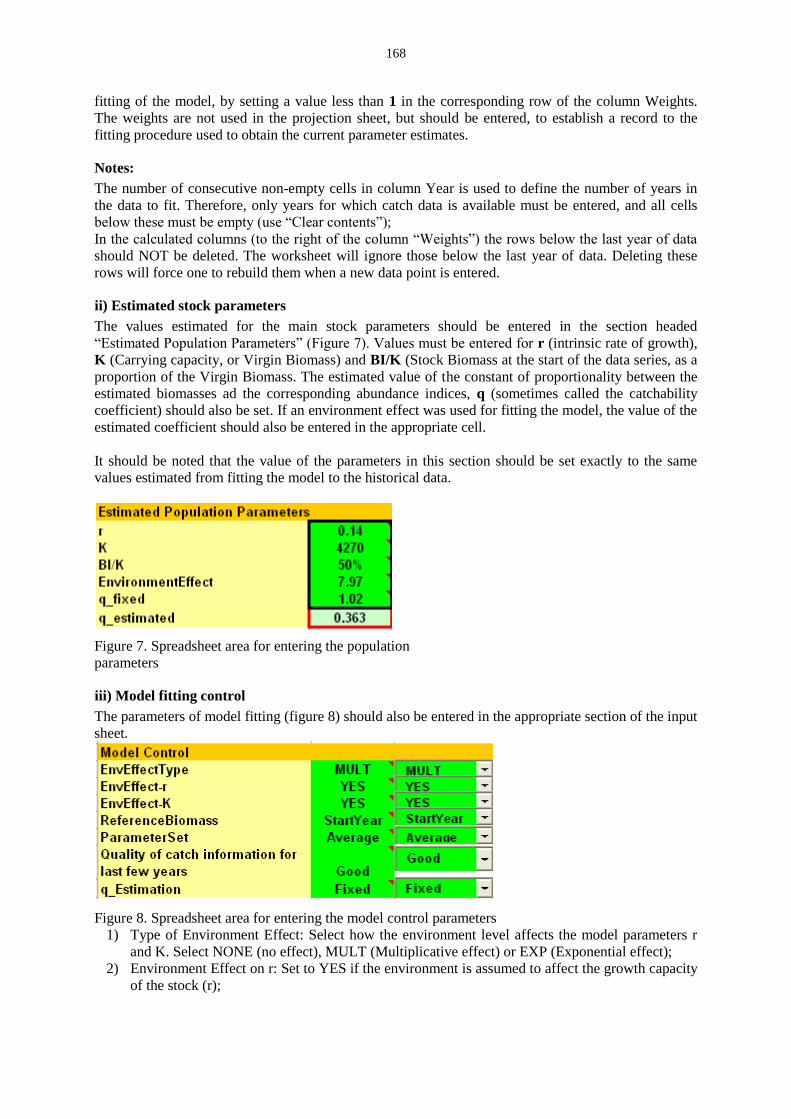
168
fitting of the model, by setting a value less than 1 in the corresponding row of the column Weights.
The weights are not used in the projection sheet, but should be entered, to establish a record to the
fitting procedure used to obtain the current parameter estimates.
Notes:
The number of consecutive non-empty cells in column Year is used to define the number of years in
the data to fit. Therefore, only years for which catch data is available must be entered, and all cells
below these must be empty (use “Clear contents”);
In the calculated columns (to the right of the column “Weights”) the rows below the last year of data
should NOT be deleted. The worksheet will ignore those below the last year of data. Deleting these
rows will force one to rebuild them when a new data point is entered.
ii) Estimated stock parameters
The values estimated for the main stock parameters should be entered in the section headed
“Estimated Population Parameters” (Figure 7). Values must be entered for r (intrinsic rate of growth),
K (Carrying capacity, or Virgin Biomass) and BI/K (Stock Biomass at the start of the data series, as a
proportion of the Virgin Biomass. The estimated value of the constant of proportionality between the
estimated biomasses ad the corresponding abundance indices, q (sometimes called the catchability
coefficient) should also be set. If an environment effect was used for fitting the model, the value of the
estimated coefficient should also be entered in the appropriate cell.
It should be noted that the value of the parameters in this section should be set exactly to the same
values estimated from fitting the model to the historical data.
Figure 7. Spreadsheet area for entering the population
parameters
iii) Model fitting control
The parameters of model fitting (figure 8) should also be entered in the appropriate section of the input
sheet.
Figure 8. Spreadsheet area for entering the model control parameters
1) Type of Environment Effect: Select how the environment level affects the model parameters r
and K. Select NONE (no effect), MULT (Multiplicative effect) or EXP (Exponential effect);
2) Environment Effect on r: Set to YES if the environment is assumed to affect the growth capacity
of the stock (r);
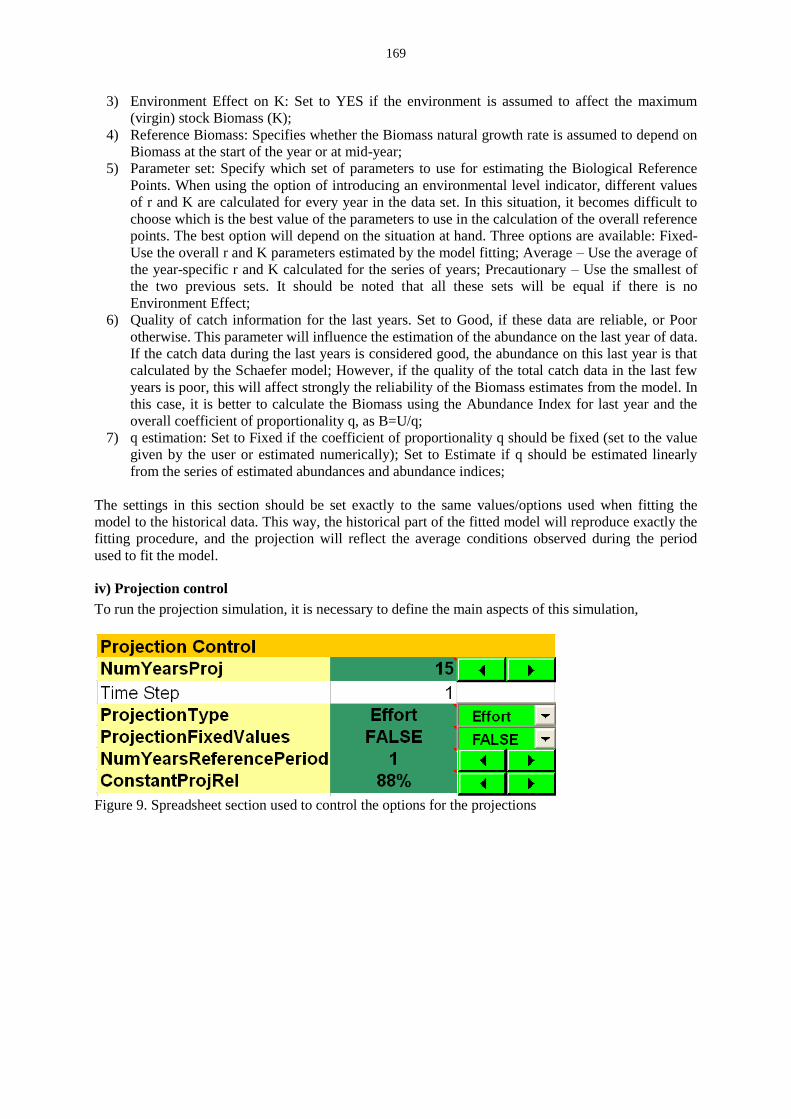
169
3) Environment Effect on K: Set to YES if the environment is assumed to affect the maximum
(virgin) stock Biomass (K);
4) Reference Biomass: Specifies whether the Biomass natural growth rate is assumed to depend on
Biomass at the start of the year or at mid-year;
5) Parameter set: Specify which set of parameters to use for estimating the Biological Reference
Points. When using the option of introducing an environmental level indicator, different values
of r and K are calculated for every year in the data set. In this situation, it becomes difficult to
choose which is the best value of the parameters to use in the calculation of the overall reference
points. The best option will depend on the situation at hand. Three options are available: Fixed-
Use the overall r and K parameters estimated by the model fitting; Average – Use the average of
the year-specific r and K calculated for the series of years; Precautionary – Use the smallest of
the two previous sets. It should be noted that all these sets will be equal if there is no
Environment Effect;
6) Quality of catch information for the last years. Set to Good, if these data are reliable, or Poor
otherwise. This parameter will influence the estimation of the abundance on the last year of data.
If the catch data during the last years is considered good, the abundance on this last year is that
calculated by the Schaefer model; However, if the quality of the total catch data in the last few
years is poor, this will affect strongly the reliability of the Biomass estimates from the model. In
this case, it is better to calculate the Biomass using the Abundance Index for last year and the
overall coefficient of proportionality q, as B=U/q;
7) q estimation: Set to Fixed if the coefficient of proportionality q should be fixed (set to the value
given by the user or estimated numerically); Set to Estimate if q should be estimated linearly
from the series of estimated abundances and abundance indices;
The settings in this section should be set exactly to the same values/options used when fitting the
model to the historical data. This way, the historical part of the fitted model will reproduce exactly the
fitting procedure, and the projection will reflect the average conditions observed during the period
used to fit the model.
iv) Projection control
To run the projection simulation, it is necessary to define the main aspects of this simulation,
Figure 9. Spreadsheet section used to control the options for the projections
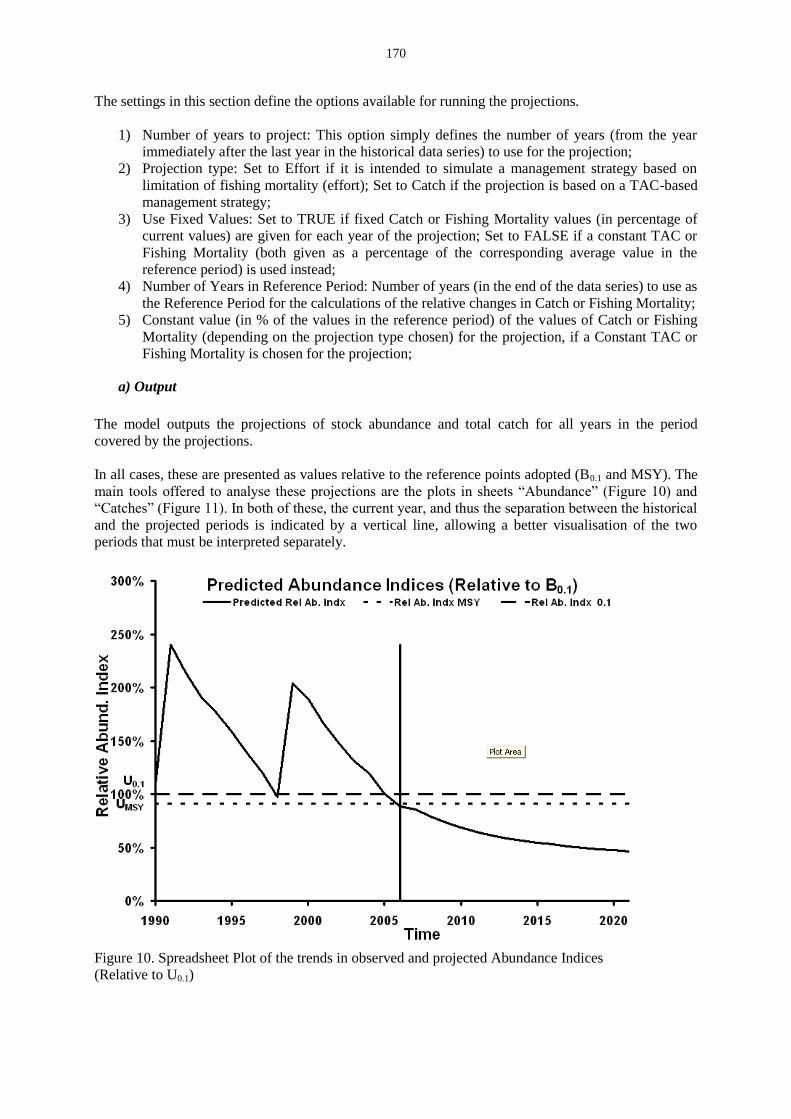
170
The settings in this section define the options available for running the projections.
1) Number of years to project: This option simply defines the number of years (from the year
immediately after the last year in the historical data series) to use for the projection;
2) Projection type: Set to Effort if it is intended to simulate a management strategy based on
limitation of fishing mortality (effort); Set to Catch if the projection is based on a TAC-based
management strategy;
3) Use Fixed Values: Set to TRUE if fixed Catch or Fishing Mortality values (in percentage of
current values) are given for each year of the projection; Set to FALSE if a constant TAC or
Fishing Mortality (both given as a percentage of the corresponding average value in the
reference period) is used instead;
4) Number of Years in Reference Period: Number of years (in the end of the data series) to use as
the Reference Period for the calculations of the relative changes in Catch or Fishing Mortality;
5) Constant value (in % of the values in the reference period) of the values of Catch or Fishing
Mortality (depending on the projection type chosen) for the projection, if a Constant TAC or
Fishing Mortality is chosen for the projection;
a) Output
The model outputs the projections of stock abundance and total catch for all years in the period
covered by the projections.
In all cases, these are presented as values relative to the reference points adopted (B0.1 and MSY). The
main tools offered to analyse these projections are the plots in sheets “Abundance” (Figure 10) and
“Catches” (Figure 11). In both of these, the current year, and thus the separation between the historical
and the projected periods is indicated by a vertical line, allowing a better visualisation of the two
periods that must be interpreted separately.
Figure 10. Spreadsheet Plot of the trends in observed and projected Abundance Indices
(Relative to U0.1)

171
Figure 11. Spreadsheet Plot of the trends in observed and projected catches (Relative to MSY)
6) Editing the WorkBook
With the exception of the cells shown in green on sheet “Input”, it is assumed that the user will not
need to edit any part of the workbook. Therefore, most of the sheets are protected, to avoid
accidentally modifying the formulas or the structure of the workbook. However, if any user wants to
modify any sheet, it is enough to select “Unprotect sheet” from the menu item “Protection” (Figure
12). Users are urged to make a copy of the workbook before doing this, however, as they might
accidentally modify the formulas or the structure of the workbook.
Figure 12. Procedure for unprotecting the worksheet “DataPlots”
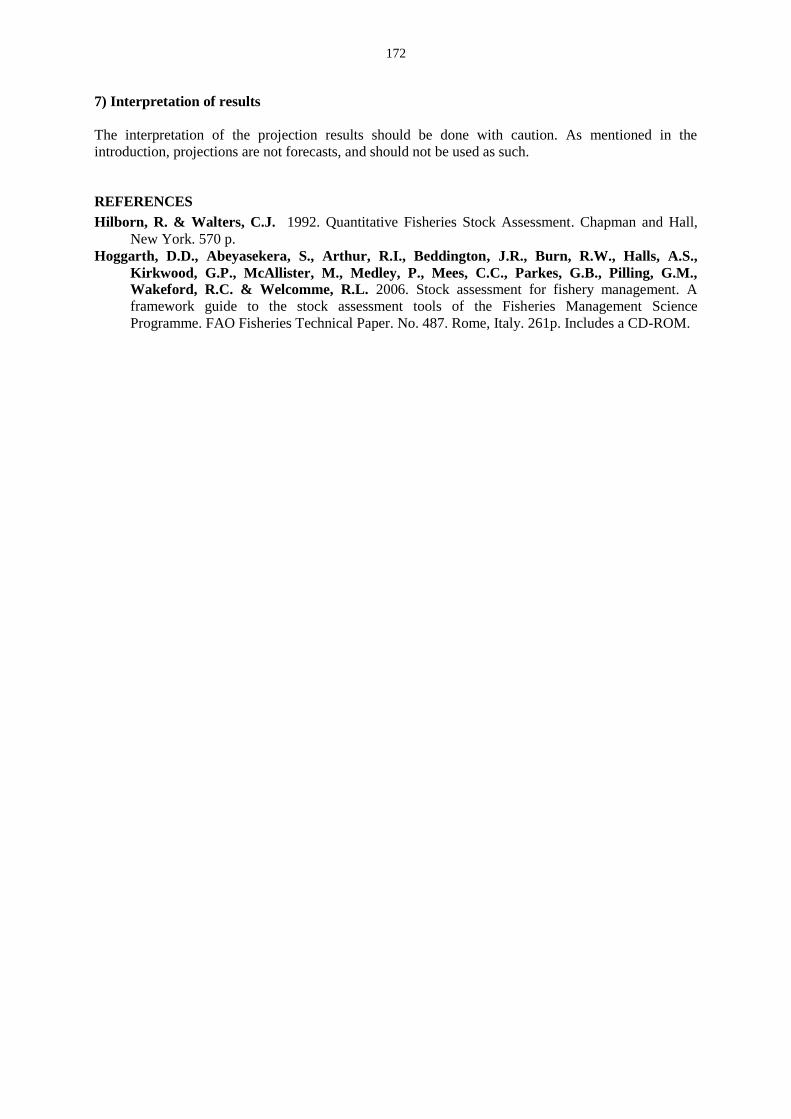
172
7) Interpretation of results
The interpretation of the projection results should be done with caution. As mentioned in the
introduction, projections are not forecasts, and should not be used as such.
REFERENCES
Hilborn, R. & Walters, C.J. 1992. Quantitative Fisheries Stock Assessment. Chapman and Hall,
New York. 570 p.
Hoggarth, D.D., Abeyasekera, S., Arthur, R.I., Beddington, J.R., Burn, R.W., Halls, A.S.,
Kirkwood, G.P., McAllister, M., Medley, P., Mees, C.C., Parkes, G.B., Pilling, G.M.,
Wakeford, R.C. & Welcomme, R.L. 2006. Stock assessment for fishery management. A
framework guide to the stock assessment tools of the Fisheries Management Science
Programme. FAO Fisheries Technical Paper. No. 487. Rome, Italy. 261p. Includes a CD-ROM.
CECAF/ECAF SERIES 12/74COPACE/PACE SÉRIES 12/74
Rapport du Groupe de travail FAO/COPACE sur l'évaluation des petits poissons pélagiques –Sous-groupe SudAccra, Ghana, 19-28 octobre 2009
Report of the FA
O/C
EC
AF W
orking Group on the A
ssessment of S
mall P
elagic Fish – Subgroup S
outh – Accra, G
hana, 19–28 October 2009
Rapport du G
roupe de travail FAO
/CO
PAC
E sur l'évaluation des petits poissons pélagiques – S
ous-groupe Sud – A
ccra, Ghana, 19-28 octobre 2009
FAO
Report of the FAO/CECAF Working Group on the Assessment of Small Pelagic Fish – Subgroup SouthAccra, Ghana, 19–28 October 2009
The second meeting of the FAO/CECAF Working Group on the Assessment of Small Pelagic Fish – Subgroup South met in Accra, Ghana, from 19 to 28 October 2009. The overall objective of the Working Group is to contribute to the improved management of small pelagic resources in West Africa through the assessment of the state of the stocks and fisheries to ensure sustainable use of these resources for the benefit of coastal countries. The Working Group focused on addressing data quality issues and the analysis of trends in the available data sets. Total catch of small pelagic fish for the period 1990 to 2007 fluctuated with an average of around 494 000 tonnes. Although important
changes were observed in the abundance and exploitation level for some of the stocks, the overall general situation with respect to the state of the different stocks was found to be similar to that of 2005. Round sardinella (western
stock) was found to be overexploited. It was recommended not to increase catches until further analysis with more complete data on the stocks is available. Five stocks were found to be fully exploited: flat sardinella (western stock) and Sardinella spp. (northern stock), bonga (northern stock and southern stock), and anchovy (western stock). For these stocks it was recommended, as a precautionary measure, that catch level should not exceed the catch of the last year or the average catch of the last four years. For the Cunene horse mackerel (southern stock) no conclusive
results were obtained with the models, but other independent information indicate that the stock is not in a good condition. For this stock it was recommended that targeted effort on this species should be reduced. For four of the stocks analysed the data did not provide reliable results and for three stocks the data available were not sufficient to
apply an assessment model. As a precautionary measure, catch level recommendations were nevertheless also made for these stocks.
La deuxième réunion du Groupe de travail FAO/COPACE sur l’évaluation des petits poissons pélagiques – Sous-groupe Sud (WGASP-S) a eu lieu à Accra, Ghana, du 19 au 28 octobre 2009. L’objectif général du Groupe de
travail est d’améliorer la gestion des ressources de petits pélagiques en Afrique de l’ouest grâce à l’évaluation de l’état des stocks et des pêcheries de façon à assurer une utilisation durable de ces ressources au bénéfice des pays
côtiers. Le Groupe de travail s'est concentré sur les aspects liés à la qualité des données et sur l'analyse des tendances dans les données. La capture totale de petits poissons pélagiques pour la période 1990 à 2007 a fluctué avec une moyenne d’environ 494 000 tonnes. Bien que des changements importants aient été observés dans les
niveaux d’abondance et d’exploitation de certains stocks, la situation générale par rapport à l’état des différents stocks est apparue globalement semblable à celle de l’année 2005. La sardinelle ronde stock ouest a été classifiée comme surexploitée. Il a été recommandé de ne pas augmenter les captures jusqu’à ce qu’une analyse plus approfondie et des données plus complètes sur le stock soient disponibles. Cinq stocks étaient pleinement exploités -sardinella plate stock ouest et Sardinella spp. stock nord, ethmalose (stock nord et stock sud), et anchois (stock ouest). Pour
ces stocks il a été recommandé, par mesure de précaution, que le niveau de capture ne dépasse pas la capture de la dernière année ou la moyenne des quatre dernières années. Pour le stock sud du chinchard du Cunène, des
résultants concluants ne peuvent pas être tirés des modèles, mais d’autres sources d’information indiquent que ce stock n’est pas dans un bonne état. L´effort exercé sur ce stock doit être réduit. Pour quatre des stocks analysés les
données n’ont pas fourni de résultats fiables et pour trois des stocks les données disponibles n’étaient pas suffisantes pour l’application d’un modèle d’évaluation. Par mesure de précaution, le Groupe de travail a néanmoins fait des
recommandations sur le niveau des captures à respecter.
i2909b/1/01.13